Embed Size (px)
Citation preview

1
AN APPROACH FOR CRIME ANALYSIS USING CLUSTERING
ALGORITHM
A PROJECT REPORT
Submitted by
K.Meghana Chowdary 316126510147
P.Samyuktha 316126510186
V.Ganesh Kumar 316126510180
T.Y.Seshadri Rao 316126510187
in partial fulfillment for the award of the degree
of
BACHELOR OF TECHNOLOGY
IN
COMPUTER SCIENCE ENGINEERING
Under esteemed guidance of
Dr.K.Suresh
(Ass.Proffessor)
DEPARTMENT OF COMPUTER SCIENCE& ENGINEERING
ANIL NEERUKONDA INSTITUTE OF TECHNOLOGY AND
SCIENCES(A)
(Affiliated to Andhra University)
SANGIVALASA, VISAKHAPATNAM -531162
2016 - 2020
2
ANIL NEERUKONDA INSTITUTE OF TECHNOLOGY AND
SCIENCES(A)
(Affiliated to Andhra University)
SANGIVALASA, VISAKHAPATNAM-531162
BONAFIDE CERTIFICATE
Certified that this project report “AN APPROACH FOR CRIME ANALYSIS USING
CLUSTERING ALGORITHM” is the bonafide work of “K.Meghana
Chowdary(316126510147),P.Samyuktha(316126510186),V.GaneshKumar(316126510180),T.Y.
Seshadri Rao(316126510187))” who carried out the project work under my supervision
(Dr.R.Sivaranjani) (Dr.K.Suresh)
HEAD OF THE DEPARTMENT PROJECT GUIDE
Designation Designation
Department of Computer Science Department of Computer
and Engineering Science and Engineering
3
DECLARATION
This is to certify that the project work entitled “AN APPROACH FOR CRIME ANALYSIS
USING CLUSTERING ALGORITHM” is a bonafide work carried out by K.Meghana
Chowdary, P.Samyuktha, V.Ganesh Kumar, T.Y. Seshadhri Rao as a part of B.TECH
final year 2nd semester of computer science &Engineering of Andhra University,
Visakhapatnam during the year 2016-2020.
We, K.Meghana Chowdary, P.Samyuktha, V.Ganesh Kumar, T.Y.
Seshadhri Rao , of final semester B.Tech., in the department of Computer Science
Engineering from ANITS, Visakhapatnam, hereby declare that the project work entitled AN
APPROACH FOR CRIME ANALYSIS USING CLUSTERING
ALGORITHM is carried out by us and submitted in partial fulfillment of the requirements for
the award of Bachelor of Technology in Computer Science Engineering , under Anil
Neerukonda Institute of Technology & Sciences during the academic year 2016-2020 and has
not been submitted to any other university for the award of any kind of degree.
K.Meghana Chowdary 316126510147
P.Samyuktha 316126510186
V.Ganesh Kumar 316126510180
T.Y.Seshadri Rao 316126510187

4
ACKNOWLEDGEMENT
The satisfaction and euphoria that accompany the successful completion of task would be incomplete
without the mention of the people who made it possible, whose constant guidance and encouragement always
boosted the morale. We take a great pleasure in presenting a project, which is the result of a studied blend of
both research and knowledge.
We first take the privilege to thank the Head of our Department, Dr.R.Shivaranjani, for permitting
us in laying the first stone of success and providing the lab facilities, we would also like to thank the other
staff in our department and lab assistants who directly or indirectly helped us in successful completion of the
project.
We feel great to thank Dr.K.Suresh , who are our project guides and who shared their valuable
knowledge with us and made us understand the real essence of the topic and created interest in us to work day
and night for the project; we also thank our project coordinator Mr.Mahesh, for his support and
encouragement.
K.Meghana Chowdary 316126510147
P.Samyuktha 316126510186
V.Ganesh Kumar 316126510180
T.Y.Seshadri Rao 316126510187

5
ABSTRACT:
Crime analysis and prevention is a systematic approach for identifying and analyzing patterns and trends in
crime. Our system can predict the type of crime activity which have high probability for given location interms
of latitude and longitude and date and also we can visualize crime prone areas. With the increasing advent of
computerized systems, crime data analysts can help the Law enforcement officers to speed up the process of
solving crimes. Using the concept of data mining we can extract previously unknown, useful information from
an unstructured data. Here we have an approach between computer science and criminal justice to develop a
data mining procedure that can help solve crimes faster. Instead of focusing on causes of crime occurrence like
criminal background of offender, political enmity etc we are focusing mainly on crime factors of each day.
KEYWORDS: Clustering, k-means Algorithm, Decision Tree, Crime.
6
CONTENTS
TITLE PAGE NO.
Abstract
Keywords
List of Figures
List of Tables
5
5
vi
vii

7
1. Introduction 9-10
1.1 Introduction 9
1.2 Problem Statement 10
2. Literature Survey 11-12
2.1.Cluster Aanlysis For Aanmoly
Detection In Accounting Data 11
2.2 Analysing Violent Criminal
Behaviour By Simulation Model 11
2.3 An Intelligent Analysis Of A City
Crime Data 12
3. Methodology 13-15
3.1
3.1.1 Clustering
3.1.2 Algorithm K-Means 13
3.1.3 Algorithm Illustration Process 13
3.2. Proposed System 14
3.2.1. Architecture 15
4. Design 16-22
4.1 UML Diagrams
4.1.1 Use case Diagram 17
4.1.2 Class Diagram 18
4.1.3 Sequence Diagram 19
4.1.4 Collaboration Diagram 20
4.1.5 Activity Diagram 21
4.1.6 Deployment diagram 22
8
5. Experimental analysis and results 23-29
5.1 System configuration 23
5.1.1 Software requirements 23
5.1.2 Hardware requirements 23
5.2 Sample Code 24-29
5.3 Screen shots 30-38
5.4 Experimental Analysis/Testing 39-42
6. Conclusion and Future work 43-44
6.1 Conclusion 43
6.2 Future Work 44
7. References 45

9
INTRODUCTION
1.1 INTRODUCION:
Day by day the crime rate is increasing considerably. Crime cannot be predicted since it is
neither systematic nor random. Also the modern technologies and hi-tech methods help criminals
in achieving their misdeeds. According to Crime Records Bureau crimes like burglary, arson etc
have been decreased while crimes like murder have been increased. Even though we cannot
predict who all may be the victims of crime but can predict the place that has probability for its
occurrence. The predicted results cannot be assured of 100% accuracy but the results shows that
our application helps in reducing crime rate to a certain extent by providing security in crime
sensitive areas. So for building such a powerful crime analytics tool we have to collect crime
records and evaluate it.

10
1.2 PROBLEM STATEMENT:
Criminals are nuisance for the society in all corners of world for a long time now and
measures are required to eradicate crimes from our world. Our mission is to offer crime prevention
application to keep public safe. Current policing strategies work towards finding the criminals,
basically after the crime has occurred. But, with the help of technological advancement, we can
use historic crime data to recognize crime patterns and use these patterns to predict crimes
beforehand. We are using clustering algorithms to predict crime prone areas.

11
2. LITERATURE SURVEY:
There are various papers which contributed to the study of sentimental classification of citations.
Based on the study of these papers, this project was proposed.
2.1CLUSTER ANALYSIS FOR ANAMOLY DETECTION IN ACCOUNTING DATA
Paper-1 Summary: Proposed by Sutapat Thirprungsri
The purpose of this study is to examine the possibility of using clustering technology for
continuous auditing. Automating fraud filtering can be of great value to preventive continuous
audits. In this paper, cluster-based outliers help auditors focus their efforts when evaluating group
life insurance claims. Claims with similar characteristics have been grouped together and those
clusters with small population have been flagged for further investigations. Some dominant
characteristics of those clusters are, for example, having large beneficiary payment, having huge
interest amount and having been submitted long time before getting paid. This study examines the
application of cluster analysis in accounting domain. The results provide a guideline and evidence
for the potential application of this technique in the field of audit.
2.2ANALYZING VIOLENT CRIMINAL BEHAVIOUR BY SIMULATION MODEL
Paper-2 Summary: Proposed by K. Zakhir Hussain
Crime analysis, a part of criminology, is a task that includes exploring and detecting crimes and
their relationships with criminals. The high volume of crime datasets and also the complexity of
relationships between these kinds of data have made criminology an appropriate field for applying
data mining techniques. Identifying crime characteristics is the first step for developing further
analysis. The knowledge that is gained from data mining approaches is a very useful tool which
can help and support in identifying violent criminal behaviour. The idea here is to try to capture
years of human experience into computer models via data mining and by designing a simulation
model.

12
2.3 AN INTELLIGENT ANALYSIS OF A CITY CRIME DATA
Paper-3 Summary: There had been an enormous increase in the crime in the recent past. The
concern about national security has increased significantly since the 26/11 attacks at Mumbai,
India. However, information and technology overload hinders the effective analysis of criminal
and terrorist activities. Crime deterrence has become an upheaval task. The cops in their role to
catch criminals are required to remain convincingly ahead in the eternal race between law breakers
and law enforcers. Data mining applied in the context of law enforcement and intelligence
analysis holds the promise of alleviating such problem. In this paper we use a clustering/classify
based model to anticipate crime trends. The data mining techniques are used to analyse the city
crime data from Police Department.
2.4 DATA CRIME APPROACHES TO CRIMINAL CAREER ANALYSIS
Paper-4 Summary: Narrative reports and criminal records are stored digitally across individual
police departments, enabling the collection of this data to compile a nation-wide database of
criminals and the crimes they committed. The compilation of this data through the last years
presents new possibilities of analysing criminal activity through time. Augmenting the traditional,
more socially oriented, approach of behavioural study of these criminals and traditional statistics,
data mining methods like clustering and prediction enable police forces to get a clearer picture of
criminal careers.. Four important factors play a role in the analysis of criminal careers: crime
nature, frequency, duration and severity. This method yields a visual clustering of these criminal
careers and enables the identification of classes of criminals. The proposed method allows for
several user-denied parameters.
13
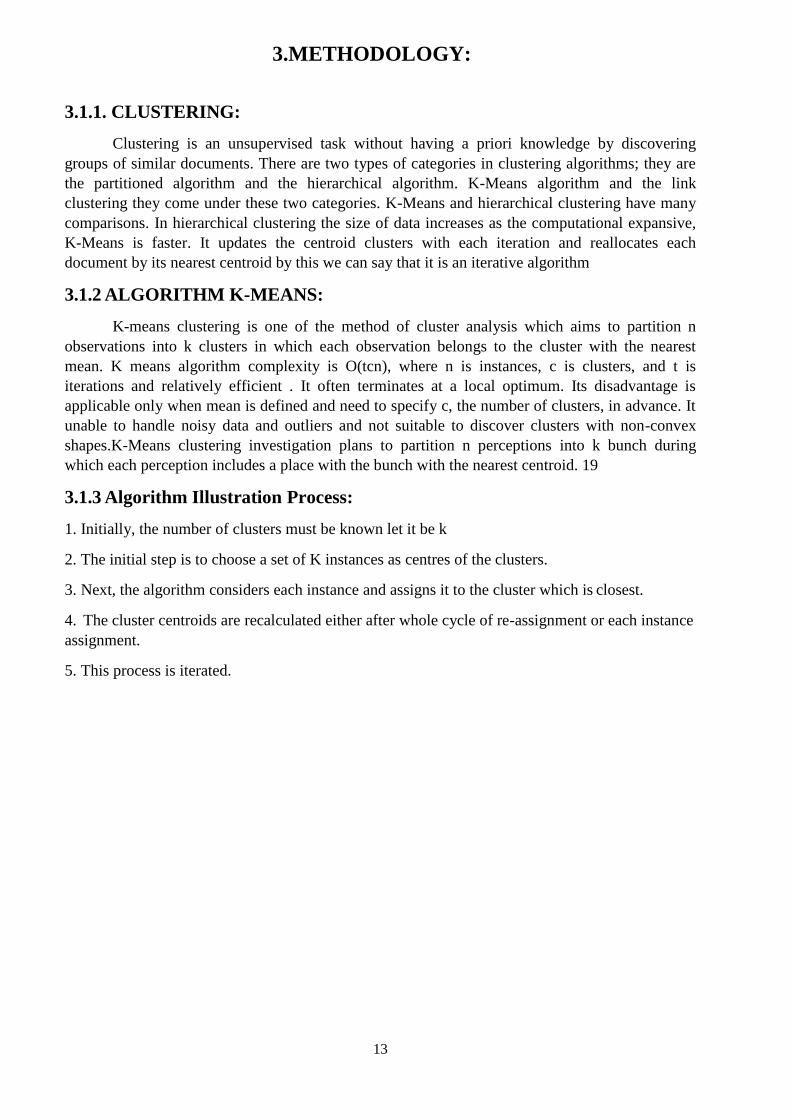
3.METHODOLOGY:
3.1.1. CLUSTERING:
Clustering is an unsupervised task without having a priori knowledge by discovering
groups of similar documents. There are two types of categories in clustering algorithms; they are
the partitioned algorithm and the hierarchical algorithm. K-Means algorithm and the link
clustering they come under these two categories. K-Means and hierarchical clustering have many
comparisons. In hierarchical clustering the size of data increases as the computational expansive,
K-Means is faster. It updates the centroid clusters with each iteration and reallocates each
document by its nearest centroid by this we can say that it is an iterative algorithm
3.1.2 ALGORITHM K-MEANS:
K-means clustering is one of the method of cluster analysis which aims to partition n
observations into k clusters in which each observation belongs to the cluster with the nearest
mean. K means algorithm complexity is O(tcn), where n is instances, c is clusters, and t is
iterations and relatively efficient . It often terminates at a local optimum. Its disadvantage is
applicable only when mean is defined and need to specify c, the number of clusters, in advance. It
unable to handle noisy data and outliers and not suitable to discover clusters with non-convex
shapes.K-Means clustering investigation plans to partition n perceptions into k bunch during
which each perception includes a place with the bunch with the nearest centroid. 19
3.1.3 Algorithm Illustration Process:
1. Initially, the number of clusters must be known let it be k
2. The initial step is to choose a set of K instances as centres of the clusters.
3. Next, the algorithm considers each instance and assigns it to the cluster which is closest.
4. The cluster centroids are recalculated either after whole cycle of re-assignment or each instance
assignment.
5. This process is iterated.
14
3.2 PROPOSED SYSTEM:
In the proposed system, we done crime data analysis of with many parameters and factors
including daily arrests, monthly arrests, number of domestic violence, top 5 monthly, weekly and
daily crime are visualized.
Using Decision Tree algorithm and K-means clustering algorithm, we are predicting the type of
crime for the given latitude and longitude.

15
3.2.1ARCHITECTURE:

16
4. DESIGN
4.1. UML DIAGRAMS:
UML DIAGRAMS
The design is a plan or drawing produced to show the look and function or workings of an
object before it is made. Unified Modeling language (UML) is a standardized modeling language
enabling developers to specify, visualize, construct and document artifacts of a software system.
Thus, UML makes these artifacts scalable, secure and robust in execution. UML is an important
aspect involved in object-oriented software development. It uses graphic notation to create visual
models of software systems.
The different types of UML diagram are as follows.
Use Case Diagram
Class Diagram
Activity Diagram
Sequence Diagram
Collaboration Diagram
Component Diagram
Deployment Diagram

17
4.1.1 USE CASE DIAGRAM:
User
User
Figure: Use case Diagram
The above figure represent use case diagram of proposed system, where user inputs dataset,
we pre-process dataset, the algorithm Decision Tree and K-means clustering to generate the
trained model to predict the crime type. The actor and use case is represented. An eclipse
shape represents the use case namely input image, pre-process, Split features, prediction and
output.
Input Dataset
Pre-process
Split X,Y Train
Apply DT, K-means
Trained model
Test Input
Predict crime

18
X_train;
Y_train
DecisionTreeRegressor()
Kmeans()
rf.fit()
dt.fit()
X_test;
Input;
DecisionTreeRegressor()
Kmeans()
rf.fit()
dt.fit()
Test
4.1.2 CLASS DIAGRAM
Figure: Class Diagram
The class diagram explains about the properties and functions of each class. The classes
are Main, pre-process, split data, train and test. In the above diagram, every class is represented
with attributes and operations.
Train_model
data_train():
data_test();
x=dataset[]
y=dataset[]
train_test_split(x, y)
Split_data
Main
from_date;
currentDate;
lat;
lon;
clear():
browse():
preprocess():
Kmeans():
decisiontree():
Pre-process
timestamp;
lat;
lon;
data_user1()
process(path):
pd.to_datetime():

19
4.1.3 SEQUENCE DIAGRAM
Figure: Sequence Diagram
A sequence diagram shows a parallel vertical lines, different processes or objects that live
simultaneously, and as horizontal arrows, the messages exchanged between them, in order in
which they occur. The above figure represents sequence diagram, the proposed system’s sequence
of data flow is represented.

20
4.1.4 COLLABORATION DIAGRAM
Figure: Collaboration Diagram
The above figure shows the collaboration diagram of the proposed system, where we represented the
collaboration between the actor and function modules with sequence number.
21
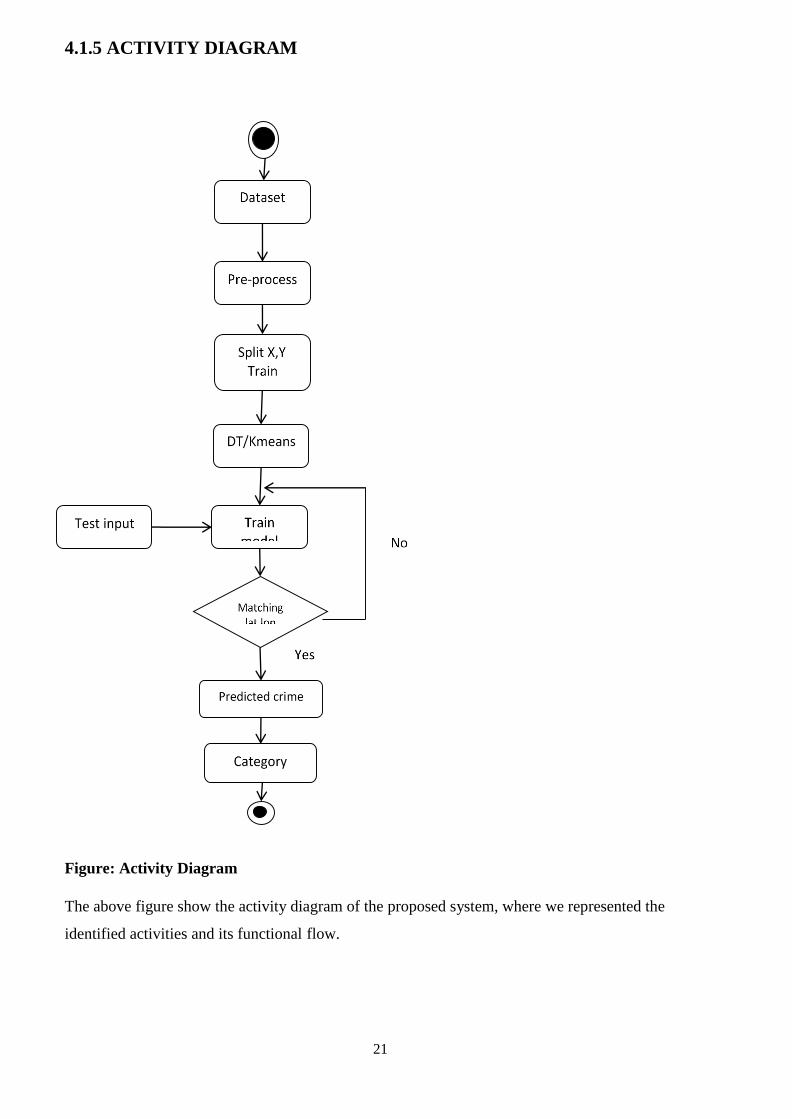
4.1.5 ACTIVITY DIAGRAM
Figure: Activity Diagram
The above figure show the activity diagram of the proposed system, where we represented the
identified activities and its functional flow.

22
4.1.6 DEPLOYMENT DIAGRAM
Figure: Deployment Diagram
In the deployment diagram the UML models the physical deployment of artifacts on nodes.
The nodes appear as boxes, and the artifacts allocated to each node appear as rectangles within the
boxes. Nodes may have subnodes, which appear as nested boxes. A single node in a deployment
diagram may conceptually represent multiple physical nodes, such as a cluster of database servers.
Client
Dataset
Middleware Pre-processprocess
Split X,Y
Train
Kmeans
DT
Server
Output
Trainedmodel

23
5.EXPERIMENTNAL ANALYSIS AND RESULTS:
5.1SYSTEM CONFIGURATION:
The system requirements includes Hardware and Software requirement, which are provided below
5.1.1. Software Requirements
Operating System : Windows 7 or higher
Programming : Python 3.6 and related libraries
5.1.2Hardware Requirements
Processor : Any Processor above 500 MHz.
Ram : 4 GB
Hard Disk : 4 GB
Input device : Standard Keyboard and Mouse.
Output device : VGA and High Resolution Monitor.

24
5.2SAMPLE CODE:
import csv
import numpy as np
import pandas as pd
from pandas import read_csv
import matplotlib.pyplot as plt
from pandas.plotting import scatter_matrix
import seaborn as sns
import matplotlib.pyplot as plt
sns.set(style="whitegrid")
def process(path):
print("preprocess")
df_main = pd.read_csv(path)
names=list(df_main.columns)
correlations = df_main.corr() #
plot correlation matrix
fig = plt.figure()
fig.canvas.set_window_title('Correlation Matrix') ax =
fig.add_subplot(111)
cax = ax.matshow(correlations, vmin=-1, vmax=1)
fig.colorbar(cax)
ticks = np.arange(0,9,1)
ax.set_xticks(ticks)
ax.set_yticks(ticks)
ax.set_xticklabels(names)
ax.set_yticklabels(names)
fig.savefig('results/Correlation Matrix.png')
plt.pause(5)
25
plt.show(block=False)
plt.close()
crimes = read_csv(path, index_col='Date') s =
crimes[['PrimaryType']]
crimes.index = pd.to_datetime(crimes.index)
crime_count =
pd.DataFrame(s.groupby('PrimaryType').size().sort_values(ascending=False).rename('counts'
).reset_index())
# Initialize the matplotlib figure
f, ax = plt.subplots(figsize=(16, 15))
# Plot the total crashes
sns.set_color_codes("pastel")
sns.barplot(x="counts",y="PrimaryType",
data=crime_count.iloc[:10, :],label="Total", color="b")
ax.legend(ncol=2, loc="lower right", frameon=True)
ax.set(ylabel="Type",xlabel="Crimes")
sns.despine(left=True, bottom=True)
plt.savefig('results/Top10Crimes.png')
# Add a legend and informative axis label
plt.pause(10)
plt.show(block=False)
plt.close()
crimes_2015 = crimes.loc['2015']
## Yearly crimes
arrest_yearly = crimes[crimes['Arrest'] == True]['Arrest']

26
plt.subplot()
# Monthly arrest
arrest_yearly.resample('M').sum().plot()
plt.title('Monthly arrests')
plt.savefig('results/Monthly arrests.png')
plt.pause(10)
plt.show(block=False)
plt.close()
# Weekly arrest
arrest_yearly.resample('W').sum().plot()
plt.title('Weekly arrests')
plt.savefig('results/Weekly arrests.png')
plt.pause(10)
plt.show(block=False)
plt.close()
# daily arrest
arrest_yearly.resample('D').sum().plot()
plt.title('Daily arrests')
plt.savefig('results/Daily arrests.png')
plt.pause(10)
plt.show(block=False)
plt.close()
domestic_yearly = crimes[crimes['Domestic'] == True]['Domestic']
plt.subplot()
# Monthly domestic violence
domestic_yearly.resample('M').sum().plot()
plt.title('Monthly domestic violence')
plt.savefig('results/Monthly domestic violence.png')
plt.pause(10)
plt.show(block=False)
plt.close()
27
# Weekly domestic violence
domestic_yearly.resample('W').sum().plot()
plt.title('Weekly domestic violence')
plt.savefig('results/Weekly domestic violence.png')
plt.pause(10)
plt.show(block=False)
plt.close() # daily domestic violence
domestic_yearly.resample('D').sum().plot()
plt.title('Daily domestic violence')
plt.savefig('results/Daily domestic violence.png')
plt.pause(10)
plt.show(block=False)
plt.close()
theft_2015 =
pd.DataFrame(crimes_2015[crimes_2015['PrimaryType'].isin(['THEFT','BATTERY',
'CRIMINAL DAMAGE', 'NARCOTICS', 'ASSAULT'])]['PrimaryType'])
grouper_2015 = theft_2015.groupby([pd.TimeGrouper('M'), 'PrimaryType'])
data_2015 = grouper_2015['PrimaryType'].count().unstack()
data_2015.plot()
plt.title("Top 5 monthly crimes 2015")
plt.savefig('results/Top 5 monthly crimes 2015.png')
plt.pause(10)
plt.show(block=False)
plt.close()
grouper_2015 = theft_2015.groupby([pd.TimeGrouper('W'), 'PrimaryType'])
data_2015 = grouper_2015['PrimaryType'].count().unstack()
data_2015.plot()
plt.title("Top 5 Weekly crimes 2015")

28
plt.savefig('results/Top 5 Weekly crimes 2015.png')
plt.pause(10)
plt.show(block=False)
plt.close()
grouper_2015 = theft_2015.groupby([pd.TimeGrouper('D'), 'PrimaryType'])
data_2015 = grouper_2015['PrimaryType'].count().unstack()
data_2015.plot()
plt.title("Top 5 daily crimes 2015")
plt.savefig('results/Top 5 daily crimes 2015.png')
plt.pause(10)
plt.show(block=False)
plt.close()
data = pd.read_csv(path,usecols=['Date', 'PrimaryType','Latitude','Longitude']) #
Preview the first 5 lines of the loaded data
data.dropna(inplace=True)
print(data)
print(data.head())
print(data.PrimaryType.unique())
data[["PrimaryType"]] = data[["PrimaryType"]].replace(['BATTERY','OTHER
OFFENSE','ROBBERY','NARCOTICS','CRIMINALDAMAGE','WEAPONS
VIOLATION','THEFT','BURGLARY','MOTOR VEHICLE THEFT','PUBLIC PEACE
VIOLATION','ASSAULT','CRIMINAL TRESPASS','CRIM SEXUAL
ASSAULT','INTERFERENCE WITH PUBLIC OFFICER','ARSON','DECEPTIVE
PRACTICE','LIQUOR LAW VIOLATION','KIDNAPPING','SEX OFFENSE','OFFENSE
INVOLVING
CHILDREN','PROSTITUTION','GAMBLING','INTIMIDATION','STALKING','OBSCENIT
Y','PUBLIC INDECENCY','HUMAN TRAFFICKING','CONCEALED CARRY LICENSE
VIOLATION','OTHER NARCOTIC VIOLATION','HOMICIDE','NON-CRIMINAL'],
[0,1,2,3,4,5,6,7,8,9,10,11,12,13,14,15,16,17,18,19,20,21,22,23,24,25,26,27,28,29,30])
29
print(data.PrimaryType.unique())
print(data)
data['year'] = pd.DatetimeIndex(data['Date']).year
data['month'] = pd.DatetimeIndex(data['Date']).month
data['day'] = pd.DatetimeIndex(data['Date']).day
data['hour'] = pd.DatetimeIndex(data['Date']).hour
data['min'] = pd.DatetimeIndex(data['Date']).minute
print(data)
data.to_csv("cleaned.csv")
30
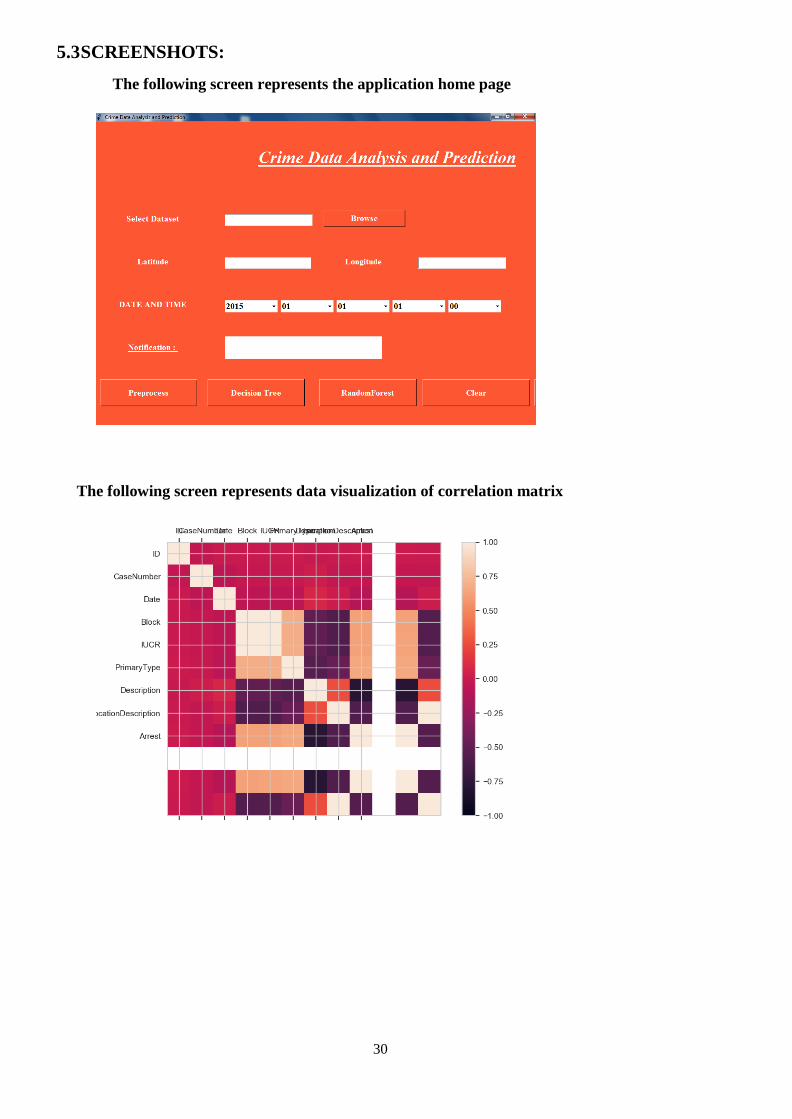
5.3 SCREENSHOTS:
The following screen represents the application home page
The following screen represents data visualization of correlation matrix

31
The following screen represents the number of crimes in each category type
The following screen represents number of arrests for crime as monthly plot

32
The following screen represents number of arrests for crime as weekly plot
The following screen represents number of arrests for crime as daily plot

33
The following screen represents number of domestic violence as monthly plot
The following screen represents number of domestic violence as Weekly plot

34
The following screen represents number of domestic violence as daily plot
The following screen represents top 5 monthly crimes
35
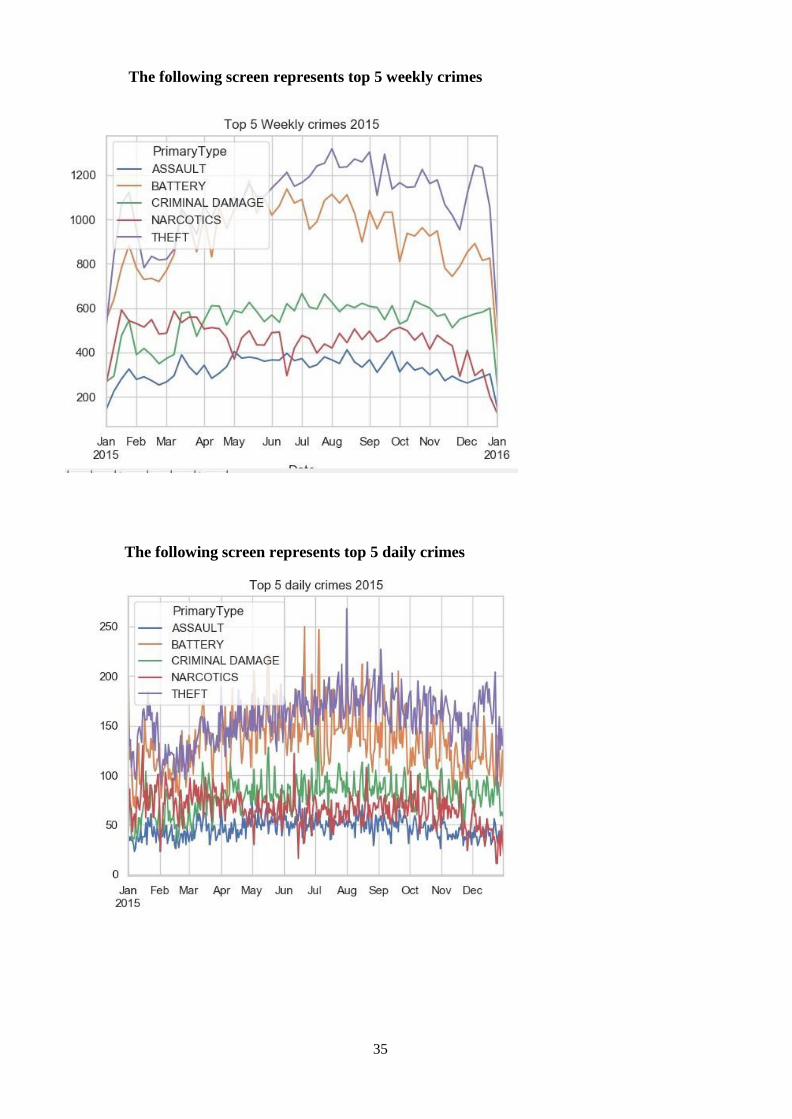
The following screen represents top 5 weekly crimes
The following screen represents top 5 daily crimes

36
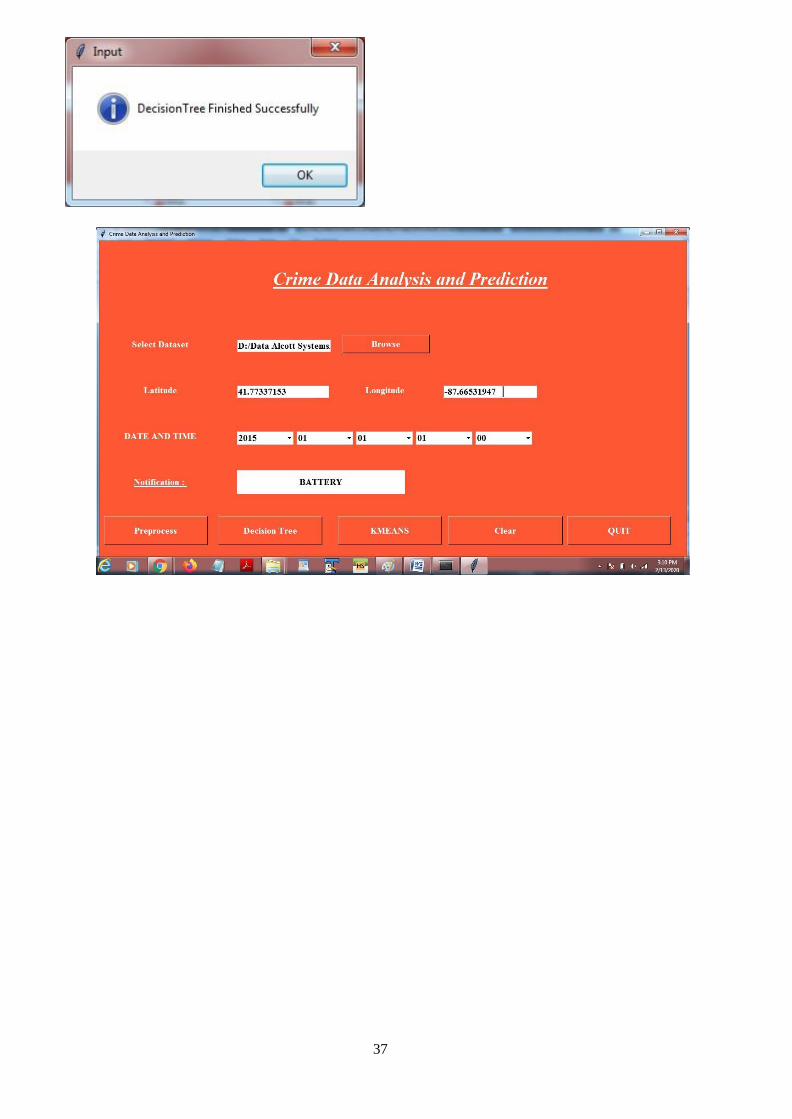
The following screen shows the home page of application
37
38
39
5.4 EXPERIMENTNAL TESTING
TESTING:
Introduction:
After finishing the development of any computer based system the next complicated time
consuming process is system testing. During the time of testing only the development company
can know that, how far the user requirements have been met out, and so on.
Software testing is an important element of the software quality assurance and represents
the ultimate review of specification, design and coding. The increasing feasibility of software as a
system and the cost associated with the software failures are motivated forces for well planned
through testing.
Testing Objectives
These are several rules that can save as testing objectives they are:
Testing is a process of executing program with the intent of finding an error.
A good test case is one that has a high probability of finding an undiscovered
error.
Testing procedures for the project is done in the following sequence
System testing is done for checking the server name of the machines being connected
between the customer and executive..
The product information provided by the company to the executive is tested against
the validation with the centralized data store.
System testing is also done for checking the executive availability to connected to the
server.
The server name authentication is checked and availability to the customer
Proper communication chat line viability is tested and made the chat system function
properly.
Mail functions are tested against the user concurrency and customer mail date
validate.
Following are the some of the testing methods applied to this effective project:

40
1. SOURCE CODE TESTING:
This examines the logic of the system. If we are getting the output that is required by the
user, then we can say that the logic is perfect.
SPECIFICATION TESTING:
We can set with, what program should do and how it should perform under various
condition. This testing is a comparative study of evolution of system performance and system
requirements.
MODULE LEVEL TESTING:
In this the error will be found at each individual module, it encourages the programmer to
find and rectify the errors without affecting the other modules.
UNIT TESTING:
Unit testing focuses on verifying the effort on the smallest unit of software-module. The
local data structure is examined to ensure that the date stored temporarily maintains its integrity
during all steps in the algorithm’s execution. Boundary conditions are tested to ensure that the
module operates properly at boundaries established to limit or restrict processing.
INTEGRATION TESTING:
Data can be tested across an interface. One module can have an inadvertent, adverse effect
on the other. Integration testing is a systematic technique for constructing a program structure
while conducting tests to uncover errors associated with interring.
VALIDATION TESTING:
It begins after the integration testing is successfully assembled. Validation succeeds when
the software functions in a manner that can be reasonably accepted by the client. In this the
majority of the validation is done during the data entry operation where there is a maximum
possibility of entering wrong data. Other validation will be performed in all process where correct
details and data should be entered to get the required results.
RECOVERY TESTING:

41
Recovery Testing is a system that forces the software to fail in variety of ways and
verifies that the recovery is properly performed. If recovery is automatic, re-initialization, and data
recovery are each evaluated for correctness.
SECURITY TESTING:
Security testing attempts to verify that protection mechanism built into system will in fact
protect it from improper penetration. The tester may attempt to acquire password through external
clerical means, may attack the system with custom software design to break down any defenses to
others, and may purposely cause errors.
PERFORMANCE TESTING:
Performance Testing is used to test runtime performance of software within the context of
an integrated system. Performance test are often coupled with stress testing and require both
software instrumentation.
BLACKBOX TESTING:
Black- box testing focuses on functional requirement of software. It enables to derive ets
of input conditions that will fully exercise all functional requirements for a program. Black box
testing attempts to find error in the following category:
Incorrect or missing function
Interface errors
Errors in data structures or external database access and performance errors.
OUTPUT TESTING:
After performing the validation testing, the next step is output testing of the proposed
system since no system would be termed as useful until it does produce the required output in the
specified format. Output format is considered in two ways, the screen format and the printer
format.

42
USER ACCEPTANCE TESTING:
User Acceptance Testing is the key factor for the success of any system. The system under
consideration is tested for user acceptance by constantly keeping in touch with prospective system
users at the time of developing and making changes whenever required.
TEST CASES
Sl.
No
Test Case
Name
Test
Procedure
Pre-
Condition
Expected
Result
Passed/ failed
1 Data Input Enter no
details and
click submit
button
Enter no
details input
Alert “Select
Dataset, Enter
Latitude,
Longitude”
Passed
2 Data Input Select dataset
and click
submit button
Select dataset
and click
submit button
Alert “Select
Dataset, Enter
Latitude,
Longitude”
Passed
3 Data Input Select
dataset, enter
latitude and
click submit
button
Select
dataset, enter
latitude and
click submit
button
Alert “Select
Dataset, Enter
Latitude,
Longitude”
Passed
43
6.CONCLUSION AND FUTURE WORK
6.1. CONCLUSION:
In this paper we have examined the accuracy of class and prediction based totally on different
check sets. Classification is done based on the Bayes theorem which showed more than 90%
accuracy. Using this algorithm we trained numerous news articles and build a model. For testing
we are inputting some test data into the model which shows better results. Our system takes
elements attributes of an area and preprocessing offers the frequent patterns of that place. The
pattern is used for constructing a model for decision tree. Corresponding to each place we build a
model by training on these frequent patterns. Crime patterns cannot be static since patterns change
over time. By training means we are teaching the system based on some particular inputs. So the
machine automatically learns the converting patterns in crime through examining the crime
patterns. Also the crime elements trade over time. By sifting through the crime data we have to
identify new factors that lead to crime. Since we are considering only some limited factors full
accuracy cannot be achieved. For getting better results in prediction we have to find more crime
attributes of places instead of fixing certain attributes. Till now we trained our system using
certain attributes but we are planning to include more factors to improve accuracy. Our
software predicts crime prone regions in India on a particular day. It will be more accurate if we
consider a particular state/region. Also another problem is that we are not predicting the time in
which the crime is happening. Since time is an important factor in crime we have to predict not
only the crime prone regions but also the proper time.

44
6.2. FUTURE SCOPE:
Experimental results prove that application is effective in terms of analysis speed, identifying
common crime patterns and crime prone areas for future prediction. From the encouraging results,
we believe that crime data mining has a promising future for increasing the effectiveness and
efficiency of criminal and intelligence analysis. Visual and intuitive criminal and intelligence
investigation techniques can be developed for crime pattern. As we have applied clustering
technique of data mining for crime analysis we can also perform other techniques of data mining
such as classification. Also we can perform analysis on various dataset such as enterprise survey
dataset, poverty dataset, aid effectiveness dataset, etc.

45
REFERENCES:
1. De Bruin ,J.S.,Cocx,T.K,Kosters,W.A.,Laros,J. and Kok,J.N(2006) Data mining
approaches to criminal carrer analysis ,”in Proceedings of the Sixth International
Conference on Data Mining (ICDM”06) ,Pp. 171-177.
2. Manish and M. P. GuptaGupta1, B.Chandra1 1,200Information System.
3. Nazlena Mohamad Ali1, Masnizah Mohd2, Hyowon Lee3, Alan F. Smeaton3, Fabio
Crestani4 and Shahrul Azman Mohd Noah2 ,2010 Visual Interactive Malaysia Crime
News Retrieval System 7 Crime Data Mining for Indian Police.
4. Chung-Hsien Yu, Max W.Ward, Melissa Morabito and Wei Ding,“Crime Forecasting
Using Data Mining Techniques”, 2011 11th IEEE International Conference on Data
Mining Workshops.
5. Tong Wang, Cynthia Rudin, Daniel Wagner, and Rich Sevieri. Detecting patterns of crime
with series finder. In Proceedings of the European Conference on Machine Learning
and Principles and Practice of Knowledge Discovery in Databases (ECMLPKDD 2013),
2013.
6. Li Zhang, Yue Pan, and Tong Zhang. Focused named entity recognition using machine
learning. In Proceedings of the 27th Annual International.
7. Malathi. A and Dr. S. Santhosh Baboo. Article:an enhanced algorithm to predict a future
crime using data mining. International Journal of Computer Applications, 21(1):1–6, May
2011. Published by Foundation of Computer Science.
8. Eibe Frank and Remco R. Bouckaert. Naive bayes for text classification with unbalanced
classes. In Proceedings of the 10th European Conference on Principle and Practice of
Knowledge Discovery in Databases, PKDD’06, pages 503–510, Berlin, Heidelberg, 2006.
Springer-Verlag.
9. Wikipedia contributors.(9 July 2013 ), Stanford NLP. [Online].Available :http://www-
nlp.stanford.edu/software/dcoref.shtml. Last accessed: 24-Feb-2014, 10:00 AM.
10. Wikipedia contributors.(12 May 2014 at 19:05.), Series Finder.
[Online].Available:http://en.wikipedia.org/wiki/Crime_analysis, Last accessed: 12- Feb-
2014, 12:00 PM.

46
AN APPROACH FOR CRIME ANALYSIS USING K-MEANS CLUSTERING
ALGORITHM
1K. Suresh , 2K. Meghana Chowdary , 3P. Samyuktha , 4V. Ganesh Kumar , 5T. Y. Seshadhri
1Assistant Professor,2Scholar ,3 Scholar,4 Scholar,5Scholar 1Computer Science and Engineering.
1 Anil Neerukonda Institute of Technology&Sciences,Visakhapatnam,India.
ABSTRACT:
Crime analysis and prevention is a systematic approach for identifying and analyzing patterns
and trends in crime. Our system can predict the type of crime activity which have high probability
for given location in terms of latitude and longitude and date and also we can visualize crime prone
areas. With the increasing introduction of automated systems, crime statistics analysts can help the
Law enforcement officers to speed up the manner of fixing crimes. Using the idea of data mining we
will extract previously unknown, useful information from an unstructured records. Here we have an
method between laptop technology and crook justice to develop a information mining method that
can assist remedy crimes faster. Instead of focusing on reasons of crime incidence like criminal
history of offender, political enmity etc we are focusing particularly on crime elements of every day.
Keywords: Clustering, k-means Algorithm, Decision Tree, Crime.
1. INTRODUCTION:
In Today’s world crime rate is drastically increasing with increase in population. Crime
cannot be predicted since it is neither systematic nor random. Also the contemporary technology and
hi-tech methods assist criminals in reaching their misdeeds. According to Crime Records Bureau
crimes like burglary, arson etc has been decreased while crimes like homicide have been increased.
Even though we cannot predict who all may be the victims of crime but can predict the place that has
its occurrence. The predicted results cannot be assured of 100% accuracy but the results shows that
our application helps in reducing crime rate to a certain extent by providing security in crime
sensitive areas. So for building such a powerful crime analytical tool we have to collect crime
records and evaluate it.
1.1CRIME ANALYSIS:
Crime Analysis is an analytical process which gives related information about crime patterns
and trends in crime. Information on patterns helps the regulation enforcement organizations deploys
assets in more effective manner. Crime Analysis performs a important position in supplying
solutions to the crime troubles and formulating crime prevention strategies.
The main objectives of crime analysis are:
1. Detecting the crime type
2. Extracting the crime patterns by analyzing the crime and criminal data
3. predicting the crime based on the distribution of the existing criminal data and prediction of crime
rate using various data mining techniques.

47
2. SYSTEM ANALYSIS:
2.1 PROPOSED SYSTEM:
In the proposed system, we done crime data analysis of with many parameters and factors
including daily arrests, monthly arrests, number of domestic violence, top 5 monthly, weekly and
daily crimes are visualized.
Using Decision Tree algorithm and K-Means clustering algorithm, we are predicting the type
of crime for the given latitude and longitude.
2.2CLUSTERING:
Clustering is one of the data mining techniques which are used to place the data elements into
their related groups. It is the process of partitioning the data or objects into the same class. The data
which is present in the same class is more similar to each other to those in other cluster. The process
of partitioning the data objects into some subclasses is called a cluster. Clustering comes under
unsupervised learning. There are a variety of algorithms for clustering process, which generally share
the same property of interactively assigning records to a cluster.
K-means ALGORITHM:
The k-means algorithm assigns every factor to the cluster whose centroid is nearest.
Generally, the center is the common of all of the points in the cluster.
1. Choose the number of clusters, k.
2. Randomly find k clusters and determine the cluster centers, or directly generate k random points
as the cluster centers.
3. Assign each point to the nearest cluster center, where nearest is defined with respect to its
distance.
4. Recomputed the new cluster centres.
5. This process is iterated.

48
a. System Architecture
3.IMPLEMENTATION:
3.1. Data Collection: The data collection process involves the selection of quality data for analysis.
Here we used dataset with features namely latitude, longitude, and timestamp. The job of a data
analyst is to find ways and sources of collecting relevant and comprehensive data, interpreting it, and
analyzing results with the help of statistical techniques.
3.2. Data Visualization: A large amount of information represented in graphic form is easier to
understand and analyze. Some companies specify that a data analyst must know how to create slides,
diagrams, charts, and templates. In our approach, the data histogram and scatter matrix are shown as
data visualization part.
a.Data Visualization of Dataset- Correlation matrix b.Data Visualization by Crime category

49
c.Data Visualization by Top Monthly Crime types
Input Dataset: We gather the criminals data from their registered records and records are given to
the system. Here, we collect unstructured data. This unstructured data is stored in the database for
further purpose.
3.3. Pre-processing: Pre-processing is done with the data in the database. It is one of the data mining
techniques which is used to convert the raw data into a readable format. The Real-world data is often
incomplete, inconsistent and also contains many errors. So in this step, we remove those types of
errors in the data and make it for clustering which is used for prediction.
Clustering: Clustering is one of the data mining techniques which is used to place the data elements
into their related groups. It is the process of partitioning the data or objects into the same class. The
data which is present in the same class is more similar to each other to those in other cluster. The
process of partitioning the data objects into some subclasses is called a cluster. Clustering comes
under unsupervised learning. There are a variety of algorithms for clustering process, which
generally share the same property of interactively assigning records to a cluster.
3.4. Experimental Setup
Approach used:
K-Means Algorithm: K-Means Clustering Algorithm is one of the technique which is used for
portioning 'n' observations into 'k' clusters, in which each observation belongs to each cluster with

50
the nearest mean point.
Procedure:
1. Initialize the number of the clusters. Let the number of clusters be 'k'
2. In this step, choose the set of 'k' instances as the centers of the clusters.
3.The algorithm considers every instance and assigns those instances to the clusters which are
closest.
4. The cluster centroids are recalculated for the whole cycle and assigned.
5. This processed is iterated k times.
The complexity of the K-Means algorithm is O (tkn), where 'n' is the number of the instances;’t’ is
the iterations.
The disadvantage of this is it is applicable only when the mean value is specified and also need to
give ' c' i.e., number of clusters, in prior. It could not handle noisy data and does not suitable to
discover the clusters with non-convex shapes.
4. RESULTS:
a.Represents number of arrests for crime as monthly plot b.Represents number of arrests for crime as weekly plot
c.Represents daily domestic violence d.Represents top 5 crimes in a month

51
5. CONCLUSION:
In this paper we have examined the accuracy of class and prediction based totally on different check
sets. Classification is done based on the Bayes theorem which showed more than 90% accuracy.
Using this algorithm we trained numerous news articles and build a model. For testing we are
inputting some test data into the model which shows better results. Our system takes elements
attributes of an area and preprocessing offers the frequent patterns of that place. The pattern is used
for constructing a model for decision tree. Corresponding to each place we build a model by training
on these frequent patterns. Crime patterns cannot be static since patterns change over time. By
training means we are teaching the system based on some particular inputs. So the machine
automatically learns the converting patterns in crime through examining the crime patterns. Also the
crime elements trade over time. By sifting through the crime data we have to identify new factors
that lead to crime. Since we are considering only some limited factors full accuracy cannot be
achieved. For getting better results in prediction we have to find more crime attributes of places
instead of fixing certain attributes. Till now we trained our system using certain attributes but
we are planning to include more factors to improve accuracy. Our software predicts crime prone
regions in India on a particular day. It will be more accurate if we consider a particular state/region.
Also another problem is that we are not predicting the time in which the crime is happening. Since
time is an important factor in crime we have to predict not only the crime prone regions but also the
proper time.
6. REFERENCES:
1. De Bruin ,J.S.,Cocx,T.K,Kosters,W.A.,Laros,J. and Kok,J.N(2006) Data mining approaches to
criminal carrer analysis ,”in Proceedings of the Sixth International Conference on Data
Mining (ICDM”06) ,Pp. 171-177.
2. Manish and M. P. GuptaGupta1, B.Chandra1 1,200Information System.
3. Nazlena Mohamad Ali1, Masnizah Mohd2, Hyowon Lee3, Alan F. Smeaton3, Fabio Crestani4
and Shahrul Azman Mohd Noah2 ,2010 Visual Interactive Malaysia Crime News Retrieval
System 7 Crime Data Mining for Indian Police.
4. Chung-Hsien Yu, Max W.Ward, Melissa Morabito and Wei Ding,“Crime Forecasting Using
Data Mining Techniques”, 2011 11th IEEE International Conference on Data Mining
Workshops.
5. Tong Wang, Cynthia Rudin, Daniel Wagner, and Rich Sevieri. Detecting patterns of crime
with series finder. In Proceedings of the European Conference on Machine Learning
and Principles and Practice of Knowledge Discovery in Databases (ECMLPKDD 2013),
2013.
6. Li Zhang, Yue Pan, and Tong Zhang. Focused named entity recognition using machine
learning. In Proceedings of the 27th Annual International.
7. Malathi. A and Dr. S. Santhosh Baboo. Article:an enhanced algorithm to predict a future
crime using data mining. International Journal of Computer Applications, 21(1):1–6, May
52
2011. Published by Foundation of Computer Science.
8. Eibe Frank and Remco R. Bouckaert. Naive bayes for text classification with unbalanced
classes. In Proceedings of the 10th European Conference on Principle and Practice of
Knowledge Discovery in Databases, PKDD’06, pages 503–510, Berlin, Heidelberg,
2006. Springer-Verlag.
9.Wikipedia contributors.(9 July 2013 ), Stanford NLP. [Online].Available :http://www-
nlp.stanford.edu/software/dcoref.shtml. Last accessed: 24-Feb-2014, 10:00 AM.
10. Wikipedia contributors.(12 May 2014 at 19:05.), Series Finder.
[Online].Available:http://en.wikipedia.org/wiki/Crime_analysis, Last accessed: 12-Feb-2014,
12:00 PM.