Embed Size (px)
Citation preview

Research Journal of Environmental and Earth Sciences 5(10): 619-630, 2013 ISSN: 2041-0484; e-ISSN: 2041-0492 © Maxwell Scientific Organization, 2013 Submitted: July 28, 2013 Accepted: August 06, 2013 Published: October 20, 2013
Corresponding Author: Thomson Kalinda, Department of Agricultural Economics and Extension, School of Agricultural
Sciences, University of Zambia, Lusaka 619
An Appraisal of Forest Resources in Zambia using the Integrated Land Use
Assessment (ILUA) Survey Data
1Thomson Kalinda, 2Samuel Bwalya, 3Jackson Munkosha and 3Abel Siampale 1Department of Agricultural Economics and Extension, University of Zambia, Kalundu, Lusaka, Zambia
2Policy and Advisory Unit, United Nations Development Programme, Addis Ababa, Ethiopia 3Forestry Department, Ministry of Lands, Natural Resources and Environmental Protection, Zambia
Abstract: This study was conducted to appraise or assess the status of forests and woodland resources in Zambia based on an analysis of data from the Integrated Land Use Assessment (ILUA) survey. An attempt was made to provide fresh estimates of the forest biomass and growing stock and other indicators which have the potential to inform policy and decision-making on forest resources and land use in Zambia. The findings show that approximately 49,968,170 ha or about 66% of the land is under forest cover. Over two thirds of the forests are located on customary land. The total above ground and below ground forest biomass over all land uses is estimated at 5.5 billion metric tonnes. The findings indicate that with the current wood stocking estimated at 2.95 billion cubic metres and with proper management, this is sufficient to meet the country’s current and future demand for forest products. The findings also indicate that most of the country’s forests are in good condition and the rates of deforestation are quite modest. Only 5% of the total forests are severely degraded and over 63% of the forests are in good condition. Given that more than two-thirds of all forests are located in customary land and are not formally managed, it is recommended that government should bring more forests under formal management and more importantly devolve and share some forest rights and responsibilities over public forests with local communities, user-groups and the private sector. Keywords: Biomass, deforestation, growing stock, integrated land use assessment, land tenure, Zambia
INTRODUCTION
Zambia is a landlocked country located in Southern Africa, lying between latitudes 8° and 18° South of the Equator and longitudes 22° and 34° East of the Greenwich Meridian. Zambia shares a common border with 8 other countries: Tanzania and the Democratic Republic of Congo (DRC) in the north; Angola in the west; Namibia, Botswana and Zimbabwe in the south and Mozambique and Malawi in the east. The country has a total land surface area of 752,616 km², lying between 1,000 and 1,600 m above sea level. Zambia’s main drainage systems are the Zambezi, Kafue, Luangwa and Chambeshi-Luapula rivers. The country has five major lakes: Kariba (man-made), Bangweulu, Mweru, Mweru-Wantipa and Tanganyika. The rivers and lakes provide the country’s most important water, fisheries and tourism resources. The annual rainfall ranges between 500 mm and 1,500 mm from November to March, varying with latitude and altitude (Government of the Republic of Zambia, 2006).
The country is abundantly endowed with the necessary resources to stimulate agricultural and rural development. For instance, forests provide critical
habitat to wildlife that supports a thriving wildlife-based tourism sector, helps to reduces soil erosion, regulates flood regimes, protect the watershed and water catchments that support municipal and industrial water supply, including hydro-electric generation and irrigation agriculture in addition to providing a wide array of other environmental services. Despite this endowment, the natural resources in Zambia have continued to decline both in quality and quantity. The forests in particular have been vulnerable to factors such as extensive practices of shifting cultivation and slash and burn; ever-increasing demands for wood-based energy (firewood and charcoal); unsustainable commercial utilization of indigenous tree species; overgrazing; and forest fires (Puustjarvi et al., 2005; Bwalya, 2000).
There have been attempts to account and estimate the state of Zambia’s natural resources in the past 5 decades but these have not been comprehensive. For instance, even though the Central Statistical Office of Zambia (CSO) has been routinely collecting national data from surveys on country demographics and agricultural statistics, very little effort has been made in looking at the data in an integrated format or combining

Res. J. Environ. Earth Sci., 5(10): 619-630, 2013
620
it with other relevant statistics to get a full picture of land use trends. The Crop Forecast Surveys, Post-Harvest Surveys and the Living Conditions Surveys have not been comprehensively collecting information and analyzing natural resource aspects such as land use systems, forest resources and other biophysical characteristics of the environment which could assist in understanding environmental issues and poverty and food security concerns in Zambia (Kalinda et al., 2008).
The lack of an integrated land use database in the country which would support the use of natural resources in development planning was seen as a serious gap. Therefore, the Government of Zambia, through the Ministry of Tourism, Environment and Natural Resources, requested technical and financial assistance from FAO to design and implement an Integrated Land Use Assessment (ILUA) survey. The ILUA survey was conducted in 2005 and the purpose of the survey was to assess forestry and other related resources and land use practices, to provide up-to-date qualitative and quantitative information on the state, use, management and trends of these resources (Mukosha and Siampale, 2009). The assessment covered a large range of biophysical and socio-economic variables and thus provides a broad view of forest resources and related land uses for the country as a whole.
This study was conducted to appraise or assess the status or condition of forests and woodland resources in Zambia based on an analysis of data from the ILUA survey. An attempt is made to provide fresh estimates of the forest stock and other indicators which have the potential to support, inform and enhance policy formulation and implementation on land use in Zambia.
MATERIALS AND METHODS
This study uses data collected in the ILUA survey conducted in 2005. The ILUA survey covered the whole country and the methodology used is based on nation-wide field sampling. The survey methodology had already been tested and implemented in several countries since the year 2000 (Costa Rica, Guatemala, Philippines, Cameroon and Lebanon) to assess forestry resources. In Zambia, the assessment was extended to other sectors, such as agriculture and livestock (Branthomme et al., 2006). Sampling design: The statistical data was acquired through field surveys at permanent sample plots systematically spread across the country. The sampling design adopted for the ILUA in Zambia was systematic. No stratification was applied. The sample density and distribution in Zambia is shown in Fig. 1. This was a
Fig. 1: Distribution of tracts for the integrated land use assessment in Zambia (Branthomme et al., 2006)

Res. J. Environ. Earth Sci., 5(10): 619-630, 2013
621
Table 1: Tract density in Zambia Stratum Tract number Distance between tracts
-------------------------------------------- (minutes) (km) 1 248 Latitude 30’
Longitude 30‘ About 50 km NS About 50 km EW
Total 248 systematic grid set across the country at 50 km between tracts. Tracts were selected at the intersection of every 30 min of the latitude/longitude grid. It resulted in the selection of 248 tracts nation-wide. The tracts were automatically spread over the surface area of Zambia regardless of the geographical location and topological conditions (Table 1). The aim was to avoid biasness in plotting and data collection.
Tract description: All data related to ILUA was exclusively collected within the limits of the tract. Data was collected through observations, measurements and interviews at different levels: within the tracts, which represents the highest level, then in smaller subunits (plots and subplots), demarcated within the tracts.
A tract is a square of 1 km × 1 km (Fig. 2). The co-ordinates of the south-west corner of the tracts correspond to those of the points selected in the systematic sampling frame. Each tract contains four field plots.
The plots are rectangles 20 m wide and 250 m long. They start at each corner of an inner 500 m2 (same centre as tract’s) and are numbered clockwise from 1 to 4 as shown in Fig. 2. The location and orientation of the 4 plots are given in Table 2.
Fig. 2: Tract, plot and subplot design (Branthomme et al., 2006)
10 m Subplots
Household survey
Subplot Level 2 (SPL2)
Subplot Level 1 (SPL1)
Plot
1
Plot 3
Plot 4
250 m
500 m
1 Km
1 Km
Plot 2
Tract
Tract X,Y coordinates
10 m
Plot central line
.
(+ 10m) (-10m) 20m
Towards end of the plot
3.99 m
SP3L1 and
125
m
Plot
250
m
20 m
Plot starting point
Plot orientation
SP2L1 and
SP1L1 and
Plot end
Measurement Point (MP)

Res. J. Environ. Earth Sci., 5(10): 619-630, 2013
622
Table 2: Plot location and orientation
Plot
Location of the starting point of the plot, within the 500 m inner square Orientation Bearing
Plot 1 South-West corner South-North 0/360° Plot 2 North-West corner West-East 90° Plot 3 North-East corner North-South 180° Plot 4 South-East corner East-West 270°
Three pairs of subplots are delimited within each plot. They correspond to two different data collection levels: 3 rectangular subplots (SPL1), 20 m×10 m, corresponding to level 1 and 3 circular subplots (SPL2), with a radius of 3.99 m, corresponding to level 2, located in the centre of the rectangular subplots. Both subplots categories are numbered from 1 to 3, starting at the starting point of the plot. The subplots serve to measure tree regeneration (Dbh <7 cm) and small diameter trees (7 cm ≤Dbh <20 cm) in forest. An edaphic and topographic measurement point is established at the centre of each subplot. When the location of the subplots falls in land use classes other than forest, they must not be demarcated (Branthomme et al., 2006). Data collection process: Data for the ILUA were collected by trained field crews for tracts, plots and subplots. A variety of methods and techniques were used during the data collection process. The data were mainly collected from two sources: • Measurements of forests and trees and other land
use practices • Interviews with local communities using land
including forest users and other people who are knowledgeable of the area. Examples of measurements in the forests included: tree diameter and height, as well as forest species composition. Data on agricultural cropping system, land tenure types, water sources, livestock and so on were collected by interviews. A structured interview using a questionnaire that was designed was used to collect information at the household level. The field crew also collected information about the local people’s perception on land use changes, the main products extracted from land, land use related problems using focus group discussions. Out of the selected 248 tracts nation-wide, the field
crew managed to collect data from 221 tracts. This was due to the fact some of the tracts could not be accessed due to constraints like difficult terrain (water bodies, slopes and so on). Other tracts were located in military restricted areas and some were geographically located outside the country’s borders. In some cases, the local people refused to allow the field teams to work or access the tracks due to mistrust.
Data analysis: The information collected from the ILUA survey was coded and entered into a database. The Data collected were coded and analyzed using Statistical Package for Social Sciences (SPSS) and Microsoft Excel worksheets. The coding and entry was meticulously done and a database was established for further analysis. This study focussed on generating estimates of forest cover, forest biomass and stocks from the ILUA database. The analysis therefore highlights and presents national-level descriptive statistics to provide estimates of wood stocks and forest cover and analyze how forest resources are distributed by type, land tenure and forest management regime.
The study estimates the growing stock available in the country. Growing stock (tree volume) estimates are based on the field inventory data collected in each province following the number of tracts accessed by the field teams. There were 221 tracts that were accessible with a total area coverage of 433.1 ha. In this assessment, Growing Stock (GS) refers to the gross volume of all living trees more than 7 cm in diameter at breast height and includes defective and diseased trees. The Gross Tree stem Volume (Growing Stock) was calculated as follows:
Dbh2/4*π*H tot*π*fgross where, Dbh = Tree diameter at breast height Htot = Tree total height π = 3.1416 fgross = 0.74
The study also analyses and provides some estimates of biomass and carbon stocks and potential carbon sequestered by forests in Zambia. In order to compute and generate the biomass and carbon estimates for Zambia, the study used the methodological framework developed in the IPCC (2006) Guidelines for National Greenhouse Gas (GHG) Inventories Volume 4, chapters 2 and 4. Carbon biomass and eventually carbon, was calculated using the following formulae or equations:
AGB = GS × WD × BEF (1) or
AGB = GS×BCEF (2)
BGB = AGB×R (3)
DWB = GS×BCEF (4)
C = Cf (AGB+BGB+DW) (5) where, AGB = Above-ground biomass (tonnes)

Res. J. Environ. Earth Sci., 5(10): 619-630, 2013
623
BGB = Below-ground biomass (tonnes) C = Carbon from aboveground, belowground and deadwood biomass Cf = Carbon fraction of aboveground biomass (0.47) DWB = Deadwood biomass GS = Growing stock (Volume, m3 overbark) WD = Basic wood density (Dry weight/green volume expressed in tonnes/m3) BCEF = Biomass conversion and expansion factor (Above ground biomass/growing stock, tonnes/m3) BEF = Biomass expansion factor (Above ground biomass/stem biomass) R = Root-shoot ratio (Below-ground biomass/Above-ground biomass)
As can be seen above in Eq. (1 and 2), there are two options available for calculating Above-Ground Biomass (AGB). This study directly applied Eq. (2) or option two which uses the Biomass Conversion and Expansion Factors (BCEF) to the growing stock figures. Based on these equations, the ILUA data was initially computed to generate above-ground, below-ground and deadwood biomass results based on the tract level data. These results were then expanded for the whole country.
RESULTS AND DISCUSSION Land use and forest resources by land classification: The ILUA survey applied the Global Forest Resources Assessment approach developed by the United Nations Food and Agricultural organization (FAO) to classify different land uses in Zambia. This approach classifies land uses into four broad categories; namely Forests, Other Wooded Land, Other Land and Inland Water. Forests are further subdivided into natural and assisted natural regeneration (which includes evergreen forests, semi-evergreen and deciduous and other forest types) and forest plantation. The second category is Other Wooded Land which includes shrubs and wooded grasslands while Other Land captures barren lands, grasslands, marshland, managed lands under annual and perennial crops, pasture and fallow land and built up areas. The last category captures inland water bodies (lakes, rivers, dams). Table 3 shows the pattern of land use in Zambia using ILUA data collected from the 221 tracts across the country.
The total land area of Zambia is approximately 75,261,400 ha, of which approximately 49,968,170 ha are under forest cover. This shows that the country has significant land under forest cover (66.4%), mainly dominated by semi-evergreen forests, which account for 45.4% of the total land followed by deciduous forests which account for 19.7% (Table 4). Evergreen forests only account for 1.1% of the total land. The country also has vast wooded grasslands which occupy 6.5% and shrubs and thickets which occupy 1.5% of the
Table 3: Forest coverage and forest biomass in Zambia Main land cover classes Hectares (%) Total forest area 49, 968, 170 66.4 Total other wooded land 6, 054, 652 8.0 Total other land 15, 771, 081 21.0 Inland water 3, 467, 497 4.6 Total (Hectares) 75, 261, 400 100.0 Total Biomass (million metric tonnes) 5, 500 Na Total Carbon (million metric tonnes) 2, 600 Na Table 4: Distribution of land by land use category Land use Total tract area (%) Deciduous forest 85.5 19.7 Evergreen forest 4.7 1.1 Semi-evergreen forest 196.5 45.4 Other natural forest 0.8 0.2 Wooded grassland 28.2 6.5 Shrubs/thickets 6.7 1.5 Grassland 35 8.1 Lakes 15.5 3.6 Marshland 7.7 1.8 Annual crops 27 6.2 Perennial crops 1.4 0.3 Fallow 13.7 3.2 Barren land 0.1 0.0 Pastures 2.7 0.6 Rivers 4.5 1.0 Rural built-up areas 3.2 0.7 Urban built-up areas 0.04 0.0 Total 433.24 100.0 total land area. When these are added to forests, it brings the total land area under forests and woodlands to 74%. Other lands account for 21% of the total land, of which grasslands and marshlands account for 8.1 and 1.8%, respectively or a total of 9.9% of the country’s total land area. Urban and rural development accounts for only 0.7% of the total land. It should be mentioned that these are tract level areas and that although Zambia obviously has urban areas, the stratified sample units of ILUA did not fall within any urban centers, since they are a rare feature. A higher sampling intensity would have captured them.
Land under agriculture (annual crop, pasture and fallow) is estimated at 10% of the total 433 ha of land covered in the ILUA survey. Of this, pasture land accounts for 0.6% and land under crop cultivation and fallow account for 6.5 and 3.2%, respectively. This estimate, which is almost 50% lower than the previous national estimate of 20.1%, suggests that previous estimates which were largely based on less comprehensive datasets than the ILUA data over-estimated land conversion to agriculture and certainly the rate of deforestation in the country. Inland waters accounts for 4.6% of the country’s total land surface, compared to 1% provided by previous studies again indicating that the ILUA data can provide useful information for land use planning. Growing stock by major land-use category: Table 5 presents estimates of the growing stock and how it is distributed across the major land use categories in Zambia. Based on the total area of accessible sample

Res. J. Environ. Earth Sci., 5(10): 619-630, 2013
624
Table 5: Total growing stock (million m3) by major land-use category
Main land-use category
Growing stock ------------------------------------------------------
Volume (Million m3)
Percent (%)
Sampling error with 95% PL
Total forest area 2, 785 95 11.2% Total other wooded land
58 2 42.7%
Total other land 97 3 32.4% Inland water 1 0 202.4% Total 2,941 100 12.9% plots (433.1 ha) across 221 tracts, the total growing stock by major land-use is calculated and expanded as 2.8 billion m3 for natural forests; 58 million m3 for other wooded land; 97 million m3 for other land and 1 million m3 in inland water. Therefore, the total tree volume over the major land use categories combined is 2.9 billion m3 distributed over the whole country.
Forests are prevalent throughout the Zambian landscape (66% of the total land area) and they were assessed with the lowest Sampling Error (SE) of 11.2% at a 95% probability level, meaning that the ‘true’ volume of natural forests may fall between 2,473 million m3 and 3,097 million m3. Likewise, with a sampling error at a 95% probability level of 12.9%, the ‘true’ overall growing stock volume falls between 2,562 million m3 and 3,320 million m3. Forest biomass: Table 6 presents estimates of the forest biomass and how it is distributed across the nine provinces of Zambia. The total above ground and below ground biomass over all land uses is 5.5 billion metric tonnes.
These estimates of forest inventory indicates that the country has sufficient stocks of wood resources to meet its current and future needs for fuel wood and construction timber and sustainable flow of other forest products and services. It is also estimated that households consume 6.359 million m3/year, of which firewood and charcoal account for 85% of the total wood extraction and construction poles and round timber harvested for household and industrial use accounts for the remainder (Puustjarvi et al., 2005). This level of extraction is only 36% of the Maximum Allowable Cut, meaning that great potential exists to develop the forest sector and to increase its contribution
to the country’s economic growth and poverty reduction efforts. It should be noted, however, that although forest resources appear to be physically abundant, wood resources are not geographically evenly distributed and this has resulted to localized depletion and scarcity of wood resources, especially for charcoal production, around urban towns and cities which is quite evident.
Table 6 shows that the North-Western Province which is the second largest province in terms of land size has the largest total forest biomass estimated at 27.6% of the total country biomass, followed by Northern, Central and Western. Copperbelt and Lusaka provinces, which are also the most urbanized provinces, have the smallest share of the country’s biomass. In fact, most urban provinces have exhausted their production forests and the remaining forests are either for protection or young re-growth forests with no critical wood biomass for charcoal production. At present Lusaka and Copperbelt Provinces are the net importers of charcoal from other provinces mostly from Central province.
While this will provide estimates and distribution of forest biomass, it is important to note that these estimates, like several previous studies, do not include biomass inventories of grass and other herbaceous plants. Herbaceous plants are an important feature of the country’s forest ecosystem and as such should be taken into account when analyzing ecological functions of forests and woodland resources as well as in the design and implementation of forest management practices. For instance, herbaceous plants play a critical role in igniting wild forest fires and therefore should be considered in fire prevention and control strategies. They are an important source of myriad forest foods, herbs and dyes, thatching grass, folder and forbs for livestock and wildlife. They also provide soil cover, prevent soil erosion and play an important role in climate change moderation as carbon sinks and sequesters. Therefore, there is need for future land use and forest inventory assessments to document herbaceous plant biomass and estimate carbon stored and sequestered by such plants and further assess the socio-economic importance of herbaceous plants to
Table 6: Spatial distribution of biomass by province
Province Aboveground Biomass/ha (tonnes/ha)
Size of province (ha)
Expanded above and below ground biomass (million metric tonnes)
% of total biomass Ranking
North-Western 100.7 12,582,637 1,520.2 27.6% 1 Northern 50.0 14,782,565 886.9 16.1% 2 Central 75.0 9,439,438 849.8 15.4% 3 Western 38.4 12,638,580 582.5 10.6% 4 Eastern 63.8 6,910,582 529.2 9.6% 5 Luapula 68.9 5,056,908 418.1 7.6% 6 Southern 35.9 8,528,283 367.2 6.7% 7 Copperbelt 64.4 3,132,839 242.1 4.4% 8 Lusaka 45.7 2,189,568 120.1 2.2% 9 Total 64.1 75,261,400 5,516.2 100% Na
Res. J. Environ. Earth Sci., 5(10): 619-630, 2013
625
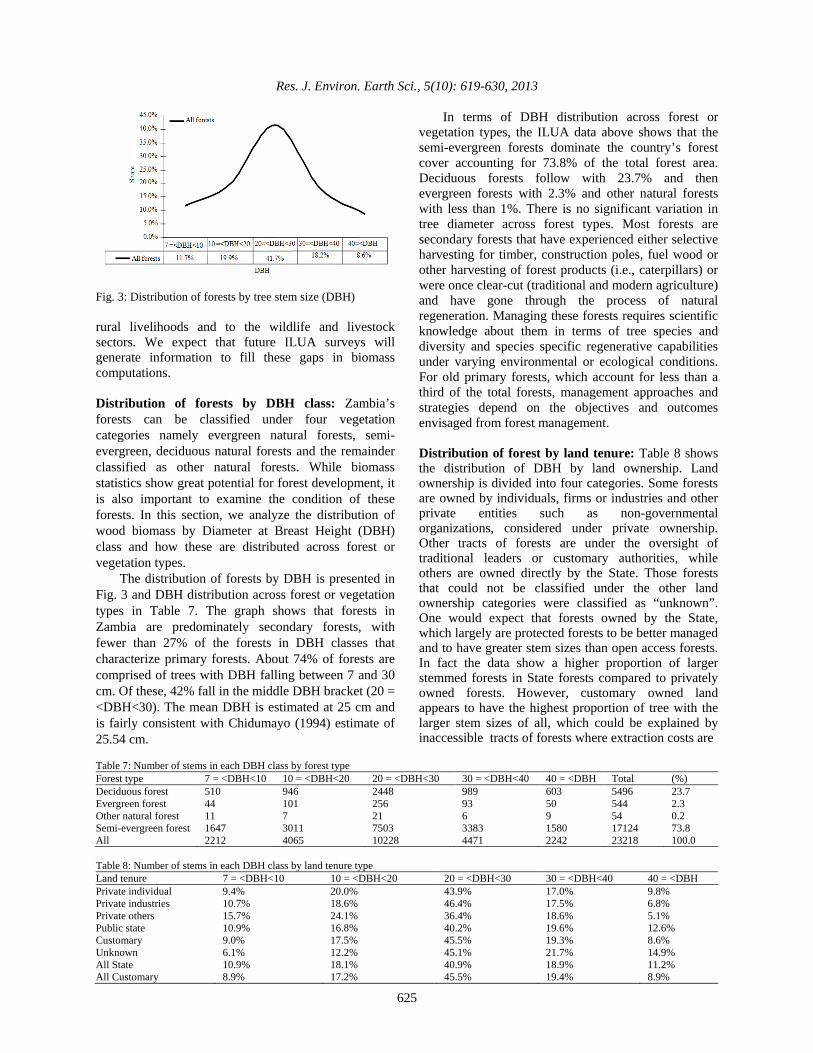
Fig. 3: Distribution of forests by tree stem size (DBH) rural livelihoods and to the wildlife and livestock sectors. We expect that future ILUA surveys will generate information to fill these gaps in biomass computations. Distribution of forests by DBH class: Zambia’s forests can be classified under four vegetation categories namely evergreen natural forests, semi-evergreen, deciduous natural forests and the remainder classified as other natural forests. While biomass statistics show great potential for forest development, it is also important to examine the condition of these forests. In this section, we analyze the distribution of wood biomass by Diameter at Breast Height (DBH) class and how these are distributed across forest or vegetation types.
The distribution of forests by DBH is presented in Fig. 3 and DBH distribution across forest or vegetation types in Table 7. The graph shows that forests in Zambia are predominately secondary forests, with fewer than 27% of the forests in DBH classes that characterize primary forests. About 74% of forests are comprised of trees with DBH falling between 7 and 30 cm. Of these, 42% fall in the middle DBH bracket (20 = <DBH<30). The mean DBH is estimated at 25 cm and is fairly consistent with Chidumayo (1994) estimate of 25.54 cm.
In terms of DBH distribution across forest or vegetation types, the ILUA data above shows that the semi-evergreen forests dominate the country’s forest cover accounting for 73.8% of the total forest area. Deciduous forests follow with 23.7% and then evergreen forests with 2.3% and other natural forests with less than 1%. There is no significant variation in tree diameter across forest types. Most forests are secondary forests that have experienced either selective harvesting for timber, construction poles, fuel wood or other harvesting of forest products (i.e., caterpillars) or were once clear-cut (traditional and modern agriculture) and have gone through the process of natural regeneration. Managing these forests requires scientific knowledge about them in terms of tree species and diversity and species specific regenerative capabilities under varying environmental or ecological conditions. For old primary forests, which account for less than a third of the total forests, management approaches and strategies depend on the objectives and outcomes envisaged from forest management. Distribution of forest by land tenure: Table 8 shows the distribution of DBH by land ownership. Land ownership is divided into four categories. Some forests are owned by individuals, firms or industries and other private entities such as non-governmental organizations, considered under private ownership. Other tracts of forests are under the oversight of traditional leaders or customary authorities, while others are owned directly by the State. Those forests that could not be classified under the other land ownership categories were classified as “unknown”. One would expect that forests owned by the State, which largely are protected forests to be better managed and to have greater stem sizes than open access forests. In fact the data show a higher proportion of larger stemmed forests in State forests compared to privately owned forests. However, customary owned land appears to have the highest proportion of tree with the larger stem sizes of all, which could be explained by inaccessible tracts of forests where extraction costs are
Table 7: Number of stems in each DBH class by forest type Forest type 7 = <DBH<10 10 = <DBH<20 20 = <DBH<30 30 = <DBH<40 40 = <DBH Total (%) Deciduous forest 510 946 2448 989 603 5496 23.7 Evergreen forest 44 101 256 93 50 544 2.3 Other natural forest 11 7 21 6 9 54 0.2 Semi-evergreen forest 1647 3011 7503 3383 1580 17124 73.8 All 2212 4065 10228 4471 2242 23218 100.0 Table 8: Number of stems in each DBH class by land tenure type Land tenure 7 = <DBH<10 10 = <DBH<20 20 = <DBH<30 30 = <DBH<40 40 = <DBH Private individual 9.4% 20.0% 43.9% 17.0% 9.8% Private industries 10.7% 18.6% 46.4% 17.5% 6.8% Private others 15.7% 24.1% 36.4% 18.6% 5.1% Public state 10.9% 16.8% 40.2% 19.6% 12.6% Customary 9.0% 17.5% 45.5% 19.3% 8.6% Unknown 6.1% 12.2% 45.1% 21.7% 14.9% All State 10.9% 18.1% 40.9% 18.9% 11.2% All Customary 8.9% 17.2% 45.5% 19.4% 8.9%
Res. J. Environ. Earth Sci., 5(10): 619-630, 2013
626
simply too high. Generally, land classified as “unknown” falls under customary tenure. Using this assumption, when “unknown” and customary owned tree stems are combined, they yield a lower number of stems above 40 cm (8.9%), leaving State owned forests with the highest proportion of larger sized stems.
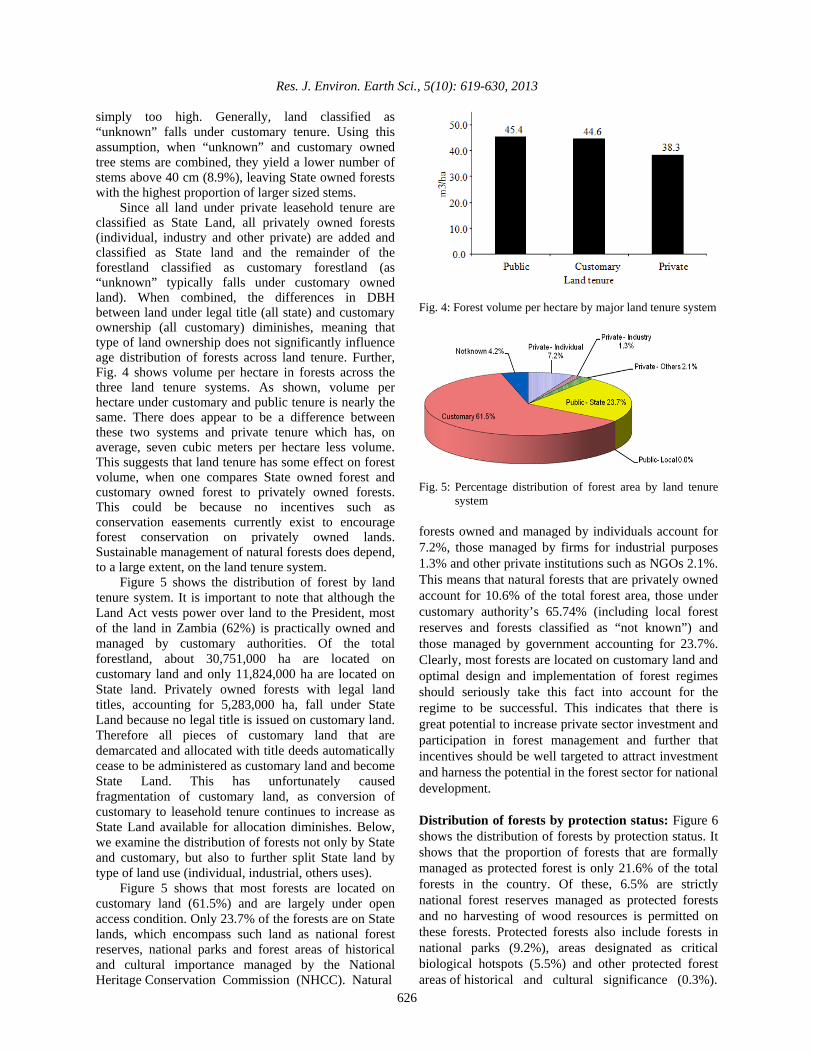
Since all land under private leasehold tenure are classified as State Land, all privately owned forests (individual, industry and other private) are added and classified as State land and the remainder of the forestland classified as customary forestland (as “unknown” typically falls under customary owned land). When combined, the differences in DBH between land under legal title (all state) and customary ownership (all customary) diminishes, meaning that type of land ownership does not significantly influence age distribution of forests across land tenure. Further, Fig. 4 shows volume per hectare in forests across the three land tenure systems. As shown, volume per hectare under customary and public tenure is nearly the same. There does appear to be a difference between these two systems and private tenure which has, on average, seven cubic meters per hectare less volume. This suggests that land tenure has some effect on forest volume, when one compares State owned forest and customary owned forest to privately owned forests. This could be because no incentives such as conservation easements currently exist to encourage forest conservation on privately owned lands. Sustainable management of natural forests does depend, to a large extent, on the land tenure system.
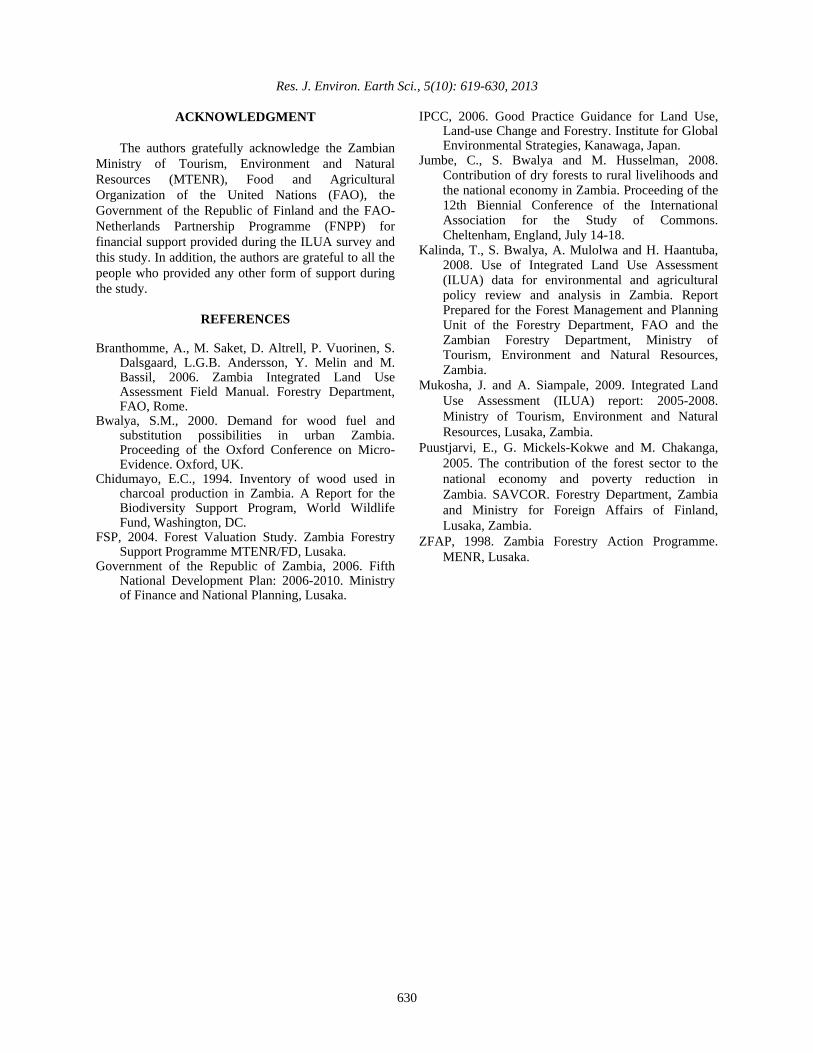
Figure 5 shows the distribution of forest by land tenure system. It is important to note that although the Land Act vests power over land to the President, most of the land in Zambia (62%) is practically owned and managed by customary authorities. Of the total forestland, about 30,751,000 ha are located on customary land and only 11,824,000 ha are located on State land. Privately owned forests with legal land titles, accounting for 5,283,000 ha, fall under State Land because no legal title is issued on customary land. Therefore all pieces of customary land that are demarcated and allocated with title deeds automatically cease to be administered as customary land and become State Land. This has unfortunately caused fragmentation of customary land, as conversion of customary to leasehold tenure continues to increase as State Land available for allocation diminishes. Below, we examine the distribution of forests not only by State and customary, but also to further split State land by type of land use (individual, industrial, others uses).
Figure 5 shows that most forests are located on customary land (61.5%) and are largely under open access condition. Only 23.7% of the forests are on State lands, which encompass such land as national forest reserves, national parks and forest areas of historical and cultural importance managed by the National Heritage Conservation Commission (NHCC). Natural
Fig. 4: Forest volume per hectare by major land tenure system
Fig. 5: Percentage distribution of forest area by land tenure
system forests owned and managed by individuals account for 7.2%, those managed by firms for industrial purposes 1.3% and other private institutions such as NGOs 2.1%. This means that natural forests that are privately owned account for 10.6% of the total forest area, those under customary authority’s 65.74% (including local forest reserves and forests classified as “not known”) and those managed by government accounting for 23.7%. Clearly, most forests are located on customary land and optimal design and implementation of forest regimes should seriously take this fact into account for the regime to be successful. This indicates that there is great potential to increase private sector investment and participation in forest management and further that incentives should be well targeted to attract investment and harness the potential in the forest sector for national development. Distribution of forests by protection status: Figure 6 shows the distribution of forests by protection status. It shows that the proportion of forests that are formally managed as protected forest is only 21.6% of the total forests in the country. Of these, 6.5% are strictly national forest reserves managed as protected forests and no harvesting of wood resources is permitted on these forests. Protected forests also include forests in national parks (9.2%), areas designated as critical biological hotspots (5.5%) and other protected forest areas of historical and cultural significance (0.3%).

Res. J. Environ. Earth Sci., 5(10): 619-630, 2013
627
Fig. 6: Area distribution of forests by protection status
Forests managed for production (local forests reserves) account for 23.7% of the total forests and those managed for multiple uses account for only 16.9%. This means that the extent of forests managed for production, including local forests reserves account for 40% of the total forests in the country. Significant amounts of forests (38%) were classified as either of unknown protection status or as falling under other forest protection regimes not specified in ILUA survey.
Clearly, there is a need to conduct comprehensive forest inventory surveys and forest reclassification to ensure that all forests are properly classified and boundaries clearly mapped. This will help to identify which forests to manage for what purpose and in determining the appropriate mix of institutional arrangements that will guarantee sustainable flow of forest benefits to the economy while at the same time promoting environmental sustainability. A comprehensive land use mapping will further enable government to efficiently allocate land to various land uses and to geographically locate forest reserves in places where land values are consistent with long-term forest management.
In the last few decades, the country has witnessed increasing demand for land for agriculture and urban development and a number of forest reserves have been cleared to pave way for agriculture and urban development. More forests are currently threatened as mineral exploitation and mining activities intensify and at present levels of development, no amount of political will would support restricting development benefits from mining to preserve a natural forest. It is therefore critical to take into account the distribution of mineral resources and anticipate future mineral development when establishing protected forests and to adopt a long-term perspective of land use planning and forest management. Distribution of forests by management plan: In terms of forest management, the ILUA data indicates that only 23% of forests are formally managed with elaborate forest management plans in place. About 41% are traditionally managed but have no formal management plans in place and another 36% of forests
Table 9: Percentage of forest area under management plan per province
Zambian province
Formal management
Traditional management
Management not known
Central 30% 45% 25% Copperbelt 22% 29% 50% Eastern 33% 24% 42% Luapula 2% 46% 51% Lusaka 42% 37% 21% North Western
29% 46% 24%
Northern 18% 60% 22% Southern 35% 49% 16% Western 6% 21% 73% Total % 23.0% 41.0% 36.0% are not known, most likely indicating that they are not managed at all (Table 9). Traditional forest management plans and systems are based on scanty scientific information and it is unlikely that these would promote sustainable management and utilization of forest resources. There may be greater need for government through the Forest Department to expand forest extension services to local communities so as to enable traditional authorities incorporate scientific information in the management and ensure that utilization patterns are sustainable and not environmentally degrading.
Despite the country’s land tenure system and by implication the forest ownership structure, 77% of the country’s forests have no formal management plans in place and need to be properly managed. These forest management regimes should seriously embrace the local preferences and solicit active participation of local communities, user-groups and traditional leaders. Management regimes that simply impose running objectives on local communities and which fail to adequately secure local interests in the forest regime especially the interests of the poor for whom these forests are most critical are unlikely to succeed in most rural communities (Jumbe et al., 2008). The Forest Department in collaboration with stakeholders in the forest sector should therefore endeavor to bring unmanaged forests and those under traditional management systems under formal management. This does not necessarily imply that the forest department should claim total oversight on all public forests; rather, it should spearhead sustainable management by putting in place mechanisms devolving public rights over forests to the local level, the private sector, local communities and identified user-groups. Current status of forest disturbance: Zambia has vast tracts of land under forest cover but their ecological condition has not been precisely known. Most previous estimates of the rate of deforestation were based on very scanty data, small samples, or inferred and extrapolated from very old forest statistics. Consequently, these statistics often are disputed as unreliable and not representative of actual facts on the

Res. J. Environ. Earth Sci., 5(10): 619-630, 2013
628
ground. The ILUA data is comprehensive enough to provide more reliable estimates and help to validate previous estimates of deforestation in Zambia. To put the analysis into context, we begin by providing and comparing estimates of total forest volume from four different inventory studies. The first study was done in 1996 through the Zambia Forest Action Plan (ZFAP, 1998) which was accomplished through expert estimation rather than an inventory, the second study was done as part of the Zambia Forest Support Programme (FSP, 2004) in 2004 incorporating inventories made in several provinces combined with country-wide remote sensing images and the third one refers to estimates compiled for the Global Forest Assessment by the UNFAO in 2005, using extrapolated inventory data from 1969 and 1974. Thus the latest is the ILUA estimate based on inventory data collected in 2006 and 2007. The estimates of forest biomass from these four studies are presented in the Fig. 7. The data indicate that these estimates have not been consistent especially estimates made in 2005, which were based on small samples and largely extrapolated from old forest statistics. The ILUA statistics appear to be more representative compared to the FSP. In this context, the ILUA project has proved quite valuable in generating data necessary to re-examine the rates of deforestation in the country.
Deforestation estimates based on small sample observation of utilization levels and stock inventories have tended to produce quite alarming statistics on deforestation in the country. In Fig. 8, we show that the level of forest disturbance in the country due to human-induced activity is quite low, much lower than generally perceived. We divide the level of forest disturbance into four categories, namely ”non-disturbed forests”, “slightly disturbed”, “moderately disturbed” and “heavily disturbed”. Only 6% of the forests are severely degraded and 26% only moderately disturbed. These two indicate that roughly 32% of the total forests are somewhat disturbed and 63% are undisturbed or mildly disturbed by human activities. Approximately 6% of the forest land had unrecorded disturbance levels. The ILUA data does not validate previous estimates of deforestation of over 500,000 ha per annum, which are extremely high and unsustainable.
It is equally important to understand the relationship between land tenure and deforestation rates and to show whether there is a significant relationship between ownership and the condition of the forest. For instance, private property rights over the forest may provide sufficient incentives to manage the forest more sustainably but only for its private values whereas open access forests provide adverse conditions and incentives that lead to over-exploitation and degradation of the forest resource. Figure 9 shows forest volume in cubic meters per hectares across forest ownership types. Although, as expected, the highest volumes are on protected land (forest reserves and national parks), there
Fig. 7: Comparing stock estimates from three separate studies
Fig. 8: Extent of forest disturbance in Zambia (impact level of
human activity in the forest or other wooded land) Fig. 9: Distribution of forest volume by land ownership
is no significant difference between volume per hectare on state and customary land. However, forests owned by individuals and firms seem to have less volume per hectare than those on customary and state land.
This may be a reflection of the fact that incentives to promote sustainable forest management in privately owned forests are still quite poor and in need of improvement. When volume per hectare within
0.005.00
10.0015.0020.0025.0030.0035.0040.0045.0050.00
Vol/h
a
Indi
vidu
al
Indu
stries
Ot
hers
priv
ate
State
Cu
stom
ary
Not k
nown
38.7231.69
41.0645.38 44.82
41.77

Res. J. Environ. Earth Sci., 5(10): 619-630, 2013
629
Fig. 10: Volume per hectare by canopy cover and land tenure
different tree canopy covers is examined over different tenure types (Fig. 10), privately owned forests appear to have the greatest volume per hectare (97 m3/ha) within the more closed tree canopies (>70%). This could indicate better management of older forests under private tenure, or the difference could be attributed to geography and ecozone type and the mere positioning of a privately owned forest within a denser vegetative zone. Regardless of what the case may be, only small proportions of the country’s forests are privately owned (12%) and efforts to promote conservation of forests on private land, for example, through conservation easement programs may be necessary to bring more forests under private management. This will also require implementing a more flexible land tenure regime that would permit easier transfer of forests currently under customary authority and unmanaged to partial or full private ownership and management.
The joint forest management initiative can help to foster effective partnerships between the private sector and local communities in managing those forests sitting on customary land. Further, those forests in game management areas can also be managed through public-private partnership initiatives that blend wildlife and forest management together using the ecosystem approach to natural resource management.
Although rates of deforestation are not yet able be assessed due to the fact that this is the first inventory of its kind ever done in Zambia, the ILUA data demonstrates the great potential that exists in the forest sector to improve management and incentives for sustainable forest resource management and reduce degradation of the forest resource base. Government cannot sustainably and effectively manage public forests all by itself. It needs expedited devolution of user rights and responsibilities to local communities, user groups and indeed to the private sector. In order to further limit deforestation, there is need to harmonize policies and strengthen linkages between the forest
sector, agriculture, wildlife and tourism and other natural resource sectors. Optimal management of forests will also require instituting payment mechanisms or benefit sharing that will ensure that forest benefits utilized in downstream sectors are appropriately shared with the forest sector. At present, these benefits are not shared with the forest sector to help defray the cost of forestry management. This tends to suppress forest values thereby leading to sub-optimal provision of forest conservation. Forest carbon payments for sustainably managed forests through such mechanisms as Reduced Emissions from Deforestation and Degradation (REDD) could provide an optimal opportunity for capturing these benefits and rewarding adjacent communities who are able to maintain and manage high forest cover.
CONCLUSION
The analysis using the ILUA survey data indicates that Zambia has substantial forest resources which can be managed and properly utilized to further the country’s development prospects and indeed to help promote poverty reduction in the rural areas. Over two thirds of all Zambia’s forests are located on customary land. The country’s forests are extensive and occupy about 67% of the total land area. The data indicate that with the current wood stocking estimated at 2.95 billion m3 and with proper management, this is sufficient to meet the country’s current and future demand for forest products.
In addition, evidence from the analysis of the ILUA data indicates that most of the country’s forests are in good condition and the rates of deforestation are quite modest. For instance, the data indicate that only 5% of the total forests are severely degraded and over 63% of the forests are in good condition. This contrasts sharply with previous estimates which indicate annual rates of deforestation of as much as 500,000 ha mainly derived from historical and small sample information. However, until another ILUA is accomplished and because it represents time zero, deforestation rates can only be made using remote sensing images from the past and comparing them to present-day images. Nevertheless, the ILUA data has enabled new insights to be distilled for forest management decision-making.
Given that more than two-thirds of all forests are located in customary land and are not formally managed, there is need to increase the proportion of forests that are formally managed, both through decentralization and provision of forest extension services. Therefore, government should bring more forests under formal management and more importantly devolve and share some forest rights and responsibilities over public forests with local communities, user-groups and the private sector.
Res. J. Environ. Earth Sci., 5(10): 619-630, 2013
630
ACKNOWLEDGMENT
The authors gratefully acknowledge the Zambian Ministry of Tourism, Environment and Natural Resources (MTENR), Food and Agricultural Organization of the United Nations (FAO), the Government of the Republic of Finland and the FAO-Netherlands Partnership Programme (FNPP) for financial support provided during the ILUA survey and this study. In addition, the authors are grateful to all the people who provided any other form of support during the study.
REFERENCES
Branthomme, A., M. Saket, D. Altrell, P. Vuorinen, S.
Dalsgaard, L.G.B. Andersson, Y. Melin and M. Bassil, 2006. Zambia Integrated Land Use Assessment Field Manual. Forestry Department, FAO, Rome.
Bwalya, S.M., 2000. Demand for wood fuel and substitution possibilities in urban Zambia. Proceeding of the Oxford Conference on Micro-Evidence. Oxford, UK.
Chidumayo, E.C., 1994. Inventory of wood used in charcoal production in Zambia. A Report for the Biodiversity Support Program, World Wildlife Fund, Washington, DC.
FSP, 2004. Forest Valuation Study. Zambia Forestry Support Programme MTENR/FD, Lusaka.
Government of the Republic of Zambia, 2006. Fifth National Development Plan: 2006-2010. Ministry of Finance and National Planning, Lusaka.
IPCC, 2006. Good Practice Guidance for Land Use, Land-use Change and Forestry. Institute for Global Environmental Strategies, Kanawaga, Japan.
Jumbe, C., S. Bwalya and M. Husselman, 2008. Contribution of dry forests to rural livelihoods and the national economy in Zambia. Proceeding of the 12th Biennial Conference of the International Association for the Study of Commons. Cheltenham, England, July 14-18.
Kalinda, T., S. Bwalya, A. Mulolwa and H. Haantuba, 2008. Use of Integrated Land Use Assessment (ILUA) data for environmental and agricultural policy review and analysis in Zambia. Report Prepared for the Forest Management and Planning Unit of the Forestry Department, FAO and the Zambian Forestry Department, Ministry of Tourism, Environment and Natural Resources, Zambia.
Mukosha, J. and A. Siampale, 2009. Integrated Land Use Assessment (ILUA) report: 2005-2008. Ministry of Tourism, Environment and Natural Resources, Lusaka, Zambia.
Puustjarvi, E., G. Mickels-Kokwe and M. Chakanga, 2005. The contribution of the forest sector to the national economy and poverty reduction in Zambia. SAVCOR. Forestry Department, Zambia and Ministry for Foreign Affairs of Finland, Lusaka, Zambia.
ZFAP, 1998. Zambia Forestry Action Programme. MENR, Lusaka.