Embed Size (px)
Citation preview
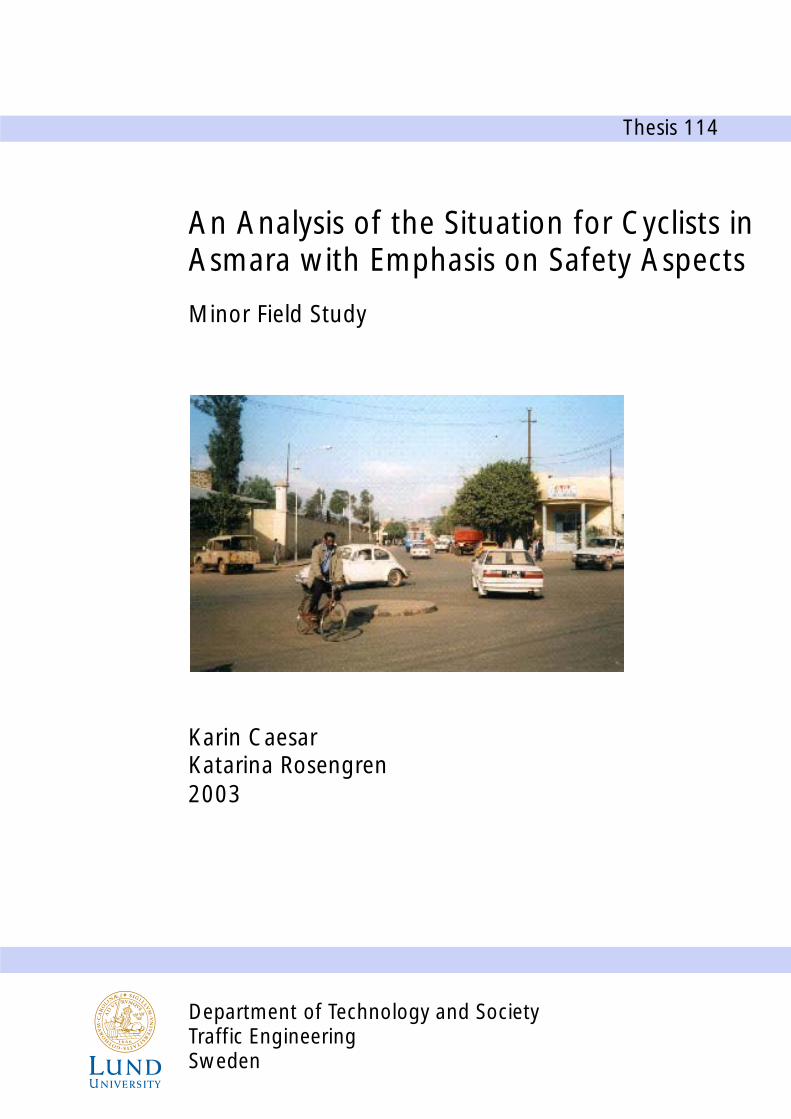
Department of Technology and Society Traffic Engineering Sweden
An Analysis of the Situation for Cyclists in Asmara with Emphasis on Safety Aspects
Minor Field Study
Thesis 114
Karin Caesar Katarina Rosengren 2003
Thesis 114 CODEN:LUTVDG/(TVTT-5081)1-157/2003
ISSN 0286-7394
Institutionen för Teknik och samhälle Avdelningen för Trafikteknik Lunds Tekniska Högskola
Karin Caesar and Katarina Rosengren
An Analysis of the Situation for Cyclists in Asmara with Emphasis on Safety Aspects Minor Field Study
Keywords: Cyclists, Asmara, Eritrea, traffic safety, accidents, speed, model routes
Abstract: This Master’s thesis studies the situation for cyclists in Asmara, the capital of Eritrea, and presents ways to improve their safety. The following pieces of information were used to assess the traffic situation: structure of the road network, traffic accident data, traffic flows and the speed of vehicles. The suggestions on how to improve the traffic safety for cyclists in Asmara can be summarized in three points. Firstly, the status of cycling can be raised by allowing cycling in all parts of the city and making a comprehensive cycling-structure plan. Secondly, the clarity on the traffic scene can be improved by redesigning the intersections. Thirdly, goals regarding traffic accidents can be defined based on statistical data from the traffic police and the hospitals. Model routes provide a means of testing specific designs and measures and can lay the groundwork for a safe, coherent, direct, comfortable and attractive cycling network in Asmara.
Citeringsanvisning: Caesar, Karin & Rosengren, Katarina. An Analysis of the Situation for Cyclists in Asmara with Emphasis on Safety Aspects. Lund 2003. Lunds universitet, Lunds Tekniska Högskola, Institutionen for Teknik och samhälle, Avdelningen för Trafikteknik, Thesis 114
Department of Technology and SocietyLund Institute of Technology Traffic Engineering Box 118, SE-221 00 Lund, Sweden
Institutionen för Teknik och samhälleLunds Tekniska Högskola Avdelningen för Trafikteknik Box 118, 221 00 LUND, Sverige
Acknowledgements
We have received a great deal of help and support throughout the course of this Master’s thesis project. We wish to give our sincere thanks to Elsa Grip and Ole Kasimir for giving us the idea in the first place and for all their enthusiasm along the way. Our deepest gratitude goes to our two excellent supervisors, Lars Ekman and Semere Abay. Semere became a good friend and he went out of his way to fill our stay in Asmara with memorable experiences.
Our dear colleague and friend Christer Lindblom deserves special thanks. He also spent the summer in Asmara working on his own thesis. Without his help, it would have taken much longer to complete the fieldwork.
Sincere thanks to Mayor Semere Russom and to Deputy Mayor Yemane Davit for taking a keen interest in our work. Thanks to all of the staff at the Department of Infrastructural Services for making us feel welcome. We are especially grateful to Aklilu Tecle for his valuable help with our fieldwork and translations and also to Roji Jacob Alex, Alem Tesfamariam, Ram Chandra and Kidhanemariam Abraha for their hospitality and help in finding necessary information and maps.
We very much enjoyed our discussions with Yohannes Teclehaimanot and Dr. Naigzy Gebremehdin, who both conveyed to us their vision of a cycle-friendly Asmara.
Thanks to the staff at the Traffic Police Department, especially Lt. Col. Mahari Negusse, who took the time to talk to us on several occasions. Thanks also to Stifanos Habte of the Ministry of Transportation and Communication for the data about motorized vehicles and an interesting talk.
Our heartfelt gratitude goes to Bertil Egerö, Stig Gustavsson, David Edman, Håkan Lockby and Anders Tingvar for offering us their knowledge, support and friendship.
We are deeply indebted to our on call computer expert Håkan Caesar and to Henrik Evanth for proofreading the document and giving valuable comments.
Malmö January 5, 2003
Karin Caesar Katarina Rosengren

Address KTH MFS SE-100 44 Stockholm
Visiting address International Office Drottning Kristinas väg 30 Stockholm
TelephoneNat 08 7906000Int +46 8 7906000
Fax Nat Int +46 8 790 8192
Internethttp://www.kth.se/student/ utlandsstudier/mfs [email protected]
Preface
This study has been carried out within the framework of the Minor Field Studies Scholarship Programme, MFS, which is funded by the Swedish International Development Cooperation Agency, Sida.
The MFS Scholarship Programme offers Swedish university students an opportunity to undertake two months of field work in a Third World country. The results of the work are presented in a report at the Master’s degree level, usually the student’s final degree project. The MFS study is primarily conducted within a subject area that is important from a development perspective and in a country supported by Swedish international development assistance.
The main purpose of the MFS Programme is to enhance Swedish university students’ knowledge and understanding of these countries and their problems and opportunities. An MFS should provide the student with initial experience of conditions in such a country. A further purpose is to widen the Swedish human resources cadre for engagement in international development cooperation.
The International Office at the Royal Institute of Technology, KTH, Stockholm, administers the MFS Programme for the faculties of engineering and natural sciences in Sweden.
Sigrun Santesson Programme Officer MFS Programme

Summary
Background information about the project
Eritrea is a young nation that faces several challenges, many of which lie within the field of transportation. As a result of thirty years of war, Eritrea’s transportation infrastructure has been severely damaged. In the nation’s capital, Asmara, the number of traffic accidents has increased at an alarming rate in the past few years due to an increase in motorized traffic. The authorities of Asmara have recognized the need to look over the street network in the city and to improve the safety situation for vulnerable road users.
The Municipality of Lund and the Municipality of Asmara signed an official agreement on twinning cooperation in 1997. In the year 2001, Asmara’s local government requested support in developing a cycling-structure plan.
The subject matter for the Master’s thesis An Analysis of the Situation for Cyclists in Asmara with Emphasis on Safety Aspects was chosen in accordance with the interests of the Municipality of Asmara concerning cyclists.
Aim
The two main objectives of this Master’s thesis are to assess the general situation for cyclists in Asmara and to make an in-depth analysis of the safety aspects of cycling in order to come up with suggestions on how to improve the safety situation.
Method
The work in Asmara entailed a traffic inventory of the city, collection of traffic accident data, traffic counts, speed measurements, as well as discussions with authorities regarding cyclists and cycling. The inventory was mostly carried out on foot and by bicycle. We studied the city structure, concentrating on the location of key points, type and condition of the roads and type of road users. The traffic accident data was provided by the Traffic Police Department.
A first round of traffic counts was made during several different time intervals on only a few sections. This was done in order to get an idea of the fluctuation of the traffic flows during the day and to find out the peak times. Then, a second round of counts was carried out on more sections but only during the peak times. The traffic counts were made for 30-minute intervals.
The speed of vehicles is closely related to traffic safety. Speed measurements of motorized vehicles were conducted on 13 sections. A radar gun was used to make the measurements. The data was processed in the program Speedboot and presented in the program BsGraph.
The final assessment of the situation for cyclists in Asmara is based on a Dutch model that is explained in the design manual Sign up for the bike (C.R.O.W., 1994). The model evaluates five factors that describe the conditions for cyclists in a planned or existing situation. The five factors are:
Safety Coherence Directness

Comfort Attractiveness
The current status of the situation for cyclists in Asmara
Role of cycling
Cycling is a widespread mode of transport in Asmara today, and it has every possibility of increasing as well. There is, however, one main factor that threatens the progress of cycling. The traffic situation in the city is considered to be chaotic and dangerous by the general public and authorities alike. Lack of road safety is the most common reason cited by people for not using bicycles as a means of transport.
Cycling is prohibited in the very center of the city. This illustrates the fact that cyclists are not considered to have a given place on the traffic scene. They are considered to be hybrids between pedestrians and drivers. This means that it is not easy for them to know how to act in the traffic environment.
The general view is that cyclists lack discipline. One of the main reasons why cyclists do not always follow traffic rules in Asmara may be that in the past, traffic and town planning did not take cyclists into account. Ideally, the needs of cyclists should be considered at the beginning when plans are made for new roads and areas. The local government of Asmara has asked for help in making the town bicycle-friendly and this initiative is certainly promising for the future.
Bicycle accidents
In Eritrea, traffic accidents are usually reported to the traffic police. It is not certain if the hospitals keep any data about traffic accidents, let alone bicycle accidents. According to Swedish studies, the accidents reported to the police primarily target car drivers while the accidents reported to the hospitals primarily target vulnerable road users. Since the data provided in Asmara covers only accidents reported to the police, it is presumed that the gray zone of traffic accidents must be quite large.
The accident data has been difficult to analyze since we did not have access to data from more than the past 1.5 years. However, some conclusions can be made: The number of fatalities from traffic accidents per 100,000 inhabitants for 2001 and the first half of 2002 was higher in Asmara than in Lund and Malmö. The number of light and severe injuries in Asmara is probably higher than the data shows. Accidents leading up to these injuries are most likely not reported to the police to the same extent as fatal accidents. The number of reported accidents involving only one bicycle is remarkably low in Asmara. This is probably due to the same reason as mentioned above.
Traffic counts
The traffic in Asmara does not follow a characteristic pattern with well-defined peak times. It is interesting to see that the traffic is quite evenly distributed during the day and therefore it is not so easy to ascertain peak times. The traffic counts have shown that cycling is widespread means of transportation in Asmara. On a few sites, there are more bicycles than motorized vehicles, and it is common that at least 50 % of the vehicles are comprised of bicycles. At most, counts of 300 - 500 bicycles during half an hour were noted. This is considered a very high figure.
An analysis of the safety situation

There is a close relationship between vehicle speed and safety: the probability of an accident taking place increases with speed and the outcome of the accident strongly depends on the collision speed.
A substantial area of Asmara has a speed limit of 35 km/h. This is a positive feature. Of course, it is the true speeds of the vehicles that are of interest when making an assessment of the traffic safety situation for the road users. The speed measurements have shown that speeding is generally not a big problem in Asmara, but does occur on some sections. There are problems with speeding on the following sections with a speed limit of 35 km/h: Martyrs Avenue, where the 85-percentile is 50 km/ h in the westward direction and Damtew Avenue, with an 85-percentile of 52 km/h in the northward direction. On Edgeth Avenue (east), the 85-percentile is as high as 72 km/h. The speed limit here is 50 km/h. The speed of vehicles is likely to increase with an improvement in the condition of the streets and roads.
Clarity on the traffic scene is very important for the safety of all road users. Today, none of the road users in Asmara are given a clear signal of how to act. The design of the infrastructure is old and very basic. The intersections are large and oftentimes confusing. In addition, the streets are wide and there are very few lane markings and traffic signs.
Most of the streets and roads in Asmara, whether paved or unpaved, are in poor condition with potholes and heaps of gravel in the carriageway. During the rainy season, the condition of all types of roads becomes even worse, resulting in severe traffic problems. The runoff is slow on many of the streets, resulting in huge masses of water hindering the flow of traffic.
Few roads and streets have streetlights and the lack of light makes it dangerous especially for vulnerable road users. To worsen the situation, pedestrians and cyclists are hardly ever equipped with reflectors.
Suggestions on how to improve the safety situation for cyclists
The culmination of our project has been to make suggestions on how to improve the safety situation for cyclists in Asmara. These can be summarized in the following manner:
Increase the status of cyclists – All streets and roads should be opened to cyclists. This factor has positive effects on all the main requirements of cyclists. Allowing cycling in the very heart of Asmara sends the message that cyclists have a given place in the traffic environment.
Improve the situation in the intersections – There are several intersections and roundabouts in Asmara with more than four legs, a fact that compromises the traffic safety for vulnerable road users in particular. A recommendation is therefore that intersections and roundabouts should have four legs at the most. The size of the intersections should be diminished so that road users keep low speeds. The clarity in the intersections needs to be improved so that the road users will get a better idea of how they should act. Speed-reducing measures in Asmara – It is recommended that some of the wider streets in Asmara should be redesigned and made narrower to reduce the speed. Reduced width in combination with forcing the drivers to make maneuvers sideways is preferable to reduce the temptation for speeding. Well-designed roundabouts have the effect of cutting off the streets straight lines and in that way reducing the speed.

Separation of cyclists from motorized vehicles – Roads that are in need of separation in Asmara are especially the roads with a speed limit of 50 km/h. Edgeth Avenue (west), road to Kushet and road to Kehauta already have separated bicycle traffic. Road to Airport and Edgeth Avenue (east) on the other hand, have no separation, which is necessary for these roads. Also Road to Keren, Ras Abebe Aregai Avenue by the university and Damtew Avenue are in need of separated bicycle lanes. Whether or not separation is needed on Independence and Martyrs Avenue if they are opened for cycling, is a complicated question. Further studies are needed to make the correct decision.
Maintenance of streets and roads – It is important that the maintenance of streets and roads is given high priority. The poor condition of the pavement of many roads has adverse effects on several aspects of the traffic situation. All road users are affected, but the vulnerable road users such as cyclists and pedestrians are particularly exposed. The cyclists’ main requirements of safety, coherence, directness, comfort and attractiveness are all influenced by the condition of the road surface.
Traffic education and public awareness campaigns – To improve the discipline of all the road users, traffic rules and safety aspects should be a part of the school curriculum. This subject should be introduced at an early stage in the schooling system. Traffic awareness campaigns targeted at the general public can help to improve the behavior of all road users. It is not easy to reach out to all the of road users since they are so diverse in nature. There are different types of road users such as pedestrians, cyclists and motorists. To make matters more difficult, these groups are not homogenous. It is an intricate task to make the campaigns as effective as possible. There must be a few well-defined messages and the language should be clear and simple.
Define goals regarding traffic accidents – Ideally, traffic accident data should be collected by the traffic police and the hospitals so that data from the two sources can be compiled and compared. Statistical data of traffic accidents makes it possible to see trends and to make analyses as to the effects of measures taken. If this is to be done, data must be collected annually and compared over a long time period such as 5 or 10 years. Goals regarding traffic accidents should be defined and these goals can be assessed on the basis of the traffic accident data. The goals can be defined annually in terms of a certain reduction in the number of traffic accidents or injuries.
Model Routes – The purpose of a model route or a demonstration-bicycle-route is to show how different designs of bicycle facilities affect the safety, trafficability and convenience of the cyclists. Another important goal is to create a bicycle route that is continuous and well planned for the cyclists. Creating a model route in Asmara is a good way to see the different ways of solving specific problems as well as to test new solutions, for instance narrower streets and smaller intersections. The effects of new solutions can be studied and assessed. Ultimately, a model route can lead to the development of a comprehensive and safe cycling network in Asmara.

Table of Contents
ACKNOWLEDGEMENTS PREFACE SUMMARY
1 INTRODUCTION ................................................................................................................................. 1
1.1 BACKGROUND INFORMATION ABOUT ERITREA................................................................................. 11.2 BACKGROUND INFORMATION ABOUT THE PROJECT .......................................................................... 21.3 AIM ................................................................................................................................................ 31.4 DELIMITATIONS .............................................................................................................................. 31.5 STRUCTURE OF THE REPORT ............................................................................................................ 3
2 METHOD .............................................................................................................................................. 5
2.1 PHASE ONE ..................................................................................................................................... 52.2 PHASE TWO .................................................................................................................................... 52.3 PHASE THREE.................................................................................................................................. 6
3 TRAFFIC INVENTORY OF ASMARA............................................................................................... 9
3.1 CITY STRUCTURE ............................................................................................................................ 93.2 TRAFFIC SITUATION ...................................................................................................................... 143.3 CULVERTS .................................................................................................................................... 22
4 ROLE OF CYCLING IN ASMARA ................................................................................................... 25
4.1 THE BICYCLE’S POSITION AS A MEANS OF TRANSPORTATION ......................................................... 254.2 VIEW OF CYCLISTS ........................................................................................................................ 274.3 ATTITUDES CONCERNING CYCLISTS............................................................................................... 28
5 BICYCLE ACCIDENTS ..................................................................................................................... 29
5.1 THE IMPORTANCE OF TRAFFIC ACCIDENT DATA............................................................................. 295.2 REPORTING TRAFFIC ACCIDENTS ................................................................................................... 295.3 AVAILABILITY OF ACCIDENT DATA ............................................................................................... 295.4 RELIABILITY OF ACCIDENT DATA .................................................................................................. 305.5 STATISTICAL DATA OF BICYCLE ACCIDENTS .................................................................................. 315.6 LOCATION OF ACCIDENTS.............................................................................................................. 35
6 INVENTORY OF TRAFFIC FLOWS................................................................................................ 39
6.1 BACKGROUND TO TRAFFIC COUNTS............................................................................................... 396.2 DECIDING HOW TO GO ABOUT THE TRAFFIC COUNTS ..................................................................... 406.3 TRAFFIC COUNTS ON EIGHTEEN SECTIONS ..................................................................................... 44
7 THE SITUATION FOR CYCLISTS IN ASMARA............................................................................ 51
7.1 EXPLANATION OF THE METHOD OF ASSESSMENT............................................................................ 517.2 SAFETY......................................................................................................................................... 517.3 COHERENCE.................................................................................................................................. 547.4 DIRECTNESS.................................................................................................................................. 557.5 COMFORT ..................................................................................................................................... 567.6 ATTRACTIVENESS.......................................................................................................................... 58
8. ANALYSIS OF THE SAFETY SITUATION FOR CYCLISTS IN ASMARA.................................. 61
8.1 SAFETY OF CYCLISTS AND SPEED OF VEHICLES .............................................................................. 618.2 SPEED MEASUREMENTS IN ASMARA ............................................................................................... 658.3 CYCLISTS’ POSITION ON THE TRAFFIC SCENE ................................................................................. 718.4 CLARITY ON THE TRAFFIC SCENE................................................................................................... 718.5 POOR STANDARD OF ROADS .......................................................................................................... 74
9. SUGGESTIONS ON HOW TO IMPROVE THE SAFETY SITUATION FOR CYCLISTS IN ASMARA ...................................................................................................................................................... 77
9.1 INCREASE THE STATUS OF CYCLING............................................................................................... 779.2 IMPROVE THE SITUATION IN THE INTERSECTIONS............................................................................ 789.3 SPEED-REDUCING MEASURES IN ASMARA....................................................................................... 799.4 SEPARATION OF CYCLISTS FROM MOTORIZED VEHICLES .................................................................. 809.5 MAINTENANCE OF STREETS AND ROADS ........................................................................................ 819.6 TRAFFIC EDUCATION AND PUBLIC AWARENESS CAMPAIGNS........................................................... 819.7 DEFINE GOALS REGARDING TRAFFIC ACCIDENTS........................................................................... 829.8 MODEL ROUTES ............................................................................................................................ 82
10 CONCLUSIONS AND FINAL DISCUSSION.................................................................................... 87
REFERENCES
APPENDIX 1: TRAFFIC COUNT FORMAPPENDIX 2: RESULTS OF TRAFFIC COUNTSAPPENDIX 3: FORM FOR SPEED MEASUREMENTSAPPENDIX 4: RESULTS OF SPEED MEASUREMENTS
Introduction
1
1 Introduction
1.1 Background Information About Eritrea
Geography
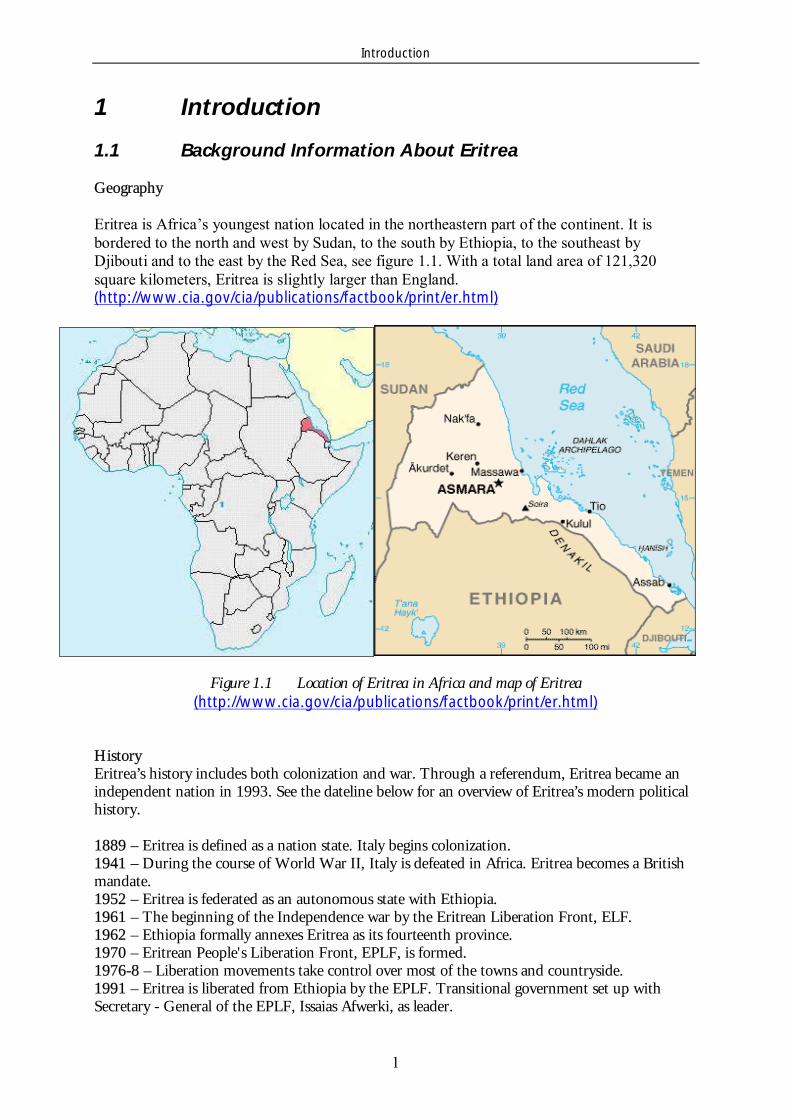
Eritrea is Africa’s youngest nation located in the northeastern part of the continent. It is bordered to the north and west by Sudan, to the south by Ethiopia, to the southeast by Djibouti and to the east by the Red Sea, see figure 1.1. With a total land area of 121,320 square kilometers, Eritrea is slightly larger than England. (http://www.cia.gov/cia/publications/factbook/print/er.html)
Figure 1.1 Location of Eritrea in Africa and map of Eritrea (http://www.cia.gov/cia/publications/factbook/print/er.html)
History Eritrea’s history includes both colonization and war. Through a referendum, Eritrea became an independent nation in 1993. See the dateline below for an overview of Eritrea’s modern political history.
1889 – Eritrea is defined as a nation state. Italy begins colonization. 1941 – During the course of World War II, Italy is defeated in Africa. Eritrea becomes a British mandate. 1952 – Eritrea is federated as an autonomous state with Ethiopia. 1961 – The beginning of the Independence war by the Eritrean Liberation Front, ELF. 1962 – Ethiopia formally annexes Eritrea as its fourteenth province. 1970 – Eritrean People's Liberation Front, EPLF, is formed. 1976-8 – Liberation movements take control over most of the towns and countryside. 1991 – Eritrea is liberated from Ethiopia by the EPLF. Transitional government set up with Secretary - General of the EPLF, Issaias Afwerki, as leader.
Introduction
2
1993 – UN sponsored referendum for independence of Eritrea held on April 23 - 25. 99% of the votes cast are in favor of independence. On April 27, Eritrea becomes an independent and recognized nation. May 24 is proclaimed National Day in Eritrea. 1998-22000 – A 2.5-year border war with Ethiopia. Eritrea hosts a UN peacekeeping operation that monitors the border region until an international commission determines and demarcates the boundary between the two countries. 2002 – The boundary between Eritrea and Ethiopia is accepted by both countries. Demilitarization is still not complete. (http://www.open.org/~tfl/eritrea/history.html),(http://www.cia.gov/cia/publications/factbook/print/er.html)
People, Religion and Language
Eritrea has a population of about 3.5 million. The capital, Asmara, is roughly 30 square kilometers and has about 400,000 inhabitants. There are nine ethnic groups in Eritrea: Tigrinya, Tigré, Saho, Afar, Hedareb, Bilen, Kunama, Nara and Rashaida. The Tigrinyan group accounts for 50 % of the population and they are predominantly Orthodox Christian. Most of the other ethnic groups are mainly Sunni Muslims. There are also a minority of Roman Catholics, Protestants and animists. Therefore, the population of Eritrea can be said to be equally divided between Christians and Muslims. Each of the ethnic groups has its own language. Tigrinya, Arabic and English can all be considered official languages of Eritrea (Gordon, 2000).
Economy
The Eritrean economy is based on subsistence agriculture. About 80 % of the population work with farming, herding or fishing. Eritrea’s main exports are salt, flowers, textiles, leather and livestock. Imports include fertilizers, machinery, spare parts, tools and construction materials (ibid).
The border war with Ethiopia in 1998-2000 interrupted Eritrea’s economic growth after independence. The war took its toll on the young nation’s economy in many ways. Ethiopian trade through Eritrean ports ceased. Eritrea’s food production was severely diminished during the war and it faced problems the summer of year 2002 as a result of drought.
The government’s two main priorities are food security and development of infrastructure. Soil erosion, outdated technology and lack of irrigation are factors that hinder the agricultural development. However, there are promising horticultural projects and there are hopes of exporting lobster, fish and crab from the Red Sea (ibid).
1.2 Background Information About the Project
Eritrea faces several challenges, many of which lie within the field of transportation. As a result of thirty years of war, Eritrea’s transportation infrastructure has been severely damaged. The reconstruction of damaged roads and bridges has been given high priority and new roads are being built as well. In the nation’s capital, the number of traffic accidents has increased at an alarming rate in the past few years due to an increase in motorized traffic. The authorities of Asmara have recognized the need to look over the street network in the city and to improve the safety situation for vulnerable road users.
The municipalities of Lund and Asmara signed an official agreement on twinning cooperation in 1997. When representatives from Lund were visiting Asmara in February – March 2001,
Introduction
3
Asmara’s local government requested support in developing a cycling-structure plan. Details of a proposed project were discussed between Yohannes Teclehaimanot, the head of town planning, and Elsa Grip from the Lund Town Planning Office. The project has now been set in motion and is called Planning for bicycle use in Asmara.
The local government of Asmara aims to make the city more cycle-friendly so that more people will use the bicycle as a mode of transport. Cycling is environment-friendly and has positive health effects. As a widespread means of transportation, cycling is advantageous in other respects, especially in a developing country such as Eritrea. For instance, cycling provides an excellent mode of transport for less wealthy people as well as an increased opportunity of movement for women and students.
The subject matter for the Master’s thesis An Analysis of the Situation for Cyclists in Asmara with Emphasis on Safety Aspects was chosen in accordance with the interests of the Municipality of Asmara concerning cyclists. We made a two-month-visit to Asmara in order to study the situation for cyclists in the city.
1.3 Aim
The two main objectives of this Master’s thesis are to assess the general situation for cyclists in Asmara and to make an in-depth analysis of the safety aspects of cycling in order to come up with suggestions on how to improve the safety situation.
An important step in increasing the use of bicycles in Asmara is to make the cyclists feel safe. We hope that this report will form the basis for continued work with safety for the cyclists in Asmara.
1.4 Delimitations
There are several delimitations that form boundaries for this project. Our stay in Asmara was limited to two months and this meant that we had to limit the extent of our traffic counts to eighteen sections.
Weather conditions restricted the length of the time intervals for the traffic counts as well as the time spent on speed measurements. Due to safety considerations, it was not advisable to make any type of fieldwork once the sun had set.
The data from the traffic police covered the last 1.5 years. Statistics about the location of bicycle accidents in Asmara was not available, and neither was a map or list of the streets and roads closed to cycling. Therefore, a complete analysis of the accident data could not be made within the course of this project.
It would have been desirable to see if the hospitals kept any data pertaining to bicycle accidents. However, it would have proved too time-consuming to visit the hospitals and it was not certain that there were any such records at all. Therefore, traffic accident data was only collected from the traffic police.
Finally, though this report aims to present the many facets of cycling in Asmara, it is only safety aspects that are studied in detail. This delimitation was chosen so that the scope of the report would not be too great.
1.5 Structure of the Report
Introduction
4
Chapter 2 presents the method used during the course of the project. Chapter 3 contains a traffic inventory of Asmara. Chapter 4 explores the role of cycling in Asmara. Chapter 5 is a presentation and analysis of the data of bicycle-related accidents. Chapter 6 contains an inventory of traffic flows and describes all aspects of the traffic counts made. Chapter 7 is an in-depth study of cycling in Asmara. The current cycling conditions are evaluated with regards to safety, coherence, directness, comfort and attractiveness. Chapter 8 presents an analysis of the safety situation for cyclists in Asmara. Chapter 9 contains suggestions on how to improve the safety situation for cyclists in Asmara. Chapter 10 presents the conclusions and final discussion.

Method
5
2 Method
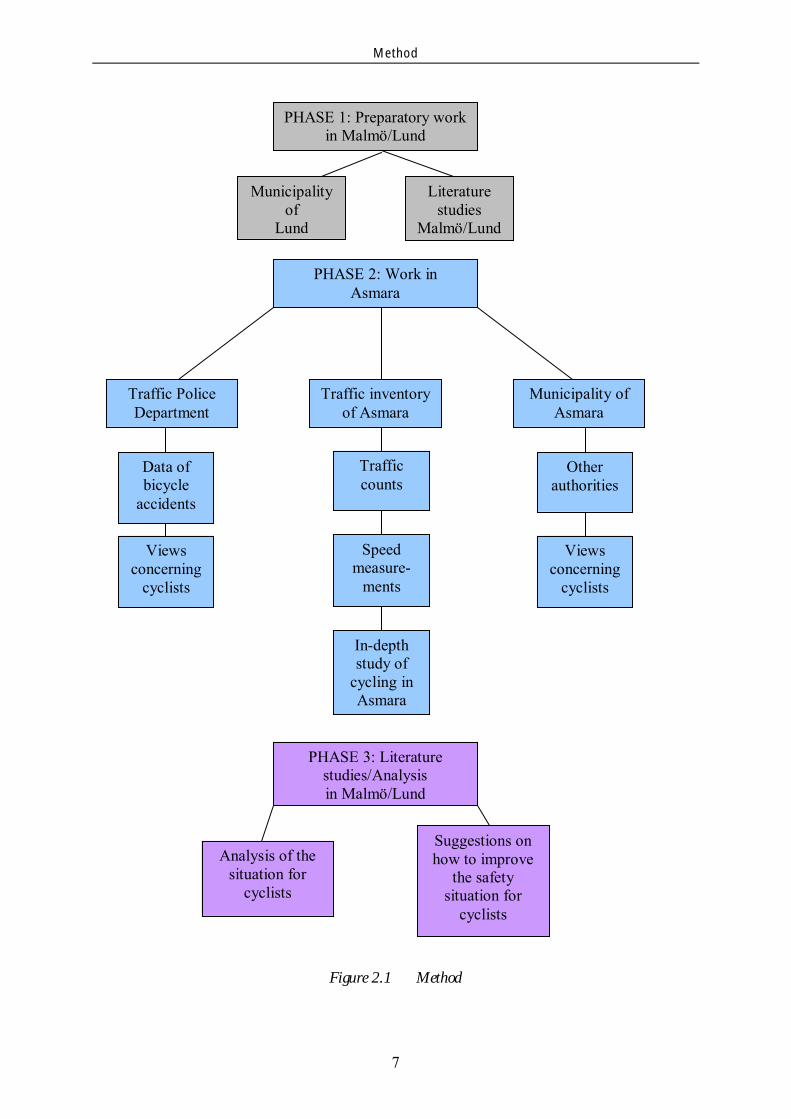
The methodology used during the course of the project for this Master’s thesis is both theoretical and empirical. The work with the project can be divided into three separate phases:
1. Preparatory work in Lund/Malmö 2. Work in Asmara 3. Literature studies and analyses in Lund/Malmö
2.1 Phase One
The first phase of work on the project can be divided into two distinct parts. The first part entailed meetings with staff of the Municipality of Lund. They gave valuable information about Asmara and provided maps and satellite photos of the city. They conveyed facts and figures pertaining to transportation in general and cycling in particular.
The second part consisted of extensive research on all aspects of cycling. Books and manuals that deal with cycling infrastructure were studied. More information was gathered about Asmara and Eritrea. A preliminary outline of the work to be done and data to be collected in Asmara was drawn up in accordance with the aims of the project.
2.2 Phase Two
The second phase began upon arrival in Asmara. A preliminary assessment of the situation for cyclists was done. A traffic inventory of Asmara was undertaken during which we studied the city’s structure and the general traffic situation of the city. This inventory was carried out by touring the city by foot, bicycle, car and bus.
Parallel to this work, an investigation was made to determine the role of cycling in Asmara. Discussions formed the backbone of this work. We wanted to find out how cycling and cyclists are viewed by the general public, different authorities, professionals as well as the cyclists themselves. Among those who gave their views on the matter were the following:
Staff of the Department of Infrastructural Services of the Municipality of Asmara Lt. Col. Mahari Negusse of the Traffic Police Department in Asmara Architect and planner Dr. Naigzy Gebremehdin Mr. Yohannes Teclehaimanot of the Department of Public Works Mr. Stifanos Habte, head of the Land Transportation Division of the Ministry of Transportation and Communication Respondents to a survey about cycling conducted by Lindblom (2003)
To gather data pertaining to the bicycle-related accidents in Asmara, we visited the Traffic Police Department. The traffic police kept statistical records on different aspects of bicycle accidents. We talked to a member of the staff, Lt. Col. Mahari Negusse, who gave us interesting facts and views concerning bicycle accidents.
The next natural step was to make traffic counts in Asmara. Since the Municipality of Asmara never had made formal traffic counts, the magnitude of the traffic flows in the city was not known, nor was the breakdown of the percentage of cars, bicycles and so forth. A decision was

Method
6
thus made to carry out simple traffic counts on chosen sections in the city. The vehicles counted were cars, trucks and buses, bicycles and animal-drawn carts.
We wanted to get an idea of the fluctuation of the traffic flows during the day and to find out the peak times. Our first course of action was therefore to make traffic counts during several different time intervals on only a few sections. After this work was completed, we made a second round of counts on more sections but only during the peak times. The traffic counts were made for 30-minute intervals. The form used to for the traffic counts is found in Appendix 1. The data from the counts was entered into an Excel file and the complete set of data can be found in Appendix 2. The details of the traffic counts are presented in chapter 6.
The speed of vehicles is closely related to traffic safety. Speed measurements of motorized vehicles were conducted parallel to the traffic counts. A radar gun was used to make the measurements. The person holding the radar gun usually stood at the edge of the sidewalk and pointed the radar gun towards oncoming traffic. The angle between the measured vehicles and the radar gun was kept as small as possible to minimize the error of the measured velocity. The size of the angle, if any, was recorded so that the correct velocity later could be calculated. The form used for speed measurements is found in Appendix 3. The data was processed in the program Speedboot and presented in the program BsGraph. Appendix 4 contains these results. The details of the speed measurements are discussed in chapter 8.
The final work in Asmara consisted of an in-depth study of the situation for cyclists in the town. Main cycling flows were determined based on the traffic counts. Preliminary thoughts and observations concerning cycling were noted, along with some suggestions on how to improve the safety situation for cyclists in Asmara.
2.3 Phase Three
The final phase of the work with the Master’s thesis was done in Sweden. Further literature studies were carried out to complement the information gathered initially. Final analyses were carried out regarding the situation for cyclists in Asmara and suggestions were made of how to improve the safety for them.
The final assessment of the situation for cyclists in Asmara is based on a Dutch model found in the design manual Sign up for the bike (C.R.O.W., 1994). The model evaluates five factors that describe the conditions for cyclists in a planned or existing situation. The five factors are:
Safety Coherence Directness Comfort Attractiveness
This project did not entail conflict studies in Asmara since we were not trained in the conflict technique. Interviews with cyclists and the general public were not conducted within the scope of this project. However, some material regarding cyclists’ views were provided by Lindblom (2003)
Figure 2.1 on the next page is a simplified flow chart illustrating the three phases of work and an overview of the methodology used in the course of this project.
Method
7
Figure 2.1 Method
PHASE 1: Preparatory work in Malmö/Lund
Municipality of
Lund
PHASE 2: Work in Asmara
Traffic inventory of Asmara
Traffic Police Department
Municipality of Asmara
Data of bicycle
accidents
PHASE 3: Literature studies/Analysis in Malmö/Lund
Suggestions on how to improve
the safety situation for
cyclists
Analysis of the situation for
cyclists
Views concerning
cyclists
Traffic counts
Speed measure-
ments
In-depth study of
cycling in Asmara
Other authorities
Views concerning
cyclists
Literature studies
Malmö/Lund
Traffic Inventory of Asmara
9
3 Traffic Inventory of Asmara
3.1 City Structure
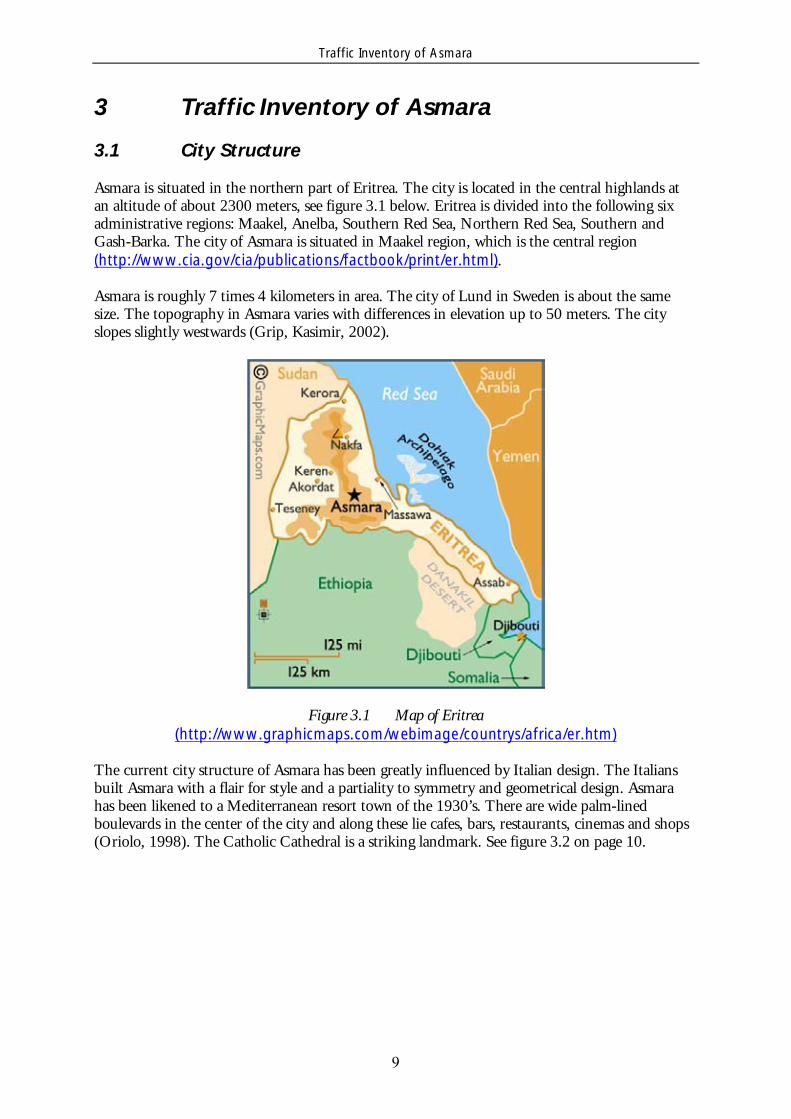
Asmara is situated in the northern part of Eritrea. The city is located in the central highlands at an altitude of about 2300 meters, see figure 3.1 below. Eritrea is divided into the following six administrative regions: Maakel, Anelba, Southern Red Sea, Northern Red Sea, Southern and Gash-Barka. The city of Asmara is situated in Maakel region, which is the central region (http://www.cia.gov/cia/publications/factbook/print/er.html).
Asmara is roughly 7 times 4 kilometers in area. The city of Lund in Sweden is about the same size. The topography in Asmara varies with differences in elevation up to 50 meters. The city slopes slightly westwards (Grip, Kasimir, 2002).
Figure 3.1 Map of Eritrea (http://www.graphicmaps.com/webimage/countrys/africa/er.htm)
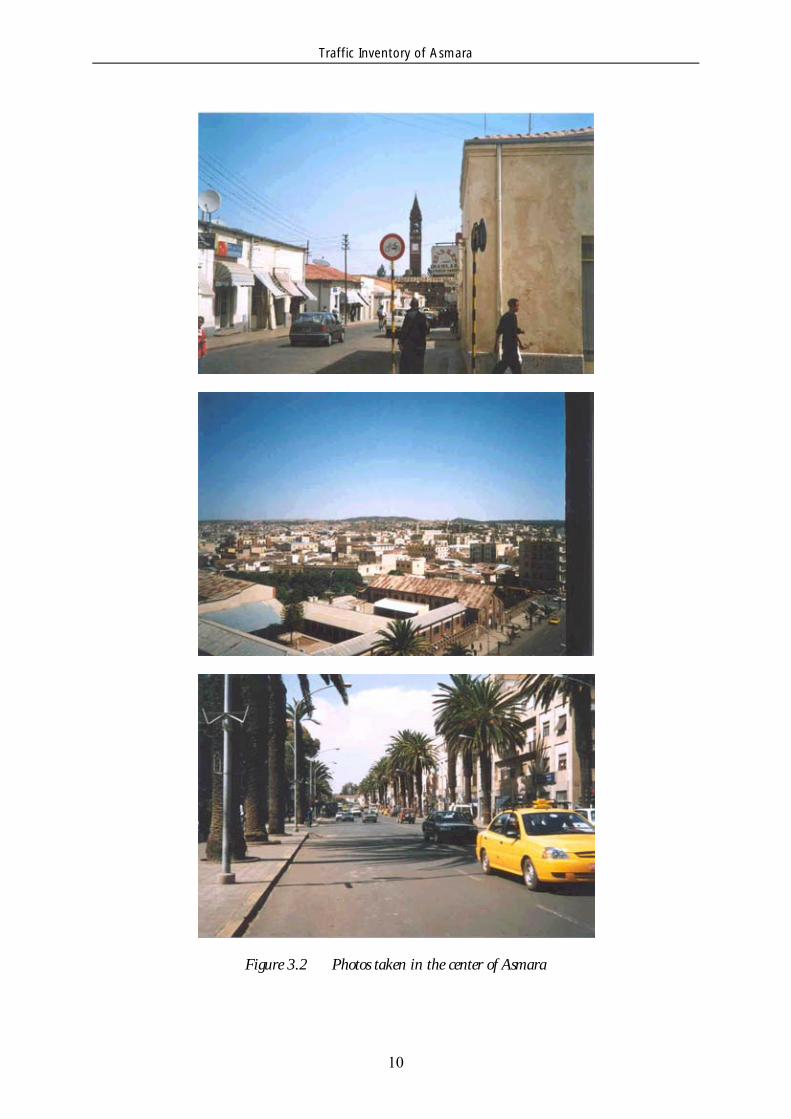
The current city structure of Asmara has been greatly influenced by Italian design. The Italians built Asmara with a flair for style and a partiality to symmetry and geometrical design. Asmara has been likened to a Mediterranean resort town of the 1930’s. There are wide palm-lined boulevards in the center of the city and along these lie cafes, bars, restaurants, cinemas and shops (Oriolo, 1998). The Catholic Cathedral is a striking landmark. See figure 3.2 on page 10.
Traffic Inventory of Asmara
10
Figure 3.2 Photos taken in the center of Asmara

Traffic Inventory of Asmara
11
There is a Central Business District where many of the commercial establishments, public offices, ministries and other big workplaces are located. See figure 3.3 below.
Figure 3.3 Central Business District
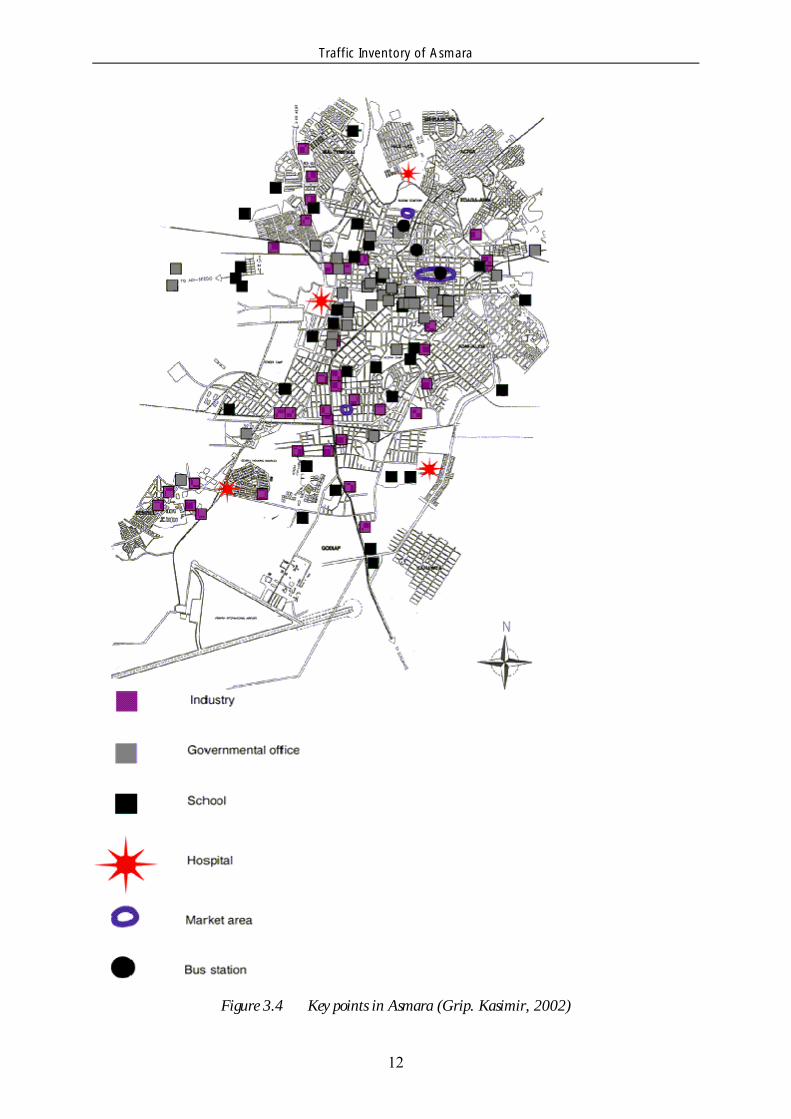
Several key points such as schools, churches, mosques, marketplaces and bus terminals are located at the heart of Asmara. Within the boundaries of the city there are a few larger factories producing food, beverages, clothing and textiles. See Figure 3.4 on page 12.
Traffic Inventory of Asmara
12
Figure 3.4 Key points in Asmara (Grip. Kasimir, 2002)

Traffic Inventory of Asmara
13
There are different types of residential areas in the city. People who live in the city center have homes in exclusive villas, above shops as well as in apartment blocks or in small hotels and family-run pensions. In the suburbs there are entire neighborhoods of Art Deco houses (Oriolo, 1998). There is a shantytown north of the city center. See figure 3.5 below.
Figure 3.5 Top: Poorer neighborhood. Middle: Larger villas. Bottom: New suburbs
Traffic Inventory of Asmara
14
Asmara is surrounded by 13 satellite villages, all of which lie within a range of about 15 kilometers from the city. Aside from the existing villages, new areas of development are being planned. These new housing areas are called Tessa developments. The size of the city including the new areas is about 10 times 6 kilometers, compared to 7 times 4 kilometers today. There are plans for new industrial areas. New main roads are also being planned and built, one of which is a ring road.
3.2 Traffic Situation
Street and roads
There is a Master plan from 1974 for Asmara but this plan has not been updated. The Municipality of Asmara wishes to make a new Master plan for the city. Most likely, this goal will be achieved soon with the help of international consultants.
The road network of Asmara is largely based on the Master plan from 1974. The street network of the city follows a grid pattern with a wide-meshed grid of main streets, a finer grid of secondary streets and local streets at an intermediary level (Grip, Kasimir, 2002).
Aside from three bicycle lanes built along newly built main roads leading to the villages, specific cycling infrastructure is virtually nonexistent. Figure 3.6 on the next page shows the existing and planned roads and bicycle lanes.

Traffic Inventory of Asmara
15
Figure 3.6 Planned and existing roads and bicycle lanes (Grip, Kasimir, 2002)
The main streets and roads in the city center are paved, but several of the smallest roads of the network are unpaved. Within the boundaries of Asmara, roughly fifty percent of the streets are paved.

Traffic Inventory of Asmara
16
The paved streets are generally in poor condition due to the lack of maintenance. There are often numerous potholes, heaps of gravel and sand in the carriageway as well. On some roads, there are no sidewalks. See figure 3.7 below.
Figure 3.7 Road in poor condition
There has been extensive work done on the sewer and drainage system all over the city during the past few years and this means that many streets have been dug up. As a result, there is an unpaved track on one side of these streets. This patch of road is about one meter wide and it has the characteristics of a narrow gravel road. See figure 3.8. There has been no proper maintenance of the abovementioned streets after the work on the sewer and drainage system has been completed.
Figure 3.8 Path of gravel after work done on the sewer and drainage system

Traffic Inventory of Asmara
17
Dirt roads and gravel roads are also in poor condition. See figure 3.9.
Figure 3.9 Typically unpaved road in Asmara
During the rainy season, the condition of all types of roads becomes even worse, resulting in severe traffic problems. Heavy rains during a couple of hours per day are the norm during the rainy season lasting from June to August. The water quickly accumulates in the carriageways and on the sidewalks. The runoff is quite slow on many of the streets and roads, resulting in huge masses of water hindering the flow of traffic. See figure 3.10 below.
Figure 3.10 Result of heavy rainfalls
Compared to streets and roads in Swedish towns, we have noted that the roads in Asmara are generally wider. The carriageways of many of the main roads in the city are between 14 – 16 meters. In Sweden, it is a goal that roads of the same character should generally be between 7 – 10 meters. The widths of the roads in Asmara encourage drivers of vehicles to go faster since they do not feel limited by space. However, their speed is partly limited by the poor condition of the carriageways.
Traffic Inventory of Asmara
18
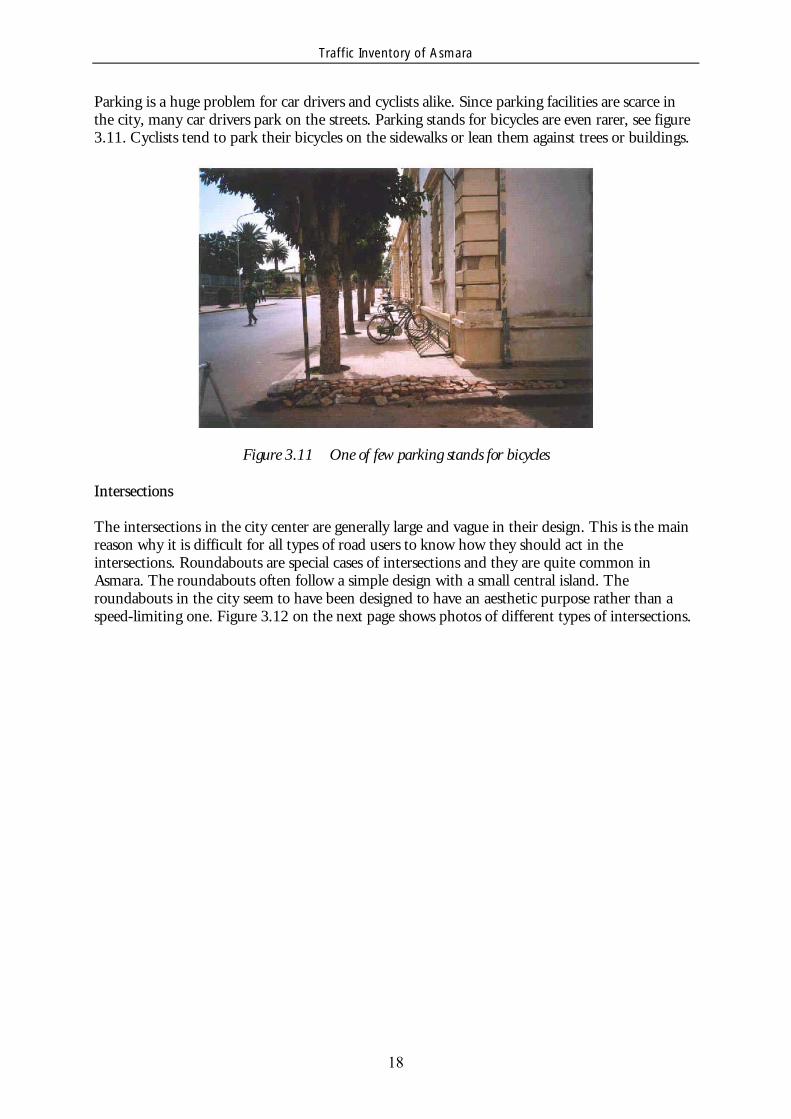
Parking is a huge problem for car drivers and cyclists alike. Since parking facilities are scarce in the city, many car drivers park on the streets. Parking stands for bicycles are even rarer, see figure 3.11. Cyclists tend to park their bicycles on the sidewalks or lean them against trees or buildings.
Figure 3.11 One of few parking stands for bicycles
Intersections
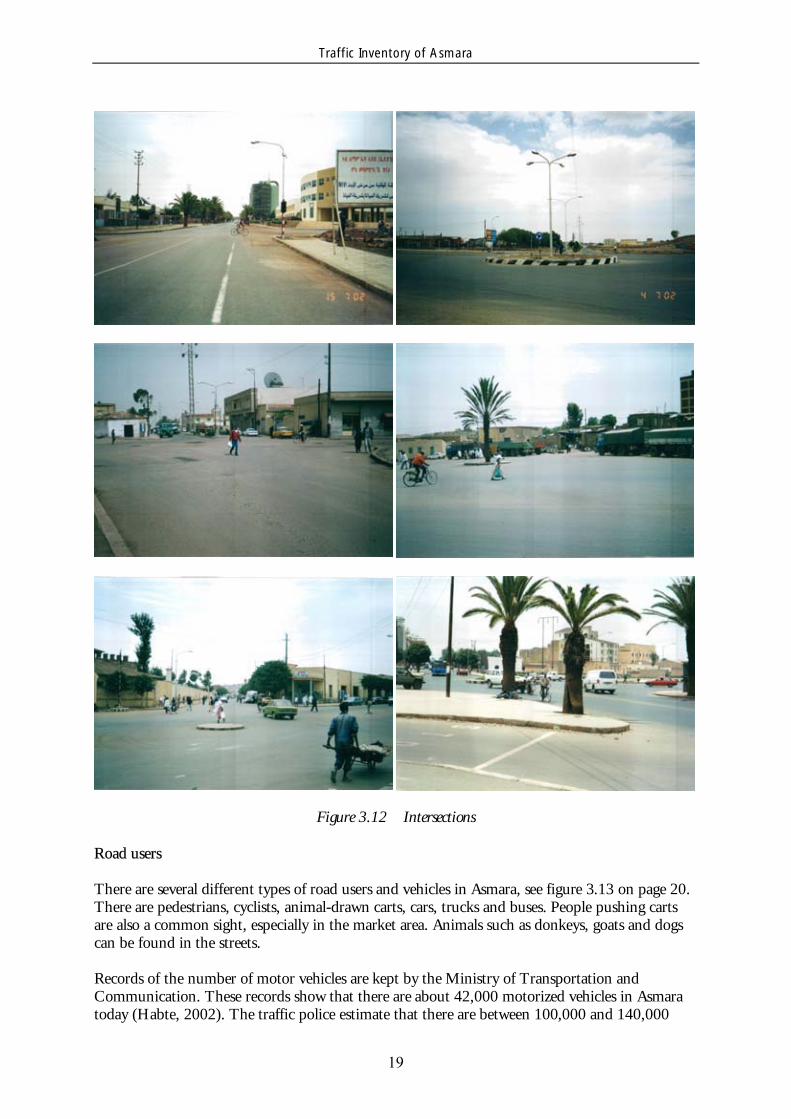
The intersections in the city center are generally large and vague in their design. This is the main reason why it is difficult for all types of road users to know how they should act in the intersections. Roundabouts are special cases of intersections and they are quite common in Asmara. The roundabouts often follow a simple design with a small central island. The roundabouts in the city seem to have been designed to have an aesthetic purpose rather than a speed-limiting one. Figure 3.12 on the next page shows photos of different types of intersections.
Traffic Inventory of Asmara
19
Figure 3.12 Intersections
Road users
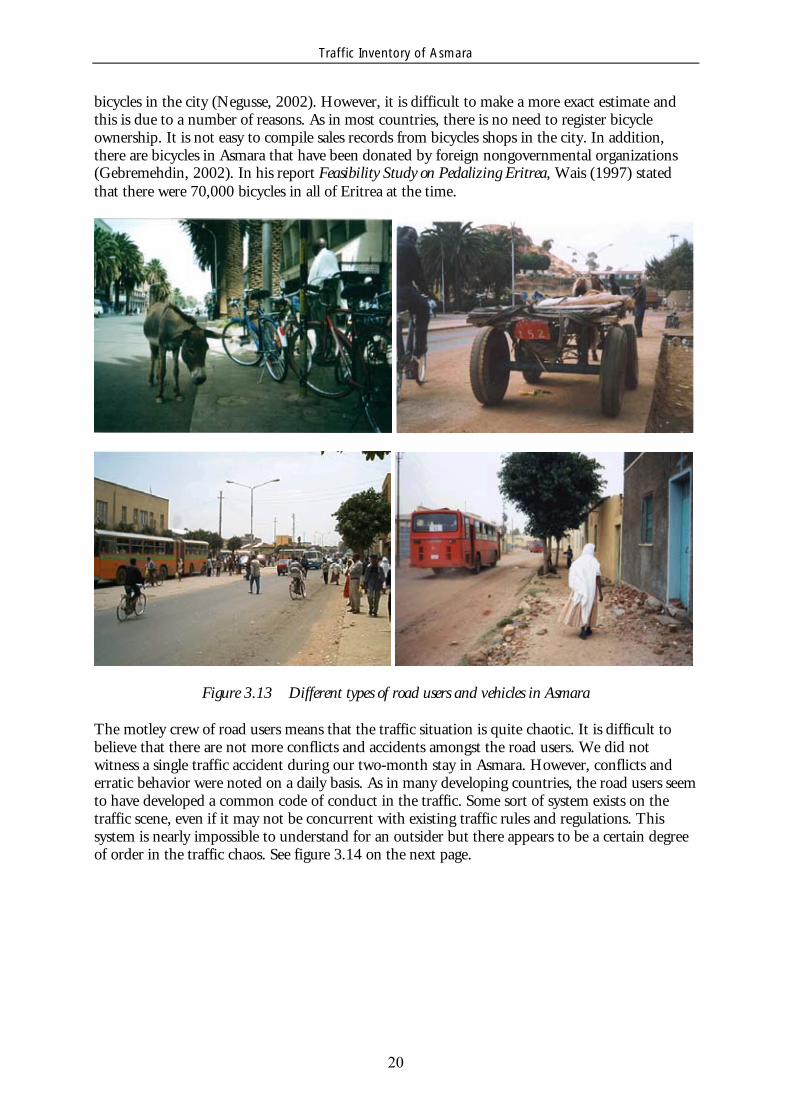
There are several different types of road users and vehicles in Asmara, see figure 3.13 on page 20. There are pedestrians, cyclists, animal-drawn carts, cars, trucks and buses. People pushing carts are also a common sight, especially in the market area. Animals such as donkeys, goats and dogs can be found in the streets.
Records of the number of motor vehicles are kept by the Ministry of Transportation and Communication. These records show that there are about 42,000 motorized vehicles in Asmara today (Habte, 2002). The traffic police estimate that there are between 100,000 and 140,000
Traffic Inventory of Asmara
20
bicycles in the city (Negusse, 2002). However, it is difficult to make a more exact estimate and this is due to a number of reasons. As in most countries, there is no need to register bicycle ownership. It is not easy to compile sales records from bicycles shops in the city. In addition, there are bicycles in Asmara that have been donated by foreign nongovernmental organizations (Gebremehdin, 2002). In his report Feasibility Study on Pedalizing Eritrea, Wais (1997) stated that there were 70,000 bicycles in all of Eritrea at the time.
Figure 3.13 Different types of road users and vehicles in Asmara
The motley crew of road users means that the traffic situation is quite chaotic. It is difficult to believe that there are not more conflicts and accidents amongst the road users. We did not witness a single traffic accident during our two-month stay in Asmara. However, conflicts and erratic behavior were noted on a daily basis. As in many developing countries, the road users seem to have developed a common code of conduct in the traffic. Some sort of system exists on the traffic scene, even if it may not be concurrent with existing traffic rules and regulations. This system is nearly impossible to understand for an outsider but there appears to be a certain degree of order in the traffic chaos. See figure 3.14 on the next page.

Traffic Inventory of Asmara
21
Figure 3.14 Traffic scenes on Menelik I Street
Public transportation
There are two bus companies in Asmara. The municipal bus company has 14 bus lines and uses full-size buses, see figure 3.15. The private bus company, Gemel, has roughly 20 lines and uses minibuses. About 60 % of all bus trips are made using municipal buses while the remaining 40 % are made using private minibuses. (Grip, Kasimir, 2002).
Figure 3.15 Bus from the municipal bus company
Buses and minibuses have specific stops where they can be boarded. The fare is 0.50 Nakfa (USD 0.10) for the municipal buses and 1.00 Nakfa for the minibuses. The buses are operated from 6.00 a.m. until 11.00 p.m. and run at 30-minute intervals.
Many people living in the villages take the bus into the city. People often make four journeys a day. Besides the trips from home to work and vice versa in the mornings and evenings, many people also go home for lunch, which lasts for at least two hours in Asmara. It should be noted that people very rarely go by bicycle to the bus stop.
Figure 3.16 on page 22 shows the area covered by the municipal bus routes.
Traffic Inventory of Asmara
22
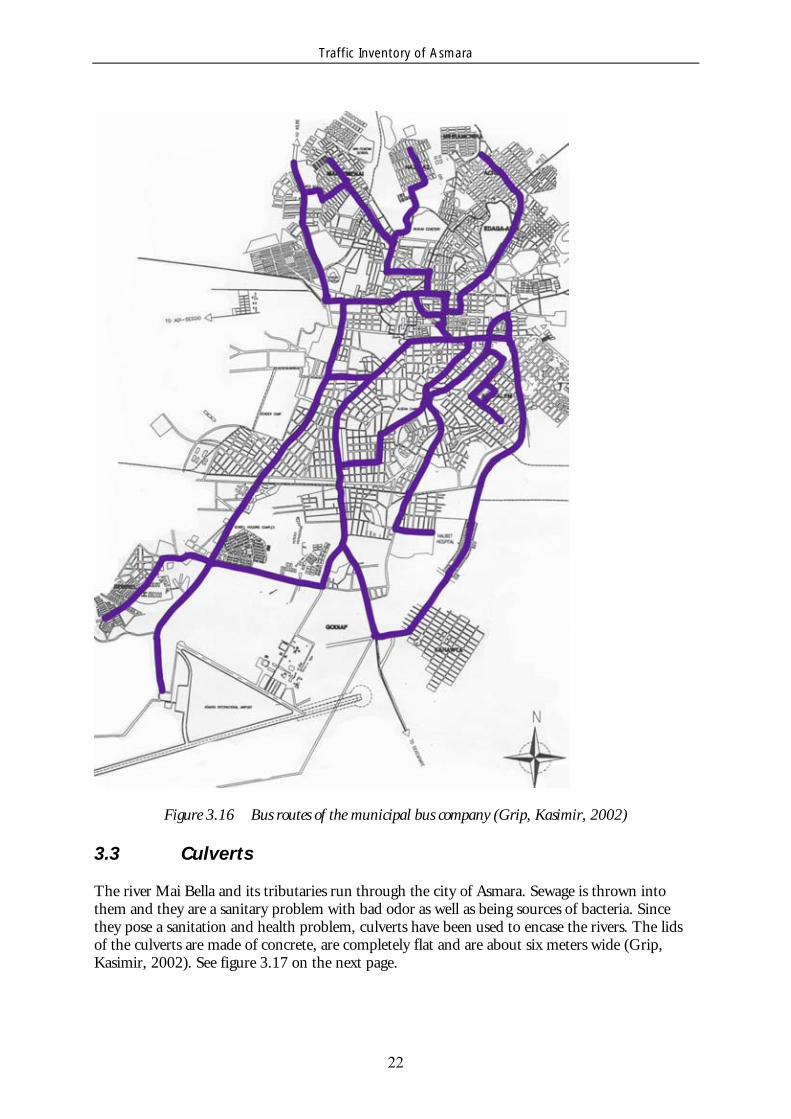
Figure 3.16 Bus routes of the municipal bus company (Grip, Kasimir, 2002)
3.3 Culverts
The river Mai Bella and its tributaries run through the city of Asmara. Sewage is thrown into them and they are a sanitary problem with bad odor as well as being sources of bacteria. Since they pose a sanitation and health problem, culverts have been used to encase the rivers. The lids of the culverts are made of concrete, are completely flat and are about six meters wide (Grip, Kasimir, 2002). See figure 3.17 on the next page.
Traffic Inventory of Asmara
23
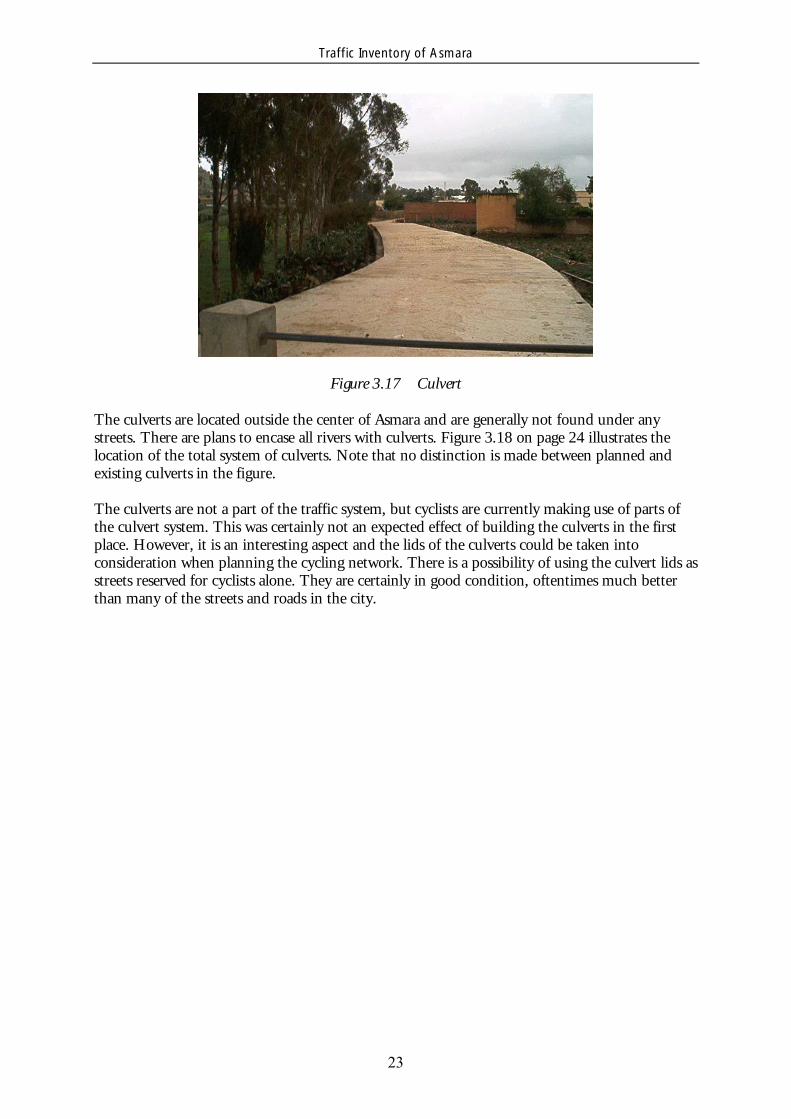
Figure 3.17 Culvert
The culverts are located outside the center of Asmara and are generally not found under any streets. There are plans to encase all rivers with culverts. Figure 3.18 on page 24 illustrates the location of the total system of culverts. Note that no distinction is made between planned and existing culverts in the figure.
The culverts are not a part of the traffic system, but cyclists are currently making use of parts of the culvert system. This was certainly not an expected effect of building the culverts in the first place. However, it is an interesting aspect and the lids of the culverts could be taken into consideration when planning the cycling network. There is a possibility of using the culvert lids as streets reserved for cyclists alone. They are certainly in good condition, oftentimes much better than many of the streets and roads in the city.

Traffic Inventory of Asmara
24
Figure 3.18 Complete system of culverts (Grip, Kasimir, 2002)
Role of Cycling in Asmara
25
4 Role of Cycling in Asmara
4.1 The Bicycle’s Position as a Means of Transportation
Eritrea is experiencing a boost in development in several areas, for instance within the fields of building construction and transportation infrastructure and on the traffic scene. Large development areas, both residential and industrial, are being planned and implemented. New roads are also being designed and built.
In countries with similar background and conditions, this surge in development often follows a similar pattern. For instance, with greater affluence often follows an increase in motorized vehicles. This in turn leads to greater problems such as increased pollution due to traffic.
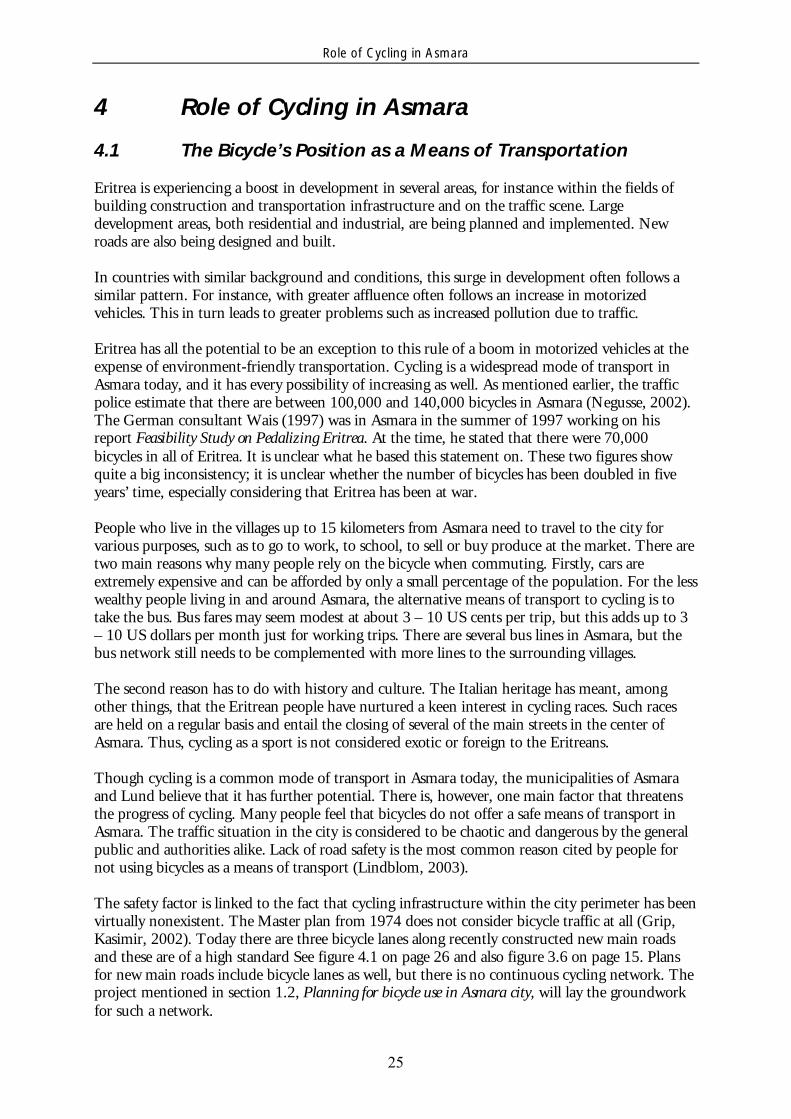
Eritrea has all the potential to be an exception to this rule of a boom in motorized vehicles at the expense of environment-friendly transportation. Cycling is a widespread mode of transport in Asmara today, and it has every possibility of increasing as well. As mentioned earlier, the traffic police estimate that there are between 100,000 and 140,000 bicycles in Asmara (Negusse, 2002). The German consultant Wais (1997) was in Asmara in the summer of 1997 working on his report Feasibility Study on Pedalizing Eritrea. At the time, he stated that there were 70,000 bicycles in all of Eritrea. It is unclear what he based this statement on. These two figures show quite a big inconsistency; it is unclear whether the number of bicycles has been doubled in five years’ time, especially considering that Eritrea has been at war.
People who live in the villages up to 15 kilometers from Asmara need to travel to the city for various purposes, such as to go to work, to school, to sell or buy produce at the market. There are two main reasons why many people rely on the bicycle when commuting. Firstly, cars are extremely expensive and can be afforded by only a small percentage of the population. For the less wealthy people living in and around Asmara, the alternative means of transport to cycling is to take the bus. Bus fares may seem modest at about 3 – 10 US cents per trip, but this adds up to 3 – 10 US dollars per month just for working trips. There are several bus lines in Asmara, but the bus network still needs to be complemented with more lines to the surrounding villages.
The second reason has to do with history and culture. The Italian heritage has meant, among other things, that the Eritrean people have nurtured a keen interest in cycling races. Such races are held on a regular basis and entail the closing of several of the main streets in the center of Asmara. Thus, cycling as a sport is not considered exotic or foreign to the Eritreans.
Though cycling is a common mode of transport in Asmara today, the municipalities of Asmara and Lund believe that it has further potential. There is, however, one main factor that threatens the progress of cycling. Many people feel that bicycles do not offer a safe means of transport in Asmara. The traffic situation in the city is considered to be chaotic and dangerous by the general public and authorities alike. Lack of road safety is the most common reason cited by people for not using bicycles as a means of transport (Lindblom, 2003).
The safety factor is linked to the fact that cycling infrastructure within the city perimeter has been virtually nonexistent. The Master plan from 1974 does not consider bicycle traffic at all (Grip, Kasimir, 2002). Today there are three bicycle lanes along recently constructed new main roads and these are of a high standard See figure 4.1 on page 26 and also figure 3.6 on page 15. Plans for new main roads include bicycle lanes as well, but there is no continuous cycling network. The project mentioned in section 1.2, Planning for bicycle use in Asmara city, will lay the groundwork for such a network.

Role of Cycling in Asmara
26
Figure 4.1 New bicycle lane on Road to Kehauta
It should be noted that cycling is prohibited on the two main streets of the city, Independence Avenue and Martyrs Avenue. This is also the case on several smaller streets leading up to these two main streets. The reason for this prohibition appears to be a belief that allowing cycling on these streets would have a negative effect on the traffic safety for all road users. See figure 4.2 below and figure 4.3 on the next page.
Figure 4.2 Martyrs Avenue and Independence Avenue are closed for cyclists

Role of Cycling in Asmara
27
Figure 4.3 Left: Independence Avenue. Right: Martyrs Avenue
We believe that the cost of bicycles is one of the key factors that may hinder the increase of cycling. A new bicycle costs at least USD 100. Even second-hand bicycles cost between 35 – 50 USD. The average monthly income in Eritrea is 20 USD. Given the price of a bicycle, large parts of the population cannot afford to buy one. This is a complex subject related to the economic situation of the entire nation. City planners and traffic engineers can do little about this factor. According to Negusse (2002), opening up the possibility of allowing more bicycles to be donated by nongovernmental organizations locally and abroad may help to remedy this problem.
Finally, there is the question of the attitude towards cycling. A common opinion seems to be that using bicycles on a daily basis for transport is natural only for young people under the age of twenty. Women who cycle are not looked upon favorably. Moreover, other road users do not believe that cyclists have a place in the traffic environment. Different authorities and other road users believe that cyclists lack discipline. There is still not a wide acceptance of bicycles in Asmara. The general belief that cycling is a promising means of transport for everyone regardless of class, age or gender has yet to be realized.
4.2 View of Cyclists
During the course of his Minor Field Study, An Inquiry into the Public Transportation System in Asmara, Lindblom (2003) conducted a survey asking cyclists and the general public what they think about cycling in Asmara. Many of the people who filled in the questionnaire expressed that they do not feel safe when cycling in the city and one of the reasons for this may be that the traffic situation on the whole is quite chaotic.
We have come to the conclusion that cyclists are not considered to have a given place on the traffic scene. They do not have their own allotted space in the streets. The cyclists are not allowed to bicycle along the main streets in the city center, and in some cases, they are not even allowed to cross these streets.
The negative aspects are in part balanced by the feeling of freedom and sense of mobility shared by many of the cyclists.
The results of the survey show that cyclists do not find the price of bicycles to be a problem (Lindblom, 2003). This is a bit surprising to us. It is true that purchasing a bicycle is a onetime expense and many people have bought second-hand bicycles. Perhaps many people have received
Role of Cycling in Asmara
28
their bicycles from relatives living abroad or from donations from nongovernmental organizations (Gebremehdin, 2003).
4.3 Attitudes Concerning Cyclists
The traffic police, staff of the Department of Infrastructural Services and staff of other authorities all believe that the cyclists generally lack discipline. This is the common opinion among other road users as well. It has been established that cyclists are not considered to be full-fledged road users with equal rights. They are considered to be in the way by most of the other road users; even animal-drawn carts are viewed with more tolerance. It should be noted that cyclists are generally considered in the same manner in Lund and Malmö in Sweden. Indeed, cyclists are generally not looked upon favorably by other road users.
The aforesaid view forms the basis of all discussions that deal with cyclists in Asmara. When questioned about what would happen if the number of cyclists would increase, most persons working for the municipality as well as the traffic police say that there would be more accidents and that the streets and roads would be overcrowded. Many of the persons who work with traffic in the city feel that the streets and roads of Asmara are too narrow. There is a common belief that the cyclists’ lack of discipline is the main reason why bicycle accidents occur. The discipline of other road users is hardly ever brought up.
Despite the beliefs mentioned above, persons working with traffic believe that cycling has great potential. They welcome the positive effects an increase in cycling would bring for the environment and health. The members of staff of both the municipality and the Traffic Police Department readily express the need to redesign the streets and roads to make them more bicycle-friendly.
Bicycle Accidents
29
5 Bicycle Accidents
5.1 The Importance of Traffic Accident Data
When making studies of the traffic situation in a particular area, it is vital to have access to statistical data about the traffic accidents that occur. Detailed information about the traffic accidents is a valuable tool that can be used when suggesting ways to improve the safety situation. Statistical data of traffic accidents also makes it possible to see trends and to make analyses as to the effects of measures taken. If this is to be done, data must be collected annually and compared over a long time period such as 5 or 10 years.
Perhaps the most important aspect of keeping traffic accident data is to use it to set up goals regarding traffic safety. The goals can be defined annually in terms of a certain reduction in the number of traffic accidents or injuries. The goals should be assessed and revised on a regular basis.
5.2 Reporting Traffic Accidents
In Eritrea, traffic accidents are usually reported to the traffic police. It is not certain if hospitals keep any data about traffic accidents, let alone bicycle accidents. In some countries, however, hospitals also keep records on traffic accidents. According to accident data for the city of Lund in Sweden, the majority of the injured road users reported to the police are car drivers. However, almost 2/3 of the injured road users reported to the hospitals are cyclists and pedestrians (Lunds kommun, 2002). This discrepancy shows that the accidents reported to the police primarily target the car drivers while the accidents reported to the hospital primarily target the vulnerable road users.
When it comes to the severity of accidents, a majority of the reported injuries to the hospitals are light injuries. Traffic accidents resulting in light injuries are not as often reported to the police. The location of traffic accidents is not as exact when reported to the hospitals as when reported to the police. The reason for this is that a traffic accident victim admitted to a hospital may not be able to give the precise location of the accident. However, a more detailed description of the accident’s location is likely to be recorded if the police are summoned.
Ideally, the traffic accidents reported to the police should be compiled with the traffic accidents reported to the hospitals. The two sources of data should thus be combined to get a better picture of the accident situation. According to Swedish studies, only 17 % of the total number of injured road users are reported to both the police and the hospitals (Lunds kommun, 2002).
5.3 Availability of Accident Data
The Traffic Police Department in Asmara has provided the data on bicycle-related accidents.Since we do not have any other source of traffic accident data, we can presume that the gray zone of traffic accidents in Asmara must be quite large.
Data exists that shows different aspects of bicycle-related accidents. Section 5.5 presents the supplied bicycle-related accident data. The accident data requested was not always readily available and had to be compiled by the traffic police. This proved to be a very time-consuming task, which meant that work with the project had to proceed without all the facts available.

Bicycle Accidents
30
It should be noted that the accident data supplied only covers the last 1.5 years. It is therefore impossible to make a comprehensive analysis. Statistical data pertaining to the location of bicycle accidents in Asmara was not available.
5.4 Reliability of Accident Data
In any scientific project, the reliability of the statistical data must always be considered. The query of reliability is raised as soon as the accident is reported. There are a number of questions that must be considered: What are the routines for expediting a reported accident? Who has reported the accident? How is the account of the accident recorded? Is a post- accident investigation carried out?
Unfortunately, most of these questions have not been answered during the course of this project. The language barrier has proven too great and only bits and pieces of the traffic police’s routines have been conveyed. Accidents are reported either by traffic police officers, witnesses or by one or more of the persons involved in the accident.
The following are some of the data recorded for reported traffic accidents:
The cause of the accident The type of accident The severity of the injuries The age of the persons involved in the accident
The cause of accidents is a treacherous area of study. It is extremely difficult to make a correct analysis as to the causes of an accident. This is a complex and often a highly subjective task. It is very difficult to be certain of the course of events leading up to a traffic accident. Witnesses and persons involved in the accident are only human and cannot be expected to give a perfect account of what has taken place. There are bound to be different versions of the accident in question.
Consider the case of an accident involving only one cyclist who falls off his bicycle. If the accident occurred on a bicycle lane that lacks lighting, one may assume that this is the reason for the accident. If further investigation shows that a cow crossed the bicycle lane in front of the cyclist just seconds before he fell off, it may be thought that this must be the reason he fell. If it is then found that the cyclist has been drinking alcohol, the case is no longer straightforward. Accidents involving more than one bicycle are even more complicated.
The issue of reliability can be applied to the severity of the injuries endured. Again there are several questions that should be answered. How is the severity of injuries evaluated? What are the definitions of light and severe injuries? Do deaths refer only to the traffic accident victims who die at the scene of the accident, or are those who die at a certain time after the accident also included in the data? Is there some sort of follow-up on the medical condition of the victims?
Age may seem to be a reliable factor. However, even data pertaining to the age of the persons involved in an accident can be questioned. In Eritrea, it is not unusual that people do not know their true age. Also, some people do not wish to disclose their age. If the persons involved in the accident leave the scene of the accident, it is probably impossible to find out their age.
Finally, we must exercise caution when analyzing the accident data since it only covers the last 1.5 years. It would have been desirable to have statistical data for a longer period of time so that a more comprehensive analysis could be made.
Bicycle Accidents
31
5.5 Statistical Data of Bicycle Accidents
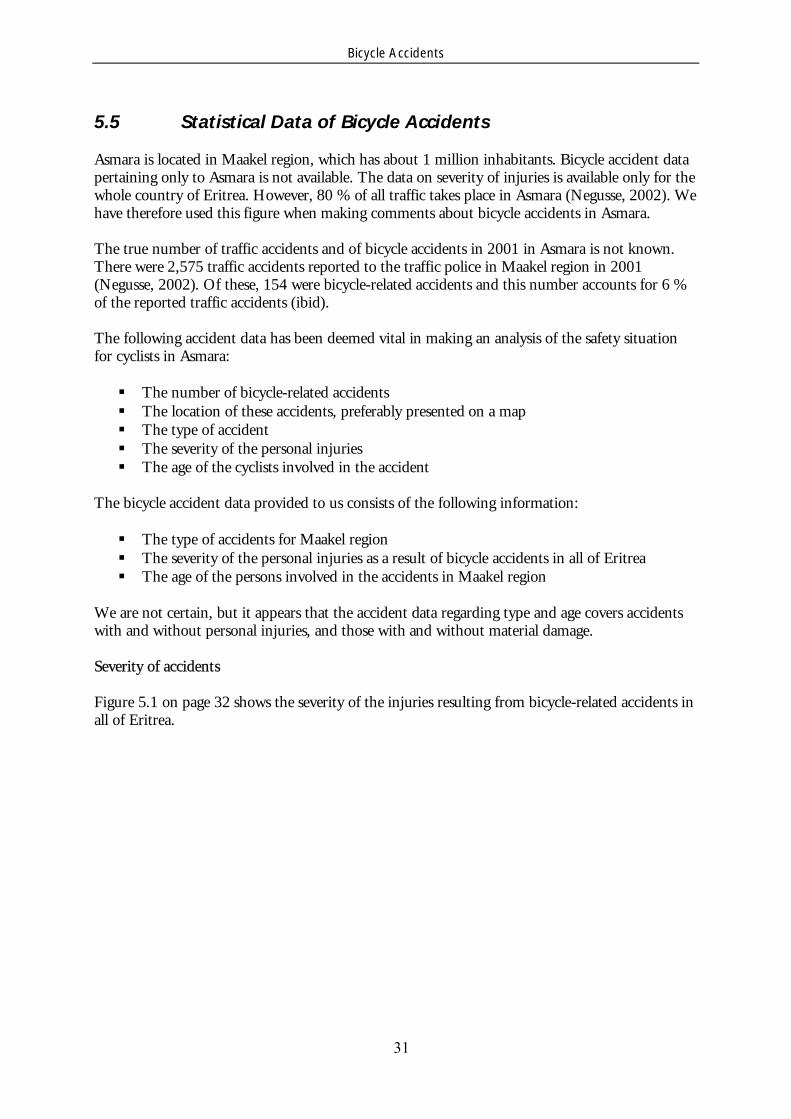
Asmara is located in Maakel region, which has about 1 million inhabitants. Bicycle accident data pertaining only to Asmara is not available. The data on severity of injuries is available only for the whole country of Eritrea. However, 80 % of all traffic takes place in Asmara (Negusse, 2002). We have therefore used this figure when making comments about bicycle accidents in Asmara.
The true number of traffic accidents and of bicycle accidents in 2001 in Asmara is not known. There were 2,575 traffic accidents reported to the traffic police in Maakel region in 2001 (Negusse, 2002). Of these, 154 were bicycle-related accidents and this number accounts for 6 % of the reported traffic accidents (ibid).
The following accident data has been deemed vital in making an analysis of the safety situation for cyclists in Asmara:
The number of bicycle-related accidents The location of these accidents, preferably presented on a map The type of accident The severity of the personal injuries The age of the cyclists involved in the accident
The bicycle accident data provided to us consists of the following information:
The type of accidents for Maakel region The severity of the personal injuries as a result of bicycle accidents in all of Eritrea The age of the persons involved in the accidents in Maakel region
We are not certain, but it appears that the accident data regarding type and age covers accidents with and without personal injuries, and those with and without material damage.
Severity of accidents
Figure 5.1 on page 32 shows the severity of the injuries resulting from bicycle-related accidents in all of Eritrea.

Bicycle Accidents
32
Severity of Accidents
6
27
65
4933
00
10203040506070
Fatal injuries Severeinjuries
Light injuries
Severity
Nu
mb
er
of
Inju
rie
s
2001 (6 month-period)2002 (6 month-period)
Figure 5.1 Severity of accidents for all of Eritrea
The data consisted of the total number of injuries in the three categories. There was no information as to how many injuries there were per month. Since the data covered 1.5 years, we decided to present it in 6-month-periods so that comparisons between year 2001 and 2002 could be made more easily. This meant that the numbers for 2001 were simply divided by two. During the year 2001 there were 12 deaths and 152 injuries in the whole of Eritrea caused by bicycle accidents, which corresponds to 6 deaths and 76 injuries for a 6-month-period. During the first six months of the year 2002 there were 98 injuries but no deaths resulting from bicycle accidents.
Of course, it is impossible to make any solid conclusions about these numbers. We can only state the simple facts: for the given 1.5 years, the number of deaths due to bicycle accidents has decreased from six to zero for a 6-month-period in the whole of Eritrea while the number of injuries has increased.
There is another way of presenting the data. During the period 2001-01-01 – 2002-06-30, there were 12 deaths reported to the traffic police in the whole nation. Of the non-fatal injuries, 87 were severe while 163 were light. Since 80% of all bicycle traffic occurs in Asmara, the following can be calculated for Asmara: 9.6 deaths, 69.6 severe injuries and 130.4 light injuries
Again, there is a difficulty in making a sound analysis. The time period covered by the data is too short and there are too many other discrepancies that stand in the way of a comprehensive scientific analysis.
In order to get a better idea of the safety situation for cyclists in Asmara, some comparisons have been made with similar data from Lund and Malmö in Sweden. Cycling is widespread in both the two Swedish cities and Lund is considered a “bicycle-city”. However, since the data from the two countries is not defined in the same manner, it is again very difficult to make a correct analysis.
Lund has approximately 100,000 inhabitants, Malmö 250,000 and Asmara 400,000. The injuries reported to the police resulting from bicycle accidents per 100,000 habitants are compared for the three cities during the time period 2001-01-01 – 2002-06-30. The result is shown in table 5.1 below.
Bicycle Accidents
33
Table 5.1 Number of injuries reported to the police per 100,000 inhabitants (2001-01-01 – 2002-06-30)
City Fatal injuries Severe injuries Light injuries Asmara 2.4 17.4 32.6 Lund 0 27 58 Malmö 1.2 16.8 118
The number of fatal injuries is higher in Asmara compared with Lund and Malmö but there are less non-fatal injuries resulting from bicycle accidents in Asmara than in both Swedish cities. The number of light injuries is much higher in Lund and Malmö than in Asmara. The reason for this may be that not all accidents with such injuries are reported to the traffic police. Another reason for the lower number of reported injuries in Asmara may be that people probably report bicycle accidents to a greater extent in Sweden. We do not know anything about the gray zone of accidents or the scope of the injuries that are never reported in Asmara.
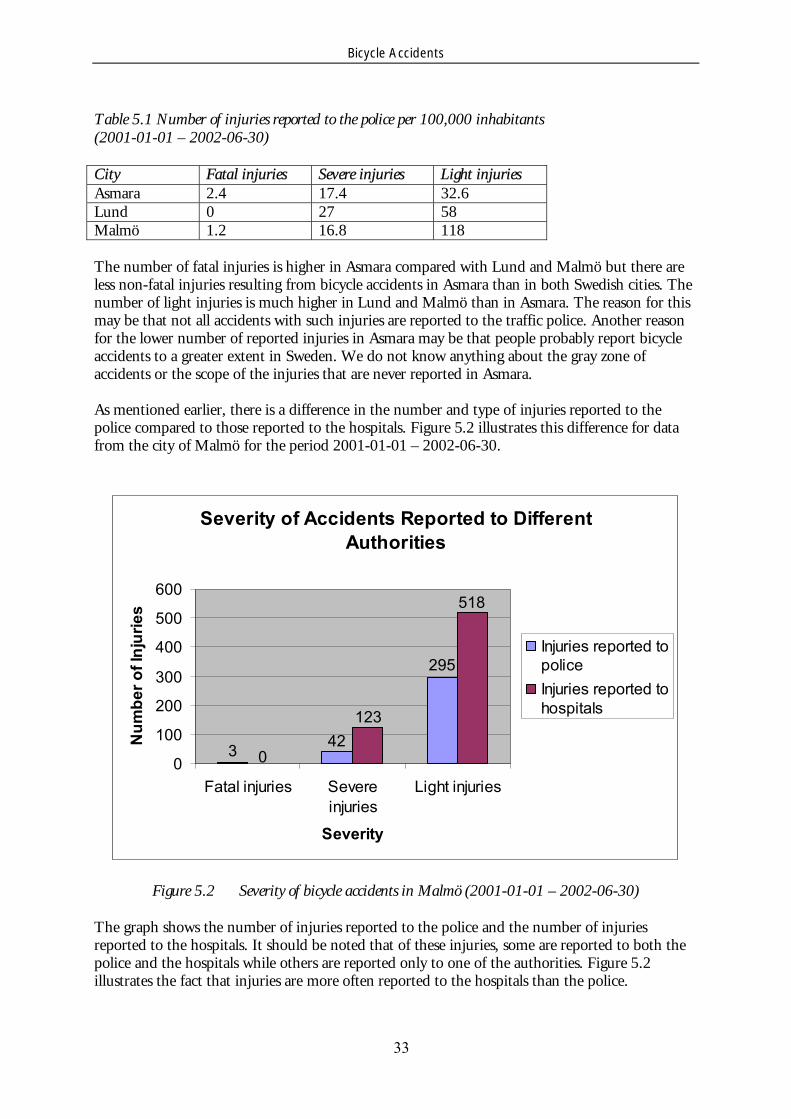
As mentioned earlier, there is a difference in the number and type of injuries reported to the police compared to those reported to the hospitals. Figure 5.2 illustrates this difference for data from the city of Malmö for the period 2001-01-01 – 2002-06-30.
Severity of Accidents Reported to Different
Authorities
295
3 420
518
123
0
100
200
300
400
500
600
Fatal injuries Severeinjuries
Light injuries
Severity
Nu
mb
er
of
Inju
rie
s
Injuries reported topoliceInjuries reported tohospitals
Figure 5.2 Severity of bicycle accidents in Malmö (2001-01-01 – 2002-06-30)
The graph shows the number of injuries reported to the police and the number of injuries reported to the hospitals. It should be noted that of these injuries, some are reported to both the police and the hospitals while others are reported only to one of the authorities. Figure 5.2 illustrates the fact that injuries are more often reported to the hospitals than the police.
Bicycle Accidents
34
Type of accidents
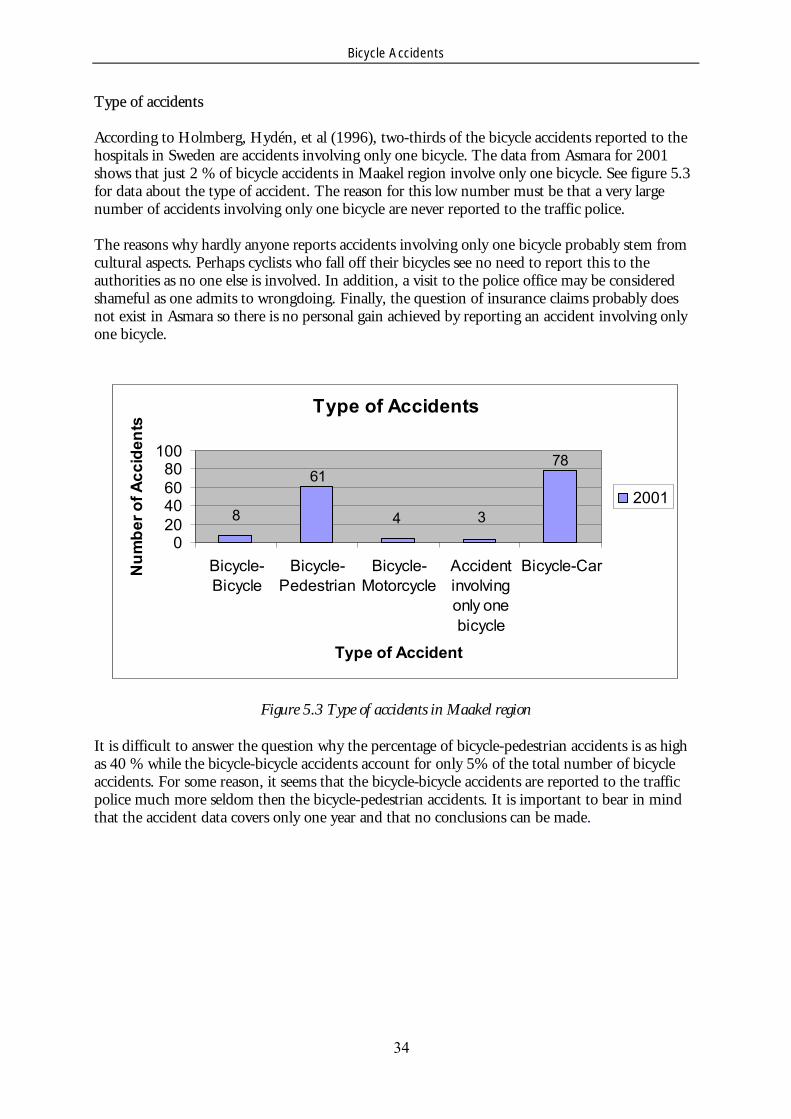
According to Holmberg, Hydén, et al (1996), two-thirds of the bicycle accidents reported to the hospitals in Sweden are accidents involving only one bicycle. The data from Asmara for 2001 shows that just 2 % of bicycle accidents in Maakel region involve only one bicycle. See figure 5.3 for data about the type of accident. The reason for this low number must be that a very large number of accidents involving only one bicycle are never reported to the traffic police.
The reasons why hardly anyone reports accidents involving only one bicycle probably stem from cultural aspects. Perhaps cyclists who fall off their bicycles see no need to report this to the authorities as no one else is involved. In addition, a visit to the police office may be considered shameful as one admits to wrongdoing. Finally, the question of insurance claims probably does not exist in Asmara so there is no personal gain achieved by reporting an accident involving only one bicycle.
Type of Accidents
48
61
3
78
020406080
100
Bicycle-Bicycle
Bicycle-Pedestrian
Bicycle-Motorcycle
Accidentinvolvingonly onebicycle
Bicycle-Car
Type of Accident
Nu
mb
er
of
Ac
cid
en
ts
2001
Figure 5.3 Type of accidents in Maakel region
It is difficult to answer the question why the percentage of bicycle-pedestrian accidents is as high as 40 % while the bicycle-bicycle accidents account for only 5% of the total number of bicycle accidents. For some reason, it seems that the bicycle-bicycle accidents are reported to the traffic police much more seldom then the bicycle-pedestrian accidents. It is important to bear in mind that the accident data covers only one year and that no conclusions can be made.

Bicycle Accidents
35
Accidents by age
The data of bicycle accidents according to age group is compiled in figure 5.4 below.
Accidents by Age
2417
71
42
01020304050607080
-18 19-30 31-50 51-Age
Nu
mb
er
of
Ac
cid
en
ts
2001
Figure 5.4 Accidents by age in Maakel region
In Sweden, the younger and the elderly cyclists are most at risk (Holmberg, Hydén et al, 1996). The accident data for cyclists in Maakel region for the year 2001 shows that the younger cyclists are the most vulnerable group among cyclists. As many as 46 % of the bicycle accidents reported to the traffic police involved people younger than 18 years old. This high value is expected. However, the group with people aged 51 and above account for only 16 % of the bicycle accidents reported to the traffic police in Asmara. Given that the elderly are more at risk in Sweden, we would have expected the same to be true in Asmara.
One reason why the number of elderly cyclists involved in accidents is not higher may again be due to the fact that the data covers only accidents reported to the traffic police, not accidents reported to the hospitals. Most of the accidents involving only one bicycle in Sweden are not found in the accident data recorded by the traffic police (Olsson, Sandberg, Wedin, 2002). In Sweden, a large number of accidents with elderly people are those involving only one cyclist, in other words, precisely the type of accident found mostly in data from the hospitals.
Maybe the elderly are less vulnerable in Asmara for a simpler reason. We did see many elderly cyclists in Asmara but it is not as common that elderly people use bicycles for transportation in Eritrea as in Sweden. Thus, they are less exposed per person and this may very well explain why this age group accounts for only 16 % of the accidents.
5.6 Location of Accidents
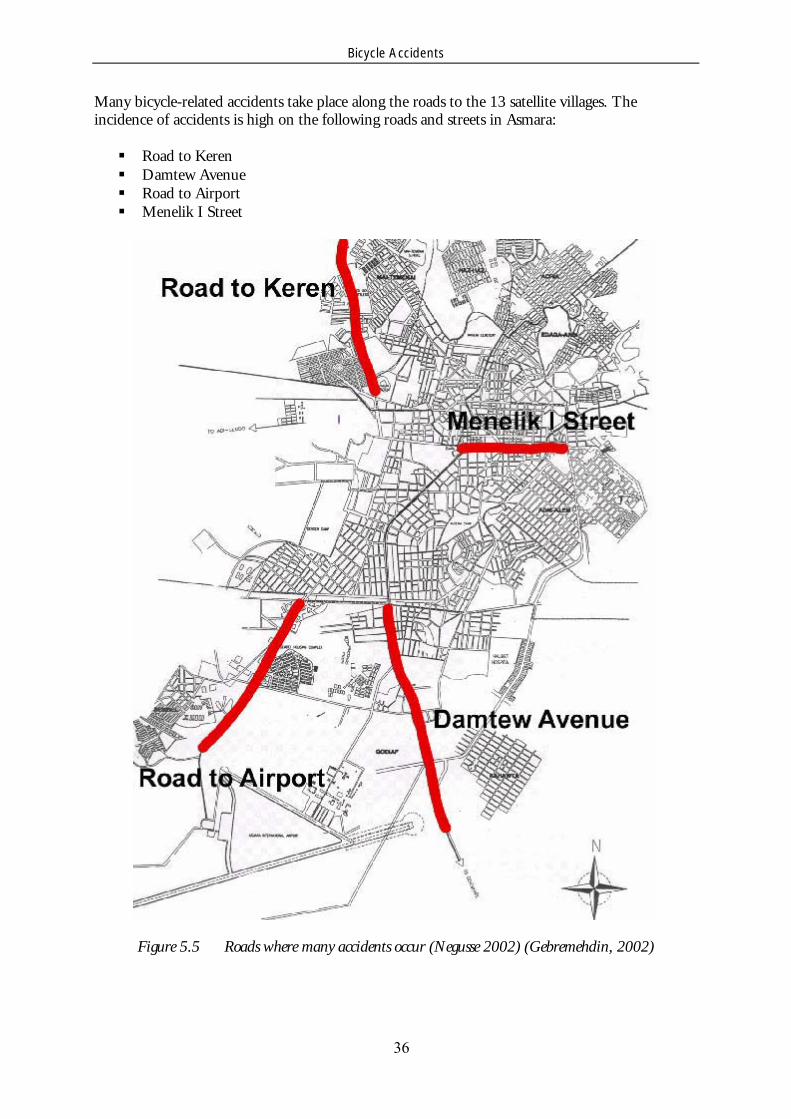
Although we did not receive any statistical data showing the location of bicycle accidents, Lt. Col. Mahari Negusse (2002) and Dr. Naigzy Gebremehdin (2002) told us some streets and roads where many bicycle accidents occur, see figure 5.5 on page 36.
Bicycle Accidents
36
Many bicycle-related accidents take place along the roads to the 13 satellite villages. The incidence of accidents is high on the following roads and streets in Asmara:
Road to Keren Damtew Avenue Road to Airport Menelik I Street
Figure 5.5 Roads where many accidents occur (Negusse 2002) (Gebremehdin, 2002)
Bicycle Accidents
37
According to Scientific Expert Group on the Safety of Vulnerable Road Users (1998), there are more fatalities in urban areas than in rural areas. However, in rural areas, the percentage of fatalities is larger than the percentage of slight injuries. This means that severity of accidents is higher in rural areas, probably because of the higher vehicle speed in such areas.
Three of four roads marked out in figure 5.5 on page 36 are situated in the more rural areas. The traffic flow and the speeds of the vehicles are high on these roads; see tables 6.2, 8.1 and 8.2 on pages 47, 68 and 70, respectively. These factors in combination with the lack of public lighting, reflectors and lights on bicycles lead to a higher number of accidents with more severe injuries. As discussed earlier, the accidents resulting in severe injuries are the ones most often reported to the traffic police. That can be one reason why Lt. Col. Mahari Negusse of the Traffic Police Department mentions these roads and streets when discussing bicycle-related accidents.
Menelik I Street is not situated in the rural area but the traffic flow is high, see table 6.2, and there are many different kinds of road users on this street. The speed is not high; see table 8.1, but the traffic situation here is probably the most chaotic of all sections we studied. This must be the reason why Menelik I is mentioned as a street where many bicycle accidents take place.

Inventory of Traffic Flows
39
6 Inventory of Traffic Flows
6.1 Background to Traffic Counts
Formal traffic counts have never been made by the Municipality of Asmara. Some simple traffic counts of cyclists were made in 1997 as part of the fieldwork for the project Feasibility Study on Pedalizing Eritrea (Wais, 1997). The results of two counts were presented in the report and are taken up in section 6.3. It should be noted that the appendix of this report that is believed to contain more data, was missing from the copy available to us during the course of our project.
We decided to make some type of traffic counts. A choice had to be made regarding which type of vehicles that should be included in the traffic counts. After the traffic inventory was completed, a preliminary assessment of the traffic situation was made. Based on what was believed to be a reasonable and plausible work load, it was decided that the following types of vehicles would be counted:
Cars Trucks, buses and other larger motorized vehicles (heavy traffic) Bicycles Animal-drawn carts
Motorcycles and mopeds are included in the class cars, as are pick-up trucks and smaller minibuses. It was decided to note the amount of heavy traffic separately as it appeared to constitute a large percentage of the motorized traffic. In this class, larger minibuses of the Gemel type from the public bus company were included. The reason why pedestrians were not included in the traffic counts is because it would not have been possible to count them as they are so great in number and move about quite randomly.
The different sites for the traffic counts needed to be chosen. Data from the inventory made by staff of the Municipality of Lund in April 2002 were used as a starting-point for this work. The inventory included a map showing the major cycling flows. This vital information had been conveyed by Kidhanemariam Abraha, a member of staff of the Department of Infrastructural Services of the Municipality of Asmara. Additional sections were chosen on the basis of the traffic inventory made for this report as well as discussions with others working at the Department of Infrastructural Services.
Different types of sites were chosen so that a more detailed picture of the traffic flows could be made. Sections such as streets in the city center as well as roads in the outskirts of the city were picked. Among these are the two largest avenues in the city center, the largest street by the marketplace and several roads used by commuters from different satellite villages.
The work was divided into two phases: making a first round of counts during many time intervals on a few sections and then making a second round of counts on more sections but only during the peak times. These two rounds of traffic counts are described in detail in sections 6.2 and 6.3, respectively.
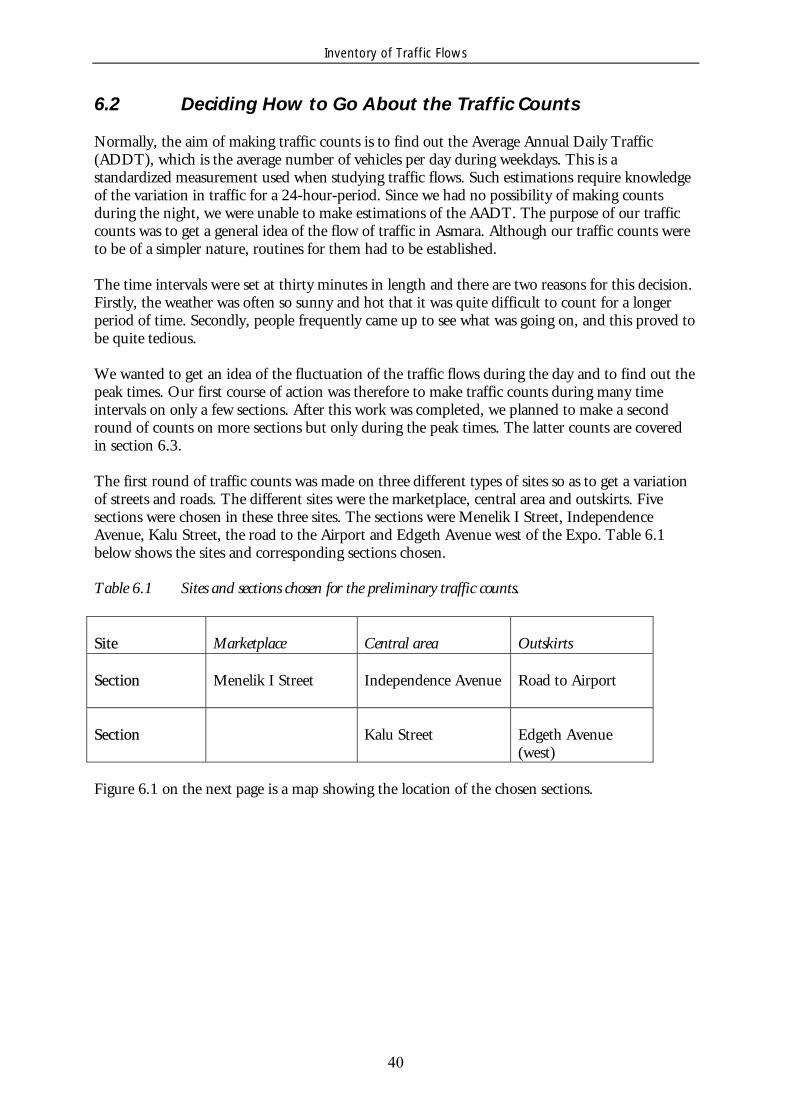
Inventory of Traffic Flows
40
6.2 Deciding How to Go About the Traffic Counts
Normally, the aim of making traffic counts is to find out the Average Annual Daily Traffic (ADDT), which is the average number of vehicles per day during weekdays. This is a standardized measurement used when studying traffic flows. Such estimations require knowledge of the variation in traffic for a 24-hour-period. Since we had no possibility of making counts during the night, we were unable to make estimations of the AADT. The purpose of our traffic counts was to get a general idea of the flow of traffic in Asmara. Although our traffic counts were to be of a simpler nature, routines for them had to be established.
The time intervals were set at thirty minutes in length and there are two reasons for this decision. Firstly, the weather was often so sunny and hot that it was quite difficult to count for a longer period of time. Secondly, people frequently came up to see what was going on, and this proved to be quite tedious.
We wanted to get an idea of the fluctuation of the traffic flows during the day and to find out the peak times. Our first course of action was therefore to make traffic counts during many time intervals on only a few sections. After this work was completed, we planned to make a second round of counts on more sections but only during the peak times. The latter counts are covered in section 6.3.
The first round of traffic counts was made on three different types of sites so as to get a variation of streets and roads. The different sites were the marketplace, central area and outskirts. Five sections were chosen in these three sites. The sections were Menelik I Street, Independence Avenue, Kalu Street, the road to the Airport and Edgeth Avenue west of the Expo. Table 6.1 below shows the sites and corresponding sections chosen.
Table 6.1 Sites and sections chosen for the preliminary traffic counts.
Site Marketplace Central area Outskirts
Section Menelik I Street Independence Avenue Road to Airport
Section Kalu Street Edgeth Avenue (west)
Figure 6.1 on the next page is a map showing the location of the chosen sections.
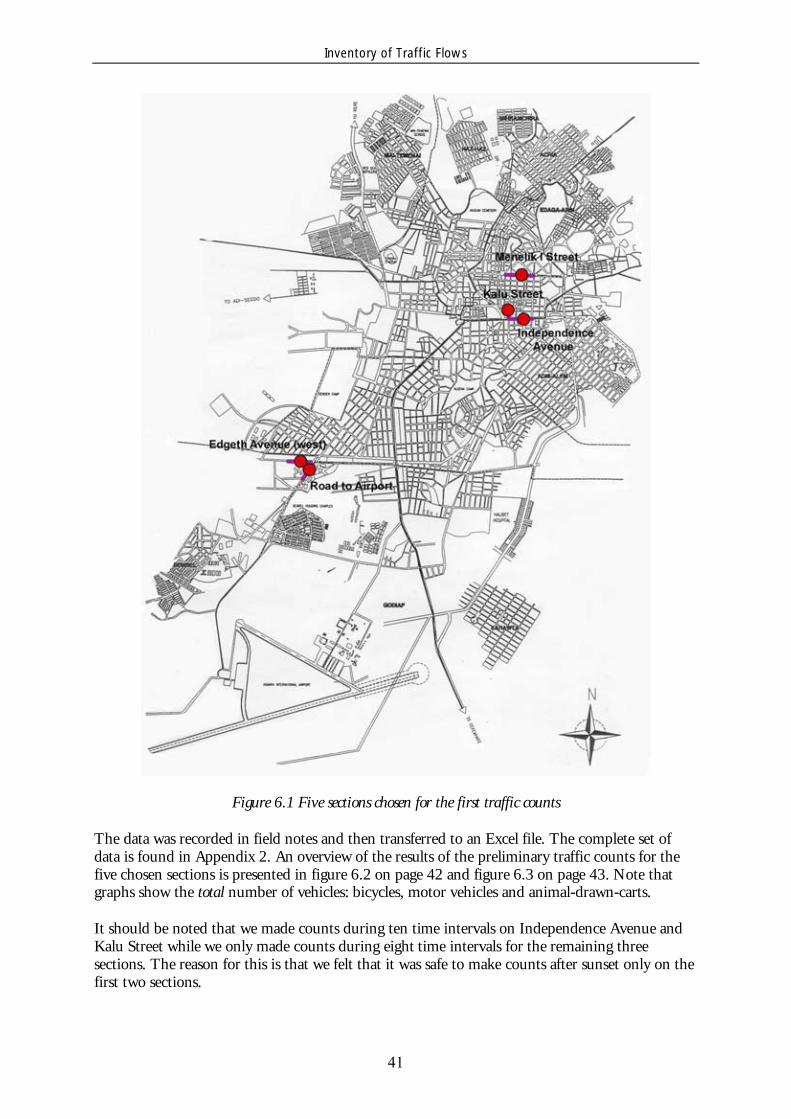
Inventory of Traffic Flows
41
Figure 6.1 Five sections chosen for the first traffic counts
The data was recorded in field notes and then transferred to an Excel file. The complete set of data is found in Appendix 2. An overview of the results of the preliminary traffic counts for the five chosen sections is presented in figure 6.2 on page 42 and figure 6.3 on page 43. Note that graphs show the total number of vehicles: bicycles, motor vehicles and animal-drawn-carts.
It should be noted that we made counts during ten time intervals on Independence Avenue and Kalu Street while we only made counts during eight time intervals for the remaining three sections. The reason for this is that we felt that it was safe to make counts after sunset only on the first two sections.

Inventory of Traffic Flows
42
257342
469 504
271
517 503 520427
252
0
100
200
300
400
500
600
To
tal
nu
mb
er
of
veh
icle
s
1 2 3 4 5 6 7 8 9 10
Time
Independence Avenue
146
232 237290
146
235 249 253176
400
50
100
150
200
250
300
Tota
l n
um
be
r o
f
veh
icle
s
1 2 3 4 5 6 7 8 9 10
Time
Kalu Street
Legend
1 07:00 - 07:302 07:30 - 08:003 09:30 - 10:004 12:00 - 12:305 13:30 - 14:006 15:30 - 16:007 17:15 - 17:458 18:00 - 18:309 19:30 - 20:0010 22:00 - 22:30
Figure 6.2 Results from the traffic counts on Independence Avenue and Kalu Street

Inventory of Traffic Flows
43
670812
10001090809 779
938722
0
200
400
600
800
1000
1200
To
tal
nu
mb
er
of
ve
hic
les
1 2 3 4 5 6 7 8
Time
Menelik I Street
489683 596
840
521 535641 705
0100200300400500600700800900
To
tal
nu
mb
er
of
ve
hic
les
1 2 3 4 5 6 7 8
Time
Road to Airport
170 197150
204150 172
217155
0
50
100
150
200
250
To
tal
nu
mb
er
of
ve
hic
les
1 2 3 4 5 6 7 8
Time
Edgeth Avenue (west of Expo)
Legend
1 07:00 - 07:302 07:30 - 08:003 09:30 - 10:004 12:00 - 12:305 13:30 - 14:006 15:30 - 16:007 17:15 - 17:458 18:00 - 18:30
Figure 6.3 Results from the traffic counts on Menelik I Street, Road to Airport and Edgeth Avenue (west of Expo)
Inventory of Traffic Flows
44
It is striking to see that the traffic is quite evenly distributed during the day and therefore it is not so easy to ascertain peak times. This surprised us at first. In Sweden, the peak times are more clearly defined. The differences between the two countries can be explained by differences in the working hours. In Sweden, working hours are more rigorously set. A working day generally starts at 8 a.m. and ends at 5 p.m. In Asmara, some people start work at 7 a.m. while others start at 8 a.m. People working at the marketplaces may start even earlier than 7 in the morning and those working in shops may start later than 8 a.m. Shops and cafés are open until nine or ten in the evening.
As mentioned in section 3.2 under public transportation, it is very common for people to go home for lunch, which generally lasts from 12 noon to 2 p.m. Most people leave the city at noon and this fact is shown by a distinct peak between 12 p.m. to 12:30 p.m. However, our results show that people come back to the city after lunch at different times. Again, this is probably due to the fact that people have different working hours.
Although it was not so easy to establish peak times, we had to make a decision. Based on the data gathered during the first round of traffic counts, three peak times were selected. These were:
1 7:30 – 8:00 2 12:00 – 12:30 3 18:00 – 18:30
6.3 Traffic Counts on Eighteen Sections
Now it was time to make the second round of traffic counts on more sections during the three peak times. We had to have a reasonable work load and still cover as many sections as possible. We decided to make the second round of counts on a total of 18 different sections, see figures 6.4 and 6.5 on pages 45 and 46 respectively. After the first round of counts, we thus made counts on 13 additional sections. The sections were chosen so that there would be a good distribution of streets and roads. The sections have different characteristics:
Independence Avenue, Kalu Street, Martyrs Avenue and Emperor Johannes Avenue are located in the very heart of Asmara. Menelik I Street and Dancalia Street are found in the vicinity of the marketplaces. Ras Abebe Aregai Avenue and Nejo Street lie next to the University of Asmara. Deg Nesibu Zemanuel Avenue is located close to Asmara Brewery, a large workplace. Several of the roads lead to villages, such as Road to Keren, Damtew Avenue, Road to Adi Segdo, Road to Kushet and Road to Airport There are bicycle lanes along Edgeth Avenue (west of Expo) and Road to Kehauta
For sections located in the vicinity of one another, the three counts were usually carried out during the course of one day. If there were circumstances that prevented a count to be made for a certain interval, for example heavy rains, this count was made on another day instead.
For each section, the following was done. The section was divided among the persons counting so that all the desirable traffic would be covered in both directions. This division of labor differed a little from section to section and on the number of persons able to take part in the count. Usually, three to four people made the counts. Whenever possible, two intersecting streets or roads were counted at one site so as to get a more detailed picture of the traffic flows.

Inventory of Traffic Flows
45
The results of the traffic counts made on the 18 chosen sections are shown in table 6.2 and table 6.3 on pages 47 and 48 respectively. Table 6.2 presents the number of bicycles as well as the number of motorized vehicles while table 6.3 gives the number of trucks and buses as well as the number of animal-drawn carts, respectively. The complete set of data is found in Appendix 2.
Figure 6.4 Eighteen chosen sections where traffic counts were made

Inventory of Traffic Flows
46
Menelik I Street Dancalia Street Kalu Street
Independence Avenue Martyrs Avenue Emperor Johannes Ave
Road to Keren Road to Agdi Segdo Ras Abebe Aregai
Nejo Street Road to Kushet Andinnet Street
Edgeth Avenue (west) Road to Airport. Edgeth Avenue (east)
Damtew Avenue Road to Kehauta Deg Nesibu Zemanuel
Figure 6.5 Photos of all 18 sections where traffic counts were made
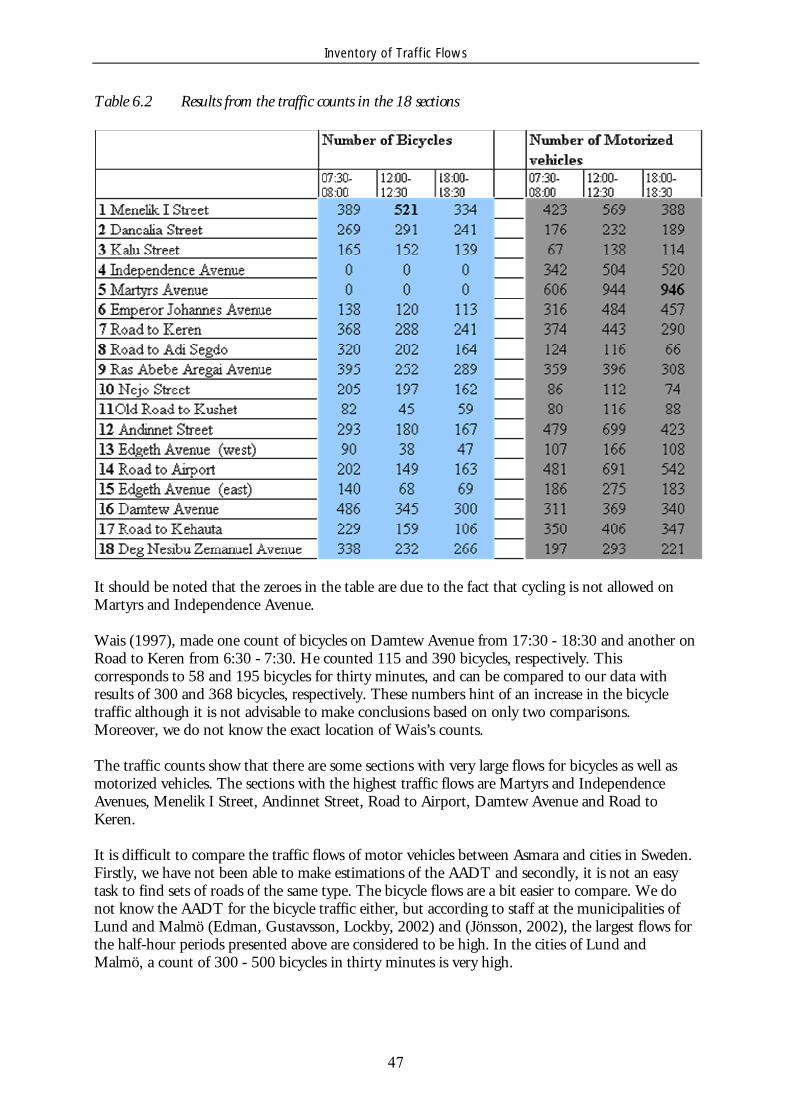
Inventory of Traffic Flows
47
Table 6.2 Results from the traffic counts in the 18 sections
It should be noted that the zeroes in the table are due to the fact that cycling is not allowed on Martyrs and Independence Avenue.
Wais (1997), made one count of bicycles on Damtew Avenue from 17:30 - 18:30 and another on Road to Keren from 6:30 - 7:30. He counted 115 and 390 bicycles, respectively. This corresponds to 58 and 195 bicycles for thirty minutes, and can be compared to our data with results of 300 and 368 bicycles, respectively. These numbers hint of an increase in the bicycle traffic although it is not advisable to make conclusions based on only two comparisons. Moreover, we do not know the exact location of Wais’s counts.
The traffic counts show that there are some sections with very large flows for bicycles as well as motorized vehicles. The sections with the highest traffic flows are Martyrs and Independence Avenues, Menelik I Street, Andinnet Street, Road to Airport, Damtew Avenue and Road to Keren.
It is difficult to compare the traffic flows of motor vehicles between Asmara and cities in Sweden. Firstly, we have not been able to make estimations of the AADT and secondly, it is not an easy task to find sets of roads of the same type. The bicycle flows are a bit easier to compare. We do not know the AADT for the bicycle traffic either, but according to staff at the municipalities of Lund and Malmö (Edman, Gustavsson, Lockby, 2002) and (Jönsson, 2002), the largest flows for the half-hour periods presented above are considered to be high. In the cities of Lund and Malmö, a count of 300 - 500 bicycles in thirty minutes is very high.
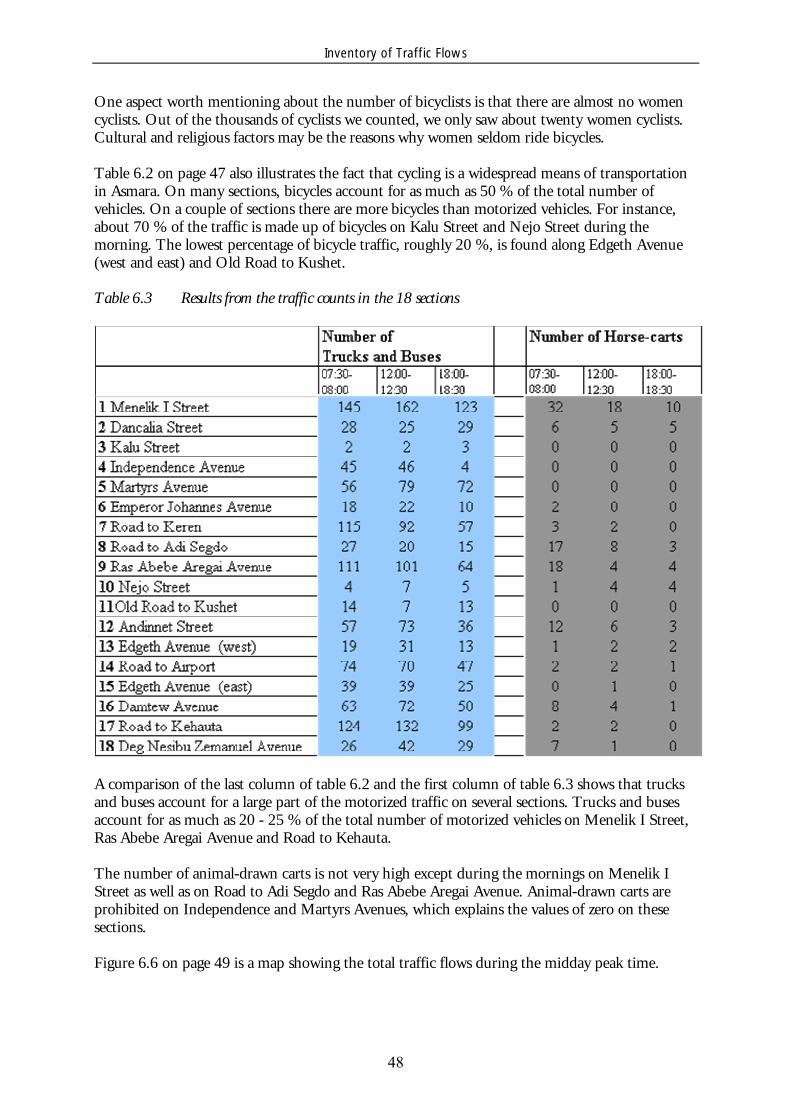
Inventory of Traffic Flows
48
One aspect worth mentioning about the number of bicyclists is that there are almost no women cyclists. Out of the thousands of cyclists we counted, we only saw about twenty women cyclists. Cultural and religious factors may be the reasons why women seldom ride bicycles.
Table 6.2 on page 47 also illustrates the fact that cycling is a widespread means of transportation in Asmara. On many sections, bicycles account for as much as 50 % of the total number of vehicles. On a couple of sections there are more bicycles than motorized vehicles. For instance, about 70 % of the traffic is made up of bicycles on Kalu Street and Nejo Street during the morning. The lowest percentage of bicycle traffic, roughly 20 %, is found along Edgeth Avenue (west and east) and Old Road to Kushet.
Table 6.3 Results from the traffic counts in the 18 sections
A comparison of the last column of table 6.2 and the first column of table 6.3 shows that trucks and buses account for a large part of the motorized traffic on several sections. Trucks and buses account for as much as 20 - 25 % of the total number of motorized vehicles on Menelik I Street, Ras Abebe Aregai Avenue and Road to Kehauta.
The number of animal-drawn carts is not very high except during the mornings on Menelik I Street as well as on Road to Adi Segdo and Ras Abebe Aregai Avenue. Animal-drawn carts are prohibited on Independence and Martyrs Avenues, which explains the values of zero on these sections.
Figure 6.6 on page 49 is a map showing the total traffic flows during the midday peak time.

Inventory of Traffic Flows
49
Figure 6.6 Total traffic flows at 12:00 – 12:30
In the figure above, the thickest gray line along Menelik I Street corresponds to 1,270 vehicles while the thinnest gray line along Road to Kushet corresponds to 168 vehicles.