Embed Size (px)
Citation preview
AN ANALYSIS OF THE CALIFORNIA TEST OF MENTAL MATURITY;
ADVANCED BATTERY
by
Louis Checov
A Thesis submitted i n P a r t i a l
Fulfilment of The Requirements
for the Degree of
MASTER OF ARTS,
in the Department
PHILOSOPHY AND PSYCHOLOGY
of
The University of B r i t i s h Columbia
October, 1946.
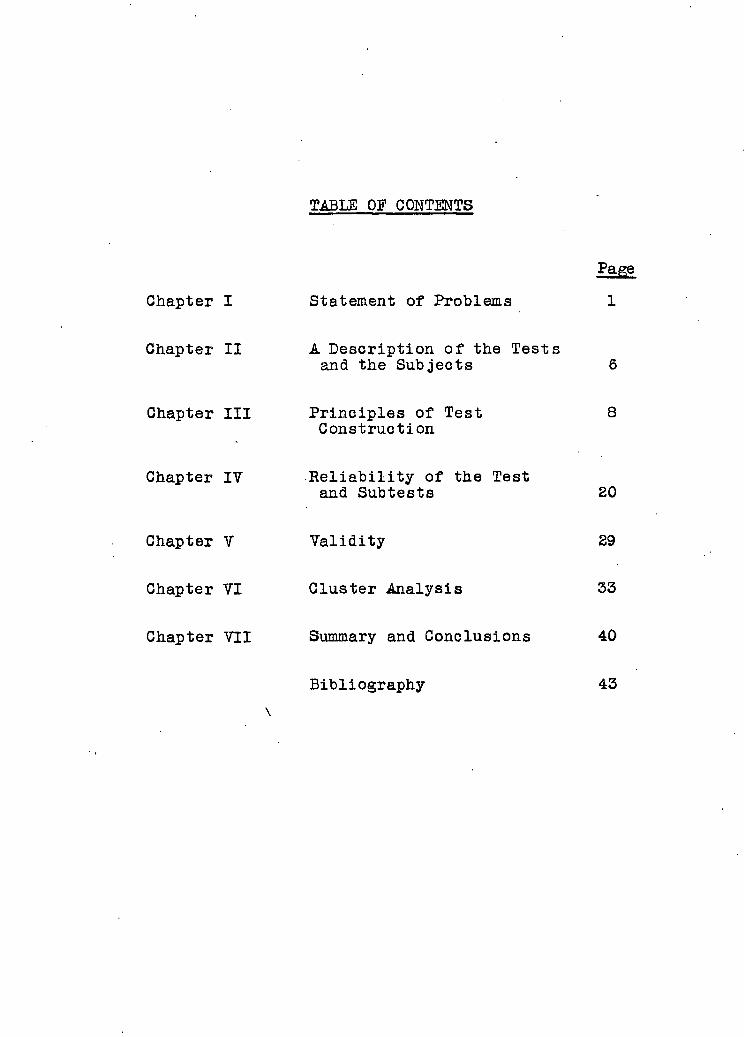
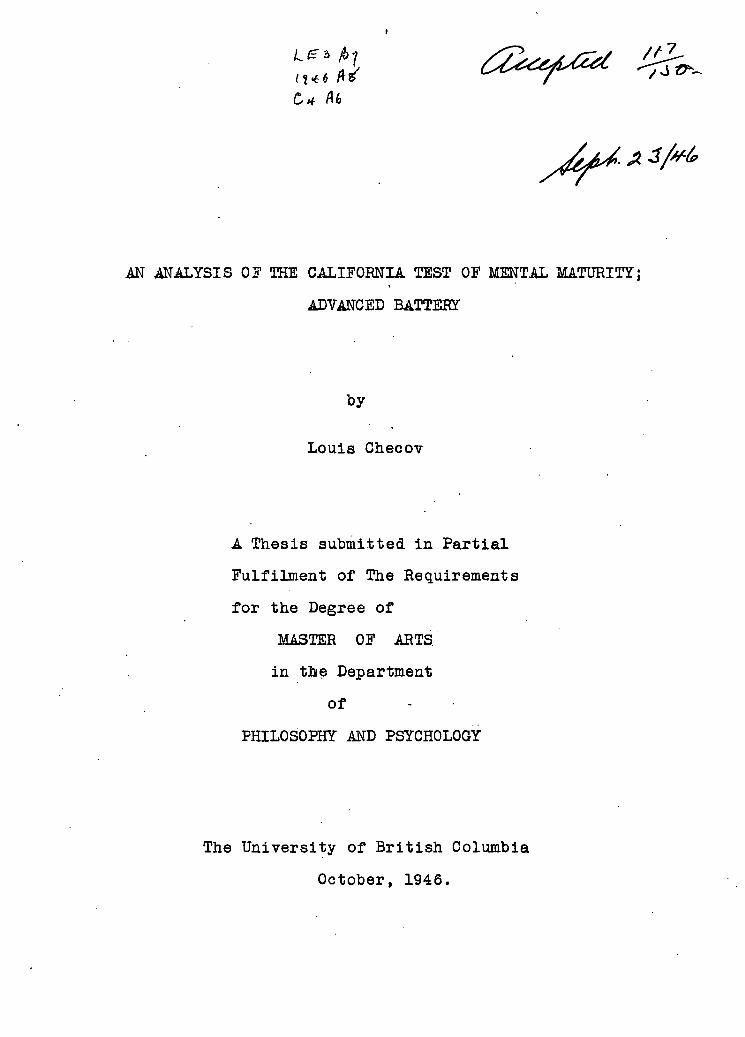
TABLE OF CONTENTS
Page
Chapter I Statement of Problems 1
Chapter II A Description of the Tests and the Subjects 6
Chapter III P r i n c i p l e s of Test 8 Construction
Chapter IY R e l i a b i l i t y of the Test
and Subtests 20
Chapter V V a l i d i t y 29
Chapter VI Cluster Analysis 33
Chapter VII Summary and Conclusions 40
Bibliography 43
TABLES AND CHARTS
Table 1 - Means, Standard Deviations, and Ranges of IQ's on the CTMM and Otis Tests 6
Table 2 - Item D i f f i c u l t y - Percentage Passing Each Item
11
Table 3 - Summary of Data on Item D i f f i c u l t y 13
Table 4 - Means and Sigmas of Subtests 14
Table 5 - Rho Between Obtained Order of D i f f i c u l t y and Test Order
16
Table 6 - Percentages of Students Attempting A l l Items
17
Table 7 - Phi C o e f f i c i e n t s of Items i n Subtest 9 and 10
18
Table 8 - R e l i a b i l i t y C o e f f i c i e n t s 24
Table 9 - R e l i a b i l i t y of Subtests 25
Table 10 • - Range of Scores containing over 80$ of Group 27
Table 11 • - Correlations Between Test Scores and Academic Scores 30
Table 12 • Intercorrelations of Subtests . compared with Los Angeles Report 34
Chart 1 - Cluster Analysis - Group A 35
Chart 2 - Cluster Analysis - Group B 36
Chart 3 - Cluster Analysis - Group C 37
Chart 4 - Cluster Analysis - Group D 38
CHAPTER I
STATEMENT'OF PROBLEMS
The modern practice of mental measurement i s
dependent upon many basic p r i n c i p l e s or concepts -
v a l i d a t i o n , standardization, o b j e c t i v i t y , r e l i a b i l i t y ,
discriminating a b i l i t y , norms, and ease of administration
and scoring. Consequently, an i n t e l l i g e n c e test i s to be
judged by the extent to which i t adheres to these p r i n c i p l e s .
Unfortunately, the production of t e s t s , and t h e i r adoption,
has f a r outpaced proper c r i t i c a l evaluation, even a f t e r
t h e i r use has become r e l a t i v e l y widespread. As S t u i t
puts i t , "Careful studies of v a l i d i t y and r e l i a b i l i t y
c o e f f i c i e n t s and norms presented by test authors are a l l too
rare." (23)
The C a l i f o r n i a Test of Mental Maturity (Advanced
Battery) consists of a t o t a l of 253 items, requiring two
periods of about 45 minutes each to administer. It
includes 3 pretests designed to detect gross defects of
sight, hearing, and motor coordination, and 13 subtests
arranged as power tests. The subtests numbering 4 to 16
are grouped into sections: A(memory, t e s t s 4 and 5 - 5 3
items), B ( s p a t i a l r e l a t i o n s h i p s , tests 6, 7, and 8 - 4 5 items),
C(Reasoning, t e s t s 9 to 15 - 105 items), and D(Vocabulary,
test 16-50 items). The memory group i s designed to test
immediate and delayed r e c a l l . The tests; on s p a t i a l
relationships are intended "to reveal orientation i n and
a b i l i t y to u t i l i z e s p a t i a l relationships"; those on reasoning
are designed to "reveal evidences of the higher games of
mental a c t i v i t y " ; and the vocabulary test i s to reveal
"maturity of the apperceptive processes with references to
ideas and growth of meaning." From the battery of subtests,
three IQ's are obtained: Total Mental Factors ( t o t a l scores),
Language Factors (scores on subtest 5, 14, 15 and 16), and
Non-Language Factors (tests 4 and 6 to 13 i n c l u s i v e ) . The
tests r e s u l t s are grouped to show a diagnostic p r o f i l e (or
the i n d i v i d u a l testee, and the manual of directions^ provides
tables f o r the conversion of raw scores into IQ» s.
The CTMM has received considerable praise i n the few
years since i t s publication, and whereas i t s use apparently
has been reasonably widespread, such analyses as Stu i t
recommends have not been carried out. The only i n v e s t i
gation dealing with r e l i a b i l i t y and v a l i d i t y that has
appeared inthe l i t e r a t u r e since i t s publication has been
that of Traxler (29). He attempts to investigate the
r e l i a b i l i t y of the CTMM, the r e l a t i o n between language and
non-language IQ's, the co r r e l a t i o n of the CTMM with other
tests of mental a b i l i t y , and the r e l a t i o n of each type of
IQ, to reading a b i l i t y . Although h i s sample i s a small one,
part of Traxler's findings on r e l i a b i l i t y point to some
disagreement with the figures given by the test authors.
-3-
Apparently, the usual evaluation of a test i s
expressed by most authors a f t e r a study of the makesgp of
the test and the accompanying manual of directi o n s , and any
other pertinent information immediately ava i l a b l e , and some
recourse to statements of users of the test. Thus Harris
claims that the C a l i f o r n i a Test of Mental Maturity i s
probably the best test available above the five-year
l e v e l . (8), and Kuhlman writes, "... we believe that the
unabbreviated batteries are to be classed among the very
best on the market f o r determining general l e v e l s of mental
maturity." (15)
According to the Manual of Directions, the p a r t i c
ular value of the CTMM (Advanced Battery) designed for use
with students i n Grade 7 to the college sophomore l e v e l ,
i s i n i t s diagnostic p o s s i b i l i t i e s . Some o f i t s s i g n i f i c a n t
features, as c i t e d i n the manual, are the following:
1. It purports to make a diagnostic evaluation, f o r each
student, of those mental a b i l i t i e s which are related to
success i n various types of school a c t i v i t y - " i n order that
the teacher may u t i l i z e t h i s information d i r e c t l y i n aiding
students who have learning d i f f i c u l t i e s " .
2. It provides a diagnostic p r o f i l e showing the extent to
which the student possesses these a b i l i t i e s , "thus enabling
the teacher to see at a glance the probable source of
d i f f i c u l t y or success."
3. Being primarily diagnostic, the test y i e l d s not one
but three mental ages (MA's) and i n t e l l i g e n c e quotients
(IQ's) - t o t a l , language, and non-language.
4. Again according to the manual, "the number and variety
of t e s t situations assures a high r e l i a b i l i t y . "
5. The test correlates approximately .88 with the
Stanford-Binet. The manual does not indicate the number
of cases in the sample from which th i s p a r t i c u l a r coeff
i c i e n t was calculated.
6. The norms are adjudged comparable to those reg u l a r l y
obtained by use of i n d i v i d u a l psychological examinations
and well-standardized group t e s t s .
Educational B u l l e t i n No. 14 adds further information
about the value of the CTMM as an aid to diagnosis i n the
schoolroom, and also notes that i t s value i s enhanced by the
i n c l u s i o n of pretests designed to detect gross defects of
hearing, v i s i o n , and motor coordination. The B u l l e t i n also
quotes cert a i n testimonials received i n praise of the test,
of which the following i s i l l u s t r a t i v e : "we believe the
C a l i f o r n i a Test of Mental Maturity to be the f i n e s t
i n t e l l i g e n c e test a v a i l a b l e , and we use i t from the f i r s t
to the twelfth grade.'!
Purpose and Method of Present Study
It i s apparent that a c e r t a i n service w i l l be
rendered by an analysis of t h i s test. For t h i s purpose
answersi.are sought to the following questions:
I. (a) What i s the l e v e l and range of d i f f i c u l t y of
in d i v i d u a l items?
(b) Are the items arranged i n order of d i f f i c u l t y ?
(c) How d i f f i c u l t are the various subtests?
(d) To what extent do the items d i f f e r e n t i a t e between
superior and i n f e r i o r students?
I I . (a) How r e l i a b l e are the scores for t o t a l , language,
and non-language factors?
(b) HQW;. r e l i a b l e are the various subtests?
III.(a) How well do Otis IQ's correlate with IQ's obtained
from the CTMM?
(b) How well do CTMM IQ fs correlate with academic
subjects?
(c) What i s the co r r e l a t i o n between CTMM IQ(s and
certain technical school shop subjects?
IV. To what extent do the t e s t s f a l l into the patterns
suggested by the test makers?
-6-
CHAFTER I I
A DESCRIPTION OF THE TESTS AND THE SUBJECTS
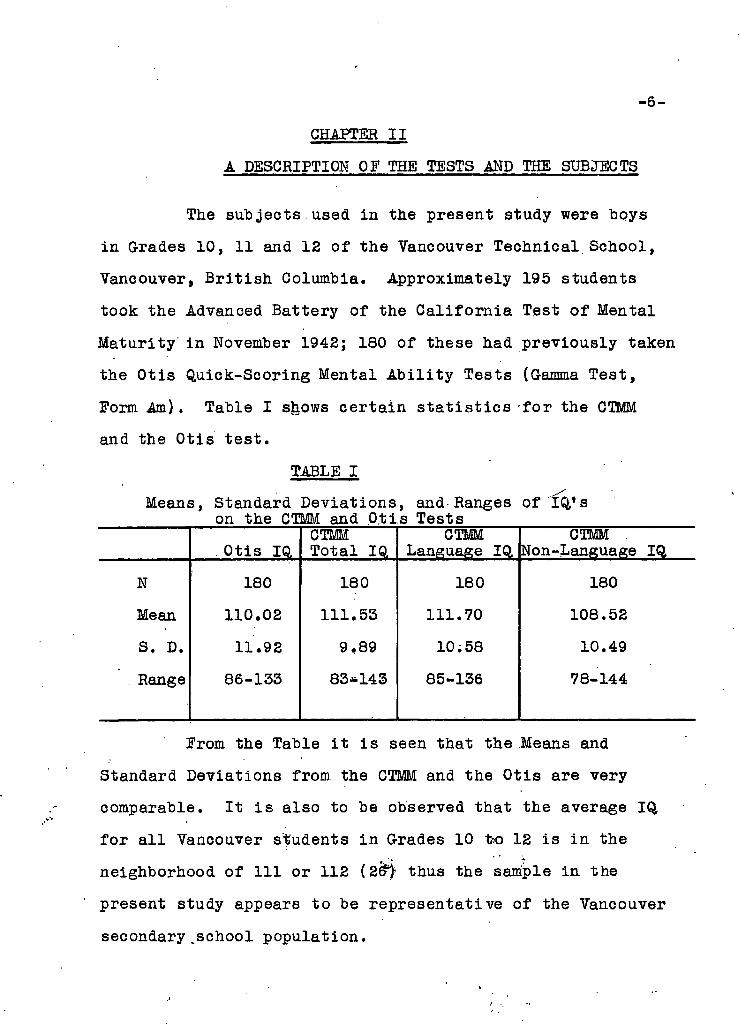
The subjects used i n the present study were boys
i n Grades 10, 11 and 12 of the Vancouver Technical School,
Vancouver, B r i t i s h Columbia. Approximately 195 students
took the Advanced Battery of the C a l i f o r n i a Test of Mental
Maturity i n November 1942; 180 of these had previously taken
the Otis Quick-Scoring Mental A b i l i t y Tests (Gamma Test,
Form Am). Table I shows ce r t a i n s t a t i s t i c s -for the CTMM
and the Otis test .
TABLE I
Means, Standard Deviations, and Ranges of'I^'a on the CTMM and O t i s Tests
. Otis IQ CTMM Total IQ.
CTMM Language
CTMM . Non-Language IQ
N 180 180 180 180
Mean 110.02 111.53 111.70 108.52
S. D. 11.92 9,89 10.58 10.49
Range 86-133 83*143 85-136 78-144
From the Table i t i s seen that the Means and
Standard Deviations from the CTMM and the Otis are very
comparable. It i s also to be observed that the average IQ
for a l l Vancouver students i n Grades 10 t>o 12 i s i n the
neighborhood of 111 or 112 (2t>) thus the sample i n the
present study appears to be representative of the Vancouver
secondary .school population.
-7-
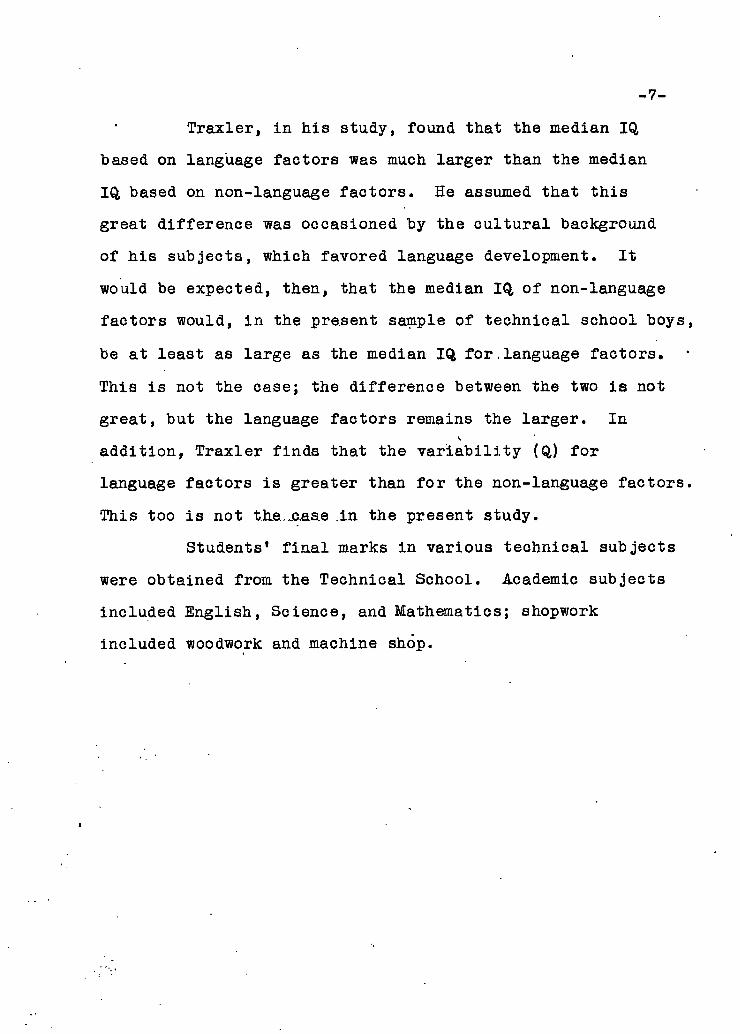
Traxler, i n his study, found that the median IQ
based on language factors was much larger than the median
IQ based on non-language factors. He assumed that t h i s
great difference was occasioned by the c u l t u r a l background
of h i s subjects, which favored language development. It
would be expected, then, that the median IQ of non-language
factors would, i n the present sample of technical school boys,
be at least as large as the median IQ for,language factors.
This i s not the case; the difference between the two i s not
great, but the language factors remains the larger. In
addition, Traxler finds that the v a r i a b i l i t y (Q) f o r
language factors i s greater than f o r the non-language factors.
This too i s not the...c.aae i n the present study.
Students' f i n a l marks i n various technical subjects
were obtained from the Technical School. Academic subjects
included English, Science, and Mathematics; shopwork
included woodwork and machine shop.
~8'
CHAPTER III
PRINCIPLES OF TEST CONSTRUCTION
The two main, requisites f o r a measuring instrument
are r e l i a b i l i t y and v a l i d i t y , and indeed, "the prime
consideration i n the construction and administration of
tests i s v a l i d i t y - that i s , representation of the influence
of factors that the test i s to represent." (S) Besides t h i s
primary consideration of v a l i d i t y , other problems are
mainly of an administrative sort; the test must not take too
long to give, i t should be reasonably easy to administer etc.
A te s t which i s highly v a l i d (for a s p e c i f i c purpose) w i l l
represent i n d i v i d u a l variations i n the character i t i s
supposed to measure with great f i d e l i t y . A test which has
a law degree of v a l i d i t y secures responses which represent
strongly the influence of a number of other factors, so that
the character we desire to measure i s somewhat l o s t among
the many present. What i s done i n a t e s t , then,.is-to
attempt to obtain test items which will., stimulate responses
of a given kind, and further, we try to get enough o f these
variance types of items so that the undesired factors w i l l
tend to neutralize each other and average out. Unfortunately,
as one writer points out i n thi s connection, "Investigators
so f a r have attained only moderate success i n these
e f f o r t s . " (3)
- 9 -
In t h i s chapter i t i s proposed to deal with
cert a i n of the generally-accepted p r i n c i p l e s of test
construction, a l l fundamentally aimed at developing a
s c i e n t i f i c measuring instrument.
1. Item D i f f i c u l t y
The heart of the item analysis problem l i e s i n the
diagnostic value of items. An item must be able to d i s t i n
guish between indivi d u a l s who have more or less of the t r a i t
that the test attempts to judge. "No item which i s answered
cor r e c t l y by a l l pupils i n a given group can be of any
functional value i n a general achievement test f o r that
group, nor can any item which i s answered co r r e c t l y by none
of that group." (9) One consideration that could be admitted
as an exception to this rule i s that several very easy
"shock absorbers" may be introduced at the beginning of a
test so as not to discourage completely the testee.
Although i t i s generally believed that maximum
discrimination among testees i s obtained by items that about s
one-half the indiv i d u a l s can pass, test authorities are not
in agreement upon what i s the best form of d i s t r i b u t i o n of
item d i f f i c u l t y . According to some, the spread of scores
on a test should extend from near zero to-near the highest
possible score (that there should be a range of success
from about 5 to 20 percent to 80 to 95 percent) to ensure
a maximum r e l i a b i l i t y . On the other hand, Symonds (24)
and Thurstone (28) have shown, that a test, consisting of items
-10-
of 50 percent d i f f i c u l t y value measures an i n d i v i d u a l most
accurately. The former viewpoint conforms to what i s
generally known as the d e f i n i t i o n of a power t e s t , and the
l a t t e r i s a feature of the speed t e s t .
From the sample of the present study, as indicated
i n Table 2, few of the items qualify according to either of
the p r i n c i p l e s or standards expressed above|.
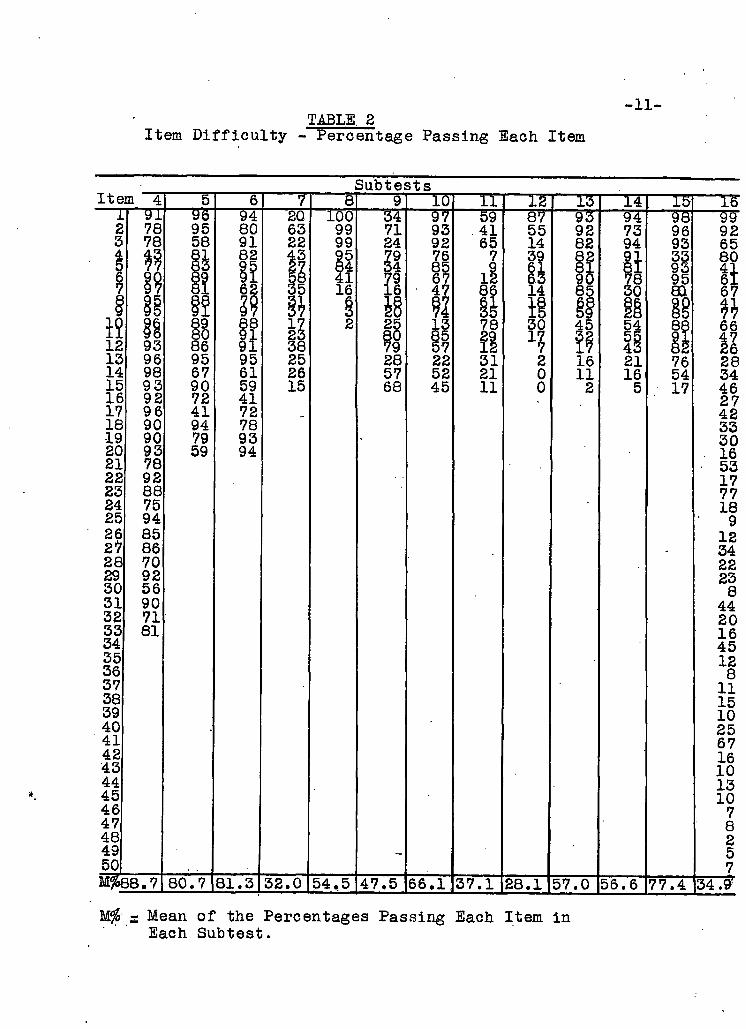
TABLE. 2 Item D i f f i c u l t y - Percentage Pas sing Each Item
Subtests Item 4 5 6 7 8 9 10 11 12 13 14 15 16
1 91 ye 94 20 100 34 97 59 87 93 94 98 99 2 78 95 80 63 99 71 93 41 55 92 73 96 92 3 78 58 91 22 99 24 92 65 14 82 94 93 65 4 43 §1 82 43 95 Z9 76 7 39 82 91 33 80 41 5 77 83 El* I? 84 34 85 9 61 81 81 93 80 41
6 §Q 89 62 §8 41 79 67 12 63 90 78 95 61 7 97 81 62 35 16 16 47 86 14 85 30 aa 67
1? f ! | 48 ?1 Si 1! 88 W 1? 89 88 17 2 25 13 78 30 45 54 88 91
66 1? 96 93 80 21 23 80 85 1Z 32 55 88
91 47 12
96 93 86 91 38 79 57 1*2 7 17 43 82 26
13 96 95 95 25 28 22 31 2 16 21 76 28 14 98 67 61 26 57 52 21 0 11 16 54 34 15 93 90 59 15 68 45 11 0 2 5 17 46 16 92 72 41
17 27
17 96 41 72 42 18 90 94 78 33 19 90 79 93 30 20 93 59 94 16 21 78 53 22 92 17 23 88 77 24 75 18 25 94 9 26 85 12 27 86 34 28 70 22 29 92 23 30 56 8 31 90 44 32 71 20 33 81 16 34 45 35 12 36 8 37 11 38 15 39 10 40 25 41 67 42 16 43 10 44 13 45 10 46 7 47 8 48 2 49 _ 5 50 7 M%88.7 80.7 81 .3 32.0 54,5 47.5 66 .1 37.1 28.1 57.0 56.6 77.4 34.9 !
HLfo s Mean of the Percentages Passing Each Item i n Each Subtest.
-12-
A quick glance at the Table reveals that there i s a
great range of d i f f i c u l t y of items of the whole te s t ,
varying from items that a l l students pass, to those that a l l
f a i l . In addition, there are great discrepancies between
the d i f f i c u l t y values of the items of the various subtests.
For example, not a single item i n subtest 7 was passed by
over 80 percent of the subjects, whereas two-thirds of the
items of subtests 4, 5, 6 and 15 were passed by over 80
percent of the students. Thus test 4 i s composed primarily
of items of a rather easy nature, whereas most of the items
of subtest 7 are too d i f f i c u l t . Nearly 67 percent of the
items of subtest 4 were passed by over 80 percent of the
students; i n subtest 7 only 13 percent of items were passed
by-more than 40 percent, and ..none of the items was passed by
more than 60 percent. In subtest 12, over 50 percent of the
items were passed by less than 20 percent of the subjects;
in subtest 9, 6 percent of the items were passed by more
than -80 percent of the group, and 20 percent of the items
were passed by less than 20 percent of the group.
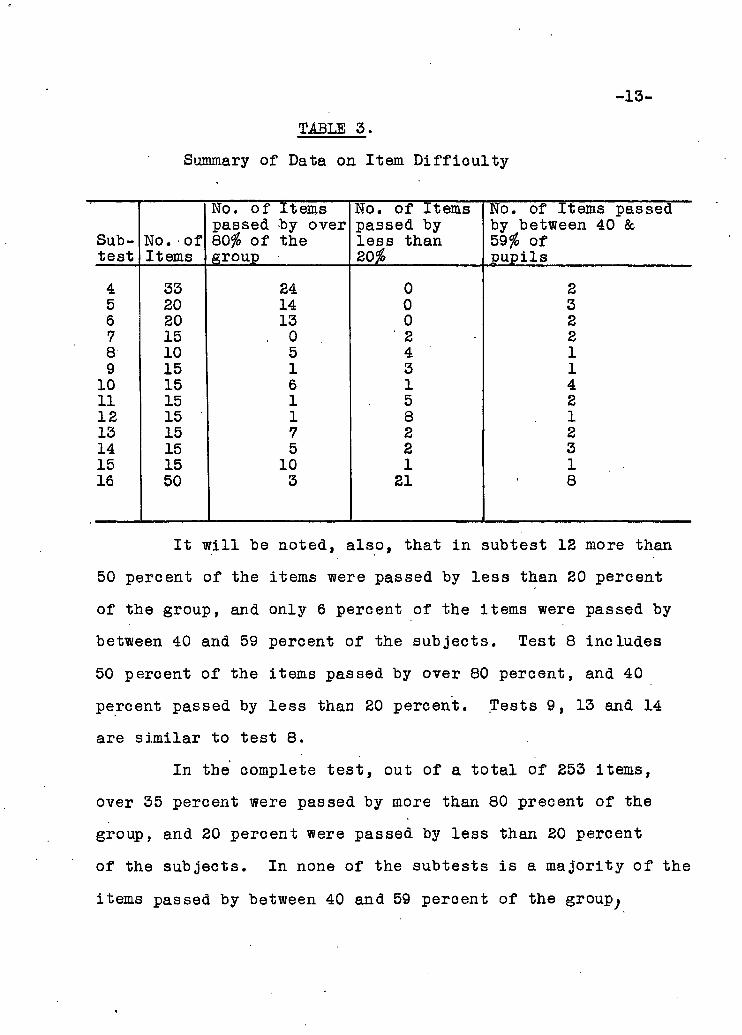
Table 3 summarizes the data of Tables 2 i n order to
i l l u s t r a t e more c l e a r l y the differences i n the d i f f i c u l t y
values discussed above.
-13-
TABLE 3.
Summary of Data on Item D i f f i c u l t y
Subtest
No.•of Items
No. of Items passed by over 80% of the group
No. of Items passed by less than 20%
No. of Items passed by between 40 & 59$ of pupils
4 33 24 0 2 5 20 14 0 3 6 20 13 0 2 7 15 . 0 2 2 8 10 5 4 1 9 15 1 3 1
10 15 6 1 4 11 15 1 5 2 12 15 1 8 1 13 15 7 2 2 14 15 5 2 3 15 15 10 1 1 16 50 3 21 8
It w i l l be noted, also, that i n subtest 12 more than
50 percent of the items were passed by le s s than 20 percent
of the group, and only 6 percent of the items were passed by
between 40 and 59 percent of the subjects. Test 8 includes
50 percent of the items passed by over 80 percent, and 40
percent passed by less than 20 percent. Tests 9, 13 and 14
are similar to test 8.
In the complete t e s t , out of a t o t a l of 253 items,
over 35 percent were passed by more than 80 precent of the
group, and 20 percent were passed by less than 20 percent
of the subjects. In none of the subtests i s a majority of the
items passed by between 40 and 59 percent of the group^
-14-
The range recommended by Symonds (28), nor, with the
exceptions of test 8, do any of the subtests exhibit a
range of d i f f i c u l t y of from near zero to near 100 percent.
From these data i t i s apparent that few o f the
items f a l l within the range of d i f f i c u l t y generally,
accepted as the most r e l i a b l e , and the diagnostic value of
many of the items i s to be questioned.
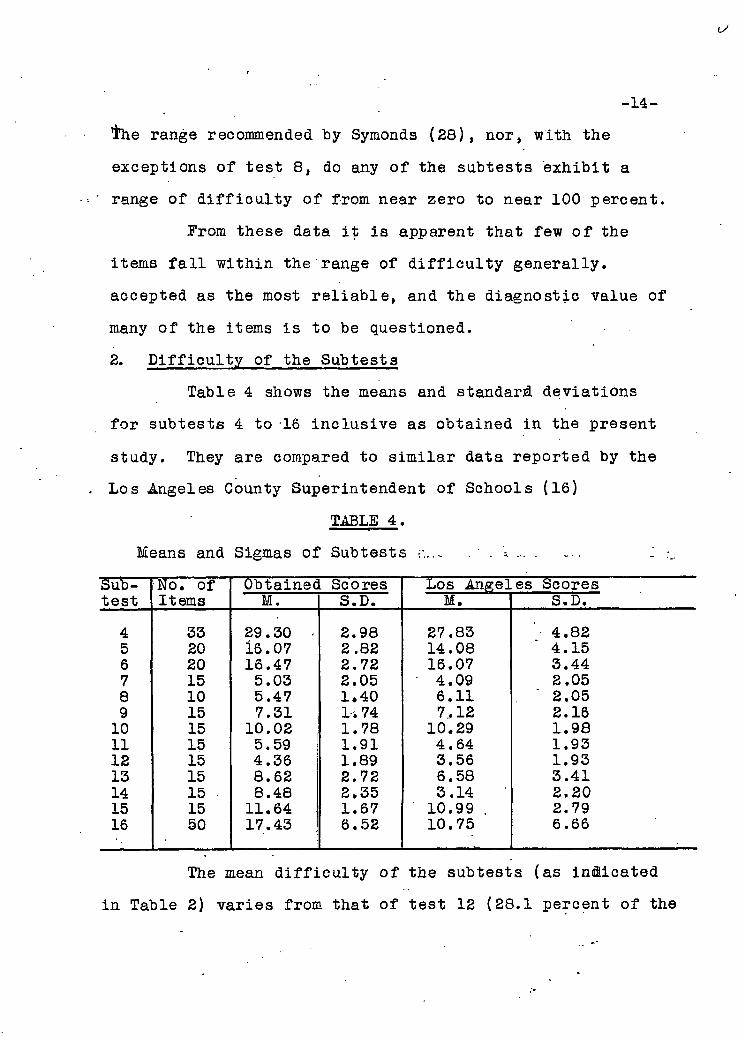
2. D i f f i c u l t y of the Subtests
Table 4 shows the means and standard deviations
for subtests 4 to 16 i n c l u s i v e as obtained i n the present
study. They are compared to s i m i l a r data reported by the
Los Angeles County Superintendent of Schools (16)
TABLE 4.
Means and Sigmas of Subtests
Subtest
No. of Items
Obtained L Scores Los Angeles Scores Subtest
No. of Items M. S.D. M. S.D.
4 33 29.30 - 2.98 27.83 ' 4.82 5 20 16.07 2 .82 14.08 4.15 6 20 16.47 2.72 16.07 3.44 7 15 5.03 2.05 • 4.09 2.05 8 10 5.47 1.40 6.11 2.05 9 15 7.31 1 -. 74 7.12 2.16
10 15 10.02 1.78 10.29 1.98 11 15 5.59 1.91 4.64 1.93 12 15 4.36 1.89 3.56 1.93 13 15 8.62 2.72 6.58 3.41 14 15 • 8.48 2.35 3.14 2.20 15 15 11.64 1.67 10.99 . 2.79 16 50 17.43 6.52 10.75 6.66
The mean d i f f i c u l t y of the subtests (as indicated
i n Table 2) varies from that of test 12 (28.1 percent of the
-15-
items passed) to that of test 4 (88.7 percent of the items
passed).
Of the battery of tests comprising the whole, only
tests 8, 9, 13 and 14 approach the mean d i f f i c u l t y l e v e l of
50 percent generally considered the most r e l i a b l e . Tests
4, 5 and 6 are apparently too easy f o r the sample of the
present study, and tests 7, .12 and 16 appear too d i f f i c u l t .
It might be noted, also, that for tests 7, 8, 11 and 12,
the scores obtained are only s l i g h t l y better than would be
expected on a chance basis.
The mean scores of the present sample and f o r the
Los Angeles study are roughly comparable, with, however,
some exceptions, especially i n subtests 14 and 16. The
present sample appears to be l e s s variable than that reported
i n the Los Angeles Study, especially for subtests 4, 5, 6,8,
13 and 14. No attempt was made to determine the sign i f i c a n c e
of these differences.
3. Order of D i f f i c u l t y
Although time l i m i t s are provided, the test i s ,
according to the publisher, a power rather than a speed test.
I f , as i s claimed, the test i s of the former variety, there
i s good reason to assume that there w i l l be a range of scores
of from near zero percent to near 100 percent, with the
items i n increasing order of d i f f i c u l t y . This claim was
appraised by computing the rank-order c o r r e l a t i n g between
obtained order of d i f f i c u l t y and test order i n each of the
-16-
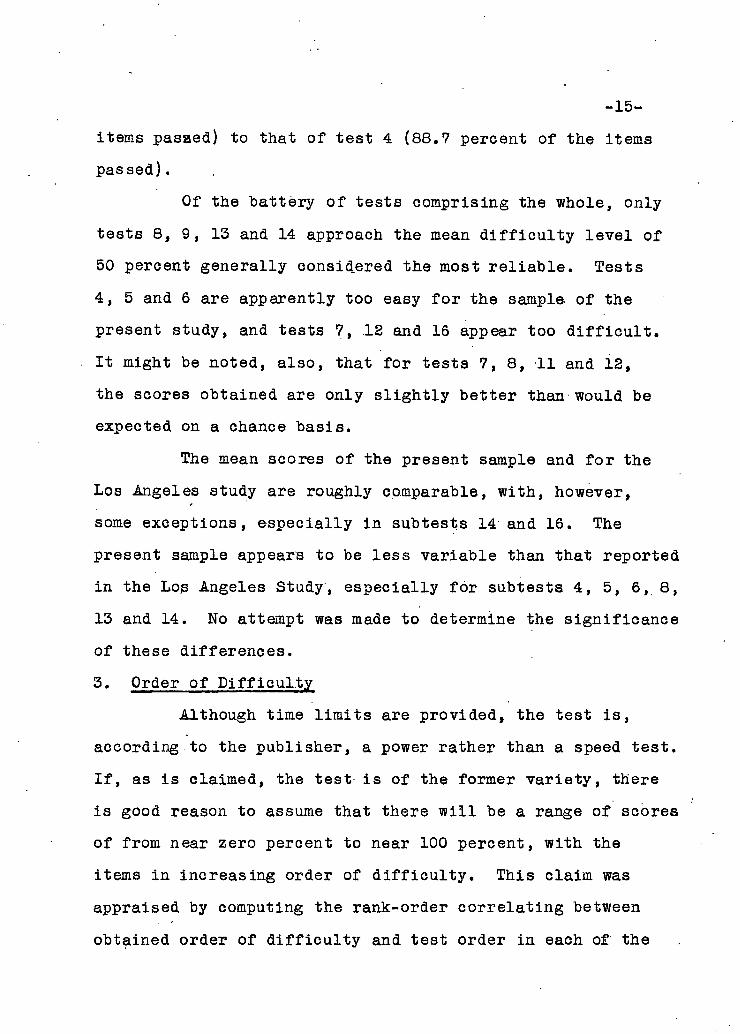
subtests. The re s u l t s appe ar below i n Table 5.
TABLE 5.
Rho Between Obtained Order of D i f f i c u l t y and Test Order
Subtest Rho
4 .26 5 .37 6 .16 7 .32 8 1.00 9 - .114 10 .75 11 .27 12 .86 13 .95 14 .85 15 .67 16 .78
, The values of these correlations indicate that for
6 of the 13 subtests, the items are not arranged even i n
approximate order of d i f f i c u l t y . Some of the items f o r thi s
sample appear to be seriously misplaced. These r e s u l t s may
be compared with those of Hovland and Wonder l i e , who report
rank order correlations between test d i f f i c u l t y and obtained
order of .46 to .75 i n various form of the Otis S e l f -
Administering Test, Advanced Form (13), and with those of
Tyler (3l) , whose reports rank order correlations of .69 to
.91 i n form D of the Terman-McNemar Test.
It was assumed f o r purposes of t h i s study that a
student attempted a l l items down to the l a s t one be marked.
-17-
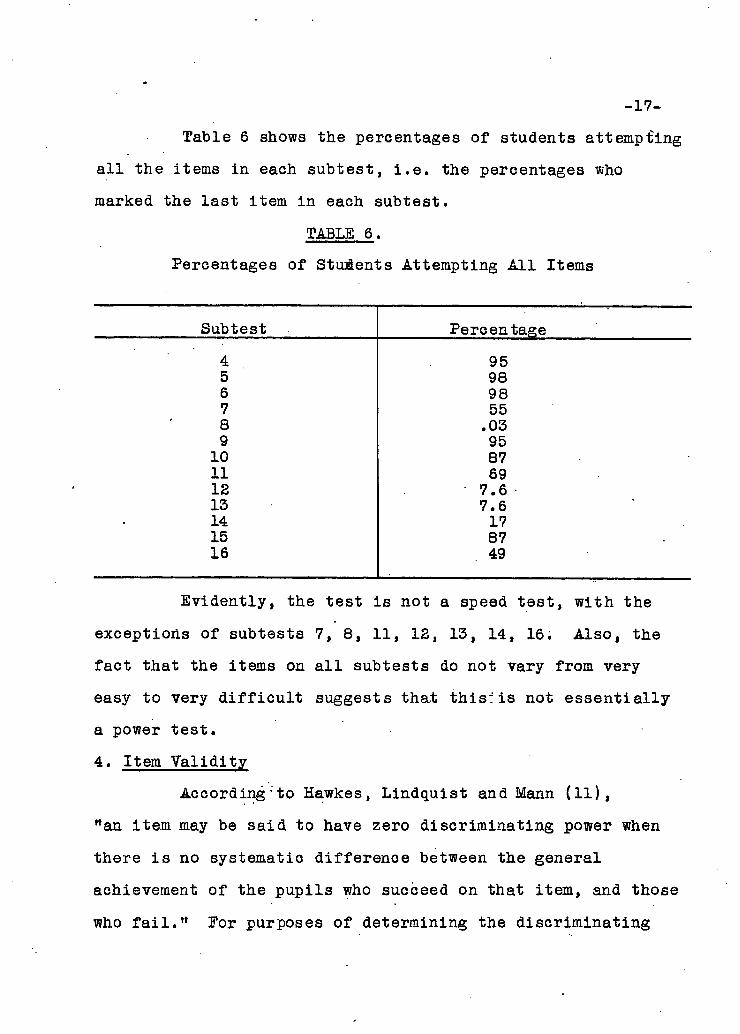
Table 6 shows the percentages of students attempting
a l l the items i n each subtest, i . e . the percentages who
marked the l a s t item i n each subtest.
TABLE 6.
Percentages of Students Attempting A l l Items
Subtest Percentage
4 95 5 98 6 98 7 55 8 .03 9 95
10 87 11 69 12 7.6 13 7.6 14 17 15 87 16 49
Evidently, the test i s not a speed test, with the
exceptions of subtests 7, 8, 11, 12, 13, 14, 16. Also, the
fact that the items on a l l subtests do not vary from very
easy to very d i f f i c u l t suggests that t h i s : i s not e s s e n t i a l l y
a power te s t .
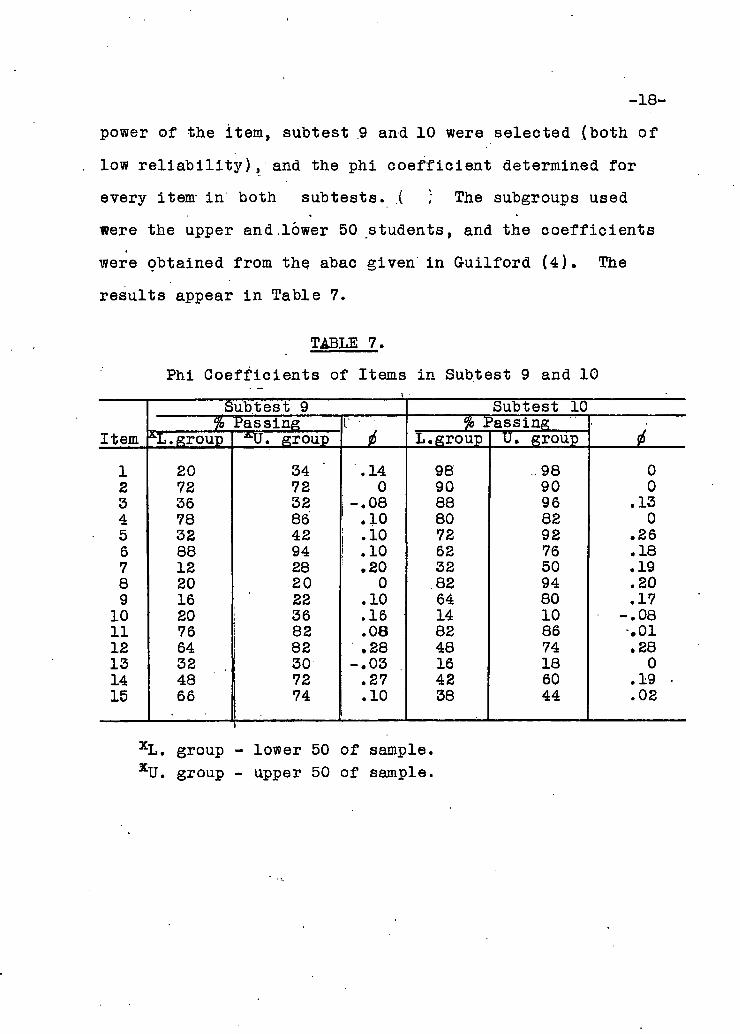
4. Item V a l i d i t y
According to Hawkes, Lindquist and Mann (11),
"an item may be s a i d to have zero discriminating power when
there i s no systematic difference between the general
achievement of the pupils who succeed on that item, and those
who f a i l . " For purposes of determining the discriminating
-18-
power of the item, subtest .9 and 10 were selected (both of
low r e l i a b i l i t y ) , and the phi c o e f f i c i e n t determined for
every item- i n both subtests. .( ; The subgroups used
were the upper and.lower 50 students, and the c o e f f i c i e n t s
were obtained from the abac given i n Gui l f o r d (4). The
resu l t s appear i n Table 7.
TABLE 7.
Phi C o e f f i c i e n t s of Items i n Subtest 9 and 10
Item
Subtest 9 Subtest 10
Item % Passing I" • % Passing
Item •̂L. group AU. group I" •
L.group U. group
1 20 34 .14 98 .98 0 2 72 72 0 90 90 0 3 36 32 ; -.08 88 96 .13 4 78 86 ' .10 80 82 0 5 32 42 ; .10 72 92 .26 6 88 94 ! .10 62 76 .18 7 12 28 .20 32 50 .19 8 20 20 0 82 94 .20 9 16 22 .10 64 80 .17
10 20 j 36 .16 14 10 -.08 11 76 82 .08 82 86 -.01 12 64 82 .28 48 74 .28 13 32 j 30 -.03 16 18 0 14 48 ! 72 : .27 42 60 .19 • 15 66 74 .10 38 44 .02
I X L . group - lower 50 of sample. KU. group - upper 50 of sample.
-19-
It w i l l be seen from these r e s u l t s that i n d i v i d u a l
items f a i l to discriminate s a t i s f a c t o r i l y between the
upper and lower groups of the present sample. Indeed, i n
some cases, the index of discrimination i s negative. The
results are not surprising i n view of the low c o e f f i c i e n t s
of r e l i a b i l i t y for these two subtests 9 and 10, which are
.01 and .06 respectively.
-20-
CHAPTER IV
RELIABILITY OF THE TEST AND SUBTESTS
According to Warren (33) r e l i a b i l i t y r e f e r s to
"a) either the degree of accuracy of a report, b) the
self-consistency of a test or other measuring device, or
c) the r e c i p r o c a l of the v a r i a b i l i t y of a series of
measurements from s me chosen standards, ( c o e f f i c i e n t of
r e l i a b i l i t y : the co r r e l a t i o n among a set of measurement or
between s i m i l a r measurements)
The term was o r i g i n a l l y introduced by Spearman (20)
i n 1904, who defined i t as follows: "the (correlation)
c o e f f i c i e n t between one-half and the other h a l f of several
measurements of the same thing." In a l a t e r work he defined
i t thus: " r e l i a b i l i t y .... this means the amount of corre
l a t i o n between two or more.ratings of the same kind." (21)
For Ferguson and Jackson (14), these d e f i n i t i o n s give r i s e
to the confusion evident i n present-day considerations of
r e l i a b i l i t y . According to Ferguson and Jackson the
d i f f i c u l t y arises as a r e s u l t of the connection, by Spearman,
of r e l i a b i l i t y and c o e f f i c i e n t , and since the interpretation
of c o r r e l a t i o n c o e f f i c i e n t s i s rather d i f f i c u l t , the connec
ti o n has not been a happy one, and has tended to confuse
rather than to c l a r i f y the issue. The c o r r e l a t i o n c o e f f i
cient i s a measure of the degree of relat i o n s h i p between
two variables; r e l i a b i l i t y i s a measure of departure from a
-21-
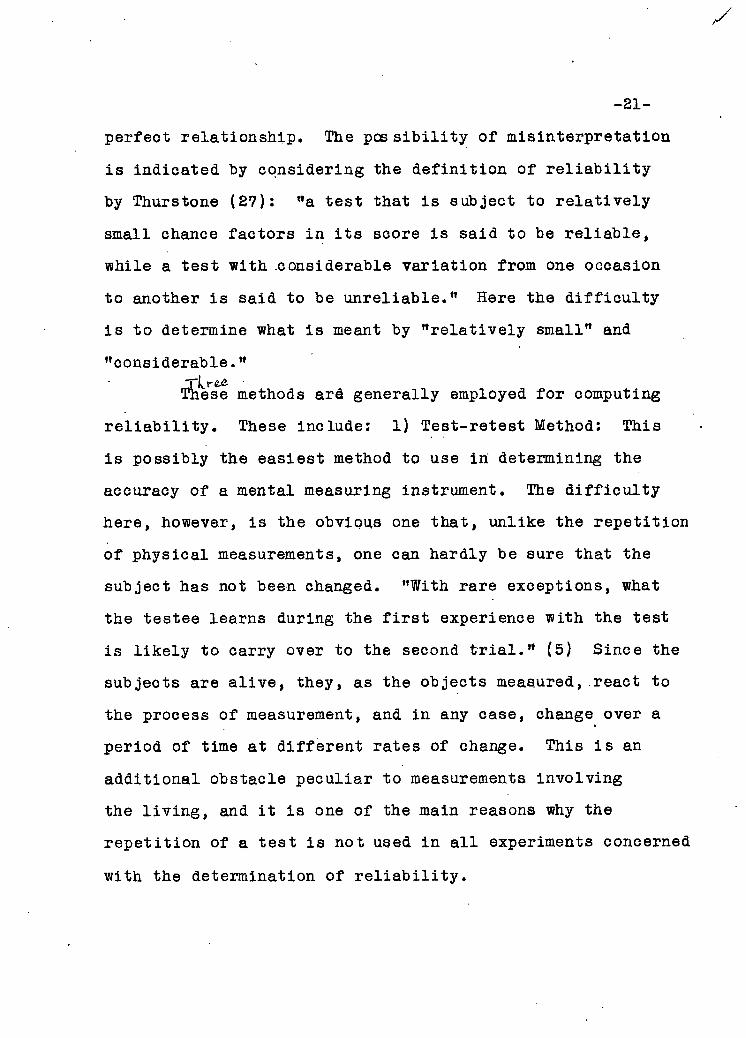
perfeot r e l a t i o n s h i p . The p o s s i b i l i t y of misinterpretation
i s indicated by considering the d e f i n i t i o n of r e l i a b i l i t y
by Thurstone (27): "a test that i s subject to r e l a t i v e l y
small chance factors i n i t s score i s s a i d to be r e l i a b l e ,
while a t e s t with .considerable v a r i a t i o n from one occasion
to another i s said to be u n r e l i a b l e . " Here the d i f f i c u l t y
i s to determine what i s meant by " r e l a t i v e l y small" and
"considerable."
These methods are generally employed fo r computing
r e l i a b i l i t y . These include: 1) Test-retest Method: This
i s possibly the easiest method to use i n determining the
accuracy of a mental measuring instrument. The d i f f i c u l t y
here, however, i s the obvious one that, unlike the r e p e t i t i o n
of physical measurements, one can hardly be sure that the
subject has not been changed. "With rare exceptions, what
the testee learns during the f i r s t experience with the test
i s l i k e l y to carry over to the second t r i a l . " (5) Since the
subjects are a l i v e , they, as the objects measured, react to
the process of measurement, and i n any case, change over a
period of time at d i f f e r e n t rates of change. This i s an
a d d i t i o n a l obstacle peculiar to measurements involving
the l i v i n g , and i t i s one of the main reasons why the
r e p e t i t i o n of a t e s t i s not used i n a l l experiments concerned
with the determination of r e l i a b i l i t y .
-22-
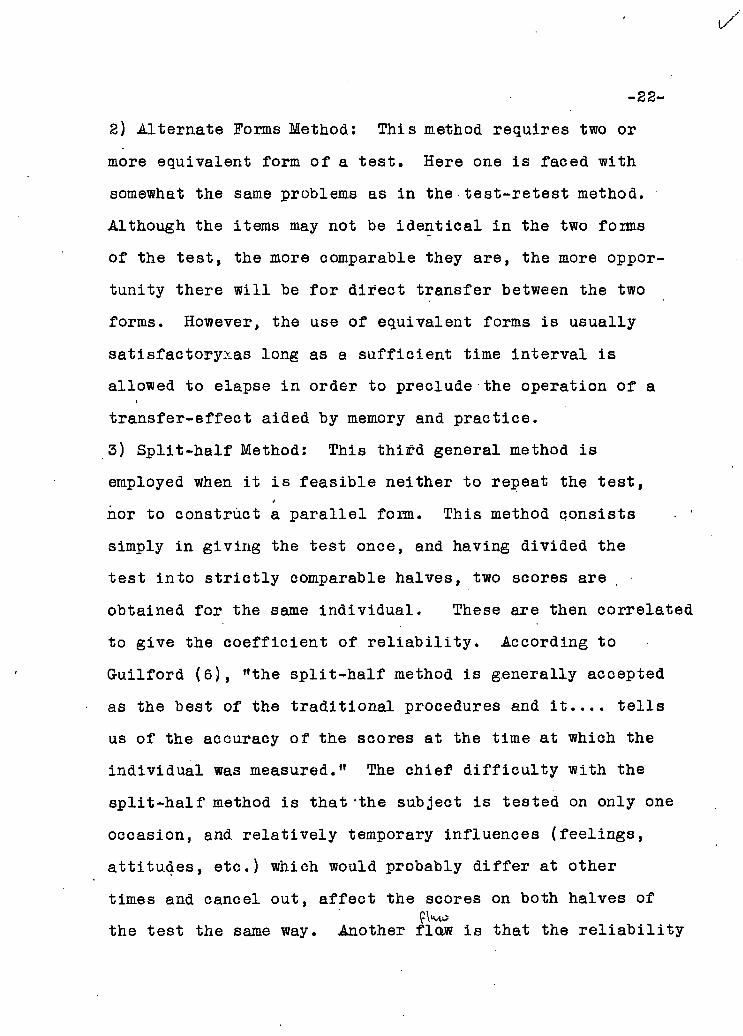
2) Alternate Forms Method: This method requires two or
more equivalent form of a test . Here one i s faced with
somewhat the same problems as i n the t e s t - r e t e s t method.
Although the items may not be i d e n t i c a l i n the two forms
of the test, the more comparable they are, the more oppor
tunity there w i l l be f o r d i r e c t transfer between the two
forms. However, the use of equivalent forms i s usually
satisfactoryxas long as a s u f f i c i e n t time i n t e r v a l i s
allowed to elapse i n order to preclude the operation of a
t r a n s f e r - e f f e c t aided by memory and practice.
3) S p l i t - h a l f Method: This t h i r d general method i s
employed when i t i s f e a s i b l e neither to repeat the t e s t ,
nor to construct a p a r a l l e l form. This method consists
simply i n giving the test once, and having divided the
test into s t r i c t l y comparable halves, two scores are
obtained for the same i n d i v i d u a l . These are then correlated
to give the c o e f f i c i e n t of r e l i a b i l i t y . According to
G u i l f o r d ( 6 ) , "the s p l i t - h a l f method i s generally accepted
as the best of the t r a d i t i o n a l procedures and i t . . . . t e l l s
us of the accuracy of the scores at the time at which the
i n d i v i d u a l was measured." The chief d i f f i c u l t y with the
s p l i t - h a l f method i s that -the subject i s tested on only one
occasion, and r e l a t i v e l y temporary influences (feelings,
a t t i t u d e s , etc.) which would probably d i f f e r at other
times and cancel out, a f f e c t the scores on both halves of
the test the same way. Another flaw i s that the r e l i a b i l i t y
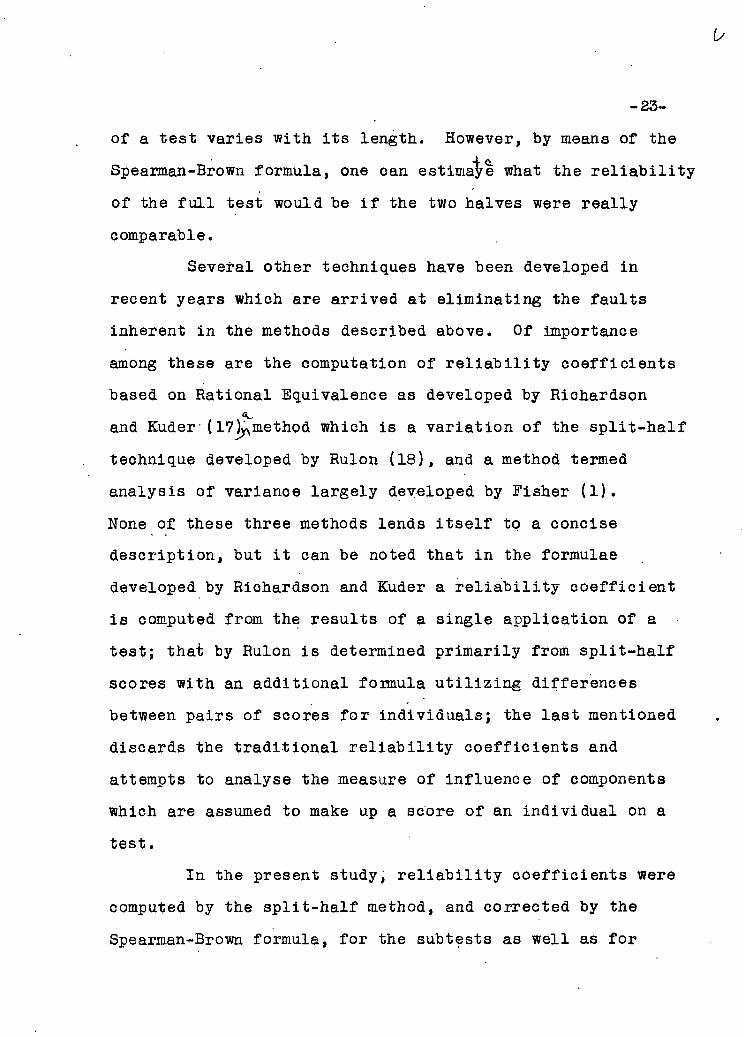
-23-
of a test varies with i t s length. However, by means of the
Spearman-Brown formula, one can estimaye what the r e l i a b i l i t y
of the f u l l test would be i f the two halves were r e a l l y
comparable.
Several other techniques have been developed i n
recent years which are arrived at eliminating the f a u l t s
inherent i n the methods described above. Of Importance
among these are the computation of r e l i a b i l i t y c o e f f i c i e n t s
based on Rational Equivalence as developed by Richardson
and Kuder' (17jyvmethod which i s a v a r i a t i o n of the s p l i t - h a l f
technique developed by Rulon (18), and a method termed
analysis of variance l a r g e l y developed by Fisher (1).
None of these three methods lends i t s e l f to a concise
description, but i t can be noted that i n the formulae
developed by Richardson and Kuder a r e l i a b i l i t y c o e f f i c i e n t
i s computed from the r e s u l t s of a single application of a
test; that by Rulon i s determined primarily from s p l i t - h a l f
scores with an addi t i o n a l formula u t i l i z i n g differences
between pairs of scores f o r individuals; the l a s t mentioned
discards the t r a d i t i o n a l r e l i a b i l i t y c o e f f i c i e n t s and
attempts to analyse the measure of influence of components
which are assumed to make up a score of an i n d i v i d u a l on a
test.
In the present study, r e l i a b i l i t y c o e f f i c i e n t s were
computed by the s p l i t - h a l f method, and corrected by the
Spearman-Brown formula, for the subtests as well as f o r
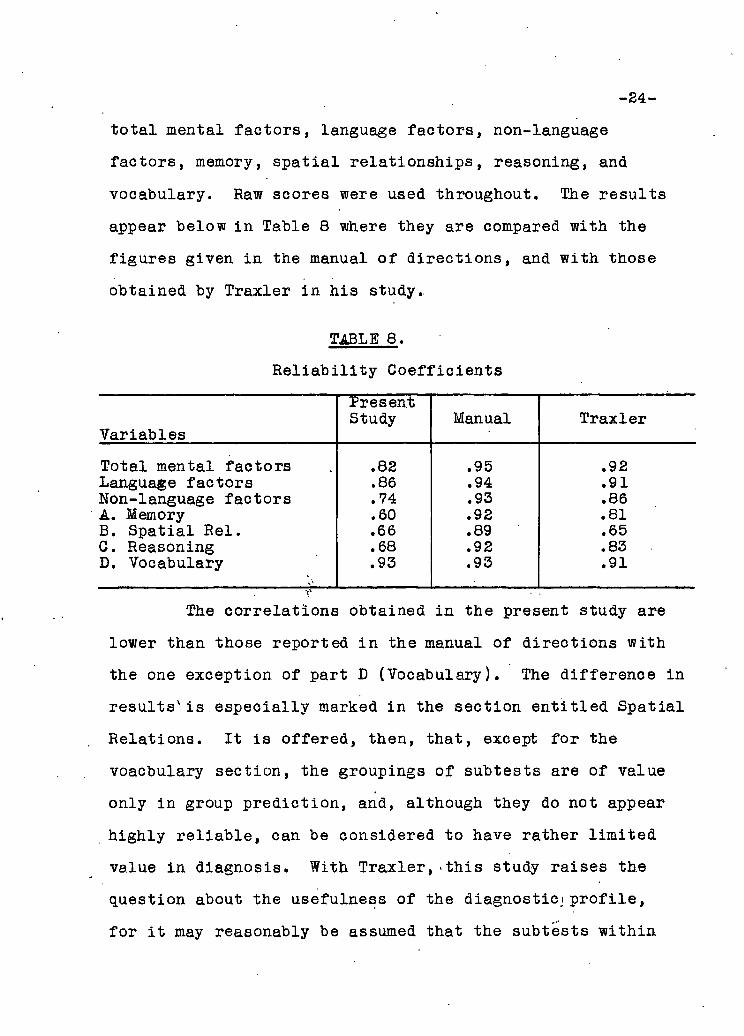
-24-
t o t a l mental factors, language factors, non-language
factors, memory, s p a t i a l r e lationships, reasoning, and
vocabulary. Raw scores were used throughout. The r e s u l t s
appear below i n Table 8 where they are compared with the
figures given i n the manual of dir e c t i o n s , and with those
obtained by Traxler i n hi s study.
TABLE 8.
R e l i a b i l i t y C o e f f i c i e n t s
Variables
Present Study Manual Traxler
Total mental factors .82 .95 .92 Language factors .86 .94 .91 Non-language factors .74 .93 .86 A. Memory .60 .92 .81 B. Spatial Rel. .66 .89 .65 C. Reasoning .68 .92 .83 D. Vocabulary .93 .93 .91
The correlations obtained i n the present study are
lower than those reported i n the manual of directions with
the one exception of part D (Vocabulary). The difference i n
r e s u l t s * i s especially marked i n the section e n t i t l e d S p a t i a l
Relations. It i s offered, then, that, except for the
voacbulary section, the groupings of subtests are of value
only i n group prediction, and, although they do not appear
highly r e l i a b l e , can be considered to have rather l i m i t e d
value i n diagnosis. With Tra x l e r , - t h i s study raises the
question about the usefulness of the d i a g n o s t i c ^ p r o f i l e ,
for i t may reasonably be assumed that the subtests within
-25-
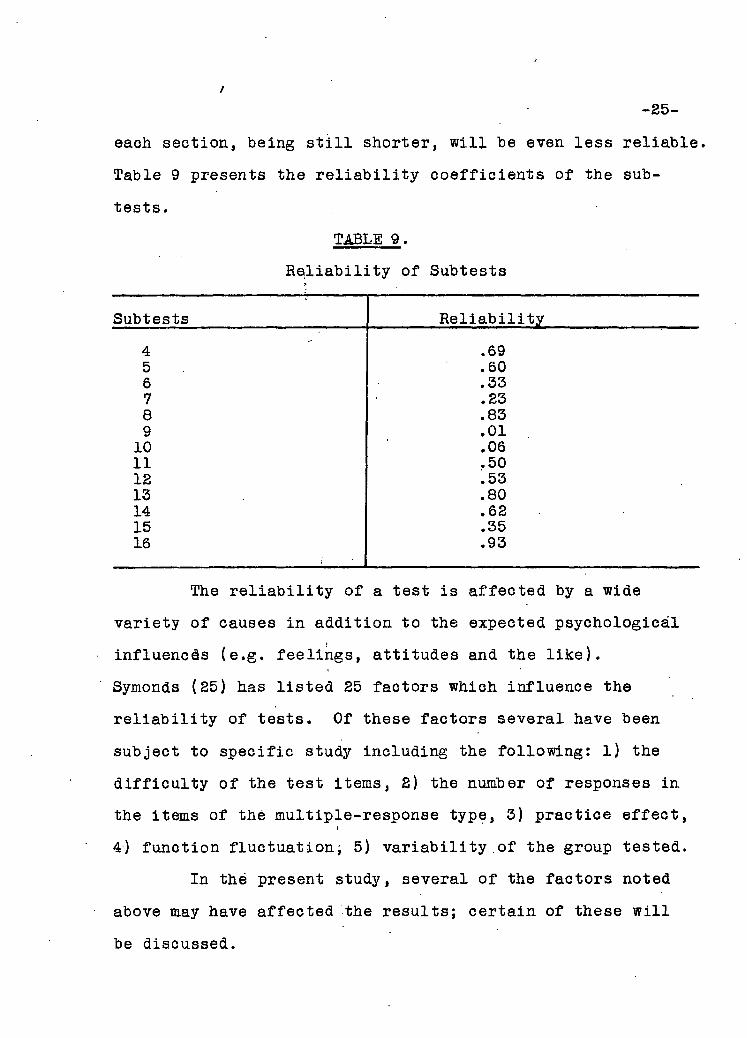
each section, being s t i l l shorter, w i l l be even l e s s r e l i a b l e .
Table 9 presents the r e l i a b i l i t y c o e f f i c i e n t s of the sub
tests.
TABLE 9.
R e l i a b i l i t y of Subtests
Subtests R e l i a b i l i t y
4 .69 5 .60 6 .33 7 .23 8 .83 9 .01 10 .06 11 .50 12 .53 13 .80 14 .62 15 .35 16 .93
The r e l i a b i l i t y of a test i s affected by a wide
variety of causes i n addition to the expected psychological
influences (e.g. fee l i n g s , attitudes and the l i k e ) .
Symonds (25) has l i s t e d 25 factors which influence the
r e l i a b i l i t y of tests. Of these factors several have been
subject to s p e c i f i c study including the following: l ) the
d i f f i c u l t y of the test items, 2) the number of responses i n
the items of the multiple-response type, 3) practice e f f e c t ,
4) function f l u c t u a t i o n ; 5) v a r i a b i l i t y . o f the group tested.
In the present study, several of the factors noted
above may have affected the re s u l t s ; c e r t a i n of these w i l l
be discussed.
-26-
1. Influence of V a r i a b i l i t y of the Group tested: It i s a
well-accepted fact that the correlations between two v a r i a
bles are smaller when based upon scores obtained from
homogeneous groups. Thus Vernon (32) notes i n t h i s
connection, "one important reason why i n t e l l i g e n c e tests
appear to be of mutJh less value for predicting scholastic
aptitude among secondary than among primary school pu p i l s ,
and to be poorer s t i l l among university students, i s that
secondary pupils are more homogeneous, or more highly
selected than primary correlations necessarily sink
as we pass from the unselected children to the primary
school, from, the primary to the secondary, and from the
secondary to the university l e v e l . "
2. Item D i f f i c u l t y : Symonds (24) and Thurstone (28) have
presented convincing arguments to show that a test made up
of items of .5 d i f f i c u l t y value measured an i n d i v i d u a l most
accurately, and that the best test was made up of items that
could be answered with 50 percent accuracy by the average
i n d i v i d u a l . Also, the diagnostic value of a t e s t , and i t s
r e l i a b i l i t y , are a maximum, when the items are about 50
percent d i f f i c u l t y . The diagnostic value was found to
decrease when the items departed from t h i s 50 percent l e v e l .
3. Range of Scores: Closely connected to the f a c t o r of
homogeneity i s that of the e f f e c t i v e range of scores on each
subtest.
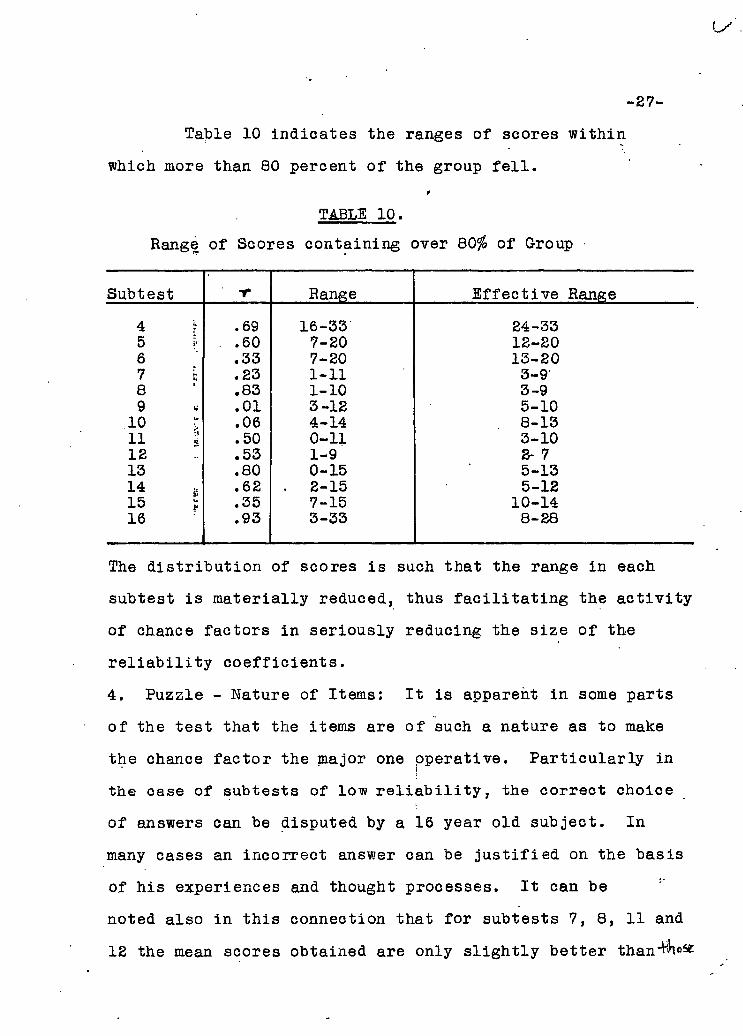
-27-
Table 10 indicates the ranges of scores within
which more than 80 percent of the group f e l l .
TABLE 10. Range of Scores containing over 80% of Group
Subtest T Range E f f e c t i v e Range
4 L .69 16-33' 24-33 5 ? . .60 7-20 12-20 6 .33 7-20 13-20 7 .23 1-11 3-9 8 .83 1-10 3-9 9 .01 3-12 5-10
10 .06 4-14 8-13 11 .50 0-11 3-10 12 .53 1-9 2- 7 13 .80 0-15 5-13 14 .62 2-15 5-12 15 u .35 7-15 10-14 16 .93 3-33 8-28
The d i s t r i b u t i o n of scores i s such that the range i n each
subtest i s materially reduced, thus f a c i l i t a t i n g the a c t i v i t y
of chance factors i n seriously reducing the siz e of the
r e l i a b i l i t y c o e f f i c i e n t s .
4. Puzzle - Nature of Items: I t i s apparent i n some parts
of the test that the items are of such a nature as to make
the chance fac t o r the major one operative. P a r t i c u l a r l y in
the case of subtests of low r e l i a b i l i t y , the correct choice
of answers can be disputed by a 16 year old subject. In
many cases an incorrect answer can be j u s t i f i e d on the basis
of h i s experiences and thought processes. It can be
noted also i n t h i s connection that for subtests 7, 8, 11 and
12 the mean scores obtained are only s l i g h t l y better than^ H o ^
-28-to be expected by chance, thus in d i c a t i n g that the problems
passed were not a l l of a type lending themselves to l o g i c a l
solution.
-29-
' CHAPTER V.
VALIDITY
"The most important, the all-important c h a r a c t e r i s t i c
of any test i s i t s v a l i d i t y . " (12:),. The v a l i d i t y of
a test depends upon the effectiveness with which i t measures
that which i t i s intended to measure, or upon the e f f e c t i v e
ness with which i t accomplishes the purpose i t i s intended
to accomplish. Although one may not be able to define with
confidence just what i t does measure, i n the case of a
v a l i d test, one can be sure that i t measures something
ind i c a t i v e of success or f a i l u r e . An i n t e l l i g e n c e test
claims to measure i n t e l l i g e n c e , and therefore i t should
measure t h i s factor or combination of factors, and the
authenticity of a test depends, i n t u r n , not on any
t h e o r e t i c a l analysis, but upon i t s relationship to a
c r i t e r i o n .
One of the most d i f f i c u l t of a l l aspects of the
v a l i d i t y problem i s that of obtaining adequate c r i t e r i a of
what we are measuring, and, i f we are dealing with
i n t e l l i g e n c e t e s t s , the intention i s almost invariably
success i n the performance of i n t e l l e c t u a l tasks as
exemplified by achievement in school. Hence the test
measures simply i n that i t predicts performance at such
tasks, and from a quantitative viewpoint, a high c o r r e l a t i o n
between a test and i t s c r i t e r i o n may be taken as evidence
-30-
of v a l i d i t y , provided both the test and i t s c r i t e r i o n are
r e l i a b l e . As Gui l f o r d points out "From a pra c t i c a l ' stand
point, the v a l i d i t y of a test i s i t s forecasting e f f i c i e n c y
i n any measurable aspect of our d a i l y l i v i n g . " (7)
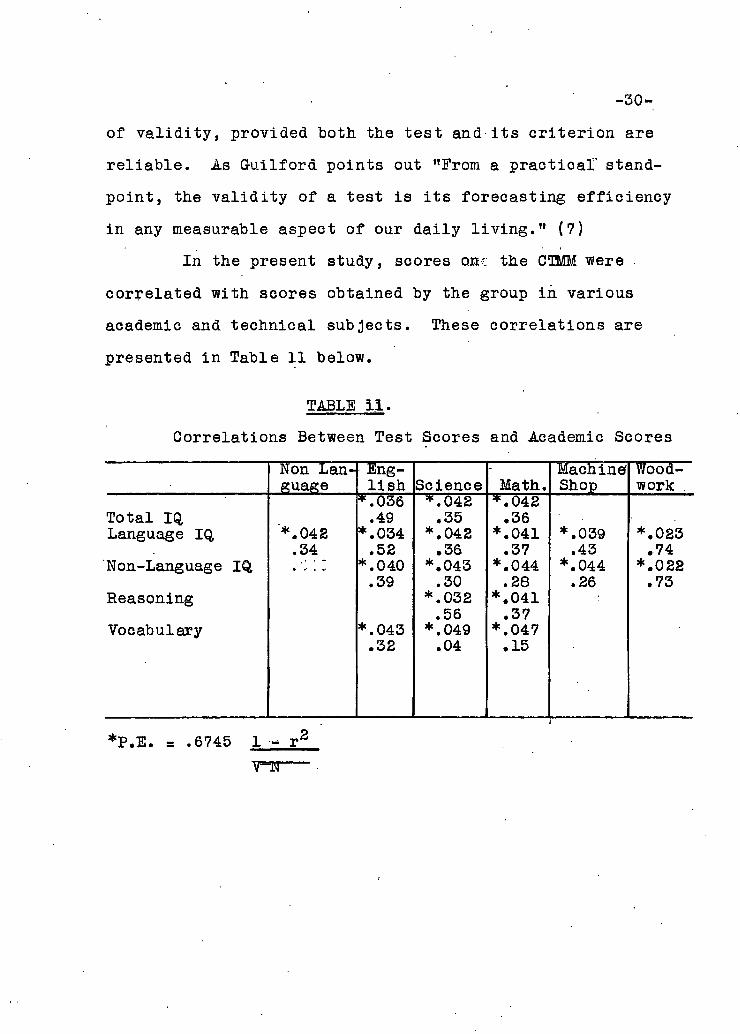
In the present study, scores one the CTMM were
correlated with scores obtained by the group i n various
academic and technical subjects. These correlations are
presented i n Table 11 below.
TABLE 11.
Correlations Between Test Scores and Academic Scores
Non Lan Eng - Machine' Woodguage l i s h Science Math. Shop work
*.036 *.042 *.042 Total IQ, .49 .35 .36 Language IQ *.042 *.034 *.042 *.041 *.039 *.023 Language IQ
.34 .52 .36 .37 .43 .74 Non-Language IQ *.040 *.043 *.044 *.044 *.022
.39 .30 .28 .26 .73 Reasoning *.032 *.041 Reasoning
.56 .37 "Vocabulary *.043 *.049 *.047 "Vocabulary
.32 .04 .15
*P.E. = .6745 1 - r 2
VTT
-31-
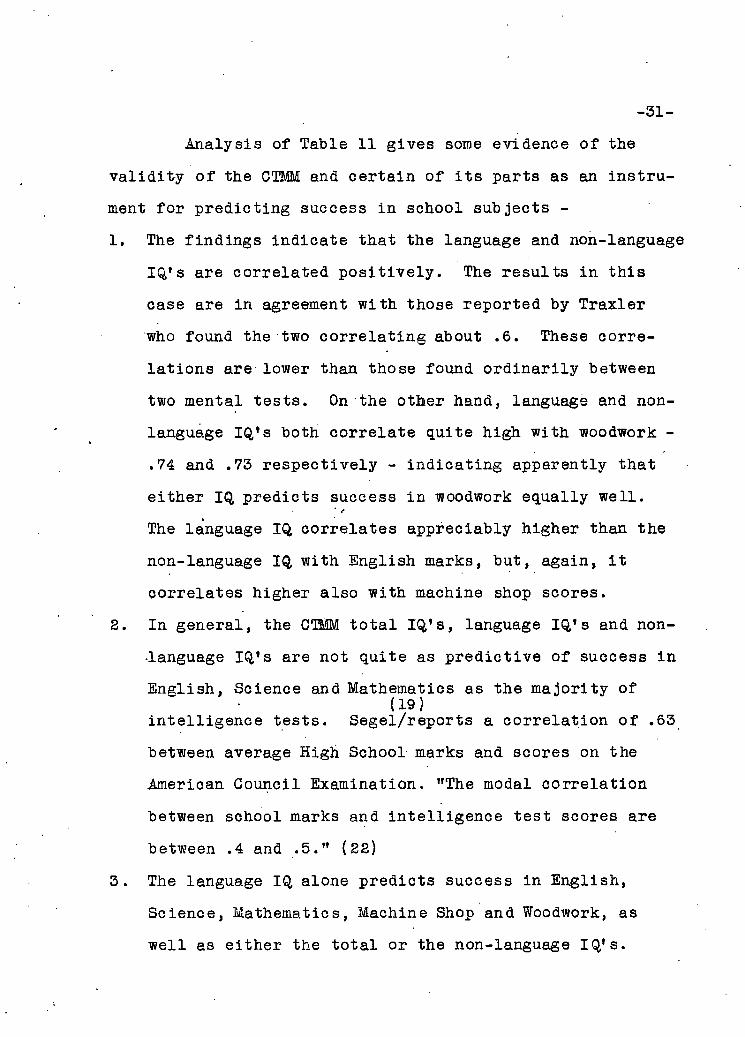
Analysis of Table 11 gives some evidence of the
v a l i d i t y of the CTMM and certain of i t s parts as an i n s t r u
ment for predicting success i n school subjects -
1. The findings indicate that the language and non-language
IQ's are correlated p o s i t i v e l y . The r e s u l t s i n t h i s
case are i n agreement with those reported by Traxler
who found the two c o r r e l a t i n g about .6. These corre
l a t i o n s are lower than those found o r d i n a r i l y between
two mental tests. On the other hand, language and non-
language IQ's both correlate quite high with woodwork -
.74 and .73 respectively - indi c a t i n g apparently that
either IQ predicts success i n woodwork equally well.
The language IQ correlates appreciably higher than the
non-language IQ with English marks, but, again, i t
correlates higher also with machine shop scores.
2. In general, the CTMM t o t a l IQ's, language IQ's and non-
language IQ's are not quite as pred i c t i v e of success i n
English, Science and Mathematics as the majority of (19)
i n t e l l i g e n c e tests. Segel/reports a co r r e l a t i o n of .63
between average High School marks and scores on the
American Council Examination. "The modal c o r r e l a t i o n
between school marks and i n t e l l i g e n c e test scores are
between .4 and .5." (22)
3. The language IQ alone predicts success i n English,
Science, Mathematics, Machine Shop and Woodwork, as
well as either the t o t a l or the non-language IQ's.
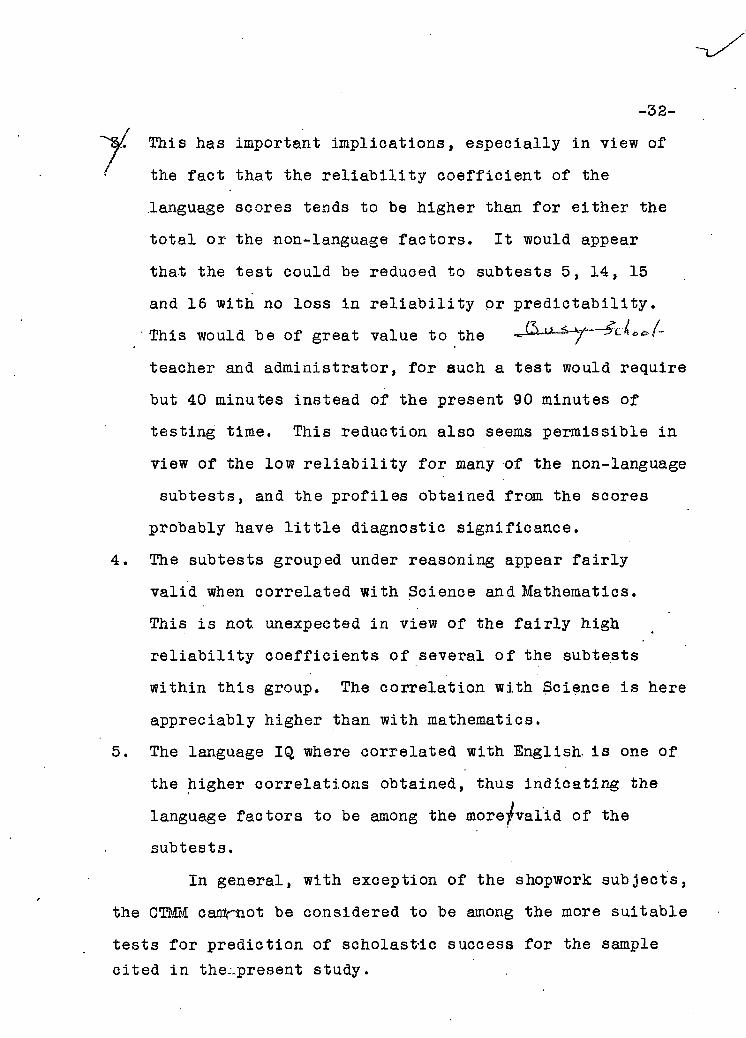
-32-
This has important implications, especially i n view of
the fact that the r e l i a b i l i t y c o e f f i c i e n t of the
language scores tends to be higher than for either the
t o t a l or the non-language factors. It would appear
that the test could be reduced to subtests 5, 14, 15
and 16 with no loss i n r e l i a b i l i t y or p r e d i c t a b i l i t y .
This would be of great value to the JXu-^y~~^ci»ot~
teacher and administrator, for auch a test would require
but 40 minutes instead of the present 90 minutes of
testing time. This reduction also seems permissible i n
view of the low r e l i a b i l i t y f o r many of the non-language
subtests, and the p r o f i l e s obtained from the scores
probably have l i t t l e diagnostic s i g n i f i c a n c e .
4. The subtests grouped under reasoning appear f a i r l y
v a l i d when correlated with Science and Mathematics.
This i s not. unexpected i n view of the f a i r l y high
r e l i a b i l i t y c o e f f i c i e n t s of several of the subtests
within t h i s group. The c o r r e l a t i o n with Science i s here
appreciably higher than with mathematics.
5. The language IQ, where correlated with English, i s one of
the higher correlations obtained, thus in d i c a t i n g the
language factors to be among the more-/valid of the
subtests.
In general, with exception of the shopwork subjects,
the CTMM canty-not be considered to be among the more suitable
tests f o r prediction of scholastic success for the sample cited i n the-.present study.
-33-
CEAPTER VI.
CLUSTER ANALYSIS
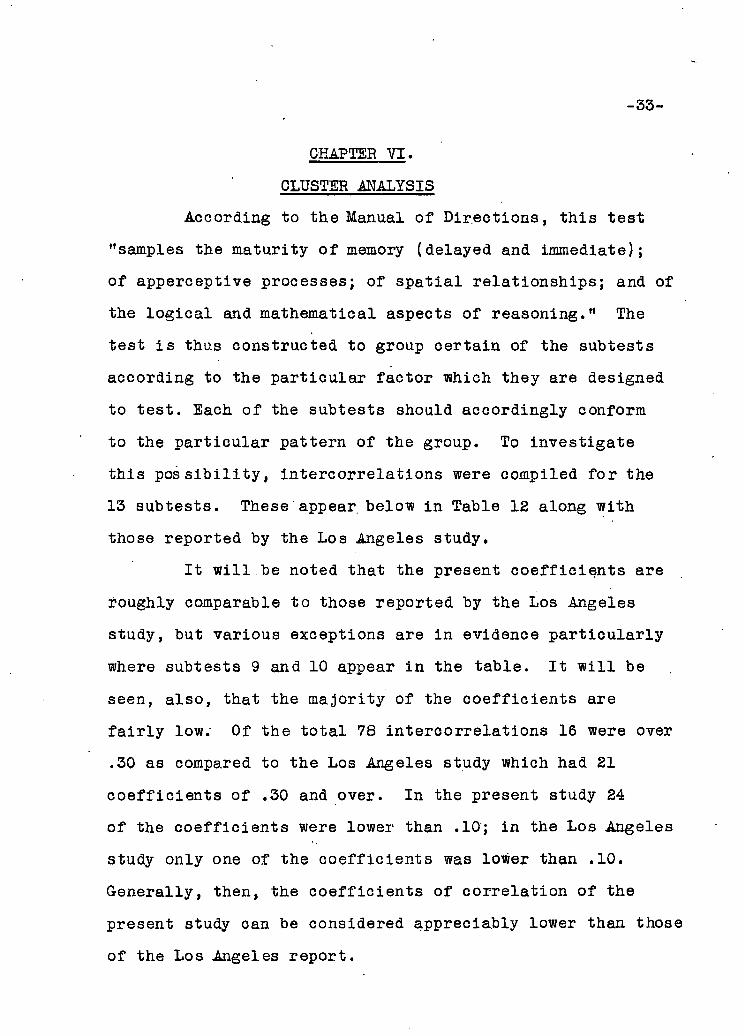
According to the Manual of Directions, t h i s test
"samples the maturity of memory (delayed and immediate);
of apperceptive processes; of s p a t i a l relationships; and of
the l o g i c a l and mathematical aspects of reasoning." The
test i s thus constructed to group certain of the subtests
according to the p a r t i c u l a r factor which they are designed
to test. Each of the subtests should accordingly conform
to the p a r t i c u l a r pattern of the group. To investigate
this p o s s i b i l i t y , i n t e r c o r r e l a t i o n s were compiled f o r the
13 subtests. These appear below i n Table 12 along with
those reported by the Los Angeles study.
It w i l l be noted that the present c o e f f i c i e n t s are
roughly comparable to those reported by the Los Angeles
study, but various exceptions are i n evidence p a r t i c u l a r l y
where subtests 9 and 10 appear i n the table. I t w i l l be
seen, also, that the majority of the c o e f f i c i e n t s are
f a i r l y low; Of the t o t a l 78 i n t e r c o r r e l a t i o n s 16 were over
.30 as compared to the Los Angeles study which had 21
c o e f f i c i e n t s of .30 and over. In the present study 24
of the c o e f f i c i e n t s were lower than .10; i n the Los Angeles
study only one of the c o e f f i c i e n t s was lower than .10.
Generally, then, the c o e f f i c i e n t s of c o r r e l a t i o n of the
present study can be considered appreciably lower than those
of the Los Angeles report.
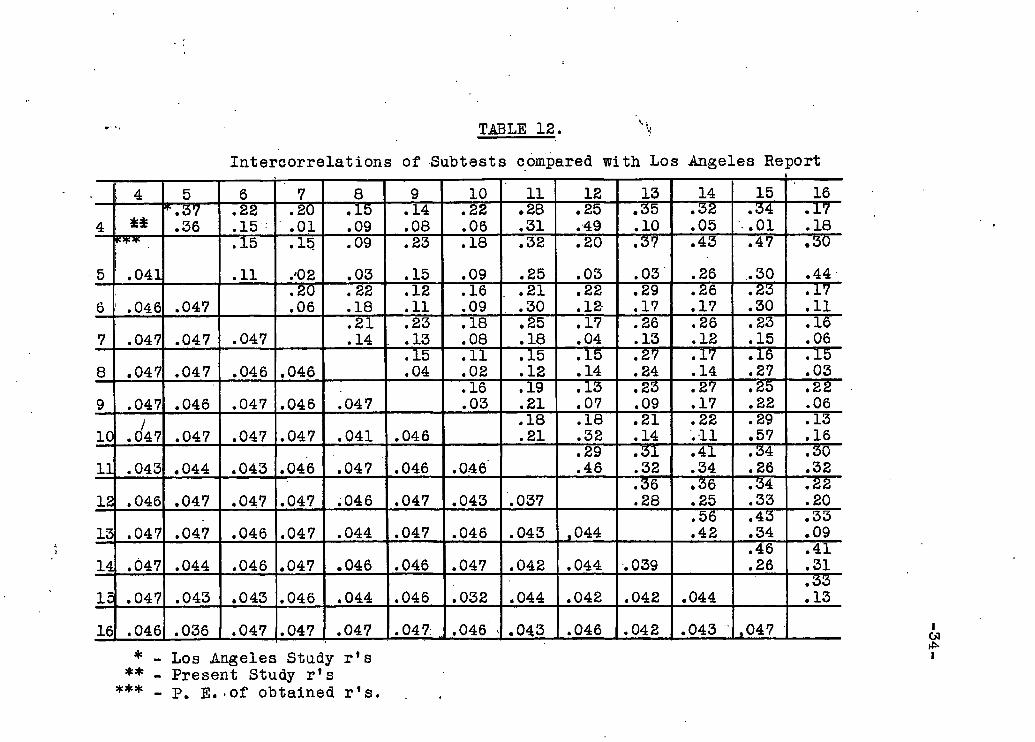
TABLE 12.
Intercorrelations of Subtests compared with Los Angeles Report
. 4 5 6 7 8 9 10 11 12 13 14 15 16
4 ** .36 .22 .15
.20
.01 .15 .09
.14
.08 .22 .06
.28
.31 .25 .49
.35
.10 .32 .05
.34 • .01
.1?
.18 .15 .15 .09 .23 .18 .32 .20 .37 .43 .47 .30
5 .041 .11 .'02 .03 .15 .09 .25 .03 .03 .26 .30 .44
6 .046 .047 .20 .06
.22
.18 .12 .11
.16
.09 .21 .30
.22
.12-.29 .17
.26
.17 .23 .30
.17
.11
7 .047 .047 .047 .21 .14
.23 . .13
.18
.08 .25 .18
.17
.04 .26 .13
.26
.12 .23 .15
.16
.06
8 .047 .047 .046 .046 .15 .04
.11
.02 .15 .12
.15
.14 .27 .24
.17
.14 .16 .27
.15
.03
9 .047 .046 .047 .046 .047 .16 .03
.19
.21 .13 .07
.23
.09 .27 .17
.25
.22 .22 .06
10 1 .047 .047 .047 .047 .041 .046
.18
.21 .18 .32
.21
.14 .22 .11
.29
.57 .13 .16
11 .043 .044 .043 .046 .047 .046 .046 .29 .46
.31
.32 .41 .34
.34
.26 .30 .32
12 .046 .047 .047 .047 .046 ,047 ,043 .037 .36 .28
.36
.25 .34 .33
.22
.20
13 .047 .047 .046 .047 .044 .047 .046 .043 ,044 .56 .42
.43
.34 .33 .09
14 .047 .044 .046 .047 .046 .046 .047 .042 .044 .039 .46 .26
.41
.31
15 .047 .043 .043 .046 .044 .046 .032 .044 .042 .042 .044 .33 .13
16 .046 .036 .047 .047 .047 .047 .046 v .043 .046 .042 .043 ,047 * - Los Angeles Study r's
** - Present Study r's ** - P. E.-of obtained r's.
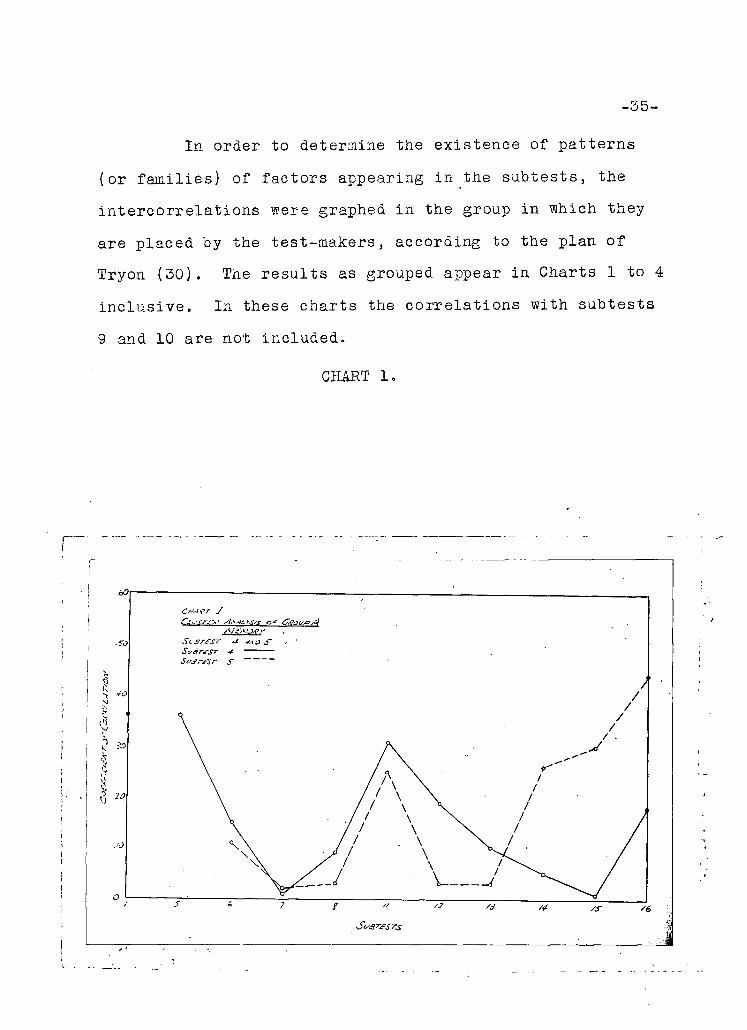
In o r d e r to determine the e x i s t e n c e of p a t t e r n s
(or f a m i l i e s ) of f a c t o r s a p p e a r i n g i n the s u b t e s t s , the
i n t e r c o r r e l a t i o n s were graphed i n the group i n which they
are p l a c e d by the t e s t - m a k e r s , a c c o r d i n g to the p l a n o f
T r y o n (30) . The r e s u l t s as grouped appear i n C h a r t s 1 to 4
i n c l u s i v e . In these c h a r t s the c o r r e l a t i o n s w i th s u b t e s t s
9 and 10 are not i n c l u d e d .
CHART 1.
-36-
1. Group A (Memory) c o n s i s t s of s u b t e s t s 4 and 5. I t w i l l be
seen that the two s u b t e s t s tend to a s i m i l a r p a t t e r n , p a r
t i c u l a r l y when they are c o r r e l a t e d w i t h s u b t e s t s 6, 7, 8, 11 ,
12 and 13. On the b a s i s of the p a t t e r n e l i c i t e d , the two
s u b t e s t s forming t h i s group can be c o n s i d e r e d as d i s t i n c t l y
r e l a t e d with r e s p e c t to the above-ment ioned t e s t s , but show
l i t t l e tendency to c o a l e s c e where c o r r e l a t e d w i t h s u b t e s t s
14, 15 and 16. In the l a t t e r c a s e , the tendency i s o p p o s i t e
to that e x h i b i t e d i n the f i r s t 5 i n t e r c o r r e l a t i o n s . T h i s
p a t t e r n was a l s o found when c o r r e l a t i o n s were c o r r e c t e d f o r
a l t e r a t i o n s .
- 3 7 -
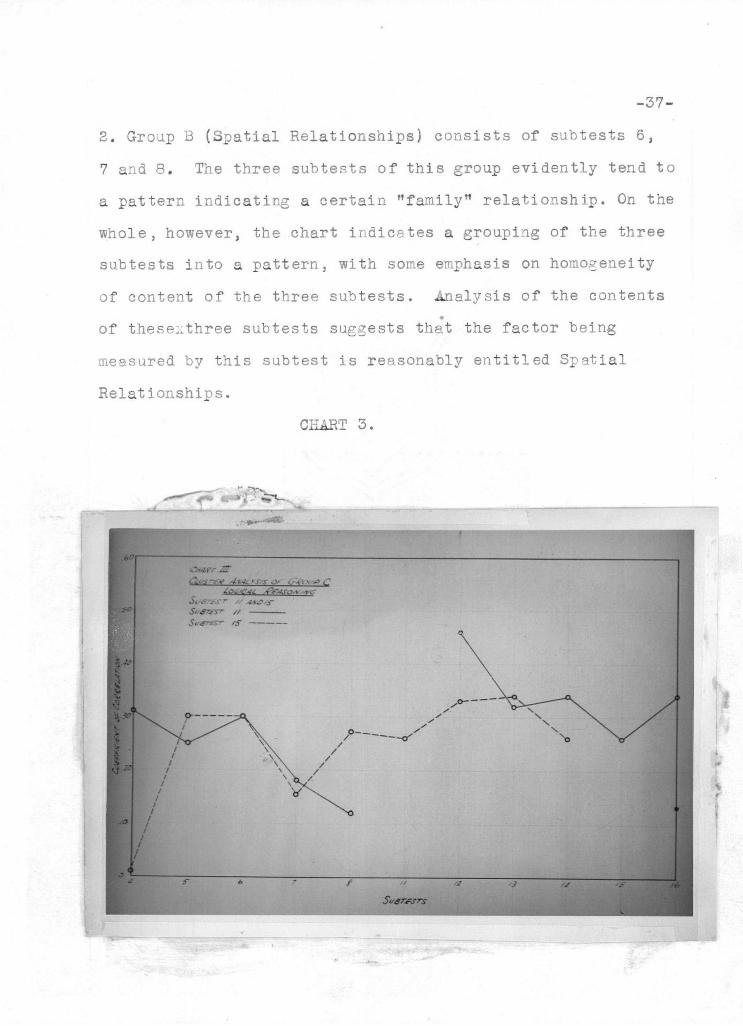
2. Group B ( S p a t i a l R e l a t i o n s h i p s ) c o n s i s t s of s u b t e s t s 6,
7 and 8. The t h r e e s u b t e s t s o f t h i s group e v i d e n t l y tend t o
a p a t t e r n i n d i c a t i n g a c e r t a i n " f a m i l y " r e l a t i o n s h i p . On the
w h o l e , however, the c h a r t i n d i c a t e s a g r o u p i n g of the t h r e e
s u b t e s t s i n t o a p a t t e r n , w i t h some emphasis on homogeneity
of content o f the t h r e e s u b t e s t s . A n a l y s i s o f the c o n t e n t s
of these::three s u b t e s t s suggests tha t the f a c t o r be ing
measured by t h i s s u b t e s t i s r e a s o n a b l y e n t i t l e d S p a t i a l
R e l a t i o n s h i p s .
CHART 3.
- 3 8 -
3. Group C i s composed o f t e s t s 9, 10, 11 and 15 and i s
l a b e l l e d l o g i c a l r e a s o n i n g . In the present s t u d y , the
low r e l i a b i l i t y c o e f f i c i e n t s of s u b t e s t s 9 and 10 d i d not
j u s t i f y t h e i r . i n c l u s i o n i n t h i s c l u s t e r a n a l y s i s ,
and o n l y s u b t e s t s 11 and 15 are p r e s e n t e d i n C h a r t 3,
I t w i l l be seen tha t these two subte s t s do not presen t an
immediate ly obv ious p a t t e r n i n g . However, when c o r r e l a t e d
w i t h s u b t e s t s 5, 6 and 7, a r e l a t i o n s h i p i s observed - a
much c l o s e r and more e v i d e n t p a t t e r n than that w i t h 4, 12,
14 and 16. E v i d e n t l y , the p a t t e r n i s e l i c i t e d on ly i n
s u b t e s t s 5, 6 and 7.
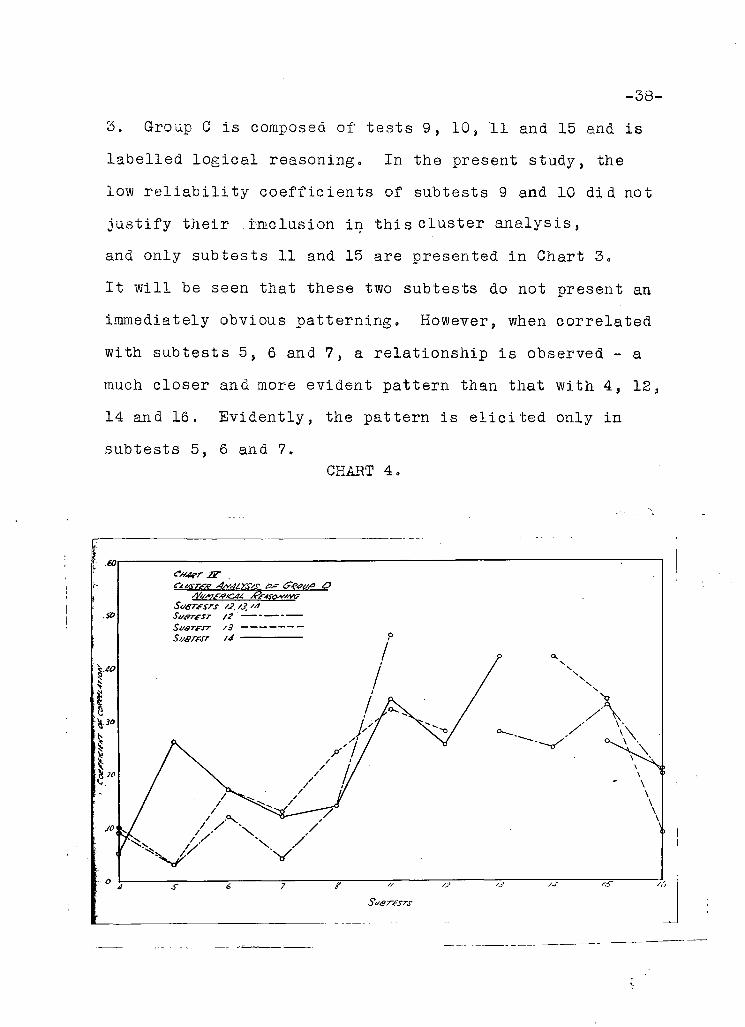
CHART 4.
-39
4. Group D consists of subtests 12, 13 and 14 and i s termed
numerical reasoning. A certain homogeneity i s not unexpected,
and Chart 4 indicates that a "family" relationship exists
f o r the three subtests when they are correlated with
subtests 4, 6, 7, 8, 9, 15 and 16. A pattern i s not i n
evidence when the remaining i n t e r c o r r e l a t i o n s are considered.
5. The p r o f i l e of correlations of subtest 16 does not f i t
into any of the above c l u s t e r s , and so i s to be considered
a r e s i d u a l , measuring some factors other than those included
in the above fam i l i e s .
-40-
CHAPTER VII.
SUMMARY AND CONCLUSIONS
Modern practice i n respect to mental measurement i s
characterized by a growing-allegiance to the implements of
the science coupled with an unfortunate tendency to neglect
the proper investigation of the implements i n use. Thus a
test i s published, u t i l i z e d by many, and c r i t i c i s e d without
the empirical investigations necessary for i t s proper
assessment. The present study investigates the C a l i f o r n i a
Test of Mental Maturity, Advanced Battery, i n an attempt at
such an assessment.
The test was given to 195 students of the Vancouver
Technical School with a view to determining i t s value f o r
predicting scholastic achievement. The study was divided
into analysis of r e l i a b i l i t y , v a l i d i t y , and p r i n c i p l e s
underlying test construction. These three main d i v i s i o n s
were further subdivided ini '. order to answer: questions
r e l a t i n g to 1) the l e v e l and range of d i f f i c u l t y of the
ind i v i d u a l items of the tests, the order of d i f f i c u l t y of
items, the d i f f i c u l t y of the various subtests, the extent
to which the in d i v i d u a l items d i f f e r e n t i a t e d between
i n f e r i o r and'superior students; 2) the r e l i a b i l i t y of the
scores for the subtests and f o r the language and non-language
factors; 3) the v a l i d i t y of various d i v i s i o n s of the tests
when correlated with academic and Technical shopwork subjects,
V"
-41-
and 4) the extent to which the test f a l l s into the patterns
suggested by the test-makers.
The re s u l t s as obtained i n the study indicate that,
for the sample employed, the l e v e l of d i f f i c u l t y of the
items was not that generally considered as conducive to
maximum r e l i a b i l i t y and diagnosis. The same was true for
the general l e v e l of d i f f i c u l t y of the subtests. On the
basis of correlations computed between obtained order and
test order of d i f f i c u l t y , and on the basis of percentages of
students attempting a l l items i n a subtest, i t was adduced
that the test was neither a power nor a speed t e s t , but a
composite of the two. The a b i l i t y of the items to discriminate
between i n f e r i o r and superior groups of students was l e f t
seriously i n doubt as a result of the computation of an
index of discrimination for two of the subtests of low
r e l i a b i l i t y .
R e l i a b i l i t y c o e f f i c i e n t s were computed f o r the •
subtests. These were f&r lower than those recorded i n the
manual of directi o n s , and, except i n the case of the
Vocabulary section of the tes t , were not even roughly
comparable. Certain factors influencing test r e l i a b i l i t y ,
such as the v a r i a b i l i t y of the group tested, the item
d i f f i c u l t y , the narrow range of scores, and the puzzle
nature of some of the items were considered as constituting
to the low c o e f f i c i e n t s obtained.
-42-
Several of the test scores were correlated with
academic and technical school marks. The re s u l t s indicate
that the part of the test measuring language factors was
more v a l i d and r e l i a b l e than either the test as a whole or
the non-language factors f o r predicting success i n academic
and shopwork..subjects.
The groups of subtests comprising 'memory',
's p a t i a l r e l a t i o n s h i p s ' , and 'numerical reasoning' appeared
to f a l l into three c l u s t e r s : The subtests contained i n the
' l o g i c a l reasoning' group do not i l l u s t r a t e any p a r t i c u l a r
tendency to f a l l into a pattern.
On the basis of the analysis ca r r i e d out i n the
present study, major discrepancies appear between the data
here reported and sim i l a r data reported i n the manual of
dire c t i o n s . The manual i s deficient i n not reporting the
results of any item analysis, any statement on l e v e l of
d i f f i c u l t y of items and nor are the r e l i a b i l i t y c o e f f i c i e n t s
included i n the data. In terms of the recommendation made
by Ferguson and Jackson (14), there are many gaps in the
manual directions for the CTMM. In general, i t appears
that the test i s not p a r t i c u l a r l y suitable i n the Technical
High School. Further analysis i s necessary to determine
i t s value elsewhere.
-43-
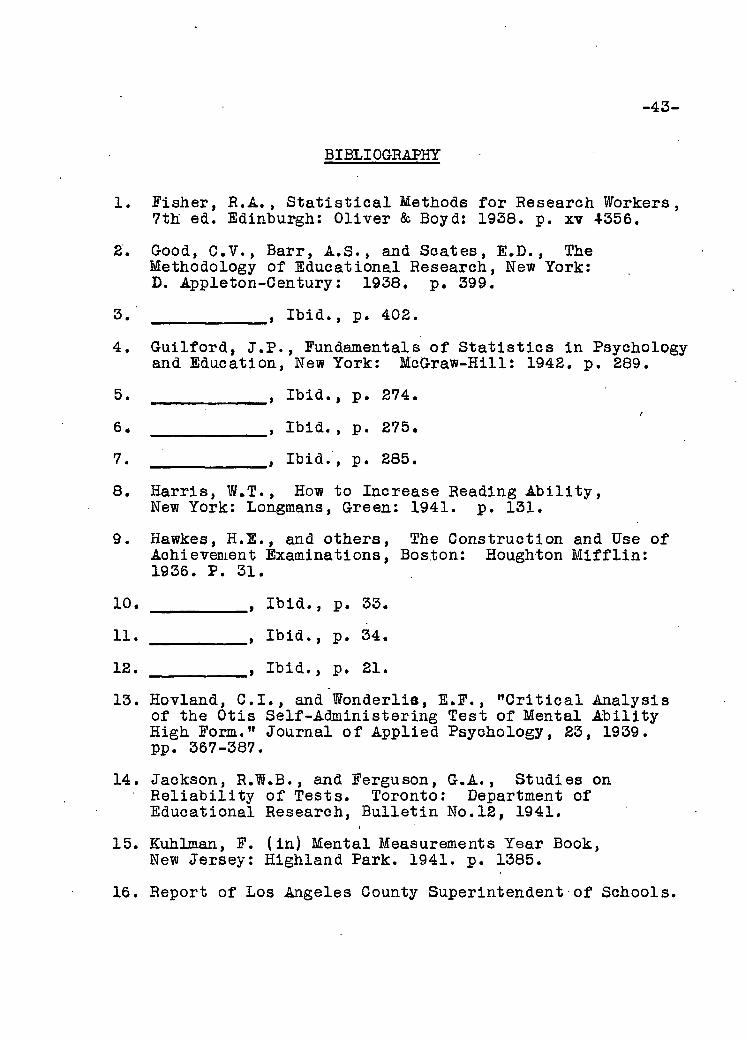
BIBLIOGRAPHT
1, Fisher, R.A. , S t a t i s t i c a l Methods for Research Workers, 7th ed. Edinburgh: Oliver & Boyd: 1938. p. xv 4356.
2. Good, C.V., Barr, A.S., and Scates, E.D., The Methodology of Educational Research, New York: D. Appleton-Century: 1938. p. 399.
3. , Ibid., p. 402.
4. Gu i l f o r d , J.P., Fundamentals of S t a t i s t i c s i n Psychology and Education, New York: McGraw-Hill: 1942. p. 289.
5. Ibid., p. 274.
6. , Ibid., p. 275.
7. , Ibid., p. 285.
8. Harris, W.T., How to Increase Reading A b i l i t y , New York: Longmans, Green: 1941. p. 131.
9. Hawkes, H.E., and others, The Construction and Use of Achievement Examinations, Boston: Houghton M i f f l i n : 1936. P. 31.
10. , Ibid., p. 33.
11. , Ibid., p. 34.
12. w , Ibid., p. 21.
13. Hovland, C.I., and Wonderlis, E.F., " C r i t i c a l Analysis of the Otis Self-Administering Test of Mental A b i l i t y High Form." Journal of Applied Psychology, 23, 1939. pp. 367-387.
14. Jackson, R.W.B., and Ferguson, G.A., Studies on R e l i a b i l i t y of Tests. Toronto: Department of Educational Research, B u l l e t i n No.12, 1941.
15. Kuhlman, F. (in) Mental Measurements Year Book, New Jersey: Highland Park. 1941. p. 1385.
16. Report of Los Angeles County Superintendent of Schools.
-44-
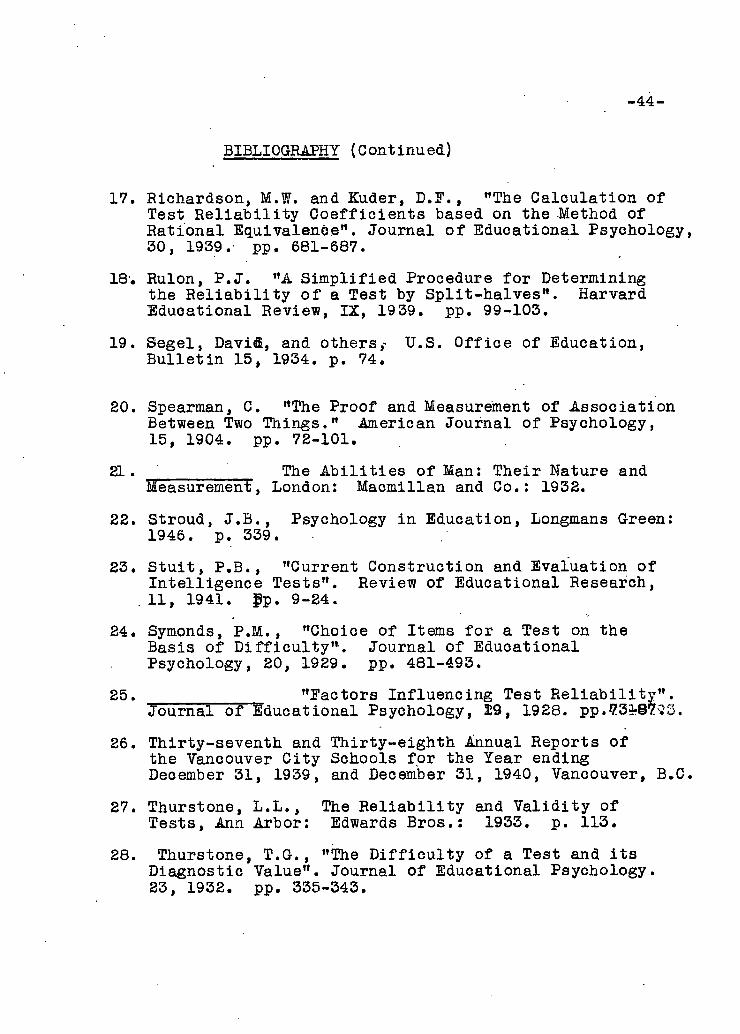
BIBLIOGRAPHY (Continued)
17. Richardson, M . W . and Kuder, D.F., "The Calculation of Test R e l i a b i l i t y C o e f f i c i e n t s based on the Method of Rational Equivalence". Journal of Educational Psychology, 30, 1939. pp. 681-687.
18'. Rulon, P.J. "A Simp l i f i e d Procedure for Determining the R e l i a b i l i t y of a Test by Spli t - h a l v e s " . Harvard Educational Review, IX, 19 39. pp. 99-103.
19. Segel, Davi«fc, and others,- U.S. Of f i c e of Education, B u l l e t i n 15, 1934. p. 74.
SO. Spearman, C. "The Proof and Measurement of Association Between Two Things." American Journal of Psychology, 15, 1904. pp. 72-101.
21. The A b i l i t i e s of Man: Their Nature and Measurement, London: Macmillan and Co.: 1932.
22. Stroud, J.B., Psychology i n Education, Longmans Green: 1946. p. 339.
23. S t u i t , P.B., "Current Construction and Evaluation of Intelligence Tests". Review of Educational Research,
. 11, 1941. gp. 9-24. 24. Symonds, P.M., "Choice of Items f o r a Test on the
Basis of D i f f i c u l t y * 1 . Journal of Educational Psychology, 20, 1929. pp. 481-493.
25. "Factors Influencing Test R e l i a b i l i t y " . Journal of Educational Psychology, 29, 1928. pp.-73*87?3.
26. Thirty-seventh and Thirty-eighth Annual Reports of the Vancouver City Schools for the Year ending December 31, 1939, and December 31, 1940, Vancouver, B.C.
27. Thurstone, L.L., The R e l i a b i l i t y and V a l i d i t y of Tests, Ann Arbor: Edwards Bros.: 1933. p. 113.
28. Thurstone, T.G., "The D i f f i c u l t y of a Test and i t s Diagnostic Value". Journal of Educational Psychology. 23, 1932. pp. 335-343.
-45-
BIBLIOGRAPHY (Continued)
29. Traxler, A.E., "Study of the C a l i f o r n i a Test of Mental Maturity: Advanced Battery". Journal of Educational Research, 32, 1939. pp. 329-335.
30. Tryon, R.C., Cluster Analysis. Berkeley, C a l i f o r n i a : , Associated Students Store: University of C a l i f o r n i a :
1939.
31. Tyler, F.T., "Analysis of the Terman-MoNemar Tests of Mental A b i l i t y " . Educational and Psychological Measurement, 5, 194 5. pp. 49-58.
32. Vernon, P.J., The Measurement of A b i l i t i e s , London: University of London Press: 1940. p. 141.
33. Warren, H.C., Dictionary of Psychology.