Embed Size (px)
Citation preview
i
AN ANALYSIS OF LAND USE POTENTIAL IN ARID AND SEMI-ARID
AREAS: - CENTRAL LOCATION, ISIOLO COUNTY
RACHEL NEKESA KISIANGANI
B.A (Planning)
University of Nairobi
A THESIS SUBMITTED IN PARTIAL FULFILLMENT OF THE REQUIREMENT
FOR THE AWARD OF A MASTER OF ARTS DEGREE IN PLANNING,
UNIVERSITY OF NAIROBI.
DEPARTMENT OF URBAN AND REGIONAL PLANNING
SCHOOL OF THE BUILT ENVIRONMENT
UNIVERSITY OF NAIROBI
JUNE 2015

ii
DECLARATION
This thesis is my original work and has not been submitted for examination in any other
University.
Signature: __________________________ Date ______________
Kisiangani Racheal Nekesa
B63/69833/2011
(Candidate)
This thesis has been submitted for examination with my approval as the University
Supervisor.
Signature: __________________________ Date ______________
Mr. Charles Osengo
(Supervisor)

iii
DEDICATION
This work is entirely dedicated to my husband and daughter Khloe whose inspiration and
unending support made this research thesis a great success.
With love

iv
ACKNOWLDGEMENT
The success of this research was made possible by the contribution of various individuals and
institutions. First all, my sincere gratitude goes to the Department of Urban and Regional
Planning, University of Nairobi and the County Government of Isiolo from where both the
guidance and resource assistance came from. I am greatly indebted to Mr. Osengo Charles,
my supervisor, who closely guided my research process as well as a great inspiration to my
accomplishing the research project. I also owe my gratitude to teaching staff in the Urban and
Regional Planning Department who were very helpful in the provision of a conducive
working atmosphere. It would be regrettable not to mention the M.A class of 2011 whose
positive criticisms and advice helped me a great deal.
Above all, I thank the Almighty God for His grace that guided me throughout the entire
process.
Although the success of this study depended on many people, groups and institutions, I solely
remain responsible for any errors and omissions.

v
ABSTRACT
Arid and semi-arid areas are part of the global ecosystem that completes the whole. Despite
their aridity conditions, ASALs are endowed with a variety of resources ranging from fertile
soils, minerals, oil, wildlife, and rivers among others. The maintenance of land productivity in
these fragile environments is a particular concern for many countries with large portions of
their land in arid areas. This study which has been contextualised in Isiolo, Central location
aims at analysing the land use potential with the aim of ensuring optimal utilisation. The study
specifically concentrates on establishing the existing resource, land use patterns and practices
in the area, the factors behind the current resource use, patterns and practices as well as the
implications on the socio-economic and environmental well-being. The study further seeks to
make recommendations on how to expand the carrying capacity of the area by optimally
utilizing the existing resources. The study employed non-experimental research method which
utilised both secondary and primary data. Secondary data was obtained from books, journals,
government publications among others. Primary data was obtained through field survey. A
sample size of 154 people was used. Key informants from the local administration and
relevant institutions were also involved. Sampling method which involved purposive
sampling, convenient sampling as well as simple random sampling was applied in selecting
the case study, formulating clusters and administering household questionnaires respectively.
During data analysis, the study employed methods such spread sheets for quantitative data,
statistical package for social scientists for qualitative data and Geographic Information
System for spatial data among others. The study revealed that Isiolo is endowed with various
resource potential ranging from natural wealth and indigenous knowledge among others. The
main land use practices in the area are pastoralism and subsistence crop farming. It was
further established that the region has dispersed settlements patterns which are lacking basic
infrastructure services. The study established that research and policy is not adequately
responsive to the resource use, land use pattern and practices, which are purely cultural
driven. This has had implications such as food insecurity, environmental degradation and
ethnic conflicts. The study therefore sought to close the gap posed by weak settlement
systems as well as declining carrying capacity in the light of existing resources. To fill the
gap, the study recommends an integrated three tier model aimed at creating sustainable rural
settlements, diversifying the rural economic basis while developing and optimizing
agriculture as a unique economic sector in ASALs.
vi
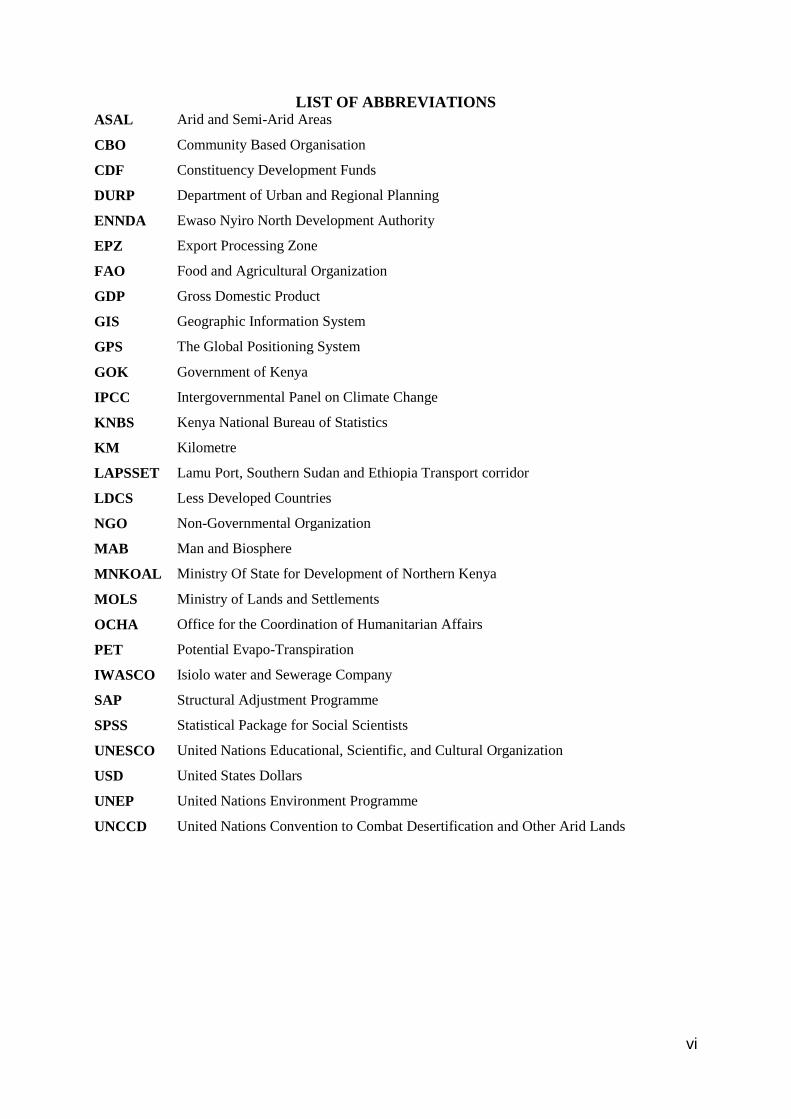
LIST OF ABBREVIATIONS ASAL Arid and Semi-Arid Areas
CBO Community Based Organisation
CDF Constituency Development Funds
DURP Department of Urban and Regional Planning
ENNDA Ewaso Nyiro North Development Authority
EPZ Export Processing Zone
FAO Food and Agricultural Organization
GDP Gross Domestic Product
GIS Geographic Information System
GPS The Global Positioning System
GOK Government of Kenya
IPCC Intergovernmental Panel on Climate Change
KNBS Kenya National Bureau of Statistics
KM Kilometre
LAPSSET Lamu Port, Southern Sudan and Ethiopia Transport corridor
LDCS Less Developed Countries
NGO Non-Governmental Organization
MAB Man and Biosphere
MNKOAL Ministry Of State for Development of Northern Kenya
MOLS Ministry of Lands and Settlements
OCHA Office for the Coordination of Humanitarian Affairs
PET Potential Evapo-Transpiration
IWASCO Isiolo water and Sewerage Company
SAP Structural Adjustment Programme
SPSS Statistical Package for Social Scientists
UNESCO United Nations Educational, Scientific, and Cultural Organization
USD United States Dollars
UNEP United Nations Environment Programme
UNCCD United Nations Convention to Combat Desertification and Other Arid Lands
vii
TABLE OF CONTENTS
TOPIC…………………………….………………...………………….………………………i
DECLARATION ....................................................................................................................... ii
DEDICATION .......................................................................................................................... iii
ACKNOWLDGEMENT ........................................................................................................... iv
ABSTRACT ............................................................................................................................... v
LIST OF ABBREVIATIONS ................................................................................................... vi
TABLE OF CONTENTS ......................................................................................................... vii
LIST OF TABLES .................................................................................................................. xiv
LIST OF FIGURES ................................................................................................................. xiv
LIST OF PLATES ................................................................................................................... xvi
LIST OF MAPS ..................................................................................................................... xvii
CHAPTER ONE
INTRODUCTION .................................................................................................................... 1
1.1 Background to the Study .................................................................................................. 1
1.2 Statement of the Problem ................................................................................................. 7
1.3 Research Questions ........................................................................................................... 8
1.4 Objectives of the Study ..................................................................................................... 8
1.5 Assumptions of the Study ................................................................................................. 9
1.6 Justification of the Study .................................................................................................. 9
1.7 Scope of the Study .......................................................................................................... 10
1.8 Organization of the Report ............................................................................................. 11
1.9 Limitations of the Study ................................................................................................. 12
CHAPTER TWO:
LITERATURE REVIEW ...................................................................................................... 13
2.0 Overview ........................................................................................................................ 13
2.1 Definition of Concepts .................................................................................................... 13
2.1.1 Land ......................................................................................................................... 13
2.1.2 Land Evaluation ....................................................................................................... 13
2.1.3 Land Use Potential ................................................................................................... 14
2.1.4 Land Use .................................................................................................................. 14
2.1.5 Land Use Patterns and Practices .............................................................................. 14
viii
2.1.6 Land Degradation ..................................................................................................... 14
2.1.7 Aridity ...................................................................................................................... 15
2.1.8 Carrying Capacity .................................................................................................... 16
2.1.9 Value Chain ............................................................................................................. 17
2.1.10 Resource ................................................................................................................. 19
2.1.11 Resource Potential ................................................................................................. 19
2.2 Overview of Resource Potential in Arid Areas .............................................................. 20
2.2.1 Land and Landscape................................................................................................. 20
2.2.2 Water Resources ...................................................................................................... 20
2.2.3 Wildlife .................................................................................................................... 21
2.2.4 Cultural Diversity ..................................................................................................... 21
2.2.5 Soils .......................................................................................................................... 21
2.2.6 Vegetation and Flora ................................................................................................ 22
2.2.7 Wind ......................................................................................................................... 22
2.2.8 Sunshine Intensity .................................................................................................... 22
2.2.9 Minerals ................................................................................................................... 23
2.3 Land Use Patterns and Practices in ASALs .................................................................... 23
2.3.1 Settlement Patterns ................................................................................................... 23
2.3.2 Farming .................................................................................................................... 24
2.3.3 Agro-Forestry ........................................................................................................... 25
2.3.4 Tourism .................................................................................................................... 26
2.3.5 Mining ...................................................................................................................... 26
2.4 Land Use Systems in Kenya‘s Drylands ........................................................................ 27
2.4.1 Land Use .................................................................................................................. 28
2.5 Factors Determining Land Use Patterns and Practices in ASALs .................................. 30
2.5.1 Natural Resources .................................................................................................... 30
2.5.2 Culture and Modern Policy ...................................................................................... 30
2.5.3 Poverty ..................................................................................................................... 30
2.5.4 Accessibility ............................................................................................................. 31
2.5.5 Land Tenure ............................................................................................................. 31
2.6 Challenges Facing ASAL Areas ..................................................................................... 31
2.6.1 Poverty and Tenure Considerations ......................................................................... 32
2.6.2 Water Scarcity/Aridity ............................................................................................. 32

ix
2.6.3 Land Degradation and Food Insecurity .................................................................... 32
2.6.4 Inappropriate Technology ........................................................................................ 33
2.6.5 Population Pressure .................................................................................................. 34
2.6.6 Ineffective Developmental Policies ......................................................................... 34
2.6.7 Low Infrastructure ................................................................................................... 35
2.7 Case Studies on Utilisation of ASALs ........................................................................... 35
2.7.1 Israel ......................................................................................................................... 35
2.7.2 Production ................................................................................................................ 36
2.7.3 Vegetables Production ............................................................................................. 36
2.7.4 Field Crops ............................................................................................................... 37
2.7.5 Livestock Rearing .................................................................................................... 37
2.7.6 Technology .............................................................................................................. 37
2.7.7 Export ....................................................................................................................... 38
2.7.8 Settlement Patterns in Rural Israel ........................................................................... 38
2.7.9 Organisation of Communal Settlements .................................................................. 39
2.7.10 Lessons Learnt ....................................................................................................... 40
2.8 Egypt ............................................................................................................................... 41
2.8.1 Farming Sector ......................................................................................................... 42
2.8.2 Livestock Rearing .................................................................................................... 42
2.8.3 Land Reclamation in Egypt ..................................................................................... 43
2.8.4 Settlement Patterns in the Rural Egypt .................................................................... 44
2.8.5 Success Practices of Farming in Egypt .................................................................... 45
2.8.6 Lessons Learnt ......................................................................................................... 46
2.9 Kenya .............................................................................................................................. 47
2.9.1 A Changing Policy and Institutional Context .......................................................... 48
2.9.2 The Prospects of Arid and Semi-Arid Lands ........................................................... 52
2.9.3 Institutional Framework ........................................................................................... 53
2.10 Theory of Rural Land Use ............................................................................................ 56
2.10.1The Von Thunen Model: A Model of Agricultural Land Use ................................ 56
2.10.2 Weaknesses and Criticisms .................................................................................... 59
2.11 Economic Base Theory ................................................................................................. 61
2.11.1 Basic Sector ............................................................................................................... 61
2.11.2 Non-Basic Sector ....................................................................................................... 62

x
2.11.3 Base Multiplier .......................................................................................................... 62
2.11.4 Weaknesses ................................................................................................................ 63
2.11Summary of Conceptual Framework ............................................................................. 64
CHAPTER THREE
RESEARCH METHODOLOGY .......................................................................................... 68
3.0 Overview ........................................................................................................................ 68
3.1 Research Design ............................................................................................................. 68
3.2 Study Area Description .................................................................................................. 71
3.4 Sample Frame and Unit of Analysis ............................................................................... 71
3.5 Types of Data .................................................................................................................. 72
3.5.1 Primary Data ............................................................................................................ 72
3.5.2 Secondary Data ........................................................................................................ 73
3.6 Sources of Secondary Data ............................................................................................. 73
3.7 Methods of Data Collection ............................................................................................ 73
3.7.1 Secondary Data ........................................................................................................ 73
3.7.2 Primary Data ............................................................................................................ 73
3.8 Sampling ......................................................................................................................... 75
3.8.1 Sample Size .............................................................................................................. 75
3.8.2 Sampling Design ...................................................................................................... 75
3.8.3 Discussion ................................................................................................................ 76
3.9 Management of Data ...................................................................................................... 77
3.10 Methods of Data Analysis ............................................................................................ 77
3.11 Analytical Framework .................................................................................................. 78
3.12 Data Presentation ...................................................................................................... 80
CHAPTER FOUR
SITUATIONAL ANALYSIS/BACKGROUND OF THE STUDY AREA ....................... 81
4.1 Overview ........................................................................................................................ 81
4.2 The Physical Setting of the Study Area .......................................................................... 81
4.3 Physical Environmental Characteristics ......................................................................... 84
4.4 Topography ..................................................................................................................... 84
4.5 Hydrology and Drainage ................................................................................................ 84
4.6 Geology and Soils ........................................................................................................... 86
4.6.1 Soil Characteristics and Crop Potential ................................................................... 87
xi
4.7 Climate ............................................................................................................................ 88
4.7.1 Drought Cycle in Northern Kenya ........................................................................... 88
4.7.2 Linkage between Water and Livestock Production ................................................. 91
4.8 Potential for Underground Water in Agriculture ............................................................ 93
4.9 Natural Resource Base .................................................................................................... 94
4.9.1 Land Resource Characteristics ................................................................................. 94
4.9.2 Land Tenure ............................................................................................................. 95
4.10 Land Use ....................................................................................................................... 95
4.10.1 Density Issues ........................................................................................................ 96
4.11 Surface Water Resources .............................................................................................. 96
4.12 Wetlands ....................................................................................................................... 99
4.13 Biodiversity .................................................................................................................. 99
4.13.1 Vegetation .............................................................................................................. 99
4.13.2 Wildlife ................................................................................................................ 101
4.13.3 Isiolo Resort City Concept ................................................................................... 101
4.14 Livestock .................................................................................................................... 102
4.15 Minerals ...................................................................................................................... 106
4.16 Solar and Wind Energy ............................................................................................... 107
4.17 Population and Demographic Characteristics ............................................................. 107
4.17.1 Demographic Characteristics ............................................................................... 108
4.17.2 Population Structure and Composition ................................................................ 108
4.17.3 Population Distribution ........................................................................................ 109
4.17.4 Mortality Rates, HDI and Life Expectancy ......................................................... 109
4.17.5 Fertility Levels ..................................................................................................... 109
4.17.6 Sex Ratio and Dependency Rate .......................................................................... 109
4.17.7 Population Projection ........................................................................................... 109
4.18 Migration .................................................................................................................... 111
4.19 Culture and Decision Making ..................................................................................... 111
4.19.1 Social Life ............................................................................................................ 112
4.20 Comparison with ASALs ............................................................................................ 113
4.21 Human Settlements ..................................................................................................... 114
4.21.1 Settlement Trends and Patterns ............................................................................ 114
4.21.2 Rural Settlement ................................................................................................... 115

xii
4.21.3 Rural Settlement Patterns ..................................................................................... 115
4.22 Urbanization ............................................................................................................... 115
4.22.1 Level of Planning in Isiolo County ...................................................................... 117
4.22.2 Level of Service Provision ................................................................................... 118
4.23 Economic Activities ................................................................................................... 120
4.23.1 Livelihood Profile ................................................................................................ 120
4.23.2 Livestock Production ........................................................................................... 120
4.23.3 Crop Farming ....................................................................................................... 121
4.23.4 Mining .................................................................................................................. 122
4.23.5 Forestry ................................................................................................................ 122
4.23.6 Tourism ................................................................................................................ 122
4.24 Infrastructure Facilities ............................................................................................... 123
4.24.1 Road Transport ..................................................................................................... 123
4.24.2 Water Supply ....................................................................................................... 123
4.24.3 Air Transport ........................................................................................................ 123
4.25 Education ................................................................................................................ 123
4.26 Health Facilities .......................................................................................................... 124
4.27 Energy Access ............................................................................................................ 124
4.28 Posts and Telecommunications .................................................................................. 124
4.29 Summary of the Background ...................................................................................... 124
CHAPTER FIVE
STUDY FINDINGS .............................................................................................................. 128
5.1 Overview ...................................................................................................................... 128
5.2 Social Economic Characteristics .................................................................................. 128
5.3 Existing Natural Resource ............................................................................................ 137
5.4 Land Use Practices at Household Level ....................................................................... 140
5.6 Infrastructure and Utility Facilities ............................................................................... 147
5.7 Land Use Practices ....................................................................................................... 149
5.8 Institutional Framework ............................................................................................... 152
5.9 Overall Challenges in Resource Utilization ................................................................. 156
5.10 Development Challenges ............................................................................................ 157

xiii
CHAPTER SIX:
IMPLICATIONS AND POLICY RECOMMENDATIONS ............................................ 163
6.0 Overview ...................................................................................................................... 163
6.1 Benefits of the Study .................................................................................................... 163
6.2 Summary of Emerging Issues ....................................................................................... 163
6.2.1 Land Degradation ................................................................................................... 163
6.2.2 Undeveloped Water Resources/Water Scarcity ..................................................... 164
6.2.3 Over-Dependence on Unprofitable Livestock Production ..................................... 165
6.2.4 Poor Infrastructure. ................................................................................................ 165
6.2.5 Unplanned Settlement Systems .............................................................................. 165
6.2.6 Poverty ................................................................................................................... 166
6.2.7 Food Insecurity ...................................................................................................... 166
6.2.8 Insecurity/ Ethnic Conflicts ................................................................................... 166
6.3 The Potentials of the Study Area .................................................................................. 167
6.4 Normative Framework –Land Use and Settlement ...................................................... 169
6.5 Scenario Building ......................................................................................................... 170
6.5.1 Proposed Models .................................................................................................... 170
6.5.2 Implications of Possible Scenarios ........................................................................ 178
6.6 Policy Recommendations ........................................................................................... 1799
6.6.1 Implementation of the Integrated Model ............................................................... 179
6.6.2 Protection and Conservation of the Environment .................................................. 179
6.6.4 Land Management Policy ...................................................................................... 180
6.6.6 Enhanced Institutional Coordination ..................................................................... 180
6.6.7 Research and Development .................................................................................... 180
CHAPTER SEVEN
SUMMARY AND CONCLUSIONS ................................................................................... 182
7.0 Overview ...................................................................................................................... 182
7.1 Summary ....................................................................................................................... 182
7.2 Conclusions .................................................................................................................. 185
7.3 Areas of Further Research ............................................................................................ 186
8.0: LIST OF REFERENCES ............................................................................................. 187

xiv
LIST OF APPENDICES ...................................................................................................... 190
APPENDIX I. HOUSEHOLD QUESTIONNARE ............................................................... 190
APPENDIX II: OBSERVATION CHECKLIST ................................................................... 195
APPENDIX III: INTERVIEW SCHEDULE FOR INSTITUTIONS .................................... 196
APPENDIX IV: SUMMARY OF WORK-PLAN ................................................................. 197
APPENDIX V: PROJECT BUDGET AND TIME-TABLE ................................................. 198
APPENDIX VI: THE INTEGRATED MODEL ................................................................... 199
LIST OF TABLES
Table 2.1: The Estimated Employment Multipliers for the Livestock Industry………..……19
Table 3.1: Data Need Matrix………………..………..……………………………………….80
Table 4.1: Divisional Population and Density……..……………………………......………108
Table 4.2: Demographic Indicators…………….……………………………………………108
Table 5.1: Average (2010-2011) Production Per Unit…………………………………. .…135
Table 5.2: Average Farming Acreage……………………….………...….…………………142
Table 6.1: Implications of Possible Scenarios………………………………………………178
LIST OF FIGURES
Figure 2.1: Dairy Value Chain………………………………………………………………..18
Figure 2.2: Von Thunen Model….…………………………………………………….……..60
Figure 2.3: Illustrations of the Von Thunen Model….………………………………………60
Figure 2.4: Conceptual Framework..……………………………………..…………………..65
Figure 3.1 Summary of Research Design…………………………………………………….70
Figure 3.2 Summary of Analytical Framework….…………………………………………...79
Figure 4.1: Isiolo Livestock Market Organization….……………………………………….105

xv
Figure 4.2: Maternal and Child Health Indicators…………………………………………..110
Figure 4.3: Population Pyramid.……….……………………………………………………110
Figure 4.4: Level of Illiteracy among Population Aged 6-18 Years..……………………...114
Figure 4.5: Percentage of Urban Population in Isiolo..…..…………………………………116
Figure 4.6: Hierarchy of Centres in Isiolo County….……………………………………….117
Figure 5.1: Reasons for Migrating into Isiolo……………………………………………….130
Figure 5.2: Challenges Facing Pastoralism………………………………………………….137
Figure 5.3: Type of Access to Resources..….………………………………………………139
Figure 5.4: Uses of the Rivers ……………….…………………………………………….140
Figure 5.5: Land Use Practices.………….…………………………………………………140
Figure 5.6: Crops Grown in Isiolo County..…………………………………………….….142
Figure5.7: Tomatoes Harvest per Season…………………………………………………..143
Figure 5.8: Average Harvest for Sukuma Wiki..……………………………………….…..143
Figure 5.9: Average Harvest for Onions……………………………………………..…….144
Figure 5.10: Distance from Isiolo River..………………………………….………………..145
Figure 5.11: Distance from the Market……………………….………………….………….145
Figure 5.12: Crop Farming Challenges………………………………………….……..…...147
Figure 5.13: Major Accessibility Challenges………………………………………………..148
Figure 5.14: Current Land Use Patterns…………….…………………………….…………150
Figure 5.15: Reasons for Current Land Use patterns….………………….……….…..…….150
Figure 5.16: Impacts of Land Use Practices…………..……….…………………….……...151
Figure 5.17: Summary of Challenges Facing Resource Utilization…………………….….157
Figure 5.18: Development Challenges in the Study Area….………………………………..157

xvi
Figure 6.1: The Proposed Farm Cluster Views…………………………...…………………173
Figure 6.2: Proposed Livestock Value Chain ………………………………………………177
LIST OF PLATES
Plate 2.1: An Example of Dry Land Farming in Asia-Pacific Region…………………..……24
Plate 4.1: Isiolo River…………………………………………………………………………97
Plate 4.2: Livestock Grazing on Vegetation in Isiolo…..…………………………….….….100
Plate 4.3: Sand Harvesting...…………………………..………………………..…………...106
Plate 5.1: Charcoal on Display for Sale...….…………...…………………….…………..…130
Plate 5.2: Crop Farming along River Isiolo……………………………………………..…..132
Plate 5.3 Tomatoes Ready for Harvest..………………………………………………….…132
Plate 5.4 Green House Farm in Isiolo…………………….…………………………………133
Plate 5.5: Rotten Tomatoes in Isiolo.………………………….……………………..……..134
Plate 5.6: Livestock Rearing in the Study Area…………………..…………………….…...136
Plate 5.7: Livestock Moving in Search for Pastures...……………….……………………...136
Plate 5.8: Black Cotton Soils………………………………………….…………………….138
Plate 5.9: Forest and Wildlife..………………………………………….…………………..138
Plate 5.10: Livestock Yard………………………………………………………….………146
Plate 5.11: Goat Market in Isiolo Town………………………………………….……….…146
Plate 5.12: A Borehole in Isiolo County.……………………………………….…………...148
Plate 5.13: Road Conditions in Isiolo……………………………………………………….149
Plate 6.1: Proposed Communal Settlements………………………………………………...171
Plate 6.2: Green House Farming………………………..…………………………………..174
xvii
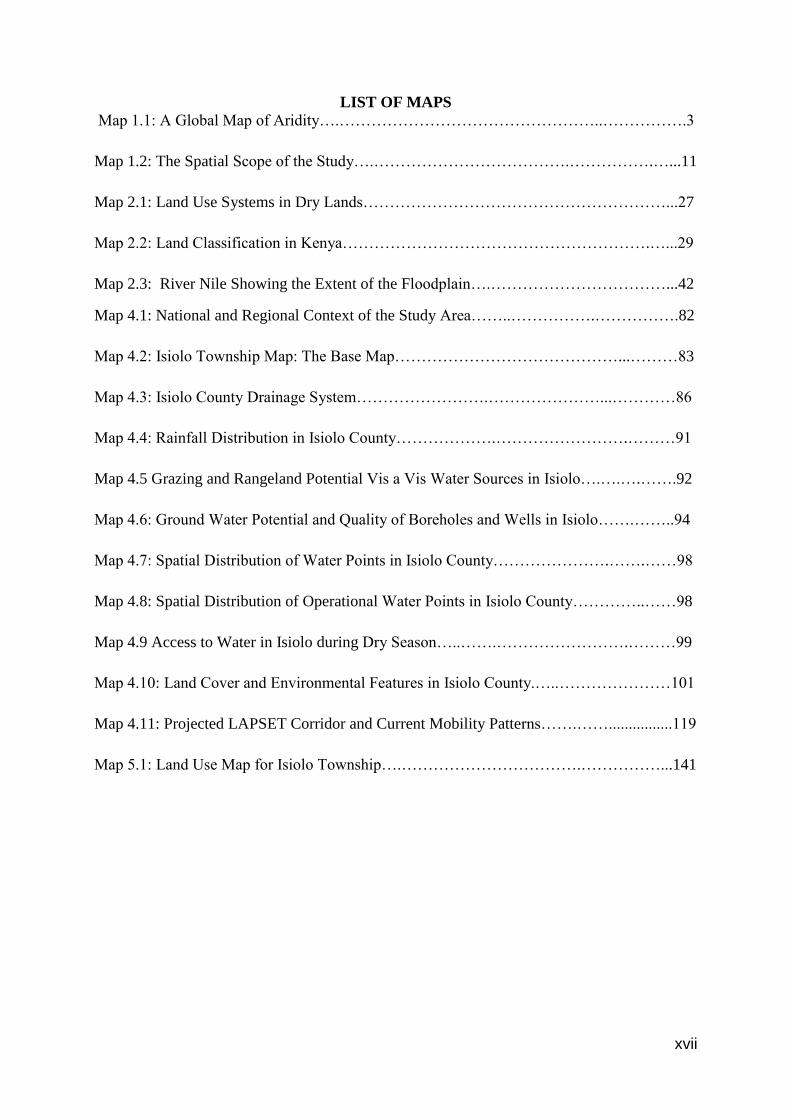
LIST OF MAPS
Map 1.1: A Global Map of Aridity….…………………………………………..…………….3
Map 1.2: The Spatial Scope of the Study….……………………………….…………….…...11
Map 2.1: Land Use Systems in Dry Lands…………………………………………………...27
Map 2.2: Land Classification in Kenya………………………………………………….…...29
Map 2.3: River Nile Showing the Extent of the Floodplain….……………………………...42
Map 4.1: National and Regional Context of the Study Area……..…………….…………….82
Map 4.2: Isiolo Township Map: The Base Map……………………………………...………83
Map 4.3: Isiolo County Drainage System…………………….…………………...…………86
Map 4.4: Rainfall Distribution in Isiolo County……………….…………………….………91
Map 4.5 Grazing and Rangeland Potential Vis a Vis Water Sources in Isiolo….….….…….92
Map 4.6: Ground Water Potential and Quality of Boreholes and Wells in Isiolo…….……..94
Map 4.7: Spatial Distribution of Water Points in Isiolo County………………….…….……98
Map 4.8: Spatial Distribution of Operational Water Points in Isiolo County…………..……98
Map 4.9 Access to Water in Isiolo during Dry Season…..…….…………………….………99
Map 4.10: Land Cover and Environmental Features in Isiolo County.…..…………………101
Map 4.11: Projected LAPSET Corridor and Current Mobility Patterns…….……................119
Map 5.1: Land Use Map for Isiolo Township….…………………………….……………...141

1
CHAPTER ONE
INTRODUCTION
1.1 Background to the Study
Land is physiographically defined as the natural synthesis of natural elements including geology,
landform, climate, soil and vegetation and is increasingly branded with human activities. Land
types and their spatial structure are the scientific basis for sustainable land use pattern and
practices. Land plays a significant role in society by being the locus of productive activities and
source of livelihood. Land use is characterized by the arrangements, activities and inputs people
undertake in a certain land cover type to produce change or maintain it (FAO/UNEP, 1999).
Kenyan Constitution (Article 260) ―land‖ includes—(a) the surface of the earth and the sub-
surface rock; (b) any body of water on or under the surface; (c) marine waters in the territorial
sea and exclusive economic zone; (d) natural resources completely contained on or under the
surface; and (e) the air space above the surface. From the above definition, land extends beyond
exclusive economic zone to include the continental shelf, social and spiritual elements.
Through-out history, land utilization worldwide has been guided by its potential i.e. the type of
original vegetation, soil type and climate. The hunters and gatherers were the initial significant
land users. However, hunting and food gathering were quickly replaced by food production
marking the beginning of land use. The importance of land utilization in the economic and social
activities of a society makes it imperative that a comprehensive land and land use policy be
adopted to effectively manage this valuable resource. This is both for high potential areas as well
as arid areas which have for a long time been neglected by countries. The decade of the 1950's
witnessed the first worldwide effort to call attention to the problems and potentials of arid
regions. It started when the United Nations Educational, Scientific, and Cultural Organization
(UNESCO) launched its Major Project on Scientific Research on Arid Lands in 1951. This saw
many governments come up with land use policies and development plans to guide resource
allocation as well as utilization in different parts of a country. In essence the goal of government
intervention is to ensure improved livelihoods and sustainable natural resource management.
Dudley Stamp,(1961) emphasizes on ‗the delicacy of balance‘ between man and the environment
in all arid lands and the suggestion that the nature of the social organization involved often may

2
have been as important as technological and environmental details in determining the course of
events in arid or semi-arid areas.
Land potential is a function of natural factors and climatic conditions. In most developed and
developing countries, the effectiveness of land utilization has been greatly influenced by
historical practices, development priorities and ideologies, social cultural factors, technological
and institutional capacities.
For a long time, arid and semi-arid lands have been classified as low potential areas based on
their inability to sustain rain-fed agriculture. The current world map of arid lands established
within the framework of a Man and Biosphere(MAB-UNESCO)program establishes that
drylands cover 6150 million ha, that is, 47.2% of the Earths total land surface area(UNEP,1992).
They are located between latitudes of 15 degrees to 30 degrees in both Northern and Southern
Hemispheres in what is termed the arid zone. Hyper-arid zones cover 7.5% of Earth‘s land
surface. Arid zones cover 12.1%, while semi-arid zones are more extensive, occur in all
continents, and cover 17.7% of Earth‘s land surface. The dry sub-humid category covers 9.9% of
Earths land surface. The dry areas are home to one-third of the global population – over 1.7
billion people and 86% of the arid population lives in Asia and Africa, 50% of this population
lives in south Asia and North Africa. The overall population density however is less than half the
world average. In true deserts of about 259ha, population density does not exceed 2 persons per
square mile (259ha). About 16% of the population lives in chronic poverty, particularly in
marginal rain-fed areas. Map 1.1 below shows the spatial distribution of ASAL regions across
the globe.

3
Map 1.1: A Global Map of Aridity
Source: Millennium Ecosystem Assessment, (2005)
In spite of their disadvantaged nature i.e. harsh climate, ASAL lands have got a lot of potential
dictated by a variety of resources. Some of the major resources in most ASAL lands include:
fertile soils, a variety of minerals (oil, sand etc.), wildlife, long hours of sunshine, wind,
rangelands, underground water, and ground water/oasis among others. These regions therefore
have potential in producing livestock, tourism, mining, horticulture and renewable energy hence
they have to be looked at differently by recognizing their strengths and resources. The areas are
endowed with a diversity of land use potential whose balance is changing with global market
forces and community values and rising population. Water resources in ASAL areas are scarce

4
however; there are other resources which can be harnessed to ensure water availability for
instance water harvesting and the use of run-off water in irrigation. These water resources remain
undetected and unharnessed in most ASAL lands of the developing world (Kassas, 1991). Under
such circumstances, exploring the way to appropriately utilize the variety of resources in arid
lands, especially rational allocation of resources and optimal land use patterns is of great
significance.
The maintenance of some land productivity in these fragile environments is a particular concern
for countries that have a major portion of their land in arid areas. It is also of concern to countries
with more diversified economies, such as the United States and the Soviet Union, since
populations and economies may also depend on the productivity of such lands. A number of
countries are trying to cope with aridity by employing various approaches. Israel has a deliberate
policy of settling its deserts and a system for managing water. Dryland farming, using runoff
water collection and runoff water spreading systems, was well known in antiquity to date. Israeli
researchers have reconstructed a number of runoff systems which work on the principle of
collecting or diverting precipitation that is not immediately absorbed by the ground (Havatzelet,
2006).The Soviet Union, with about one-fifth of its people living on semi-arid and arid lands, has
under consideration a partial diversion of north-flowing rivers to desert areas in the south.
For much of the twentieth century, Iraq was largely self-sufficient due its focus on industrial
agriculture. Agriculture‘s role in a country like Iraq goes beyond food production: it‘s the
second-largest sector in the Iraqi economy, a major source of rural employment, and a vital
cultural signifier (FAO, 2002). Despite drought, climate change, economic and political turmoil,
and an ever-aging population, Iraq‘s agricultural production continues to increase. The Tigris-
Euphrates lowland—an easily irrigated area of rich alluvial soil—has been devoted primarily to
farming since the dawn of civilization. About one-fifth of Iraq's people make their living from
farming and herding. Most rural communities are organized into nucleated settlements rather
than dispersed farmsteads; that is, the farmer leaves his village of over 100 persons to cultivate
the fields outside it (Golan, 1997. The pattern holds for farming communities in the Kurdish
highlands of the northeast as well as for those in the alluvial plain. The size of the settlement
varies, generally with the volume of water available for household use and with the amount of
land accessible to village dwellers. This type of settlement has enhanced agricultural production
5
by enhancing mechanization on the farms. Iraq government formulated land laws to replace
communal land ownership system with a system of ownership that increased the number of
sharecroppers and tenants dramatically. This saw individual titles given to farmers who in turn
invested more in agriculture than before. This in turn saw an improvement in agricultural
productivity making it the second largest sector in the Iraqi economy.
Several countries in Africa are experimenting with game ranching and pastoralism. The future of
ASALs in Kenya needs not to be painted so bleak. These areas have enormous resources that
can be harnessed not only to sustain themselves but also to contribute to national economic
development. The government of Kenya has made efforts in terms of policy formulation
towards the development of ASALs. With motivation from Sessional Paper No. 10 of 1965 on
‗African Socialism and its Application to Planning in Kenya‘, the first ASAL policy was
formulated in 1979. Recent policy attempts at developing the ASALs were made in 1992, 2001,
2004 and 2005.The 1992 policy initiative emphasized drought contingency planning with the
involvement of beneficiaries. Its main weaknesses were lack of political support and
inappropriate implementation strategy framework. In 2001, the Government of Kenya (GoK)
developed a rural development strategy (KRDS). Its departure from the District Focus for Rural
Development (1983) was (i) its stronger emphasis on empowerment of the rural beneficiaries;
(ii) the need to strengthen budget execution to ensure that resources are reaching communities;
(iii) combating corruption; and (iv) participation of the private sector, NGOs and community
based organizations (CBOs). Though the design of this 2001 KRDS looks appropriate, its
implementation has not been undertaken. Except for the Kenya Rural Development Strategy
2001, the major weakness of the other policies was that they left out implementation frameworks
and had limited stakeholder participation. In addition, they also lacked clear targets and time-
frames for achieving them.
For far too long, ASALs have been marginalized. There is no coherent pastoral development
policy in Kenya. Previously, pastoralist development issues were articulated in other policies
such as the one for agriculture and livestock development, and tourism. This has resulted in the
relegation of pastoralist development issues to second place. The piece-meal approach to ASAL
policy formulation has introduced inconsistencies and challenges in policy implementation to the
detriment of ASAL development. The policies were not holistic since they lacked aspects on

6
value chain. There is therefore need to amalgamate the scattered policies into a single unified and
coherent framework for revitalizing ASALs to enhance their contribution to the national
economy. Previous policies aimed at revitalizing ASALs were drafted with a degree of bias
against pastoralism as a viable and sustainable way of life. Emphasis was put on nomadic
pastoralists without taking cognizance of the varied resource potential in ASALs. Because such
policies were mainly top-down, discriminative and un-consultative, they often failed, making
ASALs to be considered generally unproductive and net consumers of the ―national cake‖. Yet,
these areas have enormous economic potential in livestock production, crop farming, mining,
tourism, renewable energy and biodiversity. New policy framework has been formulated and it is
expected to help tap the enormous potential of ASALs with the aim of easing the burgeoning
poverty in these areas (GoK, 2004).
Despite the percentage of land under aridity in developing countries, dry areas are viewed as
disadvantaged and therefore have minimal contribution to the development process. Most arid
areas have suffered historical alienation since the colonial period. In Kenya, increasing
population in ASALs has increased competition for the scarce resources (water and pasture) in
these areas often resulting in conflicts among communities and between animals. These frequent
conflicts have affected utilization of land for food production in these areas contributing to the
spectre of widespread hunger and food insecurity. Like any other ASAL district in Kenya, Isiolo
faces numerous challenges ranging from untapped land use potential to low investment in
infrastructure. An overview of the history and current land use in ASALs in Africa, Kenya shows
that only through planned sustainable development will developing countries be able to exploit
their resources and overcome the severe problems facing them in the future development of arid
and semi-arid lands.

7
1.2 Statement of the Problem
Arid areas such as Israel, Iran and California are very productive despite their harsh climatic
conditions as compared to Isiolo. In these regions, resources have been identified upon which
specific policy for their utilization has been formulated. This has been a spring board for
development programmes which has seen increased productivity in these otherwise known as
deserts. In a case like Israel, this has also guided scientific research and technology discovery
aimed at optimally harnessing the existing scarce resources in the light of the increasing
population. In these regions, resource use and utilization goes hand in hand with a particular land
use and this is fuelled by strong policies, innovation and over-all attitude change by the
community.
In Kenya, resource utilization in drylands has been marred by factors dating back to the colonial
period. The colonial government divided the country into various zones depending on the
resource potential of the region. Isiolo district was classified an arid area hence fell into the low
potential areas which received minimal government resources due to their minimal contribution
to the national economy (Gok, 1965). The district has therefore suffered marginalization from
the central government which saw significant tracts of good agricultural land and other natural
resources being alienated for unplanned purposes. Existing resources in drylands such as
livestock, rangelands, soils, sand, sunshine and wind were not recognized by the policies.
Resource utilization in this region was solely influenced by the cultural values of the local
community. The changing governments also brought about policy formulation through the line
ministries with aspects touching on ASALs. However, the policies proposed intervention
measures without concretely getting to the issues that affect the outcome of land use patterns and
practices.
Research and policy in the Kenyan situation is not adequately responsive to the resources, land
use pattern and practices in drylands as these are purely cultural driven. There‘s minimal
research done on resource potential in ASAL regions of Kenya hence inadequate appraisal of
resources. The current initiatives by the private sector and NGO‘s have consequently failed to
improve the situation because the practices are not adequate. In addition to the above, the
proposed initiatives overlook the settlement organization, water utilization and complete value
chain processes of crops, beef and milk which are vital components and linkages.

8
The increasing population in Isiolo in the light of climate change issues is currently posing a
number of challenges in the use of resources as well as the settlement system. The recurrent food
insecurity, poverty and ethnic conflicts in Isiolo are only but symptoms of the major problem.
The type of mitigation required should respond to scientific research as well as settlement
systems that enhance optimal resource use as well as adequate provision of basic services for the
community.
It is from this background that this research is being undertaken. The purpose of this research is
to investigate the existing resources in Isiolo-central, the land use practices and their patterns, the
level of utilization and finally the settlement systems. The research will consequently seek to
propose intervention measures aimed at enhancing optimal resource utilization for the benefit of
the local community and the country at large.
1.3 Research Questions
Research questions that will guide this study include the following:-
1. What are the existing resources, land use patterns and practices in Central location,
Isiolo?
2. What are the factors determining the resource use, land use patterns and practices in
Central location, Isiolo?
3. What are the consequences of the existing resource use, land use patterns and practices in
Central location, Isiolo?
4. What intervention measures can be applied to ensure optimal resource utilization in
Central location, Isiolo?
1.4 Objectives of the Study
The research objectives for this study will include the following:-
1. To investigate the existing resources, land use patterns and practices in Central location,
Isiolo.
2. To interrogate the factors determining the current resource use, land use patterns and
practices in Central location, Isiolo.
3. To examine the consequences of the existing resource use, land use patterns and practices
in Central location, Isiolo.
9
4. To explore planning intervention measures that can be applied to ensure optimal resource
utilization in the Central location, Isiolo.
1.5 Assumptions of the Study
This research was based on the following assumptions:-
1. Over-reliance on livestock production has impacted negatively on resource utilization in
Isiolo.
2. Cultural values have impacted negatively on resource utilization in Isiolo.
3. The existing settlement pattern in Isiolo is the main impediment to resource utilization.
4. There will be increased population growth in Isiolo hence pressure on the existing
resources.
1.6 Justification of the Study
ASALs, though disadvantaged naturally, are part of the global eco-system that completes the
whole and consequently have their share of contribution to the development process that has
been overlooked in some parts of the world.
The arid districts are usually the most vulnerable to droughts, floods, climate change and
insecurity which undermine the long-term viability of development initiatives in these areas.
There is need to solve the perennial and expensive drought-related food crisis through planning
intervention. ASAL areas lose a lot of lives through famine and studies done by different
research bodies in the country predict that if nothing is done, the number of people dying out of
hunger especially in arid areas is bound to continue. Utilization of untapped potential in ASAL
areas will ensure food security and expanded economic opportunity not only for the local
residents but also the country as a whole.
The proposed Lamu Port, Southern Sudan and Ethiopia Transport corridor (LAPSSET corridor)
envisages three Resort Cities in Lamu, Isiolo and L.Turkana. Isiolo Resort City will be
developed as part of the Vision 2030 flagship projects to be implemented within the tourism
sector to establish and set up Kenya‘s first multi-billion shilling resort city (GoK, Vision 2030).
Isiolo County is to be the first county to be developed as part of the Kenya vision 2030 program.
This therefore requires that the rural part of the county supplies adequate food for the increasing
population in the county as well as to the hospitality industry for tourists. In addition, it is

10
through planned sustainable development that will ensure a balanced growth through-out Isiolo
county. This will make economic sense if the existing resources are utilized to pay for it.
The realization that there is a symbiotic relationship between the ASAL economies and the rest
of the country is an essential step in development. For instance it is not possible to achieve
sustainable economic growth in Kenya as a whole if the ASAL lands are left out of the equation.
This is partly because of the disincentive created by regional inequality, but also because the
ASALs represent a new direction of growth for an economy which has until now been
concentrated on a very narrow geographical base. OCHA has estimated that GoK allocated
Ksh18billion (US$219m) to drought response in 2011. Between 1999 and 2010 the Kenyan
Government spent an average of USD 173.2 million each year on food and non-food emergency
operations. This confirms that drought can seriously undermine Kenya‘s ability to achieve the
MDG targets and its own national development strategy - Vision 2030. In addition to the above,
the ASAL and non-ASAL economies each have their comparative advantage which should be
fully exploited.
Isiolo continues to experience food scarcity despite being endowed with fertile black cotton soils,
rivers and underground water in the region. This is a great potential that has to be exploited for
the benefit of the country as a whole.
1.7 Scope of the Study
The study covers part of central location, Isiolo County along Isiolo River. It was limited to the
width of approximately 500meters on both sides of the river to the length of about 3KM as
shown on the Map 1.2 below.
The study concentrated on the land use patterns and practices around Isiolo river, natural
resources and their utilization in relation to the existing potential, human settlement patterns,
soils, topography, infrastructure, institutional and policy aspects. The study looked at the above
aspects with a major focus on agricultural potential.

11
Map 1.2: The Spatial Scope of the Study
Source:
https://www.google.co.ke/maps/place/Isiolo/@0.3498177,37.5902458,14z/data=!3m1!4b1!4m2!
3m1!1s0x1788662553abb67f:0xc9bb1d9f0aaf7321?hl=en (accessed on 8th
June, 2015)
1.8 Organization of the Report
The report was organized logically in chapters as follows:-
The first chapter was an introduction of the problem. This was followed by problem
identification stage which involved undertaking of a comprehensive literature review for
purposes of conceptualizing the problem and identifying the gap that needed to be filled.
The second chapter is the literature review which involved the systematic identification, location
and analysis of documents containing information related to the research problem. Its main
purpose was to determine what has already been done by other researchers in relation to land use
potential in arid areas. This involved reviewing of written materials on the land use patterns in
ASAL areas, their resource potential, policy framework etc.

12
The third chapter is the research methodology stage which summarizes the type of survey to be
done and the methods that will be used for data collection, analysis and presentation.
The fourth chapter is the situational review. This is a description of the various components of
the study area and the existing situation on the ground. This is meant to give a broad
understanding of the study area. This chapter is followed by the survey findings chapter which
highlights the actual results without manipulation. This chapter is consequently followed by a
theoretical synthesis of the findings from both primary and secondary sources for a deeper
understanding of the problem at hand. The next chapter is the problem issues and
recommendations: The purpose of the discussion is to state the interpretations and opinions,
explain the implications of the study findings and make recommendations on how to best deal
with the problem. Its main function is to answer the questions posed in the Introduction, explain
how the results support the answers and how the answers fit in with existing knowledge on the
topic. The discussion is considered the heart of the research report as it involves synthesis of
study findings, theory and practice. The final chapter involves giving a summary and conclusion
of all the major issues arising in line with the study objectives. Being a qualitative study, this
section summarizes the project and findings, stating the benefits and limitations of the research
while suggesting some ideas for future research either on the topic or in this study area.
1.9 Limitations of the Study
The study experienced limited resources in terms finances to carry out a comprehensive study.
In addition, time was also limited due to the strict university curriculum.

13
CHAPTER TWO:
LITERATURE REVIEW
2.0 Overview
This chapter involves systematic identification, location and analysis of the exact potential as it
is in arid areas, their land use patterns and practices . The chapter is critical in that it analyses the
potential in arid and semi-arid areas as well as giving case studies on how various countries have
turned ASALs into productive areas. This gives new insights as well as rich lessons from
countries whose arid areas are playing a major role in improving the economy. The chapter also
critically analyses the role of the policy, theory and practice to optimal resource utilisation in arid
areas. The chapter finally presents a conceptual framework based on exiting theory and practice.
2.1 Definition of Concepts
2.1.1 Land
Land is an area of the earth‘s surface, meaning all the attributes of the biosphere vertically above
and below this area including those of the atmosphere, the soil, the geology, the hydrology, the
plant and animal populations and the results of past and present human activity (Vink, 1983:13).
And as earlier mentioned, the Kenyan Constitution (Article 260) defines land as that which
includes—(a) the surface of the earth and the subsurface rock;(b) any body of water on or under
the surface;(c) marine waters in the territorial sea and exclusive economic zone;(d) natural
resources completely contained on or under the surface; and (e) the air space above the surface.
It also refers to the extent of the continental shelf and not only the economic zone.
2.1.2 Land Evaluation
Land evaluation is concerned with the assessment of land performance when used for specified
purposes. It involves the execution and interpretation of basic surveys of climate, soils,
vegetation and other aspects of land in terms of the requirements of alternative forms of land use.
The range of land uses considered has to be limited to those which are relevant within the
physical, economic and social context of the area considered against certain indicators such as
the land carrying capacity (ibid).

14
2.1.3 Land Use Potential
The suitability of the land and soils to support particular uses is an essential part in land use
potential analysis. The analysis provides information on the land use potential which supports
policy development, planning and on-ground decision making. (FAO, 1976). The potential of the
land is determined by the physical and natural characteristics of the land, the climatic conditions,
socio-cultural factors as well as human settlement patterns.
2.1.4 Land Use
Vink (1983:10) defines land use as ―an expression of man‘s management of the ecosystem in
order to produce some of his needs‖. Mather (1986 viii) states that land use is the product of
human decision operating within social, political and legal frameworks bound by the nature of
ecosystem i.e the natural and physical environment.
"Land use is characterised by the arrangements, activities and inputs people undertake on land to
produce, change or maintain it" (FAO/UNEP, 1999). The type of inputs and outputs undertaken
on land has consequences on the resources and its ability to sustain man in harmony with the
environment.
2.1.5 Land Use Patterns and Practices
Land use patterns refer to the arrangement of activities and people on a certain land cover. Land
use practices on the other hand refer to the type of activities carried out on a certain land cover
(FAO/UNEP, 1999). Land use patterns and practices are determined by the social cultural
factors, natural resources, policy framework as well as historical factors.
2.1.6 Land Degradation
Land degradation means the reduction, or loss, in arid, semi-arid and dry sub-humid areas, of the
biological or economic productivity and complexity of rain fed cropland, irrigated cropland or
range, pasture, forest and woodlands, resulting from land uses or from a process or combination
of processes, including processes arising from human activities and habitation patterns, such as:
(i) soil erosion caused by wind and/or water; (ii) deterioration of the physical, chemical, and

15
biological or economic properties of soil; and (iii) long-term loss of natural
vegetation(FAO,2010).
2.1.7 Aridity
The United Nations Convention to Combat Desertification (UNCCD) defines Arid, Semi-Arid
and Dry Sub-Humid zones as ―areas, other than polar and sub-polar regions, in which the ratio of
annual precipitation to potential evapotranspiration [the aridity index] falls within the range from
0.05 to 0.65.‖ Hyper-Arid zones are characterized by a ratio typically less than 0.05. Together,
these arid environments account for over 47 percent of the land mass of the earth and are spread
geographically across all continents. The African continent contains the largest area of arid
environments, while Australia has the highest proportion — about 75% of its area.
The intensity of aridity varies from one place to the other due to the variation of moisture deficit,
and might even vary within one zone where various environmental factors play roles. Broad
climatic attributes have been used to divide arid lands into three categories. Three arid zones can
be delineated by this index: namely, hyper-arid, arid and semi-arid.
2.1.7.1 Hyper-Arid Zone
Of the total land area of the world, the hyper-arid zone covers 4.2% the arid zone 14.6%, and the
semi-arid zone 12.2%. Therefore, almost one-third of the total area of the world is arid land. The
hyper-arid zone (arid index 0.03) comprises dryland areas without vegetation, with the exception
of a few scattered shrubs. True nomadic pastoralism is frequently practiced. Annual rainfall is
low, rarely exceeding 100 millimetres. The rains are infrequent and irregular, sometimes with no
rain during long periods of several years.
2.1.7.2 Arid Zone
The arid zone (arid index 0.03-0.20) is characterized by pastoralism and no farming except with
irrigation. For the most part, the native vegetation is sparse, comprising of annual and perennial
grasses and other herbaceous vegetation, and shrubs and small trees. There is high rainfall
variability, with annual amounts ranging between 100 and 300 millimetres.

16
2.1.7.3 Semi-Arid Zone
The semi-arid zone (arid index 0.20-0.50) can support rain-fed agriculture with more or less
sustained levels of production. Sedentary livestock production also occurs. Native vegetation is
represented by a variety of species, such as grasses and grass-like plants, fortes and half-shrubs,
and shrubs and trees. Annual precipitation varies from 300-600 to 700-800 millimetres, with
summer rains, and from 200-250 to 450-500 millimetres with winter rains. Arid conditions also
are found in the sub-humid zone (arid index 0.50-0.75).
However, environmentalists have argued that aridity is a product of both natural and man-made
activities. The natural factors as mentioned above include climatic factors such as rainfall,
temperatures and evapotranspiration. Man-made factors on the other hand include deforestation,
soil erosion among others. While the man-made factors can be mitigated, natural factors require
adaptability.
Thirty-five percent of earth‘s people live in arid and semi-arid lands. The drylands cover 6150
million hectares i.e. forty-seven percent (47.2%) of Earths‘ total land surface area and closely
follow the world‘s map of poverty. While already exposed to climate extremes, according to
IPCC, drylands are likely to be severely hit by climate change. Despite increase in population in
arid areas, the concerns of populations living on these lands remain under-represented in climate-
action, development discussions and national policies
2.1.8 Carrying Capacity
Refers to the population size of the species that the given environment can sustain indefinitely
given food, habitat, water and other necessitiess available in the environment. The determinants
of carrying capacity include; water, ecological conditions, resource availability, population
growth rate, policy framework and technology.
Increasing population with lack of innovation and a clear policy framework on how to improve
productivity of land will see a decline in the carrying capacity. The carrying capacity of land can
be increased by applying the relevant technology and ensuring a conducive policy framework.
Countries like Israel with more than half of their land as drylands have embraced relevant
17
technology and clear policy framework. This has increased the carrying capacity of their land
thereby sustaining their population on a small land area.
2.1.9 Value Chain
Porter M, (1985) defines a value chain as the full range of activities including design, production,
marketing and distribution through which businesses/companies go through to bring a product or
service from conception to their customers. This is mainly entailed to add value to the product to
enable it draw a higher price on the market. A value chain approach brings producers,
processors, distributors, and end users together as co-producers in the niche market.
Incorporating innovative technology into the value chain is crucial to a better coordinated, more
efficient and more accessible system. It is also aimed at fully exploiting the possible potentials of
resource through forward and backward linkages.
A well-developed livestock value chain would be in a position to contribute significantly to
reducing extreme poverty as per the MDG‘s and vision 2030 with job creation and income
generation through improved value added. The main aim of a value chain is to produce value
added products or services for a market, by transforming resources and by the use of
infrastructures – within the opportunities and constraints of its environment. A good value chain
will have a higher multiplier effect created by value addition thereby creating more employment
opportunities for the local population. Each available resource use can be seen in its value chain
through the forward and backward linkages.
Features of a good value chain include:-
efficiency;
equitable along the chain and productive in pursuit of development objectives for poverty
reduction and food security;
all inclusive
features innovative aggregation models

18
Final Consumers
Shipping and Wholesale Distribution
Retailing of Dairy Products Food Manufacturers
Brand Development and Marketing
Dairy Processing
Manufacture of Dairy
Extraction of Milk
Constituents Processing of Raw Milk
Dairy Farming Milking
Dairy Herd Management
Animal Inputs (Stock and Veterinary Services
Pasture Inputs
(Land, Infrastructure and Fertilizers)
Flow of
Commodity
Flow of Value
Figure 2.1 Dairy Value Chain in New Zealand
Source: FAO, 2010
The above value chain portrays the flow of commodity and value from animal and pasture
inputs, through daily processing to brand development and marketing, shipping and wholesale
distribution, to either food manufacturer or daily retailing to the final consumers.
According to a survey done by FAO in East Africa region (2010), meat processing has a
multiplier effect of 11.7, suggesting that value added and processing of beef into assorted meat
products creates more jobs, followed by livestock feeds and dairy products.

19
Table 2.1: The Estimated Employment Multipliers for the Livestock Industry
Stage in the Value Chain Employment Multiplier
Meat products 11.7
Livestock feeds 10.0
Dairy products 8.24
Livestock (meat animals) 1.92
Milk 1.57
Animal fibre - 1.17
Source: FAO,2010
2.1.10 Resource
A resource refers to the concentration of naturally occurring solid, liquid, or gaseous materials in
or on the Earth's crust in such form that economic extraction of a commodity is regarded as
feasible, either currently or at some future time (FAO, 2010). In the context of this study, a
resource is characterized by utility, limited availability and potential for depletion or
consumption. Resources in arid and semi-arid areas include land, fertile soils, sunshine, wind,
minerals such as coal, oil, sand, gold etc. Resources in arid areas can either be renewable or non-
renewable hence the method of utilization should ensure its sustainability. Advanced technology
in the recent past has enabled governments to optimally utilize the resources to ensure
sustainability. The extraction of such resources should help the communities within these regions
to improve their economic status and livelihoods.
2.1.11 Resource Potential
Resource potential refers to the likelihood for the occurrence of undiscovered resources/wealth in
a defined area.
20
2.2 Overview of Resource Potential in Arid Areas
ASAL areas are endowed with a variety of resources depending on the aridity index and
geographic characteristics. Among the various resources available in ASALs include; (but not
limited to the following):-
2.2.1 Land and Landscape
Arid lands are defined by their large tracks of barren land and ranches. The large chunks of land
are mostly owned by the community who are mainly pastoralists. The environments encompass a
broad range of dramatic landscapes, including mountains, table lands, hilly terrains, low-angle
bedrock, alluvial fans, river plains, deltas, wadis and dry riverbeds, dunes,oasis and sand seas,
sand sheets, desert pavements and flats, and recent volcanic deposits. These features are
important both visually in a generally treeless landscape, and biologically as micro-habitats
hence a major tourist attraction. The ranches are a major resource for pastoralists who also
practice subsistence crop production. Land as a factor of production is a great input to any
business ventures. With secure tenure, land can be used as collateral to encourage people to take
loans for business developments. However, most arid lands are communally making it difficult
for individuals to access credit facilities.
2.2.2 Water Resources
Much of the water that is available to people living in drylands regions is found in large rivers
that originate in areas of higher elevation. These rivers include the Nile in the Sudan and Egypt;
the Tigris, the Indus, the Ganges, the Senegal, and the Niger; and the Colorado in the western
United States. Rivers have played a major role in these dry areas by encouraging crop production
which in turn has contributed to the extensive growth of agri-business industry e.g. in Israel and
California (USA). Agricultural production using water resources has become a major source of
income for the people in arid lands who use water for irrigation purposes.
Brown (2008), cited that North China Plain produces over half of the country‘s wheat and a third
of its maize using underground water. A world bank study in 2008 also reported that 15% of
India‘s food supply is produced by mining groundwater. In Kenya, Studies have found out
existence of underground water in arid areas. For instance, technology has revealed that the
drought-stricken Turkana region of northern Kenya lies atop two giant underground lakes, or
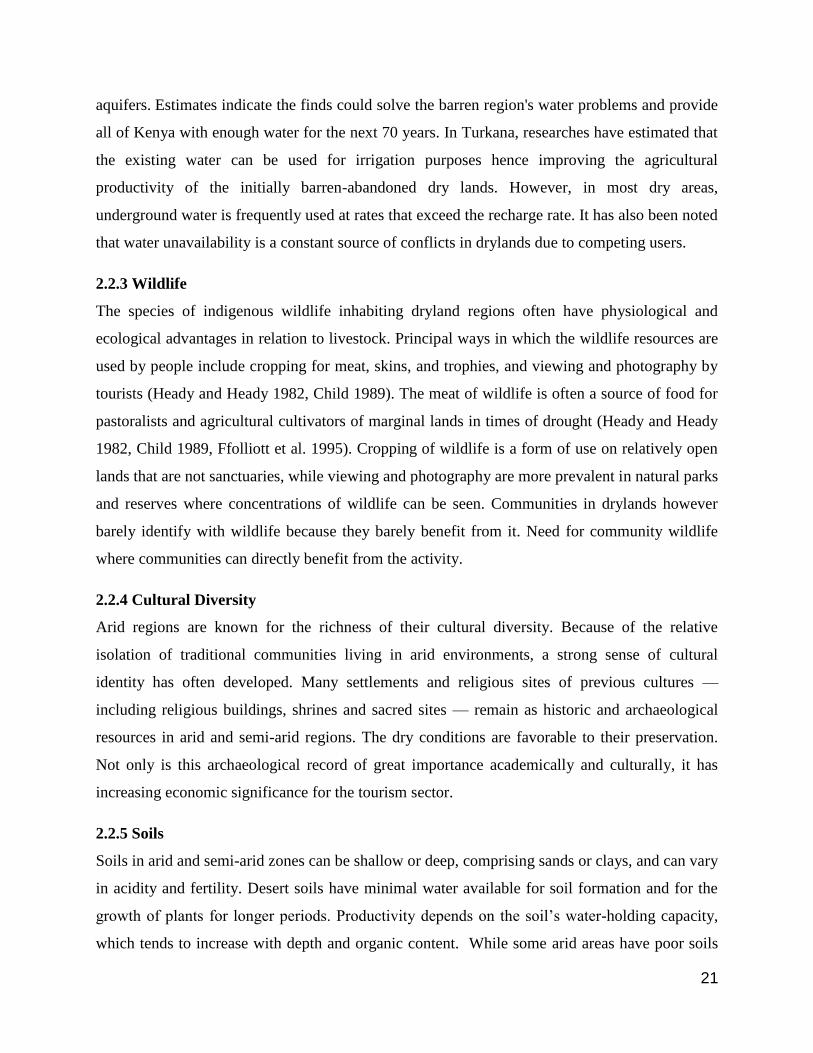
21
aquifers. Estimates indicate the finds could solve the barren region's water problems and provide
all of Kenya with enough water for the next 70 years. In Turkana, researches have estimated that
the existing water can be used for irrigation purposes hence improving the agricultural
productivity of the initially barren-abandoned dry lands. However, in most dry areas,
underground water is frequently used at rates that exceed the recharge rate. It has also been noted
that water unavailability is a constant source of conflicts in drylands due to competing users.
2.2.3 Wildlife
The species of indigenous wildlife inhabiting dryland regions often have physiological and
ecological advantages in relation to livestock. Principal ways in which the wildlife resources are
used by people include cropping for meat, skins, and trophies, and viewing and photography by
tourists (Heady and Heady 1982, Child 1989). The meat of wildlife is often a source of food for
pastoralists and agricultural cultivators of marginal lands in times of drought (Heady and Heady
1982, Child 1989, Ffolliott et al. 1995). Cropping of wildlife is a form of use on relatively open
lands that are not sanctuaries, while viewing and photography are more prevalent in natural parks
and reserves where concentrations of wildlife can be seen. Communities in drylands however
barely identify with wildlife because they barely benefit from it. Need for community wildlife
where communities can directly benefit from the activity.
2.2.4 Cultural Diversity
Arid regions are known for the richness of their cultural diversity. Because of the relative
isolation of traditional communities living in arid environments, a strong sense of cultural
identity has often developed. Many settlements and religious sites of previous cultures —
including religious buildings, shrines and sacred sites — remain as historic and archaeological
resources in arid and semi-arid regions. The dry conditions are favorable to their preservation.
Not only is this archaeological record of great importance academically and culturally, it has
increasing economic significance for the tourism sector.
2.2.5 Soils
Soils in arid and semi-arid zones can be shallow or deep, comprising sands or clays, and can vary
in acidity and fertility. Desert soils have minimal water available for soil formation and for the
growth of plants for longer periods. Productivity depends on the soil‘s water-holding capacity,
which tends to increase with depth and organic content. While some arid areas have poor soils

22
with low water holding capacity, some are well endowed with fertile black cotton soils especially
along the canals. Soils have been a great input contributing to increased agricultural productivity
in arid regions such as Israel and Egypt.
2.2.6 Vegetation and Flora
Vegetation types display a high diversity. They vary considerably from region to region, and
include different types of grassland, rangeland, woodland and forest that haveadapted to survive
under conditions of irregular rainfall, high solar radiation, fires andperiodic drought. Unique
flora and fauna provides opportunities for tourism industry by encouraging both local and
international tourism hence revenue generation. In addition, the development of forest resources
for the export trade in raw timber (the timber staple) prepares the way for the development of a
saw-milling (lumber) industry using the same basic resource inputs.
2.2.7 Wind
Because of the scarcity of vegetation that can reduce air movements, arid regions typically are
windy. For instance there are high wind speeds in various parts of northern Kenya and other arid
lands. Preliminary wind resource assessments show that wind regimes in certain parts of Kenya
(such as Marsabit, Ngong and the Coastal region) can support commercial electricity generation
as they enjoy wind speeds ranging from 8 to 14 metres per second (m/s). Wind energy has been
tapped in parts of Marsabit and Rift valley to provide electricity. Wind energy can also be used
to facilitate water supply for livestock and crop production in the rural areas.
2.2.8 Sunshine Intensity
Arid areas are well endowed with long hours of sunshine i.e. at least 6 hours of sunshine per day.
Given the right technology, the sunny conditions characteristic of arid regions can satisfy energy
needs in these areas. Energy provision encourages informal employment opportunities to the
people. The solar water heater is currently used in more than 90% of Israel homes. Solar
technology in Israel has advanced to the point where it is almost cost-competitive with fossil
fuels. The high annual incidence of sunshine in the Negev Desert has spurred an internationally
renowned solar research and development industry. At the end of 2008, a feed-in tariff scheme
was approved which has led to many residential and commercial solar energy power station
projects.

23
2.2.9 Minerals
Studies through-out the world have established existence of minerals in arid lands. These include
oil in Iraq. In Kenya recent studies have established the presence of oil/gas and underground
water in West Pokot and Turkana counties respectively. Sand harvesting is also a major activity
in dry regions especially along Ewaso-Nyiro River in Isiolo. Availability of mineral resources
has led to establishment of industries in dry regions to process the raw materials into finished
products for use and export to other regions. Sand harvesting has provided employment
opportunities to the young people in dry areas as they extract and transport the product to urban
areas for construction activities. This has in turn enhanced rural-urban linkages.
2.3 Land Use Patterns and Practices in ASALs
2.3.1 Settlement Patterns
Drylands are inhabited by more than 2 000 million people, nearly 40 percent of the world‘s
population (White and Nackoney, 2003). The population distribution patterns vary within each
region and among the climate zones comprising drylands. Regionally, Asia has the largest
percentage of population living in drylands: more than 1 400 million people, or 42 percent of the
region‘s population. Africa has nearly the same percentage of people living in drylands (41
percent) although the total number is smaller at almost 270 million.
Rural people living in drylands can be grouped into nomadic, semi-nomadic, transhumant and
sedentary smallholder agricultural populations. Nomadic people are found in pastoral groups that
depend on livestock for subsistence and, whenever possible, farming as a supplement. Following
the irregular distribution of rainfall, they migrate in search of pasture and water for their animals.
Semi-nomadic people are also found in pastoral groups that depend largely on livestock and
practice agricultural cultivation at a base camp, where they return for varying periods.
Transhumant populations combine farming and livestock production during favourable seasons,
but seasonally they might migrate along regular routes using vegetation growth patterns of
altitudinal changes when forage for grazing diminishes in the farming area. Sedentary
(smallholder) farmers practise rain-fed or irrigated agriculture (Ffolliott et al., 2002) often
combined with livestock production.

24
Drylands are characterised by dispersed settlement patterns with neighbours living as far as 10
kilometres from each other. In some parts of drylands with major water sources such as rivers
and canals, settlements are usually concentrated around/along water bodies. A case in point is
Isiolo where populations are concentrated along Isiolo and Ewaso Nyiro rivers for easier
accessibility to water for domestic and livestock use.
2.3.2 Farming
Dry land farming is generally defined as farming in regions where lack of soil moisture limits
crop or pasture production to part of the year. Dryland farming systems are very diverse,
including a variety of shifting agriculture systems, annual croplands, home gardens and mixed
agriculture– livestock systems, also nomadic pastoral and transhumant systems (Figure 3 and
Plate 3). They also include fallow systems and other indigenous intensification systems (FAO,
2004) for soil moisture and soil fertility restoration. Haas, Willis and Bond (1974) defined fallow
as a farming practice where and when no crop is grown and all plant growth is controlled by
tillage or herbicides during a season when a crop might normally be grown.
Plate 2.1: An Example of Dry Land Farming in Asia-Pacific Region
Source (FAO, 2004)
Successful dryland farming requires the integrated management of soil, water, crops and plant
nutrients. Small-scale, resource-poor, usually subsistence-based farmers, widely referred to as

25
small-holders, operate and survive in these varied, changeable and hazardous environments by
being able to manage the multiple risks (FAO, 2004) through diversification, flexibility and
adaptability (Mortimore and Adams, 1999). Stewart and Koohafkan (2004) and Stewart,
Koohafkan and Ramamoothy (2006) have also reviewed the importance and some of the
constraints of dryland farming. Expansion of cropland areas in dryland regions can fail owing to
overexpansion of inappropriate production technologies into the drylands environment. Increased
population pressures and human expansion into drier areas during long wet periods leave an
increasing number of people vulnerable to drought. Removing critical production elements (e.g.
dry-season grazing areas) from the traditional complex land-use systems through the introduction
of irrigated and non-irrigated crops, or the increased industrial and urban use of water, break
links in traditional production chains.
Largely unconfined livestock grazing has historically been widespread in the dryland regions of
the world and will continue to be a significant and, in some countries, a dominant land use into
the future. Small-scale and mostly rain-fed agricultural cropping is found on sites favourable to
this form of land use (Folliott et al. 2002). Larger-scale more intensive agriculture is practiced
where irrigation technology is available and economically feasible. Intensive forestry practices
have been uncommon in the past, although this form of land use has been increasing, especially
with the establishment of energy plantations for fuel-wood (Folliott et al. 1995). Interest in
dryland forestry as a sustainable land use has been gaining attention by both foresters and local
people.
2.3.3 Agro-Forestry
Combinations of agricultural cropping, livestock production, forestry, and other types of
production systems are frequently placed on the same piece of lands, either rotationally,
simultaneously, or spatially on the same piece of lands. Regardless of the nature of these
combinations, attaining ecological stability and sustainable benefits to users of the land is the
goal. Combined production systems that include trees or shrubs are known more commonly as
agroforestry systems (Nair 1989, Gordon and Newman 1997, Buck et al. 1999). Historically, it
has been a common practice for rural people living in the dryland regions to cultivate agricultural
crops and tree or shrubs in intimate combinations. Agroforestry is recognized by professional

26
and lay stakeholders as a set of systems, practices, and technologies that are capable of yielding
food and wood while conserving resources and, when necessary, rehabilitating ecosystem.
2.3.4 Tourism
Desert tourism is growing worldwide and will expand increasingly. Like other industries,
tourism has its social-cultural and environmental impacts which should be studied and evaluated
by the relevant authority.
2.3.5 Mining
Arid lands in the Middle East are well endowed with oil, hence mining is considered a major
land use practice in these areas for instance in Iraq. In Kenya recent studies have realised oil
deposits in northern Kenya i.e Turkana hence plans towards its exploitation are underway. Oil
and mining industry are increasing economic activities in arid and semi-arid areas.
The United Nations have identified five aquifers in parched Turkana, two of which have been
verified. The discovery of the reserves could improve the lives of generations and halt long-
running conflicts over natural resources. The underground supplies will also provide irrigation
and livestock needs in the region.

27
Map 2.1: Global Land Use Systems in Dry Lands
Source: FAO, (2000a).
2.4 Land Use Systems in Kenya’s Drylands
In Kenya, the ASALs occupy 89% of the country and are home to about 14 million people and
approximately 70% of the national livestock herd. Kenya covers an area of 591 958 km2, which
comprises 98.1 percent land and 1.9 percent water (GoK 2010b). Of the total land surface, 20
percent can be classified as medium to high potential arable land with the rest being classified as
arid and semi-arid lands (ASALs). Of the total ASAL region, the semi-arid area covers about 20
percent of the entire land area while the arid area, which is characterized by true desert
conditions, covers around 60 percent of the total landmass.
However, the arable land supports 80 percent of the human population while the ASALs support
the remaining 20 percent in addition to 50 percent of the livestock and 80-90 percent of the
wildlife resources in the country. Figure 2.2 below shows the country‘s broad land classification.
LAND USE SYSTEMS IN DRYLANDS
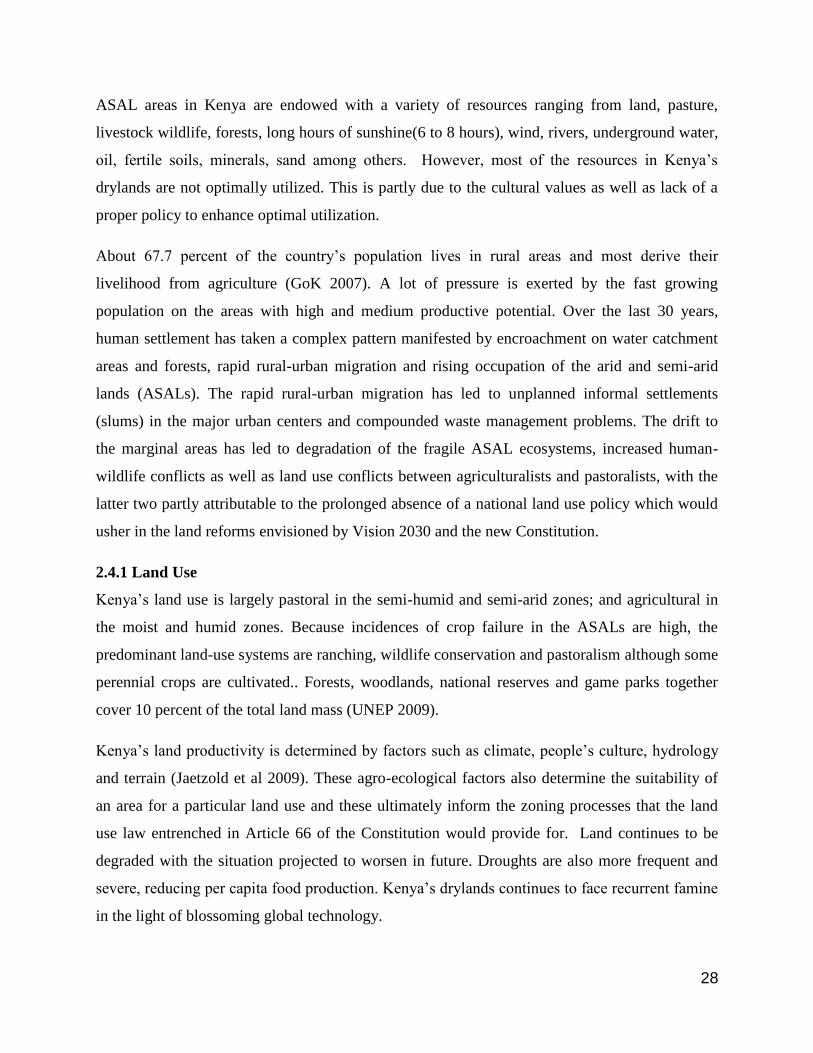
28
ASAL areas in Kenya are endowed with a variety of resources ranging from land, pasture,
livestock wildlife, forests, long hours of sunshine(6 to 8 hours), wind, rivers, underground water,
oil, fertile soils, minerals, sand among others. However, most of the resources in Kenya‘s
drylands are not optimally utilized. This is partly due to the cultural values as well as lack of a
proper policy to enhance optimal utilization.
About 67.7 percent of the country‘s population lives in rural areas and most derive their
livelihood from agriculture (GoK 2007). A lot of pressure is exerted by the fast growing
population on the areas with high and medium productive potential. Over the last 30 years,
human settlement has taken a complex pattern manifested by encroachment on water catchment
areas and forests, rapid rural-urban migration and rising occupation of the arid and semi-arid
lands (ASALs). The rapid rural-urban migration has led to unplanned informal settlements
(slums) in the major urban centers and compounded waste management problems. The drift to
the marginal areas has led to degradation of the fragile ASAL ecosystems, increased human-
wildlife conflicts as well as land use conflicts between agriculturalists and pastoralists, with the
latter two partly attributable to the prolonged absence of a national land use policy which would
usher in the land reforms envisioned by Vision 2030 and the new Constitution.
2.4.1 Land Use
Kenya‘s land use is largely pastoral in the semi-humid and semi-arid zones; and agricultural in
the moist and humid zones. Because incidences of crop failure in the ASALs are high, the
predominant land-use systems are ranching, wildlife conservation and pastoralism although some
perennial crops are cultivated.. Forests, woodlands, national reserves and game parks together
cover 10 percent of the total land mass (UNEP 2009).
Kenya‘s land productivity is determined by factors such as climate, people‘s culture, hydrology
and terrain (Jaetzold et al 2009). These agro-ecological factors also determine the suitability of
an area for a particular land use and these ultimately inform the zoning processes that the land
use law entrenched in Article 66 of the Constitution would provide for. Land continues to be
degraded with the situation projected to worsen in future. Droughts are also more frequent and
severe, reducing per capita food production. Kenya‘s drylands continues to face recurrent famine
in the light of blossoming global technology.

29
Map 2.2 Land Classifications in Kenya
Source: UNEP (2009)

30
2.5 Factors Determining Land Use Patterns and Practices in ASALs
2.5.1 Natural Resources
Human settlement patterns and practices differ in most ASALs depending on resource
availability, cultural practices and existing government policies.A considerable diversity of
people of different ethnicities and user groups live in arid environments. They range from
indigenous peoples, such as aboriginal hunter-gatherers and nomadic pastoralists, semi-nomadic
transhumance practitioners, through subsistence farmers in small settlements, to modern
industrial town-dwellers. However, the scarcity of water and the difficulties of agriculture have
meant that populations in arid environments tended to be sparse, with small groups of people
concentrated around water sources despite lack of other basic services such as electricity,
schools, security, and other related infrastructure. The water resource has usually determined the
size of the settlement despite absence of other basic services. The lifestyle and human activities
of people living in arid and semi-arid zones is traditionally characterized by their need to ensure
adequate water supplies and protection against food shortages. Populations in arid and semi-arid
zones, as in all other regions, are increasing, and the pattern of settlements is changing with
global market forces and community values.
2.5.2 Culture and Modern Policy
Scientists have rather argued that, land types and their spatial structure are the scientific basis for
sustainable land use patterns (Stamp D, 1961). In developed countries, land uses patterns and
practices are guided by existing government policies which are adequately enforced. In
developing countries, the land use practices have for a long-time been governed and determined
by an intricate system of customary land as well as water distribution and management. In
Kenya, land use practices in dry lands are basically determined by the cultural values of the local
community rather than the national policies. This has especially blossomed with the previous
governments making minimal investment in ASAL policies.
2.5.3 Poverty
People living in marginal environments try to survive by avoiding damage resulting from
hazards. Avoiding risks often entails maximizing the use of labour while minimizing the use of
capital-intensive resources with modern technology as the poor cannot afford to invest
sufficiently in their crops or in their natural resource base. The inability to incorporate scientific
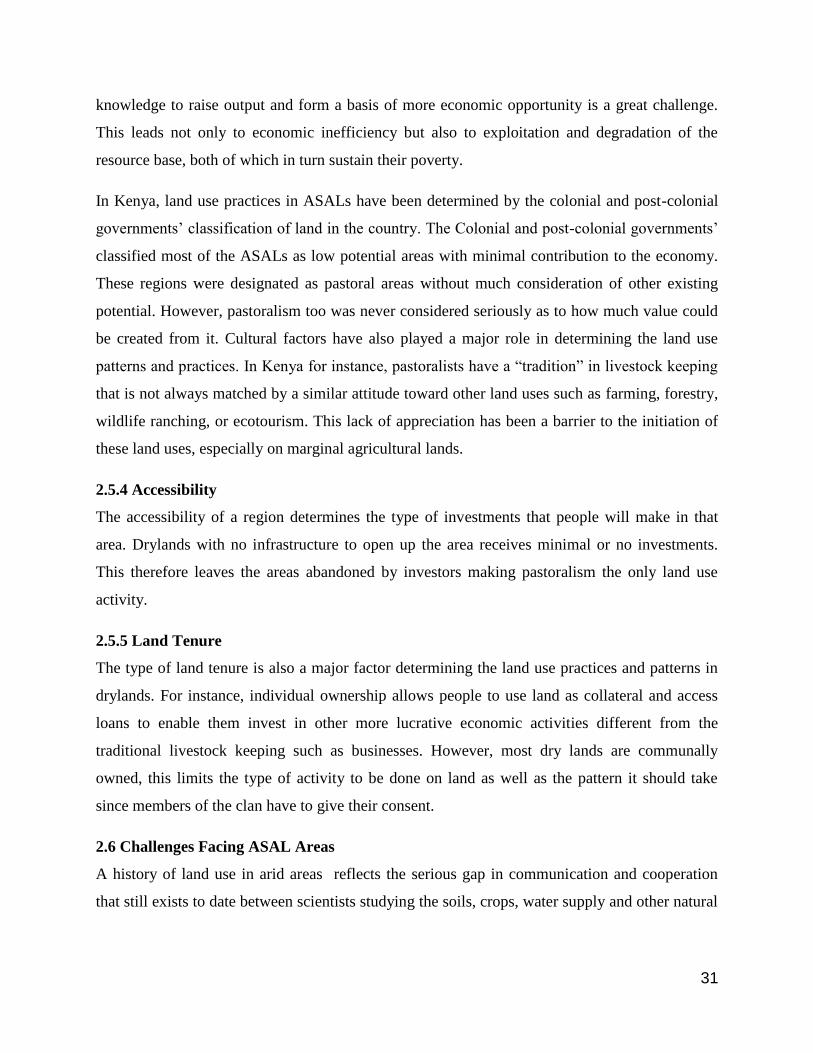
31
knowledge to raise output and form a basis of more economic opportunity is a great challenge.
This leads not only to economic inefficiency but also to exploitation and degradation of the
resource base, both of which in turn sustain their poverty.
In Kenya, land use practices in ASALs have been determined by the colonial and post-colonial
governments‘ classification of land in the country. The Colonial and post-colonial governments‘
classified most of the ASALs as low potential areas with minimal contribution to the economy.
These regions were designated as pastoral areas without much consideration of other existing
potential. However, pastoralism too was never considered seriously as to how much value could
be created from it. Cultural factors have also played a major role in determining the land use
patterns and practices. In Kenya for instance, pastoralists have a ―tradition‖ in livestock keeping
that is not always matched by a similar attitude toward other land uses such as farming, forestry,
wildlife ranching, or ecotourism. This lack of appreciation has been a barrier to the initiation of
these land uses, especially on marginal agricultural lands.
2.5.4 Accessibility
The accessibility of a region determines the type of investments that people will make in that
area. Drylands with no infrastructure to open up the area receives minimal or no investments.
This therefore leaves the areas abandoned by investors making pastoralism the only land use
activity.
2.5.5 Land Tenure
The type of land tenure is also a major factor determining the land use practices and patterns in
drylands. For instance, individual ownership allows people to use land as collateral and access
loans to enable them invest in other more lucrative economic activities different from the
traditional livestock keeping such as businesses. However, most dry lands are communally
owned, this limits the type of activity to be done on land as well as the pattern it should take
since members of the clan have to give their consent.
2.6 Challenges Facing ASAL Areas
A history of land use in arid areas reflects the serious gap in communication and cooperation
that still exists to date between scientists studying the soils, crops, water supply and other natural

32
foundations of human life and those studying man himself and why he uses the land on which he
depends.
2.6.1 Poverty and Tenure Considerations
The drylands of the world also suffer from the vicious cycle of low productivity, low levels of
investment, and, as a result, poverty. Investments, apart from those made for irrigated agriculture
activities, are relatively low (Marples 1986, Ffolliott et al. 1995, Squires and Sidahmed 1998).
The poverty and hunger that are prevalent in sub-Saharan Africa is a poignant example of this
situation.Poverty in drylands is exacerbated by land tenure insecurities where land is held under
customary law making it difficult for individuals to access credit facilities using land as
collateral. Nomadic societies that traditionally lived in drylands held land in common, leading to
the tragedy of the commons as population increases.There are also the social problems arising
from the difficulty of effectively managing communal grazing land; and the reluctance to make
investments of cash or labour in land which is held on a temporary or insecure lease.
2.6.2 Water Scarcity/Aridity
The two key features which adversely affect the productivity of drylands are the low amounts of
rainfall and the unreliability. Water scarcity is a major issue in all the drylands. Water resources
in arid lands are scarce and are mainly underground water and rivers.
Among the problems facing arid lands is the global climatic trend towards an increase in
temperatures (global warming), which would lead to an increase in aridity and decrease in the
available moisture (FAO 1981, p 13).
2.6.3 Land Degradation and Food Insecurity
Nomadic people lived in harmony with drylands for thousands of years. Land degradation begins
when populations increase to the point that the land can no longer sustain the people. Human
impact in drylands has led to soil degradation through salinization, waterlogging and wind
erosion. Land degradation has consequently resulted in desertification (Stewart and Robinson,
1997). Droughts, common to these areas, exacerbate the degradation processes. It is estimated
that almost 75 percent of the cropland in Central America is seriously degraded; 20 percent in
Africa (mostly pasture); and 11percent in Asia (IFPRI, 2001). These data suggest that, globally,
up to 40 percent of agricultural land is seriously affected by land degradation.
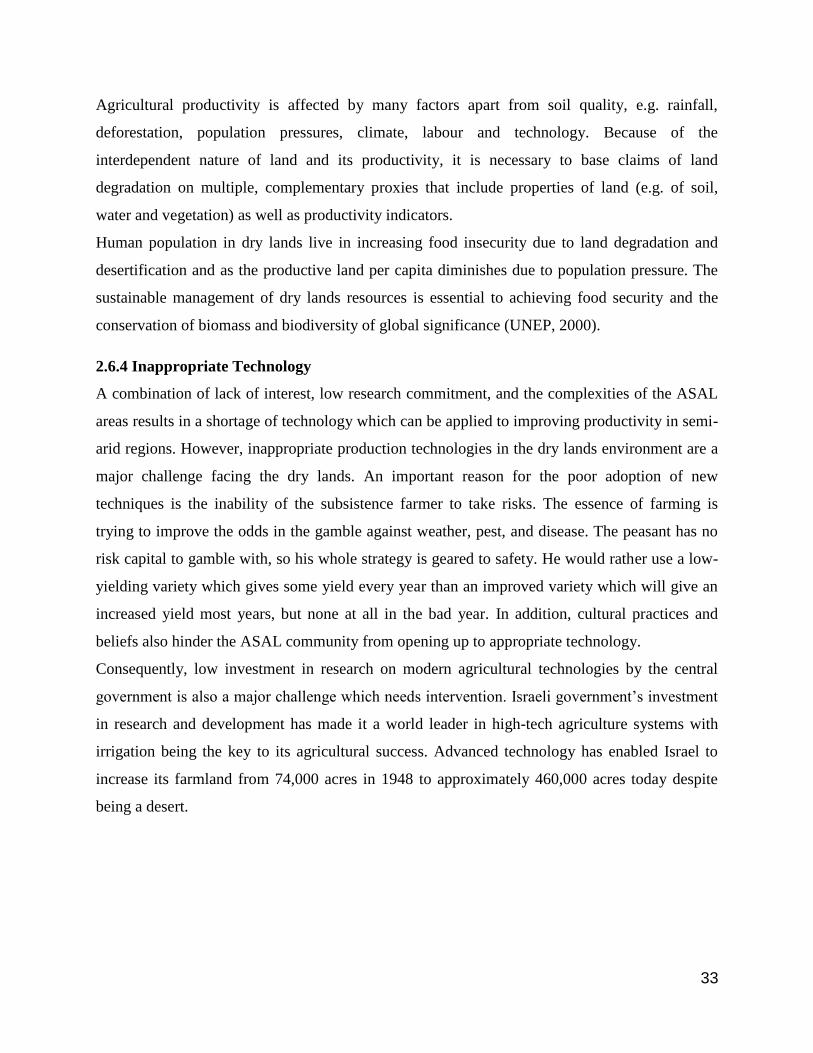
33
Agricultural productivity is affected by many factors apart from soil quality, e.g. rainfall,
deforestation, population pressures, climate, labour and technology. Because of the
interdependent nature of land and its productivity, it is necessary to base claims of land
degradation on multiple, complementary proxies that include properties of land (e.g. of soil,
water and vegetation) as well as productivity indicators.
Human population in dry lands live in increasing food insecurity due to land degradation and
desertification and as the productive land per capita diminishes due to population pressure. The
sustainable management of dry lands resources is essential to achieving food security and the
conservation of biomass and biodiversity of global significance (UNEP, 2000).
2.6.4 Inappropriate Technology
A combination of lack of interest, low research commitment, and the complexities of the ASAL
areas results in a shortage of technology which can be applied to improving productivity in semi-
arid regions. However, inappropriate production technologies in the dry lands environment are a
major challenge facing the dry lands. An important reason for the poor adoption of new
techniques is the inability of the subsistence farmer to take risks. The essence of farming is
trying to improve the odds in the gamble against weather, pest, and disease. The peasant has no
risk capital to gamble with, so his whole strategy is geared to safety. He would rather use a low-
yielding variety which gives some yield every year than an improved variety which will give an
increased yield most years, but none at all in the bad year. In addition, cultural practices and
beliefs also hinder the ASAL community from opening up to appropriate technology.
Consequently, low investment in research on modern agricultural technologies by the central
government is also a major challenge which needs intervention. Israeli government‘s investment
in research and development has made it a world leader in high-tech agriculture systems with
irrigation being the key to its agricultural success. Advanced technology has enabled Israel to
increase its farmland from 74,000 acres in 1948 to approximately 460,000 acres today despite
being a desert.
34
2.6.5 Population Pressure
The natural resources of arid regions are suffering increasing damage as they face increasing
demands and pressures from the rising population. The human population of ASALs is
increasing like any other region as a result of natural increase and immigration to urban settled
areas. In addition, the general migration from more densely settled areas has led to an increase of
settled agriculture in areas previously occupied by nomadic pastoralists. This has been
accompanied by a higher growth rate among the settled population than the nomads leading to
competition for scarce resources (e.g water and pasture) as well as exceeding the carrying
capacity of the vulnerable regions. This is a major cause of anxiety and ethnic conflicts in dry
lands. Population increases in semi-arid and arid regions and changes in regional climate often
lead to land degradation and sometimes to the collapse of societies in these regions.
2.6.6 Ineffective Developmental Policies
Unsustainable land use practices such as overgrazing and deforestation are the result of poor
government policies. Wise governments recognize the importance of the arid lands and plan
appropriately while poor governments do not. Some governments in developed nations have led
to wise use of arid land (Japan under the Tokugawa rule in the 17th century), others have had
poor policies which have led to destruction and unsustainable resource use.
For example, the Soviet Union's policy to expand agriculture into dry lands, by diverting water
from the Amu Darya and Syr Darya rivers into the desert for irrigation was unsustainable in that
it led to widespread land degradation and drying up of the Aral Sea.
In Kenya, dry areas were for a long time viewed as disadvantaged with minimal contribution to
the development process. Most arid areas have suffered historical alienation since the colonial
period. Consequently, there was no coherent pastoral development policy in Kenya. The piece-
meal approach to ASAL policy formulation introduced inconsistencies and challenges in policy
implementation to the detriment of ASAL development. The policies were not holistic as they
lacked aspects on value chain. In addition, the policy formulation process did not involve the
local community hence the output did not reflect the actual ASAL development issues. For
instance the resource potentials were barely taken into consideration.
35
2.6.7 Low Infrastructure
The infrastructure is usually less well developed in semi-arid regions because there has been both
less demand for roads, water supplies, and marketing outlets, and also because the low level of
productivity does not justify development of these facilities. In addition, the economic
justification for infrastructure provision was the main determining factor as opposed to the social
rationale in the public interest and human rights.
2.7 Case Studies on Utilisation of ASALs
2.7.1 Israel
Israel‘s total land area is approximately 22,000 km2, of which only 4,400 km
2 – about 20% – are
arable. More than half of the country is characterized by an arid and semi-arid climate, and a
large part of Israel is hilly. A narrow coastal strip and several inland valleys comprise most of the
fertile areas, where water supplied from aquifers and the Sea of Galilee make irrigation possible.
Israel‘s climate, together with extensive greenhouse production, enables production of
vegetables, fruit and flowers during the winter off-season, especially for export to European
markets.
Efficient use of land, a significant goal worldwide, is even more critical in Israel due to its
increasing land shortage in the face of current and projected development rates. Higher housing
density, reuse of existing built-up areas, joint infrastructures, efficient land use for public areas
and buildings, mixed land uses, utilization of underground space, utilization of marine space,
utilization of desert areas by means of appropriate technologies, utilization of mega-structures,
and rehabilitation/reuse of areas for alternative use—all are critical issues in a country
characterized by scarce land resources.
The total annual water potential is roughly 2 billion m3. Due to over-pumping and frequent
droughts, the actual available annual water volume is 1.5 to 1.7 billion m3. The annual water
allocation for agriculture is about one billion m3, about one half of which is recycled and
brackish water. Water is regarded as a national asset and is protected by law. Users receive their
annual allocation from the Water Commission. The entire water supply is measured and payment
calculated according to consumption and water quality.

36
2.7.2 Production
Only 20% of the land area in Israel is arable while the rest is a desert with unfavourable climate
and lack of water resources. However, Israel has transformed a desert into an agricultural
potential land being a major exporter of fresh produce world-wide. Kibbutz Ein Gedi near the
Dead Sea is a good example of a transformed desert. Agriculture and related agri-business
represents 2.5% of the total GDP and 3.6% of the exports in Israel (Israel Central Bureau of
Statistics, 2006). While agricultural worker makes up only 3.7% of the total work-force, Israel
produces approximately 95% of its own food requirements, supplementing this with imports of
grain, oilseeds, meat coffee, cocoa and sugar. The average monthly income per agricultural
employee was $1,530 in 2002. In 2007, some 64,400 people were directly employed in
agriculture in 2007 representing 2.3% of the country‘s total labor force. In the early 1950s, one
full-time agricultural employee supplied food for 17 people. In 2007, one full-time employee
supplied food for more than 100 people.
2.7.3 Vegetables Production
According to data for 2002, the vegetable growing sector in Israel accounts for about21% of total
agricultural production in the country and about 35% of total horticultural production. The value
of the vegetable sector is estimated to be about$ 672 million. Production stood at 1.7 million
tons, which are intended for consumption in the domestic market, export of fresh produce to
Europe and the USA, and industrial processing and canning.
The increase in production and the uninterrupted supply of vegetable crops were made possible
due to the exploitation of a number of factors in the production process, including: production in
different regions, production in protected conditions, exploitation of regional climatic conditions
and production in different seasons, introduction of new crops and new varieties.
About 45,000 hectares of vegetables are grown in open fields. These vegetables have been
adapted to the climatic conditions in Israel and may be grown in various regions, according to
the growing seasons and the climatic conditions present there. This group includes potatoes,
carrots, onions, garlic, leafy vegetables, sweet potatoes, summer-sown melons and watermelons,
and vegetables destined for industrial processing, such as tomatoes, corn, peas, and cucumbers
for pickling. Production in protected conditions has expanded in recent years and now covers
about4, 000 hectares, in which a wide variety of vegetables are grown.

37
Production for export is a main source of income for Israel‘s vegetable growers.
2.7.4 Field Crops
Field crops require a high degree of mechanization. These crops are grown on about175,000
hectares in Israel, 125,000 of which are winter crops, such as wheat for grain and silage, barley
for grain, hay and grazing, and legumes for hay and seeds. Some 50,000hectares are planted with
summer crops, such as cotton, sunflowers, chickpeas, green peas, beans, corn, industrial
tomatoes, groundnuts (peanuts), and watermelon for seeds. Most of these crops are irrigated
using modern technologies and are not rain fed.
The value of field crops reached $200 million in 2002, of which $70 million were from exports
(mainly cotton, groundnuts, sunflowers, and sweet corn for processing). Most field crops
produce high yields and are of top quality - the result of joint efforts between R&D and
extension personnel, related institutions, and the farmers.
In 1997, $107million worth of cotton was grown in Israel on 28,570 hectares of land, all of
which drip irrigated. 5.5 tons per hectare of raw cotton was averaged for Acala crop while the
Pima crop averaged at 5 tons per hectare. These were among the highest in the world.
2.7.5 Livestock Rearing
Israel also has much to offer in livestock rearing. Most cowsheds on the country‘s kibbutzim and
moshavim are computerized parlors where the average cow produces around 10,000 liters of
milk per year according to data published in 2011 by the Israel Central Bureau of Statistics,
outperforming the US (9,331 kg per cow), Japan (7,497), the European Union (6,139) and
Australia (5,601). The country is also a market leader in poultry with high egg-laying yields and
Israelis are the world‘s largest per-capita consumers of turkey meat. Israel has also become the
world‘s second largest producer of ostrich meat (all of which is exported), and large quantities of
fish are raised in ponds.
2.7.6 Technology
Israel is a world leader in applying high-tech systems to agriculture with irrigation being the key
to its agricultural success. This among others involves computerized irrigation systems which
also distribute fertilizers to new genetically developed varieties of seeds and livestock. The
Israeli invention of drip or precision irrigation has enabled small amounts of water to go a long

38
way. The area of irrigated farmland has increased from 74,000 acres in 1948 to approximately
460,000 acres today. Israel exports more than $250 million of irrigation equipment annually.
Israeli researchers and farmers have successfully produced world record yields in many sectors.
The greenhouse has also been adapted in arid conditions enabling farmers to design their own
climatic conditions.
2.7.7 Export
Agricultural export (fresh and processed) for 2007 reached $2,172 billion, 4.7% of the country‘s
total exports. Exported fresh produce amounted to $1,326 million, mainly to the European
Union, while exported processed food products totaled $846 million. In addition, a total of $2.1
billion of agricultural inputs were exported (2007). This figure is the outcome of advanced
agricultural technology, which has created a thriving industry of sophisticated industrial inputs.
Hands-on experience in local agriculture serves as a laboratory for the development, design and
manufacture of new input technologies.
2.7.8 Settlement Patterns in Rural Israel
Much of Israel‘s agriculture is based on cooperative communities (kibbutz and moshav), founded
on nationally owned land leased on a long-term basis in the early 20th century. The kibbutz is a
large collective production unit. Kibbutz members jointly own the means of production and share
social, cultural, and economic activities. At present, most of the kibbutz income comes from
industrial enterprises owned by the collective unit. The kibbutz (Hebrew word for ―communal
settlement‖) is a unique rural community; a society dedicated to mutual aid and social justice; a
socioeconomic system based on the principle of joint ownership of property, equality and
cooperation of production, consumption and education; the fulfilment of the idea ―from each
according to his ability, to each according to his needs‖; a home for those who have chosen it
(Havatzelelet,2006).
Another type of cooperative community, based on 50 to 120 individual family farms, is the
moshav, which is defined and registered as an ―agricultural cooperative society‖. The moshav is
based on shared allocation of resources, such as farm land, water quotas, and other productive
inputs, as well as, in some cases, provision of packing and marketing facilities. The residents in
both types of settlements are provided with a package of municipal services. A third type of
settlement is the moshava, which is a village of private farmers. The kibbutz and the moshav
39
currently account for 83% of the country‘s agricultural produce. In addition to the Jewish
agricultural sector, Arab villages are located in Israel‘s rural areas. These villages focus mainly
on production of small livestock (sheep and goats), vegetables, field crops and olives. The rural
sector is an integral part of Israel, a country rich in historical and cultural tradition, in which a
unique tourism experience, combining sight-seeing, relaxation, sea and desert adventures, and an
introduction to some of the most innovative agriculture in the world, can be weaved. These agro-
tourism activities combine the best of both agriculture and tourism, and provide the rural
community with a larger range of livelihood sources.
Today some 270 kibbutzim, with memberships ranging from 40 to more than 1,000, are scattered
throughout the country. Most of them have between 300 and 400 adult members, and a
population of 500-600. The number of people living in kibbutzim totals approximately 130,000,
about 2.5percent of the country's population.
2.7.9 Organisation of Communal Settlements
The kibbutz functions as a direct democracy. The general assembly of all its members formulates
policy, elects officers, authorizes the kibbutz budget and approves new members. It serves not
only as a decision-making body but also as a forum where members may express their opinions
and views.
The kibbutzim are adequately provided with services and infrastructure such as roads, schools,
social halls, recreational centres, police posts etc. The solar water heater is currently used in
more than 90% of Israel homes. At the end of 2008, a feed-in tariff scheme was approved which
has led to many residential and commercial solar energy power station projects.
For the founders, tilling the soil of their ancient homeland and transforming city dwellers into
farmers was an ideology, not just a way to earn a livelihood. Over the years, kibbutz farmers
made barren lands bloom, with field crops, orchards, poultry, dairy and fish farming, and-more
recently-organic agriculture is becoming the mainstays of their economy.
Through a combination of hard work and advanced farming methods, they achieved remarkable
results, accounting for a large percentage of Israel's agricultural output to this day. Production
activities of the kibbutzim are organized in several autonomous branches. While most of them
are still in agriculture, today virtually all kibbutzim have also expanded into various kinds of
40
industry.Currently, most of the kibbutz income comes from non-agricultural activities (industrial
enterprises, agro-tourism and services) and many are undergoing extensive reorganization.
Kibbutzim have also pooled their resources, establishing regional enterprises such as cotton gins
and poultry-packing plants, as well as providing a gamut of services ranging from computer data
compilation to joint purchasing and marketing. The contribution of the kibbutzim to the country's
production, both in agriculture (33% of farm produce) and in industry (6.3% of manufactured
goods) is far greater than their share of the population (2.5%).
From the above literature, the communal settlements have had many benefits in terms of
adequate service provision for its members as well as enhancing optimal resource utilization in
the light of scarce land resources. People live in settlements while the rest of the land is left for
mechanised farming. The model embraces mixed uses, densification, sharing of resources etc.
This model represents the best practices which should be emulated by other arid regions with
scarce resources.
2.7.10 Lessons Learnt
Israel agriculture sector‘s high level of development is due to the close cooperation and
interaction between scientists, extension advisers, farmers, and agriculture-related industries.
These four elements have joined together to promote advanced technologies in all agricultural
branches. The result is modern agriculture in a country, half of which is defined as desert.
Community farming: Most of Israel's agriculture is based around co-operative principles, which
evolved during the start of the twentieth century. Two unique forms of agricultural settlements;
the kibbutz, a collective community in which the means of production are communally owned
and each member's work benefits all; and the moshav, a farming village where each family
maintains its own household and works its own land, while purchasing and marketing are
conducted co-operatively. Both communities provided a means not only to realize the dream of
the pioneers to have rural communities based on social equality, co-operation and mutual aid but
also to gain agricultural output in a productive means continuous research on better farming
methods, drought resistant crops etc. The use of sophisticated drip irrigation as well as the
development of improved varieties helps this sector maintain its competitive advantage in world
markets.
41
To improve the profitability of crops, field crop cultivation is highly mechanized and
advanced GPS, GIS and irrigation technologies are employed to optimize land and water
use.
Government intervention through strong policy measures on agricultural production.
Value addition through increased agro-based industries
Israel‘s agricultural sector is characterized by an intensive production system, which
stems from the need to overcome the scarcity of natural resources, particularly water.
The Israel government has developed policies which are holistic in nature to help
enhance the production of desert land and community participation in decision making
regarding policy formulation and budgetary control.
Settlement planning- Much of Israel‘s agriculture is based on cooperative settlements;
members jointly own the means of production and share social, cultural, and economic
activities. People live in villages while the rest of the land is put under mechanized
farming. The model represents a model which enhances optimal use of scarce resources
while increasing productivity.
Water scarcity and price policy necessitate the use of marginal water, such as brackish
and reclaimed.
The land ownership structure is also a major factor contributing to the development of
Israel‘s:-i.e. the law allows for individual ownership of land and farmers only come
together in cooperatives during the production process.
2.8 Egypt
The Nile is the world's longest river, stretching 95 4,187 miles from its source in the mountains
of Burundi. The source of the river is so far from the Mediterranean. The Nile River being the
longest river in the world has been associated with farming and agriculture in Egypt. The river
has over-time flooded between June and October hence providing silt which enhances farming.
After floods, there would be a fertile strip along the Nile River of about 12 miles wide. The Nile
River has not only provided water for farming in the arid zone but also supplied water for
domestic use. The economy of Egypt has for a long time grown stronger because of irrigation
farming providing increased food supply.

42
The valley is a canyon running 660miles long with a flood plain occupying 4,250 square miles.
The delta spans some 8500square miles and is fringed in its coastal regions by lagoons, wetlands,
lakes and sand dunes.
Map 2.3: River Nile Showing the Extent of the Floodplain
Source: FAO, 2002
2.8.1 Farming Sector
The value of field crops, however, was estimated in 2007 at about US$4.3 billion]which
represent 63.7%. The value of vegetables, fruit and medicinal, aromatic and ornamental plant
crops are estimated at about 12.1%, 14.2%, and 0.7%; respectively, of the total crop production
value.
2.8.2 Livestock Rearing
Livestock form an important component of the agricultural sector, representing about 24.5% of
the agricultural gross domestic product with value of around EGP [Egyptian pounds] 33.6 billion
43
[US$6.1 billion] in 2007 (SADS, 2009). In 2005 local production covered about 92.5, 82.2, 100,
81.9, 100, 100 and 100% respectively for milk, red meat, white meat, fish, eggs, wool and
leather. Each of cattle, buffalo, sheep, camel, and goat populations contributes about 51.6, 33.2,
6.5, 5.9 and 2.7% of local red meat production, respectively, which reached 629 000 tonnes in
2005. There is no surplus of animal production for export except some limited numbers of sheep
and goats. The sector is depending mainly on the private sector, with the majority of animal
breeders being smallholder farmers and the share of the government sector is less than 2% of the
total animal numbers.
Meat and milk productivity of both cattle and buffalo experienced significant increases during
the period 1980-2007. Average cow milk production increased from around 675 kg/head/season
in 1980 to around 1.3 tonnes/head/season in 2007
2.8.3 Land Reclamation in Egypt
With almost 97% of the population confined to the Nile valley and delta and their desert fringes,
Egyptians have long been concerned with increasing cropped acreage and reclaiming land for
agriculture. The current land use trend has led to increased transformation and fragmentation of
agricultural land. The trend has increased land values for non-agricultural purpose posing a
danger to small scale farming. To counter the increased loss of old agricultural land, the
Egyptian government plans to increase land reclamation in the desert areas from 630,000Ha in
2006 to a projected 2,520, 000Ha in 2025 through the development of large scale modern
agricultural production.
After the 1952-revolution, increased agricultural production through horizontal expansion i.e.
through reclamation of desert lands was declared to be among the most important objectives of
the Egyptian Government (Meyer, 1978; Wolff, 1993). Since then, land reclamation has been
used for a number of different policy purposes and reclamation of the desert continues, despite
the inherent problems in resettling people and cultivating the desert. Land reclamation in the
Egyptian context means converting desert areas to agricultural land and rural settlements. This is
done primarily by ‗adding water‘ i.e. by extending the water canals from existing agricultural
land into the desert, but also by working with the soil, ploughing in manure in order to enhance
its fertility, and finally by providing the infrastructure for making new villages. The principal
44
purpose was and still is to increase the agricultural production and ‗overcome Egypt‘s
overwhelmingly unfavourable population to land ratio‘ (Springborg, 1979, p. 54).
It is argued that with a growing population there is a pressure to increase the agricultural
production and it is not enough to bring more intensive means of cultivation into practice –
horizontal expansion is necessary. The arguments are supported by descriptions of how the
waters of the Nile meander through the country leaving a green ribbon in the desert land. Except
from the delta and the Fayoum oasis, only a narrow strip along the Nile is cultivated and the
population is also concentrated in these areas. Only about 4% of Egypt‘s total area is agricultural
land and this area has one of the highest population densities in the world. Viewed from this
perspective, reclamation of the desert appears ‗natural‘, almost inevitable in light of the
population growth and increased congestion in the so-called old lands – these are the lands in the
Nile Valley and the delta. Agricultural areas have increased from around 2 465 400 ha in 1980 to
around 3 544 800 ha in 2007, an increase of 44% during this period.
2.8.4 Settlement Patterns in the Rural Egypt
The Nile has largely determined the settlement patterns of ancient Egypt. Even with all the
modern progress attributed to today, Egypt's settlement pattern mirrors closely that of older
times, in as far as viable habitation is, and was only possible within the Nile's floodplain; a
narrow strip of land, limited to several miles each side of the river. Habitation was only possible
within the Nile's floodplain, where all agrarian activity took place and where much depended on
the river's behaviour and the regularity of its inundation. Arable land accounted for a small
percentage of the vast expanse of Egypt's area and it was here that the vast majority of the people
were to be found. Apart from some isolated oases in desert regions, everything was concentrated
along Egypt's main artery of the Nile.
Physiographically, Egypt is usually divided into four major regions—the Nile valley and delta,
the Eastern Desert, the Western Desert, and the Sinai Peninsula. The settled Egyptian
countryside, throughout the delta and the Nile valley to the High Dam, exhibits great
homogeneity, although minor variations occur from north to south. The settlement pattern of
ancient Egypt was largely determined by access to resources, with the distribution of the
settlements closely reflecting the shape of the favourable land. The combination of the desert

45
periphery and the Nile allowed a highly civilised culture to flourish successfully for thousands of
years.
The typical rural settlement is a compact village surrounded by intensively cultivated fields. The
villages range in population from 500 to more than 10,000. They are basically similar in physical
appearance and design throughout the country, except for minor local variations in building
materials, design, and decoration. Many of the villages are built along the banks of its canals.
Some of the oldest villages are situated on mounds—a relic of the days of basin irrigation and
annual flooding.
2.8.5 Success Practices of Farming in Egypt
Agriculture was the source of welfare and prosperity in ancient Egypt and today. The agricultural
sector is responsible for achieving food security and meeting local needs in food commodities,
and is a main source of providing raw materials for many industries in Egypt. It absorbs about
27.8% of total Egyptian labour force. Due to the economic importance of such vital sector,
investments allocated to agriculture have rapidly increased over the past two decades (FAO,
2010).
Agricultural exports are a promising means of developing the Egyptian national income. They
actually succeeded in achieving constant growth, where their value rose from LE 471 million in
1982 to a bout LE 5.8 billion in 2004/05, as a result of developing agricultural production and
the application of organic agriculture system especially in new lands.
Egypt embarked upon an ambitious plan to add about 1,344,000 Ha of reclaimed agricultural
lands over the period (1997 – 2017), through implementing a number of giant agricultural
projects in south of the Valley , Sinai and Western Desert . These projects attract investments
from the Egyptian private, Arab and foreign sectors.
Giant agricultural expansion projects at the south of the Valley for instance Toshka project
started on January 9th 1997, to create a new Delta at south of the western Desert parallel to the
Nile. It adds 226,800 Ha to the agricultural area irrigated by the Nile water through El Sheikh
Zayed Canal costing about LE 5.5 billion.
46
The agricultural sector has witnessed significant developments over the last two decades with
direct effects on its role in national income formation and promoting exports. Such developments
have also affected farmers‘ delivery as related to the cropping pattern, applied technology, levels
of income and farmers‘ response to market changes.
2.8.6 Lessons Learnt
a) Policy Aspects: reforming the agricultural policy to cope with actual needs for local and
export market. The Structural Adjustment Programme has led to a significant improvement in
food self-sufficiency at the national level, which is an important element in food security
b) Land Tenure Reform: The review of the land owner-tenant relationship law, and the
enactment of a new law with the purpose of activating market forces in determining land rental
and land market values that constitute the main elements of production, thus improving the
efficiency of land distribution among the various agricultural activities.
c) Marketing: Egypt is a party to a number of regional integration schemes. The European
Mediterranean Agreement for Egypt was initialled in January 2001. In 1998, Egypt became a
member of the COMESA, which opens up 19 new markets in Africa with more than 350 million
consumers. Also, in January 1998, Egypt began implementing the Greater Arab Free Trade
Agreement reached with Arab League members in connection with the Arab Common Market
Treaty of the 1960s. Egypt has signed in addition a number of bilateral free trade agreements.
Free trade zones have been created on a bilateral basis between Egypt and Tunisia, Turkey,
Jordan, Lebanon, Morocco, Libya and Syria. Finally, in May 1998, Egypt and the United States
agreed to begin talks on a Trade and Investment Framework Agreement, which is expected to be
an intermediary step before strategy talks on a free trade agreement in the future. Egypt receives
OECD trade preferences under the GSP that allow its exports access to these markets at zero
duties or at tariffs below MFN rates
d) Settlement Planning: The typical rural settlement is a compact village surrounded by
intensively cultivated fields. This type of settlement planning prevents increased subdivision of
land into uneconomical sizes thereby enhancing mechanized farming. The model also makes it
easier for the local authorities to provide the residents of these communities with services such
electricity, roads, water, sewerage, schools, social halls, library, police post, health facilities

47
among others. People live in these compact villages as they cultivate their lands surrounding the
villages. Farmers in settlements have formed associations which they use to pool resources
towards their cultivation of lands as well as making vital decisions towards policy making on
agriculture. This model ensures optimal resource use as it concentrates human settlements in one
place while applying intensive mechanised cultivation on the open fields surrounding the
villages. The model is built on densification of services, mixed uses, sharing etc.
e) Planning and Projection: Egypt embarked upon an ambitious plan to add about 1,344,000 Ha
of reclaimed agricultural lands over the period (1997 – 2017).This is meant to counter the
increased loss of old agricultural land by fragmentation due to population pressure.
2.9 Kenya
Most East African countries have for decades viewed arid and pastoral areas as net consumers of
national wealth that offered poor prospects of return on investments. Thus arid areas dominated
by pastoralists have been side-lined in decision-making processes in East Africa. The result is
chronic underinvestment in pastoralist communities across the region, and the consequent
increase in vulnerability.
Although they cover more than two thirds of the country‘s landmass, include nearly one third of
the national population, and are situated strategically along the borders with neighbouring
countries, the people living in the ASALs of Kenya have suffered historical marginalisation. This
has been reinforced by national development policy as well as attitudes at the highest levels of
government. The ASALs have been characterised as low potential areas that could only be
developed on the basis of returns generated from the so-called high potential areas.
The 1965 Sessional Paper on African Socialism and its Application to Kenya states: ‗One of our
problems is to decide how much priority we should give in investing in less developed provinces.
To make the economy as a whole grow as fast as possible, development money should be
invested where it will yield the largest increase in net output. This approach will clearly favour
the development of areas having abundant natural resource, good land and rainfall, transport and
power facilities, and people receptive to and active in development.‘

48
Over the past decade it has become evident to the political leadership that it is never going to be
possible to develop the country if more than 80 per cent of its land mass is not at the centre of the
development process. In June 2003 the National Rainbow Coalition (NARC) government
published the Economic Recovery Strategy for Wealth and Employment Creation 2003-2007
(ERS). In a significant departure from the practice of previous national development policies, the
document provides comprehensive coverage of the ASALs, devoting the entire Chapter 8 to the
area and its issues. The most significant policy measure in favour of ASAL development arrived
with the creation of the Ministry of State for Development of Northern Kenya and other Arid
Lands (MNKOAL) in April 2008. This put in place a political framework for mainstreaming
ASAL issues into government planning at the level of Cabinet.
2.9.1 A Changing Policy and Institutional Context
By the time the MNKOAL was created, Kenya‘s Vision 2030 had been published and been
under implementation for nearly a year. The Ministry set about reviewing Vision 2030 to align it
more closely to the needs of Northern Kenya and other Arid Lands. The Vision 2030
Development Strategy for Northern Kenya and other Arid Lands now constitutes an integral part
of the five-year Medium Term Plans for implementation of Kenya Vision 2030. The Ministry‘s
review was informed by the conviction that, in order for the ASALs to fully benefit from and
take advantage of the interventions envisaged in Vision 2030, their historical marginalisation
must be addressed through some form of affirmative action. The implementation of Vision 2030
might otherwise perpetuate and worsen their marginalisation.
The adoption of the Constitution of Kenya 2010 marked an important threshold as it
institutionalised a major shift in the narrative about the ASALs. Article 56 of the Constitution
provides for affirmative action to redress historical marginalisation, providing constitutional
backing for the strategies in the Vision 2030 Development Strategy for Northern Kenya and
other Arid Lands.
Other provisions of the Constitution that strengthen the position of the ASALs include provisions
on devolved government, the objects of which include: ‗to protect and promote the interests and
rights of minorities and marginalised communities‘ and ‗to ensure equitable sharing of national
and local resources throughout Kenya.‘ The Constitution defines marginalised communities to
include ‗pastoral persons and communities, whether they are (i) nomadic; or (ii) a settled

49
community that, because of its relative geographic isolation, has experienced only marginal
participation in the integrated social and economic life of Kenya as a whole.‘ The Constitution
also creates an Equalisation Fund ‗into which shall be paid one half per cent of all the revenue
collected by the national government each year. ‗The Fund, which shall run for at least 20 years,
shall be used ‗only to provide basic services including water, roads, health facilities and
electricity to marginalised areas‘ in order to bring the quality of these services in those areas to
the level generally enjoyed by the rest of the nation.
The most important achievement of the MNKOAL however, and the climax of reforms in favour
of the ASALs, is the adoption and launch of Sessional Paper No. 8 of 2012 on the National
Policy for the Sustainable Development of Northern Kenya and other Arid Lands(known as the
ASAL Policy).This Policy, which has been in the works for nearly two decades, marks a
highpoint in the quest for an appropriate policy framework for ASAL development in Kenya.
The adoption of the ASAL Policy and the establishment of the National Drought Management
Authority, the ASAL Secretariat, and other components of the ASAL institutional framework
(such as the National Council on Nomadic Education and the Livestock Marketing Board),
should now effectively secure the mainstreaming of ASAL development into national economic
development planning.
Kenya‘s often-quoted first development blueprint, Sessional Paper No. 10 of 1965,
recommended that ―development money should be invested where it will yield the largest
increase in net output. This approach has over time favoured the development of areas with
abundant natural resources, good land and rainfall, transport and power facilities, and people
receptive to and active in development‖. Nearly 50 years later, a new policy on development of
northern Kenya and other arid lands is seeking to reverse the narrative, proposing a range of
initiatives that could see the country turning to the arid, hitherto considered unproductive and
less-endowed, for growth.
Increasing pressure on arable land that is less than 20 per cent of Kenya‘s land surface, glaring
disparities in human development indicators and the recent discovery of large amounts of oil in
Turkana in the arid northwest of the country are among factors that have influenced the new
focus on the north. Sessional Paper No. 8 of 2012, proposes to strengthen national integration,
cohesion and equity by building mutual understanding and respect between the people of

50
northern Kenya and other Kenyans, using the Equalisation Fund created under the new
Constitution to address inequities and ensuring investments and economic activities in the region
benefit the local communities.
In the case of Turkana, the policy would require that a fixed percentage of proceeds from the oil
goes directly to the local community. Development indicators like child and maternal mortality
are worst in the arid and semi-arid areas and 18 of Kenya‘s 20 poorest constituencies — where
74-97 per cent of people live below the poverty line — are in northern Kenya.
The highest rates of poverty are among those who are no longer directly involved in pastoralism,
particularly those without livestock who depend on casual labour or petty trade in towns (Gok,
2012).
With the proposal to increase investments in the arid and semi-arid areas that are home to about
14 million people, more than a third of the country‘s population, Kenya is hoping to be one of
the countries that have successfully transformed dry areas into productive land and to join the
league of countries like Israel — which has developed solutions to turn its sand-covered land
into productive vegetable gardens, orchards and vineyards. Israel‘s agricultural scientists have
revolutionised the way farmers irrigate and store crops, protect plants from drought and disease,
keep pests away naturally, and purify and reuse wastewater.
Recently, Kenya kicked off the planned opening of an alternative economic corridor in Northern
Kenya with the launch of the newly-built Isiolo Airport. The Kshs.900 million ($10.4 million)
facility is meant to upgrade the airport to international status, firmly anchoring work on the
planned transformation of Isiolo into the resort city envisaged in Kenya‘s development blueprint
i.e. Vision 2030. Isiolo, located on the edge of agriculturally rich Meru County, is the epicentre
of the multi-billion shilling effort to open up northern Kenya, landlocked Ethiopia and South
Sudan with the building of a standard gauge railway line, a highway and an oil pipeline that runs
from the Lamu Port to South Sudan. The policy paper proposes the development of an integrated
safe and efficient road, rail and air transport network in the region, prioritising transport corridors
linking Kenya to key markets in Ethiopia, South Sudan and Somalia, and to the Middle East.
It is now acknowledged that Kenya cannot achieve its development targets unless there are
appropriate investments in the Arid and Semi-Arid Lands (ASALs). Covering two-thirds of the

51
country, the ASALs can make a significant contribution to national development. Failure to
integrate them into the national economy is perhaps the
main reason for the failure of national development since independence.
Investing in the ASALs is now a constitutional imperative that is binding on the government.
The institutional foundations for integrating the ASALs into national development are also now
in place. What remains to be overcome are the persistent negative narratives about the ASALs
that have traditionally held back their development, and for all concerned actors to translate the
policy reforms into actual benefits for the ASALs and the country as a whole.
With Sessional Paper No. 8 of 2012 and the Vision 2030Development Strategy for Northern
Kenya and other Arid Lands now in place, the foundations for integrating the ASALs into
national development are secure. The marginalisation of the ASALs has been a reality for so
long however, and the mind-sets that perpetuated it are so deeply embedded, that it is likely to
take more than a favourable policy and institutional framework for the ASALs to receive their
due consideration and realise their full potential. Numerous challenges exist that may frustrate
the full realisation of the reforms with regard to the alleviation of poverty, reversing
environmental degradation, reducing conflict, and building sustainable peace in Kenya‘s ASALs.
Among the major challenges are: ‗elite capture‘ of the devolution process particularly at local
level; the lack of citizen capacity to engage with and drive the process for self-determination; the
dominance and intransigence of government mind-sets; inward looking agendas and
constitutional contestation by political leaders and finally the minimal investment in research and
innovation. The needs for reconciling conflicting or non-complementary provisions within other
policies – many of which are driven by powerful political and economic interests – may also
affect the implementation of the positive policy provisions for the ASALs.
Policy implementation is a major challenge across the board in Kenya, but is likely to be even
more challenging in the ASALs given their long history of policy marginalisation and the
entrenchment of negative perceptions about these areas in policy and other circles. It will be
necessary for all concerned actors, including civil society, communities and development
partners, to stay vigilant and advocate for the proper implementation of ASAL policies and
institutions. Although devolved government offers an opportunity to strengthen local planning
and implementation of development projects and processes – as a result of elected governments
52
that are closer to and potentially more accountable to the people – this will only happen if
devolution truly works for the ASALs.
Decades of biased distribution of public investments, with resources being directed towards the
so-called high potential areas of crop production, overlooked the wealth of lowland livestock-
based economies — creating the deep inequalities in human development in the then Northern
Frontier District. A new policy on development of northern Kenya and other arid lands is seeking
to reverse the narrative, proposing a range of initiatives that could see the country turning to the
arid, hitherto considered unproductive and less-endowed, for growth (Gok, 2005). With the
proposal to increase investments in the arid and semi-arid areas that are home to about 14 million
people Kenya is hoping to be one of the countries that have successfully transformed dry areas
into productive land.
2.9.2 The Prospects of Arid and Semi-Arid Lands
With the new policy, Kenya is seeking to addresses three distinct policy challenges. How to
close the development gap between northern Kenya and the rest of the country; how to protect
and promote institutions that are productive like pastoralism; and how to ensure food and
nutrition security across the arid lands
By addressing these three policy challenges, the government will release the latent potential of
the arid and semi-arid lands, in livestock, crop farming, tourism and renewable energy, and its
strategic location as Kenya‘s bridgehead to the markets of Northern Africa and the Middle East.
The future of African dry lands, and their people, lies in securing pastoralism for those who wish
to remain pastoralists, and providing alternative, but complementary, livelihoods options for
those who do not (or cannot). The large potential in arid and semi-arid lands with a variety of
resources needs to be exploited for the benefit of the local communities as well as the nations in
general. The African Union policy framework for pastoralism offers a real opportunity to make
pastoralism a mainstream part of national and regional policies. Pastoral people, and their
institutions, must be central to this. Designing supportive national policy and investments cannot
be left to governments alone.
53
Improving policy makers‘ understanding of what makes drylands work — their ecology,
economics and society — is a pre-requisite, but is not enough. Political leverage is also
necessary, and it must be driven by ‗the ASAL citizens‘.
Implementation of the Sessional Paper No.8 of 2012 policy will contribute towards the
Government‘s vision of security, justice and prosperity for the people of Northern Kenya and
other arid lands. It will help achieve the three pillars of Vision 2030–economic, social and
political –but particularly the social pillar, which seeks to ‗create a just and cohesive society that
enjoys equitable social development in a clean and secure environment. Finally, it will reduce
dependence on relief interventions and the heavy financial burden of emergency response.
2.9.3 Institutional Framework
2.9.3.1 Administrative Framework
During the colonial and post-colonial time, development was largely implemented through
various operating ministries and departments such as the ministry of works and the ministry of
agriculture; ministry of water and development; ministry of finance and planning; ministry of
commerce and industry among others. The annual budget was the critical focus on planning
indicating its allocations to operating ministries. The government was organized in vertical
ministries, generally along sectoral lines. Sector planning however many weaknesses and
shortcomings as the coordination of activities within and between geographical areas was
completely lacking.
In addition, the dis-integrated nature of development meant that there was no comprehensive
policy and institutions to deal with ASAL issues.
2.9.3.2 The Physical Planning Department
The physical planning department within the ministry of lands and settlement has been in
existence since 1947. The planning department has been responsible for formulation of Kenya‘s
human settlement policy. In order to improve its services, the planning department has been
decentralized by setting up offices in all the provincial capitals except Garissa and in the long
term, the services were decentralized to district and municipal levels leaving the headquarters to
deal with policy, research and coordination.
54
For a long time, the district was an important administrative unit in Kenya. Its importance
increased after independence as the government‘s approach became more oriented to rural
development. The district was the lowest level to which operating ministries could assign
properly trained staff. These were organized into District Development Committees which was
chaired by the district commissioner.
In April 2008, the president created the Ministry of State for Development of Northern Kenya
and other Arid Lands (MNKOAL) which was under the office of the prime minister. This put in
place a political framework for mainstreaming ASAL issues into government planning at the
level of Cabinet. The Ministry wishes to put in place a holistic policy framework to facilitate
and fast-track sustainable development in the region, reducing levels of inequality with the rest
of Kenya and releasing its potential for the benefit of the nation as a whole. Sessional Paper No.
8 of 2012 on National Policy for the Sustainable Development of Northern Kenya and other Arid
Lands ‗Releasing Our Full Potential‘. A new Ministry to focus on the unique challenges in these
areas.
The ministry however, was dissolved with the changing political leadership which saw merging
of ministries. This was consequently followed by creation of county governments under the new
system of government in 2013.
2.9.3.3 The County Government of Isiolo
The inauguration of the Kenya constitution in 2010 saw decentralization of services to the rural
community through devolution. This system created 47 county government, with Isiolo being
one of them. The mission of the county government of Isiolo is to Improve Livelihoods of Isiolo
People through participatory engagement and creation of a conducive environment for
mobilization and utilization of available resources sustainably. their vision is a secure, just and
prosperous county, where people achieve their full potential and enjoy a high quality 0f Life. The
county has created 7 ministries, these are:- The ministry of Agriculture Livestock & Fisheries,
Ministry of Water, Sanitation & Irrigation, Ministry of Roads & Infrastructure, Ministry of
Lands, Housing, Physical Planning & Urban Development, Ministry of Natural Resources &
Tourism and Ministry of Education, Sports, Cultural & Social Services, Environment to deal
with development activities in the region.

55
The Natural Resources & Tourism are currently in the initial stages of mapping out natural
resources. The ministry also intends to come up with sand harvesting policy to regulate sand
harvesting in the region.
The ministry of Lands, Housing, Physical Planning & Urban Development is currently
working on registering all land under one title owned by the communities and we can lease the
land to investors instead of selling it off to the highest bidder.,
Agriculture Livestock & Fisheries
Livestock being the backbone of Isiolo, the ministry is counting on the completion of the abattoir
to open up cottage industries supporting the livestock sector, notably tanneries and animal feeds.
2.9.3.4 Summary
Development activities in arid lands are currently poorly planned and coordinated. Coordination
is arguably even more critical in these areas where limited resources must be stretched across
large distances with poor infrastructure, and where the consequences of poor coordination can be
damaging to the environment and to social relations.
New established structures for devolved government require technical and political support to
ensure implementation of proposed initiatives.
Development activities in arid lands are currently poorly planned and coordinated. Limited
resources must be stretched across large distances with poor infrastructure, and where the
consequences of poor coordination can be damaging to the environment and to social relations.
There‘s need for a proper institute which will harnesses the contributions of multiple actors at all
levels and makes the most effective use of human and financial resources.
2.9.3.5 Summary from Case Studies
From the two case studies i.e. Israel and Egypt, there‘s much that Kenya can borrow from these
two success stories in order to optimally utilize their resources in dry lands. While the two
countries aridity conditions are much worse than the Kenyan situation, their productivity is
incomparable to Kenya hence a major gap that needs to be filled.
56
For instance, Israel just like Egypt has employed advanced technologies as well as use of
sophisticated irrigation methods which ensure efficient use of the available scarce resource i.e.
water. Through technology, Israel and Egypt have expanded their carrying capacity by increasing
the land under cultivation. Their advanced technology is as a result of extensive research which
is given a major priority by the two countries. This is however lacking in Kenya. Research and
development in Kenya is inadequate hence minimal innovation of modern technology. This
situation should change to enhance innovation.
The government intervention through policy formulation aimed at optimally utilizing ASAL land
is a major aspect that Kenya as a country can borrow from the two cases.
The attitude of the people is also a major factor determining resource use in these two countries.
Farmers in the 2 countries believe that the only way to survival is to utilize what they have. In
Kenya however, people rely on handouts and waiting for the government to intervene. If this is
to change, the community needs to be empowered to harness the resources that they have.
Rural settlements in Israel and Egypt are properly planned with adequate provision of social
amenities, while the rest of the land is put under mechanized farming, something that is lacking
in Kenya. Rural communities in dry lands of Kenya suffer from lack of access to basic services.
Despite the above differences, all the three case have similarities in that in all situations, land is
either publicly owned or communally owned. This makes it easier for settlement planning. This
is an opportunity which Kenya can borrow to pan for rural settlements.
2.10 Theory of Rural Land Use
Scholars have overtime come up with land use theories to explain the land use system in the rural
areas.
2.10.1The Von Thunen Model: A Model of Agricultural Land Use
The Von Thunen model of agricultural land use was created by farmer and amateur economist
J.H. Von Thunen (1783-1850) in 1826 (but it wasn't translated into English until 1966). Von
Thunen's model was created before industrialization and is based on the following limiting
assumptions:

57
The city is located centrally within an "Isolated State" which is self-sufficient and has no
external influences.
The Isolated State is surrounded by an unoccupied wilderness. The land of the State is
completely flat and has no rivers or mountains to interrupt the terrain.
The soil quality and climate are consistent throughout the State.
Farmers in the Isolated State transport their own goods to market via oxcart, across land,
directly to the central city. Therefore, there are no roads.
Farmers act to maximize profits.
In an Isolated State with the foregoing statements being true, Von Thunen hypothesized that a
pattern of rings around the city would develop.
There are four rings of agricultural activity surrounding the city. Dairying and intensive farming
occur in the ring closest to the city. Since vegetables, fruit, milk and other dairy products must
get to market quickly, they would be produced close to the city (remember, we didn't have
refrigerated oxcarts!)
Timber and firewood would be produced for fuel and building materials in the second zone.
Before industrialization (and coal power), wood was a very important fuel for heating and
cooking. Wood is very heavy and difficult to transport so it is located as close to the city as
possible.
The third zone consists of extensive fields crops such as grains for bread. Since grains last longer
than dairy products and are much lighter than fuel, reducing transport costs, they can be located
further from the city.
Ranching is located in the final ring surrounding the central city. Animals can be raised far from
the city because they are self-transporting. Animals can walk to the central city for sale or for
butchering.
Beyond the fourth ring lies the unoccupied wilderness, which is too great a distance from the
central city for any type of agricultural product.

58
The Von Thunen model depicts how commercial farmers figure out which crops and animals to
cultivate based upon the market location. A commercial farmer cultivates land for the purpose of
making a profit. A critically variable in this model that these commercial farmers take note of is
the cost of land versus the cost of transporting products to markets because their goal is to make
a high profit. Transportation cost depends on the distance from the market and the different kind
of products. Locational rent is a term used by Von Thunen to explain his theory which is the
equivalent to land value. It corresponds to the maximum amount a farmer could pay for using the
land, without making losses.
The equation is L = Y(P − C) − YDF (L= locational rent, Y= Yield, P= Market price of the crop,
C= Production cost of the crop, D= Distance from the market, F= Transport cost)
Even though the Von Thunen model was created in a time before factories, highways, and even
railroads, it is still an important model in geography. The Von Thunen model is an excellent
illustration of the balance between land cost and transportation costs. The model notes that one
gets closer to a city, the price of land increases. The farmers of the Isolated State balance the cost
of transportation, land, and profit and produce the most cost-effective product for market. Of
course, in the real world, things don't happen as they would in a model.
59
2.10.2 Weaknesses and Criticisms
The model was developed in an isolated state and did not take into consideration differences in
sites (local physical conditions). It can be modified by relaxing some of the conditions set forth
by Von Thunen:
a) Differential transportation costs. Example: boats are the cheapest mode of transportation.
b) variations in topography
c) soil fertility
d) changes in demand or price of the commodity
However, the model tends to hold true in most instances: The theory may break down somewhat
in industrial and post-industrial economies as urban expansion/sprawl occur. For example,
modern refrigerators enable perishable products to be transported longer distances. The Theory
generalize that there is one mode of transport which is the boat.
Like many other models in geography, von Thünen's model was criticized frequently due to its
restrictive nature. The basic conditions of the model, however, could be approximated by slight
modifications of the respective reality. The circular pattern, which can be attributed to only one
market and excluding transport costs gradients running from the centre, is for example only one
of many conceivable geometrical starting situations. If other natural landscapes or transportation
routes are present, the land use zones would be stripe-formed. If several markets were present,
groups of zones would be formed around each market.
A justified objection against it is the reference to the absence of any productive profit. In von
Thünen's theory different agricultural uses compete for the optimal location, which results from
the product-specific supply/expenditure relation. The competitive power becomes indirectly
measurable over locational rent. After deducting production costs and location-specific transport
costs, however, nothing more remains of the market profits. The von Thuenen model leads to the
idea of complete self-sufficiency among farmers.
Thünen's idea of "economic rent" attempted - while ignoring other characteristics - to explain the
use of zones controlled solely by economically rational perception. Possible consumers play,
finally, the crucial role for the choice of location. At the same time evaluation of all potential

60
locations is released, which leads to a zoning of the possible offers. This simply developed space
restaurant model reacts however sensitively to changes of the space overcoming costs. It
possesses however due to its universality nevertheless a high value within geographical questions
and methodology. It has now become obsolete due to the fact that he never predicted the
revolutionary technology we have today.
Figure 2.2 Von Thunen Model
Figure 2.3 Illustration of Von Thunen Model
61
Von Thunen also did not consider modern technology that had yet to be invented in his time. For
example there are refrigerated cars for the transportation of dairy products which make them last
longer and travel longer distance. Also there is the transportation of animals by rail which is
faster than having them being grazed into the city.
His ideas do tend to apply in LDCs where some of the advantages of modernization apply less
so. All in all, the Von Thunen model is a good example of the balance between land cost and
transportation costs adequately describing the land use patterns in urban areas and their
hinterland. The closer you get to the city, the higher the price of land increases. These
commercial farmers have to balance the cost of transportation, land, and profit to produce the
most cost-effective product for their market. In reality however, things don't work out exactly
how they‘re supposed to in this model which is true in every model.
2.11 Economic Base Theory
The economic base technique is based on the assumption that the local economy can be divided
into two very general sectors, i.e. Basic and Non-Basic sectors. By exporting goods out of the
region, monetary payments flow into the region, which leads to increased demand for locally
produced goods and services. The industries that export goods beyond the boundaries of their
region are referred to as basic, while those that do not export are referred to as non-basic. The
group of exporting industries makes up the economic base.
Economic base theory asserts that the means of strengthening and growing the local economy is
to develop and enhance the basic sector. The basic sector is therefore identified as the "engine"
of the local economy and called as the economic base of the local economy.
Basic is production for export outside the region while Non-Basic is production of goods and
services for consumption inside the region.
Total Economy = Basic sector + Non-Basic sector
2.11.1 Basic Sector
Basic sector is made up of local businesses (firms) that are entirely dependent upon external
factors. Local resource-oriented firms (like logging or mining) and manufacturing are usually
considered to be basic sector firms because their fortunes depend largely upon non-local factors
and they usually export their goods. An example is Boeing who builds and sells airplanes to
62
companies and countries world-wide. Their business is dependent upon external factors since
their products are for export.
Basic Industries include the following:-
a. Agriculture
b. Mining
c. Tourism
d. Federal government
e. Manufacturing etc.
This model assumes that the basic sector is the prime cause of local economic growth, that it is
the economic base of the local economy." (Klosterman, p. 115)
2.11.2 Non-Basic Sector
The non-basic sector is composed of those firms that depend largely upon local business
conditions. For example, a local grocery store sells its goods to local households, businesses,
and individuals. Almost all local services are identified as non-basic because they depend almost
entirely on local factors.
Non-Basic Industries include the following:-
a) Retail,
b) Commercial banking,
c) Local government
d) Local public schools
e) Services
2.11.3 Base Multiplier
Base multiplier refers to the method for estimating the impact of the basic sector upon the local
economy. An injection (export sales) increases income in the local area by an amount greater
than the sale. It can also be defined as the employment multiplier that estimates the impact of
local basic sector employment on overall employment growth.
This is the ratio of the total employment in a year to the basic sector employment in that year.

63
Base Multiplier = Total Employment Year i
Basic Employment Year i
Base Multiplier can provide insight as to how many non-basic jobs are created by one basic job.
For example - if the basic multiplier for an area is two, this means that for every new job in the
basic sector there will be an additional job created in the non-basic sector. The non-basic jobs are
usually in the form of personal/business services or related-goods employment.
Use of Multiplier
Estimates and projections of the base multiplier allow analysts to calculate impacts of certain
industries on the growth of the economy.
2.11.4 Weaknesses
Economic Base Theory assumes that all local economic activities can be identified as basic or
non-basic. Firms that sell to both local and an export market must, therefore, be assigned to one
of these sectors or some means of apportioning their employment to each sector must be
employed.
Economic Base Theory asserts that the means of strengthening and growing the local economy is
to develop and enhance the basic sector. The basic sector is therefore identified as the "engine"
of the local economy.
Economic Base Theory also posits that the local economy is strongest when it develops those
economic sectors that are not closely tied to the local economy. By developing firms that rely
primarily on external markets, the local economy can better insulate itself from economic
downturns because, it is hoped, these external markets will remain strong even if the local
economy experiences problems. In contrast, a local economy wholly dependent upon local
factors will have great trouble responding to economic slumps.
64
2.11Summaryof Conceptual Framework
The above figure demonstrates the current situation in arid and semi-arid areas. From the above
literature, it is established that the current land use potential in ASAL areas through-out the
world is not optimally utilised apart from some few developed nations such as Israel. Israel has
employed various strategies in improving the productivity of their arid lands for the benefit of
the people. This is unlike other developing countries that are yet to realize the existing potential
lying in these ASALs. Productivity of Israel‘s desert land is as a result of the combination of
people‘s attitude, policy and technology which is lacking in the developing world.
Theory and practice has cited some of the reasons leading to the current situation in our dry lands
as follows;-.cultural values have been quoted by scholars as the main reason leading to the
current status in drylands. Strong traditional attachment to livestock has made the arid
communities to stick with pastoralism despite its degree of viability. In addition, most of the land
in arid lands is communally owned. This has led to land tenure insecurities where most of the dry
lands are still held under customary laws making it difficult for individuals to access the land for
private purposes. Despite the willingness of individuals to invest more in their land, this is
hindered by lack of capital which is exacerbated by the lack of access to credit facilities due to
collateral issues.
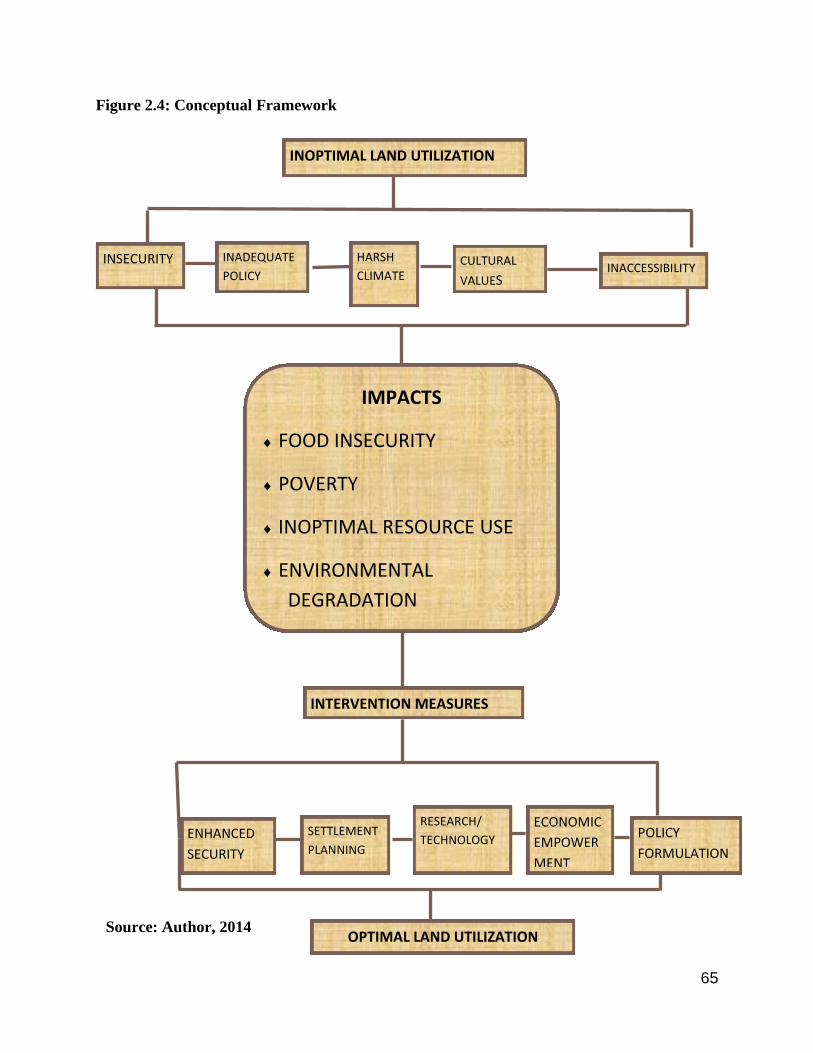
65
Figure 2.4: Conceptual Framework
INOPTIMAL LAND UTILIZATION
INSECURITY INADEQUATE
POLICY
HARSH
CLIMATE CULTURAL
VALUES
IMPACTS
FOOD INSECURITY
POVERTY
INOPTIMAL RESOURCE USE
ENVIRONMENTAL
DEGRADATION
INTERVENTION MEASURES
OPTIMAL LAND UTILIZATION
ENHANCED
SECURITY
SETTLEMENT
PLANNING
RESEARCH/
TECHNOLOGY
ECONOMIC
EMPOWER
MENT
INACCESSIBILITY
POLICY
FORMULATION
Source: Author, 2014

66
Summary of Conceptual Framework
The harsh climatic conditions i.e. lack of water, high temperatures is also a major reason leading
to minimal investments in dry lands despite their potential. People shun dry lands because of
their inability to sustain any kind of farm production. Most dry lands are also inhabited by
people who hold strong cultural beliefs and traditions some of which hinder them from
welcoming new ideas which would otherwise enable them improve their living conditions. For
instance, most ASAL community did not believe in education until recently. This hindered them
from having access to new ideas and technology which would help improve the productivity in
these regions. In addition, their stringent culture about land and cattle restrict them from
diversifying into other lucrative land use activities.
Inaccessibility of most dry land in the developing world has also contributed to inoptimal
resource use. Historically, governments in developing world invested more in other areas at the
expense of dry lands due to the perceived nature that arid lands contributed nothing to the
country‘s economy. Under the heading ‗Provincial Balance and Social Inertia‘, Sessional Paper
No. 10 of 1965 stated the following: One of our problems is to decide how much priority we
should give in investing in less developed provinces. To make the economy as a whole grow as
fast as possible, development money should be invested where it will yield the largest increase in
net output. This approach will clearly favor the development of areas having abundant natural
resources, good land and rainfall, transport and power facilities, and people receptive to and
active in development (Gok, 1965).This therefore left most dry lands inaccessible making it
difficult for investors to come in.
Inadequate policy is a major challenge facing ASAL regions in Kenya. For a long time, there
was no comprehensive policy to guide development in arid and semi-arid areas. In addition, they
were regarded as unproductive and hence received minimal government intervention in terms of
resources. The rangelands and livestock were not considered as resources. Kenya also lacks a
proper policy on research and development on arid areas. For instance, there has not been any
research done on aspects such as resource evaluation in arid lands; drought resistant crops,
proper farming methods and equipment‘s. This has consequently impacted negatively on
resource utilization in arid areas.
67
The above factors have had negative implications in dry lands. First of all, it has led to famine
and food insecurities in our dry lands. Kenya for instance has had its good share of famine in the
recent years which saw people and livestock lose their lives. Low investment in dry lands has
also increased the vicious cycle of poverty year by year. Relying on the usual land use practices
against the increasing population through natural increase puts pressure on the existing resources
thereby intensifying the rate of poverty.
Arid lands are also worst hit in terms of environmental degradation because most of their land
use practices are not sustainable. Competition for land and pasture against the carrying capacity
leads to unsustainable land use practices in order to feed the increasing population. Scholars and
analysts have argued that ASAL region‘s main livelihood strategy‘s mobile pastoralism, was
irrational and environmentally destructive.
In order to alleviate the above situation, governments‘ through-out the world have come up with
ways of how to transform their deserts into productive avenues. These are for instance, Israel,
Iraq, and Egypt among other nations. Developing nations are currently borrowing a leaf from
best practices in these countries in order to improve the situation. Among the actions being taken
include strong policies for ASALs ranging from land use planning; land management, resource
distribution etc. There are multi-national organisations through-out the world e.g. World Bank,
FAO, WHO, UN-HABITA, UNEP etc. that are incorporating aspects of empowerment of the
ASAL community in their mandates. Governments are also investing in research on drought
resistant crops as well as proper land use methods. Optimal utilization of resources in ASAL area
should focus on ecological benefits, industrial coordination as well as regional development.
This is the ultimate goal of land utilization in arid areas. Based on theory and practice, Kenya
needs to learn much from other countries in order to actualize its dream of transforming dry
lands.

68
CHAPTER THREE
RESEARCH METHODOLOGY
3.0 Overview
The purpose of this chapter is to introduce the research strategy or procedure applied in this
study. It describes the research methodology as well as the sample selection procedure used in
this study. It also describes the procedure used in designing the instruments, collecting the data
and finally gives an explanation of the statistical procedure used to analyze and present the data.
3.1 Research Design
Research design can be defined as the roadmap of the researcher‘s investigation and the
procedure the investigator wants to adopt to solve the identified problem (Anene, 1998). This is
an applied research since its main aim is to understand and consequently solve practical
problems affecting our dry lands. This study employed Non experimental research method since
the study was carried out in natural settings and did not include highly controlled aspects. Below
is an outline of how the various steps were undertaken to ensure successful completion of this
research:-
The study started through inception of the idea and problem identification. This involved
undertaking of a comprehensive literature review for purposes of conceptualizing the problem
and identifying the gap that needed to be filled. It is also in this stage where a reconnaissance
visit to the site was done by the research team to have an overall view of the selected case. The
second stage was the methodological stage which summarized the type of survey to be done and
the methods that would be used for data collection in the field. This stage also involved an
analysis of all the stakeholders as well as budget formulation. A pilot study was carried out prior
to the main study in order to ensure unforeseen errors are dealt with and relevant corrections
made before the actual study is carried out. The third step was the actual field survey which
started off by getting a research permit from the relevant authorities in order to undertake the
survey. This was followed by comprehensive data collection using different methods and
instruments formulated in the methodological stage, instrument administration such as
questionnaires, interviews were administered and workshops held by relevant stakeholders. This
step was followed by analysis of the collected data. This involved data editing coding and finally
analysis of the findings for purposes of scenario building. The final step was the report

69
compilation and presentation of the research findings, recommendations and conclusions to the
panel for examination purposes.
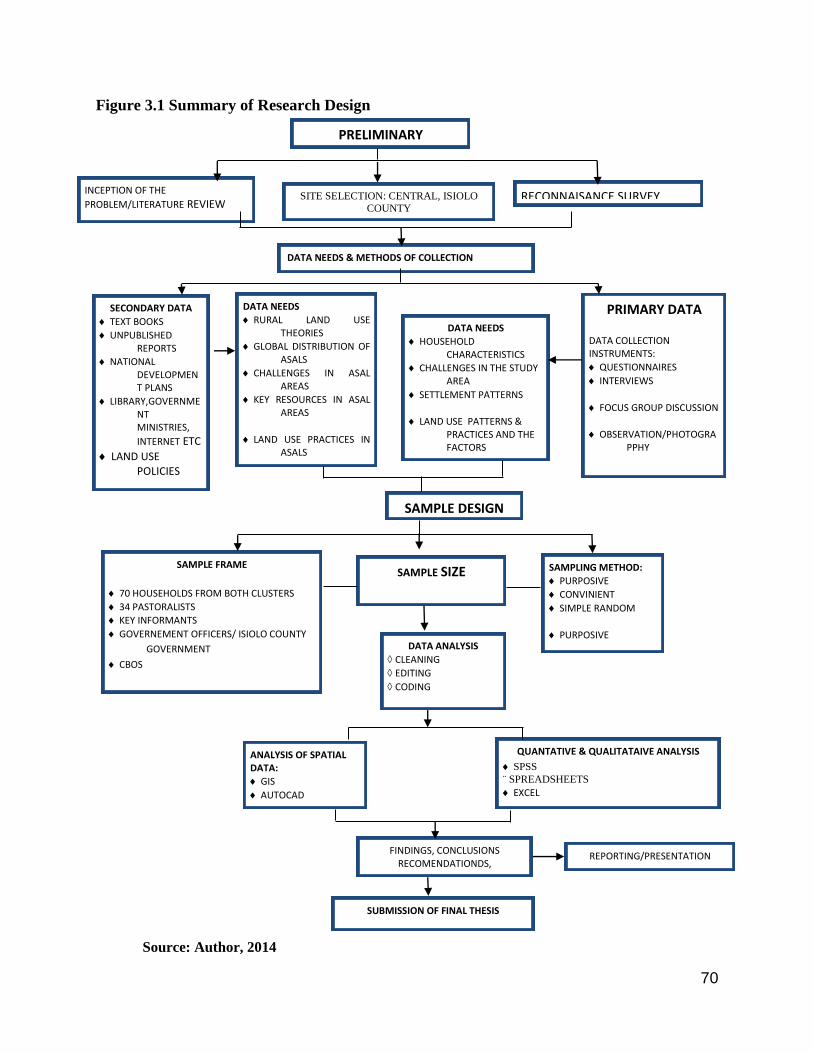
70
Figure 3.1 Summary of Research Design
PRELIMINARY
PREPARATION
INCEPTION OF THE
PROBLEM/LITERATURE REVIEW
SITE SELECTION: CENTRAL, ISIOLO
COUNTY RECONNAISANCE SURVEY
DATA NEEDS & METHODS OF COLLECTION
SECONDARY DATA
TEXT BOOKS
UNPUBLISHED REPORTS
NATIONAL DEVELOPMENT PLANS
LIBRARY,GOVERNMENT MINISTRIES,
INTERNET ETC
LAND USE POLICIES
PRIMARY DATA
DATA COLLECTION INSTRUMENTS:
QUESTIONNAIRES
INTERVIEWS
FOCUS GROUP DISCUSSION
OBSERVATION/PHOTOGRAPPHY
SAMPLE DESIGN
SAMPLING METHOD:
PURPOSIVE
CONVINIENT
SIMPLE RANDOM
PURPOSIVE
SAMPLE FRAME
70 HOUSEHOLDS FROM BOTH CLUSTERS
34 PASTORALISTS
KEY INFORMANTS
GOVERNEMENT OFFICERS/ ISIOLO COUNTY
GOVERNMENT
CBOS
SAMPLE SIZE
154 PEOPLE
DATA ANALYSIS
CLEANING
EDITING
CODING
ANALYSIS OF SPATIAL DATA:
GIS
AUTOCAD
QUANTATIVE & QUALITATAIVE ANALYSIS
SPSS
¨ SPREADSHEETS
EXCEL
FINDINGS, CONCLUSIONS RECOMENDATIONDS,
REPORTING/PRESENTATION
SUBMISSION OF FINAL THESIS
DATA NEEDS
RURAL LAND USE THEORIES
GLOBAL DISTRIBUTION OF ASALS
CHALLENGES IN ASAL AREAS
KEY RESOURCES IN ASAL AREAS
LAND USE PRACTICES IN ASALS
DATA NEEDS
HOUSEHOLD CHARACTERISTICS
CHALLENGES IN THE STUDY AREA
SETTLEMENT PATTERNS
LAND USE PATTERNS & PRACTICES AND THE FACTORS INFLUENCING THE
Source: Author, 2014
71
3.2 Study Area Description
The study covers part of central location, Isiolo County. Isiolo County is located in the upper
eastern region of Kenya, a merger of previously Isiolo and Garbatulla districts.
The study area has an approximate population of 10,548 people with about 1720 households in
an area of approximately 2,181km2. It has an average household size of 6.1 persons with a
population density of about 5.6persons per square kilometers. The area is cosmopolitan in nature
(KNBS, 2009). The area is mainly inhabited by pastoralists and small scale crop farmers. Central
location is one of the locations in central division in Isiolo county government. Other divisions
includeOldonyiro,Kinna,Garbatulla,Serichoand Merti. The mission of the county government of
Isiolo is to Improve Livelihoods of Isiolo People through participatory engagement and creation
of a conducive environment for mobilization and utilization of available resources sustainably.
Their vision is a secure, just and prosperous county, where people achieve their full potential and
enjoy a high quality 0f Life. The county has 7 ministries, these are:- The ministry of Agriculture
Livestock & Fisheries, Ministry of Water, Sanitation & Irrigation, Ministry of Roads &
Infrastructure, Ministry of Lands, Housing, Physical Planning & Urban Development, Ministry
of Natural Resources & Tourism and Ministry of Education, Sports, Cultural & Social Services,
Environment,
Isiolo has various non-governmental organizations as well as community based organizations
working in the county. These are NCCK, action aid, world vision and CBO‘s. The region also
has various youth and women groups engaged in different initiatives to improve livelihoods.
3.4 Sample Frame and Unit of Analysis
The study chose households at the major unit of analysis due to their role in resource utilization.
The study also included pastoralists due to their uniqueness and the type of land use activity they
are involved in considering pastoralism takes about 80% of the land use in the region. A number
of crop farmers were also involved to provide insight on crop farming and its challenges in the
area. The county government of Isiolo together with 3 line ministries were also included, these
are the ministry of Agriculture Livestock & Fisheries, Ministry of Lands, Housing, Physical
Planning and Urban Development; Ministry of Natural Resources and Tourism. All the above

72
were included in the sample frame to ensure inclusiveness of all stakeholders involved in the
development of this region. Below is a list of the sample frame:-
a. Households
b. Pastoralists and farmers
c. County government of Isiolo;
d. The ministry of Agriculture Livestock & Fisheries
e. Ministry of Lands, Housing, Physical Planning & Urban Development
f. Ministry of Natural Resources & Tourism
g. Action Aid
h. World Vision
i. One youth group
j. KARI
The assessment instruments used in data collection were designed to capture information from
households where preference was given to the head of the household as the respondent or any
available consenting member who will have attained the age of 18 years; key informants in the
institutional stakeholder fraternity with emphasis on departmental heads at the county level;
county representatives and village elders; government officers in different relevant ministries and
agencies.
3.5 Types of Data
A comprehensive data collection exercise was carried out in line with the objectives of this
study. Two sets of data types were used; these were primary and secondary data.
3.5.1 Primary Data
Primary data is data that is obtained directly from the field. These are settlement patterns in the
study area; household characteristics such as education, household income, household sizes and
assets owned; land use practices available in the area; physiographic features; soil characteristics;
availability of rivers; the general topography of the area; natural resources and their level of
exploitation and challenges facing the area.
73
3.5.2 Secondary Data
Secondary data is processed data that was originally collected, analyzed and documented by
previous researchers on the same subject. These are; rural land use theories; classification of arid
areas; global distribution of ASALs; resources available in arid areas; challenges facing ASALs;
land use practices in ASALs, land use patterns; ASAL polices; existing research gaps; best
practices of how resources have been utilized in arid areas, lessons learnt from the case studies;
ASAL policy in Kenya and how it has developed over time and situational analysis of the study
area.
3.6 Sources of Secondary Data
Secondary data was collected by reviewing of existing literature on existing national
development plans, relevant text books, internet, relevant journals, existing policy documents,
published and unpublished research documents; newspaper articles, NTV‘s programme on the
Counties and the library.
3.7 Methods of Data Collection
The research used different methods for gathering the two sets of data, i.e. primary and
secondary data. These are as follows:-
3.7.1 Secondary Data
Secondary data was collected by reviewing and recording of relevant existing literature written
by previous researchers on arid and semi-arid areas both locally and internationally.
This will involve critical reading, reviewing, recording of information from other written
materials and finally analyzing it then presenting it logically by synchronizing with processed
information from primary data guided by the objectives of the study.
3.7.2 Primary Data
The methods that were used to collect primary data are instrument administration
(questionnaires), observation, photography and sketching, mapping and interview schedules.
a). Questionnaires
Questionnaires were the main instrument for the collection of primary data at both household and
institutional levels. The data types collected using this instrument are the household
characteristics; settlement patterns, demographic characteristics, social-economic activities in the
74
area; type of resources available; level of exploitation of the existing resources, challenges they
face while utilizing the potential in the area and how they have overcome the challenges.
b). Interviews
Face to face interviews with relevant government officials and agencies was also used to
complement primary data collection. Interviews were accompanied by video taking and
recording of stakeholders‘ opinions on different issues.
c). Observation
Observation was used to collect data on natural features. This method was accompanied by a
checklist of all the physical features in the study area. The type of data to be collected by this
method were; physiographic features, natural resources (forests, wildlife, water bodies, soil
characteristics etc.); land use practices in the area; settlement patterns among others. Observation
was accompanied by photography.
d). Mapping
The study also made use of maps and satellite images from Google Earth to get information on
the settlement patterns, spatial organization of land uses and natural resource distribution.
e) Photography
Photographs of various features were taken such as, physical features (forest, soils, land.), human
settlements as well as human activities. Observation was always accompanied by Photography in
order to take stock of the existing visual features.
f) Focused Group Discussion
A Focus Group discussion was held with key informants in the area. These were:- The chief
officers from the ministry of lands and housing; ministry of agriculture and livestock; NGO‘s
and Community Based Organizations engaged in the development of the area. These workshops
75
will help in obtaining information on the challenges experienced in the study area, previous ways
on how the situation has been dealt with, the potentials for improvement of the current situation.
The key informants also gave an insight on possible intervention measures that can ensure
optimal exploitation of the underlying potential in the area.
3.8 Sampling
3.8.1 Sample Size U
Below is the formula that was employed in finding the sample size for this study:-
Using the Sloven‘s equations
Where
n-the sample size
N –population
e—margin of error
The population for central, Isiolo is N=10,548
Assuming a margin of error of 8% :-
=153.96
≈154
3.8.2 Sampling Design
Due to time and budgetary constraints, census of the target population was unaffordable hence
sampling of the target population was essential. Various methods of sampling were used in this

76
study due to the diversity of the subjects and elements to be studied. This is aimed at ensuring a
comprehensive and integrated study.
When selecting this case study, information oriented sampling was used. A case study is defined
as a research strategy, an empirical inquiry that investigates phenomena within its real-life
context; it relies on multiple sources of evidence/data and benefits from the prior development of
theoretical propositions (Yin, 2009). Isiolo County was selected as a case because it‘s a typical
ASAL area. Unlike other arid lands, the region is unique in the sense that it has major resource
potentials ranging from four perennial rivers i.e Ewaso Nyiro, Isiolo, Kinna and Bisanadi, with
Ewaso Nyiro River being the major source of water; fertile soils; flat topography; wildlife,
minerals, rain harvesting among others. Central location, Isiolo is therefore an outlier case
depicting a typical ASAL area with a great potential befitting the theme of the study. The case
will reveal richer information in line with the theme and objectives of the study as well as
provide an opportunity for an interrogative study. The two clusters i.e. cluster A and B were
selected using convenient sampling because they were both bordering Isiolo river hence could
reveal richer information in line with the theme of this study. This was accompanied by simple
random sampling which was used to select the households for questionnaire administration. In
areas inhabited by pastoralists, purposive sampling method was used in order to capture the rural
pastoralists who lack permanent residence. A sample size of about 34 pastoralists was used in the
study.
Cluster A and B were both represented by a sample size of 60respondents each. A total sample
of 154 respondents was drawn from the entire population and used in the study. The sample size
was calculated using Sloven‘s equations as indicated above.
For the institutional survey, face to face interviews were conducted with departmental heads
from the relevant institutions indicated in the sample frame above. Focus Group Discussions
was also held with relevant key informants as well as other groups of stakeholders e.g. NGOS,
CBO‘s etc.
3.8.3 Discussion
The use of clusters on both sides of the river and simple random sampling for households was
preferred because of their objectivity in minimizing subjectivity as well as ensuring a
comprehensive survey. The heterogonous nature of households on each side of the river was also
77
a major factor. The river also separates two sub-locations hence the need to capture the aspects.
The diversity in sources of livelihoods and culture of the local community required that a
deliberate convenient sampling method be used in order to capture data from the pastoral
communities who have no permanent residence. This was to ensure that envisioned data about
the pastoralists was captured in the study.
3.9 Management of Data
Data management was done to ensure reliability and validity. Findings from the survey were
critically analyzed to ascertain its validity. This was to ensure that the data collected and the
methods used were consistent with the expectations.
Consequently, reliability of the same was also tested by checking the consistency of the answers
given by different respondents and their consistency.
3.10 Methods of Data Analysis
Data cleaning and editing was done in order to get rid of all the irrelevant data as well as avoid
data redundancy. Data coding was consequently done in order to make analysis easier and fast
using computer applications.
This research used the following methods to analyze the collected data. These are as follows:-
i) Quantitative Data Analysis
Quantitative data was analyzed using excel and spreadsheets. The kind of data analyzed using
this method included empirical figures of different aspects such as household income; household
sizes; amount of harvested products; cost of products, number of animals and/land owned by
individuals, number of acres under farming; among others. This data was coded and analyzed
using SPPS and Microsoft excel. This method used various statistical methods such as the mean,
measures of central tendency, measures of relationships and variability. The output was then
presented in form of percentages, numbers, ratios, frequency tables, bar graphs etc.
ii) Qualitative Data Analysis
This method of data analysis was applied to information that could not be analyzed using the
contemporary statistical methods such as the social aspects, condition of various variables. These
types of data were critically analyzed using descriptive analysis and comparison of people‘s
opinions.
iii) Geographical Information System (G.I.S)
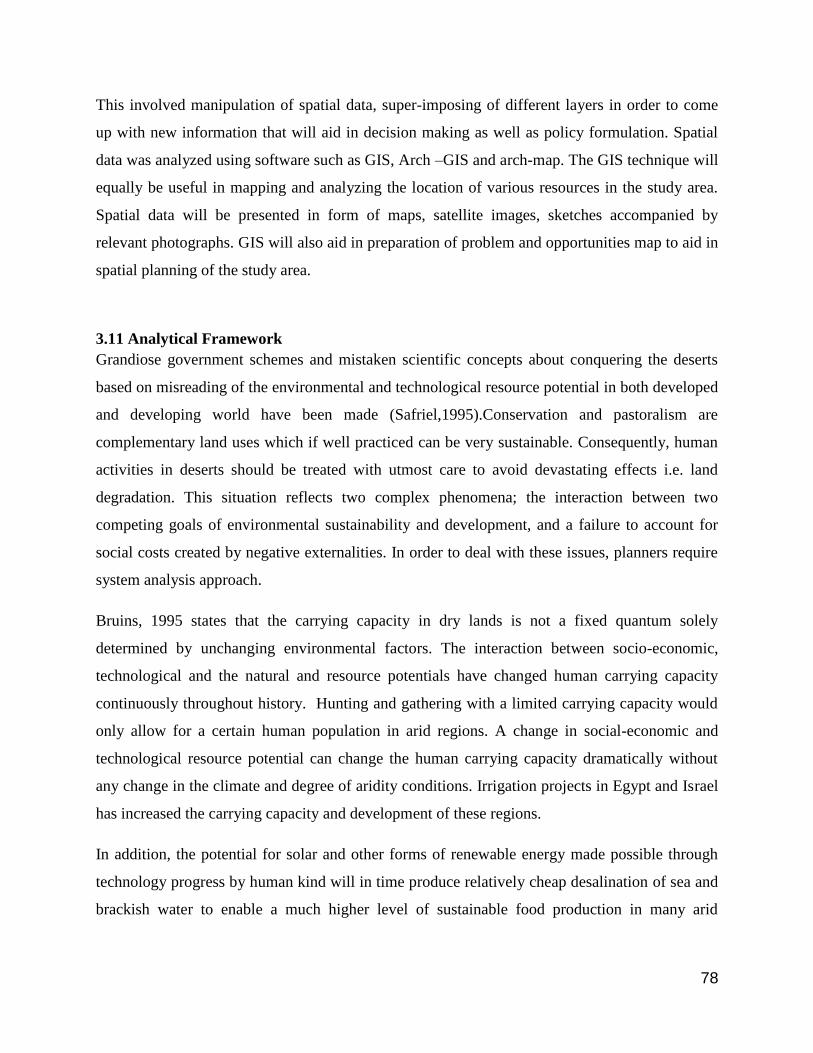
78
This involved manipulation of spatial data, super-imposing of different layers in order to come
up with new information that will aid in decision making as well as policy formulation. Spatial
data was analyzed using software such as GIS, Arch –GIS and arch-map. The GIS technique will
equally be useful in mapping and analyzing the location of various resources in the study area.
Spatial data will be presented in form of maps, satellite images, sketches accompanied by
relevant photographs. GIS will also aid in preparation of problem and opportunities map to aid in
spatial planning of the study area.
3.11 Analytical Framework
Grandiose government schemes and mistaken scientific concepts about conquering the deserts
based on misreading of the environmental and technological resource potential in both developed
and developing world have been made (Safriel,1995).Conservation and pastoralism are
complementary land uses which if well practiced can be very sustainable. Consequently, human
activities in deserts should be treated with utmost care to avoid devastating effects i.e. land
degradation. This situation reflects two complex phenomena; the interaction between two
competing goals of environmental sustainability and development, and a failure to account for
social costs created by negative externalities. In order to deal with these issues, planners require
system analysis approach.
Bruins, 1995 states that the carrying capacity in dry lands is not a fixed quantum solely
determined by unchanging environmental factors. The interaction between socio-economic,
technological and the natural and resource potentials have changed human carrying capacity
continuously throughout history. Hunting and gathering with a limited carrying capacity would
only allow for a certain human population in arid regions. A change in social-economic and
technological resource potential can change the human carrying capacity dramatically without
any change in the climate and degree of aridity conditions. Irrigation projects in Egypt and Israel
has increased the carrying capacity and development of these regions.
In addition, the potential for solar and other forms of renewable energy made possible through
technology progress by human kind will in time produce relatively cheap desalination of sea and
brackish water to enable a much higher level of sustainable food production in many arid
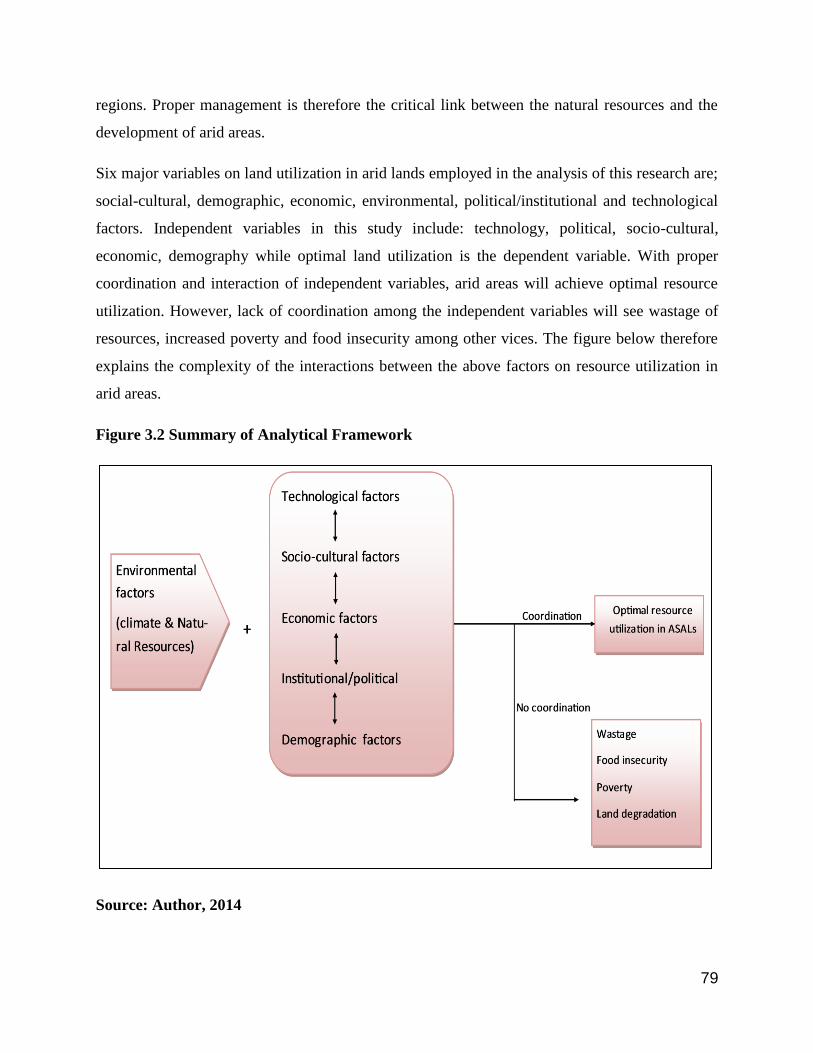
79
regions. Proper management is therefore the critical link between the natural resources and the
development of arid areas.
Six major variables on land utilization in arid lands employed in the analysis of this research are;
social-cultural, demographic, economic, environmental, political/institutional and technological
factors. Independent variables in this study include: technology, political, socio-cultural,
economic, demography while optimal land utilization is the dependent variable. With proper
coordination and interaction of independent variables, arid areas will achieve optimal resource
utilization. However, lack of coordination among the independent variables will see wastage of
resources, increased poverty and food insecurity among other vices. The figure below therefore
explains the complexity of the interactions between the above factors on resource utilization in
arid areas.
Figure 3.2 Summary of Analytical Framework
Source: Author, 2014

80
3.12 Data Presentation
The output from the various methods of analysis was presented in form of a comprehensive
written report with relevant diagrams, maps, charts, tables and plates to support the findings and
proposals.
The report was logically organized in different chapters as highlighted in chapter one above.

80
OBJECTIVE DATA NEEDS SOURCES OF DATA METHOD OF DATA
COLLECTION
EXPECTED OUTPUT
To determine the current
resources, land use
patterns and practices in
Central location.
Existing natural resources in Central; their level of
distribution; settlement patterns-household
characteristics, income levels, education,
immigration, form and structure, land use activities
and their organizations etc.
Primary sources- Field survey
(households, pastoralist,
farmers, key informants)
Literature e.g. development
plans, journals etc
Observation
Photography
Mapping
Questionnaires
Interviews
Analysis of existing
literature
Understanding of the
existing resources in the
study area; the existing land
use activities in the area as
well as their organization
To interrogate the factors
determining the current
resource use, land use
patterns and practices in
the location.
Natural resource, climatic factors; cultural practices;
historical aspects touching on land use activities in
ASALS, economic aspects, land use theories; ASAL
policies. Case studies on best practices in ASAL areas
Literature review-existing
policy documents, relevant
journals, TV programmes,
development plans, library.
Primary sources:- households,
pastoralists, key informants,
county government ministries
Reviewing of exiting
literature
interviews,
FGD
Questionnaires
To understand the various
factors determining how
the various resources are
utilized in the study area;
the existing settlement
patterns, land use activities
etc.
To examine the
consequences of the
existing resource use, land
use patterns and practices
in the location
The effects of the existing resource use/land
utilization/land use practices/land use patterns on the
social, economic, political and environmental aspects
in the study area.
The linkages/flows etc.
Field survey- household heads,
pastoralists, key informants,
county government ministries
Existing literature in
development plans, journals ,
magazines etc.
Reviewing of exiting
literature
interviews,
FGD
Questionnaires
An understanding of the
impacts of the current
resource use on the
environment, social and
economic well-being of the
local community.
To explore planning
intervention measures that
can be applied to ensure
optimal resource
utilization in the location.
Previous intervention measures/initiatives and their
level of success;
Opinions and suggestions from households, key
informants;
Success stories from case
studies
Field survey from primary
sources such as the residents,
officers from county
government of Isiolo, youth
groups, NGO‘s,CBO‘s
Literature review
FGD/workshops
Questionnaires/Interviews
The future prospects of
Isiolo;
A clear understanding of the
people‘s opinions and
suggestions on how
resources in Isiolo can be
optimally utilized for the
benefit of the community.
Table 3.1 Data Need Matrix

81
CHAPTER FOUR
SITUATIONAL ANALYSIS/BACKGROUND OF THE STUDY AREA
4.1 Overview
This chapter gives an overview of the study area such as the background information in
thematic areas such as the locational context of the study area, the physiographic aspects,
geology & soils, hydrology, climate and vegetation, human settlements, natural resource base,
resource use, land use, settlement patterns and demographic characteristics among others.
4.2 The Physical Setting of the Study Area
The study area is located in Isiolo County in Kenya. Isiolo County is in the upper Eastern
region, and lies 285 kilometres north of Nairobi, the capital city of Kenya. The County covers
an area of 25,698square kilometre. It is a merger of previously Isiolo and Garbatulla districts.
It borders seven counties with Garissa to the East, Wajir to the North east, Meru to the south
west, Samburu to the east and Marsabit to the North West, with Kitui and Tana River counties
to the south west and south east respectively. It lies between Latitude: 0°21′16″ N, Longitude:
37°34′55″ E and at 1128m or 3700ft of elevation above sea level. The County is characterized
by flat low-lying plains, especially in the lower Ewaso Ng‘iro basin, gently undulating
landscapes, and in some hills and minor scarps.
The area falls within the Ewaso Nyiro North Development Authority Region (ENNDA). The
region covers development largely Marsabit and Isiolo Counties. For this study, the corridor
of interest is Isiolo River, which is about 97 km long and located on the lee slopes of Mt.
Kenya. A section of the river that runs through Isiolo Central Location was studied. The river
has a catchment area of 569Km2.

82
Map 4.1: National and Regional Context of the Study Area
This map shows the setting of the study area within a national, regional and local context.
Source: County Government of Isiolo, 2014
The map above shows the context of the study area in national and local scale. The area falls
in Isiolo County with Meru and Garissa Counties in the neighbourhood. The base map shows
the study corridor within Isiolo Township, Central location and the different resources within
the area. The map also illustrates the population distribution and human settlement features.

83
Map 4.2: Isiolo Township Map: The Base Map
Source: Author, 2014
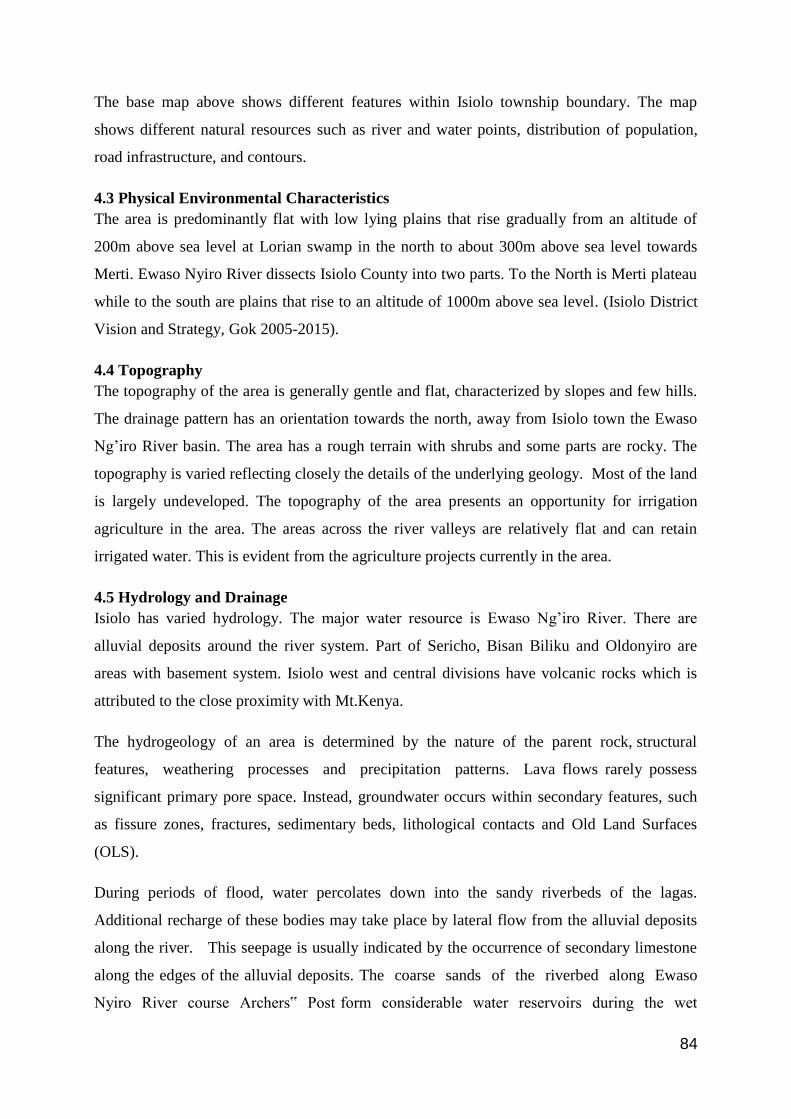
84
The base map above shows different features within Isiolo township boundary. The map
shows different natural resources such as river and water points, distribution of population,
road infrastructure, and contours.
4.3 Physical Environmental Characteristics
The area is predominantly flat with low lying plains that rise gradually from an altitude of
200m above sea level at Lorian swamp in the north to about 300m above sea level towards
Merti. Ewaso Nyiro River dissects Isiolo County into two parts. To the North is Merti plateau
while to the south are plains that rise to an altitude of 1000m above sea level. (Isiolo District
Vision and Strategy, Gok 2005-2015).
4.4 Topography
The topography of the area is generally gentle and flat, characterized by slopes and few hills.
The drainage pattern has an orientation towards the north, away from Isiolo town the Ewaso
Ng‘iro River basin. The area has a rough terrain with shrubs and some parts are rocky. The
topography is varied reflecting closely the details of the underlying geology. Most of the land
is largely undeveloped. The topography of the area presents an opportunity for irrigation
agriculture in the area. The areas across the river valleys are relatively flat and can retain
irrigated water. This is evident from the agriculture projects currently in the area.
4.5 Hydrology and Drainage
Isiolo has varied hydrology. The major water resource is Ewaso Ng‘iro River. There are
alluvial deposits around the river system. Part of Sericho, Bisan Biliku and Oldonyiro are
areas with basement system. Isiolo west and central divisions have volcanic rocks which is
attributed to the close proximity with Mt.Kenya.
The hydrogeology of an area is determined by the nature of the parent rock, structural
features, weathering processes and precipitation patterns. Lava flows rarely possess
significant primary pore space. Instead, groundwater occurs within secondary features, such
as fissure zones, fractures, sedimentary beds, lithological contacts and Old Land Surfaces
(OLS).
During periods of flood, water percolates down into the sandy riverbeds of the lagas.
Additional recharge of these bodies may take place by lateral flow from the alluvial deposits
along the river. This seepage is usually indicated by the occurrence of secondary limestone
along the edges of the alluvial deposits. The coarse sands of the riverbed along Ewaso
Nyiro River course Archers‟ Post form considerable water reservoirs during the wet
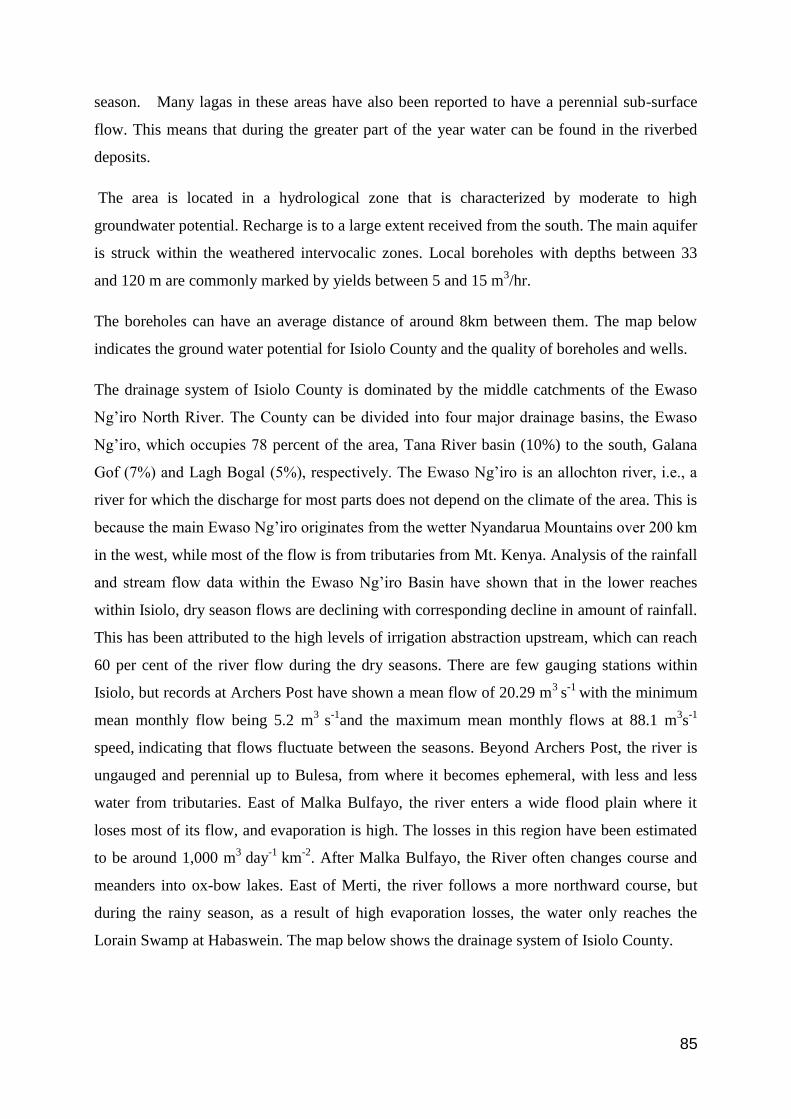
85
season. Many lagas in these areas have also been reported to have a perennial sub-surface
flow. This means that during the greater part of the year water can be found in the riverbed
deposits.
The area is located in a hydrological zone that is characterized by moderate to high
groundwater potential. Recharge is to a large extent received from the south. The main aquifer
is struck within the weathered intervocalic zones. Local boreholes with depths between 33
and 120 m are commonly marked by yields between 5 and 15 m3/hr.
The boreholes can have an average distance of around 8km between them. The map below
indicates the ground water potential for Isiolo County and the quality of boreholes and wells.
The drainage system of Isiolo County is dominated by the middle catchments of the Ewaso
Ng‘iro North River. The County can be divided into four major drainage basins, the Ewaso
Ng‘iro, which occupies 78 percent of the area, Tana River basin (10%) to the south, Galana
Gof (7%) and Lagh Bogal (5%), respectively. The Ewaso Ng‘iro is an allochton river, i.e., a
river for which the discharge for most parts does not depend on the climate of the area. This is
because the main Ewaso Ng‘iro originates from the wetter Nyandarua Mountains over 200 km
in the west, while most of the flow is from tributaries from Mt. Kenya. Analysis of the rainfall
and stream flow data within the Ewaso Ng‘iro Basin have shown that in the lower reaches
within Isiolo, dry season flows are declining with corresponding decline in amount of rainfall.
This has been attributed to the high levels of irrigation abstraction upstream, which can reach
60 per cent of the river flow during the dry seasons. There are few gauging stations within
Isiolo, but records at Archers Post have shown a mean flow of 20.29 m3
s-1
with the minimum
mean monthly flow being 5.2 m3
s-1
and the maximum mean monthly flows at 88.1 m3s
-1
speed, indicating that flows fluctuate between the seasons. Beyond Archers Post, the river is
ungauged and perennial up to Bulesa, from where it becomes ephemeral, with less and less
water from tributaries. East of Malka Bulfayo, the river enters a wide flood plain where it
loses most of its flow, and evaporation is high. The losses in this region have been estimated
to be around 1,000 m3
day-1
km-2
. After Malka Bulfayo, the River often changes course and
meanders into ox-bow lakes. East of Merti, the river follows a more northward course, but
during the rainy season, as a result of high evaporation losses, the water only reaches the
Lorain Swamp at Habaswein. The map below shows the drainage system of Isiolo County.
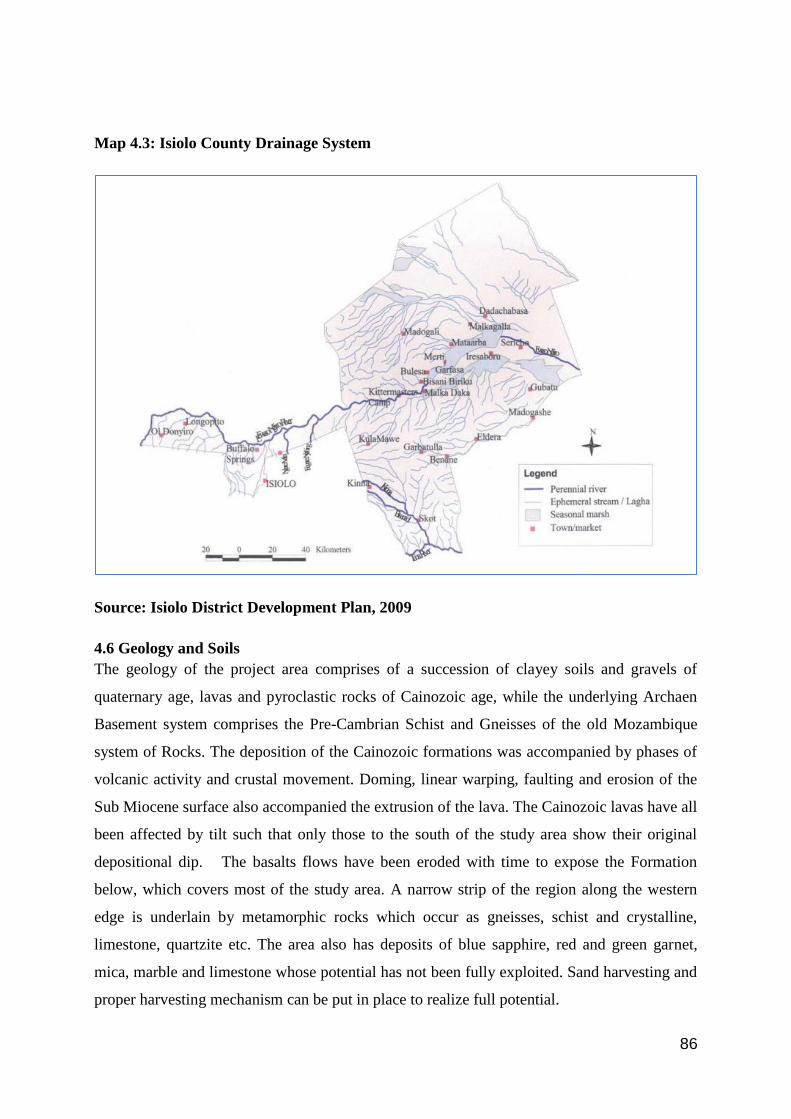
86
Map 4.3: Isiolo County Drainage System
Source: Isiolo District Development Plan, 2009
4.6 Geology and Soils
The geology of the project area comprises of a succession of clayey soils and gravels of
quaternary age, lavas and pyroclastic rocks of Cainozoic age, while the underlying Archaen
Basement system comprises the Pre-Cambrian Schist and Gneisses of the old Mozambique
system of Rocks. The deposition of the Cainozoic formations was accompanied by phases of
volcanic activity and crustal movement. Doming, linear warping, faulting and erosion of the
Sub Miocene surface also accompanied the extrusion of the lava. The Cainozoic lavas have all
been affected by tilt such that only those to the south of the study area show their original
depositional dip. The basalts flows have been eroded with time to expose the Formation
below, which covers most of the study area. A narrow strip of the region along the western
edge is underlain by metamorphic rocks which occur as gneisses, schist and crystalline,
limestone, quartzite etc. The area also has deposits of blue sapphire, red and green garnet,
mica, marble and limestone whose potential has not been fully exploited. Sand harvesting and
proper harvesting mechanism can be put in place to realize full potential.

87
4.6.1 Soil Characteristics and Crop Potential
The soils are rich in minerals and nutrients capable of supporting irrigation agriculture
activities. This makes the study on agriculture potential of the area viable. Lack of the
agriculture potential in the soils could have otherwise made this study weak. Arid or desert
soils are soils which have no water available to mesophytic plants for long periods. They have
often weakly developed, shallow and skeletal A-C or A-R profiles except in the lowlands
where soils are deeper due to colluviation and alluviation. The main factors that affect their
formation and development are: lack of water, important daily temperature variations,
deflation by wind, and microorganisms living on dew. Physical weathering is prominent in the
hyper-arid and arid zones, but is gradually replaced by chemical weathering and solution-
precipitation processes in the semi-arid zone. The soils of arid areas display a number of
characteristic features such as: desert pavement, desert patina, vesicular layer and a prominent
CaCO3 redistribution in the profile; the latter is expressed by the accumulation of secondary
calcium carbonate under the form of individual nodules or of a continuous crust (caliche).
When present, salts go into solution, redistribute and accumulate in the profile. In Soil
Taxonomy arid soils belong mostly to the order of Arid-sols. In the World Reference Base
and in the French CPCS classification they belong to different hierarchical units depending on
their intrinsic profile properties. Arid and semi-arid soils are difficult to manage and require
irrigation for sustainable economic agricultural production. Under rain fed conditions their
use is mostly limited to cereals and extensive grazing. Managing crop production risks
associated with inter-annual climate variability and climate change has received insignificant
attention in the semi-arid areas of Kenya (Isiolo district vision and strategy, Gok, 2005-2015).
Agricultural production in the arid and semiarid areas throughout the world is heavily
dependent upon water from irrigation. The major crop plants of the world are neither
xerophytic nor well adapted to and environments, and are not productive without
supplemental irrigation. Development of new crops with low water requirements is of the
highest priority. Yields of irrigated, conventional crops are generally high in the and
Southwest, but production costs are also high and continuing to increase. Reduced water
availability and increased production costs make conventional crops less attractive
economically and provide an incentive for the development and adoption of new and
alternative crops. Since plant productivity in and areas is closely tied to water usage, an
economically viable new crop should use significantly less water. However, developing a
highly productive new crop that uses less water may be easier said than done. A commonly

88
held misconception is that desert plants use water more efficiently than non-desert plants or
conventional crops. In fact many desert plants are less efficient since many of their adaptive
mechanisms that conserve water also concurrently reduce photosynthesis and dry matter
production. However, most desert plants use water more efficiently when water is limited and
can survive long periods of water stress. Xerophytic plants may not grow and produce much
biomass during periods of extended water stress, but they have the capacity to survive and
reproduce under conditions that would cause death and complete crop failure to most
mesophytic plants. Some of the crops with potential to do well in Isiolo include sorghum,
millet, cowpea, potatoes, tomatoes, pigeon pea, katumani maize variety and beans (Isiolo
district vision and strategy, Gok, 2005-2015).
4.7 Climate
The semi-arid and arid Horn of Africa, an area already characterised by high levels of
climatic variability and prone to droughts, represents one region that is particularly
vulnerable to climate change. Having been hit by a series of repeated droughts in the first
decade of the 21st century, which have led to widespread impoverishment and food
insecurity, concerns have been raised regarding the future sustainability of pastoralism,
especially given the looming challenge of climate change, which will compound current
issues of poverty and vulnerability.
4.7.1 Drought Cycle in Northern Kenya
Images of livestock carcasses, anguished faces of the elderly, despaired women and children
left behind at home as the men move in search of water and pasture while the drought scourge
bites, these are the images Kenyan have been seeing in the local media. This is happening in
the North Eastern and Eastern regions, parts of the Rift Valley, as well as the Coastal areas of
Kenya. The story of drought and famine is almost becoming a cliché in Kenya. Despite the
existing drought early warning systems in the country, drought disaster response mechanisms
and coping strategies remain miserably wanting. More often, drought and famine situations
degenerate into dire humanitarian crises before the government takes substantial action.
The drought cycle in Kenya dates back to more than three decades ago. In 1975, widespread
drought affected 16 000 people, in 1977 it was 20 000 people affected, in 1980, 40 000 people
suffered the effects of drought, and in 1983/84 it hit over 200 000 people. In 1991/92 in Arid
and Semi-Arid Districts of North Eastern Kenya, the Rift Valley, Eastern and Coastal
Provinces, 1.5 million people were affected by drought. It was reported that widespread

89
drought affected 1.4 million people in 1995/96 and in 1999/2000, famine affected close to 4.4
million people. In 2004, 3 million people were in dire need of relief aid for eight months from
August2004-March 2005 due to widespread drought. The drought in 2008 affected 1.4 million
people. In the late 2009 and early 2010, 10 million people were at risk of hunger after harvests
failed due to drought (Isiolo district vision and strategy, Gok, 2005-2015).
Traditionally, northern Kenya has been experiencing a dipole rainy season in which the long
rains are generally from March to May as the ITCZ moves northwards, and the short rains are
typically from October to December as the ITCZ retreats southwards. There is significant
inter-annual and spatial variation in the strength and timing of these rains. Rainfall varies
from over 1000mm/year in some areas to less than 300mm/year in the most arid northern
areas. However, in the observed, gridded, gauge data sets over the period 1901-2000 or over
1951-2000, there are no homogenous, statistically significant trends (0.05% level of
probability) towards wetter or drier climates in northern Kenya. In the Short rains, there is a
discernible pattern of northern Kenya becoming wetter while the southern parts are becoming
drier in the 1951-2000 analysis. The long rains in northern Kenya areas of Isiolo, Marsabit
and Wajir begin late March and last until early June and the short rains occur from October to
December. A majority of the models available show an increase in precipitation during
March, and throughout April and May, with a particularly strong signal during the peak rainy
season from mid-April to early May. The increase in rainfall shown at the in September and
October may indicate a tendency for an earlier start to the rainy season, however, in this
respect it is important to note that the magnitude of the changes in these months ranges from
very small changes (around +0.05mm/day) which would certainly not indicate early rains, to
+0.50mm, which would have a significant effect the timing of the rains. Calculating
thresholds of rainfall above which it can be said 'useful rains' have started would help to
clarify the situation, as one could look at the timing of when models cross that threshold.
Currently, the region is hot and dry most of the months in the year with two rainy seasons,
short rains occur in October and November while the long rains occur between March and
May. The area experiences low erratic relief rainfall. The area experiences an average annual
rainfall of about 580mm. Some of the factors that influence this pattern include the effect of
the ITCZ (Intertropical Convergence Zone) or movement of doldrums. The other factor could
be acute deforestation of water catchment zones. Atmospheric pressures can also be a factor
in aridity and low amounts of rainfall in the study area. The other factors include long
distance from the ocean, effects of microclimate, and sparse vegetative cover.
90
The mean annual temperature for Isiolo at an altitude of 1,104m above sea level is
26.6degrees centigrade. The area has about eight (8) hours of sunshine which gives it a high
potential for harvesting and utilization of solar energy. (Isiolo district development plan,
2008-2012). The county is classified into three climatic zones namely semi-arid, arid and the
very arid. Semi-arid zone is experienced in Central and eastern parts of the county with high
influence from Nyambene hills and Mt.Kenya. Semi-arid zone covers about five percent of
the total area of the county with an annual rainfall ranging between 400-650mm. Arid zone
covers Oldonyiro area occupying about 30% of the county. Rainfall in this area ranges
between 300-350mm annually which supports annual grassland and shrubs. Very arid zones
cover Merti, Cherab and parts of Oldonyiro occupying about 65% of the county. Very arid
zones receive annual rainfall ranging between 150 and 250mm annually. (Isiolo district vision
and strategy, Gok, 2005-2015). In addition, projections indicate that average temperatures in
Northern Kenya areas such as Isiolo are likely to increase in the range of 1-3C by the 2050s
according to downscaled results from 8 climate models using the climate change explorer
tool, and maximum temperatures show similar changes. The greatest warming generally
occurs from July to September. These are some of the cardinal indicators of climatic
variations in the study corridor.
Certainly, there are still challenges in the implementation of drought disaster responses. Even
with clearly spelled out roles of the existing institutional structures as it is outlined in the 2009
Draft National Policy for Disaster Management. Most of the response activities are focused
on immediate emergency interventions, such as water trucking and destocking. This gives
little time for adequate emphasis on long-term measures. Another challenge is that the
budgetary allocation for overall disaster management is far less than the reasonable amount
needed. Thus, drought disaster response activities are hampered by inadequate resources
allocation. The biggest setback faced by Kenya like many other African countries, is lack of
forward planning and inadequate response to crises. On the other hand, data and relevant
information (weather forecasts, drought trend analysis) is adequate and available. This is a
resource that can be used in more sustainable drought management. Unless action is taken,
drought will always be a disaster in waiting which will negatively impact on any significant
development that the Kenyan Government may undertake. Map 4.3 below shows the rainfall
distribution in Isiolo County.

91
Map 4.4: Rainfall Distribution in Isiolo County
4.7.2 Linkage between Water and Livestock Production
Livestock production is the main economic activity of communities in Isiolo County, and thus
the availability of good grazing and browse material or rangelands is as important as water
provision. In general, rangeland productivity is related to rangeland health and vitality, while
range condition is the relation between present potential and productivity. About 40 per cent
of the County has good grazing resources in terms of biomass and species. These are the areas
where the vegetation comprises Sporobolus-Chrysopogon-Acacia recifiens, Dactylocterium-
Leptothrium-Duospherma, and Cordia-Acacia tortillas-Commiphoraspecies, and covers parts
of the northeast in Merti region and parts of the southeast in Kinna Division. On the contrary,
rangelands having Aristida-ChlorisCordia-Cammiphoradeciduous bush annual grassland,
Aristida-Cordia-Cammiphora-Boswellia Ipomea-Grewiadeciduous bush land and Acacia
reficiens-Boscia, deciduous shrub land offer poor grazing. However, in-between the aforesaid
areas there are moderate grazing resources. The poor distribution of water sources is probably
the main cause of poor distribution of livestock in the rangelands, especially during the dry
season. Without a water source, it is difficult to keep livestock in an area long enough to

92
achieve proper utilization of forage. Consequently, large numbers of animals concentrate on
the few water points leading to heavy grazing pressure and trampling of soil within several
kilometres of a water point. The result is retrogression of plant communities to the dominance
of less palatable species. And with the dwindling of the palatable species further overgrazing
takes place setting off a vicious cycle of degradation.
In Isiolo District, such rangeland deterioration over the years has led to the loss of palatable
species such as bunch grass. This study found that areas with good grazing potential suffer
water scarcity and those with available water have poor grazing resources. Furthermore, the
type of forage available determines the seasonality of grazing resources and whether to install
water supply facilities. For instance, if the dominant grasses are annuals, it makes no sense to
put in a well for improving livestock access during the dry season. Accessibility to fodder
may also be limited by landform and soil. In Isiolo, flooding of the River Ewaso Ng‘iro, north
of Malkadaka during the rainy season impedes livestock mobility in these areas, forcing
animals to concentrate in the south. The map below shows the grazing and rangeland potential
and Water Sources in Isiolo (Isiolo district vision and strategy, Gok, 2005-2015).
Map 4.5 Grazing and Rangeland Potential Vis a Vis Water Sources in Isiolo
Source: Isiolo District Development Plan, 2009

93
The grazing and rangeland map is in tandem with the nomadic settlement pattern. It is evident
that the settlement are dispersed and only agglomerate in areas where there are grass
resources to support livestock production. The area experiences strong winds 6 months a year
blowing from the South to the North. Isiolo experiences a humidity of around 60% and
pressure of steady -295.27 inHg / -7518 mmHg / -9999 hPa.
4.8 Potential for Underground Water in Agriculture
Aquifers gather and store water and contaminants from large areas over decades to eons to
support many human and ecosystem functions. Globally, irrigated agriculture is the largest
abstractor and predominant consumer of groundwater resources, with important groundwater-
dependent agro-economies having widely evolved. But in many arid and drought prone areas,
unconstrained use is causing serious aquifer depletion and environmental degradation, and
cropping practices also exert a major influence on groundwater recharge and quality. The
interactions between agricultural irrigation, surface water and groundwater resources are often
very close – such that active cross-sector dialogue and integrated vision are also needed to
promote sustainable land and water management. Clear policy guidance and focused local
action are required to make better use of groundwater reserves for drought mitigation and
climate change adaptation. To be effective policies must be tailored to local hydrogeological
settings and agro-economic realities, and their implementation will require appropriate
‗institutional arrangements‘ (with a clear focal point and statutory power for groundwater
management), full involvement of the farming community and more alignment of agricultural
development goals with groundwater availability.
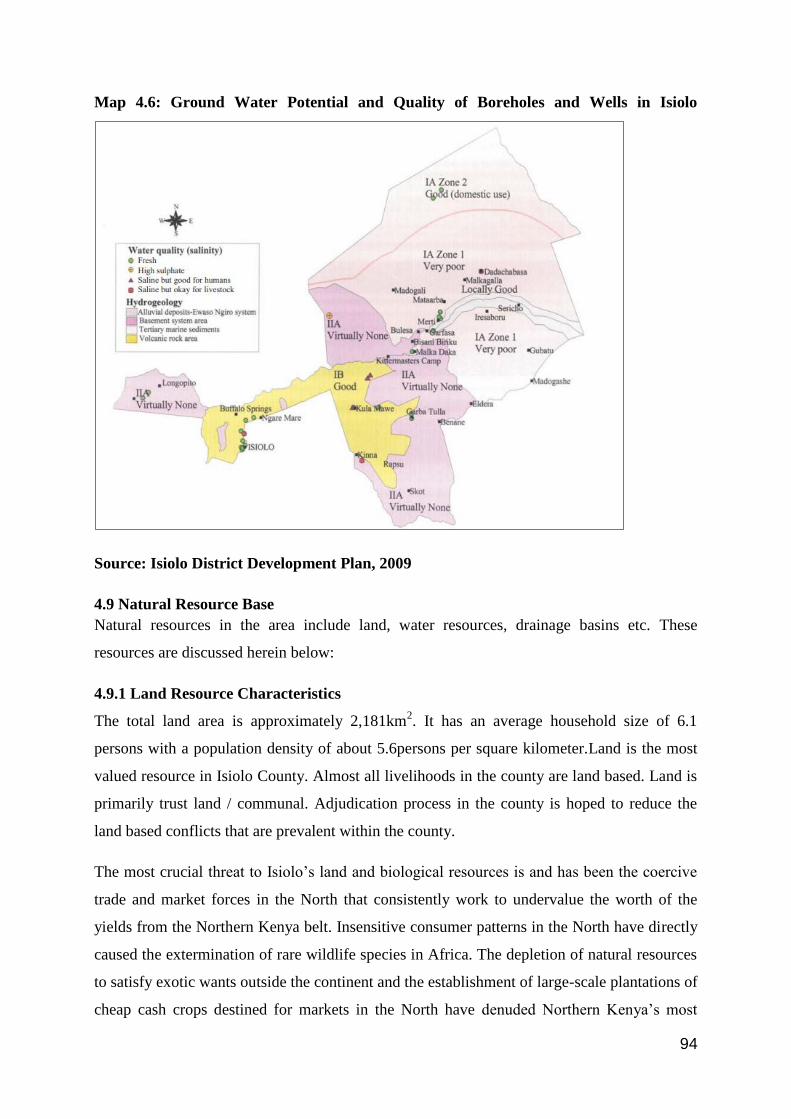
94
Map 4.6: Ground Water Potential and Quality of Boreholes and Wells in Isiolo
Source: Isiolo District Development Plan, 2009
4.9 Natural Resource Base
Natural resources in the area include land, water resources, drainage basins etc. These
resources are discussed herein below:
4.9.1 Land Resource Characteristics
The total land area is approximately 2,181km2. It has an average household size of 6.1
persons with a population density of about 5.6persons per square kilometer.Land is the most
valued resource in Isiolo County. Almost all livelihoods in the county are land based. Land is
primarily trust land / communal. Adjudication process in the county is hoped to reduce the
land based conflicts that are prevalent within the county.
The most crucial threat to Isiolo‘s land and biological resources is and has been the coercive
trade and market forces in the North that consistently work to undervalue the worth of the
yields from the Northern Kenya belt. Insensitive consumer patterns in the North have directly
caused the extermination of rare wildlife species in Africa. The depletion of natural resources
to satisfy exotic wants outside the continent and the establishment of large-scale plantations of
cheap cash crops destined for markets in the North have denuded Northern Kenya‘s most
95
fertile soils, clogging rivers with silt and destroying invaluable plant and animal species as
more land is cleared for extensive plantations.
4.9.2 Land Tenure
Most of the land is held on a freehold basis while a segment of the Township land is held as
leasehold with owners having to pay monthly rates. Since all the land in Isiolo District is
classified as ―low potential,‖ most of the land is administered by the Isiolo County Land
Board as ―Trust land‖ for the Government while grazing lands are communally owned. Large
areas of the district are occupied by bush lands, grasslands and scrublands. There‘s need to
review the tenure system in order to encourage investors in the area. There is predominant
free grazing. The rangelands are communally grazed.
4.10 Land Use
Land is the most abundant resource in the County. However, its full utilization is hampered by
various factors ranging from tenure, conflicts and aridity. This for a long time has resulted
into uncertainty among land users which in turn result to low investment in land-based
ventures e.g. agriculture and wildlife projects. For a long time, Isiolo acted as a relief zone for
neighbouring counties during dry seasons. The communities would return to their original
places once the drought is over. However, the communities are no longer returning back to
their places after the dry seasons. People are now using the trust land loophole to settle
permanently in Isiolo resulting to anxiety among local communities. This is a recipe for ethnic
conflicts. The community keeps goats, sheep, cattle, chicken, while donkeys are used for
carrying loads and water. Pastoral agriculture is the dominant land use, with crop farming, and
commercial activities forming the other notable land uses.
The main determinant of animal movements is the availability of water and security concerns
from occasional livestock raiders. Land use on agriculture is restricted to the transition zone
between the foothills of the Mount Kenya and Nyambeni foothills and the low lands towards
Isiolo. There is also some limited irrigation going on near Isiolo where permanent springs
exist e.g. at Ngarenaite/Lailubua along the Isiolo – Kula Mawe Road and Ngaremara
Location. Other notable small-holder irrigation activities are carried out in Ngarendare area.
The rural fraternity in Isiolo has concentrated mainly on pastoral framing and in crop farming
along the River Isiolo valley. However, the urban set-up is mainly preoccupied with
commercial land use with commercial activities such as butcheries, banking, and market for
agriculture produce being predominant. The type of land uses in the area has affected the

96
orientation of human settlements and networks between nodes of activities. There are high
densities within Isiolo town compared to the sparsely populated rural Isiolo.
4.10.1 Density Issues
The area is generally a low density settlement. Permanent settlements are sparse due to low
population, infrastructure development and insecurity. However, a few small centres exist
such as Ndumuru or Sharp (Shaba Ndogo) and Kachiuru along the main road from Isiolo
towards Kula Mawe. Isiolo town is the administrative headquarters and commercial centre of
Isiolo district. The town has one of the most developed infrastructure and basic services
within the district. In addition, Isiolo town is a transit centre for the far-flung northern Kenya
districts of Marsabit, Moyale and Wajir. Indeed, due to its strategic position, Isiolo town has
been identified and earmarked for elevation to a resort city status. Asa result of pull factors,
particularly the relatively better access to basic needs and services such as food, education,
water, healthcare and employment, Isiolo town is experiencing one of the most rapidly-
growing populations in the region. This is likely to increase the density of the area.
4.11 Surface Water Resources
There are four big perennial rivers in Isiolo county i.e Ewaso Nyiro, Isiolo, Kima and
Bisanadi. River Ewaso Nyiro has its catchment area from the Aberdare and drains into the
Lorian Swamp.
Rivers and streams form a major source of water for domestic use and livestock watering. The
Ewaso Ng‘iro River is the most important source of water in Isiolo County, especially for
livestock watering, with animals from drier regions of the north immigrating to its banks
during dry spells. The other permanent rivers, Ngare Mara, Engare Nything, Bisanadi and
Kinna run mostly through Meru North region, and only traverse a short distance into Isiolo,
thus have less impact on water availability in the County, but their flows are very low,
averaging about 0.10 to 0.33 m3s
-1.
In addition, these tributaries traverse very short distances within the County. The rest of the
County is criss-crossed by many ephemeral valleys and gullies (locally called lagha). These
are ungaged and handle large volume of flush floods during the rains, but remain dry for most
of the year. However, the potential for water harvesting in these valleys is enormous.
Generally, river/stream water is not a sustainable source of water in the County. Isiolo River
originates form Mt.Kenya and drains into Ewaso Nyiro River. The plate below shows Isiolo
River in one of the access sections to the river.
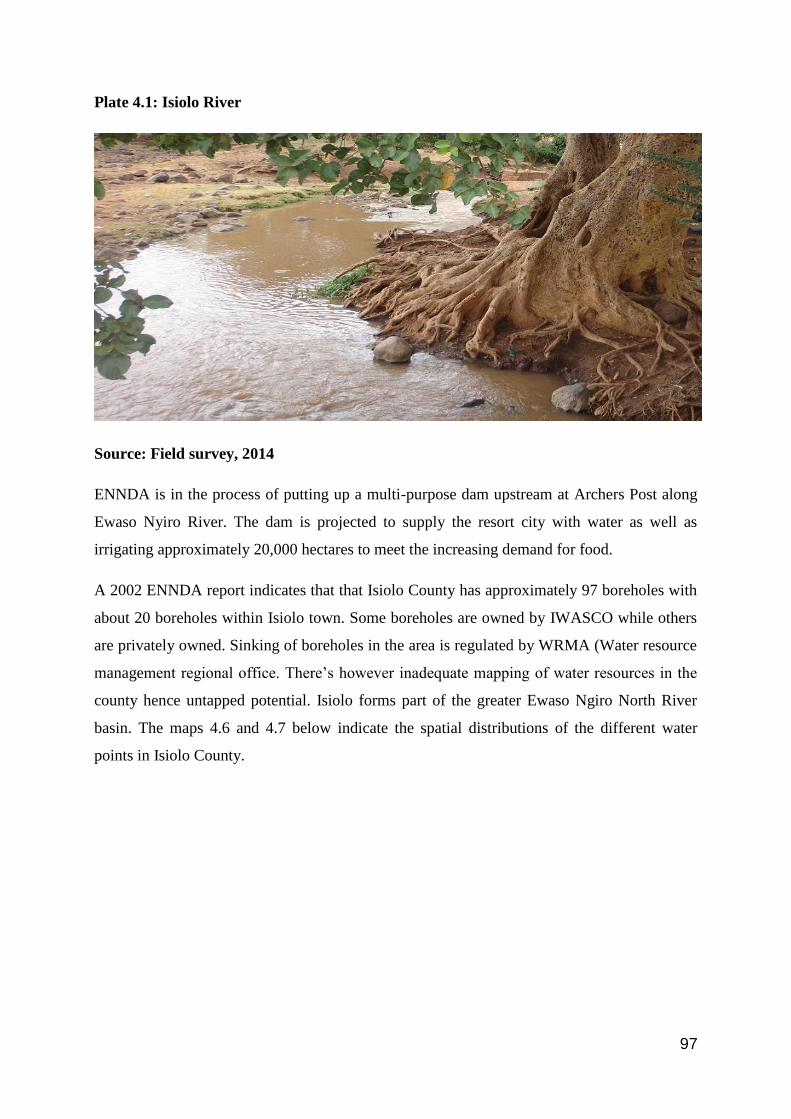
97
Plate 4.1: Isiolo River
Source: Field survey, 2014
ENNDA is in the process of putting up a multi-purpose dam upstream at Archers Post along
Ewaso Nyiro River. The dam is projected to supply the resort city with water as well as
irrigating approximately 20,000 hectares to meet the increasing demand for food.
A 2002 ENNDA report indicates that that Isiolo County has approximately 97 boreholes with
about 20 boreholes within Isiolo town. Some boreholes are owned by IWASCO while others
are privately owned. Sinking of boreholes in the area is regulated by WRMA (Water resource
management regional office. There‘s however inadequate mapping of water resources in the
county hence untapped potential. Isiolo forms part of the greater Ewaso Ngiro North River
basin. The maps 4.6 and 4.7 below indicate the spatial distributions of the different water
points in Isiolo County.
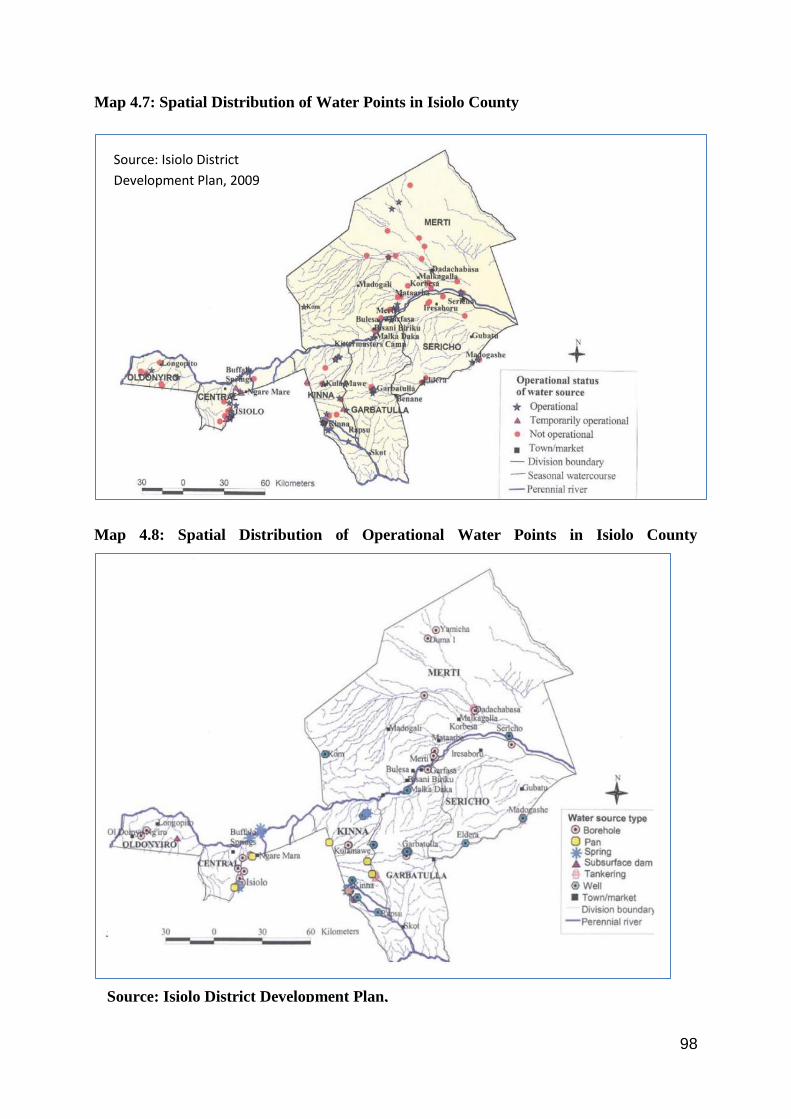
98
Map 4.7: Spatial Distribution of Water Points in Isiolo County
Map 4.8: Spatial Distribution of Operational Water Points in Isiolo County
Source: Isiolo District
Development Plan, 2009
Source: Isiolo District Development Plan,
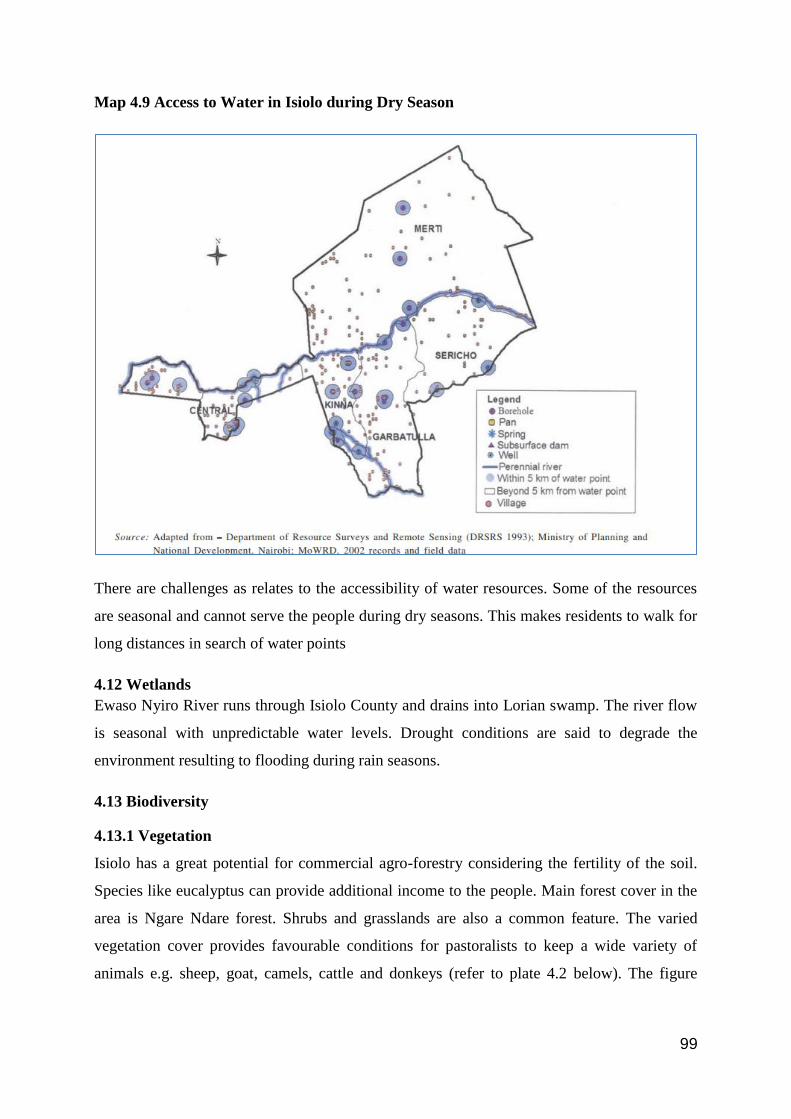
99
Map 4.9 Access to Water in Isiolo during Dry Season
There are challenges as relates to the accessibility of water resources. Some of the resources
are seasonal and cannot serve the people during dry seasons. This makes residents to walk for
long distances in search of water points
4.12 Wetlands
Ewaso Nyiro River runs through Isiolo County and drains into Lorian swamp. The river flow
is seasonal with unpredictable water levels. Drought conditions are said to degrade the
environment resulting to flooding during rain seasons.
4.13 Biodiversity
4.13.1 Vegetation
Isiolo has a great potential for commercial agro-forestry considering the fertility of the soil.
Species like eucalyptus can provide additional income to the people. Main forest cover in the
area is Ngare Ndare forest. Shrubs and grasslands are also a common feature. The varied
vegetation cover provides favourable conditions for pastoralists to keep a wide variety of
animals e.g. sheep, goat, camels, cattle and donkeys (refer to plate 4.2 below). The figure

100
shows several livestock grazing on one of the rangelands in Isiolo. It also shows shrubs and
grassland vegetation in the area that forms the essential food for livestock.
The structure of the shrub and tree layers of a semi-arid rangeland in northern Kenya was
investigated. A physiognomic classification revealed four categories: woodland, dwarf shrub
bushland, shrubland and thickets. Woodland can only develop with subsidiary water supply
along channels and permanent rivers. The differentiation of bushland and shrubland is
correlated with soil properties. While the former covers loamy and sandy sites, the latter is
confined to clay soils which are characterised by low infiltration rates. Thicket formation
especially occurs on eroded valley sediments.The bushland is characterised byAcacia tortilis,
Commiphora africana, Grewiaspecies and dwarf shrubs such asLippia carviodoraandVernonia
cinerascens. There are indications that the present high cover ofAcacia tortilisis a result of an
increase in herbivore pressure during recent years. Similar conclusions are drawn in the case
of thickets which are mainly composed ofAcacia horridaandA. reficiens. In contrast, there is
no evidence for an impact of livestock on the structure of the shrubland which is characterised
byAcacia mellifera, A. paoliiand several species of the Capparaceae family. Exotic trees or
shrubs have not invaded. Compared to the ground layer which is analysed in a subsequent
paper, the effects of livestock on the bush and tree layer are low.
Plate 4.2: Livestock Grazing on Vegetation in Isiolo
Source: Author, 2014
The map below shows the land cover and various environmental features in Isiolo County.

101
Map 4.10: Land Cover and Environmental Features in Isiolo County
4.13.2 Wildlife
There are three major game reserves in the county i.e Buffalo springs, Shaba national game
reserve and Bisanadi. All the three are under management of Isiolo county council. The
closest game reserve to the study area is Shaba National Game Reserve. There is no great
tourist attraction in comparison to other major Game Parks in Kenya but there remains
potential for conservation and development to enhance attraction.
4.13.3 Isiolo Resort City Concept
The resort cities flagship projects aims to develop Resort Cities in Diani, Kilifi, Lamu
Turkana and Isiolo which will in turn Optimize the rich tourism potential, Attract economic
activities and investments within the regions. The elevation of Isiolo to a resort city is
drawing closer to reality with the government mapping 6,200 acres of land on which investors
will build proposed tourist facilities including amusement parks. Besides the resort city, an
international airport would be constructed in the town as a node for a railway line, pipeline
and highway to be built under the Lamu-South Sudan-Ethiopia Transport Corridor. The resort
city will include accommodation facilities, theatres for international festivals, water sport
102
facilities, amusement parks, art exhibition, skiing and golf courses. The resort cities seek to
attract high-end tourists who will see the government increase expenditure per visitor to
Sh70,000 up from the current Sh56,000. There are expectations that the Isiolo resort city
would spur the growth of other sectors such as livestock production and transport. The project
has seen the price of land in Isiolo surge to Sh9 million an acre within the township and Sh1
million in the outskirts. The resort city would be in close proximity to key tourist attraction
sites around Isiolo like the Buffalo Springs, Samburu National Park, Shaba National Reserves,
Mt Kenya National Park and Meru National Park. The population in the northern Kenya is
expected to provide a market of 2.3 million people and contribute an estimated 13 per cent to
national Gross Domestic Product.
4.14 Livestock
Livestock is the major production system in the area with the main livestock being cattle
(zebu), goats, donkeys and camel. Bee keeping is also widespread in the rural parts.
There are no recent records on livestock numbers in Isiolo due to lack of animal census in the
County in the recent past. However, records from the District Livestock Office (2002) showed
that there are about 146,000 head of cattle, 183,200 sheep, 205,600 goats, 30,000 camels and
15,500 donkeys in the County. Pastoralism employs directly and indirectly about 60 per cent
of the adult labor force. However, over the years, livestock numbers have increased, owing
mostly to immigration by pastoralists from the drier north, due to the presence of the Ewaso
Ng‘iro River in Isiolo, which is the only permanent river in the region. The population has
also grown rapidly, both in numbers and in the diversity of ethnic groups that share the
resources. Isiolo Town itself is a frontier trading centre linking the inhospitable north to the
rest of Kenya and consequently to livestock markets. As a result, the grazing and water
resources in Isiolo have been stressed. This situation triggered a series of conflicts. The
district suffered under the ―Shifta‖ wars of the late 1960s, and in recent years, there have been
many conflicts, sometimes escalating to full-fledged armed battles between the various ethnic
groups.
Kenya‘s livestock production accounts for 24% of total agricultural output. Over 70% of the
country‘s livestock and 75% of the wildlife are found in the ASALs (Orindi, 2007). Despite
this, pastoralist areas such as Isiolo have the highest incidences of poverty and the least access
to basic services of any in the country. The highest poverty levels remain in the northern
pastoralist districts (Kirbride and Grahn, 2008).

103
Grazing of the livestock is mainly done in rangelands in the rural Isiolo and along the river
valleys. Grazing is done in group ranches that were established to settle ASAL communities
(including in Laikipia, Samburu, Narok and Kajiado) so that, amongst other things, they are
be provided with amenities including schools, hospitals and infrastructure. The ranches are
managed by a group ranch committee and are issued with a title deed as a form of security to
their land. They use the land as collateral against loans with which to buy immature stock for
fattening.
The livestock value chain commences from the individual owner or SACCOs. There are
different routes for marketing of livestock in Northern Kenya. These include the Eastern route
(Wajir, Mandera, Garissa and Somali border), the northern route (Isiolo, Moyale, Samburu,
Marsabitand the Ethiopian border), the southern route (Tanzanian border, Kajiado (Emali and
Bissil markets),Mwingi and Narok, coastal areas (lower Garissa/Ijara, Tana River, Taita
Taveta) and other routes (Laikipia, Eldoret, Kuria and Migori). Interviews of stock traders
were undertaken at the primary markets and terminal markets of Nairobi and Mombasa. In
Isiolo, the livestock moves from the owner or SACCO to Isiolo livestock market where
brokers join the chain or selling is done directly to agents who then move the livestock to
either the Isiolo slaughter house, Meru, Nanyuki or Nairobi where it is used for meat
production that is supplied in these towns. There are approximately 600 cattle, 300 Goats, and
200 Sheep traded in a typical month in Isiolo livestock market.
Cattle purchase prices range from Kshs.10, 000-50,000/head, goats from Kshs.2,000-
Kshs.6,000/head and camels from Kshs.20000-Kshs.40,000/head. Traders realize net margins
of 10-60% for cattle, the higher margin being for heavy Boran animals. Trekking and
associated costs range from Kshs.596/head to Kshs.1, 045/head for cattle, camels from
Kshs.1, 050-1,111/head and for goats for Kshs.372/head.
Some of the value chain actors include pastoral producers, commercial ranches, Collectors,
Livestock marketing groups, Service providers (transportation, Brokers, County Government,
Animal Health Providers, Flattening and Slaughter Agents, and Processors.
There are also the hides and skins value chain that tends to follow a similar trend to livestock.
It is an offshoot of the livestock value chain. After slaughter, at home, butcheries or abattoirs,
hides and skins are preserved through sun drying (ground and suspension drying) or wet
salting. Hides earn higher prices than sun-dried hides and skins. Traders collect hides and
skins and deliver them to tanneries, of which there are currently 13 in Kenya. Semi-processed
104
and processed hides and skins (wet blue, crust or finished leather) are exported to China, Italy
and India, with smaller volumes going to Turkey, Pakistan and Switzerland, where they are
manufactured into shoes as well as leather garments. Finished leather is also supplied to local
leather product manufacturers, such as shoemakers.
There is approximately 98 per cent of skins and 96 per cent of hides produced in Kenya that
are semi-processed to wet blue, crust or finished leather—up from just 56 per cent in 2004.
The number of tanneries has risen from nine in 2005 to 13 in 2009, with utilization of
operating capacity increasing from 30 per cent in 2003-04 to 70 per cent in 2007-08 (USaid,
2012).
In 2009, Hides and Skins contributed 0.7 per cent of export earnings compared to 1.14 per
cent in 2005, 82%—significantly more than meat exports. Volumes of leather exports more
than doubled between 2005 and 2010 (from 10,083 MT to 22,272 MT), while exports of hides
and skins (which have less value-added and are therefore of lower value) declined to nearly
zero (from 15,683 MT in 2005 to an estimated 322 MT in 2010). The value of Kenya‘s leather
exports in 2010 was Kshs. 3.3 billion (U.S. $43.5 million) (USaid, 2012).
The figure below illustrates that there are different types of markets for livestock as illustrated
in the figure below.

105
Figure 4.1: Isiolo Livestock Market Organization
Source: Author, 2014
The large cities of Nairobi and Mombasa have the highest per capita meat consumption within
Kenya. The authors estimate Nairobi‘s consumption at 25.8 kg per person, which would
require the monthly supply of approximately 27,839 head of cattle, 71,555 sheep and goats,
and 685 camels to Nairobi. Mombasa is another important terminal market (along with
Nairobi) for livestock from pastoral areas, and particularly North Eastern Province.
Mombasa‘s annual consumption is estimated at 21.2 kg per person in 2011, requiring a
monthly supply of 8,178 head of cattle, 21,021 sheep and goats and 201 camels (USaid,
2012).
The Kenyan meat market is primarily urban and is stratified according to income, with the
middle class accounting for the large majority of meat consumers in the urban centers. While
there is a significant price differential for beef between high-end and low-end markets, when
consumption is segmented by income quintile, it appears that the four lower quintiles pay
relatively similar prices per kg (although the meat cuts and quality differ).
Although total volumes remain small (accounting for only 1 percent of Kenya‘s meat
production), Kenya has experienced an important increase in meat exports since 2005,
particularly following the re-opening of the Kenya Meat Commission (KMC) abattoir as an
LOCAL MARKET IN iSIOLO
•Retail consumers of Meat
•Primary and Secondary Centres
•Local Butchers
DOMESTIC KENYAN MARKET
•Urban Consumers (Nanyuki, Meru, Nairobi, Mombasa etc.)
•Large Scale Retailers (Supermarkets and Hotels)
•Commercial Ranches
•Kenya Meat Commission
EXPORT MARKET
•Consumers in Gulf States (Oman, UAE, Qatar) , Somalia and Egypt
•Coops
•Live Animal Exporters and Meat Exporters
•Ethiopia, Tanzania, Sudan and Uganda

106
export-licensed facility for use by private exporters .Tanzania and the UAE are Kenya‘s most
consistent markets for meat exports in recent years. However, in 2010, several large new
markets were opened or expanded: Qatar, Oman, Kuwait, Somalia and Egypt (USaid, 2012).
There is need to improve this livestock chain through eestablishing strong and functional
linkages between livestock value chain and impact analysis on the one hand, and sectorial,
general equilibrium, and other economic modeling. There is need to identify and advocate
pro-poor livestock policy options emerging from the analysis.
4.15 Minerals
The region has deposits of blue sapphire, red and green garnet, mica marble and limestone
whose potential has not been exploited fully. The region also has plenty of sand which is not
optimally exploited. Minerals are around the area of Archers Post in the Marsabit County
borderline and along valleys of river Ewaso Nyiro. Currently, Sand harvesting is the major
activity that benefits the locals with residents harvesting sand for use in construction industry
in Isiolo, Marsabit and Meru. The geology indicates that there is more potential for limestone
and sand in the County.
The plate below shows a rich deposition of sand along the valley of River Ewaso Nyiro. There
is need to optimize and regulate sand harvesting from the rivers in the County.
Plate 4.3: Sand Harvesting
Source: ENNDA, 2010

107
4.16 Solar and Wind Energy
The county lies along Marsabit-Bubisa wind belt with very high potential of wind energy
generation. There is also the proposed Chalbi desert integrated project aimed at generating
100MW from wind. The lack of public-private partnerships as well as sovereign guarantees
from treasury to the wind energy investors has hampered full utilization of the natural
resource. The county also enjoys long periods of sunshine which is a great potential for solar
energy.
There are high wind speeds in various parts of northern Kenya such as Isiolo and other arid
lands. Preliminary wind resource assessments show that wind regimes in Marsabit and Isiolo
can support commercial electricity generation as they enjoy wind speeds ranging from 8 to 14
meters per second (m/s). Marsabit, Isiolo, Laisamis, Turkana and Samburu are some of the
areas that have potential to produce over 1,000 MW of wind power for sale to the national
grid. Isiolo could take example from Ngong in generation of energy using Wind Power.
4.17 Population and Demographic Characteristics
Isiolo is inhabited by communities such as the Borana, the Somali, Turkana, the Samburu and
Meru. The region is cosmopolitan. The Borana mainly identifies themselves with clans. These
clans influence development and distribution of resources in the county. There are two major
religions i.e Christians and Islam. The county is divided into six administrative divisions, i.e
central, Garbatulla, Sericho, Merti, Oldonyiro and Kinna. The total population of the county is
143,294 which is 0.37% of the national population. The total male population is 73,694 i.e.
51% while female are 69,600 i.e. 49% (KNBS, 2009). Isiolo County has a population density
of 5.66 people per square kilometre compared to the national density of 66 people per square
kilometre. The region has an annual growth rate of 1.455 compared to the national growth rate
of 2.7%. High level of mortality rate is one of the factors that accounts highly for the low
population growth rate.
Majority of the population (54%) is considered as urban with 46% being rural. The high urban
population in the region is necessitated by conflicts over livestock as affected people move to
urban areas in search of employment. This has consequently led to emergence of informal
settlements i.e. Manyattas. The settlement pattern in the area is influenced by the nomadic
way of life of the local people who majorly practice pastoralism. Central division is densely
populated compared to other divisions due to its well-developed infrastructure. People have

108
also tended to settle around permanent water sources for domestic as well as irrigation
purposes.
Table 4.1: Divisional Population and Density
Division Total population Area(km2) Density
Central 41,496 755.7 55
Oldonyiro 15,388 1,161 13
Kinna 14,618 2,181.1 7
Garbatulla 16,401 3,821.4 4
Sericho 12,099 3,816.4 3
Merti 19,447 4,870.4 3
Source: (KNBS, 2009 Census)
Table 4.2: Demographic Indicators
Densities Growth rate (%) Poverty levels Area (km2)
5.6 1.45 71 25,968
Source (KNBS, 2009)
4.17.1 Demographic Characteristics
Pastoralist populations are growing due to many and diverse factors. Pastoralists are being
obliged to inhabit more marginal rangelands, and some are adapting their traditional
livelihoods to gain access to services and alternative livelihoods. These trends in pastoralist
demography, including urbanisation, need to be part of the development agenda so that these
changes and their consequences are taken account of in dry lands development.
4.17.2 Population Structure and Composition
Data suggests that, in the continuum from nomadism to semi-nomadism to sedentarism, birth
rates rise and death rates fall at each stage. This pattern has several policy implications for
stakeholders assessing the transformation of pastoralist societies. If populations grow rapidly
as pastoralists settle, development policies should accommodate such growth and respond
with the provision of education, health and infrastructure. The population of Isiolo comprises
of children, youth, and adult women and men. The population pyramid below provides a
breakdown of the composition and structure of the population.

109
4.17.3 Population Distribution
Isiolo County has a population density of 5.66 people per square kilometre compared to the
national density of 66 people per square kilometre. The region has an annual growth rate of
1.455 compared to the national growth rate of 2.7%. High level of mortality rate is one of the
factors that accounts highly for the low population growth rate.
4.17.4 Mortality Rates, HDI and Life Expectancy
The Infant Mortality rates for Isiolo County stands at 43/1000. The under-five Mortality Rate
is 56/1000. The Human Development Index of Isiolo as at 2009 when it was measured last
stood at 0.6. Life Expectancy of Isiolo County is 50 years.
4.17.5 Fertility Levels
The reproductive female age group is about 25 per cent of the total population. The fertility
rate on the other hand is high at 6 compared with the national fertility rate of 4.6. This is
attributed to low use of contraceptives by the community. This age group is quite large and
the county needs to provide adequate health facilities to cater for this growing population
through intensification of reproductive health campaigns
4.17.6 Sex Ratio and Dependency Rate
The male to female ratio is about 1:1 and the sex ratio is almost equal at each age group.
However, with 53% of the population being below 15years of age and another 3% being
above 65 years, the dependency ratio is very high. Statistics also indicate that 71 % of
population live below poverty line (KNBS, 2009).
4.17.7 Population Projection
The basic equation for growth is Pt = P0(1+r)t
Where Pt is the population at given time t ,Po is the initial population when t = 0 and r is the
population growth rate. With a current growth rate of 1.5, in 10 years time, the estimated
population of this area will be as follows:-
P0 = 41496,r = 1.5% and t is time= 10 years
P10 = 41,496(1+0.015)10
47,921

110
The projection of the current population shows that in 10 years, the population in this area
will to about 47,921 people from the current 41,496. This implies that pressure will continue
to increase on the current resources as well as existing services which are already strained.
There‘s therefore need for expansion of the carrying capacity to improve production in order
to cater for the increasing demand.
Figure 4.2: Maternal and Child Health Indicators (Immunization, Child Births, and
Contraceptives)
Source: Isiolo District Development Plan, 2009
Figure 4.3: Population Pyramid
Source: Kenya Population and Housing Census, 2009
111
The male to female ratio is about 1:1 with most of the population being below 40 years of age.
The age category between 40-64 makes the less population. The population at age group 65
and above is larger than that between 40 and 64. Comparing this to the mortality rate in the
region, this explains that the region has an ageing population. Most young population has also
moved out to other regions in search of greener pastures and services.
4.18 Migration
The area is cosmopolitan in nature i.e. it‘s referred to as the ‗gateway to the North of Kenya‘
hence different cultures and cultural activities. This is often a source of conflicts among
various communities. The area has a high rate of in-migration mainly nomadic pastoralists
from Marsabit, Laisamis and Cherab areas in search of water and pasture. It happens in rainy
seasons such as March to June. Out-migration happens during dry seasons especially January
to February, pushing pastoralists into neighbouring Samburu and Laikipia County. However,
immigration into the area is higher than out-migration.
4.19 Culture and Decision Making
The traditional institutions of family and clans are still valued in the area hence need to
involve community leaders in any decision. Women do not own or control assets such as
livestock and do not take part in development matters. In terms of division of labour, women
play the cardinal role of domestic duties such as house building, making food for family and
child-raising. Men take care of family property such as Livestock. Circumcision is the
common rite of passage for the communities. It happens at the age of 12 years, when the
teenagers are expected to be responsible in their roles at the community and receive training
for adulthood. Community elders are responsible for rites of passage. Adult women guide the
girls as men guide the boys. This is essential in protecting community social values and
morality.The Isiolo Cultural festival is one of the major cultural events that are renowned in
the County. The culture brings together a display of culture from different communities in the
County. The Kalacha cultural food and music festival is also another cultural festival popular
within the County. The event is a celebration of artistic creativity of great value and beauty
and brings together thirteen communities, Borana, Burji, Daasanach, El-Molo, Gabbra, Garri,
Konso, Rendille, Somali, Samburu, Saakuye, Turkana and the Waata to celebrate their
diversity through narratives, poetry, song, dance and drama providing a portrait of the
meaning of life as experienced by the communities. The festival encapsulates the traditional
knowledge, beliefs and values of communities in the Northern part of Kenya. Camel racing is

112
also popular cultural event in the County. A community council of elders is responsible for
community conflicts resolutions.
4.19.1 Social Life
Isiolo is inhabited by two major communities namely the Borana and Somali. Therefore,
social life is a combination of the culture and practices of the two communities. The Borana
tribe is a section of a major group known as Galla. There are four sub-groups – the Gabbra,
the Sakuyye, the Boran-gutu and the Waat. Classified as Eastern Cushites, the Galla are
believed to have been gradually pushed westwards from the horn of Africa by the Somali
around the tenth century, until they entered Ethiopia in the sixteenth century. Through
constant warfare the Borana displaced the War day (Oromo) section of the Galla from
southern Ethiopia (Dirre region) in the mid-seventeenth century. Dirre and Liban then became
for a time their permanent home, and even today they maintain strong ties with this area. They
believe that they were ‗created‘ in Liban, and all their important shrines and their political
headquarters belong in the region. The Borana are pastoralists, though a few also grow crops
around Marsabit and Moyale, or in the southern Ethiopian highlands.
There are also a few irrigation schemes in Isiolo District. The Waat are hunters and gatherers
and, because of their very small numbers, they have long attached themselves to other Boran
clans, and in the process they have become completely dispersed. A Borana household
consists of a male head, his wife and a number of children. Brothers, and in fact most of the
close relatives, live near one another. So one gets brothers, sisters, uncles, aunts, cousins,
nephews, and often people whose only relationship is that of common ancestry, living
together in the same village as an extended family. Where a man has more than one wife, the
children from all the wives are equal brothers and sisters. A brother from the eldest wife will
be responsible for the home after their father dies. All the other brothers and sisters,
irrespective of their different mothers, are under his charge. The eldest wife occupies a senior
position.
Somalis belong to clans and sub-clans. These hierarchical descent groups, each said to
originate with a single male ancestor, are a central fact of Somali life. The Somali clan
organization is an unstable system, characterized by changing alliances and temporary
coalitions. The culture of Somalia is an amalgamation of traditions in Somalia that were
developed independently and through interaction with neighbouring and far away
civilizations, including other parts of Northeast Africa, the Arabian Peninsula, India, and
113
Southeast Asia. The cultural diffusion of Somali commercial enterprise can be detected in its
exotic cuisine, which contains Southeast Asian influences. Due to the Somali people's
passionate love for and facility with poetry, Somalia has often been referred to as a "Nation of
Poets" and a "Nation of Bards", as, for example, by the Canadian novelist Margaret Laurence.
Somalis have a story-telling tradition. Somalis have a rich musical heritage centered on
traditional Somali folklore.
Somali art is the artistic culture of the Somali people, both historic and contemporary. These
include artistic traditions in pottery, music, architecture, wood carving and other genres.
Somali art is characterized by its aniconic, partly as a result of the vestigial influence of the
pre-Islamic mythology of the Somalis coupled with their ubiquitous Muslim beliefs.
4.20 Comparison with ASALs
In Kenya, the ASALs occupy over 80 per cent of the land area accommodating 12 million
(36%) of the population (Republic of Kenya 2001). But these are populations having the
highest poverty levels, averaging at 65 per cent, with livelihoods that are constrained by very
poor access to basic social services (Government of Kenya 2003). Generally, ASALs in
Kenya are characterized by high potential evapotranspiration, exceeding twice the annual
rainfall, and in certain areas as much as ten times the annual rainfall (Republic of Kenya
1992). The annual rainfall is low, ranging from 150-450 mm and it rarely achieves the 60 per
cent probability of occurrence (Republic of Kenya 1993). Rainfall is also highly variable in
space and time, and often occurs as high intensity storms. As a result, considerable surface
runoff is generated, which is exacerbated by sparse vegetation cover. Water availability and
accessibility is a constraint to production and is also highly variable spatially and temporally.
Thus ASALs are more suited to livestock grazing systems, accommodating mostly
pastoralists and agro pastoralists, who own 50 per cent of the national cattle and a small
ruminant herd, and 100 per cent of the camel population.
One recurring problem in the ASALs is droughts and flush floods. A drought is defined as the
failure of three consecutive rainy seasons. In the past, a major drought was expected once
every 10 years, but over the past three decades major droughts have recurred after every 5-7
years. This means that ASAL livelihood systems do not adequately recover to withstand the
next drought. As a result, any small shock such as a prolonged dry spell has a much bigger
impact on people‘s livelihood strategies than in the past. This situation is aggravated by
insecurity, rising poverty and declining asset levels (natural, human, social, financial and

114
physical assets). Furthermore, the ASALs are fragile eco-systems that require protection from
environmental degradation and desertification. Access to drinking water for communities and
livestock are major livelihood constraints in the ASALs (Republic of Kenya 1992; 1994).
Isiolo County exemplifies these issues. However, the County ranks relatively better in terms
of overall development indices compared to other ASALs in North Eastern Kenya. For
instance, using the percentages of under-five children with global acute malnutrition (GAM)
in highly vulnerable disaster-affected districts, indicators below show global emergency
thresholds for 2013 2012 baseline rates: Turkana North – 15.3%, Turkana South – 17.1 %,
Turkana West – 14.3 %, Turkana Central – 11.6 %, Mandera West – 16.2 %, Wajir
West/North - 14.6%, Marsabit – 13.4%, Mwingi-2.8% and Isiolo-11%. The other comparison
is on the levels of illiteracy for population aged 6-18 years in ASALs as showed in the figure
below.
Figure 4.4: Level of Illiteracy among Population Aged 6-18 Years
Percentages of Illiterate Population
Source: Kenya Population and Housing Census, 2009
4.21 Human Settlements
4.21.1 Settlement Trends and Patterns
The region is cosmopolitan in nature with Meru and Somali being the majority in Isiolo town
and central division. Internally the Boranas identify themselves with clans which are a key
factor in development and in distribution of resources in the area. Over 80% of the settlements
are in Central and East divisions with 72,282 people out of the total population of 107,469
settling in the two divisions. Population distribution and density is mainly influenced by water

115
availability, infrastructure and security. Central is more densely populated due to its
infrastructure and commercial centres. The area has one larger market at Isiolo town where
basic infrastructure and services are provided.
4.21.2 Rural Settlement
The settlement patterns in the rural areas are highly influenced by the nomadic way of life of
the local people who are mainly pastoralists. Watering points have also attracted farming
communities and pastoralists due to the guaranteed water supply. Loss of livestock especially
during dry seasons has influenced settlement patterns in urban areas as affected people
relocate to urban areas in search of jobs. As a result, majority of them live in informal
settlements (Manyattas) with poor housing conditions. The rural settlement is largely sparsely
distributed. The main factor for this is the need for large livestock grazing ranges as the
residents are nomads and low population densities. The land use activities and patterns in this
region are unplanned. Settlement systems are also unplanned. The structure of rural
settlements and networks linkages leads to inadequate optimization of resource utilization as
most of the residents lead a nomadic lifestyle. Rural settlements have a close linkage to the
Isiolo town as it forms there market and primary centre in provision of services. They depend
on Isiolo for market of their livestock products, banking, food, and linkages to other parts of
Kenya. The implication of the sparse rural settlement is inadequate development of
infrastructure, and poor housing as the residents tend to focus on building temporal structures.
The sparsely distributed settlements also hinder optimal resource utilisation in terms of labour
and finance resources which would be pooled to improve productivity of the region. The
settlements also lead to insecurity as it becomes difficult to oversee the sparse settlements.
4.21.3 Rural Settlement Patterns
Settlement patterns in the rural areas are dispersed with people settling along the river and
other water bodies. According to the field survey, 60% of the respondents settled in their
current location due to proximity to the river while 24% due to proximity to the urban centre.
4.22 Urbanization
Isiolo County has an Urban Population of 62, 374 people. This is 43% of the entire population
in the County compared to Kenya‘s 32% urban population.

116
Figure 4.5: Percentage of Urban Population in Isiolo
Source: Kenya Population and Housing Census, 2009
The character and form of Isiolo town boasts of services and infrastructure that characterizes
modern urban centre. Isiolo is the major urban centre in the region with Garbatulla being
second. There also exists a network of other concentrations of human settlements i.e service
centres though they lack basic urban services. Isiolo is the largest centre in the County and it
is also the headquarters of the County, followed by the secondary centres of Kinna, Merti and
Garba Tula. Isiolo town is a business town with six commercial banks and one micro-finance
institution that serve its people. These include Barclays Bank, Consolidated Bank Kenya,
Kenya Commercial Bank, Post Bank, K-rep Bank and Equity Bank. The town is cosmopolitan
with the Somalis, Boranas, and the Merus forming the largest chunk of the residents. The
figure below shows the hierarchy of urban centres in Isiolo County. Isiolo County has water
services, an upcoming sewerage project, electricity line, health centres, education facilities,
Courts, Administration post, and an Airport. Industry present in the town is a livestock
slaughter house and hides and skins value addition centre.
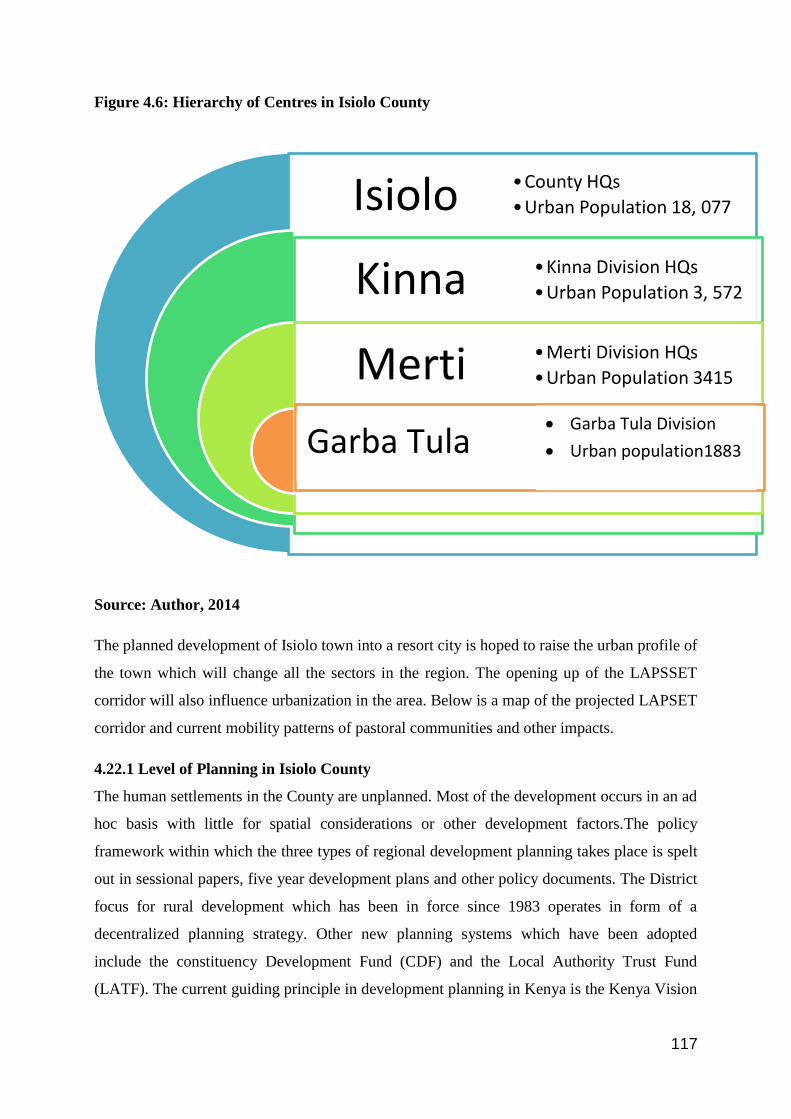
117
Figure 4.6: Hierarchy of Centres in Isiolo County
Source: Author, 2014
The planned development of Isiolo town into a resort city is hoped to raise the urban profile of
the town which will change all the sectors in the region. The opening up of the LAPSSET
corridor will also influence urbanization in the area. Below is a map of the projected LAPSET
corridor and current mobility patterns of pastoral communities and other impacts.
4.22.1 Level of Planning in Isiolo County
The human settlements in the County are unplanned. Most of the development occurs in an ad
hoc basis with little for spatial considerations or other development factors.The policy
framework within which the three types of regional development planning takes place is spelt
out in sessional papers, five year development plans and other policy documents. The District
focus for rural development which has been in force since 1983 operates in form of a
decentralized planning strategy. Other new planning systems which have been adopted
include the constituency Development Fund (CDF) and the Local Authority Trust Fund
(LATF). The current guiding principle in development planning in Kenya is the Kenya Vision
Isiolo
Kinna
Merti
•County HQs
•Urban Population 18, 077
•Kinna Division HQs
•Urban Population 3, 572
•Merti Division HQs
•Urban Population 3415
Garba Tula Garba Tula Division
Urban population1883
118
2030, which is a vehicle for accelerating transformation into a rapidly industrializing middle
income nation by the year 2030. The Millennium Development Goals (MDG's) which focuses
inter alia on poverty eradiation, combating of diseases, provision of universal free primary
education and ensuring environmental sustainability are being mainstreamed in all
development planning cycles. For the first time in the history of Kenya, development planning
has been entrenched into the new Kenyan constitution. The constitution is expected to ensure
that there is equity in resource distribution and allocation. It puts in place structures and
modes of operation at the national and county government level. Kenya has to adopt a new
policy that can enhance planning of human settlements.
4.22.2 Level of Service Provision
The level of service provision in Kenya‘s northern belt is low. There is lack of supportive
infrastructure such as roads, and utilities, commercial development, industrial development
and agriculture. The provision of government and public facilities has also lagged behind in
the area. There are inequalities in political participation, social services, and income earning
opportunities.

119
Map 4.11: Projected LAPSET Corridor and Current Mobility Patterns of Pastoral
Communities
Source :( ILRI, 2011)
120
The LAPSSET corridor project is the first single gigantic, integrated, transformative and
game-changer infrastructure project the government has initiated and prepared under Vision
2030 Strategy Framework without external assistance. The project endeavors to deliver a Just
and Prosperous middle income Kenya by the year 2030. Kenya is spearheading the
development of Lamu Port-South Sudan-Ethiopia-Transport (LAPSSET) Corridor Project to
strengthen her position as a gateway and a transport and logistics hub to the East African sub-
region and the Great Lakes region to facilitate trade, promote regional economic integration
and interconnectivity between African countries. The Project is managed by the LAPSSET
Corridor development Authority (LCDA) which is domiciled under the Government of
Kenya. The project will have tremendous impact on land use such as leading to infrastructure
development; attract corridor development and residential and urban sprawl. The project will
also enhance flows and linkages between Isiolo and other regions thereby spurring growth in
Isiolo. This is for instance movement of farm products to and fro other towns.
4.23 Economic Activities
4.23.1 Livelihood Profile
The economy of Isiolo is dominated by mobile pastoralism, while in semi-arid areas like
Central; a more mixed economy prevails including rain-fed and irrigated agriculture, agro-
pastoralism and small-scale businesses based on dry land products, conservation and tourism.
The rural economy is dominantly livestock production based while commerce based on
livestock and livestock products runs Isiolo town.
4.23.2 Livestock Production
Livestock is the major economic activity in the area. Animals kept include:-cattle, sheep,
goats, camels and donkeys. The main challenge is lack of proper livestock marketing
infrastructure due to constraints caused by poor physical and industrial infrastructure.
There are approximately 600 cattle, 300 Goats, and 200 Sheep traded in a typical month in
Isiolo livestock market. This brings a total of 13,200 livestock production on an annual basis.
Milk is from camels, goats and cattle with the composition being 41%, 39%and 20%for the
three species of animals respectively. Traders, mostly women/women groups and youth
groups, collect an average of 75 litres per trader. The collection is higher during wet seasons
than dry seasons. Milk is transported by canter vans to Isiolo market where it is sold in bulk or
in small quantities. Net margins realized for selling camel milk to the bulk buyers like hotels
were 17.5% and 20% per litre for the dry and wet seasons respectively. The margins improved
121
if the milk was sold to consumers directly to 49% and 55% for the two seasons respectively
and averaged at 37% and 43% respectively for the two seasons and categories of consumers.
Net margins for goat milk averaged at 18% and 16% per litre in the two seasons respectively
in the bulk-market, improving to 45%and 54% respectively in the consumer market and
averaging net profits of 38% and 42% for the two seasons and consumers.
Hides and skins are produced at the farm, rural slaughterhouse slabs and the bigger
slaughterhouses. After slaughter, they are either cured by wet salting (WS) or air drying. Wet
salting is preferred as it produces high quality hides and skins. After primary curing, they are
sold to hides/skins traders who sell to small rural tanneries or major tanneries. In 2004, Kenya
produced 2.148miles hides, 3,095miles goat skins, 3.809 miles sheep skins and 34,023miles
camel skins. Kenya has 11 major tanneries producing wet blue leather and products. Their
installed capacity for hides is 1.062miles/year which is about 44% of production. Their
installed capacity for shoat skins is 2.26miles/year which is about 32% of production.
A simple value-addition by Tegemeo group in Isiolo which collects raw hides, cures them and
then transports them to tanners is a demonstration of the potential for small rural groups to
earn profits. The margins realized by the group were 44% for cattle hides, 61% for sheep
skins, 41% for goat skins and 49% for camel skins. Indicators on livestock production are
wide and scarce due to lack of a solid data and facts survey on livestock in Northern Kenya.
The existing data is simply estimates of the sector amalgamated from various studies.
4.23.3 Crop Farming
Despite the county being named as ‗a net importer of food from neighbouring counties e.g
Meru and Laikipia, sections of the county especially the semi-arid areas have soils rich in
minerals and nutrients capable of sustaining both commercial and subsistence farming
through irrigation. Most crop production is rain fed though areas like Kula-Mawe have
irrigation schemes. Example of crops grown include onions, tomatoes, maize etc. most rivers
are seasonal while irrigation schemes register poor returns due to inappropriate technology
and lack of social capital. With appropriate technology, crop farming is an opportunity which
can move the local community from overdependence on livestock (poverty reduction strategy
paper, 2001-2004- Isiolo district). Livestock and Agriculture based activities contribute over
70% of the household income in the county and employ over 75% of the available labour.
Main challenge is drought which remains a serious threat to food security in the area.

122
4.23.4 Mining
Sand is a major resource in the area and is readily harvested in Burat area and along Ewaso
Nyiro. Inappropriate methods of exploitation have led to environmental degradation. Sand is
also a source of conflict among the communities living in these areas as they compete for
exploitation in relation to geographical extent of each community‘s boundaries and resources.
Other available minerals are blue sapphire, red and green garnets, mica, marble and limestone
in central division. These minerals have potentials which are yet to be exploited due to lack of
a clear policy, lack of a proper inventory on available resources as well as lack of awareness
by the local community. The local residents are the main actors in sand harvesting and the
chain extends to the construction industry. However, there are brokers in the chain of sand
supply and this lowers the benefits to the residents. The mining sector is yet to fully optimize
its operations and bring considerable impact to Isiolo.
4.23.5 Forestry
The area has one forest i.e Ngare Ndare forest hence with proper mechanisms in place, the
local community can move into commercial agro-forestry as a source of income with suitable
species such as eucalyptus. Natural forests and sceneries engulfed with shrubs and vegetation
are also common throughout the County. However, the County is off the mark regarding the
achievement of Kenya‘s target of a 10% forest cover and there should be enhancement in
conservation and reforestation efforts to redress the diminishing forests.
4.23.6 Tourism
The area has a great tourism potential. The interaction between wildlife and pastoralism
coupled with rich cultural heritage of the pastoral community are major tourist attractions.
The area has three major national reserves namely, Shaba game reserve, buffalo springs and
Bisanadi. Lewa conservancy is a wildlife sanctuary which is also an attraction to tourists.
Lewa is home to a variety of wildlife i.e. black rhino, zebra, lion, leopards etc. During peak
seasons, the county receives about 1,000 tourists per month earning the council about
kshs.200 million per year while creating employment for over 1,000 people. However, these
resources have a great potential which if well tapped can make tourism a major economic
activity in the region. However, local communities feel that the revenue from tourism does
not trickle down to them. There is potential for further consolidation and improvement in the
tourism sector especially from domestic tourism. This can improve the revenue base of the
County.
123
4.24 Infrastructure Facilities
4.24.1 Road Transport
For a long time, Isiolo County has had a road network of 380KM with only 11KM of it
tarmacked. There are around 87.6 KM of roads with gravel and 289.3KM are of earth surface.
The rural population has virtually had no road network rendering accessibility very difficult.
The situation gets worse during rainy seasons. Roads are also rocky and only big vehicles
manage to use them. This hinders movement of goods and people hence limiting access to
markets. There‘s need to invest in the road network to facilitate movement of goods and
people. The major hindrance to opening up new roads is the uneconomical sense of the
investments and scarce resources. With most of the population living along seasonal rivers, it
requires a lot of funds to connect by construction of bridges and drifts. The mode of transport
for the interior/ rural parts is Lorries which are used to ferry cattle to the market areas. There
are a lot of unclassified roads currently being maintained by various agencies e.g. county
council and CDF. The tarmacking of the current Meru-Isiolo-Merille road has greatly opened
up the urban area to the rest of the neighbouring areas e.g. Meru and Nanyuki. Isiolo is now
also considered a favourable town in terms of development prospects due to the proposed
elevation of the town into a resort city as well as the LAPSSET project.
4.24.2 Water Supply
Isiolo town is supplied with water by Isiolo water and sewerage company (IWASCO). The
other form of water supply is from boreholes. People have also sunken boreholes to enable
them get water. The wider rural part is prone to drought with poor accessibility to clean water.
More than half of the population depends on boreholes. Women spend a lot of time searching
for water at the expense of other development activities. MTAP has currently commissioned a
study aimed at mapping out water resource potentials in the county.
4.24.3 Air Transport
The area has one airport i.e. Isiolo airport which is already rehabilitated for local flights and
there are plans to expand it into a fully functional international airport for people and goods.
The government of Kenya has proposed to construct a new railway line from Lamu port to
Isiolo, where the line will branch to Ethiopia and southern Sudan.
4.25 Education
The county has about 150 ECDE centres, 91 primary schools and 11 secondary schools and 1
tertiary institution. The total school enrolment level in Isiolo stands at 24004 and the teacher

124
to pupil ratio also stands at 1:38 students in Public schools. The tertiary institution is the
Isiolo Youth Polytechnic. In addition, there are adult literacy classes where enrolment stands
at 1158 adults. The education infrastructure of the County is not at a standard level in
comparison with other Counties in Kenya. Isiolo has lagged relatively behind in terms of
education development and academic performance of schools. Some of the factors attributable
to this state are inadequate of educational facilities, retrogressive culture, ignorance,
inadequate of teachers and nomadic lifestyle.
4.26 Health Facilities
Isiolo County has 24 dispensaries, 1 health centre, and 1 district hospital. The infant mortality
rate is 43/1000 while the less than 5 mortality rate is 56/1000. The County is yet to meet the
health care demands of the populace as most of these health facilities are highly
underequipped. There is also lack of adequate medical personnel to attend to patients.
4.27 Energy Access
About 80% per cent of the county‘s population use firewood as a source of energy for
cooking purposes while 18% of the population use charcoal. Electricity is available in Isiolo
and its environs. However, there is less than 20% of population with access to electricity. In
addition the Ministry of Energy has plans to install solar systems in health facilities, schools
and watering points. Other sources of energy such as biogas and solar are used on a limited
scale.
4.28 Posts and Telecommunications
The county is served by three mobile phone service providers, with coverage of more than 60
per cent. However, a large section of the county still has no network coverage especially in
Oldonyiro and Merti. The total landline connection stands at about 60% of the County.
There is a post office in Isiolo and other Divisional headquarters. The county is served by
several internet cyber cafes.
4.29 Summary of the Background
The data from the background chapter provides an indication that there is great potential in
the development of agriculture in arid and semi-arid areas such as Isiolo. The data reveals that
there has been overwhelming dependence on livestock production in running the economies
of the ASALs despite the enormous potential the regions exhibit in other regions. Crop
cultivation is an upcoming feature in these regions and as evident from discussions on
geology and soils, there is viability to increase ventures on crop farming through irrigation
from underground or surface water.
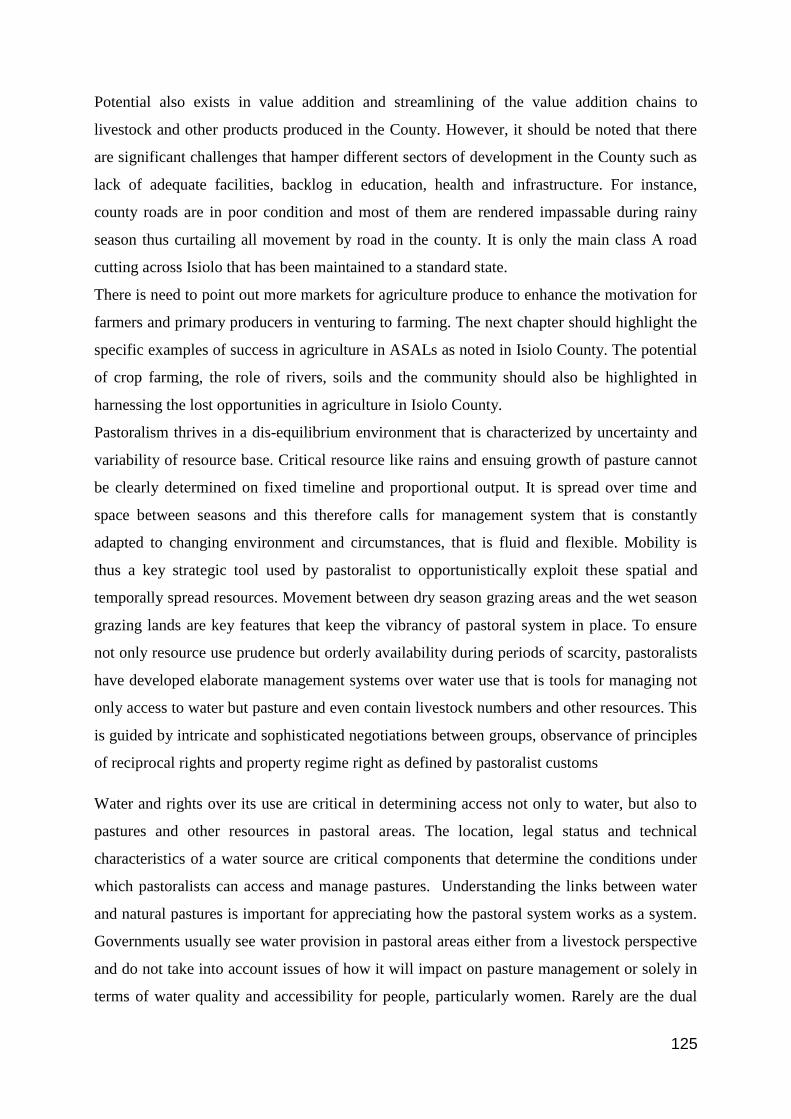
125
Potential also exists in value addition and streamlining of the value addition chains to
livestock and other products produced in the County. However, it should be noted that there
are significant challenges that hamper different sectors of development in the County such as
lack of adequate facilities, backlog in education, health and infrastructure. For instance,
county roads are in poor condition and most of them are rendered impassable during rainy
season thus curtailing all movement by road in the county. It is only the main class A road
cutting across Isiolo that has been maintained to a standard state.
There is need to point out more markets for agriculture produce to enhance the motivation for
farmers and primary producers in venturing to farming. The next chapter should highlight the
specific examples of success in agriculture in ASALs as noted in Isiolo County. The potential
of crop farming, the role of rivers, soils and the community should also be highlighted in
harnessing the lost opportunities in agriculture in Isiolo County.
Pastoralism thrives in a dis-equilibrium environment that is characterized by uncertainty and
variability of resource base. Critical resource like rains and ensuing growth of pasture cannot
be clearly determined on fixed timeline and proportional output. It is spread over time and
space between seasons and this therefore calls for management system that is constantly
adapted to changing environment and circumstances, that is fluid and flexible. Mobility is
thus a key strategic tool used by pastoralist to opportunistically exploit these spatial and
temporally spread resources. Movement between dry season grazing areas and the wet season
grazing lands are key features that keep the vibrancy of pastoral system in place. To ensure
not only resource use prudence but orderly availability during periods of scarcity, pastoralists
have developed elaborate management systems over water use that is tools for managing not
only access to water but pasture and even contain livestock numbers and other resources. This
is guided by intricate and sophisticated negotiations between groups, observance of principles
of reciprocal rights and property regime right as defined by pastoralist customs
Water and rights over its use are critical in determining access not only to water, but also to
pastures and other resources in pastoral areas. The location, legal status and technical
characteristics of a water source are critical components that determine the conditions under
which pastoralists can access and manage pastures. Understanding the links between water
and natural pastures is important for appreciating how the pastoral system works as a system.
Governments usually see water provision in pastoral areas either from a livestock perspective
and do not take into account issues of how it will impact on pasture management or solely in
terms of water quality and accessibility for people, particularly women. Rarely are the dual

126
requirements of water for both livestock and people considered in policy and development
projects. From the chapter, it comes out that there is inadequacy of resources and especially
in terms of exploitation of potential. Land degradation is considered the most significant
impact of natural resource scarcity and competition and either directly or indirectly feeds all
the other manifestations of the core problem. Overgrazing in the non-protected areas in
northern Laikipia and Samburu districts has led to substantial gully erosion and loss of soil.
This is particularly evident on Livestock Management Division land, which lacks any system
for its management or use. The land degradation reduces the viability of pastoralism and
directly contributes to increased food insecurity and vulnerability during drought periods.
The exclusive use of land relates to land in northern Kenya that is inaccessible to the public.
This includes government protected areas – which for the study area include Samburu and
Laikipia National Reserves and Maralal National Sanctuary; government land used for other
activities (such as military training); and privately owned land.
The latter category relates to Laikipia, where there are a number of large privately owned
ranches which do not permit access for livestock, and in the wetter parts of the district private
land is sub-divided and used for commercial and subsistence agriculture. Despite this, it was
only considered to be of low significance for the NRT community conservancies, which tend
to be further north of the areas in the Rift Valley that are privately owned, suitable for arable
farming and historically at the centre of land dispute issues in Kenya. However, given
increased pressure on resource access in the future, issues of land ownership and exclusion
may become more contentious in the NRT area, especially as outside groups migrate into the
area as a means of adaptation
Ambiguity over land ownership has increased the difficulty and cost involved in obtaining
land. This means that many pastoralist groups do not have secure tenure.
Weak Natural Resource Management (NRM) institutions are closely linked to economic
marginalisation as resources are not optimally used to generate alternative sources of income
and livelihood. It also leads to land degradation as resources are over-used and depleted.
Lastly, and most saliently for this report, weak management leads to rising tensions between
groups: access is not regulated by any institution (be it formal or traditional) which would
otherwise establish rules and serve to peacefully negotiate disputes between separate groups
seeking to utilise the same set of resources.
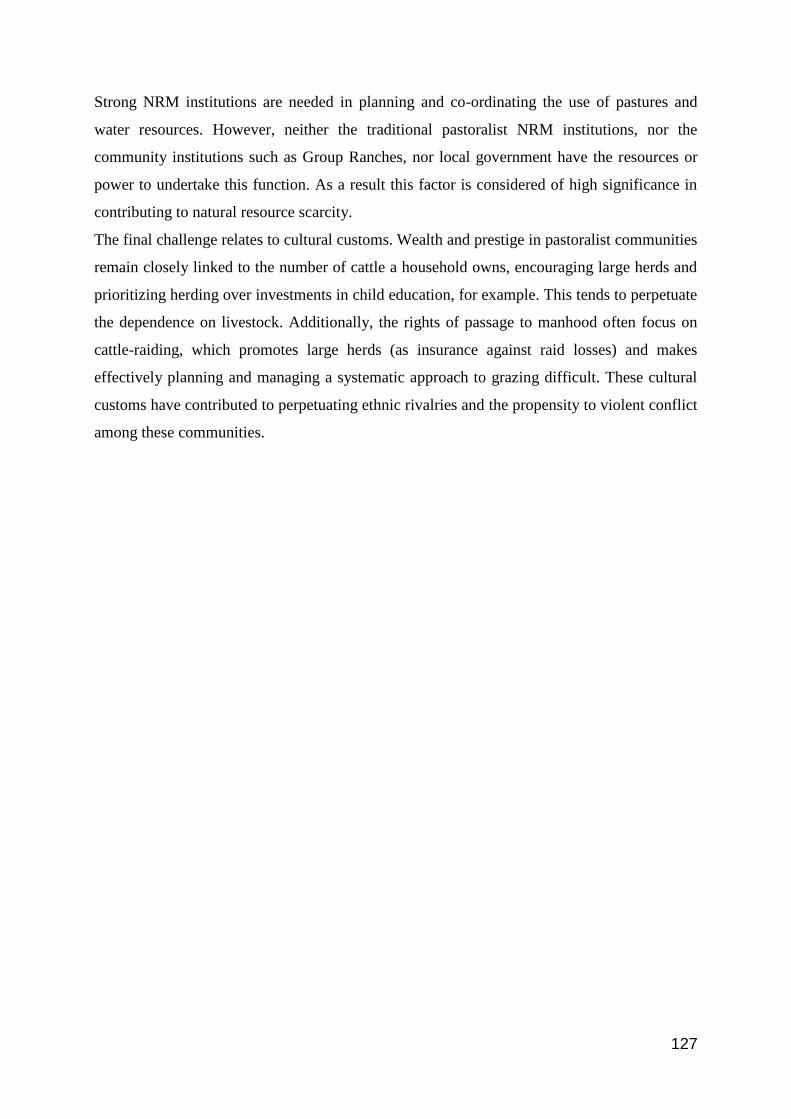
127
Strong NRM institutions are needed in planning and co-ordinating the use of pastures and
water resources. However, neither the traditional pastoralist NRM institutions, nor the
community institutions such as Group Ranches, nor local government have the resources or
power to undertake this function. As a result this factor is considered of high significance in
contributing to natural resource scarcity.
The final challenge relates to cultural customs. Wealth and prestige in pastoralist communities
remain closely linked to the number of cattle a household owns, encouraging large herds and
prioritizing herding over investments in child education, for example. This tends to perpetuate
the dependence on livestock. Additionally, the rights of passage to manhood often focus on
cattle-raiding, which promotes large herds (as insurance against raid losses) and makes
effectively planning and managing a systematic approach to grazing difficult. These cultural
customs have contributed to perpetuating ethnic rivalries and the propensity to violent conflict
among these communities.

128
CHAPTER FIVE
STUDY FINDINGS
5.1 Overview
This chapter presents the social economic profile of respondents, current land use pattern and
practices in Central location, potential of the study area, planning intervention measures that
can be applied to optimize land utilization and the synthesis of findings section which is
referred to as synthesis of the study findings. The chapter provides an insight of the situation
in the study area. It is divided into two broad sections firstly the presentation of study results
and secondly a critical synthesis of the results. The first section presents the findings of the
study based upon information gathered as a result of the methodology applied. The findings
are articulated according to various themes such as demographic characteristics, human
settlements, infrastructure, economic activities and social-cultural activities among others.
The second part presents the analysis of the findings.
5.2 Social Economic Characteristics
The Isiolo population has varied social and economic characteristics. There is a strong
communal culture based on Somali and Borana cultural values and morals. The communities
also operate based on traditional values and Muslim values. Pastoralism and livestock and
livestock products commerce dominates the economic characteristics of the people
5.2.1 Demography and Population
5.2.1.1 Gender, Age, and Marital Status
The research indicates that 85% of the respondents are female while only 15% are male.
There are 65% of respondents who are between the age of 18-35 years, 25% are between 36-
45 years, and 10% are more than 46 years. The study shows that 55% of the respondents are
married while 45% are single.
5.2.1.2 Household Size
The study shows that the average household size for the study area is 5 children plus the
parents making 7. There are 90% of the respondents who have between 4-6 children while
10% have 1-3 children.

129
5.2.1.3 Household Education Level
The study shows that 60% of the respondents have at least attended secondary education, 13%
have primary level education and only 27% have attended tertiary institutions such as colleges
and universities.
5.2.1.4 Duration of Stay in Isiolo
The study shows that 35% of the respondents have stayed in Isiolo for about 6-10 years. There
are 65% of the respondents who have stayed in the region for more than 10 years. The study
reveals that 40% of the respondents were born in Isiolo while 60% have immigrated to the
area.
5.2.2 Land Ownership
The study indicates that 45% of the respondents have leased the land they live in, while 55%
own the land they reside. This is an indicator that there has been a high level of immigration
to Isiolo as pull factor such as the LAPSSET Project, Resort City Plans, rising potential for
agriculture and devolution of resources act as incentives for investment in the town.
5.2.3 Migration
The study findings indicate that 40% of respondents identified Isiolo as their place of birth,
while 60% immigrated into the area. About 65% of the respondents have stayed in the area
for more than 10 years. About 35% have stayed in the area for between 6 and 10 years. Some
of those who have immigrated to the County have come from Meru (42%), Kisii (17%), Nyeri
(17%), Nanyuki(8%) Nairobi (8%), and Molo(8%). The survey found out that the main
reason for immigration is family/marriage ties at 33%. Other reasons included search for
opportunities, job transfer, business among others. The figure below shows the reasons for
migration to Isiolo. It is an illustration of the pull factors of Isiolo town.

130
Figure 5.1: Reasons for Migrating into Isiolo
5.2.4 Economic Profile
The study found out that people are engaged in different activities in order to support their
livelihoods. According to the survey, about 73% of the respondents depend on agriculture.
That is basically livestock production and crop cultivation, as the main source of livelihood.
However, the study indicates that about 27% rely on business as their source of livelihood.
The plate below shows charcoal on display along the Isiolo-Marsabit road. Charcoal for
commercial purposes is one of the ventures that the residents of Isiolo are exploring to meet
their daily livelihood needs.
Plate 5.1: Charcoal on Display for Sale
Source: Field Survey 2014
0%
5%
10%
15%
20%
25%
30%
35%
40%
Business Family/Marriage Search foropportunities
Job transfer
Source: Field survey,

131
5.2.5 Crop Production
Crop production is one of the economic practices of the Isiolo residents. Crop farming is an
upcoming trend and is gaining momentum in a fast way among the Isiolo residents with a
shift from the traditional livestock farming.
The livestock industry faces tedious challenges such as prolonged drought, inadequate
pasture, land and theft conflicts and low livestock prices. This has led to the appreciation of
irrigation crop farming especially along the river valleys. Crop production in the study area is
mainly along Isiolo River. However individuals are also investing in green houses especially
those who live far away from the river. The major crops grown in the area are tomatoes,
sukuma wiki (kales), and spinach among others.
5.2.5 Research and Farming in ASALs
Agricultural research is an essential service to the livestock industry in Kenya. This is seen in
the planning, execution of research programmes and in the promotion and adoption of
research results and recommendations. Effective research on forages and agricultural by-
products can only be measured in terms of its contribution to the solution of problems faced in
the national development. Research should start with identification of farmer's problems and
opportunities develop and test appropriate technologies under farmer's conditions and
conclude with solutions that would enable farmers to increase their income. Generation,
dissemination and utilization of appropriate technology depend on interdisciplinary team
approach, organized into an interacting and cohesive group involving researchers, extension
workers and farmers. There is need for strong research-extension-farmer linkages in order to
develop and test suitable and adaptable technology that will increase production. A lot of
pasture and agricultural by-products research has been carried in Kenya for many years and
substantial amount of results and technologies developed and recommended to farmers. Not
all these research results and technologies have been adopted by Kenyan farmers. However,
Kenya has not made adequate research to assist farmers in establishing crop and livestock
production in Arid and Semi-arid areas. There are still knowledge gaps that should inform
farmers on the best farming strategies in areas such as Isiolo.
The plate below shows a crop farm along Isiolo River. It shows that the residents are
incorporating crop farming as part of their livelihood strategy apart from the traditional
activity of livestock farming.
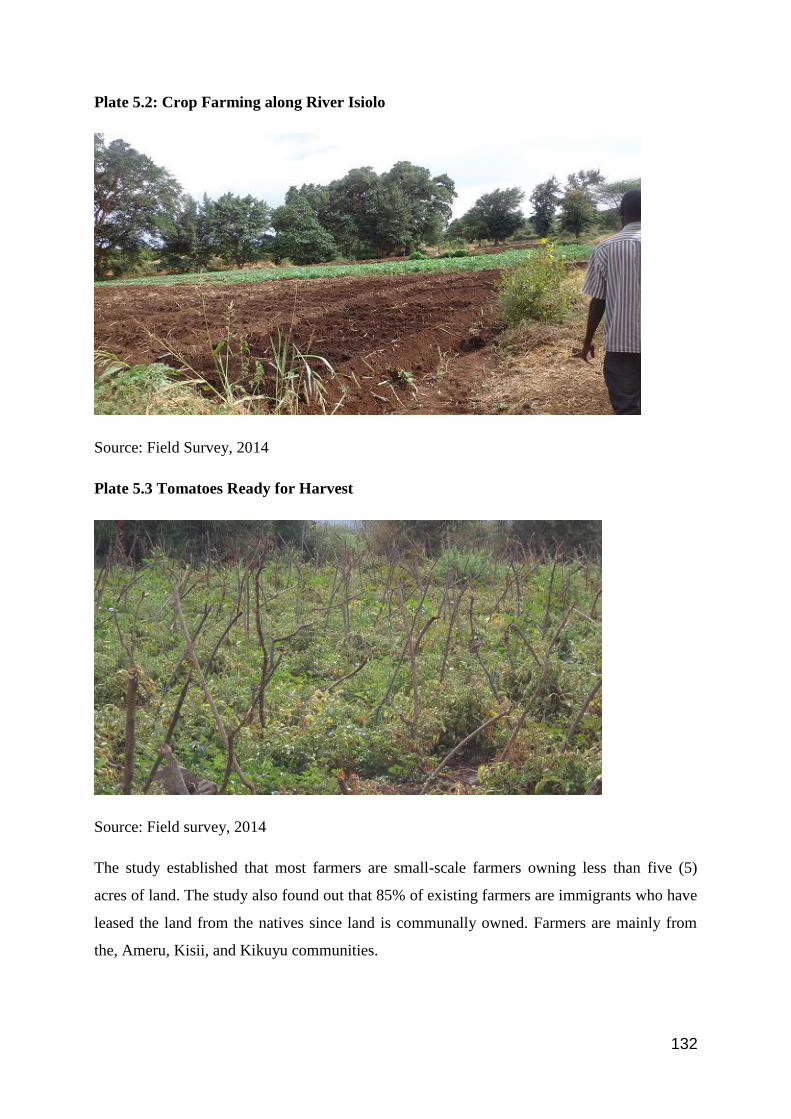
132
Plate 5.2: Crop Farming along River Isiolo
Source: Field Survey, 2014
Plate 5.3 Tomatoes Ready for Harvest
Source: Field survey, 2014
The study established that most farmers are small-scale farmers owning less than five (5)
acres of land. The study also found out that 85% of existing farmers are immigrants who have
leased the land from the natives since land is communally owned. Farmers are mainly from
the, Ameru, Kisii, and Kikuyu communities.

133
The plate below shows one of the green house projects for crops in Isiolo County that forms
the main source of livelihood for the household.
Plate 5.4 Green House Farm in Isiolo
Source: Field survey, 2014
Crop production by use of green house is less preferred by the community due to the huge
amount of capital required as well as the high technology which is currently lacking.
5.2.7 Crop Chain
The crop chain in Isiolo moves from the farmer to small scale buyers such as residents and
middlemen, to the market in Isiolo, Meru and Nanyuki and Nairobi, and also to big market
consumers such as colleges, supermarkets and also for export especially to Ethiopia and
Southern Sudan.
5.2.8 Challenges in Crop Production
Farmers cited diseases as a major challenge (include table of challenges i.e. diseases,
technology, erosion, high cost of land, poor infrastructure, lack of water). The plate below
shows rotten tomatoes as a result of disease and because of perishing. Lack of access to
markets for crops such as tomatoes hinders crop farming in Isiolo at the moment. It is an
indication of a lost opportunity to harness the power of crop farming productivity in Isiolo.
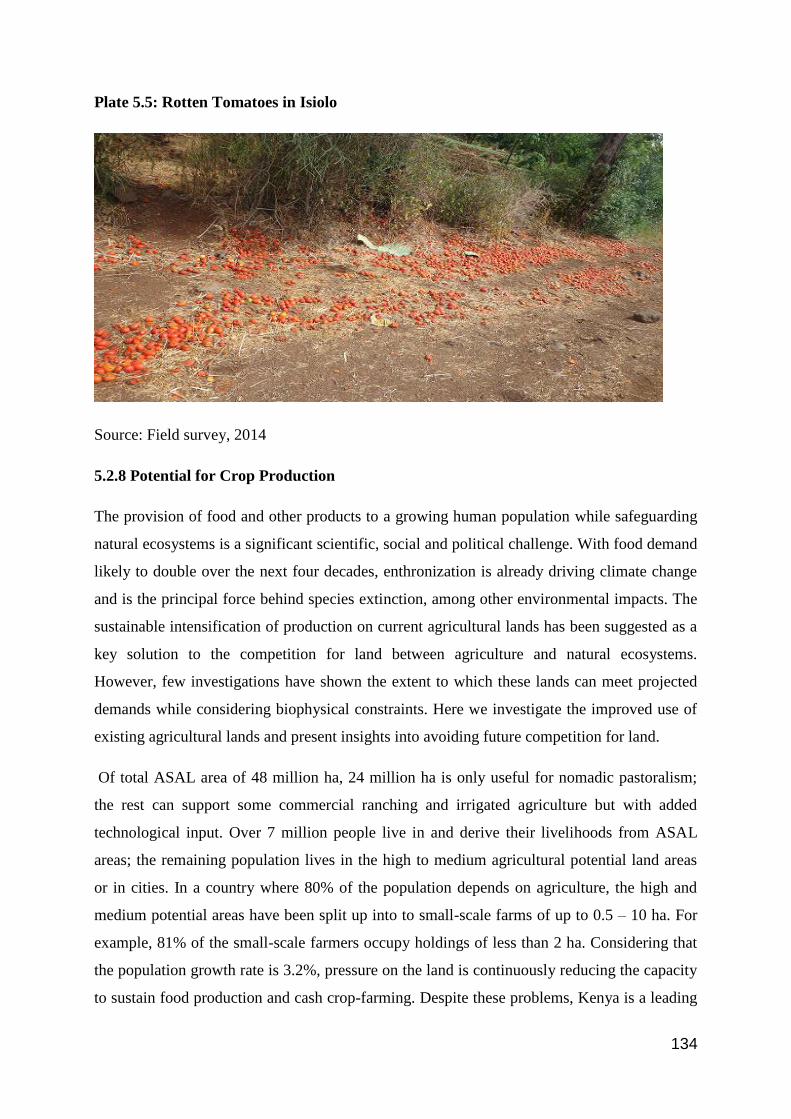
134
Plate 5.5: Rotten Tomatoes in Isiolo
Source: Field survey, 2014
5.2.8 Potential for Crop Production
The provision of food and other products to a growing human population while safeguarding
natural ecosystems is a significant scientific, social and political challenge. With food demand
likely to double over the next four decades, enthronization is already driving climate change
and is the principal force behind species extinction, among other environmental impacts. The
sustainable intensification of production on current agricultural lands has been suggested as a
key solution to the competition for land between agriculture and natural ecosystems.
However, few investigations have shown the extent to which these lands can meet projected
demands while considering biophysical constraints. Here we investigate the improved use of
existing agricultural lands and present insights into avoiding future competition for land.
Of total ASAL area of 48 million ha, 24 million ha is only useful for nomadic pastoralism;
the rest can support some commercial ranching and irrigated agriculture but with added
technological input. Over 7 million people live in and derive their livelihoods from ASAL
areas; the remaining population lives in the high to medium agricultural potential land areas
or in cities. In a country where 80% of the population depends on agriculture, the high and
medium potential areas have been split up into to small-scale farms of up to 0.5 – 10 ha. For
example, 81% of the small-scale farmers occupy holdings of less than 2 ha. Considering that
the population growth rate is 3.2%, pressure on the land is continuously reducing the capacity
to sustain food production and cash crop-farming. Despite these problems, Kenya is a leading

135
producer of tea and coffee, as well as a major exporter of fresh produce, such as flowers,
vegetables and fruits. Small farms mostly grow maize and sometimes also potatoes, bananas,
beans and peas. Table 2 gives the areas, production and yields for the major food crops in
Kenya.
Table 5.1: Average (2010-2011) Production Per Unit
Crop Harvested
Area (ha) Total Production(t) Yield (t ha
-1)
Maize 2159322.0 4089043.2 1.9
Wheat 148,703.0 444373.6 3.0
Barley 21,827.0 72930.6 3.3
Beans 1,055,632.0 613902.0 0.6
Rice 25,197.0 92696.0 3.7
Sorghum 223,799.0 166626.9 0.7
Millet 118,289.0 74915.8 0.6
Cowpeas 214,492.0 113802.8 0.5
Green grams 188,416.0 91824.3 0.5
Pigeon peas 143,212.0 89390.1 0.6
Irish potatoes 135924.4 1846576.0 13.6
Tomatoes 18115.9 395297.8 21.8
Cabbages 19491.0 891771.0 45.8
Source ; Agriculture Economic review 2012
Kenya has a wide range of soil types, which is caused by large variation in geology (parent
material), relief and climate. Soil types vary from sandy to clayey, shallow to very deep, and
from low to high fertility. However, many soil types have serious limitations such as salinity,
sodicity, acidity, fertility and drainage problems. The major soil types used in agriculture are
ferralsols, vertisols, acrisols, lixisols, luvisols and nitisols. Food crops and other annual crops
are grown according to rainfall amounts and temporal distribution, which is bimodal in nature.
The long rains occur from March to and including May, while the short rains occur from
October to and including December. Following these rainfall patterns, annual single-crop
systems and double-crop systems can be found.
5.2.9 Livestock Production
This is the main land use activity practiced by the Samburu; Turkana etc. the animals kept
include cattle, sheep, goats, camel etc. The plate below shows different livestock being reared

136
in Isiolo grazing in one of the ranches. Livestock production has been a traditional and major
venture for the residents of Isiolo.
Plate 5.6: Livestock Rearing in the Study area
Source: Field survey, 2014
The study indicates that about 60% of the respondents practiced livestock production because
they inherited it from their parents. Approximately 60% of those interviewed articulate
drought and diseases as the main challenges facing livestock production in the area followed
by insecurity. The plate below indicates livestock movement in a one of the grazing ranches
in Isiolo town. Inadequate pasture is an evident problem in livestock production in Isiolo.
Plate 5.7: Livestock Moving in Search for Pastures
Source: Field survey, 2014

137
5.2.10 Challenges in Pastoralism
The survey found out that majority of the respondents at 57% considers insecurity/ theft of
livestock as the major challenge facing livestock production. Refer to the figure below:-
Figure 5.2: Challenges Facing Pastoralism
Source: Field survey, 2014
A Focus Group Discussion with villagers revealed that pastoralists train their young ones on
how to protect their livestock. Vigilante was also cited as a measure to ensure security of
livestock. The effects of current livestock production were cited as soil erosion at 50% with
ethnic conflicts having 50%.
5.3 Existing Natural Resource
The area enjoys a variety of natural resources ranging from black cotton soils, forests,
wildlife, sunshine, land, sand, and livestock among others. The plate below shows black
cotton soils that are rich in nutrients and minerals and capable of supporting crop farming.
These soils are common in Isiolo and hence the crop farming potential in the County.
0% 20% 40% 60%
water inadequacy
pasture inadequacy
insecurity/theft of livestock
14%
29%
57%
Challenges facing Pastoralism According to the survey,
pastoralists with the above
challenges by adopting a nomadic
lifestyle in order to search for
water and pasture while others
have sunk boreholes. A report by
ENDDA, 2010 indicates that the
whole district has about 90
boreholes.
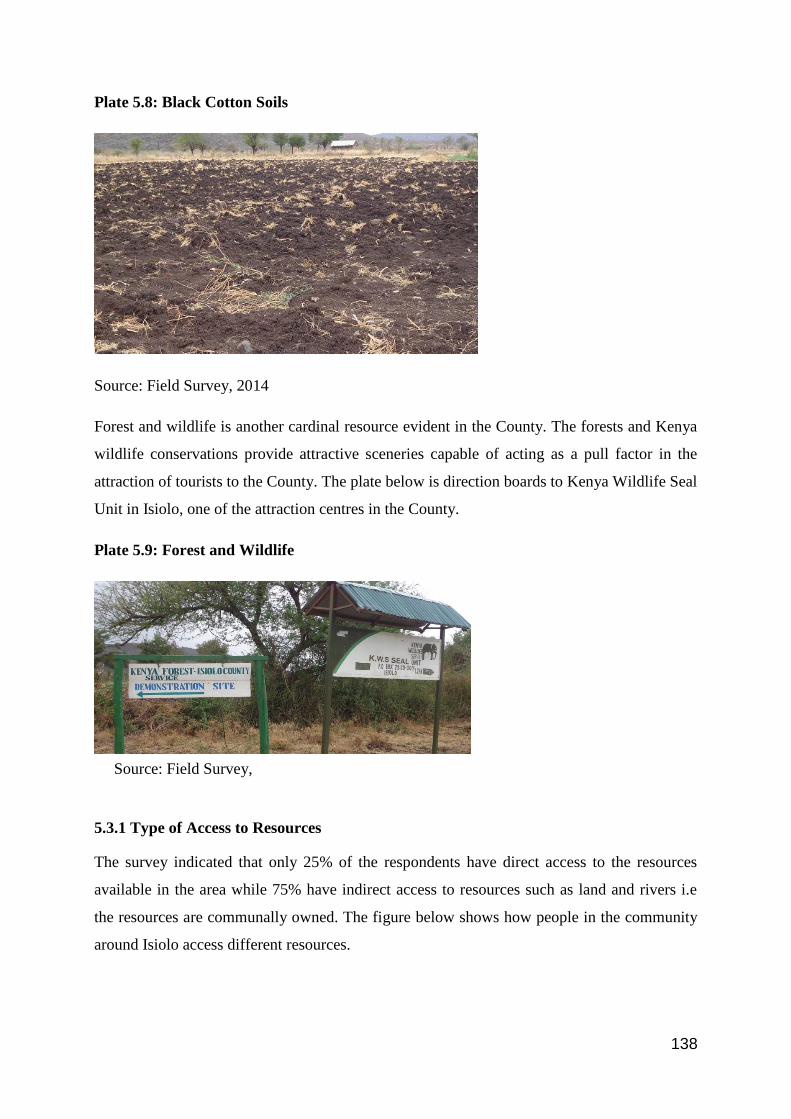
138
Plate 5.8: Black Cotton Soils
Source: Field Survey, 2014
Forest and wildlife is another cardinal resource evident in the County. The forests and Kenya
wildlife conservations provide attractive sceneries capable of acting as a pull factor in the
attraction of tourists to the County. The plate below is direction boards to Kenya Wildlife Seal
Unit in Isiolo, one of the attraction centres in the County.
Plate 5.9: Forest and Wildlife
5.3.1 Type of Access to Resources
The survey indicated that only 25% of the respondents have direct access to the resources
available in the area while 75% have indirect access to resources such as land and rivers i.e
the resources are communally owned. The figure below shows how people in the community
around Isiolo access different resources.
Source: Field Survey,
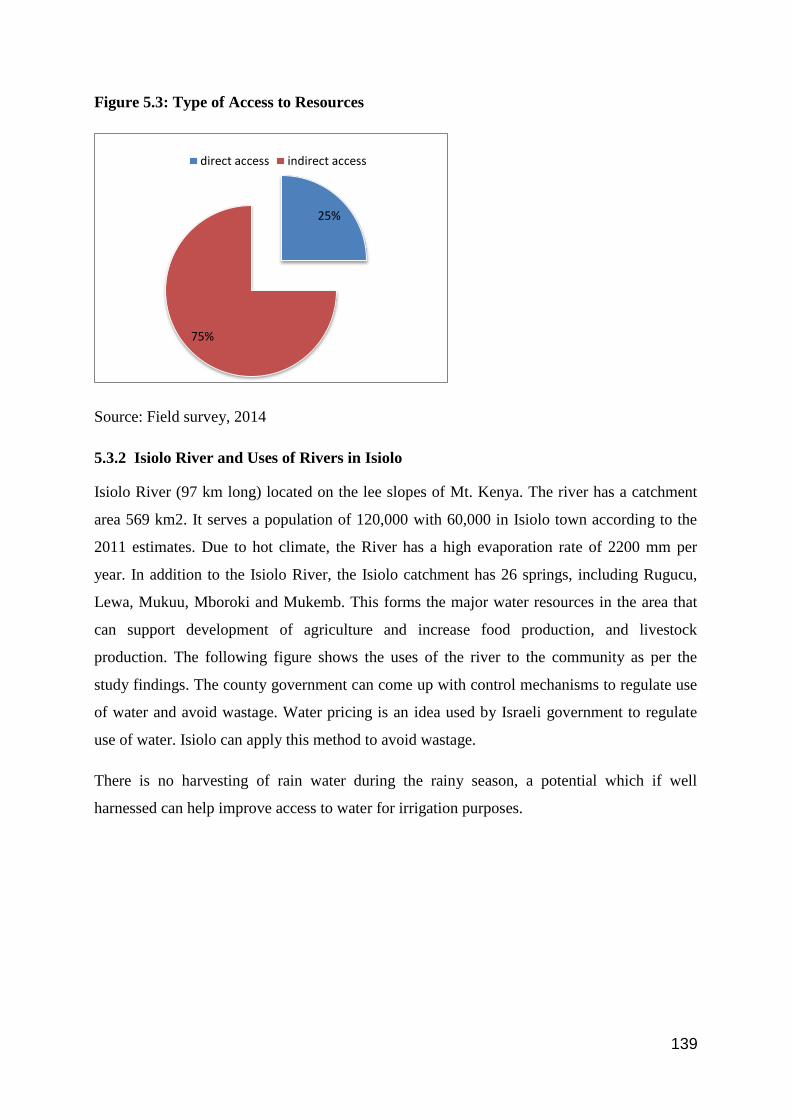
139
Figure 5.3: Type of Access to Resources
Source: Field survey, 2014
5.3.2 Isiolo River and Uses of Rivers in Isiolo
Isiolo River (97 km long) located on the lee slopes of Mt. Kenya. The river has a catchment
area 569 km2. It serves a population of 120,000 with 60,000 in Isiolo town according to the
2011 estimates. Due to hot climate, the River has a high evaporation rate of 2200 mm per
year. In addition to the Isiolo River, the Isiolo catchment has 26 springs, including Rugucu,
Lewa, Mukuu, Mboroki and Mukemb. This forms the major water resources in the area that
can support development of agriculture and increase food production, and livestock
production. The following figure shows the uses of the river to the community as per the
study findings. The county government can come up with control mechanisms to regulate use
of water and avoid wastage. Water pricing is an idea used by Israeli government to regulate
use of water. Isiolo can apply this method to avoid wastage.
There is no harvesting of rain water during the rainy season, a potential which if well
harnessed can help improve access to water for irrigation purposes.
25%
75%
direct access indirect access

140
Figure 5.4: Uses of the Rivers
Source: Field Survey, 2014
5.4 Land Use Practices at Household Level
According to the study findings, about 74% of the respondents engage in small scale crop
farming. The study has a target of crop farmers to assess the viability and potential of the
venture. There are positive synergies to indicate that enormous potential exists for crop
farming in Isiolo.
Figure 5.5: Land Use Practices in Isiolo town
Most respondents (74%) are involved in crop farming, 11% in pastoralism, 5% in mixed
farming, 5% in business and 5% in transport (boda boda).
Source: Field survey, 2014
0%
10%
20%
30%
40%
74%
11%
5% 5%
5%
Farming
Pastoralism
Mixed Farming
Commerciallanduse (Business)
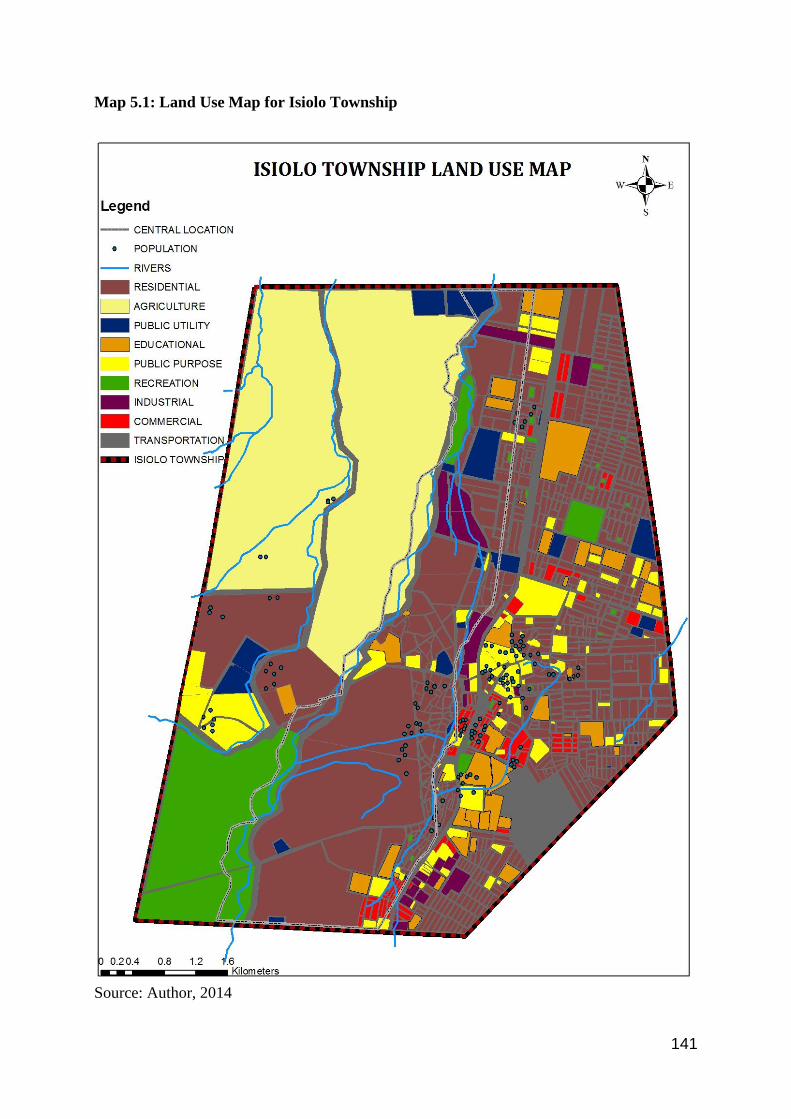
141
Map 5.1: Land Use Map for Isiolo Township
Source: Author, 2014

142
5.4.1 Average Farming Acreage
Table 5.2 below shows the amount of land put in crop farming. Majority of the respondents
had put between 5-10 acres under crop farming.
Table 5.2: Average farming acreage
Acreage Population (%)
Less than 5 acres 27%
Between 5 and 10 acres 64%
More than 10 acres 9%
Source: Field survey, 2014
5.4.2 Type of Crops Grown
The crops grown include tomatoes, sukuma wiki, spinach, ndania, onions and pili pili hoho.
The figure 5.6 below shows the percentages of the various crops grown in Isiolo County.
Figure 5.6: Crops Grown in Isiolo County
Source: Field survey, 2014
5.4.3 Average Harvest for Tomatoes
The field survey established that majority of the respondents‘ at about 47% harvest between
5001 to 10,000kilogrames of tomatoes per season in a land of about ½ hectare. However, the
harvest is a proportion of the potential of the area. From a case study of Israel, ASALs are an
enormous opportunity and they can form a cardinal basis for food security through increased
48%
7% 4%
7%
4%
30%
Tomatoes
Spinach
Onions
Pilipili hoho
Ndania
Sukuma Wiki

143
productions. Figure below shows the different percentages of respondents and their average
harvest in a season for tomatoes from a land of between ¼ to ½ a ha. Refer to the figure
below:-
Figure 5.7: Tomatoes Harvest per Season
Source: Field survey, 2014
The figure below shows the different percentages of respondents and their average harvest in
a season for Sukuma Wiki from a land of between ¼ to ½ a ha. The figure indicates that most
of the respondents for this study indicated that they harvest between 1000 and 5000 kgs of
sukuma wiki per season.
Figure 5.8: Average Harvest for Sukuma Wiki
Source: Field Survey, 2014
The figure below shows the different percentages of respondents and their average harvest in
a season for onions from a land of between ¼ to ½ a ha. The figure indicates that 83% of the
0%
10%
20%
30%
40%
50%
<1000Kg 1001-5000Kg 5001-10000Kg >10000Kg
0%
20%
40%
60%
80%
100%
<1000Kg 1001-5000Kg

144
respondents for this study indicated that they harvest less than 1000 kgs of onions wiki per
season while there are 17% who harvest between 1000-5000kg of onions per season.
Figure 5.9: Average Harvest for Onions
Source: Field Survey, 2014
5.4.4 Market for Crops
The field survey revealed that about 70% of the respondents sale their crops to Isiolo market,
13% transport their products to Meru, 7% sale their products at Samburu while the remaining
10% sell to brokers who later move them to Nairobi and other related towns.
5.4.5 Distance from Isiolo River
According to the survey, 55% of the respondents were within a radius of one kilometre from
Isiolo River, 35% were within 5km from the river while 10% were staying at a distance more
than five kilometres from the river. Some of the uses of the river include irrigation for crops
(37%), pastoral uses (34%) and domestic use at 29%). This shows that the river has a big
catchment area and it can serve most of the residents of Isiolo County. This is a massive
potential in terms of sustaining irrigation-fed agriculture along the river valleys. The dispersed
settlements also make it difficult to access water resources.
The figure below shows the distance that residents cover to access water. It indicates that at
least 60% cover more than 1km to access the source of water. This is indicative of a high level
of inaccessibility to water resources. The ideal access distance should be at least less than
1km for majority of the population.
83%
17%
Average Onion Harvest
<1000Kg 1001-5000Kg
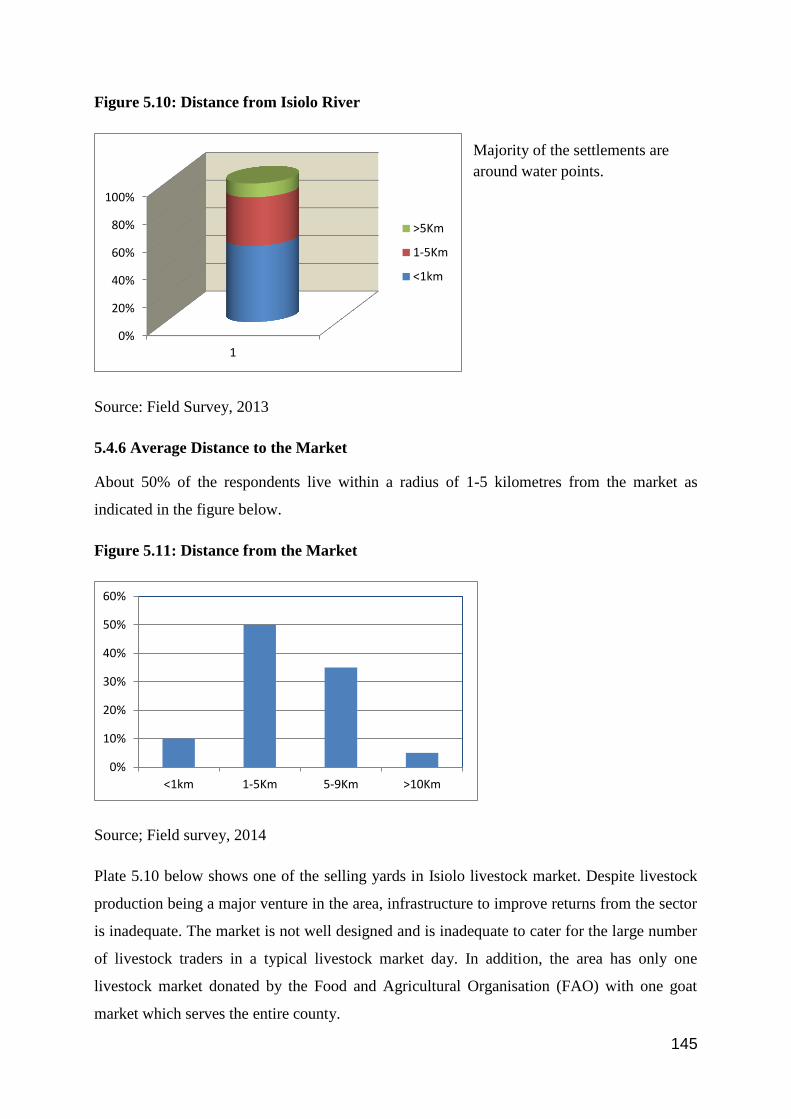
145
Figure 5.10: Distance from Isiolo River
Source: Field Survey, 2013
5.4.6 Average Distance to the Market
About 50% of the respondents live within a radius of 1-5 kilometres from the market as
indicated in the figure below.
Figure 5.11: Distance from the Market
Source; Field survey, 2014
Plate 5.10 below shows one of the selling yards in Isiolo livestock market. Despite livestock
production being a major venture in the area, infrastructure to improve returns from the sector
is inadequate. The market is not well designed and is inadequate to cater for the large number
of livestock traders in a typical livestock market day. In addition, the area has only one
livestock market donated by the Food and Agricultural Organisation (FAO) with one goat
market which serves the entire county.
0%
20%
40%
60%
80%
100%
1
>5Km
1-5Km
<1km
0%
10%
20%
30%
40%
50%
60%
<1km 1-5Km 5-9Km >10Km
Majority of the settlements are
around water points.
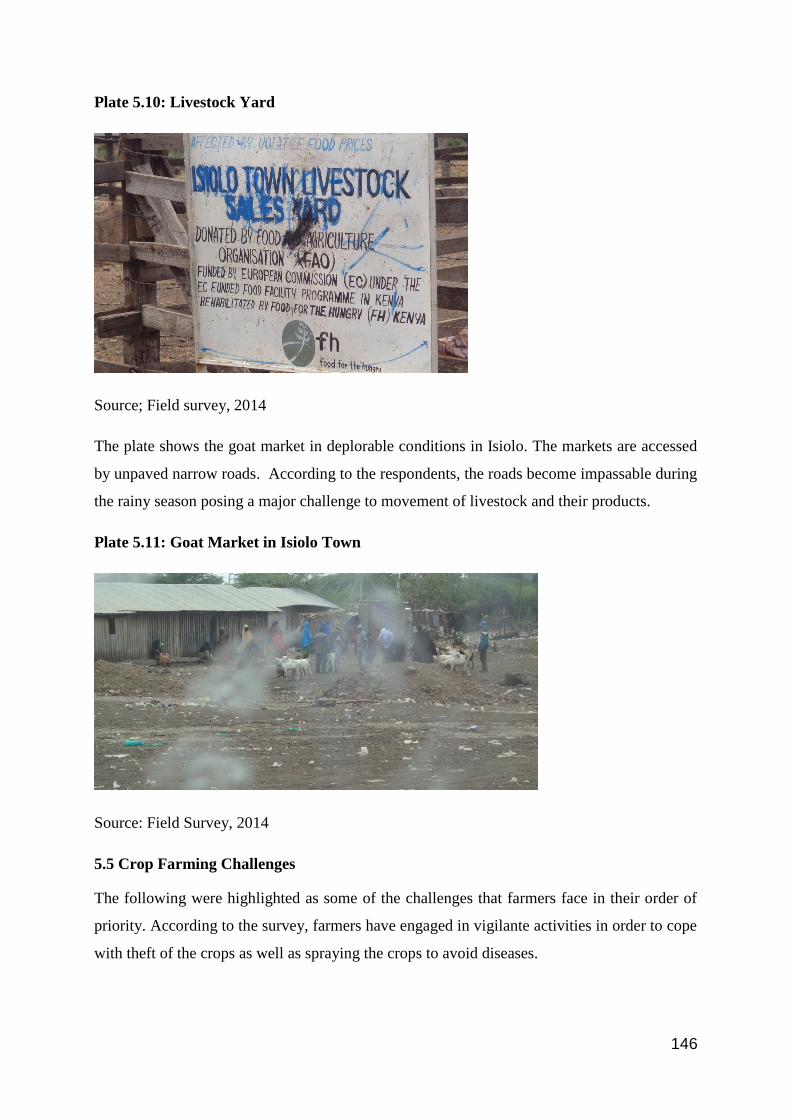
146
Plate 5.10: Livestock Yard
Source; Field survey, 2014
The plate shows the goat market in deplorable conditions in Isiolo. The markets are accessed
by unpaved narrow roads. According to the respondents, the roads become impassable during
the rainy season posing a major challenge to movement of livestock and their products.
Plate 5.11: Goat Market in Isiolo Town
Source: Field Survey, 2014
5.5 Crop Farming Challenges
The following were highlighted as some of the challenges that farmers face in their order of
priority. According to the survey, farmers have engaged in vigilante activities in order to cope
with theft of the crops as well as spraying the crops to avoid diseases.
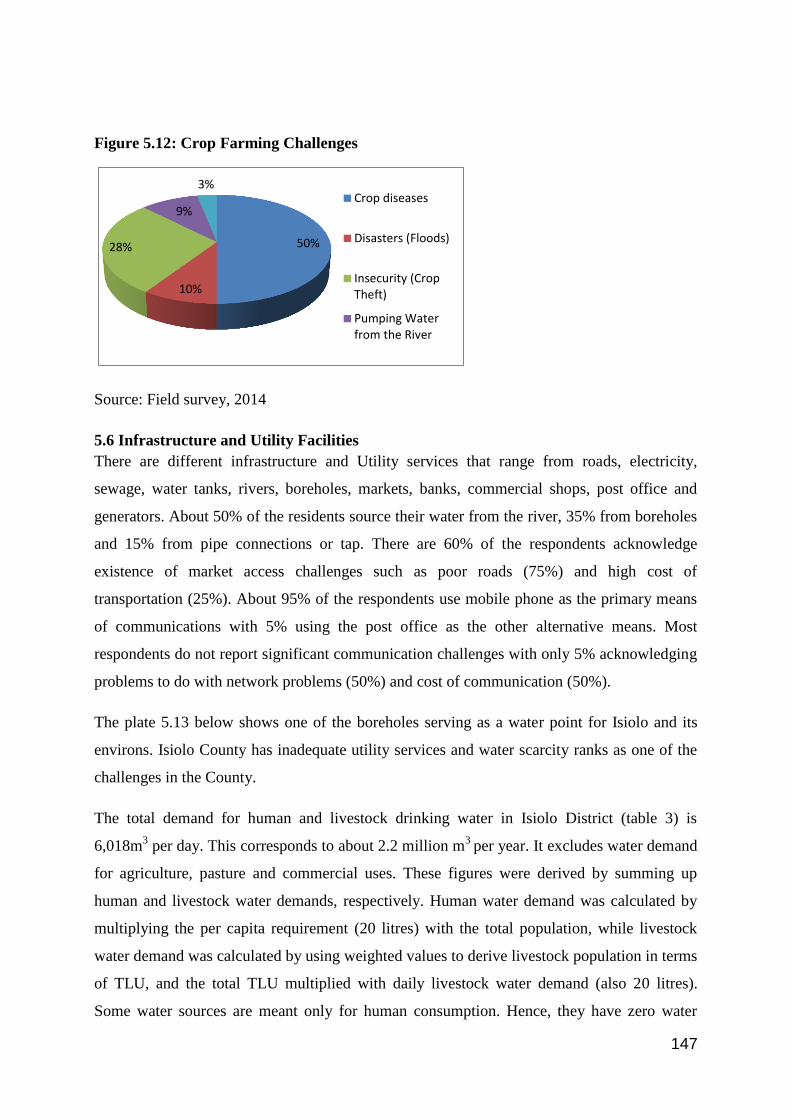
147
Figure 5.12: Crop Farming Challenges
Source: Field survey, 2014
5.6 Infrastructure and Utility Facilities
There are different infrastructure and Utility services that range from roads, electricity,
sewage, water tanks, rivers, boreholes, markets, banks, commercial shops, post office and
generators. About 50% of the residents source their water from the river, 35% from boreholes
and 15% from pipe connections or tap. There are 60% of the respondents acknowledge
existence of market access challenges such as poor roads (75%) and high cost of
transportation (25%). About 95% of the respondents use mobile phone as the primary means
of communications with 5% using the post office as the other alternative means. Most
respondents do not report significant communication challenges with only 5% acknowledging
problems to do with network problems (50%) and cost of communication (50%).
The plate 5.13 below shows one of the boreholes serving as a water point for Isiolo and its
environs. Isiolo County has inadequate utility services and water scarcity ranks as one of the
challenges in the County.
The total demand for human and livestock drinking water in Isiolo District (table 3) is
6,018m3 per day. This corresponds to about 2.2 million m
3 per year. It excludes water demand
for agriculture, pasture and commercial uses. These figures were derived by summing up
human and livestock water demands, respectively. Human water demand was calculated by
multiplying the per capita requirement (20 litres) with the total population, while livestock
water demand was calculated by using weighted values to derive livestock population in terms
of TLU, and the total TLU multiplied with daily livestock water demand (also 20 litres).
Some water sources are meant only for human consumption. Hence, they have zero water
50%
10%
28%
9%
3% Crop diseases
Disasters (Floods)
Insecurity (CropTheft)
Pumping Waterfrom the River
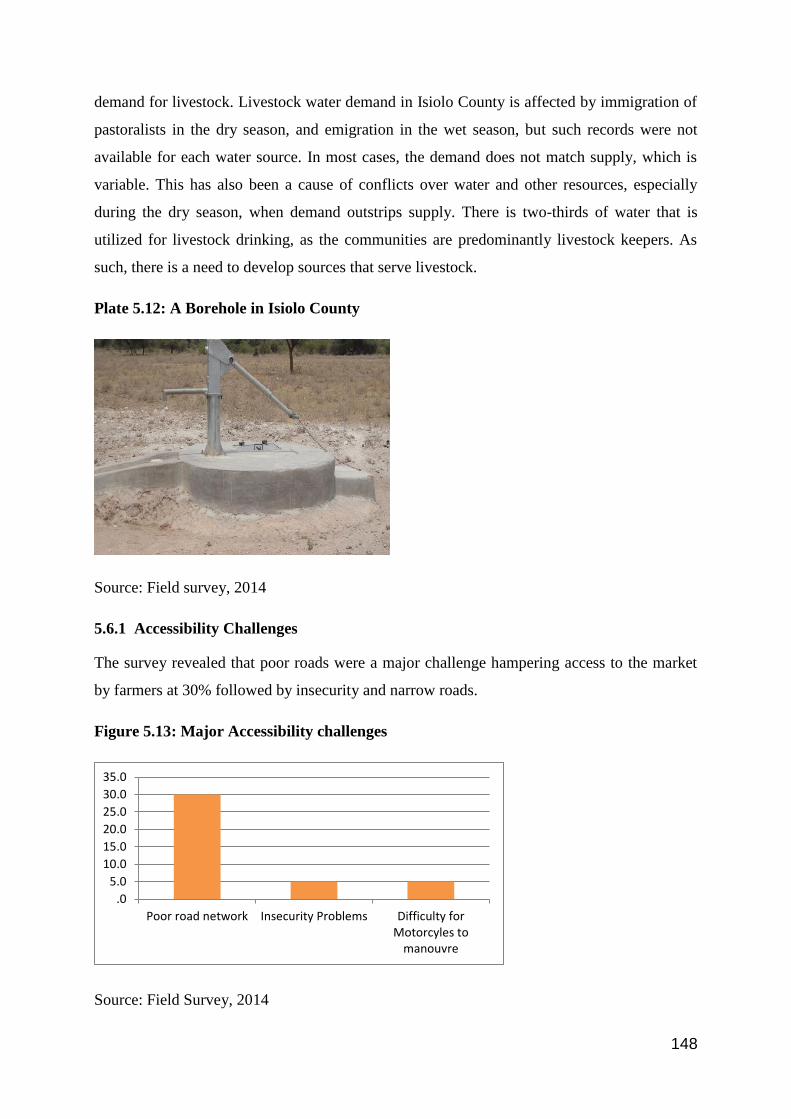
148
demand for livestock. Livestock water demand in Isiolo County is affected by immigration of
pastoralists in the dry season, and emigration in the wet season, but such records were not
available for each water source. In most cases, the demand does not match supply, which is
variable. This has also been a cause of conflicts over water and other resources, especially
during the dry season, when demand outstrips supply. There is two-thirds of water that is
utilized for livestock drinking, as the communities are predominantly livestock keepers. As
such, there is a need to develop sources that serve livestock.
Plate 5.12: A Borehole in Isiolo County
Source: Field survey, 2014
5.6.1 Accessibility Challenges
The survey revealed that poor roads were a major challenge hampering access to the market
by farmers at 30% followed by insecurity and narrow roads.
Figure 5.13: Major Accessibility challenges
Source: Field Survey, 2014
.0
5.0
10.0
15.0
20.0
25.0
30.0
35.0
Poor road network Insecurity Problems Difficulty forMotorcyles to
manouvre
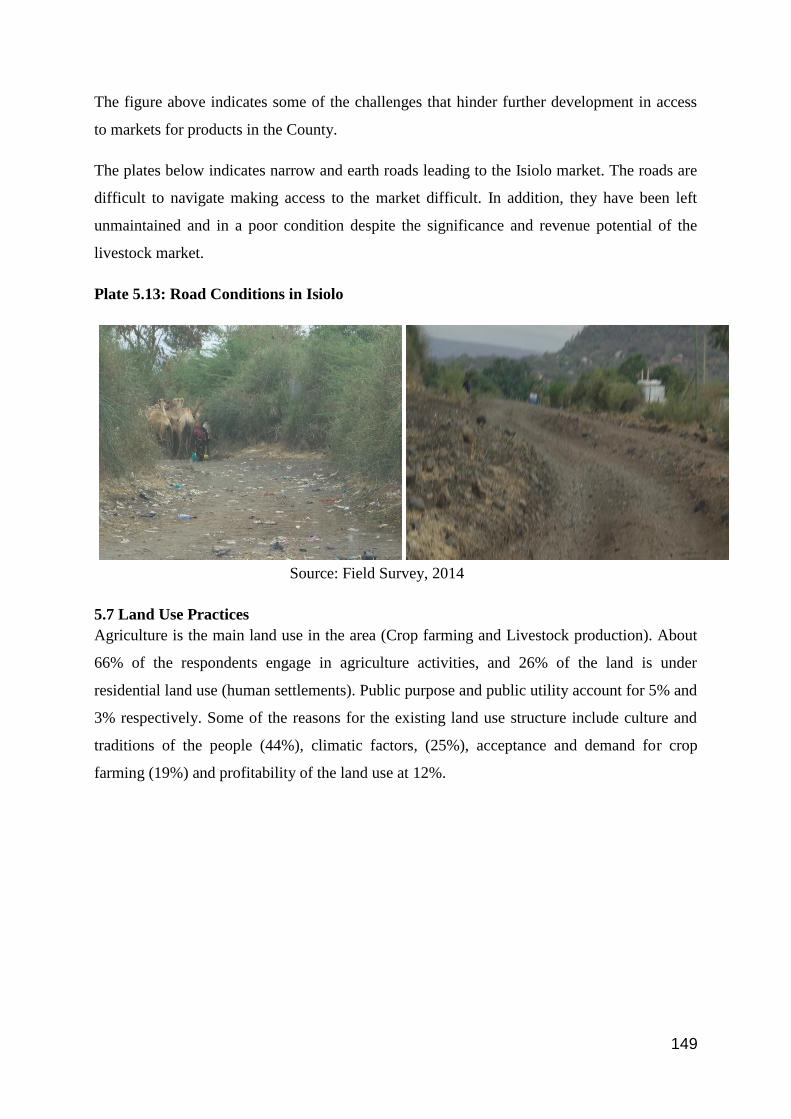
149
The figure above indicates some of the challenges that hinder further development in access
to markets for products in the County.
The plates below indicates narrow and earth roads leading to the Isiolo market. The roads are
difficult to navigate making access to the market difficult. In addition, they have been left
unmaintained and in a poor condition despite the significance and revenue potential of the
livestock market.
Plate 5.13: Road Conditions in Isiolo
Source: Field Survey, 2014
5.7 Land Use Practices
Agriculture is the main land use in the area (Crop farming and Livestock production). About
66% of the respondents engage in agriculture activities, and 26% of the land is under
residential land use (human settlements). Public purpose and public utility account for 5% and
3% respectively. Some of the reasons for the existing land use structure include culture and
traditions of the people (44%), climatic factors, (25%), acceptance and demand for crop
farming (19%) and profitability of the land use at 12%.
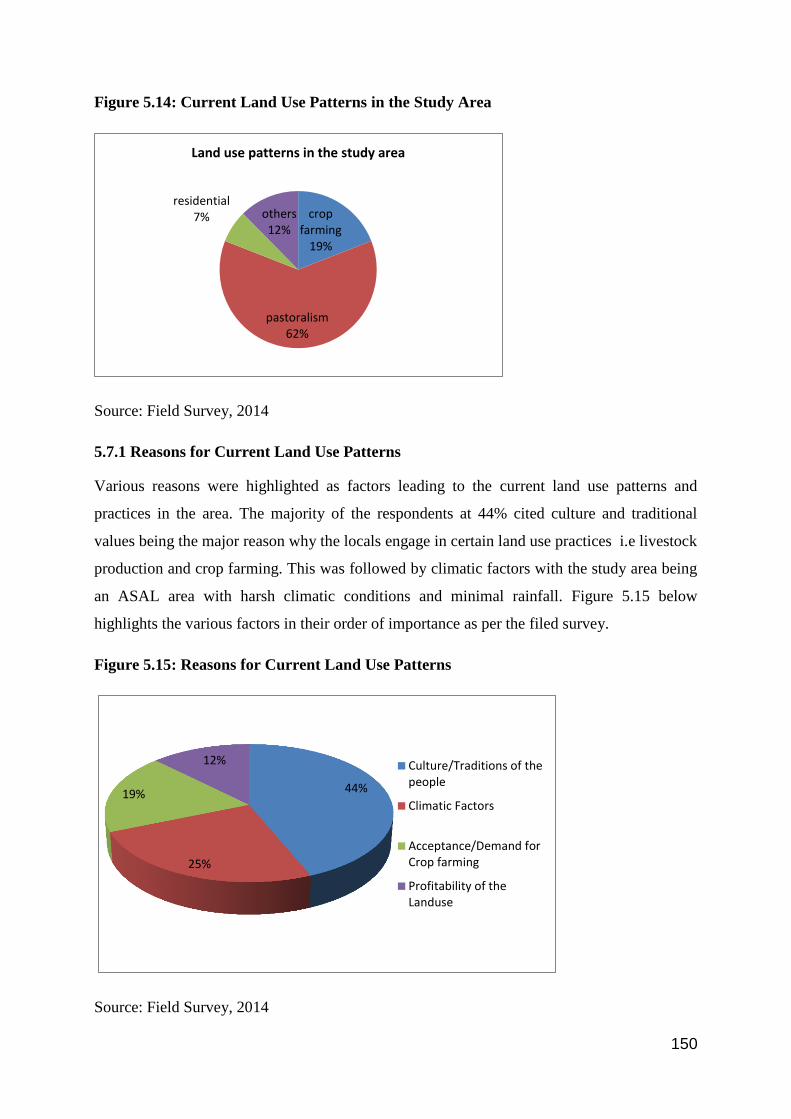
150
Figure 5.14: Current Land Use Patterns in the Study Area
Source: Field Survey, 2014
5.7.1 Reasons for Current Land Use Patterns
Various reasons were highlighted as factors leading to the current land use patterns and
practices in the area. The majority of the respondents at 44% cited culture and traditional
values being the major reason why the locals engage in certain land use practices i.e livestock
production and crop farming. This was followed by climatic factors with the study area being
an ASAL area with harsh climatic conditions and minimal rainfall. Figure 5.15 below
highlights the various factors in their order of importance as per the filed survey.
Figure 5.15: Reasons for Current Land Use Patterns
Source: Field Survey, 2014
crop farming
19%
pastoralism 62%
residential 7% others
12%
Land use patterns in the study area
44%
25%
19%
12% Culture/Traditions of thepeople
Climatic Factors
Acceptance/Demand forCrop farming
Profitability of theLanduse

151
There is potential to diversify the use of land and land use patterns to incorporate emerging
trends in modern practices such as irrigated farming in ASALs. The demand and acceptance
of crop farming is now a contemporary venture that should rank as priority for Isiolo County.
5.7.2 Impacts of Existing Land Uses
According to the respondents, there were both positive and negative impacts that the existing
land use pattern and practices has caused. These are represented in the figure below. Crop
farming along Isiolo River was cited to have improved food security in the area since most of
the products are consumed locally. However, over-reliance on livestock production has
hindered optimal land utilization as lots of land is preserved for pasture despite the low milk
production from livestock. Livestock production has also led to anxiety between immigrants
and the natives due to competition for pasture and water by pastoralists.
Observable impacts included:- lack of basic infrastructure i.e. electricity, health facilities,
schools in the rural settlements. This is coupled with poor road network.
The figure below shows the impacts of current land use pattern and practices in their order of
importance.
Figure 5.16: Impacts of Land Use Practices
Source: Field survey, 2014
13%
47% 7%
33% Underutilization of land
Improved Food Security
Provision of a source oflivelihood/Employment
Livestock conflicts (ForPasture and Water)

152
5.8 Institutional Framework
The development and management of Isiolo County is large and complex with a multitude of
public Corporation, non-government and private actors. The stakeholders in the development
of the County include the Government of Kenya, the County Government of Isiolo, the sector
ministries and all tiers and departments, private sector agribusiness actors, civil society
organizations particularly farmer organizations, and bilateral and multilateral Development
Partners.
5.8.1 The Central and County Government
The central and County Government oversees the development of Isiolo County through
different ministries and departments such as Ministry of Agriculture, Department of Livestock
Development, Fisheries Development, Cooperative Development and Marketing, Ministry of
Lands, Ministry of Water and Irrigation, Regional Development Authorities such as the
Ewaso Nyiro North Development Authority, Ministry of Environment and Mineral
Resources, Ministry of Forestry and Wildlife and other sectors under the development of
Northern Kenya and Other Arid Lands. The Ministry of State for Planning, Devolution,
National Development and Vision 2030 is also an important ministry because the
development and the agricultural sector are important sectors in achieving the goals of the
economic pillar of Vision 2030. The County Government of Isiolo will be expected to play a
greater role in influencing agricultural development in the County than hitherto. Many
decisions affecting crop, animal and fisheries production and processing such as taxation,
extension services and marketing infrastructure will be made at the counties.
5.8.2 Water Management Committees
Management of the water facilities in Isiolo is crucial due to the communal nature of their
utilization. Only 42 (34%) of the water sources have an organized system of management,
mostly comprising a water committee, but a few facilities are managed by religious
organizations, NGOs, individuals and companies (usually hotels in game reserves). In the case
of boreholes, only 17 (23%) are managed by the community, 6 by NGOs and the rest, 46
(65%), do not have an effective management system. It was noted that operational reliability
of water sources was associated with the availability of good community management
structures. At a time when focus is shifting from government-managed water systems to
community-based ones, community involvement in water management in Isiolo County is
still lagging behind. Of the available water committees, their main functions include ensuring

153
order in the sharing of water from boreholes, collection of revenue for purchase of fuel, pump
maintenance and generally acting as caretakers of the water facility.
It is important to build institutions such as water committees. Traditional water management
institutions are common in Africa, and exist in Isiolo County. For example, the Boran of
Isiolo have a traditional method of closing certain strategic water facilities such as boreholes
which are only opened during severe drought conditions. Under this system, Isiolo County is
served by 4 ―Range boreholes,‖ namely Yamicha, Duma 1, Boji and Urura. These boreholes
are kept locked under normal climatic conditions, and only opened for livestock watering
during drought periods. Unfortunately, donor and NGO interventions have tended to
undermine, not build on and support these local traditions. For example, in Isiolo, most of the
water sources have been provided by funded projects through the government and NGOs,
where community participation was limited to the provision of manual labor and some locally
available materials, and sometimes no involvement at all. The costs of spare parts are high,
while fuel and all equipment must come from Nairobi over 400 km away, making it very
difficult to maintain them. Alternatives to water from boreholes such as water harvesting are
necessary. Water supply and management in Isiolo District is influenced not only by bio-
physical conditions but also by national policies and socioeconomic structures. In Kenya,
water supply schemes in rural areas have in the past been subsidized by the government.
Recently Kenya has developed water policies to devolve water supply and management from
the government to private sector and communities. The new policy is a shift from providing
water as a basic human need either free or at a very low cost to the poorest communities,
towards greater cost recovery for the supply of water in general. The impacts of these policies
will require re-assessment in the Isiolo County, especially as the policies were developed with
sedentary human settlements in mind, whereas most people in Isiolo are pastoralists.
5.8.3 Private Sector
The role of the private sector in the development of the agricultural sector and development in
Isiolo County is strongly emphasized in all policy and strategy documents, and the County
Government and the Central Government explicitly encourages public–private partnerships
(PPP). Agribusiness on the input supply side (seed, fertilizer, chemicals, feed, medicines, etc.)
and on the processing and trade sides is represented by many Kenyan and large international
companies. Large Kenyan private company and association actors include Home-grown,
Brookside, Kenya Breweries, Oserian, the Unga Group, Kenya Fresh Producers‘ Export
Association, and Kenya Flower Council. Many large international companies are well
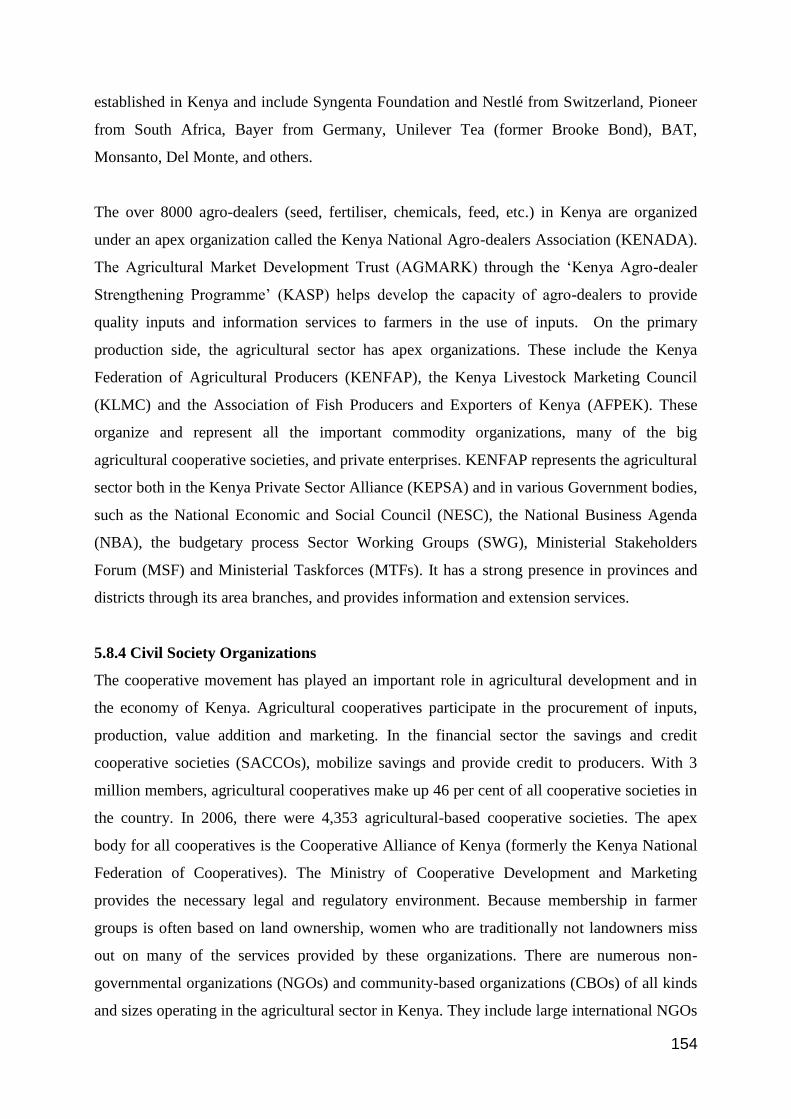
154
established in Kenya and include Syngenta Foundation and Nestlé from Switzerland, Pioneer
from South Africa, Bayer from Germany, Unilever Tea (former Brooke Bond), BAT,
Monsanto, Del Monte, and others.
The over 8000 agro-dealers (seed, fertiliser, chemicals, feed, etc.) in Kenya are organized
under an apex organization called the Kenya National Agro-dealers Association (KENADA).
The Agricultural Market Development Trust (AGMARK) through the ‗Kenya Agro-dealer
Strengthening Programme‘ (KASP) helps develop the capacity of agro-dealers to provide
quality inputs and information services to farmers in the use of inputs. On the primary
production side, the agricultural sector has apex organizations. These include the Kenya
Federation of Agricultural Producers (KENFAP), the Kenya Livestock Marketing Council
(KLMC) and the Association of Fish Producers and Exporters of Kenya (AFPEK). These
organize and represent all the important commodity organizations, many of the big
agricultural cooperative societies, and private enterprises. KENFAP represents the agricultural
sector both in the Kenya Private Sector Alliance (KEPSA) and in various Government bodies,
such as the National Economic and Social Council (NESC), the National Business Agenda
(NBA), the budgetary process Sector Working Groups (SWG), Ministerial Stakeholders
Forum (MSF) and Ministerial Taskforces (MTFs). It has a strong presence in provinces and
districts through its area branches, and provides information and extension services.
5.8.4 Civil Society Organizations
The cooperative movement has played an important role in agricultural development and in
the economy of Kenya. Agricultural cooperatives participate in the procurement of inputs,
production, value addition and marketing. In the financial sector the savings and credit
cooperative societies (SACCOs), mobilize savings and provide credit to producers. With 3
million members, agricultural cooperatives make up 46 per cent of all cooperative societies in
the country. In 2006, there were 4,353 agricultural-based cooperative societies. The apex
body for all cooperatives is the Cooperative Alliance of Kenya (formerly the Kenya National
Federation of Cooperatives). The Ministry of Cooperative Development and Marketing
provides the necessary legal and regulatory environment. Because membership in farmer
groups is often based on land ownership, women who are traditionally not landowners miss
out on many of the services provided by these organizations. There are numerous non-
governmental organizations (NGOs) and community-based organizations (CBOs) of all kinds
and sizes operating in the agricultural sector in Kenya. They include large international NGOs

155
to small village-based projects. An example is GROOTS Kenya. This is a network of women
self-help groups and community organizations. The network uses innovative methodologies to
strengthen the role of grass root women in community development by serving as a platform
for grass root women‘s groups and individuals to come together, to share their ideas /
experiences, to network and to find avenues to directly participate in decision making,
planning, and implementing issues that affect them. Agri-ProFocus Kenya is a growing
network that utilizes an interactive web platform to link Kenyan farmer organizations, NGOs,
financial institutes, research institutes, private and public sector actors and also Dutch and
other international development agencies. It aims to stimulate the enhancement of farmer
entrepreneurship in Kenya and is currently collaborating around agribusiness facilitation,
financial services, policy engagement, ICT-related business development services, and gender
in value chains.
5.8.5 Research Institutions
International Agricultural Research Centres (IARCs) provide significant research-based
inputs to the development of the agricultural sector. Three have their global HQs in Kenya—
the World Agro forestry Centre (ICRAF), the International Livestock Research Institute
(ILRI), and the International Centre for Insect Physiology and Ecology (ICIPE). Several
others have major national and/or regional programmes based in the country, including
CIMMYT (maize and wheat improvement), ICRISAT (dry area crops), TSBF / CIAT (soil
biology and fertility improvement), IPGRI (plant genetic resources), and CIP (potatoes and
other tuber/root crops). Although there is a danger of overlap among them, the IARCs work to
ensure a common, regional plan and strategy for the centres‘ work in East and Southern
Africa. Other important players include universities with programmes in agriculture, e.g.
University of Nairobi, Jomo Kenyatta University of Agriculture and Technology (JKUAT)
and Egerton University; as well as research institutions like the Kenya Agricultural Research
Institute (KARI), the Kenya Marine and Fisheries Research Institute (KEMFRI), and the
Kenya Forestry Research Institute (KEFRI); the Coffee, Tea and Sugar Research Foundations.
Finally, there are several specialized policy research institutions that are linked to
Government institutions to help analyse trends in the agricultural sector. They include the
Tegemeo Institute (Egerton University) and the Kenya Institute for Public Policy Research
and Analysis (KIPPRA, linked to the Ministry of Planning and Devolution) and the privately
managed Institute of Public Policy and Research.
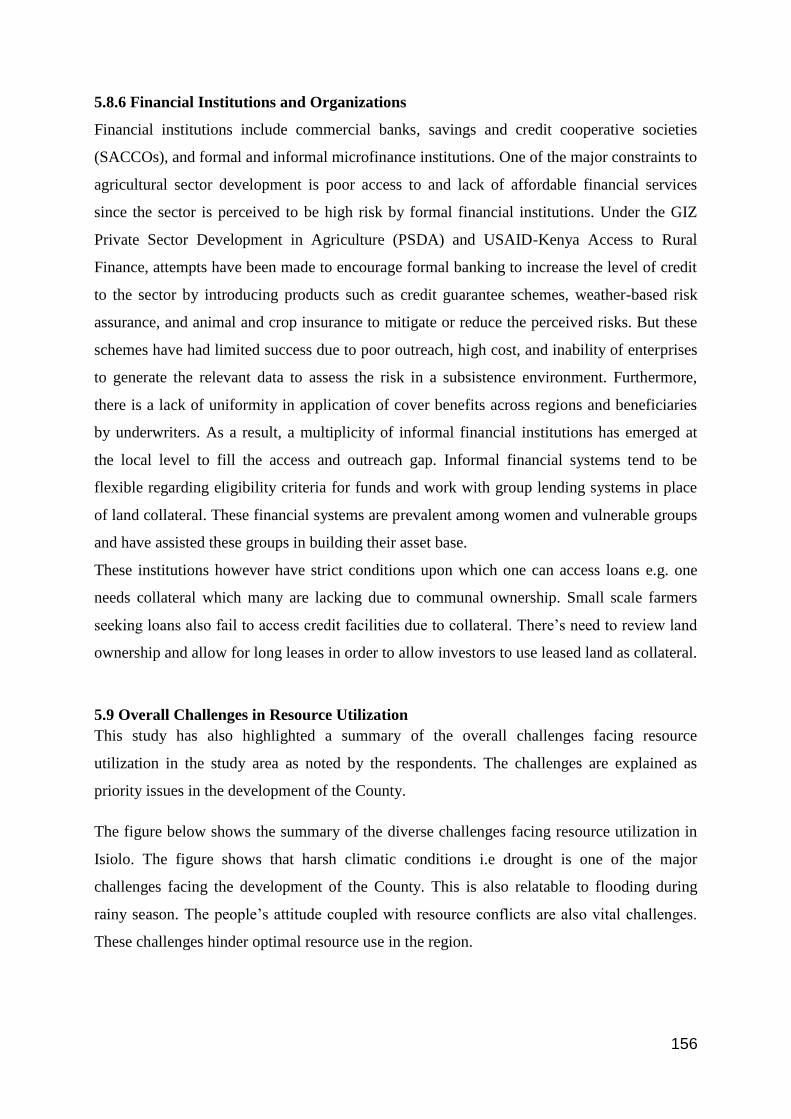
156
5.8.6 Financial Institutions and Organizations
Financial institutions include commercial banks, savings and credit cooperative societies
(SACCOs), and formal and informal microfinance institutions. One of the major constraints to
agricultural sector development is poor access to and lack of affordable financial services
since the sector is perceived to be high risk by formal financial institutions. Under the GIZ
Private Sector Development in Agriculture (PSDA) and USAID-Kenya Access to Rural
Finance, attempts have been made to encourage formal banking to increase the level of credit
to the sector by introducing products such as credit guarantee schemes, weather-based risk
assurance, and animal and crop insurance to mitigate or reduce the perceived risks. But these
schemes have had limited success due to poor outreach, high cost, and inability of enterprises
to generate the relevant data to assess the risk in a subsistence environment. Furthermore,
there is a lack of uniformity in application of cover benefits across regions and beneficiaries
by underwriters. As a result, a multiplicity of informal financial institutions has emerged at
the local level to fill the access and outreach gap. Informal financial systems tend to be
flexible regarding eligibility criteria for funds and work with group lending systems in place
of land collateral. These financial systems are prevalent among women and vulnerable groups
and have assisted these groups in building their asset base.
These institutions however have strict conditions upon which one can access loans e.g. one
needs collateral which many are lacking due to communal ownership. Small scale farmers
seeking loans also fail to access credit facilities due to collateral. There‘s need to review land
ownership and allow for long leases in order to allow investors to use leased land as collateral.
5.9 Overall Challenges in Resource Utilization
This study has also highlighted a summary of the overall challenges facing resource
utilization in the study area as noted by the respondents. The challenges are explained as
priority issues in the development of the County.
The figure below shows the summary of the diverse challenges facing resource utilization in
Isiolo. The figure shows that harsh climatic conditions i.e drought is one of the major
challenges facing the development of the County. This is also relatable to flooding during
rainy season. The people‘s attitude coupled with resource conflicts are also vital challenges.
These challenges hinder optimal resource use in the region.
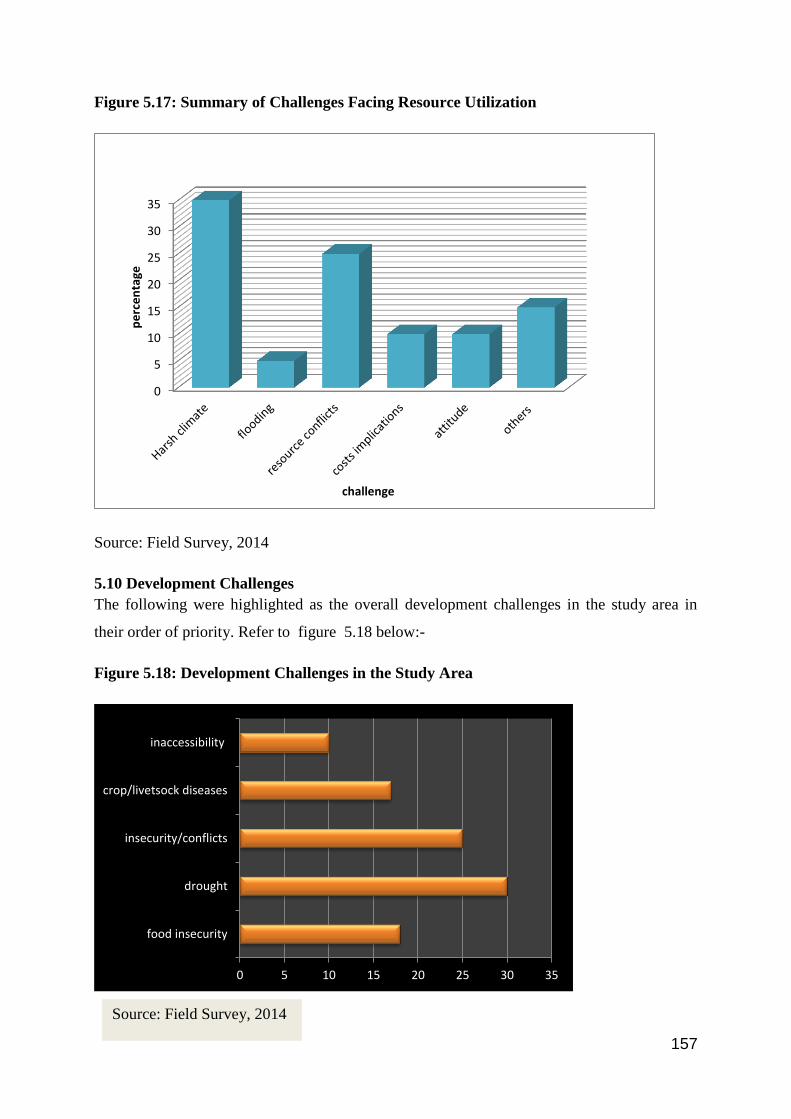
157
Figure 5.17: Summary of Challenges Facing Resource Utilization
Source: Field Survey, 2014
5.10 Development Challenges
The following were highlighted as the overall development challenges in the study area in
their order of priority. Refer to figure 5.18 below:-
Figure 5.18: Development Challenges in the Study Area
0
5
10
15
20
25
30
35
pe
rce
nta
ge
challenge
0 5 10 15 20 25 30 35
food insecurity
drought
insecurity/conflicts
crop/livetsock diseases
inaccessibility
Source: Field Survey, 2014
158
5.10.1 Summary of the Study Findings
Research has established that Isiolo district has immense potential for natural resources-driven
development based on the existing resources. However, the potential of these resources is not
fully exploited. The study therefore aims at investigating the land use potential in Isiolo -
Central by analyzing the utilization of existing resource potential with a major concentration
on agriculture i.e. livestock and crop production. This section discusses the various study
findings and the correlation between different variables as found out during the survey. It also
articulates the implications of the study findings while providing a basis for suggestions and
recommendations.
a) Existing Natural Resources
The study area is endowed with a variety of resources ranging from land, fertile soils,
livestock, wildlife, rangelands, long hours of sunshine among others. Among all the resources
available in the region, land and livestock are the most valued resource among the Borana,
Samburu and Turkana. However, rivers are considered to be the most precious resource by
both pastoralists and crop farmers hence a major source of conflict in the region. Land is
communally owned making direct access by individuals difficult.
b) Land Use Practices
The main land use practice in the area is agriculture. Crop farming is practiced on small-scale
i.e. farms ranging from one acre to ten acres while pastoralism takes up more than three
quarters of the land in the region in the form of rangelands. The survey also established that
settlement patterns in the rural parts are dispersed and are lacking in basic services such as
electricity, roads, water among others.. Nucleated settlement patterns are found around urban
centers i.e. Isiolo town as well as around water points due to availability of infrastructure and
security. Settlements are also found along rivers due to desire to access water for domestic
purposes and irrigation.
5.10.2 Factors Determining Land Use Practices And Patterns
Theory and practice has established that there are numerous land use determinants (both
natural and man-made factors) and service levels in arid and semi-arid lands. The survey in
Isiolo, Central found out that the major factors determining the existing land use practices in
this area are as follows:-.

159
i) The rich Culture and traditions of the local people is a major factor contributing to
the existing land use pattern and practices i.e. pastoralism. The Turkana, Samburu
people are pastoralists in nature having inherited the culture from their parents.
ii) Climatic conditions i.e the low rainfall patterns and high temperatures are also major
determinants of the land use practices in Central. For instance the harsh conditions
encourage the community to invest in pastoralism as well as nomadic lifestyle in
search of water and pasture for their livestock.
iii) The existing natural resources in the area have also attracted the community to
engage in certain land use practices. For instance, availability of Isiolo River with
black cotton soils has encouraged the community to engage in crop production.
However, with perennial river and fluctuating water levels, most farmers only practice
small-scale farming where farmers grow crops like tomatoes and vegetables which are
sold within Isiolo town while the rest are sold to brokers who transport them to Meru,
Garissa, Embu and Nairobi.
iv) Another factor influencing land use practices in the area is the increasing population
caused by the high population growth rate as well as immigration. This coupled with
the large natural resource base such as availability of land, fertile soils and existing
perennial rivers in the area has encouraged people to engage in different activities to
support their livelihoods. The increasing population in Isiolo town also provides a
market for the farm products thereby encouraging crop production.
v) Despite being a major factor, the productivity/profitability of the land use practice is
given less importance as compared to the other factors determining land use activities.
Individuals engage in activities that have minimal economic value leading to underutilization
of the existing resources which would have otherwise benefited the community if optimally
exploited.
5.10.3 Challenges Facing Land Use Patterns and Practices in Isiolo
There are various challenges facing the current practices i.e crop farming and pastoralism.
The major challenge is land tenure system where land is communally owned making
access a major issue. With majority of farmers being immigrants from Meru, Kikuyu and
Kisii communities, they only have access to land by hiring since land cannot be sold. The
huge capital required to hire the land, buy irrigation pumps and seedlings makes it difficult for

160
farmers to till large pieces of land hence they end up practicing small-scale farming. These
therefore leaves out large tracts of productive land uncultivated.
Another challenge facing the current land use practices is the harsh climatic conditions. The
arid nature of the area makes it a problem for the community to access water compelling
people to settle along river banks. Despite increasing access to water, settling along river
banks reduces the amount of fertile land suitable for crop farming to residential purposes. This
therefore hinders optimal utilization of the fertile land.
Poor infrastructure and related facilities are also a great challenge facing farmers in the
area. The narrow unpaved roads leading to the farms and the market become impassable
during the rainy season. This hinders movement of farm products and livestock.
Soil erosion and floods are also major challenges in the area. During rainy seasons, the soils
and crops are swept down the river due to the terrain of the land. This causes losses to farmers
as well as contributing to environmental degradation.
Diseases for both crops and animals are major challenges to farmers in the area. Livestock
diseases have led to death of animals causing losses to farmers. Crop diseases on the other
hand are also a major problem especially on tomatoes and sukuma-wiki which are major
crops in the area.
Farmers also cited low cost of animals at the market as a major challenge. With one goat
sold at Kshs.3, 000, Carmel at Kshs. 50, 000 and cows at Kshs.10, 000, an indication that
livestock production is no longer a lucrative activity in the area. This compared to the current
market average value of a goat at about Kshs.7, 000 camel at Kshs.150, 000 and cattle at
Kshs. 50,000 shows the losses that farmers are making. This coupled with the low milk
production from cattle makes over-dependence on pastoralism an issue that must be
reconsidered.
Resource conflict is also a major challenge facing land use practices in the area. Anxiety
caused by competition for resources (water and pasture) by the natives and immigrants is a
source of conflict in the area. This discourages investors from investing in the area.
Mixed production on the other hand has improved food security in the area despite the
subsistence nature of the activity as well as enhancing the utilization of idle land which is a
major resource. The exporting of farm products i.e. tomatoes to major towns like Meru,

161
Mandera, and Nairobi has enhanced the price of farm products thereby improving farmers‘
livelihoods.
Additional effects of the existing land use practices are: - improved linkages of Isiolo with
other neighboring towns such as Meru, Embu, Garissa, Mandera as well as Nairobi. This is
enhanced by the market provided by these towns for the farm products such as tomatoes and
vegetables from Isiolo.
5.10.4 Discussion
From the above findings, Isiolo is well endowed with a variety of natural resources as well as
indigenous knowledge. Some of the existing natural resources include land, soils,
underground water, minerals livestock, and wildlife among others. Of these resources, only a
few of them are harnessed, for instance despite fertile black cotton soils, crop farming is only
practiced on small-scale due to water challenges, high land cost as most of the farmers are
immigrants. Land is communally owned hence farmers have to lease in order to farm. The
settlement pattern in the rural part is mainly dispersed with concentration in Isiolo town and
along water points. Concentration in towns is basically so that people can have easier access
to security which is currently lacking in the region. Population concentration along rivers is to
enhance access to water for domestic and livestock use. However, settlement along rivers
reduces the amount of land that could have otherwise been used for crop production. Rural
settlements characterised by manyattas made of temporary materials are however not planned
hence lack basic services such as water, electricity, schools, health centres etc. hence they
have to walk for numerous kilometres in order to access the services at Isiolo town. Dispersed
settlements pose a great challenge to service provision due to the long distances between
homesteads hence need intervention.
Livestock/pastoralism is the major land use practice in the area followed by small scale crop
farming mainly along the river and some small scale greenhouse faring. Vegetables are the
main crops grown in the area and are sold at Isiolo market while the surplus is sold to agents
who transport it to Nairobi, Embu etc. The challenge is that selling to brokers fetches a very
low price unlike settling it to the market. Livestock farming is also a major land use however
it faces major challenges such as marketing constraints, poor infrastructure and lack of
extension services. Poor accessibility hinders movement of livestock to the market thereby
causing losses due to death of animals. The poor marketing channels and an
inefficient/incomplete value chain is a major issue hence need for intervention on how to
162
enhance a complete value chain with forward and backward linkages. Farmers sell their
livestock to brokers who later take them to the market/or slaughterhouse thereby fetching a
very low price. This has made livestock a non-profitable endeavour. Farmers lack advice on
crop/livestock diseases hence incurs great losses. The lack of extension services and advice to
farmers on proper farming methods and technology is a great challenge which needs
intervention.
The main factor behind this land use pattern is the culture and traditions which make people
have strong attachment to livestock irrespective of its profitability. The harsh climatic
condition is another factor which gives people no choice but to stick to pastoralism. Crop
farming is limited only along rivers where farmers do small scale irrigation. Green house
farming is not so much developed due to high cost of managing.
The above land use practices and patterns have had their implications such as environmental
degradation, poverty and food insecurity. The population projection in 10 years shows that the
population will increase. In order to curb the above implications such as food insecurity, land
degradation, poverty etc, there is need for intervention. The basic and non-basic theory
provides that, in order to enhance growth of a region, people should invest in major cash crop
which will be exported to other regions hence generating more revenue for the community. In
this case, agricultural production should be geared towards export so that the region can
generate more revenue. This therefore means there‘s need to expand the carrying capacity
through innovation and research thereby increasing production.
163
CHAPTER SIX:
IMPLICATIONS AND POLICY RECOMMENDATIONS
6.0 Overview
This chapter briefly highlights the benefits of undertaking this research in Isiolo as well as the
country at large. The chapter broadly discusses the emerging issues as well as their
implications detailing the need for intervention. It consequently summarizes the normative
framework of how arid areas ought to be transformed putting in mind existing opportunities.
It finally articulates recommendations that if implemented will ensure optimal resource
utilisation in the study area.
6.1 Benefits of the Study
Based on the existing resource potential in Isiolo, this research will have far reaching benefits
not only in Isiolo but also for the country at large. These benefits are for instance
improvement in food security in the region thereby enhancing self-efficiency as well as
reducing the net importation of food products from other regions. Implementing this study
will improve income generation to farmers through diversification of land use activities
thereby reducing poverty levels in the region. Environmental sustainability is another benefit
which will be achieved through implementation of this report. The proposals to have
settlement re-organization will also ensure planned human settlements with adequate
provision of basic infrastructure services and utilities such as water, electricity, roads, schools,
police posts, halls etc. This will go a long way in improving the social welfare of the
community as well as enhancing security in the volatile region.
6.2 Summary of Emerging Issues
The purpose of this research was to investigate the land use potential in Isiolo by analyzing
the utilization of existing resource potential and consequently propose intervention measures
on how to ensure optimal utilization for the benefit of the local community. The research,
which was extensively carried out brought out various issues. These are as follows:-
6.2.1 Land Degradation
Land degradation begins when populations exceed the carrying capacity of the land (Stewart
and Robinson,1997). The human population in Isiolo, central is increasing like any other
region as a result of natural increase. In addition, the area acts as a temporary run-away during
the dry season by nomads from Turkana and Samburu who end up establishing permanent
residence. General migration from more densely settled areas like Meru, Nyeri, Kisii has led

164
to an increase of settled agriculture in areas previously occupied by nomadic pastoralists. This
has been accompanied by a higher growth rate among the settled population than the nomads
leading to competition for scarce resources (e.g. water and pasture). Human impact in Isiolo,
has consequently led to soil degradation through waterlogging, wind and soil erosion.
Droughts, common to this area, exacerbate the degradation processes. Land degradation has
resulted in desertification which consequently brings high risks of disasters from flooding,
recurrent famine.
Israel, just like Isiolo faces the challenge of limited land in the face of current and projected
development rates with only 20% of the land area being arable while the rest is a desert with
unfavourable climate and lack of water resources. However, Israel unlike Isiolo has
transformed a desert into an agricultural potential by utilization of desert areas by means of
appropriate technologies. The area of irrigated farmland has increased from 74,000 acres in
1948 to approximately 460,000 acres today. Isiolo‘s carrying capacity has decreased with
time due to increasing human and livestock population with no innovations on how to
increase the carrying capacity. This is visible in the decreasing livestock production, soil
erosion, flooding during rainy seasons and recurrent famine. The situation has been
exacerbated by the lack of investment in research and development on arid and semi-arid
lands by the central government. Israeli government has invested in research and development
which has seen increasing innovation in drought resistant crops, modern farming technologies
(green house farming) and water usage. This has consequently expanded the carrying capacity
of a desert region to accommodate its increasing population as well as well export of surplus.
6.2.2 Undeveloped Water Resources/Water Scarcity
Water availability is a major issue in this area. This ranges from undeveloped water resources
to total lack of water in some parts of this area. The area is endowed with underground water
resources which are not adequately exploited. In addition, there‘s minimal water harvesting
during the rainy season. Undeveloped water resources have led to subsistence farming mainly
by land occupants bordering the river (Isiolo River). For those far away from the river,
boreholes are the main source of water hence minimal crop farming. This has had negative
effects on food production in the area, a factor which has increasingly contributed to food
insecurity. Israel has a water price policy which regulates the use of marginal water such as
brackish and reclaimed. Israel, unlike Isiolo has also developed modern mechanisms on how
to harvest rain water.

165
6.2.3 Over-Dependence on Unprofitable Livestock Production
Pastoralists have a ―tradition‖ in livestock keeping that is not always matched by a similar
attitude toward other land uses such as farming, forestry, wildlife ranching, or ecotourism.
This lack of appreciation has been a barrier to the initiation of other land uses. Over-
dependence on livestock production is majorly caused by the local community‘s culture and
beliefs. This is further exacerbated by the lack of commercial orientation since beef cattle are
kept by pastoral communities with sociological attachments to their livestock. The poor
attitude towards other land uses has hindered investment into other major lucrative economic
activities. The findings from the study also revealed that the value chain system in the region
is not complete hence the farmers barely realize the economic potential of their products. For
instance products i.e. farm products and animals are sold directly to the brokers who buy at a
very low price.
6.2.4 Poor Infrastructure.
Poor and undeveloped infrastructure is a great challenge in Isiolo. This is manifested in, for
instance, poor market outlets especially in marketing of milk, poor condition of roads leading
to the markets; lack of sewerage system, water and electricity in the rural areas etc. Most
roads are narrow and impassable during the rainy seasons making transportation of products a
challenge.
6.2.5 Unplanned Settlement Systems
Settlement systems refer to all the patterned ways in which humans interact with each other,
with the landscape and with the biosphere and the atmosphere. Human settlement systems are
usually understood to include the systematic/regularized ways in which settlements (hamlets,
villages, towns, and cities) are linked with one another by trade and other kinds of human
interaction. Unlike Isiolo, much of Israel‘s agriculture is based on cooperative communities
(kibbutz and moshav), founded on nationally owned land leased on a long-term basis. Kibbutz
members jointly own the means of production and share social, cultural, and economic
activities. The residents in both types of settlements are adequately provided with municipal
services such as water, electricity, schools, social halls, police posts etc. While most of them
are still in agriculture, today virtually all kibbutzim have also expanded into various kinds of
industry.
The nomads‘ way of life; their cyclic movement and temporary interactions with the
environment makes them have a weak settlement system. Isiolo is characterised by dispersed
settlement patterns with hamlets located as far as 5kilometers from each other. Settlements are
166
mostly organised along the river and other water bodies to enhance access to water for
domestic and livestock use. However, the area is characterised by unplanned settlement
patterns with dilapidated hamlets made of cheap low-quality materials. The current settlement
patterns has made it difficult to provide services and utilities such as electricity, roads, police
posts, schools etc. In addition, it is difficult to provide security for dispersed settlements as
homes are situated far away from each other. These types of settlements have also resulted to
weak organisational capacity in grassroots institutions for effective resource mobilization and
consequent implementation of community based programmes and projects.
6.2.6 Poverty
Isiolo County has a higher poverty index of about 71%. Households lack basic services and
facilities such as water, electricity, food, security among others. This is exacerbated by the
low productivity from the land as well as livestock. Insecure land tenure has had other
implications such as reluctance to make investments on land which is held on a temporary or
insecure lease.This makes it difficult for individuals to access credit facilities using land as
collateral hence a vicious cycle of poverty in the region despite huge chunks of land large
numbers of livestock.
6.2.7 Food Insecurity
Hunger and famine are among the major challenges facing Isiolo region. For a long time,
Isiolo region has been regarded as a net importer of food from the high potential highlands
due to its aridity conditions. The amount of food produced in the region does not match the
existing demand hence they have to rely on relief on other regions. The region has
consequently experienced recurrent droughts for the past years prompting intervention from
the national government as well as other stakeholders. Currently, parts of Samburu and the
neighbouring Samburu and Turkana are experiencing famine which has led to loss of lives
and livestock.
6.2.8 Insecurity/ Ethnic Conflicts
The increasing immigration and settlement by pastoralists from neighbouring regions is a
major cause of anxiety and inter-clan/ethnic conflicts which has for a long time inhibited
investment in the region. The increasing population has led to competition for scarce water
and pasture by pastoralists hence causing animosity among the different clans. There‘s need
to empower the community to diversify their land use activities in order to avoid competition
for water and pasture for livestock.

167
6.3 The Potentials of the Study Area
The study also found out that, amidst the development challenges cited in the above chapters,
there are various opportunities which can be exploited to enhance the growth and
development of the region. These opportunities range from natural resources, legal and
institutional aspects, social-economic factors, technology, among others. Below is a summary
of some of the opportunities that can be tapped to ensure optimal utilisation of underlying
resources in Isiolo, central:-
i) Livestock
Isiolo and other ASALs host about 70% of the national livestock herd with an estimated value
of Kshs.100 billion. As populations increase, urbanize and become richer, they demand more
meat and other livestock products. Research suggests that about 500,000 jobs could be created
if there was an increase in livestock production.
ii) Tourism
The natural resources such as wildlife, national parks and game ranches in Isiolo County
make it a great destination for tourists. The symbiotic interaction between wildlife and
pastoralism, coupled with the rich cultural heritage of pastoral and agro-pastoral communities,
is a major tourist attraction. Tourism is usually Kenya‘s highest foreign exchange earner and
contributes around 12% to Kenya‘s GDP.
iii) Natural Wealth
Like any other arid area, land is the most abundant resource Isiolo with an approximate area
of 25,968 KM2. The area has enormous potential for renewable energy, from both solar and
wind. Other natural resources include sand and gravel for construction, resins, medicinal
plants, and potentially oil and gas. Significant amounts of seasonal water run-off are currently
lost but could be harnessed for domestic and productive use. The area is also well endowed
with underground water which could be mined for domestic and livestock use. In addition,
some of the region has black cotton soils suitable for agricultural production e.g. along rivers.
iv) Pastoralists’ Resilience and Coping Mechanisms
Pastoralists have successfully managed climate variability for centuries. Their skills and
indigenous knowledge will become more valuable as the impact of global climate change
becomes more pressing.

168
v) Land Tenure
The communal land ownership system is a major potential when it comes to land and
settlement planning as it is easier to plan on communally owned land than on privately owned
land. Individual land ownership will result to disjointed property hence the authority will
undergo challenges trying to encourage the owners to settle in communal villages.
Communally owned land is held under one title therefore, it is easier for the county
government of Isiolo to adequately plan and implement projects and initiatives for the benefit
of the local community.
vi) The Proposed Modern Slaughter-House
The county government of Isiolo is putting up a multi-million Isiolo abattoir which will
accommodate about three hundred animals per day from as far as Garbatulla. The proposed
slaughter-house is a great potential which will enhance value addition to animal products
thereby increasing revenue for livestock farmers. The completion of the abattoir will open up
cottage industries supporting the livestock sector, notably tanneries and animal feeds. This
will consequently increase employment opportunities for the local community. Finally, the
abattoir linked to the LAPSSET project would open new market frontiers to allow exportation
of meat products across the region.
vi) Urban Development
Carefully planned and strategic urban development in this region will benefit the region,
particularly through employment creation. It will also open up new economic opportunities
for the country as a whole, reducing population pressure in high-density areas and
strengthening national cohesion. This will also go a long way in reducing ethnic animosity.
Other vital opportunities include the following:-
The new constitution and Vision 2030 blue print
Availability of basic research infrastructure i.e. KARI
Interest from the donor community and international NGOs willing to support
agricultural projects in ASALs.
Eager farmers demanding new ideas and technology
Potential for hydro-power generation and irrigation agriculture using Ewaso Nyiro
River
169
6.4 Normative Framework –Land Use and Settlement
Optimal use of land and other natural resources is a significant goal for all arid areas
worldwide. From the conceptual framework, i.e figure 2.1, it was established that in order to
realize optimal resource use in any arid area, various factors have to be harmonized and
coordinated. Borrowing from Israel and Egyptian case, vital aspects such as research and
settlement planning play a major role in improving the productivity of arid regions. For
instance, the productivity of Israel‘s desert land is as a result of the combination of people‘s
attitude, policy and technology.
In order to ensure optimal resource use in arid regions, the central government needs to invest
their resources in research and development in aspects such as resource evaluation; crop
diversity; proper farming methods, farming equipment‘s and sustainable water usage. This
therefore requires that policy is formulated to adequately provide for extensive research and
innovation on arid regions. There‘s also need for proper policy framework on land use and
settlement planning in arid regions. This is because most of arid regions in Kenya for instance
are characterised by dispersed settlement patters with minimal service provision. In the case
of Israel and Egypt, settlement planning is given a priority. Communities live in planned
villages with adequate provision of basic services and infrastructure while the rest of the land
is left for mechanised farming. This model enhances optimal utilization of arid lands as it
prevents sub-division of land into minimal sizes thereby enhancing mass production which is
economical. Land in Israel is owned by the government, this therefore makes it easier to plan
and move people into planned settlements. The government of Israeli provides long leases to
people willing to invest in land. In Isiolo, land is communally owned; the county government
of Isiolo through the Ministry of Lands, Housing, Physical Planning & Urban Development
should streamline their land policy issues and provide leases to private investors willing to
invest in Isiolo. This will encourage investments as well as diversity of land uses as well as
enhance revenue generation for the county.
Just like Israel, Isiolo stands to enhance optimal resource utilization if factors discussed above
are put into consideration i.e policy, technology and settlement planning. Policy will ensure
coordination on the institutional framework in livestock and crop production. Technology will
enhance innovations to expand the now decreasing carrying capacity which will consequently
improve production in this region. Technology will also provide farmers with a variety of
crops to grow in this dry region; control of diseases in livestock; proper farming methods
(green house farming etc) as well as farm equipment‘s. Settlement planning on the other hand

170
is vital since it ensures the community is adequately provided with basic services including
security which is currently lacking. In addition, the villages will leave more land which may
be put under crop farming and livestock production.
6.5 Scenario Building
Based on the above normative framework, there is much that needs to be done if the current
situation is to change. The study recommends that implementable plan proposals should be
formulated in order to solve the above mentioned challenges and ensure optimal resource
utilization. It is on the above basis that the research has come up with the following scenarios
that incorporate the community‘s suggestions on how to best utilize the existing resource in
this region.
6.5.1 Proposed Models
a) Model 1: Settlement Re-organization
The study found out that the area has weak settlement systems due to dispersed settlement
patterns. Settlement planning is recommended in this region due to the existing weak
settlement systems. The study recommends communal settlements like the case of Kibutz in
Israel where people live in communal villages while the rest of the land is left for mechanized
farming, refer to figure 6.2 below. Human settlement planning seeks to improve the quality of
the life of people with full respect for indigenous, cultural and social needs. Settlement re-
organisation will make it easier for provision of infrastructure and other utilities which are
currently lacking with the current settlement patterns in Isiolo.
The settlements are to be provided with adequate amenities such as schools, health facilities,
social hall, electricity, police post among other services required of a complete
neighbourhood.
The study recommends harnessing of the cheap renewable energy i.e. sun and wind to provide
for electricity for domestic use in the communal villages.
The communal villages will also take advantage of the high water table to sink boreholes to
ensure adequate water for domestic and livestock use in the villages.
The study recommends that the people in the villages form neighbourhood associations which
will consequently help in enhancing security within the villages as well as an organised
decision making channel.

171
The character of a nation is made visible in its settlements hence settlement planning should
be guided by national goals and implemented by local people making the best possible use of
indigenous resources, within the context of local culture and environment. During re-
organization of the settlements, particular attention to be paid to:
(i) Appropriate location of market places, community centers, potable water supply, health
and education facilities and transport services including loading terminals;
(ii) Respect for local customs and traditions as well as to new needs and requirements;
(iii) Use of local resources and traditional techniques and styles of construction.
Plate 6.1: Proposed Communal Settlements
Source: Adopted from Israel Kibbutz, 2010
Communal villages provide a means to realize the dream of having rural communities based
on social equality, co-operation and mutual aid as well as to increase agricultural output in a
region otherwise regarded as unproductive. The rest of the land surrounding the communal
villages is left for pastoralism.

172
Implementation of this model may face resistance from the local community who have strong
cultural ties to their manyattas. Financial implications i.e a lot of finances will be required to
implement the communal villages. The model does not provide for crop production, this will
see an increase in food insecurity.
Settlement Concerns of Mobile Groups
The unique habitat needs of such groups must receive consideration taking into account their
cultural values. The spatial, social, economic and cultural needs of mobile groups must
receive special planning attention at local, as well as regional and national levels.
This study recommends the following to be done:-
(i) Identification and appreciation of the nomads‘ special needs
(ii) Training and counseling for those persons or groups which choose freely to settle in one
or a few locations;
(iii) Development of special facilities and techniques to provide health and education services;
(iv) Provision of shelter - fixed or portable - food and water, consistent with cultural values;
(v) Regional co-operation in developing appropriate responses.
b) Model 2: Crop Farming and Pastoralism
The study recommends an organised irrigation farming system known as village
irrigation/irrigation clusters. This is a new approach in water economy useful in countries
with water scarcity. Its main purpose is to help improve the effective and efficient use of
water in dry lands in order to cater for the imbalance raised between water demand and the
limited supply. This model maintains the existing settlement patterns i.e dispersed settlements
while farmers are organised into clusters for farming purposes only. Refer to figure 6.1 below
for the design of farm clusters.
The irrigation cluster will be characterized by the following aspects:-
a) One cluster to consist of about 10 farmers.
b) The clusters should be based on shared allocation of resources such as farmland, water
quotas and other productive units.

173
c) Communal pooling of resources to acquire modern pumps to enable farmers obtain
high-end technology pumps for use in large farms.
d) Empower people to form water use associations to help distribute water among
farmers and to rationalize pumping to reduce pumping costs as well as increase yields.
e) Harness solar energy for operation of irrigation pumps.
f) Farmers to adopt drip irrigation method to minimise water usage and avoid wastage.
Figure 6.1: The Proposed Farm Cluster Views
Source: Author, 2014
The study also recommends that the county government of Isiolo as well as the neighbouring
counties should formulate comprehensive by-laws to regulate water usage. Among the by-
laws should be water pricing policy meant to regulate water utilisation along the rivers. This
is meant to regulate upstream abstraction and usage of the rivers‘ water for irrigation to ensure
sustainability of rivers.

174
Green House Farming
This study recommends greenhouse farming in the wake of the existing climatic conditions
and availability of land. This is meant to increase the productivity of the dry lands by creating
micro-climate in green-houses. Refer to figure 6.2 below:-
Plate 6.2: Green-House Farming
Source: Adopted from Israeli case study, 2010
c) Model 3: Integrated Model
The study recommends a three tier model aimed at creating sustainable rural settlements,
diversifying the rural economic basis while stabilizing and developing agriculture as a unique
economic sector. This model therefore recommends a combination of all the aspects in the
above models making an integrated model based on re-organization of rural settlements,
pastoralism which is the main livelihood for the local community as well as crop farming
(refer to Appendix VI).
Livestock systems represent a potential pathway out of poverty for many smallholders in the
developing world and Kenya as a whole. The majority of world‘s rural poor, and a significant
proportion of urban poor, keep livestock and use them in a variety of ways that extend far
beyond income generation (Randolph et al. 2007). In many cases, livestock is a central
component of smallholder risk management strategies (Bailey et al.1999). Livestock products
have highly distributed production systems located far from consumer markets and they are

175
highly perishable. Thus, they require more efficient marketing and processing system along
their entire value chain-from production to consumption-to realize their higher value.
Marketing and processing activities are even more critical in Isiolo since most livestock
producers are small, resource poor, and often unable to establish their own linkages with
markets, processors, and consumers. Marketing of livestock and livestock products remain
largely unorganized, traditional and fragmented.
The livestock sector in the region has attracted little investment, with regard to cattle and
small ruminant production, in terms of value addition.
Despite possessing a lot of land and livestock, the study found out that most people in this
region are still wallowing in poverty. Pastoralists do not sell their livestock during dry seasons
hence they die of hunger. Consequently, livestock production in this region does not follow
the right value chain thereby making pastoralism a non-profitable endeavor.
The current livestock supply chain portrays a three-tier system whereby animals are bought by
traders/argents from agro-pastoralists/pastoralists and are trekked to primary and secondary
market centers at district and regional level, respectively. This means animals are trekked for
long distances, (for a period of 1-3 days). This therefore requires an overhaul in the current
livestock production system to enhance profitability. This research proposes that livestock
production should follow the complete value chain system from production to consumption if
the local community is to benefit from the activity. The study envisions a livestock value
chain that is:-
efficient;
equitable along the chain and productive in pursuit of development objectives for
poverty reduction and food security;
all inclusive
features innovative aggregation models
Attaining this vision will require a lot to be done by all the relevant stakeholders such as local
community, the county government of Isiolo, the private sector, non-governmental
organizations as well as the national government. Specific recommendations that will help
achieve the above vision include the following:-
i) Incorporating both small and large scale farmers
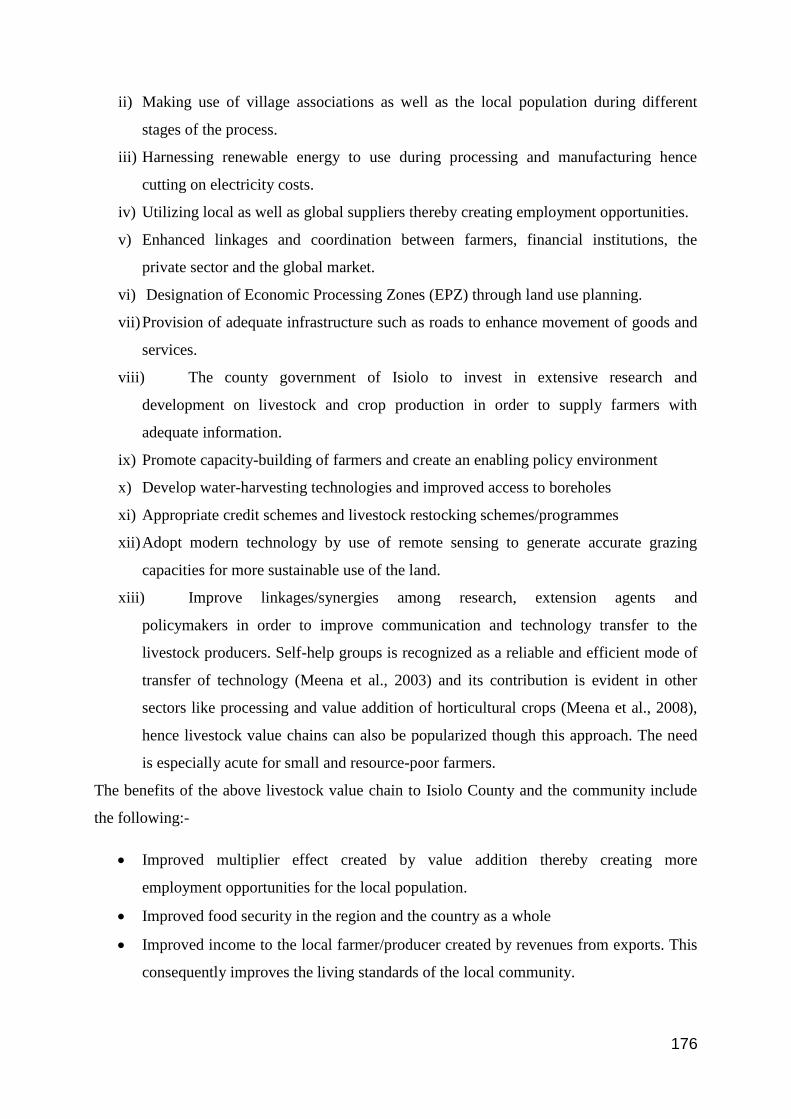
176
ii) Making use of village associations as well as the local population during different
stages of the process.
iii) Harnessing renewable energy to use during processing and manufacturing hence
cutting on electricity costs.
iv) Utilizing local as well as global suppliers thereby creating employment opportunities.
v) Enhanced linkages and coordination between farmers, financial institutions, the
private sector and the global market.
vi) Designation of Economic Processing Zones (EPZ) through land use planning.
vii) Provision of adequate infrastructure such as roads to enhance movement of goods and
services.
viii) The county government of Isiolo to invest in extensive research and
development on livestock and crop production in order to supply farmers with
adequate information.
ix) Promote capacity-building of farmers and create an enabling policy environment
x) Develop water-harvesting technologies and improved access to boreholes
xi) Appropriate credit schemes and livestock restocking schemes/programmes
xii) Adopt modern technology by use of remote sensing to generate accurate grazing
capacities for more sustainable use of the land.
xiii) Improve linkages/synergies among research, extension agents and
policymakers in order to improve communication and technology transfer to the
livestock producers. Self-help groups is recognized as a reliable and efficient mode of
transfer of technology (Meena et al., 2003) and its contribution is evident in other
sectors like processing and value addition of horticultural crops (Meena et al., 2008),
hence livestock value chains can also be popularized though this approach. The need
is especially acute for small and resource-poor farmers.
The benefits of the above livestock value chain to Isiolo County and the community include
the following:-
Improved multiplier effect created by value addition thereby creating more
employment opportunities for the local population.
Improved food security in the region and the country as a whole
Improved income to the local farmer/producer created by revenues from exports. This
consequently improves the living standards of the local community.
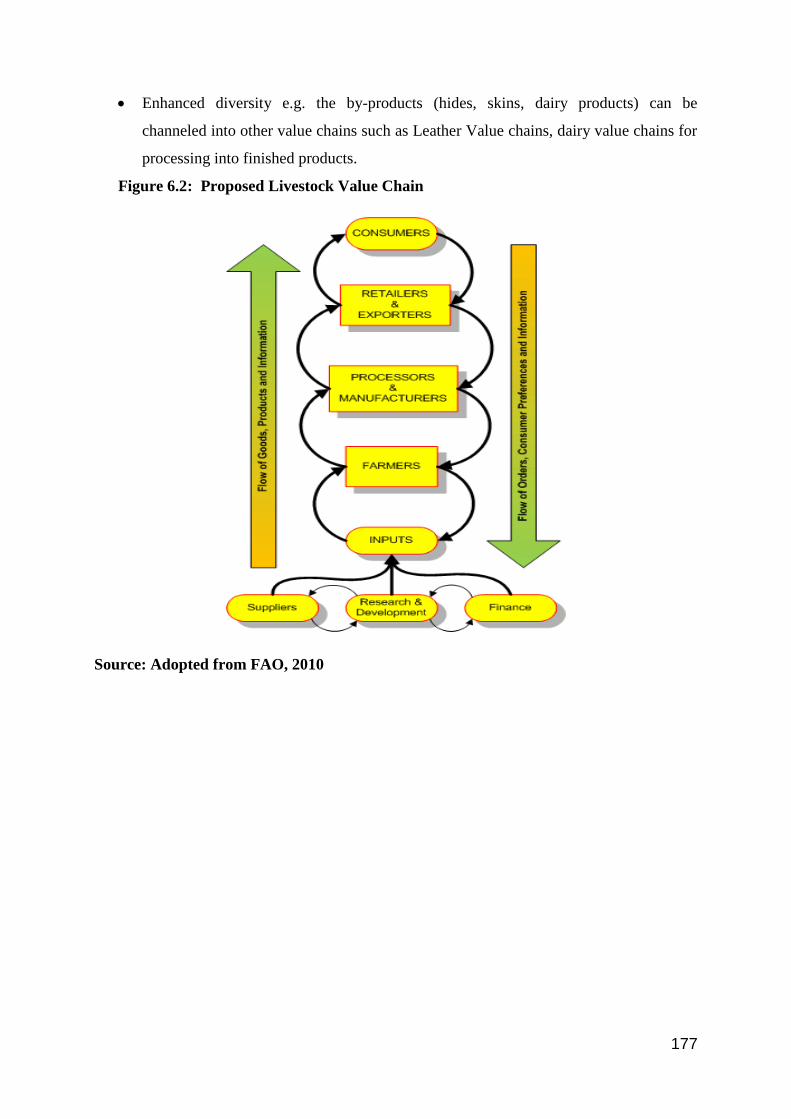
177
Enhanced diversity e.g. the by-products (hides, skins, dairy products) can be
channeled into other value chains such as Leather Value chains, dairy value chains for
processing into finished products.
Figure 6.2: Proposed Livestock Value Chain
Source: Adopted from FAO, 2010
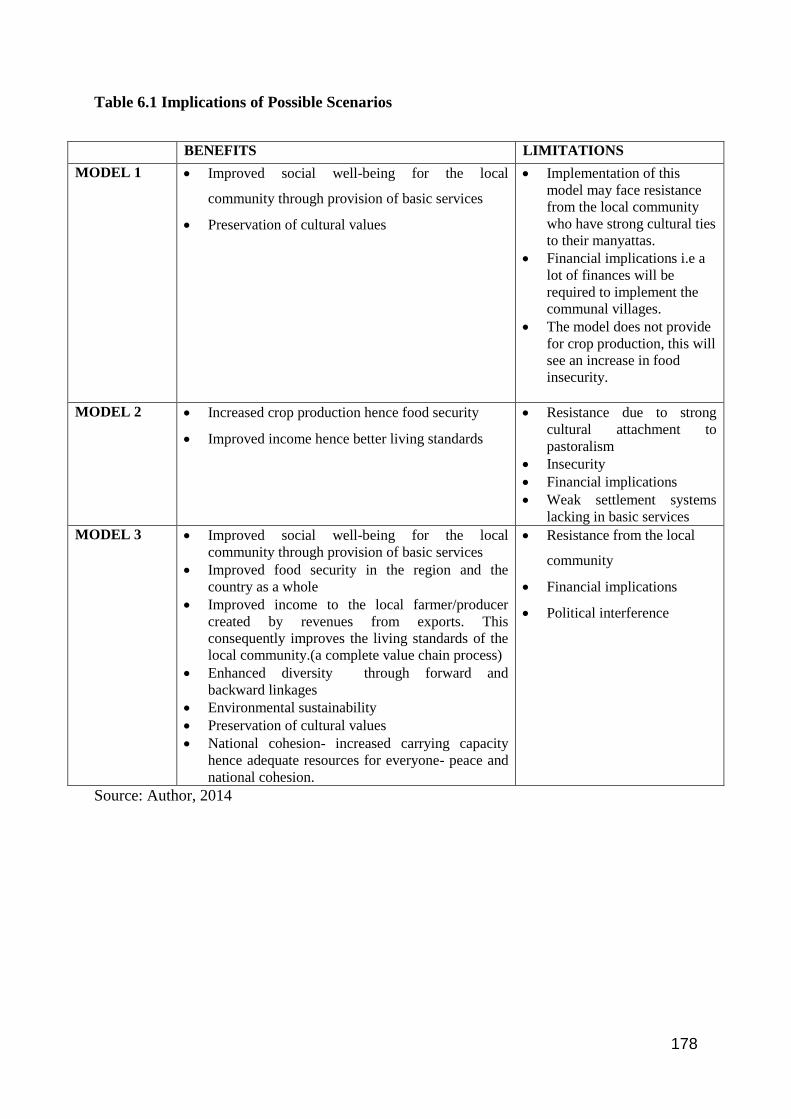
178
Table 6.1 Implications of Possible Scenarios
Source: Author, 2014
BENEFITS LIMITATIONS
MODEL 1 Improved social well-being for the local
community through provision of basic services
Preservation of cultural values
Implementation of this
model may face resistance
from the local community
who have strong cultural ties
to their manyattas.
Financial implications i.e a
lot of finances will be
required to implement the
communal villages.
The model does not provide
for crop production, this will
see an increase in food
insecurity.
MODEL 2 Increased crop production hence food security
Improved income hence better living standards
Resistance due to strong
cultural attachment to
pastoralism
Insecurity
Financial implications
Weak settlement systems
lacking in basic services
MODEL 3 Improved social well-being for the local
community through provision of basic services
Improved food security in the region and the
country as a whole
Improved income to the local farmer/producer
created by revenues from exports. This
consequently improves the living standards of the
local community.(a complete value chain process)
Enhanced diversity through forward and
backward linkages
Environmental sustainability
Preservation of cultural values
National cohesion- increased carrying capacity
hence adequate resources for everyone- peace and
national cohesion.
Resistance from the local
community
Financial implications
Political interference

179
6.6 Policy Recommendations
Below are recommendations that have been made based on the community‘s suggestions and
the success studies on how to ensure optimal land utilization in Isiolo, central location.
6.6.1 Implementation of the Integrated Model
The study recommends implementation of the integrated model which is aimed at creating
sustainable rural settlements, diversifying the rural economic basis while stabilizing and
developing agriculture as a unique economic sector
Other policy recommendations include:-
6.6.2 Protection and Conservation of the Environment
The study noted increased aspects of land degradation ranging from wind and soil erosion
hence recommends capacity building on proper farm management techniques to occupants of
land bordering rivers and pastoralists. In addition, it further recommends regulating sand
harvesting along rivers to avoid environmental degradation as witnessed during the field
survey.
The study recommends empowering of the local communities to improve their capacity to
manage their own resources in a sustainable manner through sensitizing, empowering and
facilitating community initiatives geared towards environmental conservation.
Dryland soils and vegetation store substantial amounts of carbon, hence ASALs could be
integrated into the carbon market and generate payments for environmental services such as
carbon sequestration. This requires that more equitable and effective mechanisms be put in
place to manage.
6.6.3 Encourage Diversification
This research has revealed over-reliance on pastoralism and normative way of doing things
hence the need to encourage diversification. This can be done in different ways;- in order to
discourage over-reliance on pastoralism, this study recommends provision of adequate
infrastructure to encourage locals to invest in other more lucrative economic activities. Based
on the existing wildlife and unique culture, the local community should be encouraged to
engage in eco-tourism by establishing a cultural resource centre for conservation of history,
artefacts and indigenous knowledge.
The study further recommends awareness creation about renewable sources of energy such as
wind and solar energy which is not only cheap but also environmental friendly. In addition to

180
the above, this study recommends rain water harvesting and drilling of boreholes to avoid
over-reliance on rivers.
6.6.4 Land Management Policy
This research noted that communal ownership of land in Isiolo is a major impediment to
optimal land utilization. Individual ownership is not allowed hence people cannot use land as
collateral to secure loans from banks for development purposes. This therefore enhances the
vicious cycle of poverty by the locals amidst huge chunks of land. This research therefore
strongly recommends provision of secure land tenure systems to communities by –
commencing the Adjudication process and allowing individual ownership.
6.6.5 Reduce Insecurity
Engagement of all stakeholders towards conflict resolution in the region is a vital way in
ensuring a peaceful environment. Peaceful co-existence is a vital element in enhancing
sustainable development of a community. The county government should device practical
ways of ensuring equitable access to resources among different ethnic groups.
The study finally recommends that a strong political will is necessary to ensure proper
implementation of the proposed projects and initiatives. Local politicians should take
responsibility of implementing the above recommendations by lobbying for the projects.
6.6.6 Enhanced Institutional Coordination
Institutional analysis found out that there‘s minimal coordination among relevant institutions
i.e. the national government, county government, the private sector, non-governmental
organisations as well as the local community when it comes to putting up initiates. This has
led to sectoral development which consequently leads to failure of the proposed initiatives.
The study therefore recommends strong coordination among various institutions in order to
enhance integrated development which is sustainable.
6.6.7 Research and Development
Israel believes that ‗Innovation makes drylands Bloom‘. It‘s on this basis that Israeli
government has invested much in research and development. For instance, Israel has
increased the area of irrigated farmland from 74,000 acres in 1948 to approximately 460,000
acres today by means of appropriate technologies. The greenhouse has also been adapted in
Israel enabling farmers to design their own climatic conditions thereby expanding the carrying

181
capacity of dry land. Isiolo, like Israel should invest in R&D to expand the carrying capacity
of the land e.g. greenhouse farming, irrigation etc.
The challenges facing farmers in Isiolo range from poor farming methods, low quality crops,
diseases, lack of extension services, inadequate water among others. The county government
of Isiolo as well as the national government should invest resources in extensive research on
the following aspects i.e.:- land evaluation to determine the soil potential; crop diversity,
water usage modern farming technology and equipment‘s as well as provision of extension
services to farmers. This will go along way in increasing the productivity of the dryland. With
adequate research, the county will be able to revive old industries such as cotton, which was a
top earner for the area in the 1970 and 80's.
Research should also be done on land use/settlement planning. This will help come up with
better settlement models for rural areas in drylands and other parts of the country. Spatial
planners should borrow a leaf from best practices globally and invent models that suit the
local situations as well as ensuring adequate provision of basic services.
182
CHAPTER SEVEN
SUMMARY AND CONCLUSIONS
7.0 Overview
This chapter gives a summary of the issues that have been looked at as well as providing a
critical evaluation of carrying out this research. It also gives a conclusion of the whole study,
the contributions this study would make on the planning profession as well as highlighting
areas that require further research.
7.1 Summary
Carrying out this study and implementing it in Isiolo will have far reaching benefits in Isiolo
as well as the country at large. The major benefits are for enhanced social well-being through
proper housing and service provision in the rural settlements which is currently lacking. In
addition, implementing these proposals will see enhanced security in the region as the rural
settlements will be provided with police posts. The proposed diversification of land use
activities other than pastoralism will consequently reduce anxiety/ethnic conflicts which
results from competition for scarce water and pasture. Diversification will also enhance
income generation hence improvement in people‘s living standards thereby reducing the high
poverty index. The proposed value chain will also increase the revenue generation as well as
provide employment opportunities to the local community. Enhanced food security in the
region is also another benefit that will be realized with implementation of the proposed this
study. Investment in crop production through green-houses will improve food production
thereby increasing the supply to meet the increasing demand. This will ensure a self-sufficient
region. Finally, the recommendations on environmental conservation will reduce land/soil
degradation as well as preservation of endangered species. This will go a long way in
enhancing environmental sustainability.
Despite the above benefits, the implementation of the integrated model will also have its costs
socially, financially and politically. For instance, the re-organisation of the existing traditional
manyattas to planned rural settlements/villages is likely to face resistance from the local
community. In addition, getting people to embrace other land use practice other than the
traditionally held pastoralism will not be easy. The current population is made up of Muslims
and Christians, getting people of different religious beliefs to live in a single settlement will
be very difficult. Another major hindrance is the financial implications of setting up the rural
settlements fully equipped with infrastructure and other related services. Finally, the complete

183
re-organisation of settlements into autonomous villages is likely to face resistance from the
political class for fear of rivalry and competition. The political class are also afraid of having
an enlightened and economically empowered population.
A critical analysis of the above costs and benefits shows that the benefits of implementing this
research far much outweigh the costs. Given that the gains outweigh the costs, this research,
titled as the analysis of land use potential in central location, Isiolo was carried out. The
research was guided by four major objectives i.e:-
5. To investigate the existing resources, land use patterns and practices in Central
location.
6. To interrogate the factors determining the current resource use, land use patterns and
practices in Central location.
7. To examine the consequences of the existing resource use, land use patterns and
practices in Central location.
8. To explore planning intervention measures that can be applied to ensure optimal
resource utilization in Central location.
Objective 1: To investigate the existing resources, land use patterns and practices in
Central location.
The study found out that the area is endowed with a variety of resources ranging from vast
land, fertile soils, underground water, sand, livestock, wildlife, forests among others. The
study found out that the main land use practices in the area are pastoralism and small scale
crop production. There is rampant over-reliance on pastoralism despite its economic
insolvent. Settlements are mainly dispersed with concentrations mainly along rivers and water
points. The study also realized that most households lack basic services and
infrastructure.This research recommends opening up of the area by investing in basic
infrastructure in order to encourage investors and the locals to invest in other more lucrative
economic activities such as manufacturing and tourism. Finally, rural settlement planning is
recommended through planned cluster settlements to enhance infrastructure and service
provision to the community as well as enhance productivity of the rangelands.

184
Objective 2. To interrogate the factors determining the current resource use, land use
patterns and practices in Central location.
This research found out that the main factors determining land use practices in this area are:-
the climatic conditions, culture and beliefs, inadequate policy and poor settlement patterns.
Due to cultural values, people have a strong attachment on livestock thereby influencing them
to practice pastoralism. Communal land ownership is also a major impediment to investment
and diversity. This coupled with poverty restricts the locals from having access to credit
facilities which would help them invest in more profitable economic activities. This research
recommends the need to reform the land policy in arid regions and allow for long leases. This
will encourage investors into the region. This research also recommends strong policy
formulation for arid and semi-arid areas to enhance resource utilization i.e polices on
livestock and crop production. The policies should provide for research and a coordinated
institutional framework to guide the process. The research also recommends settlement re-
organization to provide more land for mechanized farming and pastoralism.
Objective 3. To examine the consequences of the existing resource use, land use
patterns and practices in Central location.
This research found out the main consequences of the existing land utilization being food
insecurity; persistent poverty, land degradation and ethnic conflicts caused by competition for
livestock pasture and water. This research recommends settlement re-organization i.e people
to live in planned communal villages to allow more land for mechanized farming which will
in turn improve land productivity. The villages to be provided with basic services to enhance
the social well being of the community. The study also recommends strong research on how
to expand the carrying capacity of the land for instance, research on resource evaluation/land
evaluation, existing resource inventory, drought resistant crops, proper methods of farming,
animal disease control measures, rural settlements, efficient water usage among others. This
research further recommends the need to promote value addition in agricultural production as
well as encourage agri-businesses.
Objective 4. To explore planning intervention measures that can be applied to ensure
optimal resource utilization in Central location.
The study synchronized the possible solutions gathered from the community, key informants
and government officials with the guidance of planning expertise and finally came up with
185
suggestions on how to ensure optimal resource use in Isiolo. The study also borrowed ideas
on best practices from Israel, Egypt and Iraq on how to increase the land carrying capacity
amidst the growing population. These recommendations were interrogated and evaluated in
the light of the existing situation in Isiolo to ensure the recommendations are not only
implementable but also sustainable. Among the recommendations made include: -
diversification of land use activities; research and development; settlement re-organization;
environmental conservation; institutional coordination; policy formulation among others.
Spatially, the study recommends an integrated three tier model aimed at creating sustainable
rural settlements, diversifying the rural economic basis while stabilizing and developing
agriculture as a unique economic sector.
7.2 Conclusions
The study has made it clear that the study area has immense potential for natural resources-
driven development based on the existing resources such as fertile soils, land, sunshine, water
etc. However, over-reliance on pastoralism, inadequate policy and research as well as the
harsh climatic conditions has hindered people from investing in other lucrative land use
activities. Employing modern technology in crop production and livestock production will
ensure food security in the region thereby enhancing self-efficiency. In addition, the proposal
to have Isiolo as a Resort city requires that the region produces adequate food to increase the
growing demand. The region therefore calls for immediate intervention hence the study is
timely.
Improved value chain system will also ensure value addition to agricultural products thereby
improving income generation to the local community. The study has also broadened the
understanding of the existing resource potential in the area; this information is useful for the
County Government of Isiolo as it will form a basis of future planning.
The study has contributed to the understanding of the various forces determining the land use
patterns and practices in ASALs as well as the challenges therein. The proposed initiatives on
how to ensure optimal and sustainable resource utilization in drylands are vital in planning
practice as they can be applied to other drylands facing similar challenges. The
recommendations made in this research can be adopted by the county government of Isiolo in
formulating land use policies for the region.
The economies of the lowlands and highlands are complementary. Opening up the north will
generate more demand for the local products from highland and other productive areas in the
186
light of efficient infrastructure (the LAPSSET). There is already significant movement of
capital between Isiolo and Nairobi, which is set to grow with the accomplishment of the
LAPSSET corridor.
7.3 Areas of Further Research
Due to limited time and resources, the study only focussed on the agricultural potential i.e
livestock and crop production. The study found out that the region is well endowed with
natural resources ranging from vast land, fertile soils, rivers, rangelands and long hours of
sunshine which can be tapped to provide energy for use in agro-industries and green houses.
This coupled with adequate labour from increasing population, willingness from NGOs and
other investors as well as the government policy can be used to enhance the agricultural
productivity of the region. In addition, the wide variety of natural resources in the region
provides an opportunity for diversification of economic activities away from livestock
production. Ewaso Nyiro River is mainly utilised by pastoralists, the riverbank has been
designated as a livestock corridor hence minimal activities. However, further research should
be done on the viability of dam construction along Ewaso Nyiro River. This will go a long
way in increasing the productivity of the region through crop production.
187
8.0 LIST OF REFERENCES
Aliboni.R (1984); Egypt's Economic Potential. Published by Routledge, Canada.
Ancient Mesopotamia: The Geography, History, Culure and Scientific Achievements of Its
People; Gordon, A. http://www.city.ac.uk/~es161/iraq-te.html
Bovin M., Manger L.,eds.(1990); Adaptive Strategies In African Arid Lands, 320pp. Uppsala
Sweden: SIAS publication.
Dregne H.E.(1970); Arid Lands in Transition, 180 pp. AAAS Publication No.90. Washington
DC.
Economic Review of. Agriculture. 2010. REPUBLIC OF KENYA. Ministry of Agriculture.
Prepared by: Central Planning and. Project Monitoring Unit.
Economic Review of. Agriculture. 2011. REPUBLIC OF KENYA. Ministry of Agriculture.
Prepared by: Central Planning and. Project Monitoring Unit.
Economic Review of. Agriculture. 2012. REPUBLIC OF KENYA. Ministry of Agriculture.
Prepared by: Central Planning and. Project Monitoring Unit.
EHDR, 2003.Egypt Human Development Report. United Nations Development
El-Mowelhi, N., Abt, Y., Herman, Z., (1996). Project Proposals for Collective Agricultural
and Rural Development of Settlement in Nubariya Region, Egypt. MASHAV, Centre
for International Cooperation. August 1996.
El-Zoghby, S.M., (1999). Sustainable planning of desert land reclamation projects in Egypt as
related to drought management: an integrated strategy. In: Paper Presented at the
International Conference on Integrated Drought Management, arranged by UNESCO,
20–22 September 1999, Pretoria, South Africa.
Enien, R.R. et al, (2000). A New Research Paradigm For Sustainable Agriculture in Egypt.
Experimental Agriculture 36 (2), 265–271.
FAO (1996). Agro-ecological Zoning Guidelines. FAO Soils Bulletin 73. Rom. www.fao.org
FAO, (1976); A framework For Land Evaluation. Rome
Gachene, C.K.K. and Kimaru, G. (2003). Soil Fertility and Land Productivity - A guide for
extension workers in the eastern Africa region. Technical Handbook No.30. Regional

188
Land Management Unit (RELMA)/ Swedish International Development Cooperation
Agency (Sida). ISBN: 9966-896-66-X.
Golan, Arnon, (1997): The Transformation of Abandoned Arab Rural Areas
Isiolo District Consultative Forum Report on Poverty Reduction Strategy Paper 2001-2004
Jaetzold, R. and Schmidt, H. (1983).Farm Management Handbook for Kenya.Vol IIB,
Ministry of Agriculture, Nairobi.
Kassas M.(1991). Desertification; A General Review. Journal of Arid Environments,35: 115.
Keeley J. and Scoones I. (2003).Understanding environmental policy processes. Cases from
Africa.Earthscan Publications Ltd, London, Sterling VA.
Kenya Vision 2030: A Globally Competitive and Prosperous Kenya
KNBS, 2009; Kenya Population and Housing Census ,2009.
Meyer, G., (1994). Land reclamation and development of new agricultural land in
Egypt.Applied Geography 44, 59–71.
Middleton N. and Thomas D.,eds.(1997) world atlas of desertification,182pp. second edition.
London: UNEP, Arnold press.
Ministry of Lands and Settlement (1978); Human Settlement in Kenya.A Strategy for Urban
and Rural Development.
Republic of Kenya (1965), African Socialism and Its Application to Planning in
Kenya.Sessional Paper No. 10 of 1965 - p.46.
Republic of Kenya, (2003); Economic Recovery Strategy for Wealth and Employment
Creation.Government press. Nairobi, Kenya.
Republic of Kenya, (2004); Draft National Policy For The Sustainable Development Of Arid
And Semi-Arid Lands Of Kenya. Unpublished.
Republic of Kenya, (2005): Isiolo District Vision and Strategy: 2005-2015
Republic of Kenya, (2005): Arid and Semi-Arid Lands (ASALs) Sessional Paper July 2005
189
Sessional Paper No. 8 of 2012 on National Policy for the Sustainable Development of
Northern Kenya and other Arid Lands.
Sombroek, W.G., Braun, H.M.H. and van der Pouw, B.J.A. (1982). Exploratory Soil Map and
Agro-Climatic Zone Map of Kenya, 1980. Scale: 1:1'000'000. Exploratory Soil Survey
Report No. E1. Kenya Soil Survey Ministry of Agriculture - National Agricultural
Laboratories, Nairobi, Kenya.
Swift J. (1996).‗Desertification narratives, winners and losers.‘The lie of the land.
Challenging received wisdom on the African environment. The International African
Institute with James Currey Ltd., London and Oxford.
USAID, (1982) : EGYPT Strategies For Accelerating Agricultural Development. Mimeo,
Cairo.
Yahel, Havatzelet (2006): The State and the Arab Sector: Land Disputes between the Negev
Bedouin and Israel, Israel Studies, 11(2):1-22.
Yin, R.K. (2009).Case Study Research.Design and Methods. 4. ed. Thousand Oaks,
California.
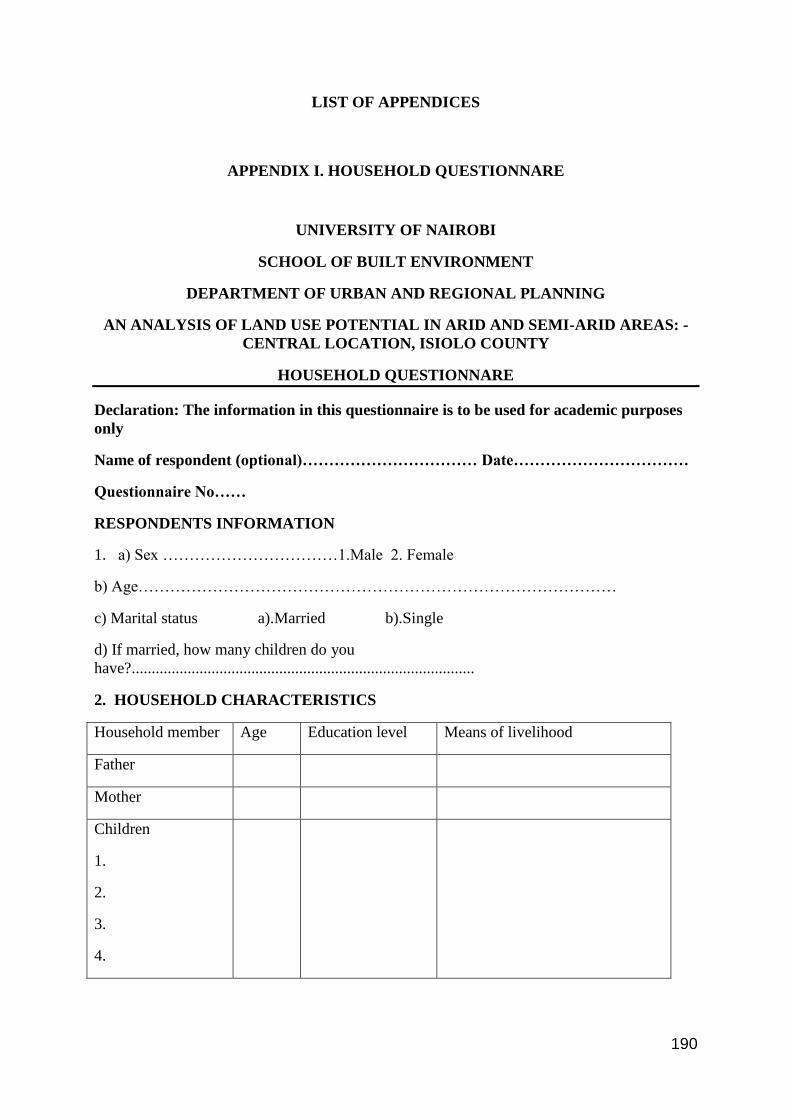
190
LIST OF APPENDICES
APPENDIX I. HOUSEHOLD QUESTIONNARE
UNIVERSITY OF NAIROBI
SCHOOL OF BUILT ENVIRONMENT
DEPARTMENT OF URBAN AND REGIONAL PLANNING
AN ANALYSIS OF LAND USE POTENTIAL IN ARID AND SEMI-ARID AREAS: -
CENTRAL LOCATION, ISIOLO COUNTY
HOUSEHOLD QUESTIONNARE
Declaration: The information in this questionnaire is to be used for academic purposes
only
Name of respondent (optional)…………………………… Date……………………………
Questionnaire No……
RESPONDENTS INFORMATION
1. a) Sex ……………………………1.Male 2. Female
b) Age………………………………………………………………………………
c) Marital status a).Married b).Single
d) If married, how many children do you
have?......................................................................................
2. HOUSEHOLD CHARACTERISTICS
Household member Age Education level Means of livelihood
Father
Mother
Children
1.
2.
3.
4.
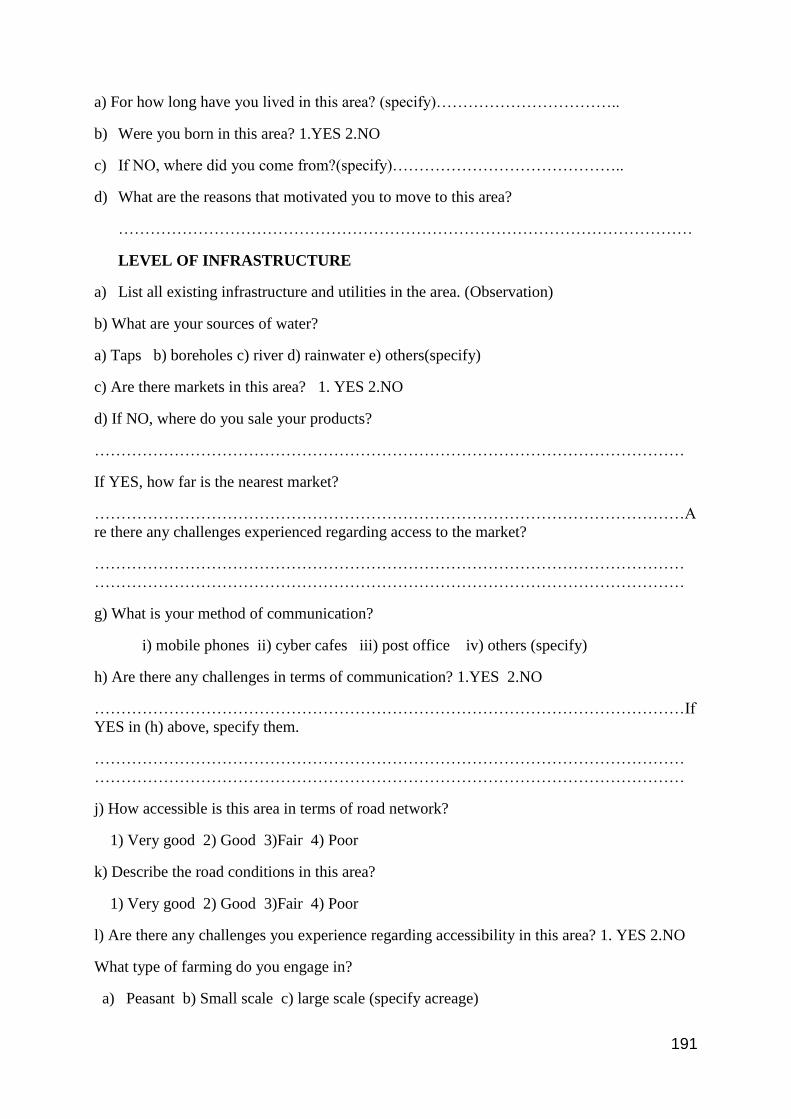
191
a) For how long have you lived in this area? (specify)……………………………..
b) Were you born in this area? 1.YES 2.NO
c) If NO, where did you come from?(specify)……………………………………..
d) What are the reasons that motivated you to move to this area?
………………………………………………………………………………………………
LEVEL OF INFRASTRUCTURE
a) List all existing infrastructure and utilities in the area. (Observation)
b) What are your sources of water?
a) Taps b) boreholes c) river d) rainwater e) others(specify)
c) Are there markets in this area? 1. YES 2.NO
d) If NO, where do you sale your products?
…………………………………………………………………………………………………
If YES, how far is the nearest market?
…………………………………………………………………………………………………A
re there any challenges experienced regarding access to the market?
…………………………………………………………………………………………………
…………………………………………………………………………………………………
g) What is your method of communication?
i) mobile phones ii) cyber cafes iii) post office iv) others (specify)
h) Are there any challenges in terms of communication? 1.YES 2.NO
…………………………………………………………………………………………………If
YES in (h) above, specify them.
…………………………………………………………………………………………………
…………………………………………………………………………………………………
j) How accessible is this area in terms of road network?
1) Very good 2) Good 3)Fair 4) Poor
k) Describe the road conditions in this area?
1) Very good 2) Good 3)Fair 4) Poor
l) Are there any challenges you experience regarding accessibility in this area? 1. YES 2.NO
What type of farming do you engage in?
a) Peasant b) Small scale c) large scale (specify acreage)
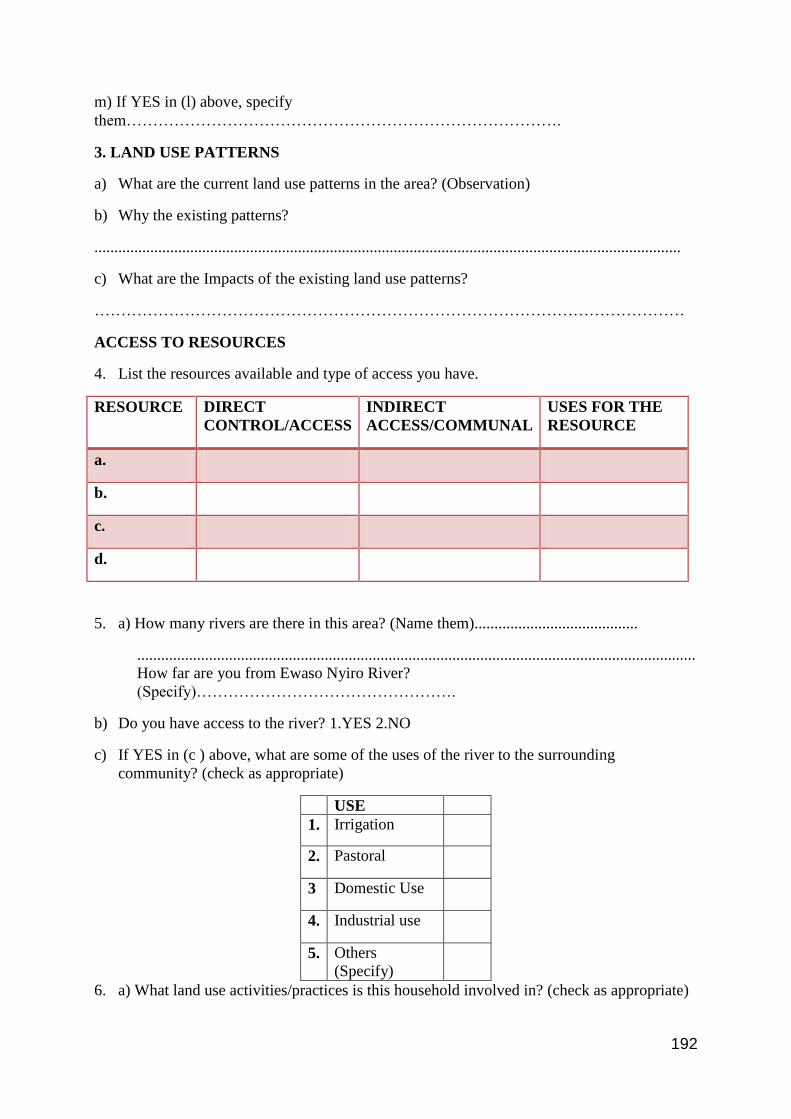
192
m) If YES in (l) above, specify
them……………………………………………………………………….
3. LAND USE PATTERNS
a) What are the current land use patterns in the area? (Observation)
b) Why the existing patterns?
...................................................................................................................................................
c) What are the Impacts of the existing land use patterns?
…………………………………………………………………………………………………
ACCESS TO RESOURCES
4. List the resources available and type of access you have.
RESOURCE DIRECT
CONTROL/ACCESS
INDIRECT
ACCESS/COMMUNAL
USES FOR THE
RESOURCE
a.
b.
c.
d.
5. a) How many rivers are there in this area? (Name them).........................................
............................................................................................................................................
How far are you from Ewaso Nyiro River?
(Specify)………………………………………….
b) Do you have access to the river? 1.YES 2.NO
c) If YES in (c ) above, what are some of the uses of the river to the surrounding
community? (check as appropriate)
USE
1. Irrigation
2. Pastoral
3 Domestic Use
4. Industrial use
5. Others
(Specify)
6. a) What land use activities/practices is this household involved in? (check as appropriate)
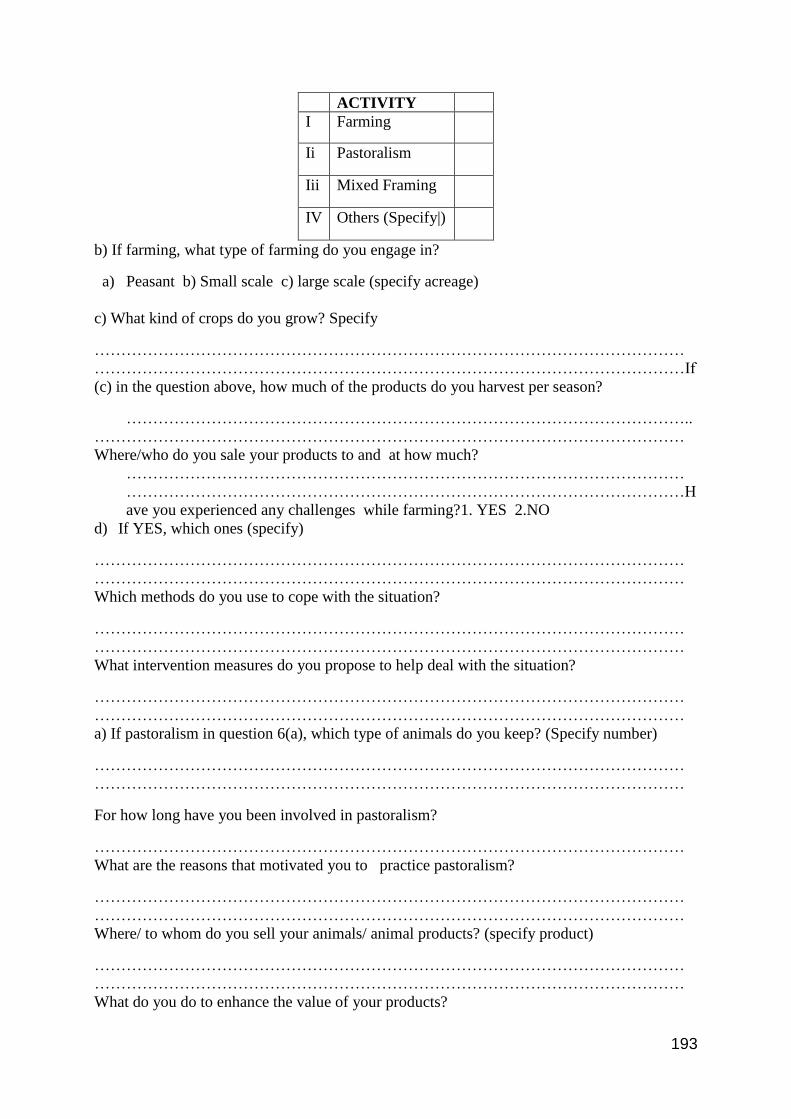
193
ACTIVITY
I Farming
Ii Pastoralism
Iii Mixed Framing
IV Others (Specify|)
b) If farming, what type of farming do you engage in?
a) Peasant b) Small scale c) large scale (specify acreage)
c) What kind of crops do you grow? Specify
…………………………………………………………………………………………………
…………………………………………………………………………………………………If
(c) in the question above, how much of the products do you harvest per season?
……………………………………………………………………………………………..
…………………………………………………………………………………………………
Where/who do you sale your products to and at how much?
……………………………………………………………………………………………
……………………………………………………………………………………………H
ave you experienced any challenges while farming?1. YES 2.NO
d) If YES, which ones (specify)
…………………………………………………………………………………………………
…………………………………………………………………………………………………
Which methods do you use to cope with the situation?
…………………………………………………………………………………………………
…………………………………………………………………………………………………
What intervention measures do you propose to help deal with the situation?
…………………………………………………………………………………………………
…………………………………………………………………………………………………
a) If pastoralism in question 6(a), which type of animals do you keep? (Specify number)
…………………………………………………………………………………………………
…………………………………………………………………………………………………
For how long have you been involved in pastoralism?
…………………………………………………………………………………………………
What are the reasons that motivated you to practice pastoralism?
…………………………………………………………………………………………………
…………………………………………………………………………………………………
Where/ to whom do you sell your animals/ animal products? (specify product)
…………………………………………………………………………………………………
…………………………………………………………………………………………………
What do you do to enhance the value of your products?

194
…………………………………………………………………………………………………
…………………………………………………………………………………………………
What challenges do you experience while practicing pastoralism?
…………………………………………………………………………………………………
…………………………………………………………………………………………………
What coping mechanisms do you use to cope with the situation?
…………………………………………………………………………………………………
What do you suggest should be done?
…………………………………………………………………………………………………
…………………………………………………………………………………………………
What are the overall consequences of the current resource use and land use practices in this
area?
…………………………………………………………………………………………………
………………..…………………………………………………………………………………
CHALLENGES IN RESOURCE UTILIZATION
Resource
type
Challenge
Experienced
Duration What has
been
done
Actor Effectiveness Way forward
a.
b.
c.
d.
e.
On effectiveness of the actions done, insert numbers as follows:- 1. Very Effective
2.Effective 3.Not effective
7. What are the overall development challenges in this area?
USE
1. Food insecurity
2. Drought
3 Insecurity
4. Uncertain land
tenure
5. Poverty
6. Others (Specify|)
8. In your opinion, what do you think is the future of Isiolo?
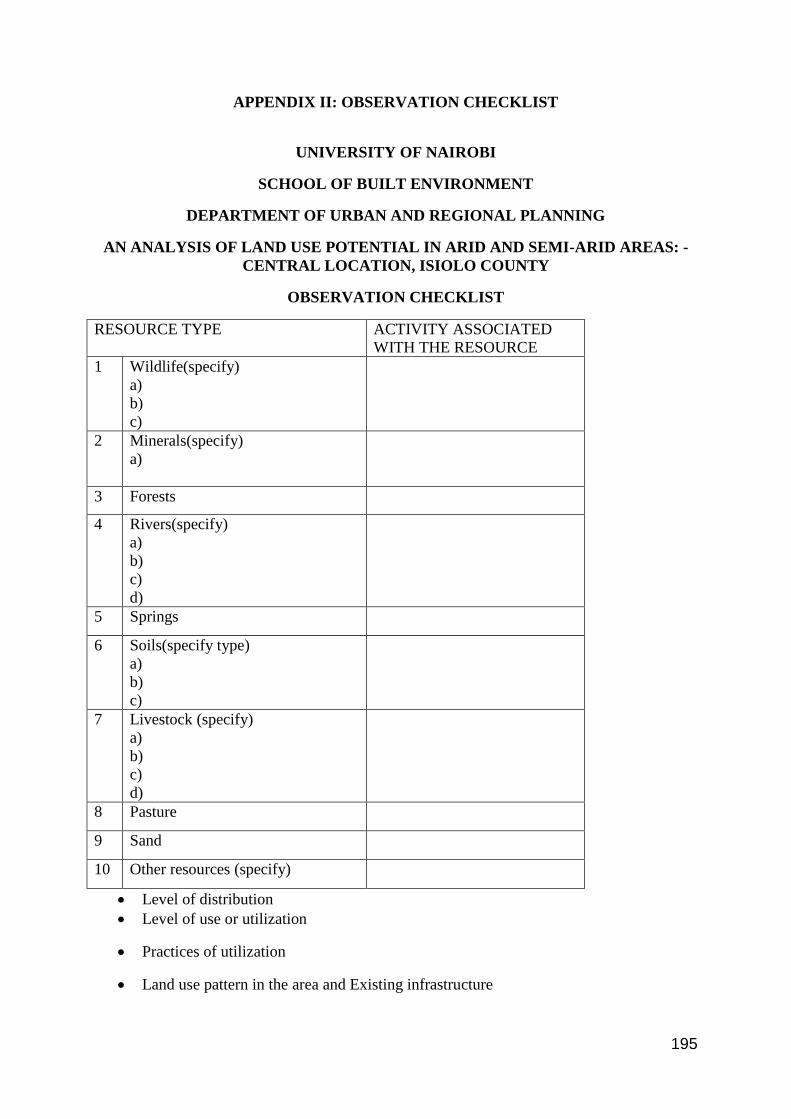
195
APPENDIX II: OBSERVATION CHECKLIST
UNIVERSITY OF NAIROBI
SCHOOL OF BUILT ENVIRONMENT
DEPARTMENT OF URBAN AND REGIONAL PLANNING
AN ANALYSIS OF LAND USE POTENTIAL IN ARID AND SEMI-ARID AREAS: -
CENTRAL LOCATION, ISIOLO COUNTY
OBSERVATION CHECKLIST
RESOURCE TYPE ACTIVITY ASSOCIATED
WITH THE RESOURCE
1 Wildlife(specify)
a)
b)
c)
2 Minerals(specify)
a)
3 Forests
4 Rivers(specify)
a)
b)
c)
d)
5 Springs
6 Soils(specify type)
a)
b)
c)
7 Livestock (specify)
a)
b)
c)
d)
8 Pasture
9 Sand
10 Other resources (specify)
Level of distribution
Level of use or utilization
Practices of utilization
Land use pattern in the area and Existing infrastructure

196
APPENDIX III: INTERVIEW SCHEDULE FOR INSTITUTIONS
UNIVERSITY OF NAIROBI
SCHOOL OF BUILT ENVIRONMENT
DEPARTMENT OF URBAN AND REGIONAL PLANNING
AN ANALYSIS OF LAND USE POTENTIAL IN ARID AND SEMI-ARID AREAS: -
CENTRAL LOCATION, ISIOLO COUNTY
INTERVIEW SCHEDULE FOR INSTITUTIONS
Declaration: The information in this questionnaire is to be used for academic purposes only
Name of Respondent (optional)…………………………… Date……………………………
1. What development activities are you involved in as an institution?
2. What are the existing natural resources in this area?
3. What are the most prevalent land use and practices in this area? (Differentiate between
land use and Land use practices)
4. How have the existing resources influenced land use patterns and land use practices in
this area?
5. What factors have contributed to the existing land use patterns and practices?
6. What challenges hinder optimal utilization of existing resources in this area?
7. What are the effects of the existing land use patterns and practices to growth of this
area?
8. What are the development challenges arising from utilization of available resources
(land, and water, sunshine, wildlife) and others experienced in this area?
9. For how long have the above challenges existed?
10. Are there any interventions that have been undertaken? And by who?(specify the
actor)
11. How adequate have the intervention measures been? if not adequate, what do you
propose should be done?
12. What role have you played to ensure optimal utilization of existing resources in this
area?
13. What land use form or structure can be congruent to optimal resource use in this area?
14. In your opinion, what do you think can be done to ensure optimal exploitation of
existing potential in this area? And what in your opinion is the future of Isiolo?
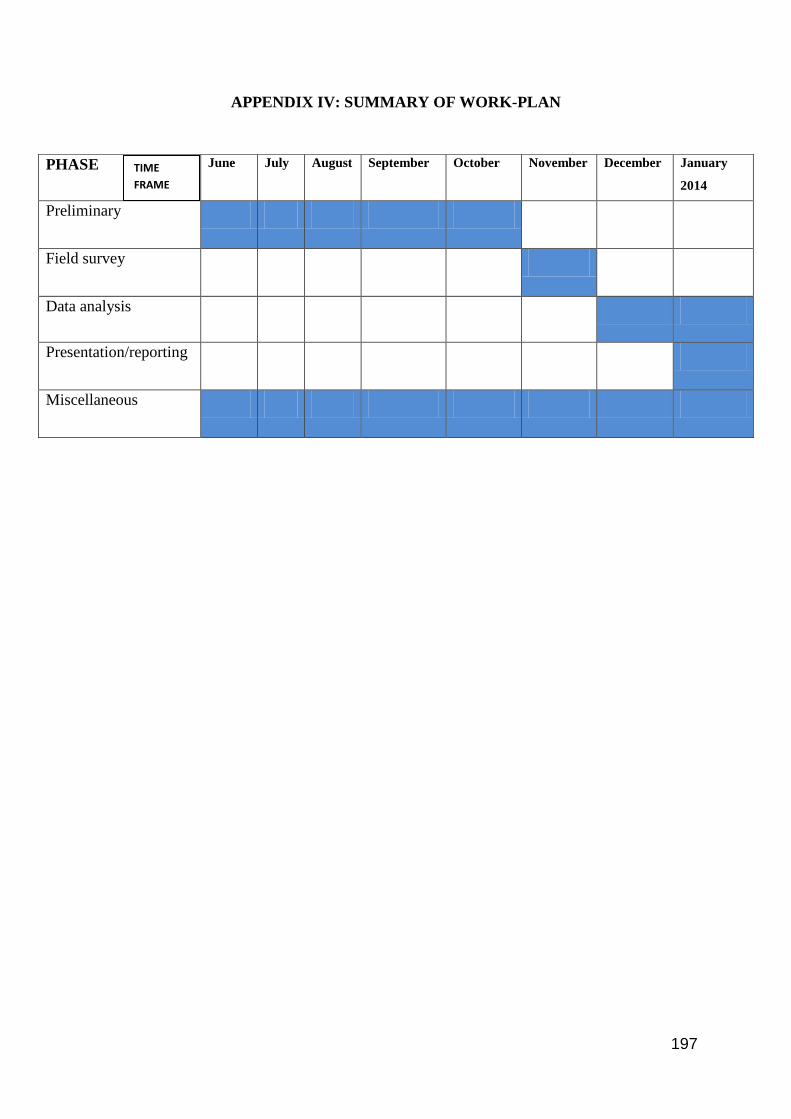
197
APPENDIX IV: SUMMARY OF WORK-PLAN
PHASE June July August September October November December January
2014
Preliminary
Field survey
Data analysis
Presentation/reporting
Miscellaneous
TIME
FRAME

198
APPENDIX V: PROJECT BUDGET AND TIME-TABLE
PHASE ACTIVITY DESCRIPTION INPUTS
(RESOURCE
S)
AMOU
NT
(KSHS)
TIM
E
FRA
ME
ANTICIPATED
OUTPUT
Preliminary Proposal writing Buying of documents for
literature review
Internet browsing for
more literature
Printing of research
proposal
Carrying out a pilot
study
Printing of research
instruments
Researcher&
assistants
Modem
Printing
materials
Fuel
20,000.0
0
4mont
hs
An approved
research proposal
2no.trained
research assistants
Ready Research
instruments
Field survey Data collection Obtaining a camera
(1no.)
Travel expenses
Data collection
Consultation
Organising for
workshops (5no.)
Camera, tape
recorder
Fuel
Researcher &
assistants
Venues for
workshops
120,000.
00
4
weeks
Raw data,
photographs etc
5no. workshops
with stakeholders
Analysis Data analysis
Data cleaning, editing
and coding
New SPSS &
GIS softwares
Researcher
assistants
35,000.0
0
4wee
ks
Processed data
Presentation
&Reporting
Dissemination Printing of draft report
Printing coloured A3 &
A1 layouts for
presentation
Printing of 10no.copies
of the final report
Printing
materials
15,000.0
0
2
weeks
Power point
Presentation
Final project
report
Others Miscellaneous Making phone calls to
participants to confirm
appointments; phone
calls to research
assistants and other
relevant stakeholders
Airtime/credit
Refreshments
Participant
allowances(tok
ens)
10,000.0
0
Conti
nuous
Efficiency
Support provided
to research
assistants as
needed.
Comfortable
participants

199
APPENDIX VI: THE INTEGRATED MODEL