Embed Size (px)
Citation preview

International Journal of Marketing & Financial Management, Volume 4, Issue 7, Oct-2016, pp 36-52
ISSN: 2348 –3954 (Online) ISSN: 2349 –2546 (Print),
Contact Us : [email protected] ; submit paper : [email protected] download full paper : www.arseam.com 36
www.arseam.com
Impact Factor: 1.13
AN ANALYSIS OF INDIAN PRIVATE SECTOR
BANKS USING CAMEL APPROACH
Bhanwar Singh
Ph.D Research Scholar
Institute of Management Studies &
Research
Maharshi Dayanand University, Rohtak
(India)
Pawan
Ph.D Research Scholar
Institute of Management Studies &
Research
Maharshi Dayanand University, Rohtak
(India)
ABSTRACT
Financial institutions are paramount tools in economy to boost the economic growth,
especially banks are one of them. After the economic reforms 1991, Liberalization,
privatization, globalization (LPG) growth of private sector banks increase tremendously.
Private Banks contributes significantly in growth of economy. Initially banks are only limited
to deposits and credits but today banks are perform various functions. Before to privatization
of banks all financial needs of corporate and individual are meet by public sector banks but
after privatization private sector banks also not behind the public sector banks to provide the
credit facilities and other non banking services to individual and corporate. Many studies
revels that private sector banks are better perform to public sector bank in terms of NPA
management, profit making and other so more. To know the financial performance of private
sector banks present study is conducted. In present study, researcher takes a sample of 5
private sector banks namely ICICI Bank, Axis Bank, HDFC Bank, Yes Bank, Indusland Bank
and try to understand and analysis the financial performance and soundness of selected
private sector banks during 2011-2016 through CAMEL methodology. CAMEL is an
acronym where C- Capital Adequacy, A- Assets Quality, M- Management Efficiency, E-
Earning Efficiency, L- Liquidity. Data used in study purely in secondary nature and collected
from annual reports of respective banks, journal articles and other published documents.
Keywords: Indian private sector banks, financial performance, CAMEL
INTRODUCTION
Financial institutions are paramount tools in economy to boost the economic growth,
especially banks are one of them financial institution. After the economic reforms 1991,
Liberalization, privatization, globalization (LPG) growth of private sector banks increase
tremendously. Private Banks contributes significantly in growth of economy. Initially banks
are only limited to deposits and credits but today banks are perform various functions. Before
to privatization of banks all financial needs of corporate and individual are meet by public
sector banks but after privatization private sector banks also not behind the public sector
banks to provide the credit facilities and other non banking services to individual and
corporate. Many studies revels that private sector banks are better perform to public sector
bank in terms of NPA management, profit making and other so more.
Bhanwar Singh & Pawan / An Analysis of Indian Private Sector Banks Using CAMEL Approach
Contact Us : [email protected] ; submit paper : [email protected] download full paper : www.arseam.com 37
The banking sector’s performance is perceived as the replica of economic activities of the
economy. The stage of development of the banking industry is a good reflection of the
development of the economy. There is a substantial improvement over the earlier supervisory
system of banking sector in terms of recovery, management efficiency, assets quality, earning
quality and internal control system to regulate the level of risk and financial viability of
commercial banks. The regulators have augmented bank supervision by using CAMEL
(capital adequacy, asset quality, management quality, earnings and liquidity) rating criterion
to assess and evaluate the performance and financial soundness of the activities of the bank.
The CAMEL supervisory criterion in banking sector is a significant and considerable
improvement over the earlier criterions in terms of frequency, check, spread over and
concentration. During this period, the banking sector has experienced a paradigm change and
it was the time to make performance appraisal of operations. Reserve Bank of India
recommended two supervisory rating models named as CAMELS (Capital Adequacy, Assets
Quality, Management, Earning, Liquidity, Systems and Controls) and CACS (Capital
Adequacy, Assets Quality, Compliance, Systems and Controls) for rating of Indian
commercial Banks and Foreign Banks operating in India (Misra & Aspal, 2013).
REVIEW OF LITERATURE
Review of literature provides the roadmap to researcher who wants to study the problem and
reveals the undisclosed facts and results. There have vast literature on financial performance
analysis of banks through ratio analysis only but limited by CAMEL methodology.
Researcher reviews the published literature on financial performance analysis through
CAMEL methodology prior to conduct of research article.
Svetlana Tatuskar (2010) analyzed the financial performance of selected Indian scheduled
bank through CAMEL model. They had taken a sample of five banks namely ICICI bank,
SBI, Axis bank, HDFC bank and BOI for study purpose. This study found that public sector
banks like BOI had done remarkable well on every CAMEL parameter. In the case of private
sector banks ICICI bank was outperformed the other private sector banks. Study show that
public sector bank should formulate strong structure to recover of bad-assets.
Sushendra Kumar Misra and Parvesh Kumar Aspal (2013) conducted a study to evaluate the
performance & financial soundness of State Bank Group using CAMEL approach. In this
study, researchers evaluate and financial performance of through twenty ratio from the year
2009-2011. They found It is found that in terms of Capital Adequacy parameter SBBJ and
SBP were at the top position, while SBI got lowest rank. In terms of Asset Quality parameter,
SBBJ held the top rank while SBI held the lowest rank. Under Management efficiency
parameter it was observed that top rank taken by SBT and lowest rank taken by SBBJ. In
terms of Earning Quality parameter the capability of SBM got the top rank while SBP was at
the lowest position. Under the Liquidity parameter SBI stood on the top position and SBM
was on the lowest position. SBI needs to improve its position with regard to asset quality and
capital adequacy, SBBJ should improve its management efficiency and SBP should improve

International Journal of Marketing & Financial Management, Volume 4, Issue 7, Oct-2016, pp 36-52
ISSN: 2348 –3954 (Online) ISSN: 2349 –2546 (Print),
Contact Us : [email protected] ; submit paper : [email protected] download full paper : www.arseam.com 38
its earning quality. They also employed ANOVA statistic to test hypothesis. By ANOVA
result they found there have no significant difference in performance of SBI and its associate
banks.
An another study conducted by Santosh Kumar and Roopali Sharma (2014) to evaluate
performance of top Indian bank through CAMEL methodology. In research study, they
decided to evaluate the top 8 market capitalized banks. Kotak Mahindra Bank is on to
position in term of capital adequacy. They also found that SBI had highest NPA among their
peer banks. They opinion that earning quality of SBI and PNB was on top. They concluded
from the study that Kotal Mahindra and ICICI bank was most efficient in managing their
liquidity.
Ruchi Gupta (2014) analyzed performance of Indian public sector banks using Camel
approach for a five year period from 2009-13. They included all the 26 public sector banks in
study. Inclusion of all 26 public sector banks in study, research tried to effetely measure the
financial soundness of banks. Researcher employed the F-test and one way ANOVA for
analysis and interpretation. The study revealed fact that there is a significant difference
among overall performance of public sector banks. They also concluded that the banks with
least ranking need to improve their performance to come up to the desired standards.
Mikail Altan, Habib Yusufazari & Aykut Beduk (2014) tried to attempt evaluate and
analyzed performance of banks in Turkey using camel model. They have chosen three State-
Owned banks and twelve Private-Owned banks from the Turkish banking sector, which
represent more than seventy percent of the banking system in terms of total assets. They
evaluated the financial performance of turkey banks through 23 ratios relating to CAMEL
Model. They found that on the overall performance of, Ziraat Bank was on the top position
followed by AK Bank and Vakit Bank. Study reveals fact that there is a significant difference
between performance of state-owned and private-owned banks in Turkey
OBJECTIVE
Objectives of study are follows:
Understand qualitative as well as quantitative factors for evaluating financial Banks
To find the adequacy of CAMEL in capturing the overall performance of a Bank
Analyze financial institutions and assign overall ratings through CAMEL model
RESEARCH METHODOLOGY
In this present study, an effort has been made to assess, evaluate and compare the financial
performance of selected private sector banks. The present study of banks based on CAMEL
methodology, which evaluates each and every component that is of important from the
functioning of the Bank’s perspective. The present study based on purely secondary data that

Bhanwar Singh & Pawan / An Analysis of Indian Private Sector Banks Using CAMEL Approach
Contact Us : [email protected] ; submit paper : [email protected] download full paper : www.arseam.com 39
has been collected from annual reports of banks, magazines, articles published in journals,
other published documents and websites have been chosen when found relevant. The study
covers the period of 5 years i.e. year 2010-11 to year 2014-15. All the banks are ranked in the
ascending/descending order based on individual bank sub-parameters.
The study includes comparison among following banks:
ICICI Bank
Axis Bank
HDFC Bank
Yes Bank
Indusland Bank
DATA ANALYSIS AND INTERPRETATION
CAMEL Model
1. Capital Adequacy
Capital adequacy is very prominent indicator to measure the financial strength of banking
sector. High capital adequacies give enough confidence to stakeholders for their capital
security. Capital adequacy shows the strength of bank to bear unexpected losses arise in near
future.
i. Capital Adequacy Ratio(CAR)
Capital Adequacy Ratio
Year
Banks
ICICI Bank Axis Bank HDFC Bank Yes Bank Indusland Bank
2010-11 19.54 12.65 16.22 16.50 15.89
2011-12 18.52 13.66 16.52 17.90 13.85
2012-13 18.74 17.00 16.80 18.30 15.36
2013-14 17.70 16.07 16.07 14.40 13.83
2014-15 17.02 15.09 16.79 15.60 12.09
Mean 18.30 14.89 16.48 16.54 14.20
Rank 1 4 3 2 5
Source: Compiled from annual report of selected private banks.
It is found from the table that ICICI Bank (18.30) is No.1 in CAR followed by Yes (16.54)
and HDFC Bank (16.48). Axis Bank also able to maintain mandatory CAR but stood on 4th
rank. Indusland Bank gets lowest rank on CAR parameter.

International Journal of Marketing & Financial Management, Volume 4, Issue 7, Oct-2016, pp 36-52
ISSN: 2348 –3954 (Online) ISSN: 2349 –2546 (Print),
Contact Us : [email protected] ; submit paper : [email protected] download full paper : www.arseam.com 40
ii. Debt – Equity Ratio
Year
Debt to Equity Ratio (%)
Banks
ICICI Bank Axis Bank HDFC Bank Yes Bank Indusland Bank
2010-11 6.08 11.34 8.79 13.87 9.87
2011-12 6.55 11.14 9.04 13.54 10.79
2012-13 6.57 8.96 9.09 15.13 8.34
2013-14 6.65 8.67 9.36 13.41 8.33
2014-15 6.64 9.00 8.00 10.05 8.91
Mean 6.50 9.82 8.85 13.20 9.25
Rank 1 4 2 5 3
Source: Compiled from annual report of selected private banks.
Table show the Debt-Equity ratio of selected banks. ICICI Bank (6.50) gets 1st rank on Debt-
Equity ratio which shows lower leverage of bank followed by HDFC Bank and Indusland
Bank. Axis Bank and Yes Bank get 4th
and 5th
rank on Debt- Equity ratio which indicates
these banks are maintaining high leverage.
iii. Advance to Assets Ratio
Year
Advances to Assets
Banks
ICICI Bank Axis Bank HDFC Bank Yes Bank Indusland Bank
2010-11 0.53 0.59 0.58 0.58 0.57
2011-12 0.52 0.59 0.58 0.52 0.61
2012-13 0.54 0.58 0.61 0.47 0.60
2013-14 0.57 0.60 0.62 0.51 0.63
2014-15 0.60 0.61 0.62 0.55 0.63
Mean 0.55 0.59 0.60 0.53 0.61
Rank 4 3 2 5 1
Source: Compiled from annual report of selected private banks.
Table indicates that Indusland Bank (1st) is very aggressive to lend its deposits to advance
seekers which also mean that Indusland bank generating high profitability. HDFC (2nd
) and
Axis Bank (3rd
) also performing good on advances to assets ratio compare to rivals ICICI
(4th
) and Yes banks (5th
).

Bhanwar Singh & Pawan / An Analysis of Indian Private Sector Banks Using CAMEL Approach
Contact Us : [email protected] ; submit paper : [email protected] download full paper : www.arseam.com 41
iv. Government Securities to Total Investment
Year
Government Securities to Total Investment (%)
Banks
ICICI Bank Axis Bank HDFC Bank Yes Bank Indusland Bank
2010-11 48.27 61.39 75.64 57.08 73.96
2011-12 54.77 62.81 78.19 58.29 81.68
2012-13 54.28 63.76 76.07 66.41 71.78
2013-14 54.17 61.30 78.25 54.77 71.33
2014-15 57.56 62.13 72.32 64.37 72.03
Mean 53.81 62.28 76.09 60.18 74.15
Rank 5 3 1 4 2
Source: Compiled from annual report of selected private banks.
Table shows the government securities to total investment ratio. HDFC bank (1st) has
invested its large part of total investment in the risk free government securities which indicate
bank has strong risk free investment strategy. Indusland (2nd
) and Axis Bank (3rd
) also have
good risk free investment strategies. Yes and ICICI bank get 4th
and 5th
rank respectively.
Composite Capital Adequacy
Bank CAR
Debt-
Equity
Ratio
Advance to
Assets Ratio
Government
Securities to
Total Investment
Group Rank
Rank Rank Rank Rank Average Rank
ICICI 1 1 4 5 2.75 2.5
Axis 4 4 3 3 3.5 4
HDFC 3 2 2 1 2 1
Yes 2 5 5 4 4 5
Indusland 5 3 1 2 2.75 2.5
On the basis of composite capital adequacy HDFC Bank get 1st position followed by ICICI
and Indusland Bank combined 2.5 ranks. Axis and Yes bank got lowest rank 4th
and 5th
respectively. Reasons behind Yes lowest rank are the poor performance on Debt-Equity ratio
and advance to assets ratio.
2. Assets Quality
Assets quality is an important financial indicator to measure the financial strength and health
of banking sector. The objective behind the check assets quality is to know quality of assets

International Journal of Marketing & Financial Management, Volume 4, Issue 7, Oct-2016, pp 36-52
ISSN: 2348 –3954 (Online) ISSN: 2349 –2546 (Print),
Contact Us : [email protected] ; submit paper : [email protected] download full paper : www.arseam.com 42
of bank, assets quality give indication that baking strength to employed assets in profitable
project or not.
i. Net NPAs to Total Assets Ratio
Year
Net NPA's to Total Assets (%)
Banks
ICICI Bank Axis Bank HDFC Bank Yes Bank Indusland Bank
2010-11 0.59 0.02 0.11 0.02 0.16
2011-12 0.39 0.17 0.10 0.02 0.16
2012-13 0.42 0.21 0.12 0.01 0.19
2013-14 0.55 0.27 0.17 0.02 0.21
2014-15 0.97 0.29 0.15 0.06 0.19
Mean 0.58 0.19 0.13 0.03 0.18
Rank 5 4 2 1 3
Source: Compiled from annual report of selected private banks.
Table show that Yes Bank gets 1st position followed by HDFC (2
nd) rank and Indusland Bank
(3rd
) rank on Net NPAs to Total Assets. Performance of Axis (4th
) and ICICI (5th
) is poor on
Net NPAs to Total Assets ratio.
ii. Net NPAs to Net Advances Ratio
Year
Net NPA's to Net Advances (%)
Banks
ICICI Bank Axis Bank HDFC Bank Yes Bank Indusland Bank
2010-11 1.11 0.29 0.19 0.03 0.28
2011-12 0.73 0.28 0.18 0.05 0.27
2012-13 0.77 0.36 0.20 0.01 0.31
2013-14 0.97 0.44 0.27 0.05 0.33
2014-15 1.61 0.46 0.25 0.12 0.31
Mean 1.04 0.37 0.22 0.05 0.30
Rank 5 4 2 1 3
Source: Compiled from annual report of selected private banks.
Table show that Yes Bank gets 1st position followed by HDFC (2
nd) rank and Indusland Bank
(3rd
) rank on Net NPAs to Net Advances. Performance of Axis (4th
) and ICICI (5th
) is poor on
Net NPAs to Net Advances ratio. Table also indicates that Yes bank have powerful strategies
to employed advances in secure hands.
iii. Total Investment to Total Assets Ratio (%)

Bhanwar Singh & Pawan / An Analysis of Indian Private Sector Banks Using CAMEL Approach
Contact Us : [email protected] ; submit paper : [email protected] download full paper : www.arseam.com 43
Year
Total Investment to Total Assets Ratio (%)
Banks
ICICI Bank Axis Bank HDFC Bank Yes Bank Indusland Bank
2010-11 33.15 29.66 25.52 31.91 29.69
2011-12 32.63 32.63 28.58 37.68 25.30
2012-13 31.93 33.40 27.88 43.36 26.81
2013-14 29.77 29.63 24.60 37.56 24.78
2014-15 28.88 28.65 28.19 34.23 22.78
Mean 31.27 30.79 26.95 36.94 25.87
Rank 4 3 2 5 1
Source: Compiled from annual report of selected private banks.
Table indicates that financial performance of Indusland Bank followed by HDFC and Axis
Bank is good on total investment to total assets ratio. These banks follow sage guard
investment policy to protect its depositors. Indusland Bank get 1st rank followed HDFC and
Axis Bank 2nd
and 3rd
ranks respectively. ICICI and Yes Bank get lowest rank 4th
and 5th
banks.
Composite Assets Quality
Bank
Net NPAs to Total
Assets Ratio
Net NPA's to
Net Advances
Ratio
Total
Investment to
Total Assets
Ratio
Group Rank
Rank Rank Rank Average Rank
ICICI 5 5 4 4.67 5
Axis 4 4 3 3.67 4
HDFC 2 2 2 2.00 1
Yes 1 1 5 2.33 2.5
Indusland 3 3 1 2.33 2.5
Above table show overall assets quality rank for banks. HDFC bank gets 1st rank on overall
composite assets quality followed by Yes and Indusland Bank rank 2.5 equally. Axis and
ICICI bank is the poor performer on composite assets quality. HDFC Bank performs well on
net NPAs to total assets ratio and Net NPAs to Net Advances ratio. Yes bank performs better
on above financial parameters. ICICI and Axis bank perform poor on above assets quality
parameters.
3. Management Efficiency
Management efficiency is third component of the CAMEL model that measures the growth
and management efficiency of bank to generate business and profitability. Management

International Journal of Marketing & Financial Management, Volume 4, Issue 7, Oct-2016, pp 36-52
ISSN: 2348 –3954 (Online) ISSN: 2349 –2546 (Print),
Contact Us : [email protected] ; submit paper : [email protected] download full paper : www.arseam.com 44
efficiency shows that how much bank management or administrative is able to generate
business and profits.
i. Total Advances to Total Deposits Ratio
Year
Total Advances to Total Deposits Ratio
Banks
ICICI Bank Axis Bank HDFC Bank Yes Bank Indusland Bank
2010-11 0.96 0.75 0.77 0.75 0.76
2011-12 0.99 0.77 0.79 0.77 0.83
2012-13 0.99 0.78 0.81 0.70 0.82
2013-14 0.95 0.82 0.82 0.75 0.91
2014-15 0.99 0.87 0.81 0.83 0.93
Mean 0.98 0.80 0.80 0.76 0.85
Rank 1 3.5 3.5 5 2
Source: Compiled from annual report of selected private banks.
Above table show that ICICI bank gets top 1st rank on total advances to total deposits ratio
which indicate that bank is flexible to providing advances out of its total deposits. ICICI bank
is flexible to disburse 98% total deposits. Indusland bank also flexible to providing advances
to loan seeker. Indusland bank gets 2nd
rank on above total advances to total deposits ratio
followed by Axis and HDFC bank. Yes bank is conservative in disburse of total deposits and
poor performer on above parameters.
ii. Return on Net Worth Ratio
Year
Return on Net Worth
Banks
ICICI Bank Axis Bank HDFC Bank Yes Bank Indusland Bank
2010-11 9.35 17.84 15.47 19.17 14.28
2011-12 10.70 18.60 17.27 20.89 16.97
2012-13 12.48 15.64 18.57 22.40 13.93
2013-14 13.40 16.27 19.50 22.72 15.59
2014-15 13.90 16.47 16.47 17.17 16.87
Mean 11.97 16.96 17.46 20.47 15.53
Rank 5 3 2 1 4
Source: Compiled from annual report of selected private banks.
Above table show the return on net worth ratio of banks from the year 2010-11 to 2014-15.
Yes bank generate average 20.47% return on its equity which is highest among its rival banks
and bank gets 1st rank on above parameter followed by HDFC and Axis Bank. Table shows

Bhanwar Singh & Pawan / An Analysis of Indian Private Sector Banks Using CAMEL Approach
Contact Us : [email protected] ; submit paper : [email protected] download full paper : www.arseam.com 45
that HDFC and Axis bank also good performer on above parameter. Indusland Bank is good
performer compare to its rival ICICI bank.
iii. Profit Per Employee
(Rs. Crore)
Year
Profit Per Employee
Banks
ICICI Bank Axis Bank HDFC Bank Yes Bank Indusland Bank
2010-11 10.00 14.00 7.37 20.89 8.24
2011-12 11.00 14.00 8.00 20.42 8.57
2012-13 11.00 15.00 10.00 21.02 9.22
2013-14 14.00 15.00 12.00 20.45 9.03
2014-15 16.00 17.00 10.00 20.96 9.38
Mean 12.40 15.00 9.47 20.75 8.89
Rank 3 2 4 1 5
Source: Compiled from annual report of selected private banks.
Above table shows profit per employee of banks. Table indicates that Yes Employee is very
well profit generator followed by Axis and ICICI bank. Yes, Axis and ICICI bank get 1st, 2
nd,
and 3rd
position respectively on above parameter. HDFC and Indusland Bank employee are
poor performing in generating profit per employee.
iv. Business Per Employee
(Rs. Crore)
Year
Business Per Employee
Banks
ICICI Bank Axis Bank HDFC Bank Yes Bank Indusland Bank
2010-11 7.35 13.66 6.53 22.20 8.44
2011-12 7.08 12.76 6.54 17.48 7.88
2012-13 7.35 12.15 7.5 17.74 8.41
2013-14 7.47 12.30 8.9 15.58 7.17
2014-15 8.32 13.71 10.1 16.86 7.19
Mean 7.51 12.91 7.91 17.97 7.81
Rank 5 2 3 1 4
Source: Compiled from annual report of selected private banks.
Above table show the business per employee for banks. Yes bank employees are well
performer on the above parameter. Yes bank gets 1st rank on above parameter followed by

International Journal of Marketing & Financial Management, Volume 4, Issue 7, Oct-2016, pp 36-52
ISSN: 2348 –3954 (Online) ISSN: 2349 –2546 (Print),
Contact Us : [email protected] ; submit paper : [email protected] download full paper : www.arseam.com 46
Axis and HDFC bank. HDFC, Indusland and ICICI bank Performance on the above
parameter averagely similar and poor.
Composite Management Efficiency
Bank
Total Advances to
Total Deposits
Ratio
Return on
Net Worth
Profit Per
Employee
Business
Per
Employee
Group Rank
Rank Rank Rank Rank Average Rank
ICICI 1 5 3 5 3.5 4
Axis 3.5 3 2 2 2.6 2
HDFC 3.5 2 4 3 3.1 3
Yes 5 1 1 1 2.0 1
Indusland 2 4 5 4 3.8 5
Above table shows composite earning quality. Yes bank is well performer on above
parameter. Yes bank gets top position on above parameters followed by Axis and HDFC
bank. Yes bank performs better on return on net worth, profit per employee and business per
employee. Axis bank gets 2nd
rank on above composite management efficiency and HDFC
bank gets 3rd
rank. ICICI (4th
) and Indusland bank (5th
) perform poor on management
efficiency component.
4. Earning Efficiency
The earning efficiency is another component of CAMEL model. Earning quality represents
the quality of bank’s profitability and bank capability to maintain quality and earn
consistently. Earning efficiency show the earning trends of banks its future prospects.
i. Percentage Growth in Net Profit
Year
Percentage Growth in net profit
Banks
ICICI Bank Axis Bank HDFC Bank Yes Bank Indusland Bank
2010-11 27.99 34.76 33.16 52.21 64.80
2011-12 25.51 25.19 31.60 34.40 39.02
2012-13 28.77 22.09 30.25 33.13 32.22
2013-14 17.84 20.05 26.00 24.40 32.68
2014-15 13.91 18.34 20.50 23.96 27.39
Mean 22.80 24.09 28.30 33.62 39.22
Rank 5 4 3 2 1
Source: Compiled from annual report of selected private banks.
Bhanwar Singh & Pawan / An Analysis of Indian Private Sector Banks Using CAMEL Approach
Contact Us : [email protected] ; submit paper : [email protected] download full paper : www.arseam.com 47
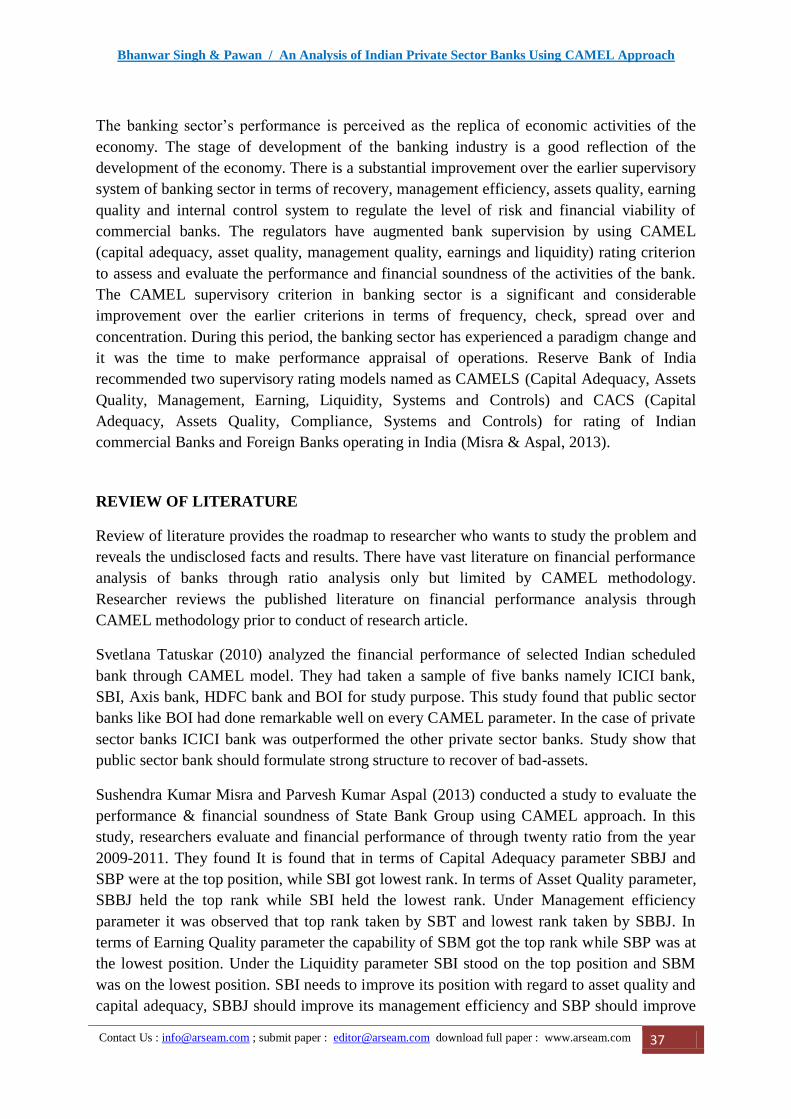
Above table show the trend in net profit. All banks show increasing trend in net profit.
Indusland bank gets the 1st rank among its rival on percentage growth in net profit. Indusland
bank shows average 39.22% growth in net profit. Yes and HDFC bank get 2nd
and 3rd
rank
respectively. Axis and ICICI bank show good performance on above parameter individually
but poor performer comparatively its rivals.
ii. Net Interest Margin
Year
Net Interest Margin (%)
Banks
ICICI Bank Axis Bank HDFC Bank Yes Bank Indusland Bank
2010-11 2.64 3.65 4.30 2.90 3.47
2011-12 2.73 3.59 4.20 2.80 3.33
2012-13 3.11 3.53 4.50 2.90 3.43
2013-14 3.33 3.81 4.40 2.90 3.71
2014-15 3.48 3.92 4.40 3.20 3.65
Mean 3.06 3.70 4.36 2.94 3.52
Rank 4 2 1 5 3
Source: Compiled from annual report of selected private banks.
Above table show the net interest margin for banks. HDFC bank gets 1st on above net interest
margin followed by its Axis, Indusland and ICICI bank 2nd
, 3rd
, 4th
rank respectively. Yes
bank performs poor on above parameter and gets lower rank.
iii. Net Profit to Total Assets Ratio
Year
Net Profit to Total Assets (%)
Banks
ICICI Bank Axis Bank HDFC Bank Yes Bank Indusland Bank
2010-11 0.97 1.40 1.42 1.23 1.27
2011-12 1.04 1.49 1.53 1.33 1.39
2012-13 1.23 1.52 1.68 1.31 1.45
2013-14 1.31 1.61 1.72 1.48 1.62
2014-15 1.35 1.57 1.73 1.47 1.64
Mean 1.18 1.52 1.62 1.37 1.47
Rank 5 2 1 4 3
Source: Compiled from annual report of selected private banks.
Above table show the net profit to total assets for banks. It is inferred from the table HDFC
bank is performing well on above net profit to total assets. HDFC bank gets top position
International Journal of Marketing & Financial Management, Volume 4, Issue 7, Oct-2016, pp 36-52
ISSN: 2348 –3954 (Online) ISSN: 2349 –2546 (Print),
Contact Us : [email protected] ; submit paper : [email protected] download full paper : www.arseam.com 48
followed by Axis and Indusland bank 2nd
and 3rd
rank respectively. Yes and ICICI bank gets
4th
and 5th
rank respectively on net profit to total assets ratio.
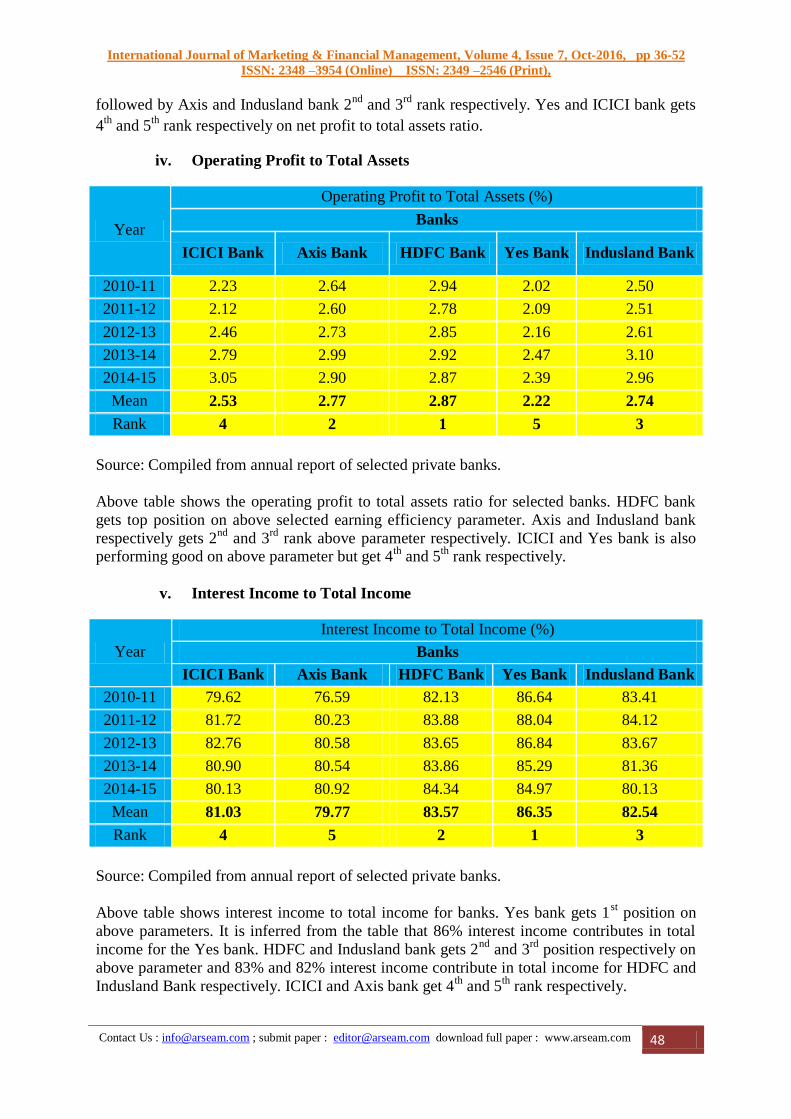
iv. Operating Profit to Total Assets
Year
Operating Profit to Total Assets (%)
Banks
ICICI Bank Axis Bank HDFC Bank Yes Bank Indusland Bank
2010-11 2.23 2.64 2.94 2.02 2.50
2011-12 2.12 2.60 2.78 2.09 2.51
2012-13 2.46 2.73 2.85 2.16 2.61
2013-14 2.79 2.99 2.92 2.47 3.10
2014-15 3.05 2.90 2.87 2.39 2.96
Mean 2.53 2.77 2.87 2.22 2.74
Rank 4 2 1 5 3
Source: Compiled from annual report of selected private banks.
Above table shows the operating profit to total assets ratio for selected banks. HDFC bank
gets top position on above selected earning efficiency parameter. Axis and Indusland bank
respectively gets 2nd
and 3rd
rank above parameter respectively. ICICI and Yes bank is also performing good on above parameter but get 4
th and 5
th rank respectively.
v. Interest Income to Total Income
Year
Interest Income to Total Income (%)
Banks
ICICI Bank Axis Bank HDFC Bank Yes Bank Indusland Bank
2010-11 79.62 76.59 82.13 86.64 83.41
2011-12 81.72 80.23 83.88 88.04 84.12
2012-13 82.76 80.58 83.65 86.84 83.67
2013-14 80.90 80.54 83.86 85.29 81.36
2014-15 80.13 80.92 84.34 84.97 80.13
Mean 81.03 79.77 83.57 86.35 82.54
Rank 4 5 2 1 3
Source: Compiled from annual report of selected private banks.
Above table shows interest income to total income for banks. Yes bank gets 1st position on
above parameters. It is inferred from the table that 86% interest income contributes in total
income for the Yes bank. HDFC and Indusland bank gets 2nd
and 3rd
position respectively on
above parameter and 83% and 82% interest income contribute in total income for HDFC and
Indusland Bank respectively. ICICI and Axis bank get 4th
and 5th
rank respectively.
Bhanwar Singh & Pawan / An Analysis of Indian Private Sector Banks Using CAMEL Approach
Contact Us : [email protected] ; submit paper : [email protected] download full paper : www.arseam.com 49
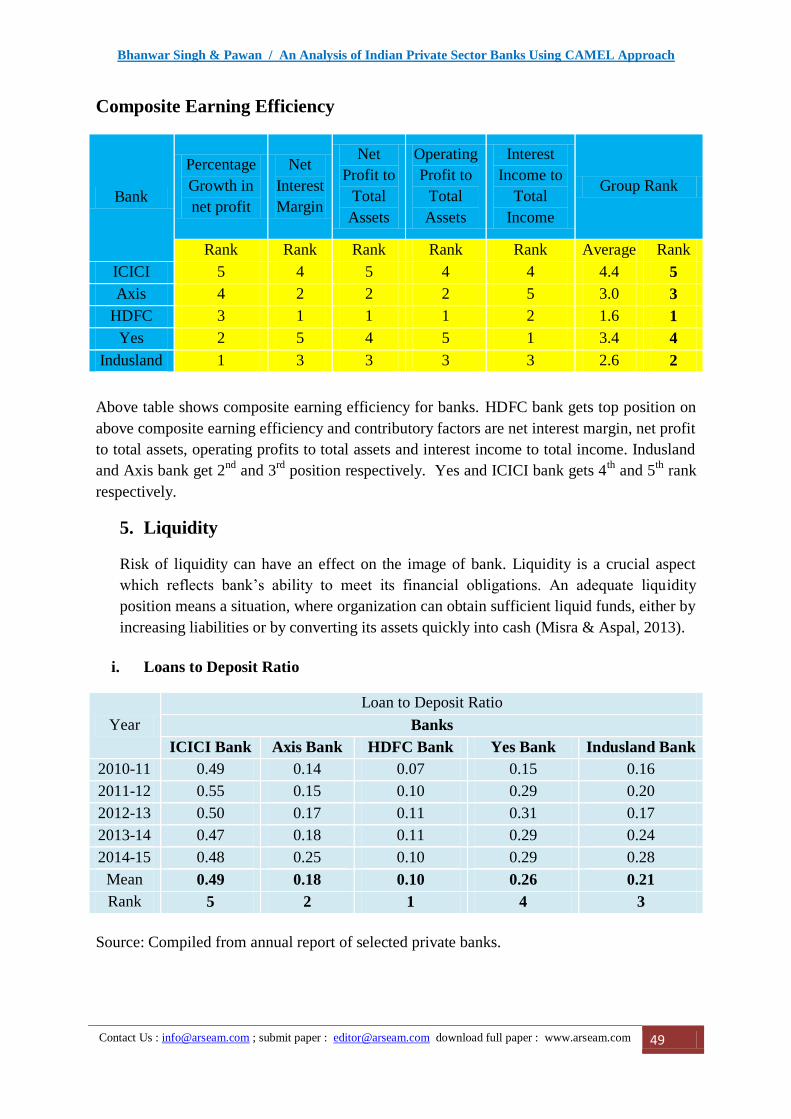
Composite Earning Efficiency
Bank
Percentage
Growth in
net profit
Net
Interest
Margin
Net
Profit to
Total
Assets
Operating
Profit to
Total
Assets
Interest
Income to
Total
Income
Group Rank
Rank Rank Rank Rank Rank Average Rank
ICICI 5 4 5 4 4 4.4 5
Axis 4 2 2 2 5 3.0 3
HDFC 3 1 1 1 2 1.6 1
Yes 2 5 4 5 1 3.4 4
Indusland 1 3 3 3 3 2.6 2
Above table shows composite earning efficiency for banks. HDFC bank gets top position on
above composite earning efficiency and contributory factors are net interest margin, net profit
to total assets, operating profits to total assets and interest income to total income. Indusland
and Axis bank get 2nd
and 3rd
position respectively. Yes and ICICI bank gets 4th
and 5th
rank
respectively.
5. Liquidity
Risk of liquidity can have an effect on the image of bank. Liquidity is a crucial aspect
which reflects bank’s ability to meet its financial obligations. An adequate liquidity
position means a situation, where organization can obtain sufficient liquid funds, either by
increasing liabilities or by converting its assets quickly into cash (Misra & Aspal, 2013).
i. Loans to Deposit Ratio
Year
Loan to Deposit Ratio
Banks
ICICI Bank Axis Bank HDFC Bank Yes Bank Indusland Bank
2010-11 0.49 0.14 0.07 0.15 0.16
2011-12 0.55 0.15 0.10 0.29 0.20
2012-13 0.50 0.17 0.11 0.31 0.17
2013-14 0.47 0.18 0.11 0.29 0.24
2014-15 0.48 0.25 0.10 0.29 0.28
Mean 0.49 0.18 0.10 0.26 0.21
Rank 5 2 1 4 3
Source: Compiled from annual report of selected private banks.

International Journal of Marketing & Financial Management, Volume 4, Issue 7, Oct-2016, pp 36-52
ISSN: 2348 –3954 (Online) ISSN: 2349 –2546 (Print),
Contact Us : [email protected] ; submit paper : [email protected] download full paper : www.arseam.com 50
Above table shows loan to deposit ratio for banks. HDFC bank gets 1st position on above
parameter followed by Axis and Indusland Bank. Yes and ICICI bank gets 4th
and 5th
position
on above parameter.
ii. Liquid Assets to Total Assets Ratio
Year
Liquid Assets to Total Assets Ratio (%)
Banks
ICICI Bank Axis Bank HDFC Bank Yes Bank Indusland Bank
2010-11 8.39 8.82 10.73 5.92 8.82
2011-12 7.65 4.88 6.21 4.87 9.62
2012-13 7.72 6.00 6.81 4.10 9.34
2013-14 6.98 7.37 8.05 5.40 7.78
2014-15 6.55 7.81 6.15 5.55 9.88
Mean 7.46 6.98 7.59 5.17 9.09
Rank 3 4 2 5 1
Source: Compiled from annual report of selected private banks.
Above table shows the liquid assets to total assets ratio for selected banks. It is inferred from
the table that 9% liquid assets to total assets for Indusland bank and Indusland bank get 1st
rank on above parameter followed by HDFC and ICICI bank. Axis and Yes bank get 4th
and
5th
rank respectively.
iii. Liquid Assets to Total Deposit Ratio
Year
Liquid Assets to Total Deposit Ratio (%)
Banks
ICICI Bank Axis Bank HDFC Bank Yes Bank Indusland Bank
2010-11 15.11 11.31 14.30 7.61 11.71
2011-12 14.18 6.33 8.58 7.29 13.08
2012-13 14.15 8.09 9.21 6.07 12.66
2013-14 12.51 10.05 10.78 7.94 11.19
2014-15 11.70 11.20 8.06 8.29 14.54
Mean 13.53 9.40 10.19 7.44 12.63
Rank 1 4 3 5 2
Source: Compiled from annual report of selected private banks.
Above table show the liquid assets to total deposit ratio for banks. ICICI, Indusland and
HDFC bank get 1st, 2
nd, and 3
rd position respectively. Axis and Yes bank get 4
th and 5
th rank
respectively on liquid assets to total deposit ratio.
Bhanwar Singh & Pawan / An Analysis of Indian Private Sector Banks Using CAMEL Approach
Contact Us : [email protected] ; submit paper : [email protected] download full paper : www.arseam.com 51
Composite Liquidity
Bank
Loan to Deposit
Ratio
Liquid Assets to
Total Assets
Ratio
Liquid Assets to
Total Deposit
Ratio
Group Rank
Rank Rank Rank Average Rank
ICICI 5 3 1 3.0 3
Axis 2 4 4 3.3 4
HDFC 1 2 3 2.0 1.5
Yes 4 5 5 4.7 5
Indusland 3 1 2 2.0 1.5
Above table show the composite liquidity for banks. HDFC and Indusland Bank tie first
position and get 1.5 ranks respectively. ICICI, Axis and Yes bank get 3rd
, 4th
, and 5th
rank
respectively.
Composite Ranking (overall performance) of Banks
Bank C A M E L Average Rank
ICICI Bank 2.75 4.67 3.50 4.40 3.00 3.66 5
Axis Bank 3.50 3.67 2.60 3.00 3.30 3.21 3
HDFC Bank 2.00 2.00 3.10 1.60 2.00 2.14 1
Yes Bank 4.00 2.33 2.00 3.40 4.70 3.29 4
Indusland Bank 2.75 2.33 3.80 2.60 2.00 2.70 2
Above composite ranking table show the overall performance of banks on Capital Adequacy,
Assets Quality, Management Efficiency, Earning Efficiency and Liquidity CAMEL
parameters. It is inferred from the table that HDFC overall performance is excellent and bank
got 1st position out of five banks. Indusland bank overall rank is 2
nd followed by Axis and
Yes bank. Axis and Yes Bank got 3rd
and 4th
rank respectively. ICICI bank performs poorly
on overall ranking and got 5th
position.
FINDINGS
In is found from the Capital Adequacy component that HDFC Bank is performance is better
than its rival bank. ICICI and Indusland bank also performing well on Capital adequacy
component.
Further, it is found from another Assets quality component that HDFC bank performing well
on Assets quality. Yes and Indusland bank also performing well on Assets quality
component.

International Journal of Marketing & Financial Management, Volume 4, Issue 7, Oct-2016, pp 36-52
ISSN: 2348 –3954 (Online) ISSN: 2349 –2546 (Print),
Contact Us : [email protected] ; submit paper : [email protected] download full paper : www.arseam.com 52
Study also reveals that Yes bank performing well on management efficiency followed by
Axis and HDFC bank.
It is also found from earning efficiency component that HDFC bank performing well
followed by its rival Indusland and Axis bank.
Overall liquidity of HDFC bank and Indusland bank is good. Overall liquidity of ICICI bank
is also better.
CONCLUSION
CAMEL model provides overall performance picture of bank on different parameters from
Capital adequacy to liquidity. It is found from the study that to measure and analyze the
performance of bank is very interesting and challenging. Study reveals that overall
performance of HDFC Bank is excellent and HDFC Bank got 1st among its rival banks. It is
also concluded that Indusland and Axis Bank performance on CAMEL component is good.
REFERENCE
Altan, M., Yusufazari, H., & Beduk, A. (2014). Performance Analysis Of Banks In Turkey
Using Camel Approach. 14th International Academic Conference, (pp. 21-32). Malta.
Babar, H. Z., & Zeb, G. Does CAMELS system provide similar rating as PACRA system in
assessing the performance of banks in Pakistan? In CAMELS RATING SYSTEM FOR
BANKING INDUSTRY IN PAKISTAN. Umea University.
Gupta, R. (2014). An Analysis of Indian Public Sector Banks Using Camel Approach. IOSR
Journal of Business and Management , 94-102.
Kumar, S., & Sharma, R. (2014). Performance Analysis Of Top Indian Banks Through
Camel Approach. International Journal of Advanced Research in Management and Social
Sciences , 81-92.
Misra, S. K., & Aspal, P. K. (2013). A Camel Model Analysis of State Bank Group. World
Journal of Social Sciences , 36-55.
Tatuskar, S. (2010). A Study of Financial Performance of Selected Indian Scheduled
Commercial Banks Unsing CAMELS Methodology For 2006-2010. Internation Journal of
Research In Commerce & Management , 105-121.