Embed Size (px)
Citation preview
A Comparative Analysis of Commercial Banks
About Us:
IMS Investment Management Services Pvt. Ltd. is a service provider for investing in Nepal Capital market through its web portals www.sharesansar.com and www.commoditysansar.com. IMS was established on 7th March, 2011 under the company act of 2063. We are committed to the fundamental principles: Integrity, Service and Performance.
The company principal activities consist of all the clerical, administrativeand research works that are required for investing in the Nepal Stock marketfor its Corporate and Individual clients on a personalized note.
Sharesansar.com is a complete financial web portal, running successfully since last 26 months in Nepal. ShareSansar.com updates your financial world related to Nepal Share market to the general public in a most common way all over the world. Our websitecaters more than 2,00,000 plus hits and 5,000 plus unique visitors on a daily basis.
We are committed to stand sharesansar.com most dependable financial web platform for any financial news and information in Nepal. Sharesansar.com is the only updatedand seamless website covering all the major aspects of share market of Nepal.
Our main objective behind publishing this report is to aware general share market investorsabout the performance of commercial banks in second quarter of fiscal year 2069/70.
Click the image above
1
2nd Quarterly Financial High-lights of 2069/70 fiscal year
A Comparative Analysis of Commercial Banks
Net Profit:
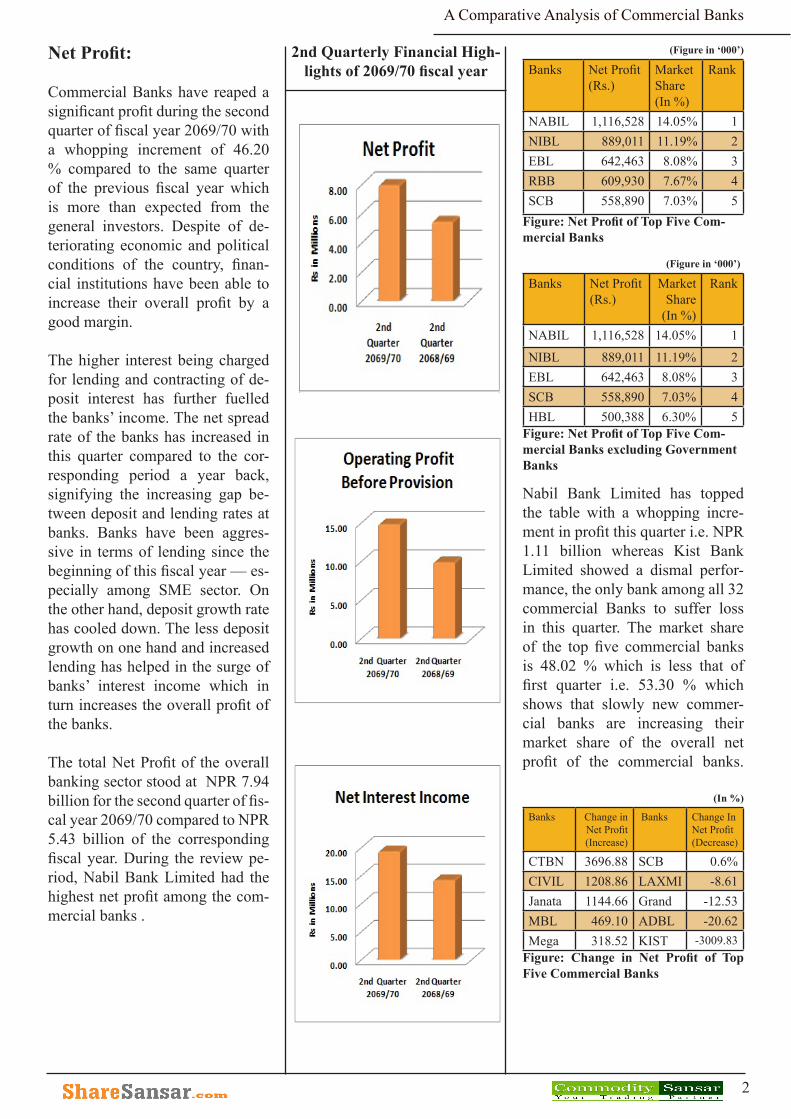
Commercial Banks have reaped a significant profit during the second quarter of fiscal year 2069/70 with a whopping increment of 46.20 % compared to the same quarter of the previous fiscal year which is more than expected from the general investors. Despite of de-teriorating economic and political conditions of the country, finan-cial institutions have been able to increase their overall profit by a good margin.
The higher interest being charged for lending and contracting of de-posit interest has further fuelled the banks’ income. The net spread rate of the banks has increased in this quarter compared to the cor-responding period a year back, signifying the increasing gap be-tween deposit and lending rates at banks. Banks have been aggres-sive in terms of lending since the beginning of this fiscal year — es-pecially among SME sector. On the other hand, deposit growth rate has cooled down. The less deposit growth on one hand and increased lending has helped in the surge of banks’ interest income which in turn increases the overall profit of the banks.
The total Net Profit of the overall banking sector stood at NPR 7.94 billion for the second quarter of fis-cal year 2069/70 compared to NPR 5.43 billion of the corresponding fiscal year. During the review pe-riod, Nabil Bank Limited had the highest net profit among the com-mercial banks .
2
(Figure in ‘000’)
Banks Net Profit (Rs.)
Market Share (In %)
Rank
NABIL 1,116,528 14.05% 1NIBL 889,011 11.19% 2EBL 642,463 8.08% 3RBB 609,930 7.67% 4SCB 558,890 7.03% 5
Figure: Net Profit of Top Five Com-mercial Banks
(Figure in ‘000’)
Banks Net Profit (Rs.)
Market Share
(In %)
Rank
NABIL 1,116,528 14.05% 1
NIBL 889,011 11.19% 2EBL 642,463 8.08% 3SCB 558,890 7.03% 4HBL 500,388 6.30% 5
Figure: Net Profit of Top Five Com-mercial Banks excluding Government Banks
Nabil Bank Limited has topped the table with a whopping incre-ment in profit this quarter i.e. NPR 1.11 billion whereas Kist Bank Limited showed a dismal perfor-mance, the only bank among all 32 commercial Banks to suffer loss in this quarter. The market share of the top five commercial banks is 48.02 % which is less that of first quarter i.e. 53.30 % which shows that slowly new commer-cial banks are increasing their market share of the overall net profit of the commercial banks.
(In %)
Banks Change in Net Profit(Increase)
Banks Change In Net Profit (Decrease)
Figure: Change in Net Profit of Top Five Commercial Banks
CTBN 3696.88 SCB 0.6%CIVIL 1208.86 LAXMI -8.61Janata 1144.66 Grand -12.53MBL 469.10 ADBL -20.62Mega 318.52 KIST -3009.83
2nd Quarterly Financial High-lights of 2069/70 fiscal year
A Comparative Analysis of Commercial Banks
During the review period, Com-merz and Trust Bank Nepal Lim-ited, one of the youngest commer-cial bank was able to increase its net profit by 3696.88 %, but its early to judge its performance only of this data. Whereas, Kist Bank Limited showed a worst perfor-mance as its profit decreases by 3009.93 % compared to the same period of last fiscal year. In the ta-ble shown above we can see that, the top net profit earning banks have not appeared which suggest that these banks’ capacity of earn-ing profit is at a saturation point and their growth rate is static. Apart from it, as most of the newer commercial banks’ base is small compared to the old banks, so their growth rate is higher than com-pared to old commercial banks.
Operating Profit Before Provision:Commercial Banks real strength is shown by how much it has able to earn an operating profit before pro-vision. This profit is the actual prof-it that is earned by doing a business during a review period. During the review period, total operating profit before provision of the com-mercial banks grew by 49.94% to NPR 14.81 billion as compared to the corresponding first quarter of the previous financial year which proved to be a satisfactory growth. It is obvious that growth in oper-ating profit results growth in net profit too, but the gap between net profit and operating profit be-fore provision during the 2069/70 year is less compared to the cor-responding fiscal year first quarter. The cause of this lies in the in-come from other non-operating ac-tivities, less provision for possible losses, recovery of bad loan, etc.
NABIL Bank Limited has the highest operating profit before pro-vision among all the banks during
the review period i.e. NPR 1.71 billion which is 11.55 % of total operating profit before provision of the banking industry. Whereas, Nepal Bank Limited which had the highest decline in operating profit before provision by 99.20 %. Surprisingly, Standard Char-tered Bank Nepal Ltd. is also seen in the bottom of this list whose operating profit before provision has declined by 5.78 % which is a worrying sign for the bank; Since this bank has remained on top of the table for most of the time pre-viously. Machhapuchchhre Bank Limited had the highest growth rate of 3596.90% which shows that this bank is slowly recovering from the trouble it had in the past.
(Figure in ‘000’)
Banks Operatng Profit Be-fore Provi-sion (Rs.)
Market Share
Rank
NABIL 1,711,817 11.55% 1NIBL 1,452,381 9.80% 2EBL 1,075,740 7.26% 3HBL 975,466 6.58% 4ADBL 974,364 6.58% 5
Figure: Operating Profit Before Provi-sion of Top Five Commercial Banks
(In %)
Banks Change in Oerating Profit (In-crease)
Banks Change in Oerat-ing Profit (De-crease)
MBL 3596.90 ADBL 6.99Century
Figure: Change in Operating Profit Before Provision of Top Five Commer-cial Banks
Deposits:
The Deposit is one of the main source of fund available with the banks to mobilize for different pur-poses to make profit. High the de-posit, higher will be the chance of
3
2672.79 BOK 6.96KIST 699.68 LAXMI 1.86Mega 530.21 SCB -5.78CIVIL 477.97 NBL -99.20
2nd Quarterly Financial High-lights of 2069/70 fiscal year
A Comparative Analysis of Commercial Banks
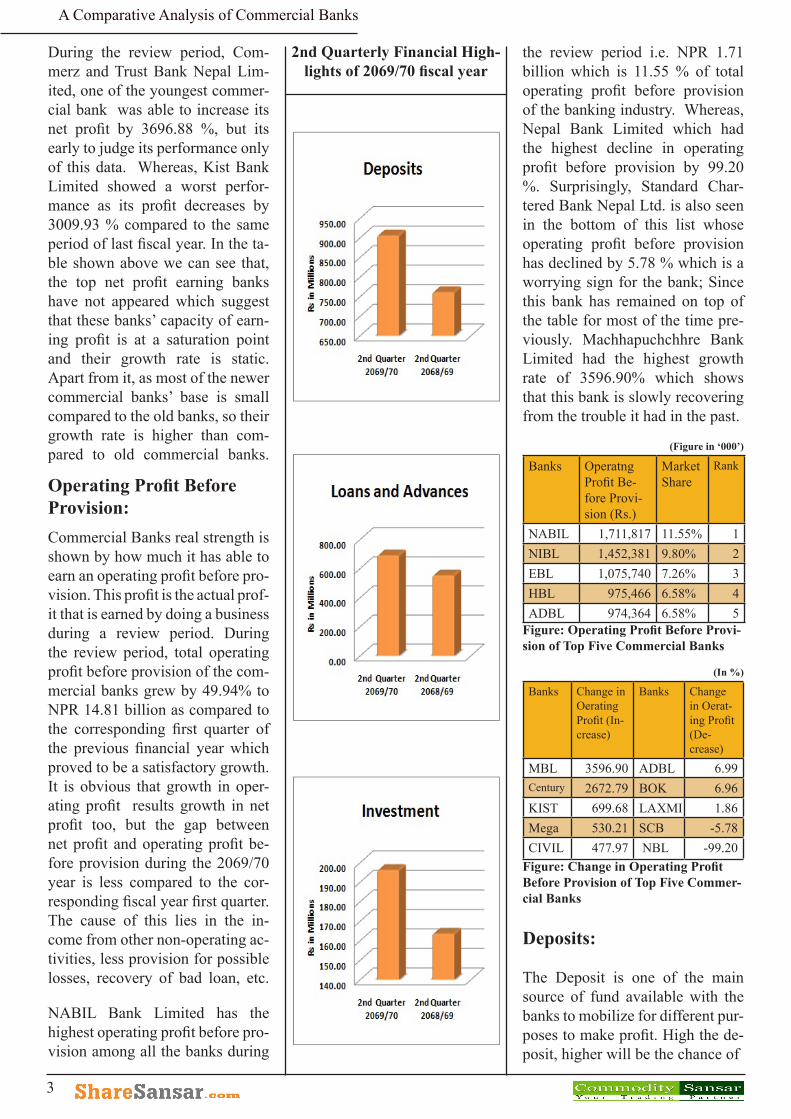
making profit. So every bank has their own strategy to attract depos-its from government, institutions and the general public. The deposit of commercial banks as of the sec-ond quarter of the current fiscal year has increased by 19.00% com-pared to the corresponding second quarter of the previous fiscal year.
Now, that the situation is just re-verse from the last year, commer-cial banks are suffering from the excess liquidity situation and are bound to lower the interest rate of deposits. Since, the banks have excess liquidity they are more fo-cused on increasing their lending portfolio other than concentrate on expanding the depositor base.
An overall deposit of the bank-ing sector is NPR 905.80 billion at the end of the second quarter of the fiscal year 2069/70. The banks have mobilized their large deposit at a higher interest spread in the market which has eventu-ally led to their higher return.
This quarter also, Rastriya Bani-jaya Bank Limited had the largest amount of deposits among all the commercial banks; this is mainly due to a larger portion of the gov-ernment deposits are attracted by this bank whereas Nabil Bank Limited lead the race on exclud-ing government banks category. During the review period, new commercial banks like Century, Civil, Commerz & Trust, Jana¬to have maintained a higher deposit growth rate like they did in the previous quarter. Here, also Stan-dard Chartered Bank Nepal Ltd. has the concerning sign; Since its deposit come down by 1.62% compared to the previous quarter.
(Figure in ‘000’)
Banks Total De-posits (Rs.)
Market Share
Rank
RBB 86,166,874 9.51% 1NABIL 58,987,777 6.51% 2NBL 57,014,219 6.29% 3
NIBL 55,136,424 6.09% 4NSBI 54,099,710 5.97% 5
Figure: Total Deposits of Top Five Commercial Banks
(In %)
Banks Change in Deposit (Increase)
Banks Change in De-posit (De-crease)
Century Bank
311.30 NABIL 6.27
CTBN 121.11 NIB 5.39
Civil 116.58 HBL 3.92Janata 98.67 BOK 3.40Global IME
72.70 SCB -1.62
Figure: Change in Deposits of Top Five Commercial Banks
Loans and Advances:
One of the main sources of rev-enue of the commercial banks is to mobilize their collected funds in loans and advances. Therefore, they make different strategy to increase their loan portfolio. Dur-ing the current fiscal year, due to excess liquidity position in this sector, they are mainly focused on increasing their loan and advances rather than focusing on increasing their deposit base. On this pretext, they somehow get succeeded by increasing their loans and advanc-es by 24.89% which is more than the deposit increment in the same period. This clearly shows that, more the lending more is the rev-enue in terms of interest income which results in the higher profit.
Despite all the political instability and chaos in the country after the dissolution of the Constituent As-sembly, the banks have managed to increase its loan and advance amount to NPR 690.29.30 billion.
4
2nd Quarterly Financial High-lights of 2069/70 fiscal year
A Comparative Analysis of Commercial Banks
Nepal Investment Bank Limited tops the chart on lending among all the commercial banks. The newer commercial banks have main-tained substantial growth in terms of lending compared to the previ-ous second quarter of the 2068/69 whereas most of the old banks had meager growth which can be seen from the table below. This depicts that old banks are slowly losing their hold in the market.
(Figure in ‘000’)
Banks Total Loan & Advanc-es (Rs.)
Market Share
Rank
NIBL 46,449,484 6.73% 1NABIL 45,455,454 6.58% 2
RBB 43,205,248 6.26% 3ADBL 43,172,250 6.25% 4EBL 42,192,684 6.11% 5
Figure: Total Loans & Advances of Top Five Commercial Banks
(In %)
Banks Change in Loan and Advances (Increase)
Banks Change In Loan and Advances (Decrease)
Century 278.51 HBL 11.15CTBN 94.67 BOK 10.48CIVIL 84.96 PCBL 10.22Janata 71.82 Nabil 9.22Global IME
60.97 SCB 3.66
Figure: Change in Loan and Advances of Top Five Commercial Banks
Investment:
Rastriya Banijaya Bank Limited has the highest investment i.e. NPR 30.04 billion. Basically these investments are made on risk-free assets like treasury bills, govern-ment bonds, foreign bonds, invest-ment on equity share, etc.
( In Rs )
Banks Investmemt (Rs.)RBB 30,048,759 NSBI 23,549,933 NABIL 18,757,218 SCB 15,101,171 NBL 10,710,273
Figure: Total Investment of Top Five Commercial Bank.
5
As per the Nepal Rastra Bank di-rectives, out of the 32 commercial banks in the country, none of them has maintained high exposure loan to the real estate sector i.e. above 25 %. But among the existing commercial banks Grand Bank Nepal Ltd. had the highest percent-age of loan exposure in real estate i.e. 20.22% whereas Agricultural Development Bank Ltd. had the lowest i.e. 0.39%. This shows that all banks have maintained as per the given directives of NRB. With the real estate business being in the downhill and less attractive sector to invest, the commercial banks have diminished their exposure in the real estate sector; As an aver-age commercial bank real estate exposure has decreased to 9.99% compared to 13.01% in the same period of the previous fiscal year. However, there have been signifi-cant growth in long term loans of commercial banks i.e. 18% during the review period compared to the same period of the previous fis-cal year which signals that more loans were given to long term project financing like hydropower projects, industrial projects and other manufacturing and service oriented sectors. This shows that presently banks focus on long term businesses by funding this kind of project which automatically helps in the sustainable growth of the company.
(In %)
Banks Change in Real Estate Loan (High)
Banks Net interest Spread (Low)
Grand 20.22 CTBN 4.52PRIME 18.61 NSBI 3.81SBL 17.76 Mega 2.25CZBL 15.91 ADBL 0.39NIBL 15.56 NBL 0.00
Figure: Investment in Real Estate Loan/Total Provision of Top and Least Five Commercial Banks
2nd Quarterly Financial High-lights of 2069/70 fiscal year
A Comparative Analysis of Commercial Banks
positions in operating with less cost of fund. Standard Chartered Bank Nepal Ltd. had the lowest cost of funds among all the com-mercial banks i.e. 2.47% and Civil Bank Ltd had the highest cost of fund with 7.98%. This shows that old banks have lower cost of funds compared to the new commercial banks due to their strong position in the market from a long time.
(In %)
Banks Net interest Spread (High)
Banks Net interest Spread (Low)
NBB 6.27 KBL 3.93CZBL 5.81 Grand 3.87CTBN 5.23 SCB 3.83EBL 5.17 Civil 3.65LBL 4.95 Janata 2.85
Figure: Net Interest Spread of Top Five Commercial Banks
During the review period, Ne-pal Bangladesh Bank Ltd. had the highest net interest spread of 6.27% whereas Janata Bank Ltd. had the lowest i.e. 2.85%. Simi-larly, Century Commercial Bank Limited had the highest change in net interest income with 244.60% whereas Standard Chartered Bank Nepal Ltd. net interest income de-clined by 4.83%.
(In %)
Banks Changein Net Interest (Increase)
Banks Change in Net Interest (Decrease)
Mega 156.89 BOK 9.49Civil 155.71 ADBL 1.46MBL 146.96 NBL 0.23CZBL 121.87 SCB -4.83
Figure: Change in Net Interest Income of Top and Least Five Commercial Banks
Loan Loss Provision, Write Back and Net Write Back:
As per the Nepal Rastra Bank di-rectives 1% provision of each loan is mandatory for the commercial
6
Cost of Fund, Net Interest Spread and Net Interest In-come:
With the ease of liquidity situa-tion in the banking sector since last year, the banks have gradu-ally lowered their interest rate in the deposits but the lending rate has not declined in the same ratio. Because of which the cost of fund that stood around 8.44% in the corresponding quarter of the previ-ous financial year has come down to 6.09% in this quarter which is more than 27.8% decline. Like-wise, their net interest spread has also improved during the review period as it stands at 4.47% which is higher by 36.69% than the corre-sponding fiscal year second quar-ter rate of 3.27%. Decrease in the cost of fund and increase in the net interest spread has positively af-fected the net profit of the banking sector which can be checked from the increment in profit this quarter.
During the review period, Net In-terest Income of banking industry amplified by 36.08% compared to the second quarter of fiscal year 2068/69, which is the result of improvement of the cost of fund and the net interest spread. Overall Net interest Income stood at NPR 19.31 billion.
(In %)
Banks Cost of Fund (Low)
Banks Cost of Fund (High)
SCB 2.47 Cen-tury
7.39
RBB 3.84 BOAN 7.48NSBI 4.60 Sanima 7.67EBL 4.70 Grand 7.96NBL 4.80 Civil 7.98
Figure: Cost of Fund of Top and Least Five Commercial Banks
The old commercial banks, which were less affected by the liquidity crunch in the previous fiscal year have managed to maintain high
Century 244.60 LAXMI 10.35
2nd Quarterly Financial High-lights of 2069/70 fiscal year
A Comparative Analysis of Commercial Banks
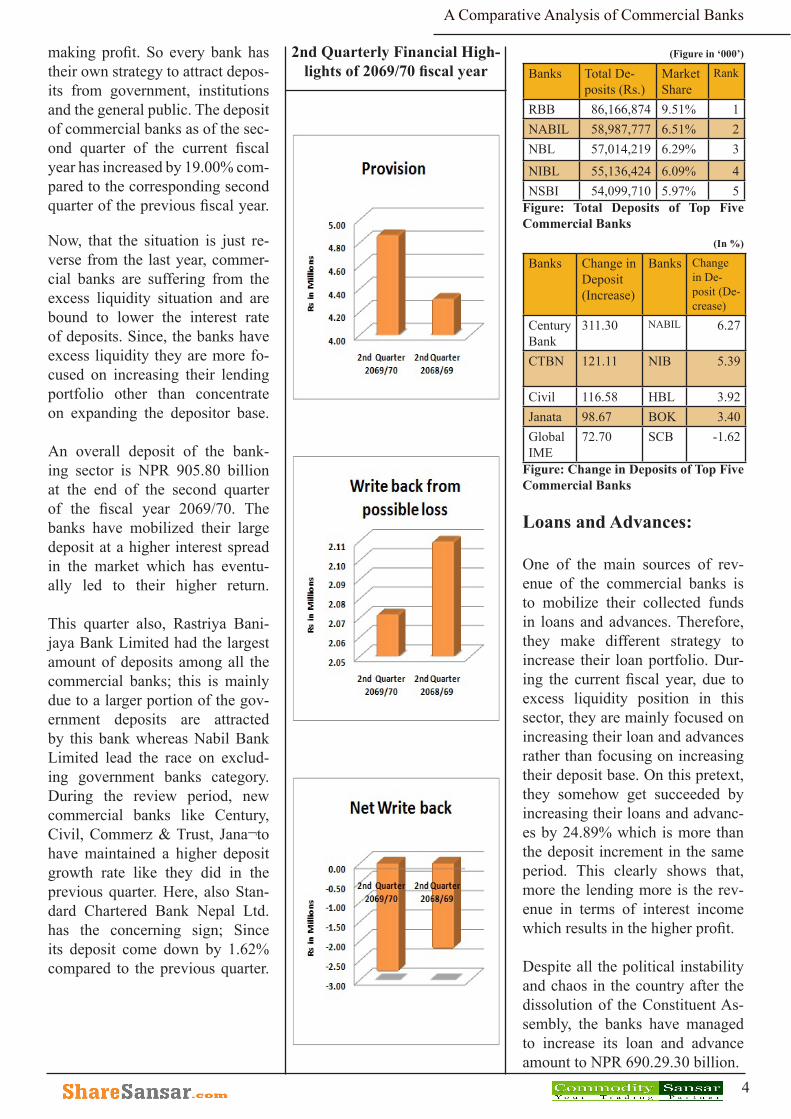
banks and further increment in the provision depends upon the state of the loan of the bank. The overall provision for the possible losses stood at NPR. 4.86 billion which has increased by 12.79% compared to the previous second quarter of the fiscal year 2068/69. The growth rate of provision as compared to the previous quarters has decreased but still the provi-sion amount stand huge. The given figure suggests that the banks are facing tough time in recovering their loans on time; to the slow re-covery of real estate loan from the market has led to an inconvenient payment of principal amount and interest by clients of the commer-cial banks.
(Figure in ‘000’)
Banks Total Provision (Rs.) (In-crease)
Banks Total Provision (Rs.) (De-crease)
ADBL 675,064 Sanima 42,653
KIST 379,811 Century 37,908
PCBL 302,961 NIC 36,666
CZBL 283,840 SCB 30,533
NIBL 279,013 CTBN 28,058
Figure: Total Provision of Top Five Com-mercial Banks
This quarter the write back amount stood at NPR 2.07 billion which has decreased by 1.8% compared to the previous fiscal year second quarter. The write back from pos-sible losses figure is not so sat-isfactory. On one hand, provision amount is increasing and other hand, banks are unable to write back amount from the previous year provision which surely have an adverse effect on the net profit of the companies.
( Figure in ‘000‘ )
Banks Write back (Rs.)ADBL 450,520 NABIL 293,894 NIBL 224,938 RBB 215,919 CZBL 131,204
Figure: Total Write Back from Possible Losses of Top Five Commercial Banks
The Net write back of an overall banking industry at the review period is negative NPR 2.79 bil-lion which is 26.76% more that of the previous year same period. This negative figure suggests that write back amount is less than that of loan loss provision during this review period which signifies that NPR 2.79 billion on net ba-sis was kept as provision for pos-sible losses after deducting write back amount of all the commercial banks.
Non Performing Loan (NPA):
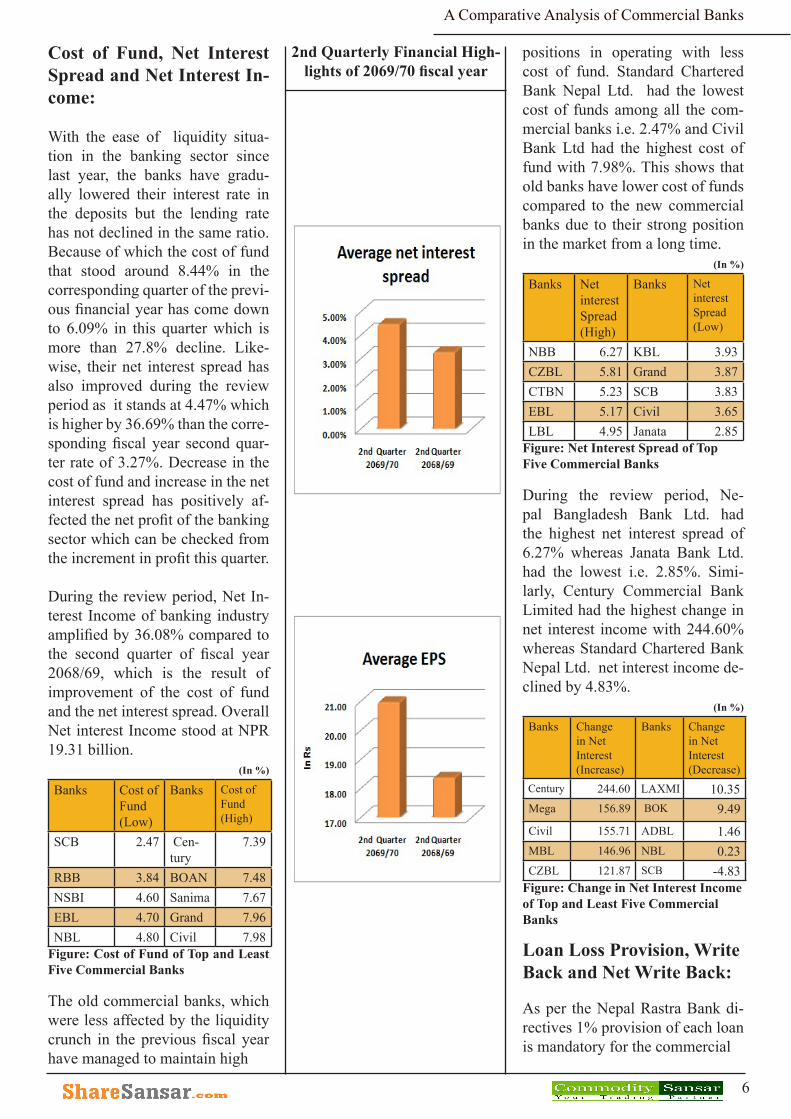
During the review period, the non performing loan or bad loans from the commercial banks was lower than the previous fiscal year sec-ond quarter. Average non-perform-ing loan decreased by 16.06 % to 2.66 % from 3.17% in the second quarter of this fiscal year. The fig-ure suggests that the riskiness of the overall loan portfolio of the commercial banks is decreasing, which will automatically enhance the good environment of the bank-ing industry. Out of the 32 com-mercial banks, only 4 banks NPA remained above 5% which is re-garded riskier according to NRB directives. All 3 government banks including Nepal Bank, RBB and ADBL, bad loans stands more than 5% which suggest that these bank overall loan portfolio is in riskier state. Kist Bank Limited has the highest NPA among all the com-mercial banks (excluding govern-ment banks) with worst perfor-mance this quarter.
(In %)
Banks NPA (Most)
Banks NPA (Least)
Sanima 0.19 KBL 4.38CTBN 0.32 NBL 5.40
NSBI 0.43 RBB 6.53Century 0.45 ADBL 6.64EBL 0.70 KIST 7.15
Figure: NPA of Top Five Commercial Banks
7
2nd Quarterly Financial High-lights of 2069/70 fiscal year
A Comparative Analysis of Commercial Banks
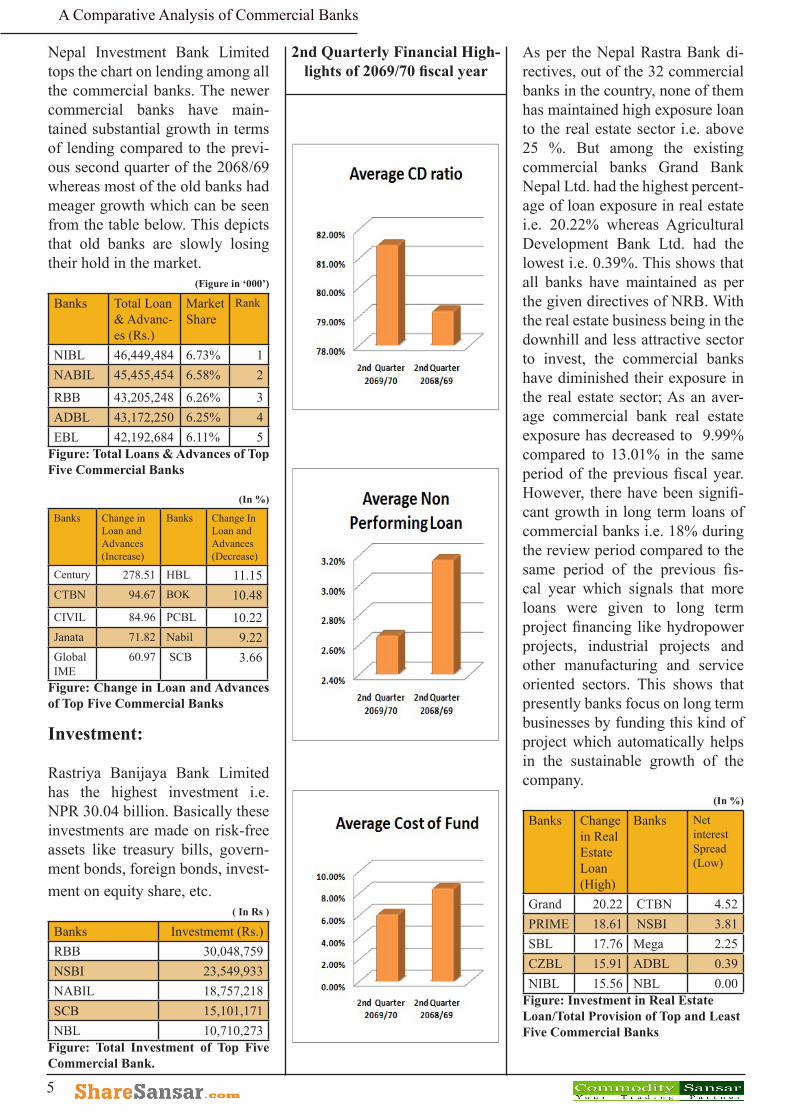
Credit Deposit (CD) Ratio:The commercial banks are sup-posed to maintain up to 80 % CD ratio. But as per the directive is-sued by NRB, only 7 banks CD ratio is below 80% and remain-ing all banks CD ratios is more than that. Compared to the previ-ous year, this quarter CD ratios of commercial banks have increased. The older banks like SCB, Nepal Bank, Rastriya Banijaya Bank had less than 60 % CD ratio which in-dicates that they were unavailable to utilize the full capacity given by the NRB because of the lack of stable investment opportunity. The average credit deposit ratio of the commercial banks stood at 81.45% during the review period which is slightly higher than the previous fiscal year second quarter.
(In %)
Banks CD Ratio (Most)
Banks CD Ratio (Least)
Figure: CD Ratio of Top Five Commer-cial Banks
Earnings per Share (EPS) and Return on Equity (ROE):Earning per share and Return on Equity generally show the perfor-mance of the company as per the investment made by investors or shareholders. It generally shows the financial performance from the bird’s eye view. Higher the EPS and ROE higher will be the perfor-mance of the company in terms of investor’s point of view.
Earnings per share allow us to com-pare different companies’ power to make profit per share. During the review period, the annualized av-erage EPS of commercial banks is
NPR 20.97, which is 14.19 % higher than the previous year sec-ond quarter. Whereas, out of 32 commercial banks only 10 banks were able to earn above industry average. During the review period, Nabil Bank Limited had the high-est annualized EPS i.e. NPR 91.64 whereas Kist Bank Limited had the lowest annualized EPS of negative NPR 6.96.
(In Rs)
Banks EPS (Rs.) (Most)
Banks EPS (Rs.) (Least)
NABIL 91.64 Century 4.66EBL 72.96 NBL 4.41SCB 60.29 CIVIL 3.36NIBL 47.19 MBL 2.66NIC 36.31 KIST -6.96
Figure: EPS of Top Five Commercial Banks
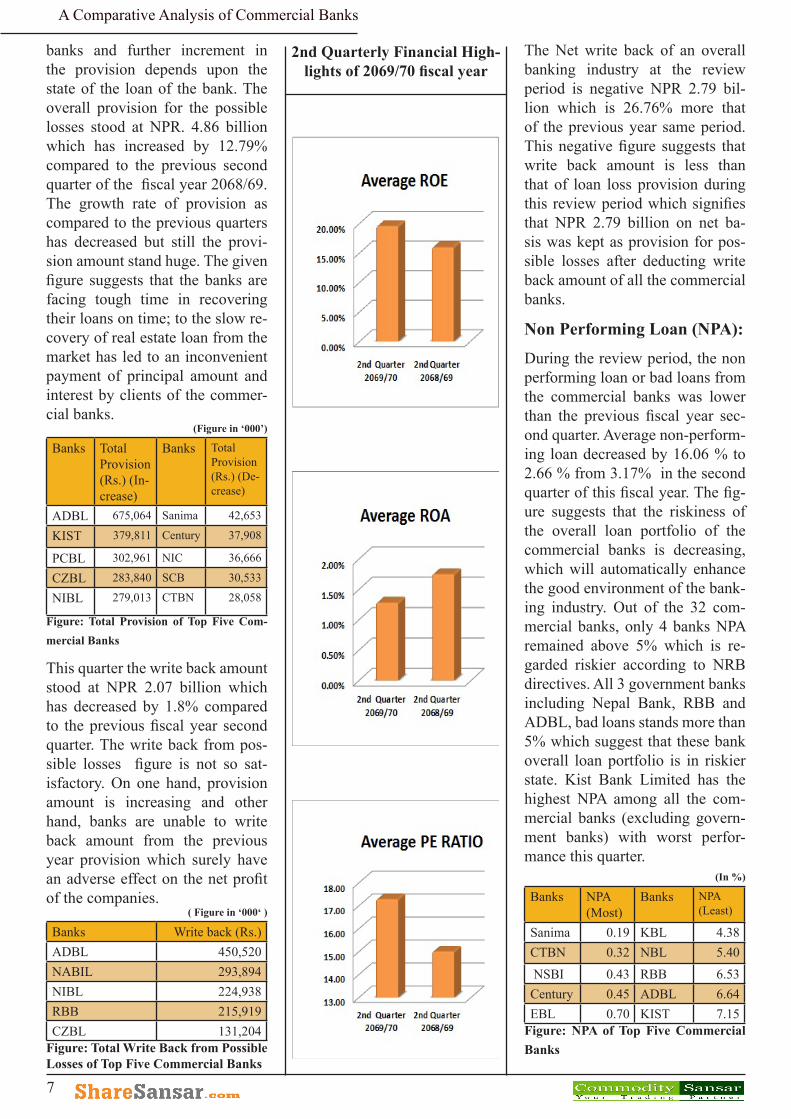
The annualized average return on equity was 19.55% compared to 15.95% of previous fiscal year second quarter. This figure shows that banks are able to increase the return on an investor’s capital. ROE is one of the best financial performance indicators of a com-pany. Rastriya Banijaya Bank has highest ROE i.e. 249.95% but this figure is misleading investors since its net worth is close to negative whereas Kist Bank Limited annu-alized ROE is negative i.e. 6.40%.
(In %)
Banks ROE (Most)
Banks ROE (Least)
RBB 249.95 Century 4.25NABIL 34.02 CIVIL 3.25EBL 26.66 MBL 2.46NIBL 25.62 NBL -2.73SCB 23.87 KIST -6.40
Figure: ROE of Top Five Commercial Banks
8
ADBL 96.00 LAXMI 76.96Janata 95.96 NBL 56.86CTBN 93.61 SCB 53.51Mega 92.08 NSBI 51.93LBL 90.95 RBB 50.14
A Comparative Analysis of Commercial Banks
add any premium if a borrower has a safe collateral like government bonds and if it is for priority sec-tors identified by the government,.
The base rate will ensure the sta-bility of the monetary market in the current volatile situation when the interest rates are fluctuating and could attain the sustainabil-ity and long-term stability of the financial system, according to the central bank.
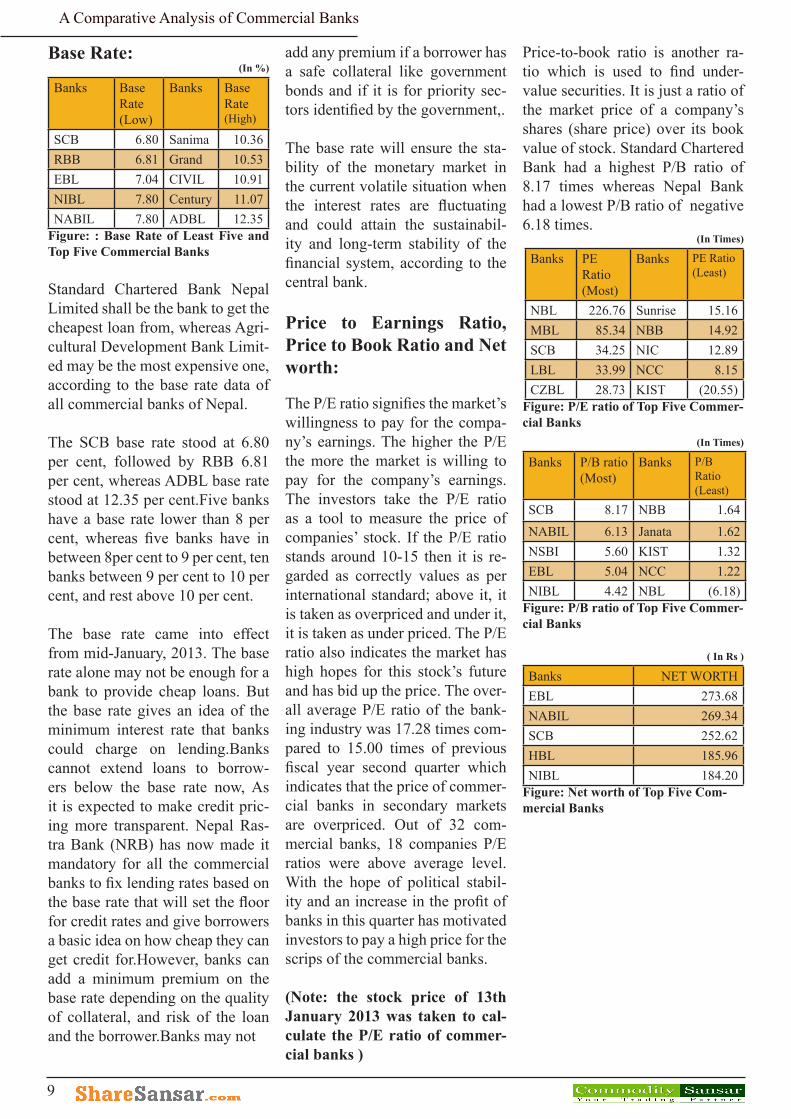
Price to Earnings Ratio, Price to Book Ratio and Net worth:
The P/E ratio signifies the market’s willingness to pay for the compa-ny’s earnings. The higher the P/E the more the market is willing to pay for the company’s earnings. The investors take the P/E ratio as a tool to measure the price of companies’ stock. If the P/E ratio stands around 10-15 then it is re-garded as correctly values as per international standard; above it, it is taken as overpriced and under it, it is taken as under priced. The P/E ratio also indicates the market has high hopes for this stock’s future and has bid up the price. The over-all average P/E ratio of the bank-ing industry was 17.28 times com-pared to 15.00 times of previous fiscal year second quarter which indicates that the price of commer-cial banks in secondary markets are overpriced. Out of 32 com-mercial banks, 18 companies P/E ratios were above average level. With the hope of political stabil-ity and an increase in the profit of banks in this quarter has motivated investors to pay a high price for the scrips of the commercial banks.
(Note: the stock price of 13th January 2013 was taken to cal-culate the P/E ratio of commer-cial banks )
Base Rate:(In %)
Banks Base Rate (Low)
Banks Base Rate (High)
SCB 6.80 Sanima 10.36RBB 6.81 Grand 10.53EBL 7.04 CIVIL 10.91NIBL 7.80 Century 11.07NABIL 7.80 ADBL 12.35
Figure: : Base Rate of Least Five and Top Five Commercial Banks
Standard Chartered Bank Nepal Limited shall be the bank to get the cheapest loan from, whereas Agri-cultural Development Bank Limit-ed may be the most expensive one, according to the base rate data of all commercial banks of Nepal.
The SCB base rate stood at 6.80 per cent, followed by RBB 6.81 per cent, whereas ADBL base rate stood at 12.35 per cent.Five banks have a base rate lower than 8 per cent, whereas five banks have in between 8per cent to 9 per cent, ten banks between 9 per cent to 10 per cent, and rest above 10 per cent.
The base rate came into effect from mid-January, 2013. The base rate alone may not be enough for a bank to provide cheap loans. But the base rate gives an idea of the minimum interest rate that banks could charge on lending.Banks cannot extend loans to borrow-ers below the base rate now, As it is expected to make credit pric-ing more transparent. Nepal Ras-tra Bank (NRB) has now made it mandatory for all the commercial banks to fix lending rates based on the base rate that will set the floor for credit rates and give borrowers a basic idea on how cheap they can get credit for.However, banks can add a minimum premium on the base rate depending on the quality of collateral, and risk of the loan and the borrower.Banks may not
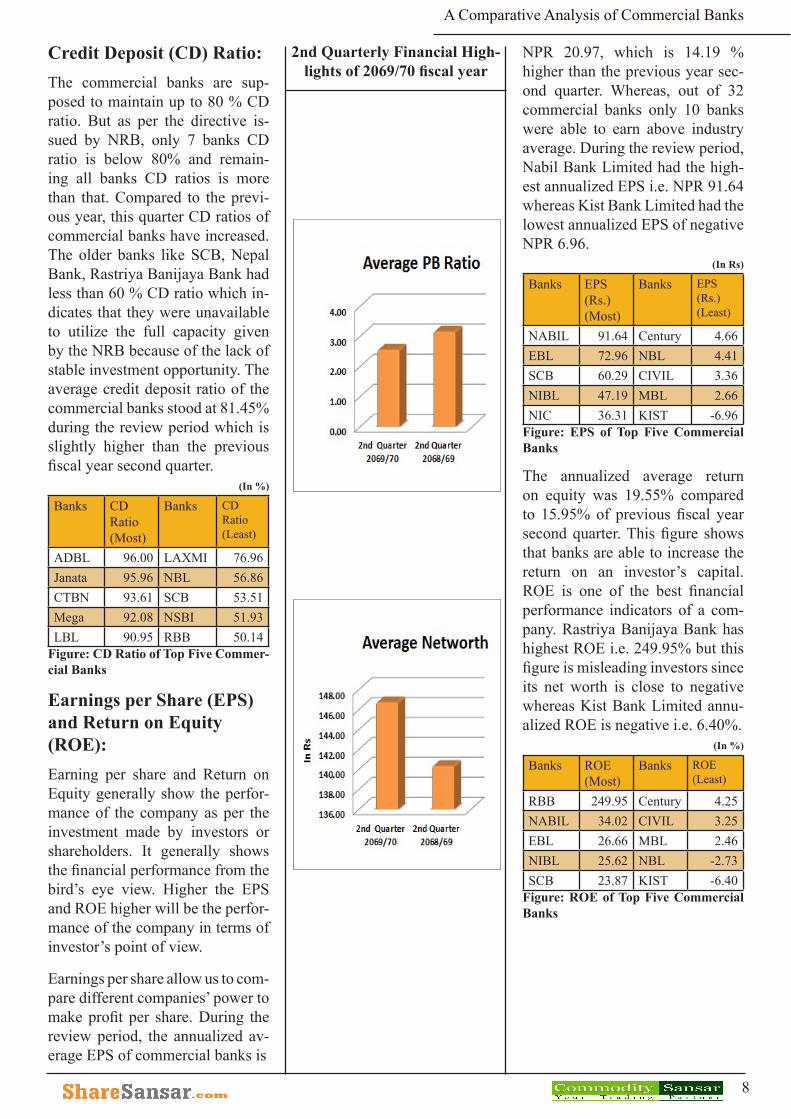
Price-to-book ratio is another ra-tio which is used to find under-value securities. It is just a ratio of the market price of a company’s shares (share price) over its book value of stock. Standard Chartered Bank had a highest P/B ratio of 8.17 times whereas Nepal Bank had a lowest P/B ratio of negative 6.18 times.
(In Times)
Banks PE Ratio (Most)
Banks PE Ratio (Least)
NBL 226.76 Sunrise 15.16 MBL 85.34 NBB 14.92 SCB 34.25 NIC 12.89 LBL 33.99 NCC 8.15 CZBL 28.73 KIST (20.55)
Figure: P/E ratio of Top Five Commer-cial Banks
(In Times)
Banks P/B ratio (Most)
Banks P/B Ratio (Least)
SCB 8.17 NBB 1.64 NABIL 6.13 Janata 1.62 NSBI 5.60 KIST 1.32 EBL 5.04 NCC 1.22 NIBL 4.42 NBL (6.18)
Figure: P/B ratio of Top Five Commer-cial Banks
( In Rs )
Banks NET WORTHEBL 273.68 NABIL 269.34 SCB 252.62 HBL 185.96 NIBL 184.20
Figure: Net worth of Top Five Com-mercial Banks
9
A Comparative Analysis of Commercial Banks
Conclusion:
Commercial banks have yet again surprised the financial sector as well as all stakeholders, as they to-gether posted a whopping 44.20% hike in net profits in the first half of the current fiscal year.Commercial banks have reaped significant prof-its following the accelerated total lending growth rate that overtook deposit growth rate, in the second quarter. The increment in net inter-est income due to decrease in cost of fund and increase in net interest spread is the main reason behind the increase in overall net profit this year.
Commercial banks are currently working with high spread in the market which has mainly helped the boost in the net profit of the companies. Likewise, NPA seems to be on a declining trend which is a positive sign for the banks. With
10
the immense improvement in the performance in the banking sec-tor, investors are hoping to get better return this year, which can be assumed from the surge in the Nepse index level recently.
However, low growth of the busi-ness sector is creating a poor demand of loan which can ham-per profitability in the long run. And also increased competition among banks and financial insti-tutions is a major factor that can hold the growth of financial insti-tution due to increased unhealthy competition.
Also, prevailing political stale-mate, sluggish economic condi-tion, widening trade deficit, high inflation rate, unfavorable busi-ness environment, meager BOP surplus for the business indus-try, lack of implementation and smooth transition in big projects,
delay in the decision making pro cess and mostly the lack of full budget is creating a major prob-lem in the progress of banking sec-tor in the economy. In spite of all these, the Central Bank has been very helpful to guide the Banking sector of Nepal; to cope up with heightening competition among the existing banking institution in the small market place like Nepal, the NRB has issued merger poli-cies among each other, incline to create a positive impact in the long term of the banking industry.
The overall growth of the bank-ing system is satisfactory taking in note the number of problems faced by the country last fiscal year. Likewise, the number of steps tak-en by the NRB to address the prob-lem faced by commercial bank is a positive sign and this will surely outcome good performance in the future.
A Comparative Analysis of Commercial Banks
Annex
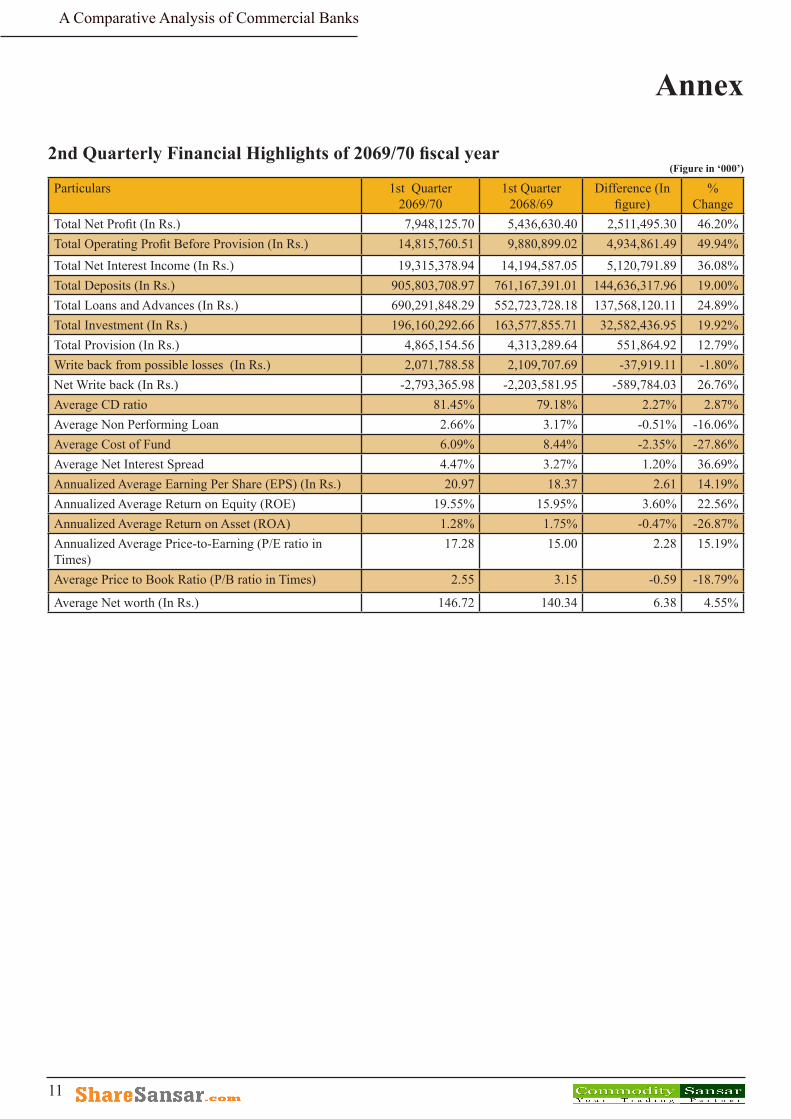
2nd Quarterly Financial Highlights of 2069/70 fiscal year(Figure in ‘000’)
Particulars 1st Quarter 2069/70
1st Quarter 2068/69
Difference (In figure)
% Change
Total Net Profit (In Rs.) 7,948,125.70 5,436,630.40 2,511,495.30 46.20%Total Operating Profit Before Provision (In Rs.) 14,815,760.51 9,880,899.02 4,934,861.49 49.94%Total Net Interest Income (In Rs.) 19,315,378.94 14,194,587.05 5,120,791.89 36.08%Total Deposits (In Rs.) 905,803,708.97 761,167,391.01 144,636,317.96 19.00%Total Loans and Advances (In Rs.) 690,291,848.29 552,723,728.18 137,568,120.11 24.89%Total Investment (In Rs.) 196,160,292.66 163,577,855.71 32,582,436.95 19.92%Total Provision (In Rs.) 4,865,154.56 4,313,289.64 551,864.92 12.79%Write back from possible losses (In Rs.) 2,071,788.58 2,109,707.69 -37,919.11 -1.80%Net Write back (In Rs.) -2,793,365.98 -2,203,581.95 -589,784.03 26.76%Average CD ratio 81.45% 79.18% 2.27% 2.87%Average Non Performing Loan 2.66% 3.17% -0.51% -16.06%Average Cost of Fund 6.09% 8.44% -2.35% -27.86%Average Net Interest Spread 4.47% 3.27% 1.20% 36.69%Annualized Average Earning Per Share (EPS) (In Rs.) 20.97 18.37 2.61 14.19%Annualized Average Return on Equity (ROE) 19.55% 15.95% 3.60% 22.56%Annualized Average Return on Asset (ROA) 1.28% 1.75% -0.47% -26.87%Annualized Average Price-to-Earning (P/E ratio in Times)
17.28 15.00 2.28 15.19%
Average Price to Book Ratio (P/B ratio in Times) 2.55 3.15 -0.59 -18.79%
Average Net worth (In Rs.) 146.72 140.34 6.38 4.55%
11
A Comparative Analysis of Commercial Banks
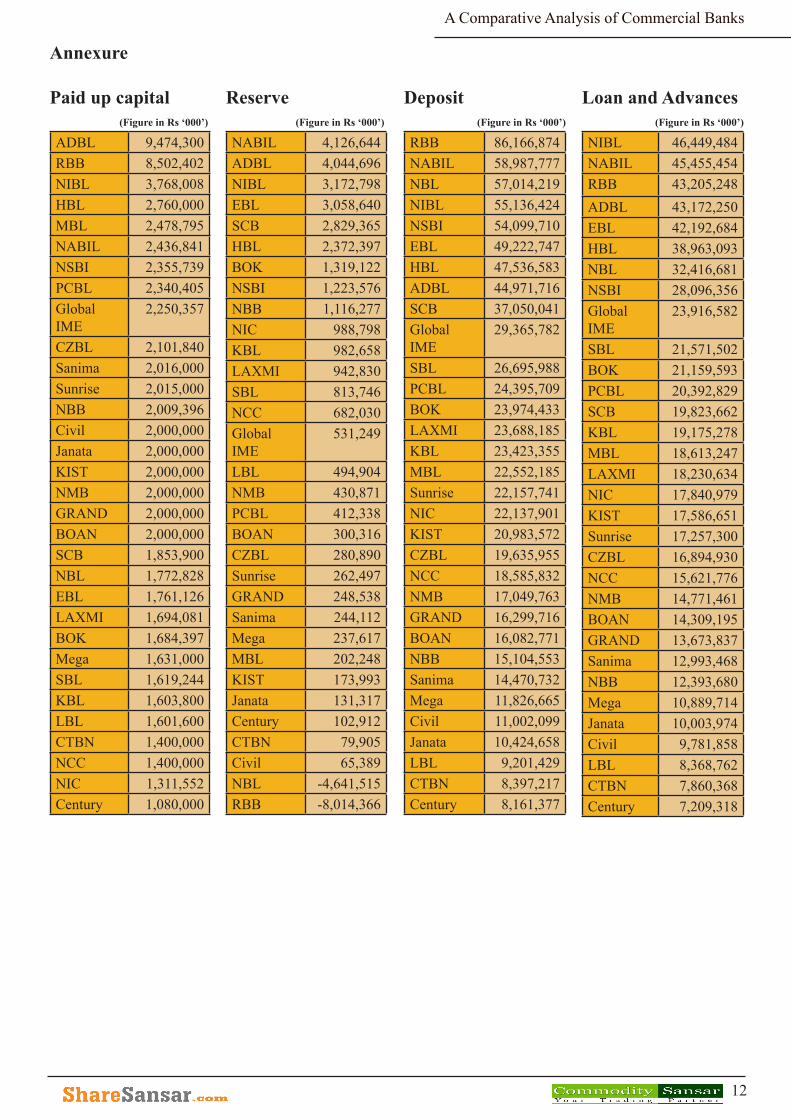
Annexure
Paid up capital(Figure in Rs ‘000’)
ADBL 9,474,300RBB 8,502,402NIBL 3,768,008HBL 2,760,000MBL 2,478,795NABIL 2,436,841NSBI 2,355,739PCBL 2,340,405Global IME
2,250,357
CZBL 2,101,840Sanima 2,016,000Sunrise 2,015,000NBB 2,009,396Civil 2,000,000Janata 2,000,000KIST 2,000,000NMB 2,000,000GRAND 2,000,000BOAN 2,000,000SCB 1,853,900NBL 1,772,828EBL 1,761,126LAXMI 1,694,081BOK 1,684,397Mega 1,631,000SBL 1,619,244KBL 1,603,800LBL 1,601,600CTBN 1,400,000NCC 1,400,000NIC 1,311,552Century 1,080,000
Reserve(Figure in Rs ‘000’)
NABIL 4,126,644ADBL 4,044,696NIBL 3,172,798EBL 3,058,640SCB 2,829,365HBL 2,372,397BOK 1,319,122NSBI 1,223,576NBB 1,116,277NIC 988,798KBL 982,658LAXMI 942,830SBL 813,746NCC 682,030Global IME
531,249
LBL 494,904NMB 430,871PCBL 412,338BOAN 300,316CZBL 280,890Sunrise 262,497GRAND 248,538Sanima 244,112Mega 237,617MBL 202,248KIST 173,993Janata 131,317Century 102,912CTBN 79,905Civil 65,389NBL -4,641,515RBB -8,014,366
Deposit(Figure in Rs ‘000’)
RBB 86,166,874 NABIL 58,987,777 NBL 57,014,219 NIBL 55,136,424 NSBI 54,099,710 EBL 49,222,747 HBL 47,536,583 ADBL 44,971,716 SCB 37,050,041 Global IME
29,365,782
SBL 26,695,988 PCBL 24,395,709 BOK 23,974,433 LAXMI 23,688,185 KBL 23,423,355 MBL 22,552,185 Sunrise 22,157,741 NIC 22,137,901 KIST 20,983,572 CZBL 19,635,955 NCC 18,585,832 NMB 17,049,763 GRAND 16,299,716 BOAN 16,082,771 NBB 15,104,553 Sanima 14,470,732 Mega 11,826,665 Civil 11,002,099 Janata 10,424,658 LBL 9,201,429 CTBN 8,397,217 Century 8,161,377
Loan and Advances(Figure in Rs ‘000’)
NIBL 46,449,484 NABIL 45,455,454 RBB 43,205,248 ADBL 43,172,250 EBL 42,192,684 HBL 38,963,093 NBL 32,416,681 NSBI 28,096,356 Global IME
23,916,582
SBL 21,571,502 BOK 21,159,593 PCBL 20,392,829 SCB 19,823,662 KBL 19,175,278 MBL 18,613,247 LAXMI 18,230,634 NIC 17,840,979 KIST 17,586,651 Sunrise 17,257,300 CZBL 16,894,930 NCC 15,621,776 NMB 14,771,461 BOAN 14,309,195 GRAND 13,673,837 Sanima 12,993,468 NBB 12,393,680 Mega 10,889,714 Janata 10,003,974 Civil 9,781,858 LBL 8,368,762 CTBN 7,860,368 Century 7,209,318
12
A Comparative Analysis of Commercial Banks
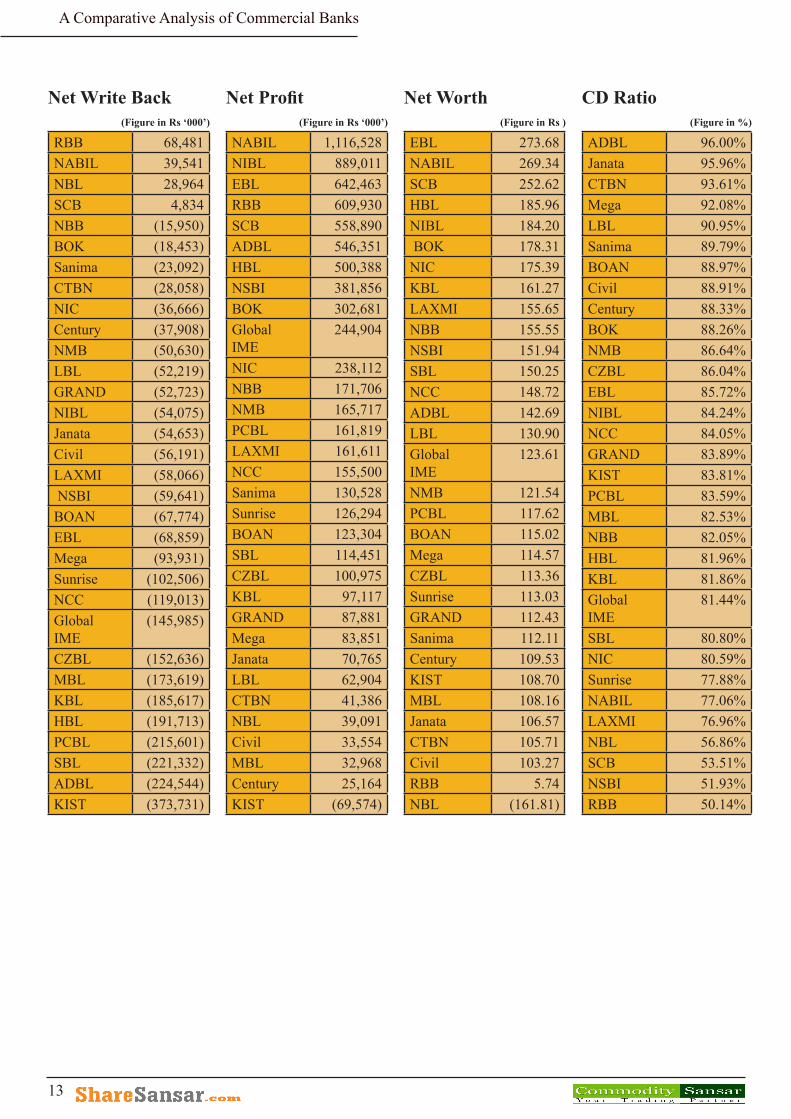
Net Write Back(Figure in Rs ‘000’)
RBB 68,481 NABIL 39,541 NBL 28,964 SCB 4,834 NBB (15,950)BOK (18,453)Sanima (23,092)CTBN (28,058)NIC (36,666)Century (37,908)NMB (50,630)LBL (52,219)GRAND (52,723)NIBL (54,075)Janata (54,653)Civil (56,191)LAXMI (58,066) NSBI (59,641)BOAN (67,774)EBL (68,859)Mega (93,931)Sunrise (102,506)NCC (119,013)Global IME
(145,985)
CZBL (152,636)MBL (173,619)KBL (185,617)HBL (191,713)PCBL (215,601)SBL (221,332)ADBL (224,544)KIST (373,731)
Net Profit(Figure in Rs ‘000’)
NABIL 1,116,528 NIBL 889,011 EBL 642,463 RBB 609,930 SCB 558,890 ADBL 546,351 HBL 500,388 NSBI 381,856 BOK 302,681 Global IME
244,904
NIC 238,112 NBB 171,706 NMB 165,717 PCBL 161,819 LAXMI 161,611 NCC 155,500 Sanima 130,528 Sunrise 126,294 BOAN 123,304 SBL 114,451 CZBL 100,975 KBL 97,117 GRAND 87,881 Mega 83,851 Janata 70,765 LBL 62,904 CTBN 41,386 NBL 39,091 Civil 33,554 MBL 32,968 Century 25,164 KIST (69,574)
Net Worth(Figure in Rs )
EBL 273.68 NABIL 269.34 SCB 252.62 HBL 185.96 NIBL 184.20 BOK 178.31 NIC 175.39 KBL 161.27 LAXMI 155.65 NBB 155.55 NSBI 151.94 SBL 150.25 NCC 148.72 ADBL 142.69 LBL 130.90 Global IME
123.61
NMB 121.54 PCBL 117.62 BOAN 115.02 Mega 114.57 CZBL 113.36 Sunrise 113.03 GRAND 112.43 Sanima 112.11 Century 109.53 KIST 108.70 MBL 108.16 Janata 106.57 CTBN 105.71 Civil 103.27 RBB 5.74 NBL (161.81)
CD Ratio(Figure in %)
ADBL 96.00%Janata 95.96%CTBN 93.61%Mega 92.08%LBL 90.95%Sanima 89.79%BOAN 88.97%Civil 88.91%Century 88.33%BOK 88.26%NMB 86.64%CZBL 86.04%EBL 85.72%NIBL 84.24%NCC 84.05%GRAND 83.89%KIST 83.81%PCBL 83.59%MBL 82.53%NBB 82.05%HBL 81.96%KBL 81.86%Global IME
81.44%
SBL 80.80%NIC 80.59%Sunrise 77.88%NABIL 77.06%LAXMI 76.96%NBL 56.86%SCB 53.51%NSBI 51.93%RBB 50.14%
13
A Comparative Analysis of Commercial Banks
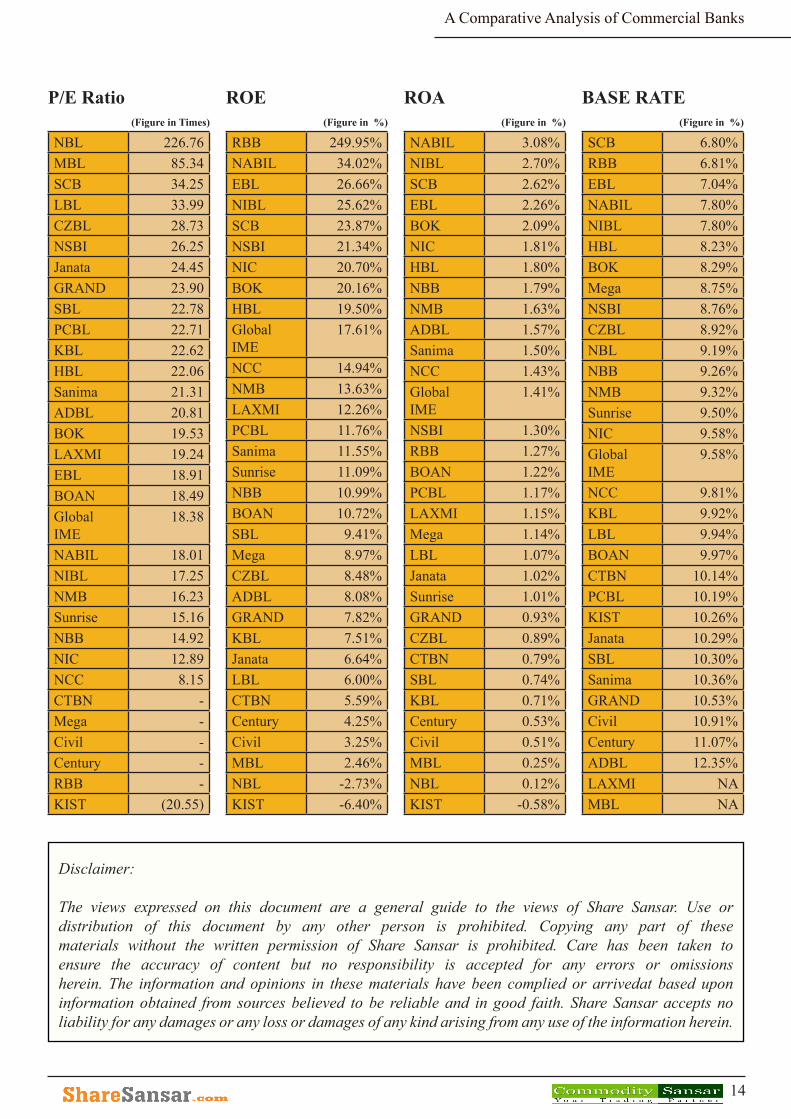
ROE(Figure in %)
RBB 249.95%NABIL 34.02%EBL 26.66%NIBL 25.62%SCB 23.87%NSBI 21.34%NIC 20.70%BOK 20.16%HBL 19.50%Global IME
17.61%
NCC 14.94%NMB 13.63%LAXMI 12.26%PCBL 11.76%Sanima 11.55%Sunrise 11.09%NBB 10.99%BOAN 10.72%SBL 9.41%Mega 8.97%CZBL 8.48%ADBL 8.08%GRAND 7.82%KBL 7.51%Janata 6.64%LBL 6.00%CTBN 5.59%Century 4.25%Civil 3.25%MBL 2.46%NBL -2.73%KIST -6.40%
P/E Ratio(Figure in Times)
NBL 226.76 MBL 85.34 SCB 34.25 LBL 33.99 CZBL 28.73 NSBI 26.25 Janata 24.45 GRAND 23.90 SBL 22.78 PCBL 22.71 KBL 22.62 HBL 22.06 Sanima 21.31 ADBL 20.81 BOK 19.53 LAXMI 19.24 EBL 18.91 BOAN 18.49 Global IME
18.38
NABIL 18.01 NIBL 17.25 NMB 16.23 Sunrise 15.16 NBB 14.92 NIC 12.89 NCC 8.15 CTBN - Mega - Civil - Century - RBB - KIST (20.55)
ROA(Figure in %)
NABIL 3.08%NIBL 2.70%SCB 2.62%EBL 2.26%BOK 2.09%NIC 1.81%HBL 1.80%NBB 1.79%NMB 1.63%ADBL 1.57%Sanima 1.50%NCC 1.43%Global IME
1.41%
NSBI 1.30%RBB 1.27%BOAN 1.22%PCBL 1.17%LAXMI 1.15%Mega 1.14%LBL 1.07%Janata 1.02%Sunrise 1.01%GRAND 0.93%CZBL 0.89%CTBN 0.79%SBL 0.74%KBL 0.71%Century 0.53%Civil 0.51%MBL 0.25%NBL 0.12%KIST -0.58%
14
Disclaimer:
The views expressed on this document are a general guide to the views of Share Sansar. Use or distribution of this document by any other person is prohibited. Copying any part of these materials without the written permission of Share Sansar is prohibited. Care has been taken to ensure the accuracy of content but no responsibility is accepted for any errors or omissions herein. The information and opinions in these materials have been complied or arrivedat based upon information obtained from sources believed to be reliable and in good faith. Share Sansar accepts no liability for any damages or any loss or damages of any kind arising from any use of the information herein.
BASE RATE(Figure in %)
SCB 6.80%RBB 6.81%EBL 7.04%NABIL 7.80%NIBL 7.80%HBL 8.23%BOK 8.29%Mega 8.75%NSBI 8.76%CZBL 8.92%NBL 9.19%NBB 9.26%NMB 9.32%Sunrise 9.50%NIC 9.58%Global IME
9.58%
NCC 9.81%KBL 9.92%LBL 9.94%BOAN 9.97%CTBN 10.14%PCBL 10.19%KIST 10.26%Janata 10.29%SBL 10.30%Sanima 10.36%GRAND 10.53%Civil 10.91%Century 11.07%ADBL 12.35%LAXMI NAMBL NA