Embed Size (px)
Citation preview


An analysis of factors influencing renewable energy deployment in the EU’s electricity sector
ABHISHEK SHIVAKUMAR
Doctoral Thesis 2018
KTH Royal Institute of Technology
Industrial Engineering and Management
Department of Energy Technology
Unit of Energy Systems Analysis
SE-100 44 Stockholm, Sweden

TRITA-ITM-AVL 2018:14
ISBN 978-91-7729-787-1
© Abhishek Shivakumar, 2018
Akademisk avhandling som med tillstånd av KTH i Stockholm framlägges till offentlig
granskning för avläggande av teknisk doktorsexamen fredagen den 1 juni 2018 kl. 10:00 i sal
Q2, Osquldas väg 10, KTH, Stockholm. Avhandlingen försvaras på engelska.

i
Abstract
The EU has set itself ambitious short- and long-term decarbonisation
targets: a reduction in greenhouse gas (GHG) emissions of 40% by 2030
and 80% by 2050, compared to 1990 levels. The power generation sector,
currently responsible for around 55% of GHG emissions, is expected to
contribute significantly to achieving the EU’s decarbonisation targets.
Increasing the share of energy from renewable sources (RES), such as wind
and solar, is an important step towards decarbonising the power
generation sector. This dissertation analyses drivers, enablers, and barriers
to renewable energy deployment in the EU’s electricity sector.
The transition to power generation from renewable energy sources is
strongly driven by targets and policies. In this dissertation, past RES
deployment trajectories in selected EU Member States (MS) are studied to
identify the most effective drivers to increasing deployment in the past as
well as barriers that may potentially hinder its progress. A meta-analysis of
previous studies shows the significant variance in projected levels of RES-
E shares in the EU. While no study is expected to accurately predict future
levels of RES-E, the meta-analysis showed their sensitivity to underlying
data, assumptions, and methodologies. However, not all projection studies
- and the energy strategies based on them – explicitly state their underlying
assumptions.
Technologies such as energy storage and smart grids can enable the
increased penetration of variable RES by providing flexibility to the
system. Here, the role and potential of large-scale electricity storage to
enable higher shares of RES penetration is assessed using a combination
of a long-term energy system (TIMES) and a power system model
(PLEXOS). Further, the regulatory treatment of technologies such as
energy storage is analysed and with suggested updates are provided to
reflect their evolving role in the energy system. The thesis verifies findings
in other studies that multiple benefits are required to justify battery storage
in the EU until 2030. Further, this dissertation shows a clear correlation
between degree of RES implementation and the value of storage. This is
illustrated by the difference in feasibility of storage in the Reference
scenarios and CO2 scenarios. Under current cost estimations and policy
framework, there is no business case for large-scale electricity storage in
the EU until 2030 with the technologies considered, but it may become

ii
feasible by 2050 in selected markets. Further studies - including how
multiple benefits could be used and consideration of other storage
technologies - would provide additional insights on the potential role of
large-scale electricity storage. The current status of smart energy solutions
- such as smart meters and demand side management – in the EU is also
studied in this dissertation. The study finds that the current emphasis on
smart meter roll-outs must be followed up with measures such as real-time
pricing in order to achieve the full potential of smart energy solutions.
Increasing the share of variable RES also brings with it significant
challenges. As the EU moves towards an internal energy market, the role
of cross-border interconnectors will become crucial. This dissertation
highlights the role that cross-border interconnectors are expected to play -
such as enabling large-scale integration of variable RES, preventing loss of
load, and ensuring cost-effective power generation – through a power
system model, with an hourly resolution, of the EU’s power system in
2030.
Finally, the transition to a system with high shares of variable RES must be
achieved while maintaining, or improving upon, the high level of reliability
currently enjoyed in the EU. Valuing electricity interruptions differently
between EU MS may lead to mismatched incentives to improve reliability
levels through cross-border interconnectors. This dissertation, for this first
time, quantifies the differences in value of lost load for households across
all twenty-eight EU Member States.
The EU is on track to meet its 2020 RES targets, which are legally binding
at the Member State level. The targets set in the 2030 climate and energy
framework are only legally binding at the EU level and this is seen as a risk
since Member States may not be sufficiently incentivised to invest in RES
deployment beyond 2020. This dissertation analyses selected drivers,
barriers, and enablers of renewable energy deployment in the EU’s
electricity sector to help achieve the EU’s stated decarbonisation targets.
In particular, the potential role of large-scale electricity storage and cross-
border interconnectors is highlighted as being of crucial importance.
Finally, the variance in costs of electricity supply interruptions across the
EU is also presented as a potential barrier to increased RES-E penetration.
Keywords: renewable energy; energy storage; interruption costs; long-
term energy models; cross-border interconnectors; European Union.

iii
Sammanfattning
EU har förbundit sig att nå ambitiösa kort- och långsiktiga mål för utsläpp
av växthusgaser. Jämfört med år 1990, ska utsläppet minska med 40% till
år 2030 och med 80% till år 2050. Sektorn för kraftproduktion som idag
ansvarar för cirka 55% av utsläppen, förväntas bidra avsevärt för att uppnå
EU: s mål om att bli oberoende av kol. Att öka andelen energikällor (FE),
som vind och sol, är ett viktigt steg mot en kol fri energi sektor. I denna
avhandling analyseras drivkrafter, stöd och hinder som påverkar
utvecklingen av förnybar energin inom EU: s elsektor.
Övergången till elproduktion genom förnybara energikällor drivs starkt av
politiska mål. I denna avhandling genomförs en undersökning av tidigare
FE spridningsbanor för utvalda EU-medlemsstater (MS). Det ska även
beskriva de mest effektiva drivkrafterna för ökad utveckling historiskt sett,
samt de hinder som potentiellt kan ha påverkat deras framsteg. En
metaanalys av tidigare studier visar den stora variationen som finns bland
projekterade andelar FE i EU. Trots att ingen studie förväntas exakt
förutsäga framtida nivåer av RES-E, så visade metaanalysen sin känslighet
för underliggande data, antaganden och metoder. Det finns dock inte alltid
tydliga uttryck för de grundläggande antaganden avseende alla
projektstudier samt för de energistrategier som de basaras på.
Teknologier som energilagring och smarta nät erbjuder flexibilitet till
systemet där de kan då möjliggöra ökad penetration av variabel FES
(Förnybara Energi System). Här används en kombination av ett långsiktigt
energisystem (TIMES) och en energisystemmodell (PLEXOS) för att
utvärdera rollen och potentialen för storskalig ellagring. Vidare analyseras
den regulatoriska behandlingen av teknologier, som t.ex. energilagring,
och uppdateringar som speglar deras utvecklingsroll i energisystemet.
Denna avhandling bekräftar resultaten från andra studier som visar att det
krävs många fördelar för att rättfärdiga användning av batterilagring i EU
före år 2030. Avhandlingen uppvisar också en tydlig korrelation mellan
graden av FES tillämpning och värdet av lagringssystem. Detta illustreras
av mellanskillnaden mellan det som finns för lagringssystem i Referens och
CO2-scenarierna. Enligt nyvarande beräkningar för framtida kostnader
samt politiska ramar finns det ingen affärsplan för storskalig ellagring i EU
före år 2030. Med de nämnda teknologierna, kan det dock bli
genomförbart på utvalda marknader år 2050. Ytterligare studier, inklusive

iv
hur deras mångfaldiga fördelar kan användas och med hänsyn taget till
andra lagringstekniker, skulle ge utökad insikt om den roll en storskalig
ellagring skulle innebära. Denna avhandling studerar också den nuvarande
statusen för smarta energilösningar i EU såsom smarta elmätare och
efterfrågehantering. Den konstaterar att den nuvarande inriktningen på
smarta mätare måste följas upp med åtgärder, såsom realtids prissättning,
för att uppnå den bästa energilösningen. Att öka andelen av variabeln FES,
innebär också stora utmaningar. Rollen som speglas av internationella
sammanlänkningar ska bli avgörande när det gäller EU:s väg mot en inre
energimarknad. Denna avhandling använder en kraftsystemsmodell av
EU:s elsystem för år 2030 med en ”en timme” upplösning för att belysa
den roll som dessa sammankopplingar förväntas spela. Det ska bli möjligt
att genomföra en storskalig integration av variabel RES, förhindra
förlusten av förväntad belastning och säkerställa kostnadseffektiv
kraftproduktion.
Slutligen måste övergången till ett system med höga andelar av variabel
FES kunna uppnås, samtidigt som den höga tillförlitligheten som man för
närvarande åtnjuter i EU, upprätthållas eller förbättras. Uppkomsten av
elavbrott, värderas olika i EU: s medlemsstater. Det kan i sin tur leda till
ojämna incitament avseende viljan att förbättra tillförlitligheten genom
internationella sammanlänkningar. Denna avhandling kvantifierar för
första gången skillnaderna i värdet av belastningsförlust för hushållen i
samtliga tjugoåtta EU-medlemsstater.
EU är på rätt väg för att uppfylla sina år 2020-mål, som är juridiskt
bindande på medlemsstatsnivå. Målen som ställs för år 2030-ramen
avseende klimat och energi är bara juridiskt bindande på EU-nivå, vilket
anses som en risk då medlemsstaterna därmed inte får tillräckligt med
incitament för att investera i FES-utbyggnad efter år 2020. Denna
avhandling analyserar utvalda drivkrafter, hinder och stöd för förnybar
energiutveckling inom EU: s elsektor. Den ska bidra till att uppnå EU: s
fastställda mål för att bli oberoende av kol. I synnerhet betonas de stora
roller som storskalig ellagring och internationella sammanlänkningar har.
Slutligen presenteras även variationen i strömavbrottskostnader i hela
EU som ett potentiellt hinder för ökad FES-E-penetration.
Nyckelord: förnybar energi; energilagring; avbrottskostnader;
långsiktiga energimodeller; internationella sammanlänkningar;
Europeiska Unionen.

v
Acknowledgements
I have come to learn that the old saying, “it takes a village to raise a child”,
apparently holds true for PhD theses as well. First and foremost, I am
eternally grateful to Prof. Mark Howells. Mark has been as much a friend
and colleague as a PhD advisor and mentor. It has been a privilege to join
him on the rollercoaster ride that is KTH-dESA. Most of all, I thank Mark
for showing me a vocation that I find meaningful, interesting, and worth
pursuing. I am also grateful to Prof. Holger Rogner for generously sharing
both his time and wisdom. He is a role model and inspiration to many
young researchers, including myself. I feel lucky and proud to be able to
call Mark and Holger my PhD advisors. I also thank for Prof. Viktoria
Martin for her kind support throughout my time at KTH, from
coordinating the SELECT Masters programme to reviewing my PhD thesis.
Anyone who has been at KTH-dESA knows that it is a unique and close-
knit group that enjoys each other’s company both at and outside of work.
This thesis would not have been possible without Constantinos and
Vignesh, friends with whom I’ve shared this journey from start to end. I am
also thankful to Giannis, Dimitris, Alexandros, Francesco Gardumi,
Eunice, Francesco Fuso Nerini, Rebecka, Youssef, Shahid, Agnese, Hauke,
Georgios, Nandi, and Gabi for their support, kindness, humour, and
advice. Oliver and Manuel – both friends and former colleagues -
supported me at key moments during the thesis. Lucia, Nawfal, Maria,
Maarten, and João made each day at work and beyond more fun. I also
thank Anneli for her patience and frequent help throughout my time at
KTH-dESA.
I spent a majority of my time at KTH-dESA working on the INSIGHT_E
project, which led to the research presented in this thesis. Working with
Audrey Dobbins, Louise Coffineau, Aurélie Faure, Paul Deane, Steve Pye,
Tom Kober, Claude Ayache, Bo Normark, Ulrich Fahl, Karine Pollier, Remy
Denos and others on the INSIGHT_E project was a learning experience
that I am grateful for.
Last but not least, I would like to thank my wonderful family. Appa, Amma,
and Shreyas are a constant source of joy and unconditional love. Shiva
uncle and Vidu aunty have supported and encouraged me throughout.
Finally, I am thankful to Vas for her love, patience, and laughter. And for
not asking me to call her “Dr.”.

vi

vii
List of appended papers
This thesis is based on the following scientific papers:
Paper I
A. Shivakumar, A. Dobbins, U. Fahl, A. Singh, “Drivers of renewable
energy deployment in the EU: an analysis of past trends and projections”,
Energy Strategy Reviews, [Under review]
Paper II
A. Shivakumar, A. Faure, B. Normark, S. Gupta, T. Kober, C. Bauer, Z.
Xiaojin, “Redefining electricity storage for a redesigned market in the EU”,
Energy Policy, [Submitted]
Paper III
A. Shivakumar, S. Pye, J. Anjo, M. Miller, P. Boutinard, T. Kober, M.
Densing, “Smart energy solutions in the EU: state of play and measuring
progress”, Energy Strategy Reviews, vol. 20, pp. 133-149, April 2018,
(https://doi.org/10.1016/j.esr.2018.02.005)
Paper IV
M. Brinkerink, A. Shivakumar, “System dynamics within typical days of
a high variable 2030 European power system”, Energy Strategy Reviews,
[Under review]
Paper V
A. Shivakumar, M. Welsch, C. Taliotis, M. Howells, D. Jakšić, T.
Baričević, S. Gupta, H. Rogner, “Valuing lost leisure: Estimating electricity
interruption costs for households across the European Union”, Journal of
Energy Research & Social Science, vol. 34, pp. 39-48, 2017
(http://dx.doi.org/10.1016/j.erss.2017.05.010)
Book chapter
A. Shivakumar, C. Taliotis, P. Deane, J. Gottschling, R. Pattupara, R.
Kannan, D. Jakšić, K. Stupin, R.V. Hemert, B. Normark, A. Faure, ‘Chapter
21 - Need for Flexibility and Potential Solutions’, Europe’s Energy
Transition - Insights for Policy Making, Academic Press, 2017

viii

ix
Table of Contents
1 Introduction _________________________________ 1
Scope and aim _____________________________________ 5
1.1.1 Research objective _______________________________ 5
1.1.2 Research questions ______________________________ 5
Literature review and identified gaps __________________ 5
1.2.1 Role of large-scale electricity storage in the EU_________ 5
1.2.2 Role of cross-border interconnectors in the EU _________ 7
1.2.3 VoLL estimation studies ___________________________ 9
Contributions to the state of the art __________________ 11
1.3.1 Appended papers _______________________________ 11
1.3.2 Additional reports and publications _________________ 14
2 Methods ___________________________________ 16
Identifying drivers of past RES-E deployment in the EU __ 16
2.1.1 Selection of RES-E technologies ___________________ 17
2.1.2 Selection of deployment pathway types ______________ 17
2.1.3 Selection of representative Member States ___________ 18
Optimisation models _______________________________ 19
2.2.1 Role of storage: Soft-linking long-term (TIMES) and hourly
dispatch (PLEXOS) models ______________________________ 20
2.2.2 Role of interconnectors: Analysis of ENTSO-E ‘visions’ using
a dispatch model _______________________________________ 24
Estimation of Value of Lost Load (VoLL) ______________ 31
3 Results and discussion ______________________ 35
Past RES-E deployment and projections ______________ 35
3.1.1 Germany ______________________________________ 36

x
3.1.2 Ireland ________________________________________ 38
3.1.3 Spain _________________________________________ 41
3.1.4 Summary of case studies _________________________ 44
3.1.5 RES-E deployment projections _____________________ 45
Electricity storage _________________________________ 47
3.2.1 Capacity Expansion _____________________________ 48
3.2.2 Cost of capacity expansion ________________________ 52
3.2.3 Value of storage ________________________________ 53
Role of interconnectors in the EU electricity system _____ 54
3.3.1 Impact of variable generation on flow dynamics ________ 55
3.3.2 Dispersing renewable surplus electricity ______________ 56
3.3.3 Dynamics with foreign PHS fleets ___________________ 58
3.3.4 Preventing loss of load ___________________________ 59
Costs of electricity supply interruptions _______________ 60
4 Conclusions ________________________________ 64
Key messages ____________________________________ 64
Recommendations and future work ___________________ 68
Impact of the thesis ________________________________ 69

xi
List of Figures
Figure 1 - Basis of characterising deployment pathways across all EU
Member States .............................................................................................. 18
Figure 2 - EUSTEM regions [59] ................................................................. 21
Figure 3 - Intra-annual details in EUSTEM [59] ...................................... 22
Figure 4 - Example load profiles of Germany (DE) for V3 and V4 to
showcase the difference between the profile with (V4) and without (V3)
high predetermined impact of DR applications ........................................ 30
Figure 5 - Support scheme characteristics, realized percentage of predicted
2050 potential in 2013, annual and cumulative new installed power
capacity, estimated NREAP trajectories and identified investment sections
in Germany. Support scheme graphic [56], Data from [69], Eurostat .... 36
Figure 6 - Expected average to maximum profit ranges in Germany. Data:
[52–54, 56] .................................................................................................. 37
Figure 7 - Support scheme characteristics, realized percentage of predicted
2050 potential in 2013, annual and cumulative new installed power
capacity, estimated NREAP trajectories and identified investment sections
in Ireland. Support scheme graphic [56], Data from [69], Eurostat and
Ireland’s NREAP ......................................................................................... 39
Figure 8 - Expected average to maximum profit ranges in Ireland; Data
from [52–54, 56] ......................................................................................... 40
Figure 9 - Support scheme characteristics, realized percentage of predicted
2050 potential in 2013, annual and cumulative new installed power
capacity, estimated NREAP trajectories and identified investment sections
in Spain. Support scheme graphic [56], Data from [69], Eurostat .......... 42
Figure 10 - Expected average to maximum profit ranges in Spain, Data:
[52–54, 56] .................................................................................................. 43
Figure 11 - Categorisation of factors identified through case studies and
their influence on RES-E deployment ....................................................... 45
Figure 12 - Comparison of projected shares of RES-E in electricity
generation by 2030 based on different modelling studies and scenarios 46
Figure 13 - Electricity capacity expansion (Germany) .............................. 49

xii
Figure 14 - Electricity capacity expansion (France).................................. 50
Figure 15 - Electricity capacity expansion (Italy) .......................................51
Figure 16 - 2030 cross-border transmissions Germany July 17 and
February 13. Negative values indicate import; positive values indicate
export. Lines of the DE-CZ and DE-SE connections are dashed to show the
underlying connections of DE-PL and DE-BE at equal load. ................... 55
Figure 17 - Electricity generation and consumption in Denmark (DK) and
Germany (DE) on April 18, 2030................................................................ 57
Figure 18 - Electricity generation and consumption in Austria (AT) and
Germany (DE) on July 17, 2030. ................................................................ 58
Figure 19 - Electricity generation and consumption in Germany (DE) and
Poland, December 5, 2030. ......................................................................... 59
Figure 20 - Comparison of VoLL in EU households by Member State .... 61
Figure 21 - Time-varying VoLL by EU Member State ............................... 63
xiii
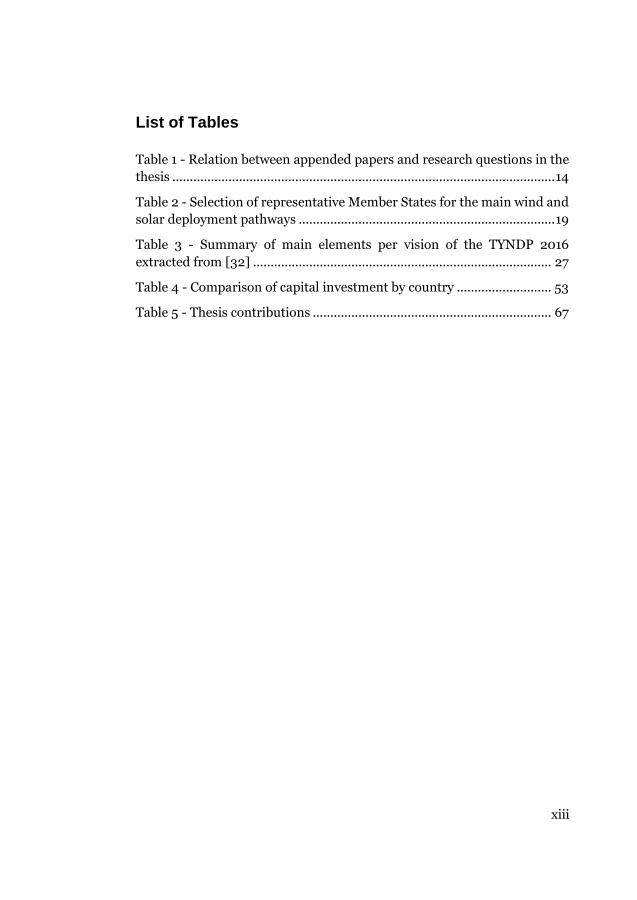
List of Tables
Table 1 - Relation between appended papers and research questions in the
thesis ............................................................................................................. 14
Table 2 - Selection of representative Member States for the main wind and
solar deployment pathways ......................................................................... 19
Table 3 - Summary of main elements per vision of the TYNDP 2016
extracted from [32] ..................................................................................... 27
Table 4 - Comparison of capital investment by country ........................... 53
Table 5 - Thesis contributions .................................................................... 67

1
1 Introduction
The European Union (EU) has a clearly stated commitment to making
energy more affordable, secure, and sustainable [1]. This has translated
into targets for a reduction in greenhouse gas (GHG) emissions, an
increase in the share of energy coming from of renewable energy sources
(RES), and improvements in energy efficiency. The EU has long been a
global leader in promoting and developing renewable energy. Adopted in
2009, the 2020 climate and energy package [2] set a target for 20% of
gross final energy consumption in the EU to come from RES by 2020 and
paved the way for the first Renewable Energy Directive (RED) [3]. The
Directive includes legally binding national targets and is complemented by
a National Renewable Energy Action Plan (NREAP) for each EU Member
State. In 2014, the EU proposed the 2030 climate and energy framework
[4] in order to reaffirm its commitment to renewables for the period after
2020. The framework set a target of 27% of gross final energy consumption
in the EU to come from RES by 2030. However, unlike the 2020 targets,
the 2030 targets are not legally binding at the Member State level but only
at the EU level. With no power to enforce these targets, the EU must rely
on formulating effective policies and designing efficient markets in order
to achieve the 2030 RES target. To this end, the Clean Energy for All
Europeans package was launched in 2016 [5] consisting of proposals for a
revised Renewable Energy Directive (RED II) [6] and a new Electricity
Market Design ‘rulebook’ [7].
With an increase in the share of renewables from 8.4% in 2004 to 16.7% in
2017, the EU is on track to achieve its 2020 RES target 1. This share of
renewables is divided across three sectors: electricity (RES-E), heating and
cooling, (RES-H/C) and transport (RES-T). While the largest deployment
of renewables in absolute terms has been in the RES-H/C, the RES-E sector
has the highest RES share and has grown the fastest since 2004. Further,
it is expected to support the decarbonisation in the other two sectors as
well [8]. The revised Renewable Energy Directive sets a target for 50% of
electricity in the EU to come from RES by 2030, a significant increase from
1 Eurostat (nrg_100a) and (nrg_107a)

2
the present level of 29% [6]. This ambitious level for RES-E deployment
must be achieved against the challenging backdrop of targets that are non-
binding at the Member State level, as mentioned previously. Further, much
of it will come from intermittent RES such as wind and solar. The new
Electricity Market Design ‘rulebook’ is intended to address these concerns.
It introduces rules “adapted to fast-evolving technologies… to increase the
flexibility of the system and ensure security of electricity supplies” [7].
‘Flexibility’ in the context of the electricity system is the “extent to which a
power system can adjust the balance of electricity production and
consumption in response to variability, expected or otherwise” 2 .
Traditionally, power system flexibility was provided almost exclusively by
controlling the supply side. In systems with increasing shares of variable
renewable energy sources, additional flexibility is needed to maintain
system reliability. This is because they displace traditional, more flexible
supply side options and thus reduce the available flexibility within the
system. In addition, their inherent stochastic nature, or unpredictability by
virtue of being a random process, simultaneously increases the need for
flexibility. This has created a “flexibility gap”. One promising option to
provide flexibility to the energy system is energy storage [9]. It has
increasingly come into focus as a key enabling technology in the energy
system. In recent years, for instance, there has been a significant shift
towards the Li-ion battery technology, not only for small-scale storage and
electric vehicles but also for large scale applications. It is therefore critical
to assess the role of storage in the EU’s electricity system and identify the
regulatory elements likely to influence technology development.
Increased RE penetration is typically supported through efforts on the
supply side such as the availability of fast-acting reserves and grid-level
energy storage through pumped hydropower. With rapidly falling costs of
RE technologies and supported by the advent of ‘smart energy solutions’ –
smart meters and demand side management – consumers can now invest
in, generate, share, consume, and store electricity from RES. The EU is,
therefore, increasingly looking to harness the potential of the demand side
to support RE deployment as well. This is reflected in the revised
2 “Renewables Grid Integration and Variability”, IEA, 2014

3
Renewable Energy Directive which lists ‘Empowering and informing
consumers’ as one of six main areas for action. ‘Smart energy solutions’
could also provide consumers with ways to reduce costs by shifting demand
through improved information and automation to optimize energy use,
and by moving towards becoming prosumers. However, the widespread
use of smart energy solutions should not be a goal itself, but rather be seen
as one enabler amongst many [10]. Smart energy solutions must be
assessed in the context of providing flexibility to power systems and,
ultimately, helping to achieve the goal of RES deployment.
Half of the EU’s electricity supply in 2030 is expected to come from RES, a
majority of which will be from intermittent sources such as wind and solar
photovoltaics (PV) [11]. One approach for the EU’s power system to handle
increasing levels of intermittent RES without compromising reliability is a
fully-integrated internal EU energy market, where electricity can flow
freely between all Member States [12]. This would allow for electricity to
be generated at the lowest marginal cost across the EU. Further, it would
mitigate the impact of surplus electricity generation in one Member State
by balancing supply and demand across the EU [13]. The benefits of a fully-
integrated electricity system are apparent from an EU perspective.
However, progress in this direction is delayed for several reasons such as
low local public acceptance for new interconnection lines, political aspects
such as protection of national interests (e.g. nuclear industry in France
reluctant to accept the influx of cheap renewable electricity) or high costs
of developing interconnector [14] . The EU has a set a goal for all Member
States to achieve a minimum cross-border transmission capacity - relative
to nationally installed generation capacity - of 10% by 2020 and 15% by
2030 [11,12]. With average cross-border transmission capacity stagnant at
around 8% [12], the lack of interconnectors between EU Member States
can act as a barrier to future RES-E deployment. Highlighting and
quantifying the value of interconnectors between Member States to
achieving the EU’s RES targets is crucial to overcoming this barrier.
While the EU has enjoyed a high degree of supply security during the last
few decades, the utility industry has identified ‘liberalization and
privatization’ (which largely took place in the 1990s) and ‘renewable
capacity expansion’ as the two major trends that increase the risk of power
outages [15,16]. Increased shares of renewable energy sources (RES)
affects energy security in several ways. From a long-term perspective,
increased shares of RE positively affect energy security due to decreased

4
reliance on depletable, and often imported, fossil fuels. In the short-term,
however, the variability and temporal mismatch between demand and
supply poses a considerable challenge to the integration of RES [18, 19].
Most grid expansion options involve significant investment expenditures,
which must be justified by the potential adverse impact of compromising
power supply security. As the EU moves towards a fully integrated
electricity market, a clear understanding of the costs of interruptions
across all Member States would be an important step to decide on an
‘optimal’ level of supply security. From a socio-economic perspective , the
most commonly used indicator to measure interruption costs is the value
of lost load (VoLL3). VoLL is likely to play a significant part in informing a
number of key areas of European energy policy and market design. In
Capacity Markets, for instance, the amount of electricity generating
capacity required in each EU Member State (MS) and that will be
contracted through a Capacity Market is likely to be informed by the VoLL.
For balancing markets, VoLL can represent the cost of electricity
interruptions to end-users [20, 21]. VoLL will therefore be used in a range
of policy and market design decisions at both the EU level and Member
State levels.
In summary, the EU’s Clean Energy for All Europeans package currently
only provides broad guidelines for the post-2020 period. However,
important details and specifications - such as remuneration levels for
flexibility services, electricity storage, capacity reserves, and
interconnector capacities - are as yet undecided. In order to do so, it is
crucial to quantify the drivers, enablers, and barriers that influence the
deployment of RE technologies in the EU. Quantifying the key factors
influencing RE deployment in the EU is an important first step towards
this. Such knowledge will support the formulation of effective policies and
efficient functioning of markets required to achieve the EU’s RES targets
post-2020.
3 Other terms that are used synonymously with VoLL include “electricity outage costs”,
“cost of unserved energy”, or “customer service reliability”
5
Scope and aim
1.1.1 Research objective
To quantify the key drivers, enablers, and barriers of renewables
deployment in the EU electricity sector
1.1.2 Research questions
Research question I: What are the key policy drivers of renewable energy deployment in the EU?
Research question II: To what extent can flexibility through
energy storage and cross-border interconnectors
contribute to achieving the EU renewable energy targets?
Research question III: To what extent can electricity
interruptions costs act as a barrier to achieving the EU
renewable energy targets?
Literature review and identified gaps
A review of the current state of the art on the topics addressed by the above
research questions is presented in this section. Based on this review, the
main gaps in existing literature are then highlighted.
1.2.1 Role of large-scale electricity storage in the EU
As mentioned previously, there is a growing need for flexibility to balance
increasing shares of RES in the EU’s power system. Electricity storage –
both large- and small-scale – are emerging as promising options to provide
this flexibility [9, 22]. Large-scale electricity storage in the EU has
traditionally referred to pumped hydro storage (PHS). It is currently the
only commercially proven, large-scale, economically viable (>100 MW)
energy storage technology. The fundamental working principle of PHS is
to store electric energy in the form of hydraulic potential energy. Water
stored in an upper reservoir is processed in a turbine to recover its
potential energy in form of mechanical (kinetic) energy. Most PHS capacity
in Europe is located in mountainous areas (Alps, Pyrenees, Scottish
Highlands, Ardennes, and Carpathians). Currently there are more than 90
GW of PHS systems (with power rating >100 MW) installed worldwide,
representing approximately 3% of global generation capacity. No official

6
figures are available for the total installed capacity of PHS in the EU. The
World Market for Pumped-Storage Power Plants [23] put total capacity at
almost 45 GW in the beginning of 2011.
Other mechanical storage systems have not yet significantly penetrated the
energy market. Experience with compressed air energy storage (CAES) is
limited. The main drawback of this storage type is the need for suitable
geological structures. The construction of artificial caverns for storage
would involve high costs [24]. Although flywheel storage is a mature
technology and fully introduced in the industrial market (i.e. motion
smoothing, ride-through power for power disturbances), it is not
competitive at the higher power ratings. High maintenance requirements
and installations regarding safety lead to increased costs [25].
Electrochemical storage, such as Battery Energy Storage (BES), being
available in various sizes and power ratings has not competed with PHS or
CAES in the period prior to liberalization due to limited lifetime and
storage capacities as well as higher maintenance requirements.
Furthermore, concerns existed about negative environmental impact
caused by batteries due to toxic materials [25]. Chemical storage via
hydrogen is also not competitive with other storage technologies. Notably
high costs and very low efficiency have prevented the large-scale
introduction. With hydrogen only being available as a secondary source of
energy, costly conversion equipment is necessary. The conversion process
has high energy consumption resulting in a fairly low overall efficiency.
Furthermore, the volumetric energy density is very low, requiring much
space for storage and increasing the cost of infrastructure [25].
Supercapacitors and Superconducting Magnetic Energy Storage (SMES) as
new options for electrical energy storage are not yet at a stage of
development for market introduction [25].
Blanco et al. [26] provide a review of the potential role of storage in energy
systems. Different approaches are used to estimate the potential of large-
scale storage as a source of power system flexibility [27]. These include
ones with simple heuristics [28] to more complex ones with model
coupling [29] or specific indicators [30]. Deane et al. provide a
demonstration of coupling a long-term energy systems model to and power
systems model [31]. Flexibility through large-scale electricity storage is
mostly discussed in a national context. However, model-based approaches

7
should account for cross-border interconnectors can be better utilized to
unlock additional sources of flexibility in the EU’s power system.
It is therefore important to better understand the potential role that large-
scale energy storage can play in enabling RES deployment. In order to
study this, both long-term and short-term electricity system dynamics
need to be considered. Long-term dynamics include the falling costs and
improving efficiencies of energy technologies such as solar PV, wind
turbines, and lithium-ion batteries. Short-term dynamics comprise of load
balancing and cross-border exchanges. Current literature typically
addresses storage in either a long- or short-term context. However, a
comprehensive view of the current and future potential of large-scale
electricity storage will need to simultaneously consider both long- and
short-term dynamics.
1.2.2 Role of cross-border interconnectors in the EU
Considering the expected development of the European power system in
the direction of a more variable nature of generation, a range of studies
have been conducted regarding the implications on the European scale and
on the impact of possible methods for treating the variability within these
high variable European power systems [32–36].
The biennially released 10-year network development plan (TYNDP) of the
European Network of Transmission System Operators for Electricity
(ENTSO-E) [32] showcases the necessity of, on average, a doubling in
interconnection capacity by 2030 in order to achieve the EU’s 2030 RES
targets cost-effectively. A range of development visions are simulated in a
variety of market modelling tools, including PowerSYM [37]. The impact
of the different visions, including deviating assumptions on balancing
assets and power market integration, are assessed through a variety of
indicators such as national generation profiles, CO2 emissions, power
exchange and differences in marginal cost. Results are separated per
country, yet aggregated per year.
The 2030 power perspectives study is constructed as an intermediate step
towards the EU energy roadmap 2050 [33]. It provides a view on the
progress needed by 2030 to be able to achieve the goals set in the EU
energy roadmap 2050. It includes a technical assessment of the EU power
grid and the impact of certain key elements such as DR, sharing of spinning
reserves and incremental transmission capacities. Simulations of the

8
European power system are conducted in the PRIMES model [38] with
yearly aggregated output of results. The study highlights the importance of
a diverse and compatible portfolio of low-carbon generation technologies
across Europe and confirms the necessity of investments in
interconnection capacity. Demand-side resources such as demand
response assets and energy efficiency are indicated as an attractive mean
to reduce the required investments in large-scale generation and
interconnection capacity.
The French electricity company Électricité de France (EDF) has performed
a technical and economic analysis of the 2030 European power system
with a 60% share of generated electricity from RES [34]. It includes
aggregated results based on hourly dispatch simulations from the
Continental model [39]. The study among others assesses the role of base-
load and peak-load generators in a system with a high share of variable
RES. Important conclusion from the study is that storage and demand
response can contribute to required flexibility in balancing demand and
generation, but do not replace the need for backup generation.
Energynautics GmbH has performed a European grid study for 2030 and
2050 [35]. The authors used grid optimization software ENAplan [40] to
perform hourly dispatch simulations and assessed multiple scenarios with
varying assumptions regarding priority dispatch for RES, DR, electricity
storage, flexibility of conventional power plants and interconnection
capacities. The study shows the importance of priority dispatch for RES to
minimize renewable curtailment. It also shows the potential of demand
response for renewables integration. Not only does it underline the
significance of load shifting from peak to off-peak hours, it also indicates
that a shift of load towards times of peaks in high variable generation can
lower the need for interconnection capacity.
The effect of variability in generation and the potential impact of balancing
assets in the 2030 European power system have been explored and
quantified in existing literature. Yet, the common approach is to present
results as yearly aggregates and, therefore, short-term power system
dynamics such as load balancing and the use of storage for daily arbitrage
are often missed. In order to capture such dynamics, daily snapshots for a
variety of representative days, for instance, is needed. This will allow for a
better understanding of what a typical day of electricity generation and
consumption by 2030 in a high variable generating environment may

9
potentially look like. In particular, the role of three main assets for
balancing variability - centralized electricity storage, DR applications and
cross-border electricity transmission – can be explored through such a
study.
1.2.3 VoLL estimation studies
Currently, reliability levels are often used to design the future power
system. These may be quantified by defining an acceptable Loss of Load
Probability (LOLP), which specifies the share of time when a generation
shortfall may occur [9,10]. Other design criteria are redundancy measures
to ensure the system can cope with an outage in essential supply
infrastructure (e.g., N-1 rule) [11,12]. Both approaches have in common
that they do not build on quantifications of the impacts of interruptions on
individual consumers or consumer categories. Thus, both approaches will
not result in a socially optimal level of interruptions. A clear understanding
of the socio-economic costs of interruptions across the EU would be an
important step to decide on such an optimal level.
Further, the household sector is often overlooked in discussions of supply
security. However, the welfare losses of households (lost leisure) can be as
important as the lost value addition of firms. Studies such as de Nooij et al.
[45], in a study of the Netherlands, find that on a weekday in the evening
the cost of a supply interruption is largest for households. Households,
however, do not receive adequate attention in decisions on supply security.
It is interesting to note that the number of publications on estimating VoLL
has increased in recent years. Schröder and Kuckshinrichs [17] report that
Germany has published six studies on the topic, all of them after 2011. All
of the studies focus on industry (sub-divided differently in each study) and
private households. As mentioned earlier, the increased penetration of
RES - as is the case in Germany - is strong justification to estimate the costs
of electricity supply interruptions.
Commonly used technical indicators of power system reliability include
SAIFI, SAIDI, and CAIDI4, which are statistical measures [46]. They are
4 SAIFI: System Average Interruption Frequency Index; SAIDI: System Average
Interruption Duration Index; CAIDI: Customer Average Interruption Duration Index

10
related to average power interruption frequency, duration, and intensity
respectively. However, from a socio-economic perspective, VoLL is an
important indicator that addresses the impact of electricity supply
interruptions and the monetary valuation of a reliable, uninterrupted
power supply. VoLL can, therefore, be understood as an economic
indicator for electricity security. It is determined by relating the monetary
damage arising from an electricity supply interruption - due to the loss of
socio-economic activity - to the level of kWh that were not supplied during
the interruption [47]. While a representation in monetary units/kWh is
most commonly used, VoLL may also be measured in relation to time [48].
Four main methods are used to estimate VoLL: surveys (or stated
preferences, production-function, case studies, and market behaviour (or
revealed preferences). Each method has its own advantages and
disadvantages. An advantage of case studies is that an actual rather than a
hypothetical interruption is studied. On the other hand, revealed
preferences (market behaviour) may provide a more objective basis than
subjective valuation (surveys) for estimating the cost of power outages, as
it reflects “what people do rather than what they say”. In this study, we use
the production-function approach. The production-function approach
provides a top-down estimate of total costs without needing to study each
user individually, as is the case for bottom-up methods such as 1 and 4.
‘Market behavior (revealed preferences)’ does not seem relevant for the
case of the EU, where the electricity systems of Member States is
characterized by high levels of reliability. Further, the production-function
approach has been used in several previous national-level studies
estimating VoLL for households, including de Nooij et al. [45], Leahy and
Tol [49], Zachariadis and Poullikkas [50], and Growitsch et al. [51] for the
Netherlands, Republic of Ireland, Cyprus, and Germany respectively.
Overall, approximately 50% of recently published studies apply the
production-function approach [17].
Since no market currently exists to trade electricity interruptions, it is not
possible to ascertain a “market price” that shows the marginal cost per unit
of time of a supply interruption. The production-function approach
purports to capture both direct and indirect costs of electricity supply
interruptions. The production-function approach leads to substantial
higher welfare costs than the simulations of demand models [50] but are
however in line with current literature for other European countries cited
above. However, there are inevitable limitations related to adopting the

11
production-function approach. For instance, the duration of interruption
is difficult to account for. Further, it is not able to account for annoyance
caused in households due to electricity supply interruption [49].
At present, VoLL is completely lacking in international comparability. A
uniform analytical framework is therefore urgently required [17]. As the
EU moves towards a common internal energy market, it is increasingly
important to align the economic incentives of different EU Member States
in ensuring reliable electricity supplies, both within and between Member
States.
Contributions to the state of the art
The research presented in this dissertation comprises of the following five
papers and a book chapter. One of the papers and the book chapter are
published while the remaining four are accepted for publication.
1.3.1 Appended papers
Paper I: A. Shivakumar, A. Dobbins, U. Fahl, A. Singh, “Drivers of
renewable energy deployment in the EU: an analysis of past trends and
projections”, Energy Strategy Reviews, [Under review]
Author’s
contribution
The author and a co-author (Audrey Dobbins)
designed the study and methodology. The author
performed the meta-analysis of past studies and
wrote the paper along with two co-authors (Audrey
Dobbins and Antriksh Singh). Other co-authors
(Ulrich Fahl) provided overall guidance and
feedback. The author led the coordination of the
paper.
Paper II: A. Shivakumar, A. Faure, B. Normark, S. Gupta, T. Kober,
C. Bauer, Z. Xiaojin, “Redefining electricity storage for a redesigned
market in the EU”, Energy Policy, [Submitted]
Author’s
contribution
The author developed the methodology with other
co-authors, analysed data, and wrote sections of the
article. The co-authors contributed sections on the
EU regulatory framework (Aurélie Faure), business
models (Bo Normark), and electricity storage data

12
(Gupta, Tom Kober, Christian Bauer, and Zhang
Xiaojin). The author led the coordination of the
paper.
Paper III: A. Shivakumar, S. Pye, J. Anjo, M. Miller, P. Boutinard, T.
Kober, M. Densing, “Smart energy solutions in the EU: state of play and
measuring progress”, Energy Strategy Reviews, vol. 20, pp. 133-149,
April 2018, (https://doi.org/10.1016/j.esr.2018.02.005)
Author’s
contribution
The author developed the methodology with other
co-authors, analysed data, and wrote sections of the
article. The co-authors each contributed sections on
different national case studies and other sections.
Paper IV: M. Brinkerink, A. Shivakumar, “System dynamics within
typical days of a high variable 2030 European power system”, Energy
Strategy Reviews, [Under review]
Author’s
contribution
The author developed the methodology, selected the
modelling software, and supported the analysis of
the modelling results. The lead author of the paper
(Maarten Brinkerink) carried out the modelling
work, analysed results, and wrote the paper.
Paper V: A. Shivakumar, M. Welsch, C. Taliotis, M. Howells, D.
Jakšić, T. Baričević, S. Gupta, H. Rogner, “Valuing lost leisure:
Estimating electricity interruption costs for households across the
European Union”, Energy Research & Social Science, vol. 34, p. 39-48,
2017 (http://dx.doi.org/10.1016/j.erss.2017.05.010)
Author’s
contribution
The author developed the methodology, collected
data, carried out the analysis, and wrote the paper.
Other co-authors provided additional insights,
comments, and feedback.
Book chapter: A. Shivakumar, C. Taliotis, P. Deane, J. Gottschling,
R. Pattupara, R. Kannan, D. Jakšić, K. Stupin, R.V. Hemert, B. Normark,
A. Faure, ‘Chapter 21 - Need for Flexibility and Potential Solutions’,
Europe’s Energy Transition - Insights for Policy Making, Academic
Press, 2017

13
Author’s
contribution
The author developed the methodology with other
co-authors, analysed modelling results, and wrote
several sections. In particular, the author analysed
the role of large-scale electricity storage based on
soft-linking a short-term dispatch model and a long-
term capacity expansion model. Other co-authors
(Rajesh Pattupara, Kannan Ramachandran, and
Paul Deane) carried out the modelling work in
TIMES and PLEXOS. The author led the
coordination of the paper.
Each of the three research questions presented in 1.1.2 is addressed by one
or more of the above six papers, as detailed in Table 1. The first research
question, on identifying past drivers of renewable energy deployment in
the EU, is addressed in Paper I. The second research question, relating to
enablers, is addressed through Papers II-IV and the book chapter. This
research question considers multiple flexibility options and a substantial
portion of the thesis is spent on it. Finally, the third research question,
relating to barriers, is addressed through Paper V.

14
Table 1 - Relation between appended papers and research questions in the
thesis
Research question Paper Book
chapter I II III IV V
What are the key policy drivers of renewable energy deployment in the EU?
To what extent can flexibility through electricity storage and cross-border interconnectors contribute to achieving the EU renewable energy targets?
To what extent can electricity interruption costs act as a barrier to achieving the EU renewable energy targets?
1.3.2 Additional reports and publications
Other reports and publications that the author has contributed to and have
informed the present thesis include:
1. A. Shivakumar, M. Welsch, C. Taliotis, M. Howells, D. Jakšić, T.
Baričević, ‘Estimating the socio-economic costs of electricity supply
interruptions’, INSIGHT_E Rapid Response Energy Brief, 2015
2. I. Drmac, D. Jakšic, N. Karadža, R. Kunze, J. Dehler, R. De Miglio, A.
Shivakumar, A. Beltramo, M. Romero Nevado, M. Welsch, M.
Basslim, M. Lojanica (Ifri), A. Dobbins, ‘Exploring the strengths and
weaknesses of European innovation capacity within the Strategic
Energy Technologies (SET) Plan’, INSIGHT_E Policy Report, 2015
3. ‘Enhancing the Climate Resilience of Africa’s Infrastructure: The
Power and Water Sectors’ (Technical Appendix D5), The World
Bank, 2015
4. A. Shivakumar, J.P. Deane, K. Ramachandran, R. Pattupara, B.
Normark, A. Faure, J. Gottschling, ‘Business models for flexible
production and storage’, INSIGHT_E Policy Report, 2016
5. A. Shivakumar, B. Normark, M. Welsch, ‘Household DC networks:
State of the art and future prospects’, INSIGHT_E Rapid Response
Energy Brief, 2016

15
6. A. Shivakumar, T. Badouard, D. M. Olivera, J. Dehler, S. Pye, M.
Welsch, ‘Analysing RES support mechanisms in the EU post-2020’,
INSIGHT_E Hot Energy Topic, 2016
7. C. Taliotis, A. Shivakumar, E. Ramos, M. Howells, D. Mentis, V.
Sridharan, O. Broad, and L. Mofor, ‘An indicative analysis of
investment opportunities in the African electricity supply sector —
Using TEMBA (The Electricity Model Base for Africa),’ Energy for
Sustainable Development, vol. 31, pp. 50–66, 2016.
8. M. Welsch, S. Pye, D. Keles, A. Faure, A. Dobbins, A. Shivakumar, P.
Deane, M. Howells, ‘Europe’s Energy Transition: Insights for Policy
Making’, Academic Press (Elsevier), 2017
9. A. Shivakumar, A. Faure, B. Normark, S. Gupta, T. Kober, C. Bauer,
Z. Xiaojin, ‘Electricity storage in a redesigned market’, INSIGHT_E
Rapid Response Energy Brief, 2017
10. A. Shivakumar, A. Dobbins, U. Fahl, A. Singh, ‘Drivers of renewable
energy deployment in the EU: an analysis of past trends and
projections’, INSIGHT_E Policy Report, 2017
11. A. Shivakumar, S. Pye, J. Anjo, M. Miller, P. Boutinard, T. Kober, M.
Densing, ‘Smart energy solutions in the EU: state of play and
measuring progress’, INSIGHT_E Policy Report, 2017
12. M. Brinkerink, A. Shivakumar, ‘System dynamics within typical days
of a high variable 2030 European power system’, INSIGHT_E Policy
Report, 2017
13. S. Pfenninger, L. Hirth, I. Schlecht, E. Schmid, F. Wiese, T. Brown, C.
Davis, M. Gidden, H. Heinrichs, C. Heuberger, S. Hilpert, U. Krien, C.
Matke, A. Nebel, R. Morrison, B. Müller, G. Pleßmann, M. Reeg, J. C.
Richstein, A. Shivakumar, I. Staffell, T. Tröndle, C. Wingenbach,
‘Opening the black box of energy modelling: Strategies and lessons
learned’, Energy Strategy Reviews, vol. 19, pp. 63-71, 2018.
14. C. Taliotis, A. Shivakumar, V. Sridharan and M. Howells, ‘Regional
effects of Grand Inga: A project-focus application of TEMBA (The
Electricity Model Base for Africa),’ [Forthcoming]. Submitted to
Energy for Sustainable Development.
16
2 Methods
This section summarises the main methods used. It is intended to
complement the methodologies described in the appended papers. The
diversity of methods reflect the range of topics related to renewable energy
deployment that are addressed in this dissertation. The methods employed
in this dissertation are a mixture of quantitative (Paper IV-V, book
chapter), such as linear optimisation models, and qualitative approaches
(Paper I-III).
Identifying drivers of past RES-E deployment in the EU
The first step of the dissertation is identifying the main policy drivers of
past renewable energy deployment in the EU. Past deployment of
renewable energy technologies in the electricity sector (RES-E) are studied
to identify factors that influence the rate and scale of deployment. These
factors are then further analysed in seven representative EU Member
States. The process of selecting RES-E technologies and representative
Member States to focus on is also described. The results are used to identify
the main factors – both barriers and enablers – that influenced past RES-
E deployment.
RES deployment in this study is characterised using three indicators.
Firstly, literature describing factors influencing RES deployment in
individual Member States is evaluated qualitatively. Secondly, investment
trends documented in RES policy monitoring studies such as OPTRES
[52], RE-Shaping [53–55], and DiaCore [56] are evaluated quantitatively.
These two indicators are then compared with a third: annual installed
capacity of RES-E technologies as an indicator of actual deployment. The
indicator of actual deployment allowed for the verification and
classification of information obtained from literature. If, for example, a
source describes a factor as strongly supportive of deployment in a certain
period, but the deployment indicator reveals no growth of installed
capacity in this period, we can infer the existence of other more influential
hindering factors. The evaluation of actual deployment further allows for a
validation of data on investment trends. For example, it allows assessing
whether the magnitude of expected profits through an investment in RES
directly influences the volume of investment.

17
2.1.1 Selection of RES-E technologies
The analysis does not include all sectors nor all RES technologies. The
electricity sector is expected to play an important role in the
decarbonisation of the EU’s energy system directly and indirectly – by
supporting other sectors such as Transport, Heating & Cooling [57].
Therefore, the investigation is limited to limits to renewable technologies
in the electricity sector (RES-E). This is the first selection criterion. A
detailed explanation of the technology selection process is provided in
Paper I.
A second criterion for selection is the expected future growth rate to 2050.
Substantial growth is expected for wind power, solar power, biomass and
geothermal energy. The third and final criterion for selection of RES
technologies is the variability of electricity supply. Variable sources involve
the greatest challenges in terms of integration into the electricity grid and
are therefore of special interest.
2.1.2 Selection of deployment pathway types
The identification of factors influencing RES deployment requires a
detailed analysis performed at a Member State-level. The current analysis
is limited to a selected number of representative Member States in order
to achieve a reasonable compromise between the additional effort needed
to cover all EU Member States and the insights that it would provide.
The term ‘representative’ in the context of this study is defined as
‘illustrating a characteristic deployment pathway’ out of the range of
deployment pathways among all EU Member States. The process of
selecting representative Member States consists of two basic steps:
identifying ‘deployment pathways’ with relevant characteristics and
selecting a Member State that best represents the particular pathway.
A ‘deployment pathway’ itself is defined as the characteristic trend of RES
deployment in a Member State over a specific time span. The relevance of
a deployment pathway is determined the frequency of its occurrence across
all EU Member States.
A deployment pathway is defined as the trend of gross electricity
generation (GEG) over a certain period of time. In general, every Member
State shows an individual deployment pathway. In order to compare
individual pathways on a common basis, all pathways are assessed over

18
two consistent dimensions: ‘deployment status in 2005’ and ‘deployment
progress in between 2005 and 2013’ (see Figure 1).
Figure 1 - Basis of characterising deployment pathways across all EU
Member States
2.1.3 Selection of representative Member States
In the second step of the overall selection process, representative Member
States for the main development types are identified. The third column in
Table 2 lists Member States showing a particular deployment pathway type
as specified in the first column. Member States highlighted in red and
orange are not well-suited to represent the particular deployment pathway
type because their deployment status in 2005 or their deployment progress
between 2005 and 2013 is located close to the boundary of two quantiles,
as further described in Paper I. These Member States are excluded from
the selection procedure. The final selection of representative Member
States from the third column are then listed in the last two columns. If two
main deployment pathway types could be represented by one Member
State, this Member State is selected preferentially. The additional
deployment pathway type related to concentrated solar power can only be
represented by Spain, as no other Member State shows substantial
deployment of this technology. Thus, the selected representative Member
States are Austria (AT), Bulgaria (BG), Finland (FI), Germany
(DE), Ireland (IE), Slovenia (SL) and Spain (ES).

19
Table 2 - Selection of representative Member States for the main wind and
solar deployment pathways
Deployment Pathway
No.
Change in deployment
status (2005–2013)
Assigned Member
States
Selected MS for
main wind and solar
deployment pathways
Additionally selected MS
W-1 ↑ – → DK, DE, IE, EL, AT, IT
IE
W-3 ↓ – ↗ BG, LT, HU, RO
BG
W-6a ↓ – ↓ MT, SI, SK SI
W-9 ↕ – ↓ EE, FR, LV,
FI FI
S-1 ↑ – → NL, AT, LU, UK
AT
S-2 ↓ – → MT, RO, SI SI
S-3 ↓ – ↗ BG, CZ, SK, BG
S-6a ↓ – ↓ IE, HR, HU, CY
IE
S-6b <2% - <2% LV, LT, FI, PL, SE, EE
FI
S-7 ↑ – ↗ DE, ES, IT,
DK DE
CSP ↑ – ↗ ↑ – ↗
ES ES
Legend: MS = Member State; W = Wind power; S = Solar power; CSP = Concentrated solar power
Optimisation models
Here, two different optimisation models are presented. The first is a soft-
linking of a long-term (TIMES) and an hourly dispatch (PLEXOS) model
to study the role of storage. The second is Artelys Crystal Super Grid,
another hourly dispatch model that is used to study the role of cross-border
interconnectors.

20
2.2.1 Role of storage: Soft-linking long-term (TIMES) and hourly
dispatch (PLEXOS) models
To assess the role of electricity storage in the medium and long term, a set
of long-term, low-carbon electricity supply options were analysed for
Europe. A multi-region cost-optimization TIMES electricity model was
used to generate insights on future electricity supply options under given
policy constraints. The model, called European Swiss TIMES5 Electricity
Model 6 (EUSTEM), has 11 regions encompassing 20 of the EU-28
countries (plus Switzerland and Norway, see Figure 2). The EUSTEM
model covers 96% of the total electricity generation and 90% of the total
installed capacity of the EU-28 + Switzerland and Norway in 2014. It
should be noted that EUSTEM is an electricity system model, i.e. there is
no representation of heating or transport sectors. As such, the focus of this
analysis is to generate insights on the need for electricity storage.
EUSTEM identifies the “least-cost” combination of technologies and fuel
mixes based on their operation characteristics, to satisfy exogenously given
electricity demands under a given set of constraints. The framework allows
for prospective analysis over a long model horizon (70+ years) while at the
same time being able to represent a high level of intra-annual detail in
demand and supply (e.g. electricity load curves). It also has an enhanced
generic storage algorithm, enabling the modelling of electricity storage
systems [58]. It should be noted that demand responses and electricity
efficiency improvements are not explicitly represented, with demand side
measures expected to be captured in the assumed electricity demand
growth rate.
EUSTEM is used to generate insights on possible electricity supply
pathways to decarbonize the EU electricity sector by 2050, similar to the
EU Roadmap to 2050 [60] . The model identifies the long-term capacity
expansions plans to meet the given policy targets. To understand the real
time dispatchability of the electricity system, the installed capacity from
5 The Integrated MARKAL/EFOM System (TIMES) framework is a perfect foresight,
technology rich, cost optimization modelling framework [58]
6 It is worth noting that EUSTEM is an extension to the existing five regions Cross border
Swiss TIMES electricity model (CROSSTEM) see [59]

21
EUSTEM is eventually analysed in an EU-28 electricity market model in
PLEXOS. It also describes revenue generated by storage processes to study
the economic viability of pumped hydro and battery storage systems in
current market conditions.
Figure 2 - EUSTEM regions [59]
Key model assumptions
Several modelling assumptions and input data are used in EUSTEM. In the
following subsection, an overview of the modelling framework and key
assumptions are described. A more detailed model description can be
found in [59].
EUSTEM has a time horizon of 70 years (2010-2080), divided into eight
unequal time periods. Each period has a milestone year, which is the result-
reporting representative year, and displays the average value of parameters
over the period, e.g. 2050 represents the period of 2046-2055.
Each period also has an hourly representation within a year, differentiated
by four seasons and three types of days as shown in Figure 3.

22
Figure 3 - Intra-annual details in EUSTEM [59]
The model is calibrated to actual data from IEA on electricity demand,
generation mix, electricity trade and capital stock in 2010. Operational
characteristics of power plants, seasonal resource availabilities, trade
patterns and other such characteristics are included in the model. Existing
generation technologies are calibrated to seasonal and annual electricity
generation, as hourly level calibration was not possible due to lack of data.
However, the availability of renewable energy resources is implemented at
seasonal (hydro) and hourly levels (solar, wind). In addition to the existing
fleet of technologies, the model has the option to invest in new electricity
generation technologies. There are more than 20 categories of electricity
generation technologies, which use primary energy resources in the form
of renewables (solar, wind, hydro, etc.), fossil and nuclear as inputs (see
[61])
The model also has the option to trade electricity between the regions
based on long-run marginal costs of electricity generation. Highly
simplified interconnectors are represented to quantify the needs for
interconnector capacity between the regions. The existing inter connector
capacity based on historical trade patterns are included and the model has
the option to expand the interconnectors. EUSTEM does not have an
electricity transmission or distribution grid. The transmission constraints
are captured in the analysis using the dispatch model described in [61]
2010 2011-2012 2013-2017 2018 – 2025 2046 – 2055 2050 (Milestone year)
Model Horizon (2010-2080)

23
Scenarios
Two scenarios have been analysed in this study. The first scenario
represents a least-cost electricity supply option, which is used as a baseline
for comparison. The focus of the discussion will be on a decarbonisation
scenario of the EU electricity system, which will highlight the importance
of electricity storage in a high renewable based electricity generation
system.
Least Cost scenario (LC): This scenario is the cost-optimal electricity
supply scenario, which gives the least cost electricity supply without
reflecting foreseeable market changes resulting from climate change
mitigation policies or renewable targets. In this scenario, no specific
constraints on technologies are included, except the existing national
policies on nuclear phase out. Technology growth constraints have been
applied on certain technologies such as coal, wind and solar PV based on
historical trends to reflect technical limits to deploy them and thereby
prevent unrealistic penetration of these technologies. A CO2 price is
implemented based on the EU ETS prices from the “new energy policy”
scenario of the IEA World Energy Outlook [62]. The CO2 price varies
between 11 €2010/t- CO2 in 2010 and 44 €2010/t- CO2 in 2050 and is very
close to assumption in the Reference scenario of the EU Energy Roadmap
[60]. There are no market incentive tools (such as feed-in-tariffs) applied
for the case study. No particular market or interconnector constraints are
applied on electricity imports / exports between regions, i.e. the model has
full freedom to trade electricity and expand the cross-border
interconnector capacity.
Decarbonisation scenario (CO2): The decarbonisation scenario has the
same boundary conditions as the LC scenario, with an additional CO2
emission cap to decarbonise the EU electricity sector by 2050. The total
CO2 emissions from the power sector across the regions are reduced by 61%
of the 1990 levels by 2030, and 95% by 2050. These emission caps are in
line with the CO2 emission targets in the EU energy roadmap to 2050 [60].

24
Soft-linking an hourly dispatch model (PLEXOS7)
In this part of the work, wholesale market prices are derived for two
specific years - 2030 and 2050 - using an hourly dispatch model, PLEXOS.
Two scenarios of power plant portfolios are analysed for each year and
these scenarios are developed using outputs from the EUSTEM model. A
power plant portfolio is constructed for each Member State for each
scenario (‘Least Cost’ and ‘Decarbonistaion’) and each year (2030 and
2050). In all, approximately 3,000 individual thermal power plants are
included in the PLEXOS model. Power plant capacities, efficiencies and
fuel types are based on outputs from the EUSTEM model. The PLEXOS
model aims to minimise the overall generation cost to meet demand
subject to generator technical characteristics. The resulting market price is
defined as the marginal price at Member State-level. This is often called
the ‘shadow price’ of electricity and does not include any extra revenues
from potential balancing, reserve or capacity markets or costs such as grid
infrastructure cost, capital costs or taxes. These extra revenues or costs are
not considered in this study. The conditions in various countries are very
different and the main objective of the study is to analyse how different
conditions will lead to better or worse case for storage. This dissertation
has been limited to studying the value of energy arbitrage8 to keep the
modelling at reasonable levels. If, for instance, the value of peak shaving is
to be considered the highest value is typically in deferment of grid
infrastructure investments and this is a very complex analysis. This
dissertation looks at the value of centralized storage.
2.2.2 Role of interconnectors: Analysis of ENTSO-E ‘visions’ using a
dispatch model
To simulate a European electricity system with realistic decision making
functionalities, an hourly dispatch model has been used based on the merit
order of the electricity market. The specific software used in this study is
7 https://energyexemplar.com/software/plexos-desktop-edition/
8 Arbitrage is the simultaneous purchase and sale of an asset in order to profit from a difference in the
price. It is a trade that profits by exploiting price differences of identical or similar electricity sources,
on different markets or in different forms.

25
Artelys Crystal Super Grid 9 . The model can perform hourly decisions
regarding generation, shifts in demand, storage and cross-border
transmissions based on the input data. It is possible to manually add
market zones (e.g. a country or district within a country) including all its
assets. Next to an internal editing tool, it is also possible to link external
data files with the software. This makes it possible to construct the different
market zones outside the software. Besides hourly dispatch simulations the
software is also capable of doing other assessments such as cost-benefit
analyses and capacity expansion planning, although this is outside the
scope of this research. Super Grid provides the option of setting user-
defined operational and tactical horizons for the simulations. The
operational horizon is the timespan during which the software optimizes
the electricity generation by securing the supply with the overall lowest
marginal costs (MC) for the entire period.
The tactical horizon is the duration the software looks forward for changes
in load, variable primary input and generation availability. By setting the
horizons it is for example possible to generate additional electricity now,
store it and use it later if it seems cost efficient (e.g. if the software notices
a strong decline in variable generation or a strong increase in load within
the set horizons). For this study the operational horizon has been set at 7
days and the tactical horizon at 15 days. The software assumes perfect
foresight.
This study has focusses on the role of interconnectors while the one
presented in the previous section focusses on the role of large-scale
electricity storage. Further, the synergistic effect between the two is
highlighted as well. The models, and underlying assumptions used in the
two studies are share several similarities but some important differences
as well. Both modelling frameworks include an optimisation of the hourly
dispatch of specific years of the EU power system. The model horizon in
the ‘storage study’ is until 2050 and its underlying assumptions are
therefore harmonised with the EU Energy Roadmap 2050. The model
horizon in this ‘interconnectors study’ is only until 2030 and therefore the
ENTSO-e’s 2030 Visions were found to be a more appropriate source for
9 https://www.artelys.com/en/applications/artelys-supergrid

26
data and assumptions. However, both studies address the issue of
increasing shares of RES and the need to balance them.
ENTSO-E visions
The development of a potential high variable European electricity system
has been based on the TYNDP 2016 visions of the ENTSO-E [32]. Per
vision, the study includes installed generating capacities per country,
cross-border transmission capacities, hourly load patterns for each country
and other important factors such as fuel and CO2 prices. Based on these
elements, the model can determine the marginal costs of electricity
production per country per hour. For this particular study, Vision 3 (V3)
and Vision 4 (V4) have been simulated in Super Grid. These visions have
the highest renewable installed capacities (V3 48.18% and V4 50.2%
Europe average) and more specifically variable renewable installed
capacities (V3 42.14% and V4 44.26% Europe average) by 2030. The main
differences between V3 and V4 are different setup of installed capacities,
V4 has higher electricity demand, higher integration of DR applications
and electric plug-in vehicles, higher ratio of offshore wind capacity
compared to onshore wind capacity, but less adequacy in the form of lower
back-up capacity compared to V3 [32].
An overview of the characteristics per vision can be seen in Table 3.
Unfortunately, not all assumptions in the TYNDP report are quantified or
specified for each country, and hence additional data sources were needed
for the modelling.

27
Table 3 - Summary of main elements per vision of the TYNDP 2016
extracted from [32]10
Slowest progress Constrained
progress
National green
transition
European
green
revolution
V1 V2 V3 V4
Economic
and financial
conditions
Least favourable Least favourable More
favourable
More
favourable
Focus of
energy
policies
National European National European
Focus of
R&D
National European National European
CO2 and
primary fuel
prices
Low CO2 price,
high fuel price
Low CO2 price,
high fuel price
High CO2
price, low fuel
price
High CO2
price, low fuel
price
RES Low national
target (>= 2020
target)
Between V1 and
V3
High national
RES
On track to
2050
Electricity
demand
Increase
(stagnation to
small growth)
Decrease
compared to
2020 (small
growth nut high
energy
efficiency)
Stagnation
compared to
2020
Increase
(growth
demand)
Demand
response
(and smart
grids)
As today Partially used Partially used Fully used
0% 5% 5% 20%
Electric
vehicles
No commercial
breakthrough of
Electric plug-in
vehicles (flexible
charging)
Electric plug-in
vehicles
Electric plug-
in vehicles
(flexible
10 Percentages for DR assets (including EV and heat pumps) refers to shiftable and / or sheddable total
load

28
electric plug in
vehicles
(flexible
charging)
charging and
generating)
0% 5% 5% 10%
Heat pumps Minimum level Intermediate
level
Intermediate
level
Maximum
level
Adequacy 1% 5% 5% 9%
Merit order Coal before gas Coal before gas Gas before coal Gas before
coal
Storage As planned
today
As planned
today
Decentralized Centralized
Single market, nodal prices and marginal costs
For simplicity, the 2030 EU system has been assessed as an integrated
single market. Political developments are uncertain in a time frame of
almost 15 years, so exact predictions regarding the evolution of the single
market are difficult. Nonetheless, following the progress reports of the EC
as described in the background it is likely that eventually the single market
will be reached. The choice for this assumption is therefore the most
obvious starting point. For the modelling of the system a nodal pricing
approach has been followed as described by [63]. The idea is that the
electricity market is one large pool of generators and load with
differentiated costs of generation per technology. The cost of generation
per technology is determined by its production costs, its emissions and the
CO2 price which varies slightly between V3 and V4 at 71 €/ton CO2 for V3
and 76 €/ton CO2 for V4. The costs per technology, per vision, are included
in Paper IV. One important consideration in V3 and V4 is that the
generation of electricity from closed cycle gas turbines (CCGT) is set before
the coal and lignite fleet in the merit order, due to the high CO2 prices. This
means that CCGT fleets are generally used as base load, whereas coal and
lignite fleets are functioning as peak supply. This in contrary to the current
market situation. Within the simulations of this study every country in the
European market represents one node. This means that transmission
limitations and congestion within countries are not considered. In practice
the number of nodes per country can be much higher and representing
them will be especially important for national-level studies. The marginal
cost of electricity generation at each node is equal to its most expensive
unit of generated or consumed electricity at that node plus one. If no
transmission congestion occurs between countries, the marginal costs of

29
electricity generation is theoretically speaking equal throughout Europe,
apart from wheeling charges (costs of transmission) for the importing
countries. If congestion between two nodes does occur, the single market
function between these areas will be disconnected and the costs of
generation will result in two different local marginal prices (LMP).
Assessment of a high variable European 2030 electricity system
To analyse the dynamics of a European electricity system with a high
integration of variable generation, this policy report is built on a series of
daily snapshots based on the hourly output of the simulations in Super
Grid. It starts with a variety of cases in different situations to indicate the
necessity of integration of assets for balancing variable generation. This is
followed by separate assessments of the functionality and potential roles of
three main assets for balancing the variability in generation; centralized
electricity storage, cross-border electricity transmission and DR
applications. Simulations of the European system are conducted for
representative (average) days and for more extremes as well, being low
variable generation or high generation in different seasons to give a
comprehensive overview of a variety of possible situations in 2030. For the
assessment of electricity storage and cross-border transmission the
simulation of V3 has been used, in which both assets are simulated as
active components.
The functionality of DR applications, for example the use of flexible
charging and generation of electric vehicles or the flexible use of domestic
heat pumps, is assessed through simulations of V4. The difference with the
other assessments is that DR has not been integrated as an active
component within Super Grid. This is because of the way the load profiles
of the TYNDP are constructed, where the potential impact of DR
applications is predetermined on the load profiles [32]. This has been done
by the ENTSO-E after consideration of various scenarios. It assumes a
movement of load from hours of potential high prices to hours of potential
low prices, which in reality means a shift of load from traditional peak
hours to off-peak hours. The effect can be seen in Figure 4.

30
Figure 4 - Example load profiles of Germany (DE) for V3 and V4 to
showcase the difference between the profile with (V4) and without (V3) high
predetermined impact of DR applications
Besides the difference between total demand for V3 and V4, it is clear that
the load profile of V4 is much less fluctuating between peak and off-peak
demand. To be able to assess the impact of DR on the daily dynamics in the
system, it is necessary to develop a reference case for V4 without influence
of DR. Comparison to V3 or one of the other visions is not reliable, because
the differences in load and other factors such as installed capacities are too
large. Adapting a load profile is a delicate task and cannot be applied in the
same manner for every day due to differences in the diurnal cycle between
different periods of the year. Furthermore, although it has been mentioned
in the TYNDP report that there are differences in assumed DR capacities
for different European countries, it has not been quantified. This means
that there is no single uniform approach to correctly alter the load profiles
of all countries. The choice has therefore been made to adapt the V4 profile
for a few exemplary days. This has been done by taking the load profile of
comparable days of V4 without integrated DR effect as reference. Based on
the reference data, the shape of the profiles of the exemplary days have
been adapted and proportionally scaled. The total demand for the changed
days in the adapted profile has remained exactly equal. Although this
approach is most likely not completely accurate, it is sufficient for assessing
the dynamics and potential influence of DR in a high variable integrated
European electricity system.
The assessment of transmission congestion in the European power system
is based on the simulated V4 system of the TYNDP 2016. It has the highest
influence of variable generation and follows a European approach for
securing system adequacy in all member states. Both aspects stimulate a

31
higher utilization of transmission capacity and it is therefore more likely
that the extent of transmission congestion will be higher within this version
of the 2030 European power system.
In Paper IV, the issue of system congestion is explained in further detail
with an exemplary case. It first identifies the core roots underlying the
issue, followed by an analysis of the extent of the problem and the first part
of the chapter ends with an assessment of the consequences as a result of
the occurrence of transmission congestion. The second part of the chapter
consists of an attempt to optimize the system at key bottlenecks to decrease
the overall occurrence of system congestion and its negative consequences.
The effect of this optimization is being assessed through multiple system
indicators, further explained in Paper IV. One of the main indicators in
which the optimization is being assessed is through the application of a
Cost Benefit Analysis (CBA). Future revenues (or relative decrease in costs)
as a result of the system optimization are set against their net present value
(NPV) to assess the profitability of the potential system adaptation.
Estimation of Value of Lost Load (VoLL)
In order to estimate the outage costs for the household sector, the value of
the output generated by them needs to be considered. The primary effect
of outages in households is the interruption of leisure activities, to which
an economic value needs to be assigned. While people ascribe value to
leisure activities, the relationship between electricity usage and leisure
activities is not clear; some activities are directly and completely dependent
on electricity (e.g. watching television), other activities are not (e.g. playing
an outdoor sport). Therefore, any estimation of outage costs relies on the
amount of hours spent on leisure activities and the proportion of these
leisure activities that are dependent on electricity. In order to represent
this substitutability between electricity-based leisure activities and non-
electricity-based leisure, we utilize the approach propose by several
previous studies including de Nooij et al. [45], Leahy and Tol [49],
Zachariadis and Poullikkas [50], Growitsch et al. [51] and Bliem, M. [64]
and assume a substitutability factor of 0.5. This corresponds to a 50%
reduction in the utility that households gain from leisure activities when
an electricity interruption occurs. This simplifying assumption is in line
with several well-established VoLL estimation studies [12-15,40,41].
However, the authors note that it is important to further investigate the
impact of this assumption. Since different countries are likely to have

32
varying ‘substitutability factor’, we conduct a sensitivity analysis to
estimate its impact on the range of VoLL by country. Results of this analysis
are presented later in this section.
Becker [66] provides a framework to estimate an economic value for time
spent on leisure activities. He proposes that households gain utility from
consuming goods and time spent on leisure activities. The money required
to purchase these goods to consume is gained by working. Moreover, the
marginal utility of both consuming goods and leisure activities decreases
with each additional unit leading to an optimal ratio between working and
non-working hours. At this optimal point, a person or household is
indifferent between an additional hour of work compared to an additional
hour of leisure. Therefore, an additional hour of leisure can be valued as
equal to the income from an additional hour of work (i.e. the hourly
wage)11.
Becker’s approach, however, may not be applicable to people that are non-
employed, such as unemployed, pensioners, children, sick or disabled
persons. This is due to the fact that the value of their leisure can no longer
be equated to hourly wages, and would lead to an overestimation.
However, the leisure time of people that are non-employed is, of course,
still valuable. This study assumes that an hour of leisure for non-employed
persons is valued as half the hourly wage of those that are employed, as
suggested by [67] and [45].
After obtaining a value of leisure, the VoLL for households in each MS was
calculated as
𝑉𝑜𝐿𝐿𝑀𝑆 =𝐿𝑉𝑀𝑆
𝐸𝐿𝐶𝑀𝑆 (1)
where LVMS is the annualised leisure value (economic) of each MS,
measured in €, and ELCMS is the annual household electricity consumption
of each MS, measured in kWh. In order to obtain LVMS, labour market data
11 This method to value leisure time is sometimes considered controversial, especially
outside the field of economics. As de Nooij [45] reports, this idea is used regularly in
economics. Economists often use a ‘reservation wage’ in labour economics; if people
cannot earn more than this reservation wage, they will not accept a job because, to
them, their leisure time is more valuable than the earnings from the job offered

33
on hourly wages, number of employed/non-employed persons, and the
number of hours worked per employee annually was used. Labour market
data was obtained from Eurostat12 and a detailed summary of this data is
provided in [68]. Following the approach used in [51], the average time
spend on personal care such as sleeping, eating, washing, and dressing is
around 11 hours per day. Considering the information described above, the
annual economic value of leisure for all persons in each Member State was
calculated as
𝐿𝑉𝑀𝑆, = ((hours per year − 𝑑𝑎𝑦𝑠 𝑝𝑒𝑟 𝑦𝑒𝑎𝑟 ×
ℎ𝑜𝑢𝑟𝑠 𝑜𝑛 𝑝𝑒𝑟𝑠𝑜𝑛𝑎𝑙 𝑐𝑎𝑟𝑒 𝑝𝑒𝑟 𝑑𝑎𝑦 − ℎ𝑜𝑢𝑟𝑠 𝑤𝑜𝑟𝑘𝑒𝑑𝑀𝑆) × ℎ𝑜𝑢𝑟𝑙𝑦 𝑤𝑎𝑔𝑒𝑀𝑆) ×
𝑠𝑢𝑏𝑠𝑡𝑖𝑡𝑢𝑡𝑎𝑏𝑖𝑙𝑖𝑡𝑦 𝑓𝑎𝑐𝑡𝑜𝑟 × (𝑛𝑢𝑚𝑏𝑒𝑟 𝑜𝑓 𝑒𝑚𝑝𝑙𝑜𝑦𝑒𝑑 𝑝𝑒𝑟𝑠𝑜𝑛𝑠𝑀𝑆 + 0.5 ×
𝑛𝑢𝑚𝑏𝑒𝑟 𝑜𝑓 𝑢𝑛𝑒𝑚𝑝𝑙𝑜𝑦𝑒𝑑 𝑝𝑒𝑟𝑠𝑜𝑛𝑠𝑀𝑆) (2)
where substitutability factor is the fraction of leisure activities that are
electricity-based, as described earlier and where the value of leisure of non-
employed persons is 50% of the hourly wage of employed persons. This
assumption is line with current literature that calculates VoLL for
households at national levels [15,16,18,22]
The VoLL obtained from the above equation, measured as €/kWh,
represents an average annual value. However, leisure activities are clearly
not distributed equally throughout the day or the year. In order to capture
the time varying nature of electricity interruption costs, it is important to
consider the absolute value of electricity not supplied. This is obtained by
combining the average annual VoLL with the hourly household electricity
consumption. The time-varying VoLL was calculated as
𝑉𝑜𝐿𝐿𝑀𝑆,𝑡 =𝐿𝑉𝑀𝑆
𝐸𝐿𝐶𝑀𝑆 × 𝐸𝐿𝐶𝑀𝑆,𝑡 = 𝐿𝑉𝑀𝑆 × 𝑑𝑓𝑀𝑆,𝑡 (3)
12 Eurostat: Unemployment rate by sex and age - monthly average, % [une_rt_m]

34
where dfMS,t represents the demand factor 13 in hour t for each MS. The
hourly household electricity consumption for each EU Member State was
obtained from ENTSO-E14.
The following section presents the results of calculating VoLL for each EU-
28 Member State using the methodology described above, first as annual
average values and then on an hourly basis. This is supplemented by a
sensitivity analysis on the impact of substitutability factor on VoLL.
13 Demand factor is the ratio of the average electricity demand to the peak electricity
demand over a period of time (one year in this case)
14 ENTSO-E (European Network of Transmission System Operators for Electricity)
Consumption data is available at https://www.entsoe.eu/data/data-
portal/consumption/Pages/default.aspx

35
3 Results and discussion
In this chapter, the main results of the thesis are presented. These are
divided in four parts, each relating to one of the three research questions.
The first part, on past RES-E deployment projections, is related to the
research question on ‘drivers’. The second and third parts, on electricity
storage and interconnectors respectively, relate to the research question on
‘enablers’. Finally, the fourth part, on electricity supply interruptions,
relates to the research question on ‘barriers’.
Past RES-E deployment and projections
In this section, we present analyses of wind (onshore and offshore) and
solar (PV and CSP-E) technology deployment in selected EU Member
States. Furthermore, we perform a meta-analysis of different studies on the
projected share of electricity generation from wind and solar technologies
in the EU as a whole. Finally, we use both the above sets results to identify
barriers and enablers to the deployment of RE technologies. Such an
analysis can help provide insights towards setting ambitious, yet feasible,
RES-E targets at the Member State level. Further, it can provide a basis to
develop an effort-sharing plan between Member States to achieve the EU’s
overall 2030 RE target.
We analyse the deployment of RES-E technologies in the following EU
Member States: Austria, Bulgaria, Finland, Germany, Ireland,
Slovenia, and Spain. The rationale and process of selecting these
Member States is discussed in chapter 2.1 and Paper I. Analysing trends in
individual Member States allows us to identify barriers and enablers to
RES-E technology deployment that may be specific to certain conditions
that are geographic, climatic, or socio-economic etc. and those that are
universal across different Member States.
The analysis of each Member State is structured as follows: first, the broad
conditions in each MS such as past generation mix and evolution of policy
support schemes. Then, the deployment of wind and solar technologies in
the past is presented and compared to the projected trend for the future.
Here, the results for three Member States are presented. The analyses of
the remaining MS are in Paper I.

36
3.1.1 Germany
Germany’s aggressive deployment of RES technologies, especially solar PV
and wind power, is well documented and its national targets are well
beyond those set by the EU and other Member States. Germany, as part of
implementing its Energiewende, aims to increase the share of RES in gross
electricity consumption to 50% by 2030 and 80% by 2050. This expansion
of RES is expected to strongly contribute to Germany’s 2050 target of
reducing GHG emissions by 80-95% (compared to 1990 levels).
Wind (onshore)
99-13 Stable and strong growth
PV 99-02 Small Growth
03-08 Increasing Growth
09-10 Strongly increasing growth
11-12 Stable growth
13 Decreasing Growth
Figure 5 - Support scheme characteristics, realized percentage of predicted
2050 potential in 2013, annual and cumulative new installed power
capacity, estimated NREAP trajectories and identified investment sections
in Germany. Support scheme graphic [56], Data from [69], Eurostat
W-I Stable and strong growth, 1999-2013
Wind power deployment is characterized by stable and substantial
investment in the period from 2000 to 2013, see Figure 5.
The procured data on profitability of wind power investments (see Figure
6) shows very attractive conditions in 2004, that deteriorated to 2009 and
0
10,000
20,000
30,000
40,000
0
2,000
4,000
6,000
8,000
10,000
Cu
mu
lati
ve P
ow
er C
apac
ity
(MW
)
New
Po
wer
Cap
acit
y (i
n M
W)
wind on wind off
PV wind (on + off) cumulative
PV cumulative wind (on + off) NREAP
PV-NREAP

37
2011 and improved again to 2013. The WindBarrier project [70] reveals
no indication on severe non-economic barriers to wind deployment. The
adaptions of the support legislation show no significant correlation with
the fluctuation of new installed capacity and thus most likely did not cause
uncertainty on the investors side. The achievement of growth even with
very low economic investment incentives, as in 2011, indicates that
Germany succeeded in installing high certainty and reliability on investors
side with its organisation and design of RES support.
PV-I Small Growth, 1999-2002
Solar PV grew slowly in the period from 1999 to 2002. No information on
the investment framework was available for this period. Waiting for
attractiveness and for industry to transition from grid feed-in law to FIT
(EEG).
PV-II Increasing Growth, 2003-2008
In 2003 substantial growth of solar PV installed despite unattractive profit
opportunities, as shown in Figure 6. This indicates a very favourable
organisation and design of solar PV support.
Figure 6 - Expected average to maximum profit ranges in Germany. Data:
[52–54, 56]

38
PV-III Strong Growth, 2009-2010
The profitability of solar PV investments improved significantly to 2009
(see Figure 6) and accordingly investment increased by huge amounts in
2009 and 2010. The evaluation of the administrative procedure in [71]
revealed only few barriers compared to the EU average. The adoption of a
new RES law in 2009 did not impact solar PV investment negatively,
although it included the introduction of a restrictive measure, the so called
“breathing cap” [53]. This indicates that a sophisticated support scheme
design can include restrictive instruments to control deployment without
losing trust of investors. So the strong growth is enabled by attractive
economic support, a favourable administrative procedure and a
sophisticated support scheme design.
PV-III Stagnation, 2011-2012
The period of strongly increasing growth ended after 2010. The annually
new installed capacity stabilized on a high level until 2012. The likely cause
for the stop of increasing growth is the deterioration of the profitability by
a restrictive amendment of the legislation in 2010. The tariffs for solar PV
were cut and the “deployment dependent tariff reduction mechanism” had
been introduced [72].
PV-IV Decreasing Growth, 2013
In 2013 growth of solar PV declined heavily. The reason most likely is the
ongoing reduction of the tariffs through the tariff reduction mechanism
that resulted in the absence of profit opportunities in 2013.
3.1.2 Ireland
Renewables capacity in Ireland is dominated by wind power, with an
installed capacity of around 3 GW as of 2016 while solar power deployment
is non-existent. The evaluation of the installed wind capacity from 1999 to
2013 in Ireland revealed different investment sections as illustrated in
Figure 7. Ireland supported the investment in renewable energy
technologies until 2006 with a tender scheme and then switched to a feed-
in tariff (FIT). The evaluation limits to onshore wind power, as offshore
wind power and solar power were not or very slightly deployed in 2013.
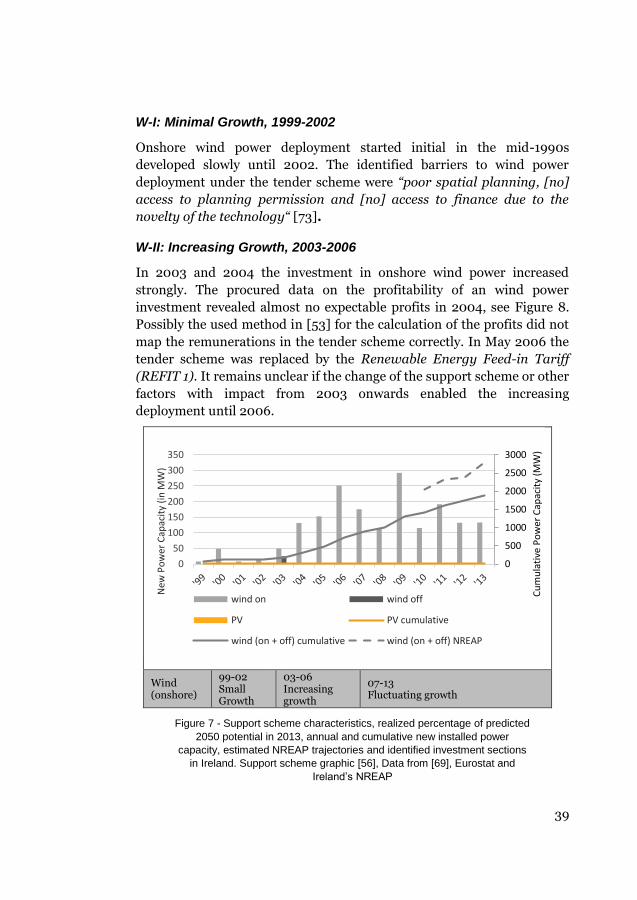
39
W-I: Minimal Growth, 1999-2002
Onshore wind power deployment started initial in the mid-1990s
developed slowly until 2002. The identified barriers to wind power
deployment under the tender scheme were “poor spatial planning, [no]
access to planning permission and [no] access to finance due to the
novelty of the technology“ [73].
W-II: Increasing Growth, 2003-2006
In 2003 and 2004 the investment in onshore wind power increased
strongly. The procured data on the profitability of an wind power
investment revealed almost no expectable profits in 2004, see Figure 8.
Possibly the used method in [53] for the calculation of the profits did not
map the remunerations in the tender scheme correctly. In May 2006 the
tender scheme was replaced by the Renewable Energy Feed-in Tariff
(REFIT 1). It remains unclear if the change of the support scheme or other
factors with impact from 2003 onwards enabled the increasing
deployment until 2006.
Wind (onshore)
99-02 Small Growth
03-06 Increasing growth
07-13 Fluctuating growth
Figure 7 - Support scheme characteristics, realized percentage of predicted
2050 potential in 2013, annual and cumulative new installed power
capacity, estimated NREAP trajectories and identified investment sections
in Ireland. Support scheme graphic [56], Data from [69], Eurostat and
Ireland’s NREAP
0
500
1000
1500
2000
2500
3000
0
50
100
150
200
250
300
350
Cu
mu
lati
ve P
ow
er C
apac
ity
(MW
)
New
Po
wer
Cap
acit
y (i
n M
W)
wind on wind off
PV PV cumulative
wind (on + off) cumulative wind (on + off) NREAP

40
W-III: Fluctuating growth, 2007-2013
The period from 2007 to 2013 is characterized by continuous but strongly
fluctuating capacity growth. The available profits improved over the
complete period to 2013. Consequently, the investment does not correlate
directly with the profitability.
The WindBarrier project [70] indicates significant barriers in the grid
connection procedure. The administrative procedure of receiving a grid
connection permission was organized as a “Group Processing” approach in
the Irish system. Projects were collected as “Gates” and then were
processed together [74]. In practice this approach was connected to severe
problems, for example extremely long waiting times of about 6-9 years
[75]. Healy [74] names the administrative procedure and grid limitations
as the main barriers to stronger deployment.
So the economic support conditions, provided by the FIT, enabled the
continuous deployment of wind power. However, the existence of severe
barriers in the administrative procedure and the insufficient deployment
of the grid prevented stronger growth. The fact that deployment lags
behind the estimated NREAP trajectory, see Figure 7, supports this result.
Figure 8 - Expected average to maximum profit ranges in Ireland; Data from
[52–54, 56]
41
3.1.3 Spain
Spain has been a pioneer of renewables expansion in the EU. It has the
second largest installed capacity of wind power in the EU (after Germany)
of 23,000 MW. The development of solar PV grew rapidly as well, from an
installed capacity of 125 MW in 2006 to 4,667 MW in 2013. Spain also has
the largest installed capacity of concentrated solar power (CSP) technology
at 2,300 MW. However, legislative changes brought about by Spain’s
government in recent years has severely hindered progress in renewables
expansion; total installed capacities of wind power, solar PV and CSP since
2013 have remained stagnant.
The evaluation of the installed wind power, solar PV and CSP capacity from
1999 to 2013 in Spain revealed different investment sections as illustrated
in Figure 9. Spain’s main support scheme type to all RET is a feed-in tariff
(FIT) and a feed-in premium (FIP) scheme.
W-I Continuous and high growth, 1999-2009
The first identified investment section is characterized by continuous and
substantial annual capacity growth of onshore wind power. The procured
data on the profitability of investments, see Figure 10, reveals attractive
profits in 2004 and 2009. The Renewable Energy Plan of 2005 provided
deployment targets and the long term deployment history at that point in
time ensured a secure and reliable investment framework. The caps to
deployment introduced in an amendment in 2007 “introduced a
significant level of uncertainty in the market” [76].
Thus the favourable economic support and the stable and reliable support
perspective had been, possibly among others, the main enablers of onshore
wind deployment up to 2007.
W-II Decreasing growth, 2010-2011
Wind power deployment declined in 2010 and 2011. The introduction of a
pre-allocation register in 2009 aimed to stop the wind sector from
overshooting (IRENA-GWEC). The register increased the administrative
effort for investors and is considered as a bureaucratic hurdle [55], [76].
The “deficit of the electricity tariff” in Spain and the achievement of certain
deployment level caused a reduction of tariffs and other restrictive changes
to the support framework in 2010 [55]. Altogether the changes in 2010 and

42
2011 most likely caused uncertainty on investors side and lead to a decline
of investment.
Wind (onshore)
‘99-‘09 Continuous and high growth
‘10-‘11 Decreasing growth
‘12 Increasing growth
‘13 Very small growth
PV ‘00-‘05 No Growth
‘06-‘08 Strongly increasing growth
‘09-‘12 Small growth
‘13 Very small growth
CSP ‘99-‘08 Marginal Growth
‘09-‘12 Increasing or steady growth
‘13 Decreasing growth
Figure 9 - Support scheme characteristics, realized percentage of predicted
2050 potential in 2013, annual and cumulative new installed power
capacity, estimated NREAP trajectories and identified investment sections
in Spain. Support scheme graphic [56], Data from [69], Eurostat
PV-I No Growth, 2000-2005
The first identified deployment section is characterized by marginal
capacity growth. The profitability data indicates only small profits
available for investments in solar PV in 2004, so that the missing economic
support worked as a barrier to investment.
0
5,000
10,000
15,000
20,000
25,000
30,000
0
1,000
2,000
3,000
4,000
Cu
mu
lati
ve P
ow
er C
apac
ity
(MW
)
New
Po
wer
Cap
acit
y (i
n M
W)
wind (on+off) PV
CSP-E cumulative wind (on + off) cumulative
PV cumulative CSP-E cumulative
wind (on + off) NREAP PV-NREAP
CSP-E NREAP

43
Figure 10 - Expected average to maximum profit ranges in Spain, Data:
[52–54, 56]
PV-II Strongly increasing growth, 2006-2008
Substantial deployment of solar PV started in 2006 and increased by huge
amounts to 2008. The FIT had been increased with the amendment of the
support framework in 2007. This enabled very attractive profits as shown
for 2009 in Figure 10. The PV Legal project identified a very long duration
for developing PV projects in Spain (actually the longest of all EU Member
States)[77]. The high profit opportunities can be seen as a main enabler of
the strong investment in the second deployment section.
PV-III Small growth, 2009-2012
In September 2008 a new law (Royal Decree 1578/2008) adjusted the
support framework of solar PV. The amendment had been justified by the
unexpected high growth in 2007 and 2008 and the expected reduction of
costs for solar PV equipment [78]. It seems likely, that the adaption of the
support framework is triggered by the economic burden due to recent
expenditures for RES support. The new law limited the new installed
capacity receiving remuneration by a cap of 500MW per year. The
favourable profitability enabled the exploitation of this limit with ease.

44
CSP-0 Marginal Growth, 1999-2008
The assessment of the investment conditions for CSP-E is difficult as no
data on profitability could have been procured. No information on the first
deployment section was available.
CSP-I Increasing or stable growth, 2008-2012
The deployment of CSP-E started in 2008 and growth rates increased in
the following years to 2012. According to [79] the support schemes have
been very effective in driving CSP deployment. Consequently, attractive
profit opportunities can be assumed as the main enabler to CSP-E
deployment.
W-III & PV-IV & CSP-II, Minimal or decreasing growth, 2013
In January 2012 Spain passed a moratorium to its FIT program for
unlimited time, applying to all renewable technologies (IRENA-GWEC). In
February 2013 the government abolished retrospectively the FIP scheme
for all existing plants. These retrospective and sudden changes “caused […]
a strong loss of confidence in the legal security of the Spanish RES-E
promotion regime” [80]. The low or missing profitability and the
uncertainty on future RES-E support worked as a strong barrier to the
deployment of wind and solar power in in 2013.
3.1.4 Summary of case studies
The main barriers and enablers identified through the case studies are
presented in Figure 11. The first category of factors includes those that
occurred in almost every Member State analysed and are thus considered
‘indispensable enablers’ for deployment. Consequently, their absence is
identified as an insurmountable barrier to RES-E deployment. In addition,
two other categories with lesser influence on deployment in the Member
States were identified. Factors that showed a positive effect on deployment
are grouped as ‘supportive enablers’, while those with a negative effect are
grouped as ‘hindering barriers’. The categorisation allows for a
prioritisation of factors within policies supporting RES deployment.
‘Indispensable enablers’ should be addressed preferentially before
supportive enablers or hindering barriers.

45
Figure 11 - Categorisation of factors identified through case studies and
their influence on RES-E deployment
3.1.5 RES-E deployment projections
Comparing the key features of different studies and scenarios can help to
better understand factors influencing projections of future RES
deployment. On one hand, energy-based models (such as the PRIMES
model used in the EC Reference Scenario 2016) allow to look forward based
on an optimization of all energy components, not purely electricity but also
gas and oil which all interact. On the other hand, power-based models
(such as the one used by ENTSO-E) are based on electricity market
simulations which take into account full-year hourly based profiles of load
and climate data, as well as grid constraints. Such power-based model
allows to assess price zone differentials, RES spillage and surplus, country
balances, etc. A comparison of projected RES-E shares in different studies
for 2030 is shown in Figure 12.
The projections of RES-E shares in the studies considered differ
significantly from each other. The lowest projection is from the IEA World
Energy Outlook (WEO) ‘Current Policies Scenario’ (39%, with 16% coming
from wind, 5% from solar and the remaining 18% from other RES-E
technologies). The highest projection is from the GHG45/EE/RES35
scenario of the EC Policy Framework study (67%, with 31% from wind, 9%
from solar, and 27% from other RES-E technologies). The main difference
between the two scenarios is that the IEA World Energy Outlook is based
on a simulation from an accounting model while the EC Policy Framework
study is based on the results of an optimisation model. The former

46
determines the share of RES-E in the future based on currently
implemented policies while the latter determines the least cost mix of
technologies to achieve specific targets set by the model user. In the case of
the GHG45/EE/RES35 scenario of the EC Policy Framework study, the
targets are well above current policies in the EU. In particular, the scenario
includes energy efficiency policies that are very ambitious and go beyond
enabling conditions. The average annual energy savings in 2020-2030
amount to a 2.3% savings per year. Efficiency standards for products
driven by Eco-design Regulations are continuously tightened, broadened
and extended to as yet unregulated products to cover all energy product
categories represented in the model. Further, energy efficiency polices
contribute to higher shares of RES-E as they reduce total electricity
consumption.
Figure 12 - Comparison of projected shares of RES-E in electricity
generation by 2030 based on different modelling studies and scenarios
The EC-Reference Scenario 2016 projects RES-E share of electricity
generation to reach 42% by 2030. The average RES-E of all scenarios in
the studies under consideration is 50%. The lower projection of the EC-
Reference Scenario is primarily due to a lower projected share of wind
power: 17% as compared to an average projection of 23%. Solar power and
other RES-E projections in the EC-Reference Scenario are closely aligned
with their average of their projected shares from the other studies.

47
The ENTSO-E TYNDP 2016 projects RES-E shares to be between uses
fossil fuel prices from the IEA’s World Energy Outlook 2013.The data used
was compiled prior to dramatic fall in fossil fuel prices in 201415. The IEA-
WEO 2013 projects the cost of crude oil to be at 136 $2012/bbl by 2030 as
compared to 127$2015/bbl suggested by the 2016 edition of the IEA-WEO.
These higher, pre-2014 fossil fuel price projections are likely to have
influenced the results of the ENTSO-E TYNDP 2016. Higher fossil fuel
prices, especially for gas, improve the cost competitiveness of solar PV and
onshore wind. For instance, fuel costs for a peaking gas power plant
accounts for 40% of its LCOE on average [81].
Electricity storage
The previous section highlighted the need for flexibility to balance
increasing shares of variable RES. Power system flexibility can be provided
by different means: energy storage, cross-border interconnectors, and
demand side management. Thus far, such flexibility has been provided at
the Member State level, supported by national policies. However, as the EU
enters the period beyond 2020, Member States will need to increasingly
rely on market mechanisms to provide the flexibility achieving the 2030
RES targets will entail. This section presents a quantitative analysis of the
role that storage can play in the EU’s power system at a time horizon of
2030 and 2050.
In this section, modelling results are presented for Germany, France and
Italy. For the business model case study (described in [61]), these three
countries have been selected for a detailed analysis to evaluate the
importance of storage systems. France and Italy have substantial flexible
hydro systems which can be used to balance and store electricity. Germany
on the other hand has limited pumped hydro storage potential, thereby
enabling a contrasting outlook compared to France and Italy.
The model generates a wide range of outputs such as installed capacity,
generation mix, hourly long-run marginal cost, capital cost, etc. For the
15 https://www.eia.gov/dnav/pet/pet_pri_spt_s1_d.htm

48
case study, we limit the discussion of results to installed capacity, which is
an input to the dispatch model (see [61]) and cost of capacity expansions.
3.2.1 Capacity Expansion
Figure 13 shows the total installed capacity of Germany in a CO2 emission
reduction scenario for the period 2030-2050, as well as the base year of
2010. Results from the least-cost scenario (LC) are also shown to illustrate
the technology preferences of the model in the absence of any climate
change mitigation targets. Although such a least-cost scenario is highly
unlikely, it is presented as a basis to understand the cost-optimization
framework.
Results from the LC scenario show that in the absence of nuclear-based
generation in Germany, coal power plants become the most cost-effective
technologies. In the absence of any long-term renewable incentive schemes
(like the feed-in-tariff), coal technology (especially lignite technology
available in Germany) would still be more cost optimal than renewable
technologies such as wind and solar PV, which is seen by the phase-out of
existing wind and solar PV technologies by 2050. Although wind and solar
PV technologies become much cheaper towards 2050, several other factors
could lead to such a generation mix.
In this instance for example, Germany invests considerably in cheap lignite
technology and exports excess base-load electricity to neighbouring
countries that lack the availability of such baseload options (for example,
in the year 2050, around 50TWh of electricity is exported by Germany to
neighbouring regions, mainly Switzerland and BENELUX). Such a
situation may seem unrealistic, but from a purely cost-optimal point of
view, in a single market model, there would be no reason for Germany to
invest in renewables to meet its electricity demand if it can export excess
baseload electricity and generate more revenue, thereby decreasing its
overall system cost. However, the total share of renewables for all of
EUSTEM increases from 13% of the total demand in 2010 to 27% in 2050.
This could either be due to other constraints preventing the investments in
fossil-fuel technologies (see Figure 14 for situation in France) or due to
better performances of renewables depending on geographical locations
(see solar PV investments in Figure 15 for situation in Italy). The large
base-load generation from coal plants is supplemented by dispatchable gas
and hydro plants to provide sufficient flexibility for the system.

49
Figure 13 - Electricity capacity expansion (Germany)
In the climate target scenario (CO2), coal based generation is gradually
replaced by wind and solar PV, supplemented by flexible gas and
electricity imports. The share of renewable capacity increases from 35% in
2010 to 76% by 2050. In order to balance the intermittent generation from
renewables, an investment in around 27 GW of battery storage is required
by 2050, in addition to the existing 7 GW of pumped hydro storage
available in Germany. This installed storage capacity amounts to around
9% of the total installed capacity. Additional flexibility is provided by
dispatchable gas plants, which accounts for approximately 3% of the total
installed capacity. Finally, there is a large expansion in interconnector
capacities, which increases by around 84% between 2010 and 2050. The
majority of the expansion occurs at the cross-border capacities with the
NORDIC and BENELUX regions, due to their high renewable and CCS
potentials. Results indicate that in order to meet stringent CO2 emission
targets, it would be cost optimal for Germany to become a net importer of
electricity (around 20% of the final electricity demand is imported).
0
50
100
150
200
250
300
350
400
450
2010 2030 2040 2050 2030 2040 2050
LC CO2
GW
Installed Capacity (Germany) Interconnectors
Hydro (Pump)
Hydro (Dam)
Tide
Wood
Waste & Biogas
Wind
Solar
Battery
Gas-CCS
Gas (Flex)
Gas (Base)
Coal-CCS
Coal
Nuclear
Hydro(River)

50
Figure 14 - Electricity capacity expansion (France)
Figure 14 shows the installed capacity in France. It is assumed that France
keeps its nuclear generation at the today’s level (in energy terms). In the
LC scenario, one can observe a steady increase in wind and solar PV
technologies especially by 2040 and 2050. This is attributed to the growth
constraints applied on nuclear and coal expansion. Hence in order to meet
the increasing electricity demand, renewable generation is competitive
compared to gas-based generation, although some investment in flexible
gas plants is still made to add flexibility in the electricity system. This is an
apt example of an external constraint influencing decisions in a cost
optimization model (in contrast to the German case discussed previously).
In the CO2 scenario, France has a slightly higher nuclear capacity by 2050.
This higher capacity is used at lowered annual load factors to account for
seasonal variabilities of its high renewable share. Solar PV and wind
capacities expand considerably by 2050 and account for around 48% of
total installed capacity. The stringent CO2 emission cap makes investments
in gas and coal plants unattractive in this scenario, thereby resulting in
higher penetrations of renewable technologies. Battery and pumped hydro
storage also accounts for almost 9% of total installed capacity (as was the
case with Germany), despite the availability of dam hydro (5% of total
installed capacity) which provides flexible generation. Interconnectors are
also significantly expanded (from 20 GW to almost 50 GW), primarily to
facilitate electricity exports to Italy, Switzerland, Germany and UKI due to
its low-carbon nuclear option.
0
50
100
150
200
250
300
350
400
2010 2030 2040 2050 2030 2040 2050
LC CO2
GW
Installed Capacity (France) Interconnectors
Hydro (Pump)
Hydro (Dam)
Tide
Wood
Waste & Biogas
Wind
Solar
Solar CSP
Geothermal
Battery
Oil
Gas-CCS
Gas (Flex)
Gas (Base)
Coal-CCS
Coal
Nuclear
Hydro (River)

51
Figure 15 shows the installed capacity of Italy. In the LC scenario, solar PV
and wind technologies already occupy a share of 46% of the total installed
capacity by 2050. In this case, base-load electricity is obtained from gasl,
oil, and coal-based generation as well as electricity imports from EAST and
France. The model then prefers solar PV technologies, whose profile
follows the electricity peak load at noon (see load curve diagram in [61]),
with flexible gas and hydro technologies filling the gaps. This is in strong
contrast with France, where renewable investments were made due to the
inability to expand its baseload option; and Germany, where renewable
technologies were phased-out by 2050 in favour of coal-based baseload
generation.
Figure 15 - Electricity capacity expansion (Italy)
For Italy, results for the decarbonisation scenario (CO2) closely resembles
its least-cost solution (LC) till the year 2040. Afterwards, there is a
significant increase in solar PV installations, making up almost 47% of the
total installed capacity (which rises to 55% when including wind). Battery
and pump storage accounts for more than 20% of the total capacity,
significantly higher than in France and Germany. This is explained by the
much higher share of solar power in the generation mix of Italy, compared
to Germany where wind-power dominates over solar PV generation.
Interconnectors with neighbouring regions are almost doubled, with Italy
still remaining a net importer of electricity (around 14% of the demand in
2050 is covered by electricity imports, primarily from France).
0
50
100
150
200
250
300
2010 2030 2040 2050 2030 2040 2050
LC CO2
GW
Installed Capacity (Italy) Interconnectors
Hydro (Pump)
Hydro (Dam)
Tide
Wood
Waste & Biogas
Wind
Solar
Solar CSP
Geothermal
Battery
Oil
Gas-CCS
Gas (Flex)
Gas (Base)
Coal-CCS
Coal
Nuclear
Hydro ( River)

52
Based on the results discussed above, the penetration of new storage
technologies such as batteries occurs only towards the end of the time
horizon, i.e. by the year 2050. This is attributed to two main reasons,
namely the share of intermittent renewables and the cost reduction of
storage technologies. For example, in Italy, the share of solar PV and wind
technologies is around 27% of the total electricity generation in the year
2040, which increases to 59% by 2050. Concurrently, the share of flexible
generation technologies such as gas plants, which help in balancing the
system, is reduced from 36% in 2040, to 18% in 2050, mainly due to the
stringent CO2 emission cap. Hence the increase in share of intermittent
generation and decrease in flexible backup technologies, coupled together
with the reduction in technology costs makes investments in battery
technology cost effective by the year 2050. This conclusion is valid for the
other regions as well, where similar trends are observed.
3.2.2 Cost of capacity expansion
One of the key outputs of EUSTEM is the total system cost. For this
particular case study, focus has been limited to the capital investment costs
to examine the economic feasibility of storage systems.
Table 4 summarises the capital investment required in Germany, Italy and
France for the two scenarios studied. The cumulative investment required
in the LC scenario between 2018 and 2050 is around 232 billion Euros16.
On the other hand, investment costs in the CO2 scenario for the period
2046–2055 alone is close to 350 billion Euros. The cost of decarbonizing
the electricity system of Germany incurs an additional capital cost of
almost 450 billion euros between 2018 and 2050. The cost of investing in
battery storage, which primarily occurs during 2046–2055, is
approximately 40 billion euros, i.e. four billion euros per year in that
period. The revenue generated by battery electricity storage must be able
to cover this investment costs.
16 Currency Conversion: 1 €2010 = 1.32 CHF2010 (XE (2014), Current and Historical Rate
Tables, http://www.xe.com/currencytables/)
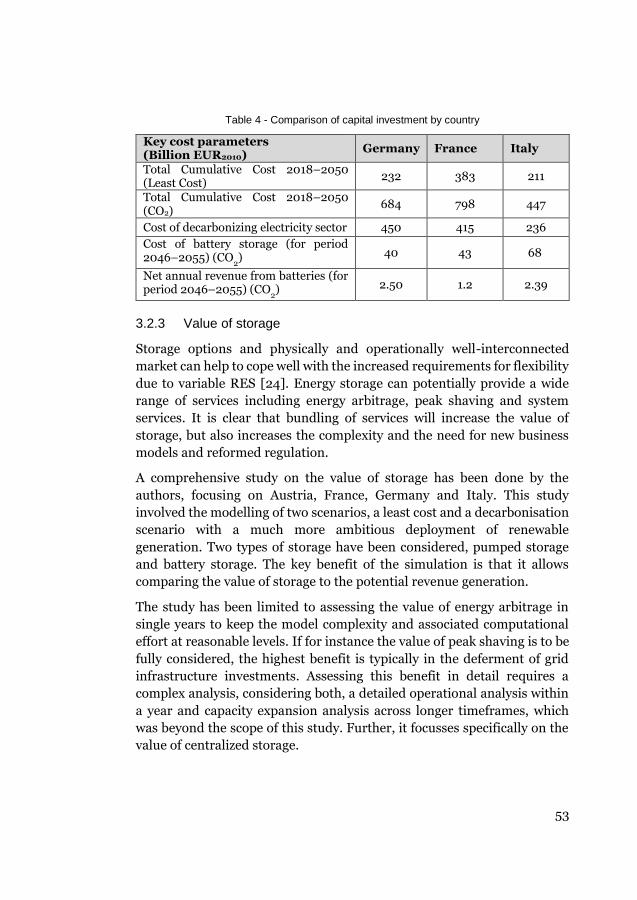
53
Table 4 - Comparison of capital investment by country
Key cost parameters (Billion EUR2010)
Germany France Italy
Total Cumulative Cost 2018–2050 (Least Cost)
232 383 211
Total Cumulative Cost 2018–2050 (CO2)
684 798 447
Cost of decarbonizing electricity sector 450 415 236
Cost of battery storage (for period 2046–2055) (CO
2) 40 43 68
Net annual revenue from batteries (for period 2046–2055) (CO
2) 2.50 1.2 2.39
3.2.3 Value of storage
Storage options and physically and operationally well-interconnected
market can help to cope well with the increased requirements for flexibility
due to variable RES [24]. Energy storage can potentially provide a wide
range of services including energy arbitrage, peak shaving and system
services. It is clear that bundling of services will increase the value of
storage, but also increases the complexity and the need for new business
models and reformed regulation.
A comprehensive study on the value of storage has been done by the
authors, focusing on Austria, France, Germany and Italy. This study
involved the modelling of two scenarios, a least cost and a decarbonisation
scenario with a much more ambitious deployment of renewable
generation. Two types of storage have been considered, pumped storage
and battery storage. The key benefit of the simulation is that it allows
comparing the value of storage to the potential revenue generation.
The study has been limited to assessing the value of energy arbitrage in
single years to keep the model complexity and associated computational
effort at reasonable levels. If for instance the value of peak shaving is to be
fully considered, the highest benefit is typically in the deferment of grid
infrastructure investments. Assessing this benefit in detail requires a
complex analysis, considering both, a detailed operational analysis within
a year and capacity expansion analysis across longer timeframes, which
was beyond the scope of this study. Further, it focusses specifically on the
value of centralized storage.

54
Within this study the wholesale market prices are derived for two specific
years (2030 and 2050) using a model based approach. A power plant
portfolio is constructed for each Member State for two scenarios (Least cost
and CO2 Mitigation/Decarbonisation) and two years (2030 and 2050). In
all, approximately 3,000 individual thermal power plants are included in
the model. Power plant capacities, efficiencies and fuel types are based on
outputs from the EUSTEM model described in the earlier chapter on ‘Need
for flexibility and potential solutions’. The model minimises overall
generation costs to meet demand subject to the technical characteristics of
the power plants. The resulting market price is defined as the marginal
price at Member State level (often called the shadow price of electricity)
and does not include any extra revenues from potential balancing, reserve
or capacity markets, or costs such as grid infrastructure costs, capital costs
or taxes. Results of these simulations for 2030 and 2050 are shown in [61].
The study verifies findings from other studies that multiple benefits are
required to justify battery storage. It confirms that there is a clear
correlation between the degree of the penetration of renewables and the
value of storage. Under current estimations of battery prices, there is no
business case for battery storage at the grid level up to 2030. Battery
storage becomes however attractive in selected markets in 2050.
Moreover, there are large variations between the countries which were
investigated. The main reason is the significant difference in their
production mix and infrastructure.
Role of interconnectors in the EU electricity system
The role and potential of large-scale, centralized storage has been
identified. Although the potential is significant, not all countries have
access to large scale electricity storage and even if they do, installed
capacities are often limited. Furthermore, considering expected conversion
losses in the storage cycle of PHS ranging between 70% and 85% [15],
direct utilization of generated electricity can generally be seen as more
cost-efficient. Finally, several studies have shown the synergistic effects
between interconnector capacity and storage [26], [29], [82].
This section assesses the functionality of the available interconnection
capacity in the 2030 European power system through a range of exemplary
cases.

55
3.3.1 Impact of variable generation on flow dynamics
Figure 16 showcases the flows of electricity from and towards Germany
during two deviating days within the simulated 2030 power system.
Roughly 63% of Germany’s installed capacity in the simulated system is
based on wind and solar-PV. In total during 34.6% of the year, or during
3035 hours, Germany produces more electricity by its combined capacity
of variable renewables and ‘must run’ power plants than needed for the
domestic demand. On July 17, there’s a strong peak production of
electricity in Germany and other Northern from wind and solar-PV. This
production results in a large oversupply in the entire area at daytime. The
effect is that during these hours Germany imports electricity from the
Scandinavian countries and the Netherlands (NL, which imports electricity
simultaneously from Scandinavia and Great Britain) and exports electricity
towards the southern and eastern countries. When the evening starts and
the electricity generation from solar-PV decreases, the export stops. The
domestic generation drops below the demand at that timeframe and
Germany starts importing electricity from Austria (AT) combined with a
continuous import from the Scandinavian countries.
During February 13 a different situation occurs. It is a cold winter day in
Germany, resulting in a high demand for (electric) heating during hours
when people are generally at home, with a relatively low input of variably
generated electricity. In these hours of high demand, the combined import
of electricity increases significantly, mainly from baseload or storage
oriented countries, such as Austria, France and Switzerland. During in-
between periods of lower demand, the net import decreases and the system
adequacy can be fulfilled with predominantly domestic backup generators.
Figure 16 - 2030 cross-border transmissions Germany July 17 and
February 13. Negative values indicate import; positive values indicate
export. Lines of the DE-CZ and DE-SE connections are dashed to show the
underlying connections of DE-PL and DE-BE at equal load.

56
Although there are clear differences visible in these situations and an
ongoing change in dynamics, there are also some recurring elements. For
example, that an almost continuous load flow exists from Germany
towards Poland (PL) and the Czech Republic (CZ) as a result of relatively
low domestic cost-efficient generation capacity within these countries.
Furthermore, the Scandinavian countries almost continuously export
electricity towards Germany whereas countries such as Austria, France,
Luxembourg (LU) and Switzerland (CH) with relatively lower influence of
variable generation, react on the situation in Germany. These countries
generally import during peaks in Germany’s generation and export when
domestic generation in Germany is low. The Netherlands has a strong
resemblance to the German power system and is often influenced by
correlated changes in wind speeds and solar irradiation. According to
Monforti and colleagues [38] there is a 78% country-to-country correlation
in wind power between Germany and the Netherlands. This correlation
often results in simultaneous peaks and lows in variable generation. Thus,
when Germany has a net export usually the same occurs in the
Netherlands, as well as during net import. The Netherlands is also used as
a transit country between load centres as Great Britain and Germany.
3.3.2 Dispersing renewable surplus electricity
Denmark (DK) is the country with the highest relative fraction of installed
capacity of variable renewables at 66% in the 2030 power system, of which
55% from on- and offshore wind. During in total 4442 hours of the year,
Denmark produces more electricity from their variable renewables alone
than needed for domestic demand. Combined with their must run capacity
and their renewable thermal fleet (biomass combustion) this increases up
to 5166 hours. Since it has no domestic storage fleets, it is dependent on its
interconnection capacity for balancing the variability in generation.
In Figure 17 – as well Figure 18 and Figure 19 in the following sub-sections
- demand is represented by a red line while marginal cost of production is
represented by a blue line. The remainder of the figures are composed on
electricity generation from different technologies such as hydro power and
wind as well as cross-border interconnectors. Figure 17 shows the demand
and generation profiles of Denmark and Germany on April 18, and the
dynamics of their cross-border flows.

57
Germany in this situation imports a significant part of the generated
electricity from Denmark throughout the day for direct use. The import
occurs almost consistently at full interconnection capacity of 4 GW.
Figure 17 - Electricity generation and consumption in Denmark (DK) and
Germany (DE) on April 18, 2030.
Although Denmark has a total generation surplus of approximately 51
GWh during this day, the maximum surplus per hour is around 3.2 GW.
This means that not all imported electricity from Denmark is based on
surplus, which can clearly be seen in the graph. It is an indication that
Denmark is used as a transit country in this situation. More specifically,
Denmark imports electricity from Great Britain (surplus renewable
electricity), Norway and Sweden (hydro power). The generation profile of
Germany also indicates that import of electricity from Denmark alone is
not sufficient for fulfilling its demand. An additional 121 GWh is imported
from other regions throughout the day. While the interconnection capacity
between Denmark and Germany is during 15 hours of the day congested,
the marginal cost of electricity generation in both countries is still
determined through the functionality of the integrated market. This is
possible due to indirect connections between Denmark and Germany,
through the Netherlands, Norway and Sweden which are not congested.
This case shows several important aspects. The use of the imported
renewably generated electricity from Denmark prevents the utilization of
more expensive fossil-fuel-based backup generators within Germany,
stimulates renewables penetration and prevents electricity curtailment in
Denmark. Furthermore, the functioning of a transit country as Denmark
stimulates the generation and flow of cheap renewably produced electricity
from different areas towards the load centres in Europe, such as Germany.
It also shows the strong impact of a country with high demand and high

58
variable installed capacity such as Germany during a situation of lower
variable generation on the dynamics in the European power system.
3.3.3 Dynamics with foreign PHS fleets
Figure 18 shows the generation within and dynamics between Austria and
Germany during July 17. The large oversupply of electricity due to the high
variable peak generation in Germany is partly resolved by filling its
domestic PHS fleet, resulting in a fully stocked storage capacity of just
below 70 GWh. Storage alone is not sufficient to effectively use all the
generated electricity surplus. Most of the remainder is therefore exported
towards Austria below the full transmission capacity of 7.5 GW, totalling
43.2 GWh. Since there is no occurrence of congestion, the functionality of
the integrated market between Austria and Germany stays intact. The
imported electricity is consumed by Austria’s PHS fleet at a marginal cost
of 61.3 €/MWh. When the variable generation in Germany decreases below
its domestic demand, the electricity flow is being converted from electricity
export into import from Austria to almost completely fulfil the demand in
Germany. The remainder comes from electricity generation from
Germany’s domestic PHS fleet and additional imports from other
countries. The imported electricity from Austria is produced by its PHS and
hydro fleet, at a marginal cost equal to the production costs of the
technology next in line of the merit order, being the CCGT fleet. Besides
export to Germany, Austria exports almost 50% of the additionally
produced electricity from the PHS- and normal hydro fleet to other regions
in Europe (e.g. towards Italy and Hungary) during that day. Indirectly, the
cheap surplus electricity from Germany is thus spread out over a larger
area beyond Austria.
Figure 18 - Electricity generation and consumption in Austria (AT) and
Germany (DE) on July 17, 2030.
The general effects and advantages of electricity storage as described
earlier in this study also count for the use of storage in an international

59
context. The current example has shown us the additional benefits of using
storage in an international setting through cross-border transmissions of
electricity. If a country does not have domestic storage capacity, or
alternatively not sufficient, surplus electricity can be exported, stored and
imported again in a later stage, preventing the use of more expensive non-
renewable backup capacity for the generation of electricity. Second
important benefit is that countries with large PHS storage capacities, such
as Austria, Italy, Spain and Switzerland can act as a transit buffer by
stocking up on cheaply generated electricity and spreading it out in a later
stage.
3.3.4 Preventing loss of load
The case visualized in Figure 19 shows an example where interconnection
capacity is used to prevent loss of load (LOL) on the Polish electricity grid.
The variable generation in Poland during December 5 is relatively speaking
low. Yet more importantly, within the simulated European power system
of the TYNDP the Polish available generation capacity for fulfilling the
domestic system adequacy is low as well. These factors combined result in
a situation where import of electricity is necessary to prevent LOL and its
attached price penalty. Among others, this import is supplied by additional
generation of electricity from the CCGT- and coal fleet in Germany. The
available transmission capacity between Germany and Poland of 2 GW is
used during almost the entire day. This leads to a disruption of the
functionality of the integrated market, resulting in a separate local
marginal price in Poland at the production costs of the coal fleet and later
in the day of the lignite fleet at 88 €/MWh. Although the costs are high, it
is a better alternative than LOL on the electricity grid and its attached
financial and social consequences.
Figure 19 - Electricity generation and consumption in Germany (DE) and
Poland, December 5, 2030.

60
Costs of electricity supply interruptions
One of the dimensions of the European Commission’s Energy Union
relates to a “fully integrated European energy market”. A significant focus
of current EU energy policy is directed towards removing barriers to
achieving such an integrated energy market. An important barrier is the
reconciliation of objectives at the EU-level with those at the Member State-
level. Among the factors that strongly affect national energy policy is the
need for reliable electricity supply to all end-use sectors: industry,
commerce, agriculture, transportation, and households. As mentioned in
previous sections, it is important to quantify and compare electricity
outage costs at the household level across all EU Member States. Using the
methodology described in the previous section, an annual average VoLL
was determined for each EU Member State. Figure 20 shows a comparison
of the annual average VoLL, by EU Member State on a map in order to
highlight the differences between neighbouring Member States. These
disparities are of particular importance in the context of achieving the
“fully integrated European energy market” described above.
The annual average VoLL for EU Member States ranges from 3.2 €/kWh
for Bulgaria to 15.8 €/kWh for the Netherlands. The average VoLL for the
EU was calculated to be 8.7 €/kWh. As detailed in the methodology
section, the VoLL directly proportional to hourly wages and inversely to
per capita electricity consumption. On the one hand, Bulgaria has the
lowest hourly wage, but an above average per capita electricity
consumption partially due to an inexpensive - although inefficient -
generation mix [45,46]. On the other hand, the Netherlands has a relatively
high hourly wage but a below average per capita electricity consumption.
Other Member States with a low VoLL (below 6 €/kWh) are Croatia,
Cyprus, Estonia, Finland, Greece, Hungary, Latvia, Lithuania, Malta, and
Romania. Member States with a high VoLL (above 11 €/kWh) include
Belgium, Denmark, Italy, Luxembourg, Poland and the Netherlands.
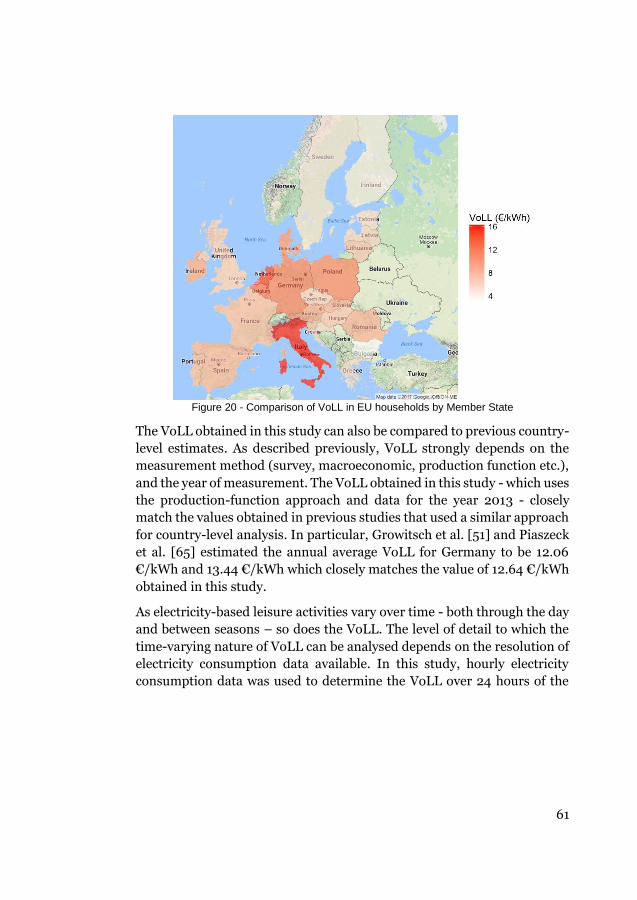
61
Figure 20 - Comparison of VoLL in EU households by Member State
The VoLL obtained in this study can also be compared to previous country-
level estimates. As described previously, VoLL strongly depends on the
measurement method (survey, macroeconomic, production function etc.),
and the year of measurement. The VoLL obtained in this study - which uses
the production-function approach and data for the year 2013 - closely
match the values obtained in previous studies that used a similar approach
for country-level analysis. In particular, Growitsch et al. [51] and Piaszeck
et al. [65] estimated the annual average VoLL for Germany to be 12.06
€/kWh and 13.44 €/kWh which closely matches the value of 12.64 €/kWh
obtained in this study.
As electricity-based leisure activities vary over time - both through the day
and between seasons – so does the VoLL. The level of detail to which the
time-varying nature of VoLL can be analysed depends on the resolution of
electricity consumption data available. In this study, hourly electricity
consumption data was used to determine the VoLL over 24 hours of the

62
day for 12 months of the year, in each EU Member State17. These results are
shown in Figure 21. The highest VoLL is found to be between 17:00 – 19:00
in the Winter months (November- February) for Denmark and the
Netherlands, and between 10:00 – 16:00 in the Summer months (June-
August) for Italy. Since the comparison in Figure 21 is scaled over a wide
range of values across the EU, the VoLL in Bulgaria, for instance, appears
to be relatively low for the entire year.
In addition, some general trends for all the Member States can be
identified. VoLL is found to be the lowest between the hours of 23:00 and
6:00. In most Member States, the greatest hourly outage cost is found to
between the hours of 17:00 – 21:00. The time of year that this peak VoLL
occurs varies for each Member State based on their latitude; for Member
States in Northern Europe – such as Denmark, Sweden and Finland- peak
VoLL occurs in the Winter months (November-February) while for
Member States in Southern Europe – such as Spain, Italy and Greece- peak
VoLL occurs in the Summer months (June-August). In addition, VoLL in
Central European Member states, such as the Netherlands, Germany and
Austria, show less seasonal variation.
Figure 21 highlights the heterogeneity of electricity interruptions costs
across the EU in terms of time of interruption as well their magnitude.
Previously, the important role of cross-border interconnectors was
highlighted. With significantly varying costs of electricity supply
interruptions across the EU, this study highlights differing incentives to
invest in cross-border interconnectors between neighbouring Member
States. Therefore, the heterogeneity of electricity interruption costs across
the EU could potentially act as a barrier to increased RES-E penetration.
17 Time-varying VoLL was not calculated for Malta as hourly electricity consumption
data was not available for it is not available on the ENTSO-E data portal. Time-
varying VoLL results for the remaining 27 EU Member States have been calculated
and reported.
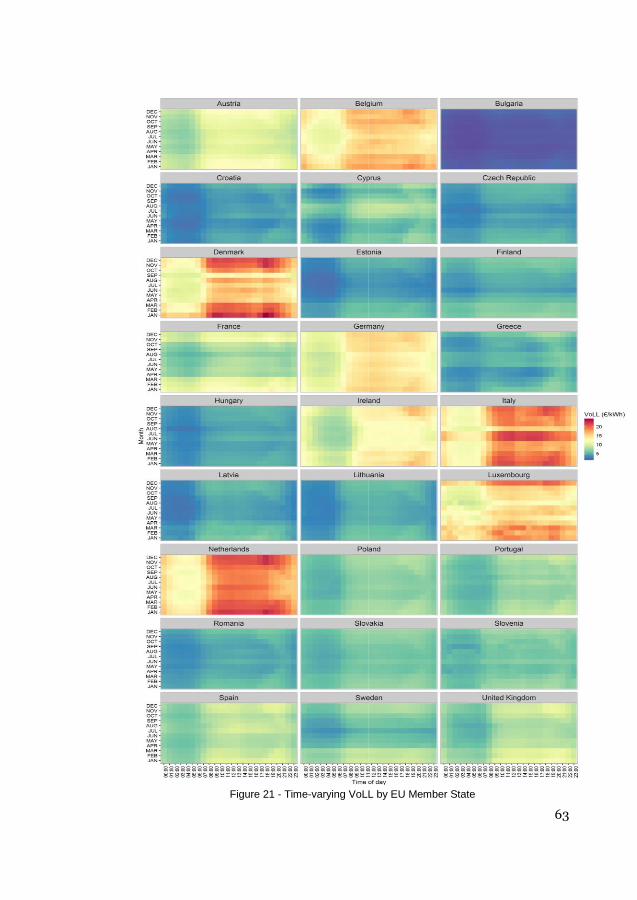
63
Figure 21 - Time-varying VoLL by EU Member State

64
4 Conclusions
This section presents the overall conclusions of the thesis. It consists of a
list of specific academic contributions, limitations, suggested future work,
and finally the impact of the thesis.
Key messages
The thesis first demonstrated the factors which significantly impacted past
RES-E deployment in different representative EU Member States. Further,
it was revealed that certain barriers (e.g. access to finance, spatial planning
process, and unsustainable ratio of effectiveness to efficiency of
deployment) and enablers (e.g. explicit RES support policies, long term
certainty of government support, and efficient administrative procedures)
are common to several Member States considered. This suggests that the
selected Member States – considered as representative of the entire EU -
are confronted with similar barriers and can achieve deployment through
common enablers. Consequently, there is significant potential to learn
from each other and possibly develop common guidelines at the EU level.
This guidance could take the shape of ‘best practice policy principles’ and
‘lessons learned’ and can rely on the concept of barriers and enablers as
used in this analysis.
Policy certainty is found to be a key enabler of RES-E technology
deployment success. Further, projections of future RES-E trends in the EU
are important, and will continue to be so, as they play a vital role in
designing and evaluating the impact of policies. The meta-analysis of
previous studies shows the significant variance in projected levels of RES-
E shares in the EU. While no study is expected to accurately predict future
levels of RES-E, the meta-analysis showed their sensitivity to underlying
data, assumptions, and methodologies. However, not all projection studies
- and the energy strategies based on them – explicitly state their underlying
assumptions.
The EU is on track to meet its 2020 RES targets, which are legally binding
at the Member State level. The targets set in the 2030 climate and energy
framework are only legally binding at the EU level and this is seen as a risk
since Member States may not be sufficiently incentivised to invest in RES
deployment beyond 2020.
65
Literature shows that multiple benefits are required to justify battery
storage in the EU until 2030. As such, energy storage will be able to both
enhance existing competition and support flexibility (generation
curtailments, load modulation, peak load shaving, peak load shifting) in
energy markets. In the framework of European Union’s innovation policy,
additional research would need to be performed in relation to the
contribution of energy storage to the overall energy system on aspects such
as, for instance, security of supply. Further, there is a clear correlation
between degree of RES implementation and the value of storage. This is
illustrated by the difference in feasibility of storage in the Reference
scenarios and CO2 scenarios. Under current cost estimations and policy
framework, there is no business case for battery storage until 2030 but it
may become feasible by 2050 in selected markets.
This thesis underlines the significance of assets for balancing generation
variability in the 2030 European power system in a high variable context.
The potential high variable 2030 European power systems are assessed in
this thesis using an hourly dispatch model to integrate realistic decision
making functionalities. An integrated market approach is applied based on
a nodal pricing methodology. By zooming in on daily snapshots of
electricity generation, load, marginal cost and balancing assets, this study
creates a better understanding of the dynamics in these high variable
systems during deviating situations throughout the year, throughout
Europe. It is shown that there are multiple reasons why assets for
balancing variability should be integrated in a high variable European
power system. For example, to prevent expensive alternative generation
for fulfilling the system adequacy, to manage peak- or consistent
oversupply of electricity, especially during periods of lower demand such
as weekends or national holidays, or to prevent loss of load on the
electricity grid. The implementation of centralized electricity storage,
increased cross-border transmission capacity and demand response (DR)
applications in a high variable electricity generation context, all contribute
to the integration of renewables and to optimizing the costs of electricity
generation throughout the fully-integrated European power system. Cross-
border transmission capacity can help unlock the full potential of storage
and DR by allowing the use of the most cost-efficient generation
technologies throughout the European power system. Countries with large
storage capacities can act as a transit buffer for storing and supplying
cheaply generated electricity over a longer time span through a larger

66
region. And DR can prevent system congestion and the use of expensive
backup generators by decreasing the pressure on the capacity of
transmission lines or storage facilities.
The EU, which pursues a policy of increasing the share of RES in national
and regional generation mixes, must make additional efforts in order to
maintain current levels of supply reliability. From a socio-economic
perspective, the most commonly used indicator to measure interruption
costs is the value of lost load (VoLL). VoLL is likely to play a significant part
in informing a number of key areas of European energy policy and market
design. In this thesis, VoLL for households in all twenty-eight EU Member
States is estimated based on a uniform methodology for the first time. The
findings are envisaged to provide a basis for meaningful comparison
between EU Member States and to inform key areas of European energy
policy such as the design of capacity and balancing markets. At present,
VoLL is completely lacking in international comparability. All previous
studies to determine VoLL have been performed at a national level for
individual countries. Therefore, while estimating VoLL has been
considered and explored in an international context, the heterogeneity of
methods used and base year analysed precludes the inter-comparison of
studies. As mentioned in the previous section, this thesis highlights the
variance in electricity interruptions costs across the EU in terms of time of
interruption as well their magnitude. Earlier, the important role of cross-
border interconnectors towards increasing RES shares in the EU was
highlighted. With significantly varying costs of electricity supply
interruptions across the EU, this thesis highlights the differing incentives
to invest in cross-border interconnectors between neighbouring EU
Member States. The variance of electricity interruption costs across the EU
could therefore potentially act as a barrier to increased RES-E penetration.
Table 5 below summarises the contributions of this thesis to existing
academic knowledge. While non-exhaustive, it provides a list of the main
highlights in the thesis.

67
Table 5 - Thesis contributions
Analytical advances
First meta-analysis of studies projecting RES shares for the EU
to identify influencing factors.
First study providing 'snapshots' of power system dynamics in
the EU for individual days in 2030 using an hourly dispatch
model.
First comparison of Value of Lost Load (VoLL) across all EU
Member States using with a single methodology and common
data sources allowing an analysis of differing incentives towards
cross-border interconnectors between EU Member States.
Methodological advances
Developed a novel methodology to assess the effectiveness of RE
deployment and applied it to seven representative EU Member
States.
Proposed a new methodology to improve the measurement of
progress in deploying smart energy solutions such as smart
meters and demand side management.
Expanded an existing methodology for linking a short-term
dispatch model and a long-term capacity expansion model to
have an explicit focus on the role of electricity storage.
Creation of new data and insights
Identified regulatory barriers to the participation of electricity
storage in a redesigned EU electricity market.
Highlighted the multiple benefits of interconnector capacities
between EU Member States in 2030 using an hourly dispatch
model.
Quantified the cost of electricity supply interruptions for
households in all 28 EU Member States. Highlighted the
variance in electricity interruption costs across the EU from an

68
average of 3.2 €/kWh in Bulgaria to 15.8 €/kWh in the
Netherlands
Specific insights
Proposed a new definition of electricity storage in response to a
European Commission request to support the formulation of
the new Electricity Market Design. A new definition is required
to appropriately value the storage as a source of flexibility
services a redesigned EU electricity market.
Current state of progress in deploying smart meters and
demand side management in selected EU Member States.
Assessed the potential for large-scale electricity storage in the
EU’s present and future power system using a combination of a
long term optimisation model and a dispatch model. The
expected remuneration for electricity storage technologies,
based on current EU policies, was found to be insufficient in all
countries until 2030 but appearing in selected markets by 2050.
Estimated the role of CO2 prices on the dynamics of the EU
electricity market and power system.
Recommendations and future work
This thesis focussed on RES deployment in the electricity sector. While the
electricity sector is of crucial importance, the heating & cooling, and
transport sectors should be studied as well. This will provide a more
comprehensive view of RES deployment within the EU and will especially
help in identifying areas of synergies between two or more sectors. One
such area is the rapid deployment of electric vehicles [85], which strongly
links to both the transport and electricity sectors. For instance, electric
vehicles will increase electricity sector demand while also acting as a
potential source of decentralised storage and demand response. In the
context of this thesis, the move towards electric vehicles would likely act as
an enabler of increased RES-E penetration in the EU.
Further, this thesis focussed on variable RES, such as wind and solar. Wind
and solar play an increasingly important role within the EU’s energy
system and come with unique challenges related to balancing their

69
variability. While other RES such hydro power and bioenergy are included
in the modelling work (Paper IV and book chapter), they are not
investigated in depth in Papers I, II, III, and V.
Another area worth further investigation is the role and potential of
decentralized storage as well as thermal storage. This thesis mainly
considered large-scale electricity storage for two reasons: a focus on the
electricity sector and the current prevalence of large-scale storage in
comparison to decentralized storage in the EU. However, both
decentralised and thermal storage are expected to play an increasingly
important role in achieving the EU’s RES targets. In the context of this
thesis, studying decentralised and thermal storage will provide a more
comprehensive view of the role of storage as an enabler of increased RES
deployment. Specifically, it may indicate that a business case for certain
storage technologies such as decentralised storage can be made before
large-scale, centralised storage.
Further work is suggested on the cost of electricity supply interruptions as
well. The study estimating and comparing VoLL across the EU only
considered the households sector. However, VoLL for other sectors such as
industry and commercial services will need to be studied as well in order
to gain a more comprehensive perspective of electricity interruption costs
across the EU.
Finally, the energy and power system models used in this thesis included a
large amount of techno-economic data on different energy technologies –
both current and projections. The models and their structure are expected
to be representative of the EU electricity system for the foreseeable future.
However, the data included will need to be updated in future modelling
studies in order to track current trends such as the rapidly declining capital
costs of solar PV and li-ion batteries as well as volatile fuel prices.
Impact of the thesis
All of the studies presented in this thesis were part of INSIGHT_E (FP7
project), a multidisciplinary energy think tank informing the EC. The
studies were prepared as responses to direct requests from various units
the EC. They were intended to provide the evidence-based insights
required from energy policy actions by the EC and recommendations to
Member States. Specifically, results from INSIGHT_E were directly
included in the EC’s Winter Package released in November 2016, which is

70
expected to shape energy policy in the EU for the period beyond 2020.
Further, the book chapter included in this thesis is a part of book that
compiled INSIGHT_E’s outputs titled, ‘Europe’s Energy Transition:
Insights for Policy Making’ (2017).

71
References
[1] European Commission, “Energy union and climate,” European Commission - European Commission, 08-Dec-2015. [Online]. Available: https://ec.europa.eu/commission/priorities/energy-union-and-climate_en. [Accessed: 22-Aug-2017].
[2] European Commission, “2020 climate & energy package,” Climate Action - European Commission, 23-Nov-2016. [Online]. Available: https://ec.europa.eu/clima/policies/strategies/2020_en. [Accessed: 22-Aug-2017].
[3] European Commission, “Directive 2009/28/EC of the European Parliament and of the Council of 23 April 2009 on the promotion of the use of energy from renewable sources and amending and subsequently repealing Directives 2001/77/EC and 2003/30/EC,” Off. J. Eur. Union, 2009.
[4] European Commission, “2030 climate & energy framework,” Climate Action - European Commission, 23-Nov-2016. [Online]. Available: https://ec.europa.eu/clima/policies/strategies/2030_en. [Accessed: 22-Aug-2017].
[5] European Commission, “Clean Energy For All Europeans.” European Commission, 30-Nov-2016.
[6] European Commission, “Technical Memo on the revised Renewable Energy Directive.” European Commission, 30-Nov-2016.
[7] European Commission, “Technical Memo on the new Electricity Market Design.” European Commission, 30-Nov-2016.
[8] European Commission, “Impact Assessment accompanying the Energy Roadmap 2050.” European Commission, 2011.
[9] J. Cochran et al., “Flexibility in 21st Century Power Systems,” May 2014.
[10] C. Jullien, P. Serkine, M. Miller, S. Bubeck, and U. Fahl, “End-users: The trigger to shape the European Energy System,” HET 16, 2016.
[11] P. Capros et al., “EU Reference Scenario 2016-Energy, transport and GHG emissions Trends to 2050.,” 2016.
[12] European Commission, “COM(2014) 634 final, ‘Progress towards completing the Internal Energy Market.’” European Commission, 13-Oct-2014.

72
[13] European Commission, “COM(2015) 82 final, ‘Achieving the 10% electricity interconnection target.’” European Commission, 25-Feb-2015.
[14] Christian Oliver, “EU energy market: Pipe dream,” Financial Times, 09-Jul-2014. [Online]. Available: https://www.ft.com/content/c6dd6c38-ea3c-11e3-afb3-00144feabdc0. [Accessed: 22-Aug-2017].
[15] European Commission, “Commission Decision: Setting-up a Commission expert group on electricity interconnection targets.” European Commission, 03-Oct-2016.
[16] M. Aichinger, M. Bruch, V. Münch, M. Kuhn, M. Weymann, and G. Schmid, “Power Blackout Risks: Risk Management Options,” CRO Forum: Emerging Risk Initiative, Nov. 2011.
[17] T. Schröder and W. Kuckshinrichs, “Value of Lost Load: An Efficient Economic Indicator for Power Supply Security? A Literature Review,” Front. Energy Res., vol. 3, Dec. 2015.
[18] B. Johansson, “Security aspects of future renewable energy systems–A short overview,” Energy, vol. 61, pp. 598–605, Nov. 2013.
[19] B. Johansson, “A broadened typology on energy and security,” Energy, vol. 53, pp. 199–205, May 2013.
[20] G. Hawker, K. Bell, and S. Gill, “Electricity security in the European Union—The conflict between national Capacity Mechanisms and the Single Market,” Energy Res. Soc. Sci.
[21] London Economics, “The Value of Lost Load (VoLL) for Electricity in Great Britain,” London Economics, Jul. 2013.
[22] IEA, World Energy Outlook 2015. Paris: Organisation for Economic Co-operation and Development, 2015.
[23] ecoprog, “The World Market for Pumped-Storage Power Plants,” 2013.
[24] EASE/EERA, “European Energy Storage Technology Development Roadmap towards 2030,” 2015.
[25] S. Cole, D. Van Hertem, L. Meeus, and R. Belmans, “Energy storage on production and transmission level: a SWOT analysis,” WSEAS Trans. Power Syst., vol. 1, no. 1, p. 31, 2006.

73
[26] H. Blanco and A. Faaij, “A review at the role of storage in energy systems with a focus on Power to Gas and long-term storage,” Renew. Sustain. Energy Rev., vol. 81, pp. 1049–1086, Jan. 2018.
[27] I. Hidalgo González et al., Addressing flexibility in energy system models. Luxembourg: Publications Office, 2015.
[28] H. Chen, Z. Liu, A. K. Coskun, and A. Wierman, “Optimizing energy storage participation in emerging power markets,” in Green Computing Conference and Sustainable Computing Conference (IGSC), 2015 Sixth International, 2015, pp. 1–6.
[29] M. G. Rasmussen, G. B. Andresen, and M. Greiner, “Storage and balancing synergies in a fully or highly renewable pan-European power system,” Energy Policy, vol. 51, pp. 642–651, Dec. 2012.
[30] F. J. de Sisternes, J. D. Jenkins, and A. Botterud, “The value of energy storage in decarbonizing the electricity sector,” Appl. Energy, vol. 175, pp. 368–379, Aug. 2016.
[31] J. P. Deane, A. Chiodi, M. Gargiulo, and B. P. Ó Gallachóir, “Soft-linking of a power systems model to an energy systems model,” Energy, vol. 42, no. 1, pp. 303–312, Jun. 2012.
[32] ENTSO-E, “TYNDP 2016 Scenario Development Report,” Nov. 2015.
[33] Christian Hewicker, Michael Hogan, and Arne Mogren, “Power Perspectives 2030; On the road to a decarbonised power sector, Energy Roadmap 2050,” 2011.
[34] Alain Burtin and Vera Silva, “Technical and Economic analysis of the Euroepan electricity system with 60% RES,” EDF, 2015.
[35] E. Tröster, R. Kuwahata, and T. Ackermann, “European grid study 2030/2050,” BrusselsLangen Study Comm. Greenpeace Int., 2011.
[36] Fraunhofer IWES, “The European Power System in 2030: Flexibility Challenges and Integration Benefits. An Analysis with a Focus on the Pentalateral Energy Forum Region. Analysis on behalf of Agora Energiewende,” Fraunhofer institue for Wind Energy and Energy System Technology. 067/02-A-2015/EN, 2015.
[37] “PowerSYM- Generation and Ancillary Planning Tool,” Integ Consulting. [Online]. Available: http://www.integconsulting.com/powersym--generation-and-ancillary-planning-tool.html. [Accessed: 04-Jan-2018].

74
[38] National Technical University of Athens, “The PRIMES Energy System Model.”
[39] Miguel Lopez-Botet Zulueta and Vera Silva, “Energy systems planning and the interactions with the electricity system planning - an European model,” 2015.
[40] “Grid Optimization Software ENAplan,” Energynautics. [Online]. Available: http://energynautics.com/en/services/grid-optimization-software-enaplan/. [Accessed: 04-Jan-2018].
[41] NERC, “Methods to Model and Calculate Capacity Contributions of Variable Generation for Resource Adequacy Planning.”
[42] NREL, “Methods to Model and Calculate Capacity Contributions of Variable Generation for Resource Adequacy Planning,” Jan. 2011.
[43] B. Willems, “Methods to Model and Calculate Capacity Contributions of Variable Generation for Resource Adequacy Planning,” 2004.
[44] M. Eremia and M. Shahidehpour, Handbook of Electrical Power System Dynamics: Modeling, Stability, and Control. John Wiley & Sons, 2013.
[45] M. de Nooij, C. Koopmans, and C. Bijvoet, “The value of supply security,” Energy Econ., vol. 29, no. 2, pp. 277–295, Mar. 2007.
[46] R. Billinton, “Distribution system reliability performance and evaluation,” Int. J. Electr. Power Energy Syst., vol. 10, no. 3, pp. 190–200, Jul. 1988.
[47] A. van der Welle and B. van der Zwaan, “An overview of selected studies on the value of lost load (VOLL),” Energy Res. Cent. Neth. ECN, 2007.
[48] V. S. Ajodhia, Regulating beyond price: integrated price-quality regulation for electricity distribution networks. 2006.
[49] E. Leahy and R. S. J. Tol, “An estimate of the value of lost load for Ireland,” Energy Policy, vol. 39, no. 3, pp. 1514–1520, Mar. 2011.
[50] T. Zachariadis and A. Poullikkas, “The costs of power outages: A case study from Cyprus,” Energy Policy, vol. 51, pp. 630–641, Dec. 2012.
[51] C. Growitsch, R. Malischek, S. Nick, and H. Wetzel, “The Costs of Power Interruptions in Germany - an Assessment in the Light of the Energiewende,” Institute of Energy Economics at the University of Cologne (EWI), Apr-2013.

75
[52] OPTRES, “Best practice support schemes for RES-E in a dynamic European electricity market,” 2006.
[53] RE-Shaping, “Indicators assessing the performance of renewable energy support policies in 27 Member States,” Oct. 2011.
[54] RE-Shaping, “Shaping an effective and efficient European renewable energy market,” 2012.
[55] RE-Shaping, “Renewable energy policy country profiles,” 2011.
[56] I. Boie, A. Held, M. Ragwitz, and F. Genoese, “DIA-CORE POLICY BRIEF,” 2014.
[57] European Commission, “Energy Economic Developments - Investment perspectives in electricity markets,” 2015. [Online]. Available: https://ec.europa.eu/info/publications/economy-finance/energy-economic-developments-investment-perspectives-electricity-markets_en. [Accessed: 24-Jan-2018].
[58] Richard Loulou Uwe Remne, Uwe Remme, Amit Kanudia, Antti Lehtila, and Gary Goldstein, “Documentation for the TIMES model.” IEA-Energy Technology Systems Analysis Programme, Apr-2005.
[59] Rajesh Pattupara, Sophie Maire, Kannan Ramachandran, Marc Vielle, and Frank Vöhringer, “Electricity markets and trade in Switzerland and its neighbouring countries (ELECTRA): Building a coupled techno-economic modeling framework,” Bundesamt für Energie BFE, Aug. 2015.
[60] European Commission, “Energy Roadmap 2050.” 2011.
[61] Abhishek Shivakumar et al., “Business models for flexible production and storage,” INSIGHT_E Policy Report, 2016.
[62] International Energy Agency, “World Energy Outlook 2010,” 2010.
[63] W. W. Hogan, “Nodes and Zones in Electricity Markets: Seeking Simplified Congestion Pricing,” in Designing Competitive Electricity Markets, Springer, Boston, MA, 1998, pp. 33–62.
[64] M. Bliem, “Economic Valuation of Electrical Service Reliability in Austria - A Choice Experiment Approach,” IHSK Work. Pap., 2009.
[65] S. Piaszeck, L. Wenzel, and A. Wolf, “Regional diversity in the costs of electricity outages: Results for German counties,” Hamburg Institute of International Economics (HWWI), HWWI Research Paper 142, 2013.

76
[66] G. S. Becker, “A Theory of the Allocation of Time,” Econ. J., vol. 75, no. 299, pp. 493–517, Sep. 1965.
[67] P. Linares and L. Rey, “The costs of electricity interruptions in Spain. Are we sending the right signals?,” Energy Policy, vol. 61, pp. 751–760, Oct. 2013.
[68] A. Shivakumar et al., “Valuing blackouts and lost leisure: Estimating electricity interruption costs for households across the European Union,” Energy Res. Soc. Sci., vol. 34, no. Supplement C, pp. 39–48, Dec. 2017.
[69] P. Capros et al., EU Energy, Transport and GHG Emissions Trends to 2050 - Reference Scenario 2013. Publications Office of the European Union: European Commission, 2013.
[70] EWEA, “WindBarriers: Administrative and grid access barriers to wind power.” 2010.
[71] PV Legal, “Reduction of administrative barriers for photovoltaic systems in Germany,” 2011. [Online]. Available: http://www.pvlegal.eu/results/advisory-papers/germany.html. [Accessed: 24-Jan-2018].
[72] B. für W. und Energie, “Erneuerbare Energien in Zahlen.” [Online]. Available: https://www.bmwi.de/Redaktion/DE/Publikationen/Energie/erneuerbare-energien-in-zahlen-2015-09.html. [Accessed: 02-May-2018].
[73] Cathal O’Donoghue, Ricky Conneely, Deirdre Frost, Kevin Heanue, Brian Leonard, and David Meredith, “Rural Economic Development in Ireland,” 2014.
[74] Grattan Healy, “Issues In Accessing Enormous Renewable Resource In Ireland Prepared for IRENEC 2013.” 2013.
[75] Keep-On-Track Project, “Keep-on-Track! Projec:t Analysis of Deviations and Barriers 2013/2014,” 2014.
[76] European Environment Agency, “Energy support measures and their impact on innovation in the renewable energy sector in Europe,” 2014.
[77] PV Legal, “Reduction of bureaucratic barriers for successfil PV deployment in Europe.” 2012.

77
[78] PV Legal, “Reduction of administrative barriers for photovoltaic systems in Spain,” 2011.
[79] G. Frisari and J. Feás, “The Role of Public Finance in CSP,” Clim. Policy Initiat., 2014.
[80] Keep-On-Track Project, “Policy Paper on Retroactive Changes to RES Legislations and National Moratoria,” 2013.
[81] Lazard, “Lazard’s Levelized Cost of Energy Analysis - Version 8.0.” 2014.
[82] D. Heide, M. Greiner, L. von Bremen, and C. Hoffmann, “Reduced storage and balancing needs in a fully renewable European power system with excess wind and solar power generation,” Renew. Energy, vol. 36, no. 9, pp. 2515–2523, Sep. 2011.
[83] “Bulgaria’s energy sector reform to start with the regulator,” EurActiv.com, 01-Apr-2015. [Online]. Available: https://www.euractiv.com/section/energy/news/bulgaria-s-energy-sector-reform-to-start-with-the-regulator/. [Accessed: 16-Mar-2016].
[84] “Protesting about power prices,” The Economist, 15-Feb-2013. [Online]. Available: http://www.economist.com/blogs/easternapproaches/2013/02/bulgarias-electricity-prices. [Accessed: 16-Mar-2016].
[85] IEA, “Global EV Outlook 2017,” 2017.