Embed Size (px)
Citation preview
Calhoun: The NPS Institutional Archive
Theses and Dissertations Thesis Collection
2012-12
An Analysis of Aviation Maintenance Operations and
Supporting Costs, and Cost Capturing Systems
Palomino, Alejandro
Monterey, California. Naval Postgraduate School
http://hdl.handle.net/10945/27885

NAVAL POSTGRADUATE
SCHOOL
MONTEREY, CALIFORNIA
MBA PROFESSIONAL REPORT
An Analysis of Aviation Maintenance Operations and
Supporting Costs, and Cost Capturing Systems
By: Alejandro Palomino Jesse C. Epp
December 2012
Advisors: Kenneth Doerr Keebom Kang
Approved for public release; distribution is unlimited

THIS PAGE INTENTIONALLY LEFT BLANK
i
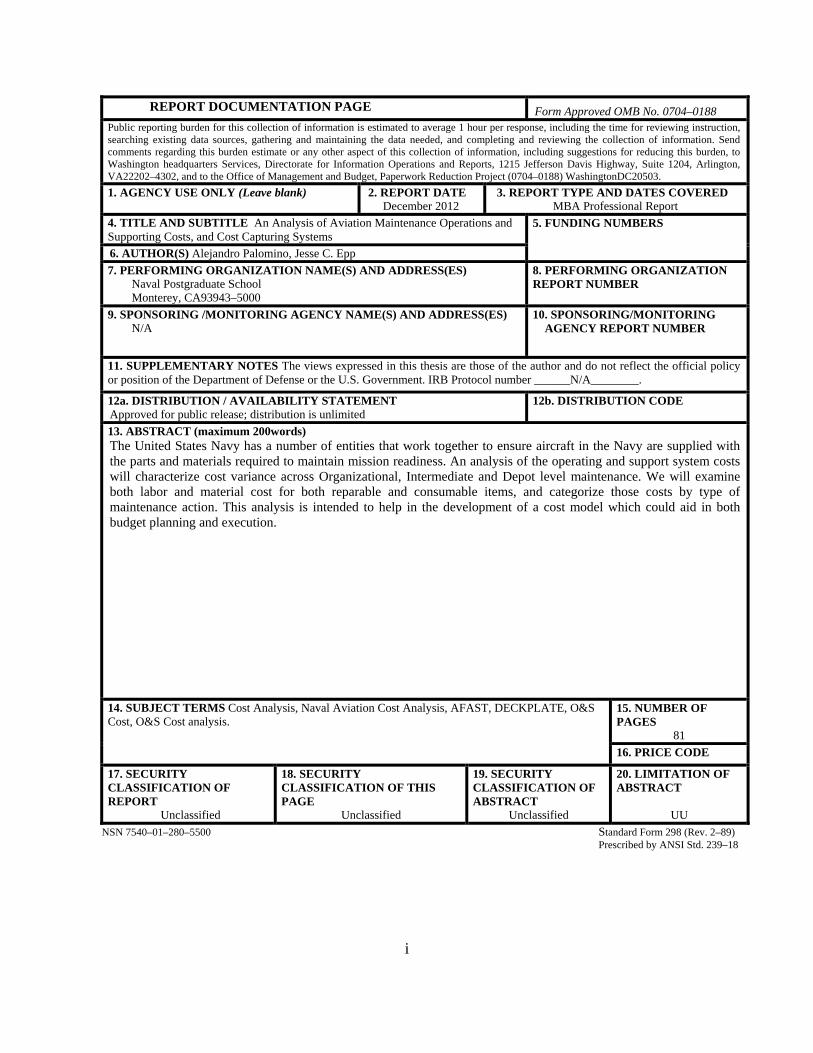
REPORT DOCUMENTATION PAGE Form Approved OMB No. 0704–0188Public reporting burden for this collection of information is estimated to average 1 hour per response, including the time for reviewing instruction, searching existing data sources, gathering and maintaining the data needed, and completing and reviewing the collection of information. Send comments regarding this burden estimate or any other aspect of this collection of information, including suggestions for reducing this burden, to Washington headquarters Services, Directorate for Information Operations and Reports, 1215 Jefferson Davis Highway, Suite 1204, Arlington, VA22202–4302, and to the Office of Management and Budget, Paperwork Reduction Project (0704–0188) WashingtonDC20503.
1. AGENCY USE ONLY (Leave blank)
2. REPORT DATE December 2012
3. REPORT TYPE AND DATES COVERED MBA Professional Report
4. TITLE AND SUBTITLE An Analysis of Aviation Maintenance Operations and Supporting Costs, and Cost Capturing Systems
5. FUNDING NUMBERS
6. AUTHOR(S) Alejandro Palomino, Jesse C. Epp
7. PERFORMING ORGANIZATION NAME(S) AND ADDRESS(ES) Naval Postgraduate School Monterey, CA93943–5000
8. PERFORMING ORGANIZATION REPORT NUMBER
9. SPONSORING /MONITORING AGENCY NAME(S) AND ADDRESS(ES) N/A
10. SPONSORING/MONITORING AGENCY REPORT NUMBER
11. SUPPLEMENTARY NOTES The views expressed in this thesis are those of the author and do not reflect the official policy or position of the Department of Defense or the U.S. Government. IRB Protocol number ______N/A________.
12a. DISTRIBUTION / AVAILABILITY STATEMENT Approved for public release; distribution is unlimited
12b. DISTRIBUTION CODE
13. ABSTRACT (maximum 200words) The United States Navy has a number of entities that work together to ensure aircraft in the Navy are supplied with the parts and materials required to maintain mission readiness. An analysis of the operating and support system costs will characterize cost variance across Organizational, Intermediate and Depot level maintenance. We will examine both labor and material cost for both reparable and consumable items, and categorize those costs by type of maintenance action. This analysis is intended to help in the development of a cost model which could aid in both budget planning and execution.
14. SUBJECT TERMS Cost Analysis, Naval Aviation Cost Analysis, AFAST, DECKPLATE, O&S Cost, O&S Cost analysis.
15. NUMBER OF PAGES
81
16. PRICE CODE
17. SECURITY CLASSIFICATION OF REPORT
Unclassified
18. SECURITY CLASSIFICATION OF THIS PAGE
Unclassified
19. SECURITY CLASSIFICATION OF ABSTRACT
Unclassified
20. LIMITATION OF ABSTRACT
UU
NSN 7540–01–280–5500 Standard Form 298 (Rev. 2–89) Prescribed by ANSI Std. 239–18

ii
THIS PAGE INTENTIONALLY LEFT BLANK
iii
Approved for public release; distribution is unlimited
AN ANALYSIS OF AVIATION MAINTENANCE OPERATIONS AND SUPPORTING COSTS, AND COST CAPTURING SYSTEMS
Alejandro Palomino
Lieutenant, United States Navy B.S., Norfolk State University, May 2004
Jesse C. Epp
Lieutenant, United States Navy B.S., Embry-Riddle Aeronautical University, January 2006
Submitted in partial fulfillment of the requirements for the degree of
MASTER OF BUSINESS ADMINISTRATION
from the
NAVAL POSTGRADUATE SCHOOL December 2012
Authors: _____________________________________
Alejandro Palomino _____________________________________
Jesse C. Epp Approved by: _____________________________________
Dr. Kenneth Doerr, Thesis Advisor _____________________________________ Dr. Keebom Kang, Thesis Co-Advisor _____________________________________ William R. Gates, Dean
Graduate School of Business and Public Policy

iv
THIS PAGE INTENTIONALLY LEFT BLANK
v
AN ANALYSIS OF AVIATION MAINTENANCE OPERATIONS AND SUPPORTING COSTS, AND COST CAPTURING SYSTEMS
ABSTRACT
The United States Navy has a number of entities that work together to ensure that aircraft
in the Navy are supplied with the parts and materials required to maintain mission
readiness. An analysis of the operating and support system costs characterizes cost
variance across Organizational-, Intermediate-, and Depot-level maintenance. In this
report, we examine both labor and material cost for both repairable and consumable
items, and categorize those costs by type of maintenance action. This analysis is intended
to help in the development of a cost model that could aid in both budget planning and
execution.

vi
THIS PAGE INTENTIONALLY LEFT BLANK
vii
TABLE OF CONTENTS
I. INTRODUCTION........................................................................................................1 A. MOTIVATION ................................................................................................1 B. RESEARCH QUESTIONS .............................................................................1 C. EXAMINING ORGANIZATIONAL-, INTERMEDIATE-, AND
DEPOT-LEVEL MAINTENANCE COSTS .................................................1 1. Organizational-Level Maintenance ....................................................1 2. Intermediate-Level Maintenance .......................................................2 3. Depot-Level Maintenance ...................................................................3
II. BACKGROUND AND LITERATURE REVIEW ...................................................5 A. BACKGROUND ..............................................................................................5
1. F/A-18 Hornet and Super Hornet .......................................................5 2. Generator Converter Unit ...................................................................5 3. Level of Repair Analysis ......................................................................7 4. Maintenance Data Systems .................................................................7
B. LITERATURE REVIEW ...............................................................................8 1. Current Cost/Expenditure System Used by the Navy ......................8 2. Making Accurate Cost Decisions ......................................................11 3. Identifying the Relevant Data ...........................................................12 4. Establishing Measures .......................................................................14
III. METHODOLOGY AND DATA SOURCES ..........................................................17 A. METHODOLOGY ........................................................................................17 B. DATA SOURCES ..........................................................................................19
1. The Navy Visibility and Management of Operating and Support Costs .....................................................................................20
2. Cost Analysis Improvement Group ..................................................21 3. Decision Knowledge Programming for Logistics Analysis and
Technical Evaluation .........................................................................24 4. Aviation Financial Analysis Tool ......................................................25
C. DESCRIPTION OF DATA FIELDS USED ................................................27 1. Job Control Number ..........................................................................27 2. Type Equipment Code .......................................................................29 3. Commercial and Government Entity ...............................................29 4. Action Taken ......................................................................................30 5. Beyond Capable Maintenance ..........................................................30 6. A National Item Identification Number ...........................................30 7. Malfunction Description Code ..........................................................31 8. Measures of Maintenance Hours ......................................................31
a. Elapsed Maintenance Time ....................................................31 b. Man-Hours ..............................................................................31
9. Serial Numbers ...................................................................................31
IV. RESULTS ...................................................................................................................33
viii
A. JOB CONTROL NUMBERS........................................................................33 B. TYPE EQUIPMENT CODE .........................................................................35 C. ACTION TAKEN CODES............................................................................36 D. MALFUNCTION CODES ............................................................................38 E. NATIONAL ITEM IDENTIFICATION NUMBER ..................................38 F. CORRELATIONS .........................................................................................42 G. VAMOSC ........................................................................................................48
V. CONCLUSIONS ........................................................................................................51 A. SUMMARY ....................................................................................................51 B. RESEARCH LIMITATIONS .......................................................................52 C. RECOMMENDATIONS ...............................................................................54 D. CONCLUSIONS ............................................................................................55
LIST OF REFERENCES ......................................................................................................57
BIBLIOGRAPHY ..................................................................................................................59
INITIAL DISTRIBUTION LIST .........................................................................................61
ix
LIST OF FIGURES
Figure 1. Generator Converter Unit’s Current Utilization ................................................6 Figure 2. DECKPLATE Data Flow ................................................................................25 Figure 3. Job Control Number Representation ................................................................28 Figure 4. Percentages of Top 10 Item Ordered ...............................................................43

x
THIS PAGE INTENTIONALLY LEFT BLANK

xi
LIST OF TABLES
Table 1. CAIG Costs ........................................................................................................9 Table 2. Alternative Air Force Expenditure Categorization Scheme ............................10 Table 3. ATMSR TMS Query CAIG Forma Fiscal Year 1997 to Present ...................21 Table 4. Pivot Table for Job Control Numbers ..............................................................34 Table 5. Type Equipment Code, Job Control Number, and Aircraft Count Used to
Determine Percentage of Failures ....................................................................36 Table 6. Action Taken Codes Used to Illustrate Beyond Capability of Maintenance,
Cannibalization, Repairs, and the Associated Maintenance Hours .................37 Table 7. Top 10 Consumable Parts Organized by Number Ordered .............................39 Table 8. Top 10 Repairable Parts Organized by Number Ordered ................................39 Table 9. Top 10 Consumable Parts Organized by Total Cost of Items Ordered ...........41 Table 10. Top 10 Repairable Parts Organized by Total Cost of Items Ordered ..............41 Table 11. Breakdown of Phi Correlation and How it was Used in Excel ........................46 Table 12. P-values Derived from Phi by Using 1-CHISQ.DIST .....................................47 Table 13. List of AWM Codes and their Meaning ..........................................................54

xii
THIS PAGE INTENTIONALLY LEFT BLANK

xiii
LIST OF ACRONYMS AND ABBREVIATIONS
AESA Active Electronically Scanned Array
ACES Aviation Cost Evaluation System
AFAST Aviation Financial Analysis Support Tool
AIMD Aircraft Intermediate Maintenance Department
APN Aircraft Procurement, Navy
ASKIT Aviation Store Keeper Information Tracking
AT Action Taken
ATMSR Aircraft Type Model Series Report
AVDLR Aviation Depot-Level Repairable
AWM Awaiting Maintenance
BCM Beyond Capability of Maintenance
BOR Budget Operating Target Report
CAGE Commercial and Government Entity
CAIG Cost Analysis Improvement Group
CAPE Cost Assessment and Program Evaluation
CEO Chief Executive Officer
CFO Chief Financial Officer
COMNAVAIRPAC Commander, Naval Air Forces Pacific
COMNAVAIRFOR Commander, Naval Air Forces
CPFH Cost Per Flight Hour
CRS Congressional Research Service
DECKPLATE Decision Knowledge Programming for Logistics Analysis and Technical Evaluation
DLR Depot Level Repairable
DoD Department of Defense
DoDI Department of Defense Instruction
DoN Department of the Navy
EMD Engineering and Manufacturing Development
EMT Elapsed Maintenance Time
ESC Executive Steering Committee
FHP Flying Hour Program
xiv
FRC Fleet Readiness Center
FY Fiscal Year
GAO Government Accountability Office
GCU Generator Converter Unit
I-Level Intermediate Level
IMA Intermediate Maintenance Activity
JCN Job Control Number
JSF Joint Strike Fighter
LCC Life-Cycle Cost
LORA Level of Repair Analysis
MAF Maintenance Action Form
MAL Malfunction Description Code
MDR Master Data Record
MDS Maintenance Data System
MilPers Military Personnel
MOS Military Occupation Specialty
MTBF Mean Time Between Failure
NACA NALCOMIS AIMD Cost Accounting
NAE Naval Aviation Enterprise
NALCOMIS Naval Aviation Logistics Command Management Information System
NALDA Naval Aviation Logistics Data Analysis
NAMP Naval Aviation Maintenance Program
NATO North Atlantic Treaty Organization
NAVAIR Naval Air Systems Command
NAVPERS Naval Personnel Command
NCTS Naval Computer and Telecommunications Station
NCCA Naval Center for Cost Analysis
NEC Navy-Enlisted Classification
NIIN National NATO Item Identification
NMCI Navy/Marine Corps Intranet
O&I Organizational and Intermediate
O&MN Operation and Maintenance, Navy
O&S Operating and Support
xv
O-Level Organizational Level
OPN Other Procurement, Navy
OPTEMPO Operating Tempo
OSD Office of the Secretary of Defense
SAF/FM Secretary of the Air Force, Financial Management
SUF Suffix
TEC Type Equipment Code
TD Technical Directive
TOC Total Ownership Cost
TMS Type Model Series
VAMOSC Visibility and Management of Operating and Support Cost
WP Waiting Parts
WUC Work Unit Code

xvi
THIS PAGE INTENTIONALLY LEFT BLANK

xvii
ACKNOWLEDGMENTS
Let us start by saying that our time at the Naval Postgraduate School (NPS) has
been a time of personal growth, overcoming doubt within ourselves, and gaining
confidence in an area of our personal and professional knowledge where it had been
lacking. NPS is truly one of the most rewarding and enhancing training tours the Navy
has to offer.
We extend a sincere thank you to Professor Doerr and Professor Kang. We are
grateful to have had the experience of working with experts in the field. As our advisors,
you have provided us with the support, direction, and encouragement that enabled us to
produce a product that we are proud of and that will hopefully benefit the Navy as well.
Thank you to CAPT Kelly, CAPT Munning, and the rest of the
COMNAVAIRFOR team for recognizing the best use and direction of our initial MBA
project proposal, and for allowing us the opportunity to take on a project that is truly
meaningful, not only to the NPS curriculum and the Navy, but to the aviation community
as well. The knowledge gained during this process has truly shaped how we will
approach logistics and management throughout our careers.
Thank you to Mr. Kevin Doyle for answering questions and for your tremendous
help with bridging gaps and merging data from multiple systems. You truly helped make
sense of the data.
Lastly, all of this would not have been possible without the unwavering love and
support of our families. Our wives, Cheryl and Amy, and children; Gabriela, Sofia,
Cameron, and Preston, have been a source of motivation and strength every second of
every day, encouraging us to achieve more in our lives than we thought capable. It is with
our utmost gratitude that we say thank you to them for all of this and so much more. The
words on this page can never do justice to the amount of love, respect, and appreciation
we have for you all. You are forever and always will be the pillars of our strength, life,
and world. From Alex; to God to whom I give Glory through my work and gives me
strength, thank you Lord for putting all who made this possible in each other’s paths.

xviii
THIS PAGE INTENTIONALLY LEFT BLANK

1
I. INTRODUCTION
A. MOTIVATION
As professional aviation maintenance officers we wanted to pursue a topic that
would benefit our entire community. Supporting aviation maintenance involves a balance
of funding, manpower, and logistics. Parts and materials directly affect all three.
Understanding how parts and materials influence our supply systems, troops, and drive
cost, is the key to identifying weaknesses and the first step to process improvements,
which, in turn, can reduce labor hours, lead times, and save money. By analyzing the data
of a component with a high failure rate, and in turn, a high utilization, we hope a large
amount of statistically significant data is available and can be used to answer the
following questions.
B. RESEARCH QUESTIONS
By analyzing the current data collecting systems utilized by the Department of
Defense (DoD), can naval aviation accurately predict proper inventories, safety stocks,
and costs associated with organizational-, intermediate--level maintenance?
Are the current data systems capturing the necessary data to make cost effective
maintenance decisions at the Organizational and Intermediate levels?
If not, what data fields should be added?
What can be done to improve data collection?
C. EXAMINING ORGANIZATIONAL-, INTERMEDIATE-, AND DEPOT-LEVEL MAINTENANCE COSTS
1. Organizational-Level Maintenance
Organizational-level (O-level) maintenance is performed by the maintenance
personnel assigned to the operational unit or squadron. A squadron is a mix of officer and
enlisted personnel, each assigned to a specific assignment or billet. A service member is
required to have the appropriate level of training and/or the Navy-enlisted classification
2
(NEC)/designator/military occupational specialty (MOS). The NECs and training
standards are required to ensure mission readiness and are governed by Naval Personnel
Command (NAVPERS). NAVPERS determines the required levels of training,
qualifications, and the number of personnel for assignment. This is calculated utilizing
the documented number of work hours performed and the mission of the squadron or unit
determines the manning levels and training requirements. The mission of O-level
maintenance at a squadron is to maintain all assigned aircraft and associated aeronautical
equipment in a full mission-capable status. Other duties associated with this process are:
improving the local maintenance process, standing watches, and performing other
required duties. All of these tasks feed the manning requirements for size and
determining costs (COMNAVAIRFORINST, 2012).
O-level maintenance can be grouped into three main categories: scheduled,
unscheduled, and technical directive compliance. Scheduled maintenance is the
primary form of maintenance performed at the O-level. Scheduled maintenance is
designed to prolong and improve the life and performance of the system being serviced.
Engineers with intimate knowledge of these systems determine the design and schedule
of this type of maintenance. Some tasks are established at the birth of the system, while
others are implemented as they are identified. Unscheduled maintenance occurs when
systems unexpectedly fail and require repair and or replacement of good components.
Technical directives (TDs) are implemented when trends occur and/or safe-for-flight
concerns are raised. Most TDs are inspection based, but some require the removal and
replacement of suspected faulty components. TDs are a preemptive approach to
preventing catastrophic failure (COMNAVAIRFORINST, 2012).
2. Intermediate-Level Maintenance
Intermediate-level (I-level) maintenance is the next level of support. I-level
maintenance personnel are assigned to a ship-based aircraft intermediate maintenance
department (AIMD) or a shore-based Fleet Readiness Center (FRC). I-level maintenance
is designed to provide a higher level of maintenance support, with improved capabilities
to repair and test components. AIMDs and FRCs are capable of providing support to
3
multiple type/model/series (TMS) of aircraft. Pooling these resources allows the Navy to
save money and improve the readiness of O-level maintenances. I-level commands are
responsible for receiving parts, assessing the condition of the components, and
determining the necessary action. Depending on priority and availability, parts are
repaired and returned to the squadron for installation and use on the aircraft or for
induction into the supply system. Parts that are beyond capable maintenance (BCM) are
shipped to the appropriate depot-level maintenance activity or to the manufacturer.
Among the Sailors and Marines that work in I-level facilities, civilian artisans are
contracted to provide expert support and technical expertise, not only to repair
components but also to train personnel. These artisans improve the capabilities of the I-
level command and contribute to the professional development of Service members. Just
as the O-level duties of the Service members vary, the work performed determines the
manning of the AIMD or FRC and contributes to the cost of supporting a system.
Artisans in AIMDs and FRCs also represent a cost of support (COMNAVAIRFORINST,
2012).
O- and I-level activity Service members share O- and I-level maintenance duties.
This provides rotational assignments for Service members to complete sea/shore
rotations, as well as to gain valuable O- and I-level maintenance experience
(COMNAVAIRFORINST, 2012).
3. Depot-Level Maintenance
Depot-level maintenance includes naval aviation industrial establishments and
commercial facilities. Depot repair consists of aircraft overhauls, rebuilding and repairing
of parts, assemblies, subassemblies, and any other system that falls outside of the
capabilities of the O- and I-level maintenance departments. Depot-level maintenance
represents another level of costs associated with the operations and support of systems.
These costs usually fall under aviation depot-level repairable (COMNAVAIRFORINST,
2012).

4
THIS PAGE INTENTIONALLY LEFT BLANK
5
II. BACKGROUND AND LITERATURE REVIEW
A. BACKGROUND
1. F/A-18 Hornet and Super Hornet
Developed in the 1970s as a multi-role, all-weather, supersonic, twin-engine,
carrier-based aircraft, the F/A-18 (Fighter/Attack) Hornet is a product of the combined
efforts from McDonnell Douglas and Northrop Grumman. Its multi-role capability made
it a versatile weapons system and set the stage for the F/A-18 Super Hornet. Flying its
first flight in 1995, the F/A-18 Super Hornet was designed to replace the F-14 Tomcat.
The F/A-18 family consisted of A, B, C, D, E, F, and G series, all of which were
variations of the same aircraft, with the major differences being single or double-seated
cockpits and variations in fuel capacity. Each new series of aircraft incorporated
upgraded radar systems, avionics, and weapon-carrying capability. These variations
helped tailor each series to a specific set of mission capabilities. The F/A-18 family of
aircraft eventually replaced the F-14 Tomcat, A-6 Intruder, S-3 Viking, and EA-6B
Prowler. With a single platform performing multiple roles, the F/A-18 provided an
opportunity to drastically improve logistics support. For example, imagine seven TMS of
aircraft on an aircraft carrier with each aircraft consisting of two types of tiers. To support
these aircraft, the aircraft carrier must maintain an adequate number of tiers to ensure the
full mission capability of its fleet of aircraft. Now, imagine if there were only three TMS
of aircraft. The required number and variety of parts and materials required to sustain
carrier-based flight operations is drastically reduced (United States Navy, 2009).
2. Generator Converter Unit
The F/A-18 Super Hornet’s generator converter unit (GCU) has experienced
increased demand; changing system utilization is a common theme for many system
components operated by the fighting forces in the DoD. Estimating the ever-changing
utilization rates associated with a component and determining the strain and wear
imposed is a challenge the DoD faces. This information is critical when determining the
mean time between failures (MTBF) and, in turn, the reliability of the weapon system.

6
The GCU is similar to the alternator in a vehicle. It takes mechanical energy produced by
jet engines of the F/A-18 and converts that into electrical energy for the appropriate
systems of the aircraft to operate. Without a properly operating GCU, the F/A-18 cannot
complete its mission. Currently, the GCU is the number one AVDLR and readiness
degrader for the F/A-18 community. As subsystems of larger weapon systems upgraded
changed and integrated, the effects of these changes are felt on other components that
operate together to make the entire system function. The GCU is a great example of this,
higher electrical loads and higher demands on the aircraft’s electrical systems is a result
of components being removed and replaced by new ones to support the avionics that the
aircraft utilizes, failures of the GCU can be attributed to the change in its utilization.
Figure 1 illustrates a time stamp when the new radar system, Active Electronically
Scanned Array (AESA) was installed and its demand placed on the GCU in 2005
compared to the current utilization. The utilization change is illustrated by the volts and
currents that the systems handles, the white strip represents the old radar system the gray
strip represents the new demands after the new AESA was installed.
Figure 1. Generator Converter Unit’s Current Utilization
(From Commander, 2010)
7
Strains applied to the current system have caused the MTBF of the GCU to
decrease. The new demand placed on the GCU is much higher than the original demand.
Failure to correctly estimate the reliability and life of a system is extremely costly and in
some cases dangerous to the operators of the system (NAVAIR, 2010).
3. Level of Repair Analysis
Level of repair analysis (LORA) is an analytical method to be used in determining
the appropriate level of maintenance. LORA follows a series of steps that takes inputs,
such as reliability of the system, maintainability, physical dimensions, weight, and so
forth. Those inputs are then used to determine the optimal provisions of repair and
maintenance facilities in order to reduce life-cycle cost and increase operational
readiness. LORA helps solve problems as simple as how to avoid paying hundreds of
dollars on transportation charges for a single $20 part or how to organize and staff an I-
level facility. LORA is also responsible for determining the appropriate level to repair
and or dispose high cost repairable items by creating cost-benefit analyses at each level,
starting at the O-level and working its way up (OPNAVINST 3000.12A).
4. Maintenance Data Systems
The maintenance data systems (MDSs) were created to enhance naval aviation by
tracking different maintenance actions and their effects on diverse elements of naval
aviation. The NAMP (2012) describes MDS as a system that “furnishes data products that
provide management tools for the efficient and economical management of maintenance
organizations” (p 14.1.1). Maintenance organizations, such as I-level and O-level, are
responsible for the proper incorporation of data that is uploaded into the Naval Aviation
Enterprise (NAE) on databases such as Aviation Financial Analysis Support Tool
(AFAST) and Decision Knowledge Programming for Logistics Analysis and Technical
Evaluation (DECKPLATE) via MDS. The final data should be able to be utilized as a
management information system data source tool for all levels of management in
questions related to:
8
equipment reliability and maintainability,
material usage, and
maintenance material cost expenditure.
MDS is the beginning of a series of building blocks that presents the big picture
of maintenance, how much it really costs, and where the manager can find areas of
interest in order to implement change or make an educated decision in order to better the
system (COMNAVAIRFORINST, 2012). Currently, AFAST is widely utilized by the
fleet as the preferred method to track and monitor spending throughout different
operational commands.
B. LITERATURE REVIEW
Every year, the Department of the Navy (DoN) has to make decisions about the
annual budget. These decisions are heavily based on readiness and modernization, two of
the four pillars of military capabilities. According to the Congressional Research Service
(CRS), readiness is “the ability of each unit to deliver the outputs for which it was
designed,” while modernization is “technical sophistication of all the elements of the
force” (Tyszkiewicz and & Daggett, 1998, p. 265).
To put it in simple terms, the DoD budget takes into account the factors of
sustaining current capabilities and supporting the incorporation of new capabilities. The
link between those two pillars, our research, and the way DoD budgets in the present
economic situation is operating and support (O&S). The goal of this project is to identify
the cost of O&S throughout the maintenance cycle; and focusing on a component, such as
the GCU, will help capture the data. We believe that by identifying more, if not all, the
costs associated with O&S, better maintenance decisions can be made, and the DoD can
improve the way it budgets in order to better sustain readiness throughout the fleet and
also plan for future.
1. Current Cost/Expenditure System Used by the Navy
Unger (2009) depicted the relationship between multiple systems’ expenditure
patterns, flying hours, and fleet sizes. Unger’s work recognized the complexity of the

9
system and acknowledged that there are different costs; some are affected by flying
hours, some by fleet sizes, and others by a complicated mix of the two or sometimes one
and not the other. Additionally, Unger (2009) explained that the mixed cases appeared to
be a manifestation of fixed-plus-variable cost structure, which is not constantly
compatible with the traditional Air Force CPFH program. Unger (2009) addressed the
current categories by which costs are separated and presented to higher echelons for
review during budgetary processes. Table 1 shows the expenditure categories elements as
described by the Office of the Secretary of Defense (OSD) Cost Analysis Improvement
Group (CAIG).
Table 1. CAIG Costs
(From Unger, 2009, p. 2)
10
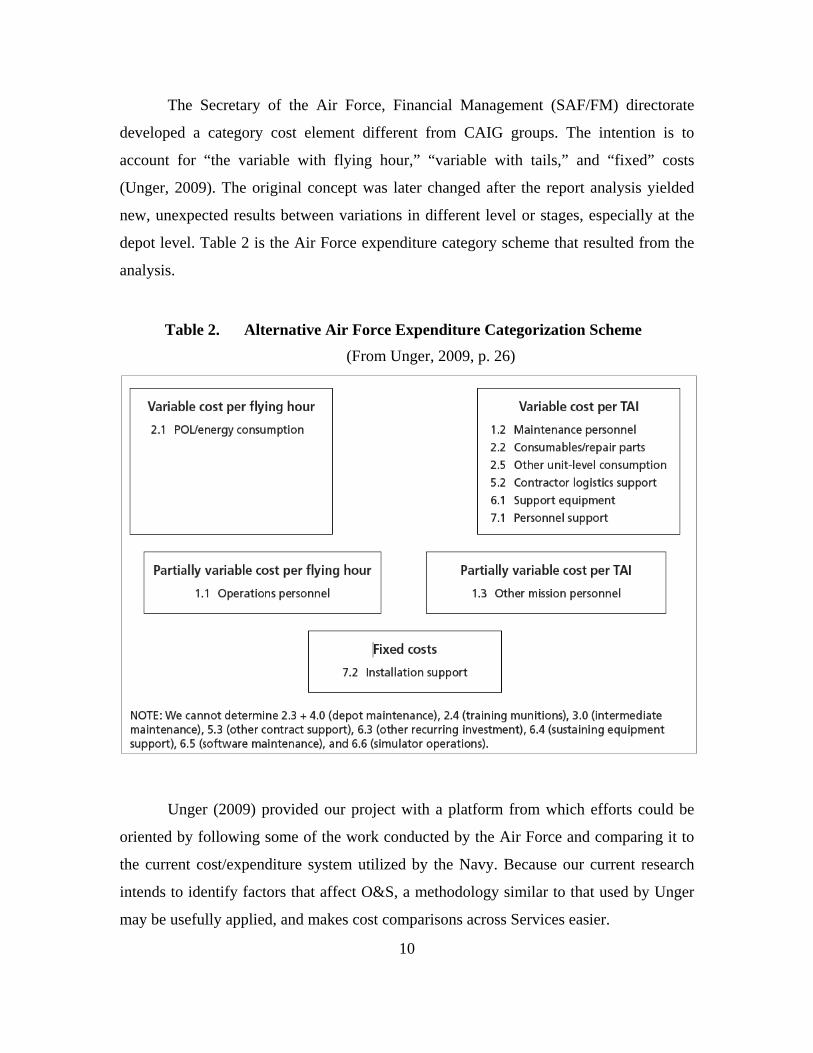
The Secretary of the Air Force, Financial Management (SAF/FM) directorate
developed a category cost element different from CAIG groups. The intention is to
account for “the variable with flying hour,” “variable with tails,” and “fixed” costs
(Unger, 2009). The original concept was later changed after the report analysis yielded
new, unexpected results between variations in different level or stages, especially at the
depot level. Table 2 is the Air Force expenditure category scheme that resulted from the
analysis.
Table 2. Alternative Air Force Expenditure Categorization Scheme
(From Unger, 2009, p. 26)
Unger (2009) provided our project with a platform from which efforts could be
oriented by following some of the work conducted by the Air Force and comparing it to
the current cost/expenditure system utilized by the Navy. Because our current research
intends to identify factors that affect O&S, a methodology similar to that used by Unger
may be usefully applied, and makes cost comparisons across Services easier.
11
2. Making Accurate Cost Decisions
According to a Government Accountability Office (GAO) report dated July 20,
2010, the DoD cannot effectively manage and reduce O&S costs for most of the weapon
systems that the GAO reviewed. The GAO office analyzed and compared life-cycle O&S
cost estimates and historical data on actual O&S costs. The GAO found that five of the
seven aviation systems reviewed did not have the life-cycle O&S cost estimates
developed at production milestones, and the data used to calculate costs was incomplete.
Incomplete and insufficient data forced the DoD to make inaccurate calculations when
determining O&S costs. Providing accurate data, and the ability to analyze the rate of
O&S cost growth, identifying cost drivers, and developing plans for managing and
controlling costs are essential for the successful calculation of O&S costs. Updating
methods, identifying life-cycle O&S costs, and identifying cost drivers will aid in the
accuracy of estimates. These measures need to be re-evaluated periodically throughout
the life of the system (GAO, 2010). By using the GCU’s historical data, we hope to
highlight the factors affecting the GCU, as well as use the lessons we learn from the
GCU’s data to build a model that will aid in the accuracy of future calculations for other
systems and their components.
Our research and findings are not intended to design a new activity-based cost
system. However, there are lessons and approaches activity-based costing uses that help
provide a good product and information that leads to the formulation of a good,
competitive strategy. In “Measure Costs Right: Make the Right Decisions,” Cooper and
Kaplan (1988b) explained that costs are categorized and separated so that they can be
traced back to their origins and show the true cost of the individual component to the
company. This is extremely important when calculating the O&S costs of a weapon
system. Understanding and identifying the fully burdened costs associated with the
weapon system is the only way to identify the support ability of the system and its value-
adding capabilities to the organization. Cooper and Kaplan (1988b) covered the important
aspect of the cause of distorted data. They explained that current cost systems typically
overstate costs of high-volume items and understate costs of low-volume items, thus
providing misleading information and leading to inaccurate decisions (Cooper & Kaplan,
12
1988b). A central goal of our thesis is to demonstrate an approach to gathering and
categorizing costs to facilitate decision making. We will also raise questions about the
accuracy, or at least the completeness of that data.
3. Identifying the Relevant Data
As a result of the Secretary of Defense’s policy on usage of specifications and
standards, MIL-PRF-49506, LMI, has been developed to replace MILSTD-1388–2B. It is
not a revision of MIL-STD-1388–2B. Rather, it represents a fundamental change in the
way data requirements are levied on contracts. MIL-PRF-49506 does not contain any
“how to” requirements. The new specification is designed to minimize oversight and
government-unique requirements (p. 7–2).1 While this manual has been canceled the
DoD’s MIL-STD-1388–1A (The DoD’s Military Standard (MIL-STD; 1983), a military
standard logistic support analysis, is a publication that covers many aspects of logistics
support. Task Section 400, Determination of Logistics Support Resource Requirements,
provides detailed guidance regarding the process of assessing the O&S costs that must be
considered before a system can be adopted and when a new system’s production line is
about to be closed. Upon examination of the Super Hornets, the DoD utilizes the GCU to
determine its effective service life and the Navy’s measures and processes for changing
and adapting a weapon system to best combat constantly changing global threats. The
MIL-STD (1983) Section 403 provides guidance for weapon systems reaching the end of
their life cycle. It identifies key areas to assess regarding the system/equipment, such as:
expected useful life,
support requirements,
problems associated with inadequate supply after termination of product line, and
ability to predict and solve support inadequacies.
The overall purpose of this instruction is to ensure that all aspects of a weapon
system are considered before it is implemented, extended, or changed, and the
1 This is copied from the Department of defense handbook acquisition Logistics MIL-PRF-49506. (p
7-2).

13
appropriate data is collected during the life of the system so that the appropriate decisions
can be made. We considered many of the same metrics outlined in Section 400 (MIL-
STD, 1983), such as identifying:
logistics support resource requirements for each task,
new or critical logistics support resource requirements,
participants in the support process and their required resources,
effects of new strains on weapon systems,
estimations of the life of aging components, and
reductions in O&S costs.
Utilizing the data provided, we hope to classify areas that can be identified as key
causal factors, or metrics that can be better used to identify and explain O&S costs
associated with the system. The MIL-STD (1983) provided us with a good starting point
and guidance regarding the current system used.
Accurate forecasting of the demand for spare parts is vitally important for
maintenance but the sporadic nature of demand makes accurate forecasting difficult (Hua,
Zhang, Yang, & Tan, 2007). Hua et al.’s (2007) study centers on how excess inventory of
spare parts increases costs and how important it is to manage these costs that come from
holding inventory and from inadequate inventory controls. They described the case of a
Chinese company that held spare inventory of approximately $12 million out of
$21 million total inventory with a turnover of 0.58 times per year. While we do not
attempt to develop a forecasting model for spare parts, the Hua et al. (2007) study shows
how spare parts affect O&S estimations and demonstrates that effective sparing levels
are necessary the for cost effective management of maintenance processes. To have
effective sparing levels, the Navy must capture accurate and relevant maintenance data at
the Organizational and Intermediate level.
14
4. Establishing Measures
The United States Marine Corps is growing concerned about expenditures
generated from the organizational and intermediate (O&I) levels; moreover, Romero and
Elliott believe efforts to reduce budgetary impact on O&S must be taken before it is to
late (Romero and Elliott, 2009). Romero and Elliott began their thesis, Developing a
United States Marine Corps Organizational and Intermediate Level Maintenance
Performance Cost Model, by noting a multitude of O&S cost drivers, such as inventory,
OPTEMPO, and equipment age, procurement costs that are not within the scope of
decision-makers. Furthermore, Romero and Elliott (2009) suggested that by developing a
method to understand and analyze the relationship between cost variations and the
continued increases in spending, DoD could support sustainment budgetary requirements
in the annual funding process. In this manner, budgetary planners could have a more
reliable way to forecast future budgets, especially during times of monetary uncertainty.
Romero and Elliott (2009) presented an example about how overestimating inventory has
created extra spending with the Marine Corps. With the end of operations in Iraq and a
drawdown over the horizon at Afghanistan, a question must be asked: What is going to
happen to the inventory built to sustain the wars? The DoD has created inventories to
sustain operations, so the question is this: When is the right time to take the foot off the
gas, particularly when war itself is so unpredictable and may not present an exact final
day? Questions like these are extremely important to our project because the costs
associated with the sustainment of operations can be vastly complex and variable Romero
and Elliott (2009) covered the importance of identifying the very aspects that can be
affected by the lowest level of maintenance.
According to Dixon (2006) in The Maintenance Costs of Aging Aircraft: Insights
From Commercial Aviation, a close study of how commercial aircrafts age could help
military decision-makers understand how “aging effects” affect cost estimation over time.
In the cost study, Dixon (2006) covered three separate linear regressions by computing
age effects on aircraft age zero to six years old; the second, aircraft age six to 12; and
lastly, aircraft age 12 and older. Dixon (2006) displayed the results of the RAND study as
follows: group one shows a maintenance increase cost rate of 17.6% per year; group two
15
displays an annually increase rate of 3.5% per year; and group three yields a surprising
0.7% increase per year. Dixon (2006) also explained that organizations must assume a
rapid constant increase in cost with age; however, other studies show that such
assumptions are incorrect. Furthermore, the reason the younger aircraft result is higher
than the rest is due to a cost-shift from manufacturer-provided maintenance to owner-
provided maintenance after the warranties have expired (Dixon, 2006). Dixon’s point is
that leadership in the military must spot such changes while projecting future budgets not
as a linearly increasing cost but as a midway point at which costs needs to be reevaluated.
Utilizing flight hours to calculate the life of an airframe and its components is the
most widely used and accepted method of measurement. A linear relationship is assumed
to exist, along with the assumption that all parts on the aircraft have constant failure rates.
These assumptions do not factor into the age of the weapon system or components, or
into the change in mission or utilization of the weapon system and its components. In our
analysis of the GCU’s data, we hoped to identify trends in the failure rates and make
correlations to the age and/or utilization of systems the GCUs support. In A Method of
Forecasting Repair and Replacement Needs for Naval Aircraft: Phase II, DeLozier and
Wilkinson (1986) defined the variables that could be used in a method for forecasting
repair and replacement needs for naval aircraft phase II. These variables include the
replacement rate, fraction recycled, failure rate and repair rate.
Delozier and Wilkinson (1986) provided valuable insight to aid our interpretation
of the current maintenance data. Models such as this need accurate data to predict
replacement rates. Our analysis will examine the data used to determine failure rates, and
fraction replaced that impact replacement rates and costs.
Understanding how to identify which costs are fixed and which costs are variable
is important. This process is complicated further by the mix of funds that the DoD uses to
cover expenses. Cooper and Kaplan (1988) discus costing systems which can cloud the
waters and make it difficult to see what the true expenses are or how making changes to a
process or systems, which will affect the costs associated with the mix of funds that are
intended to, support the program or system. Understanding the impact of changes and the
importance of identifying costs, as well as understanding errors in the way data is

16
recorded and interpreted, makes it difficult to form a plan of attack. Data collection
systems which are easy to use and understand, not only by management but also by the
frontline user, greatly enhance the accuracy and volume of data collected. The DoD has
many systems collecting data to form an array of measures. We use multiple sources of
data to examine how costs which may seem “fixed” at a high level actually vary across
categories at the Organizational level.
.

17
III. METHODOLOGY AND DATA SOURCES
A. METHODOLOGY
Our results are derived from using Microsoft Excel to manipulate data collected
and stored in AFAST and DECKPLATE databases. Microsoft Excel and our data sources
are tools available to today’s naval officers. Using tools and data that are available to
aviation maintenance officers can benefit the community, identifying strengths and
weaknesses in the data, as well as describe and use methods to make better use of the data
collected.
The data used to calculate the following results is derived from a merging of
AFAST and DECKPLATE data, starting March 23, 2009, and ending September 30,
2010. This data range was selected because it represented the current consecutive FYs
that have been completed. By selecting the last two FYs, we hoped to identify any new
trends or tease out information that had not been discovered yet.
The merging of maintenance data from DECKPLATE, a system that NAVAIR
maintains in Patuxent River, and AFAST Requisition and Cost data, a system which is
maintain in San Diego at COMNAVAIRPAC. These separate inputs created the
combined product that was utilized. The DECKPLATE Work Order Info (all) data field
was matched with the requisition information in DECKPLATE then the AFAST cost data
was added to match the requisition information. The merging of DECKPLATE and
AFAST data was completed by Mr. Kevin Doyle, a data analyst at COMNAVAIRFOR
based on our request.
Organization of the data was accomplished by extensive use of Microsoft Excel
pivot tables. Pivot tables automatically sort, count, total or give the averages, of the data
field selected, for example by selecting the merged DECKPLATE and AFAST data one
can easily and quickly be manipulate the data. Pivot tables make sorting and organizing,
this large volume of information easier and more accurate, by removing a majority of the
manual data manipulation, thus removing the chance for human error in the data entry.
The Pivot table displays the results in a second table (called a “pivot table”) showing the

18
summarized data. Changes can be made to the summary’s structure by dragging and
dropping fields graphically. The “rotation” or pivoting of the summary table gives the
concept its name.
Line items totaling 5579, each with 80 data fields of information, represented a
snap-shot of the GCU’s maintenance history. Seventeen pivot tables were created and
utilized to filter, organize and analyze this data. Manual grouping the job control numbers
(JCN) was completed in order to build our correlation tables. The 5579 individual JCNs
could be tied to 186 mother JCNs.
Pivot tables provided the core descriptive statistics that are the central part of our
analyses. In addition correlation tools were also used to demonstrate the sorts of post-hoc,
or ‘what if’ analysis that could be performed by naval aviation professionals if the sorts
of tables we built in this thesis were made available to them. We utilized Excel to create a
Phi Correlation to see how often items are order together (Cramer, 1946). Phi
Correlations are appropriate for measuring the strength of association between binary (or
dichotomous) variables. The Phi Correlation coefficient is defined as.
where a is the number of observations in which both variables are coded ‘1’, b is the
number of observations in which the first variable is coded ‘1’ but the second is coded
‘0’, c is the number of observations in which the first variable is coded 0 but the second is
coded ‘1’, and d is the number of observations in which both variables are coded ‘0’.
The data used in these correlations is converted from quantities ordered to item
ordered or not, a binary repression of the data. The correlation is intended to show if there
was an interaction between parts, for example if there was a part used to repair the GCU,
were there any other parts used in conjunction with that part as well. For this reason we
changed the data to binary where 1 (one) represents a part that is used to repair the GCU
and 0 (zero) represents the absence of a part being utilized. Microsoft Excel’s CORREL
tool provides an output table with values illustrating the strength of their correlation, +1
representing items that are perfectly positively correlated -1 representing items that are

19
negatively correlated. Phi Correlation tools are not available in Microsoft Excel so we
coded them manually using Excel. Phi correlation results were formatted to find the result
in the same visual representation as the Microsoft Excel’s CORREL tool output table,
making it easier to read and compare to our results.
In this project, we take a close look at the costs of aviation, the costs of aviation
maintenance, and the systems that capture that data. Utilizing the same data sources used
by the Navy to track and store maintenance information, we track parts through the
maintenance and supply system capturing O-, I- and depot-level maintenance actions,
failure rates, and costs. Data sources used by the Navy already capture a large portion of
the maintenance transaction; by using this data, we identify the strengths and weaknesses
of the current data system, as well as paint a picture of costs associated with naval
aviation maintenance for a single item. Exploring accessible online databases tools such
as AFAST, DECKPLATE, and VAMOSC that track historical cost data throughout the
fiscal year, we use these tools to identify costs and changes that contribute to significant
costs variations for that item.
The item we selected was the GCU. By examining the GCU, we focus our data
collection and analysis. With the GCU’s current high utilization rate and its impact on the
F/A-18 weapon system, data analysis on the GCU is important for the fleet. Also,
because there is a great deal of data related to the GCU in our source datasets, we ensure
that we can extract enough data to demonstrate the usefulness of our methodology.
B. DATA SOURCES
Aviation maintenance involves a lot of data collection in order ensure
maintenance actions are properly performed and documented. This process is intended to
provide vital information that is critical to the safety of the aircrew and personnel
performing maintenance on the aircraft; ensuring accountability, the tracking of parts and
materials are also functions of this data collecting. By combining the data collected from
aircraft that are of the same TMS or that utilize the same parts and materials, the DoD can
quickly identify trends, anticipate demands, and ensure proper stocking levels. Using a
combination of data sources utilized by the DoD, we identify the cost of repairable

20
components on the Navy across O-, I-, and depot-level maintenance. Section 1 of this
chapter is a description and reason for the use of the following data systems.
1. The Navy Visibility and Management of Operating and Support Costs
The DoD utilizes information from all Services to make budgetary decisions. The
Services provide information from a database source called VAMOSC. VAMOSC is a
management information system that collects and reports U.S. Navy and Marine Corps
historical O&S costs. In 1975, the Deputy Secretary of Defense directed all Services to
collect actual weapon systems O&S costs. In 1992, management of the Naval VAMOSC
to provide executive oversight was assigned to the Naval Center for Cost Analysis
(NCCA) and to the OSD CAIG. Today, VAMOSC provides data of direct and indirect
O&S costs of weapon systems; it also provides non-cost information, such as flying-hour
metrics, age of aircraft, and so forth. VAMOSC also contains military personnel
databases composed of personnel costs and has recently added databases covering Navy
Department civilian personnel and Navy facilities physical characteristics and operating
costs (VAMOSC, 2012).
VAMOSC databases are intended as information files to be used in appropriations
and cost analyses. These data are used to develop the O&S portion of Life-Cycle Cost
(LCC) and estimates indirect costs for future weapon systems. They also contribute to the
Navy’s efforts to reduce the total ownership cost (TOC) of legacy and future weapon
systems. VAMOSC is being used to identify significant cost drivers that represent cost
reduction opportunities (VAMOSC, 2012).
The VAMOSC (2012) appropriation accounts applicable to the current project are
as follows:
Aircraft Procurement, Navy (APN)—Procurement of new aircraft, modifications to existing aircraft, and spare parts;
Other Procurement, Navy (OPN)—Procurement of ship and aviation support equipment, communication and electronic equipment, ordnance support equipment, civil engineer support equipment, supply and personnel/command support equipment, and spare and repair parts; and
21
Operation and Maintenance, Navy (O&MN)—Expenses necessary for support of the fleet, civilian employee pay, travel and transportation, training, consumable supplies, recruiting and advertising, base operations, and base communications and subsistence.
2. Cost Analysis Improvement Group
CAIG, now called the Cost Assessment and Program Evaluation (CAPE), was
created as an independent standard cost estimation parameter utilized by the DoD during
acquisitions and any cost tracking or estimation event. CAPE is also consistent with DoD
regulations and is under administrative control by an appointed DoD official.
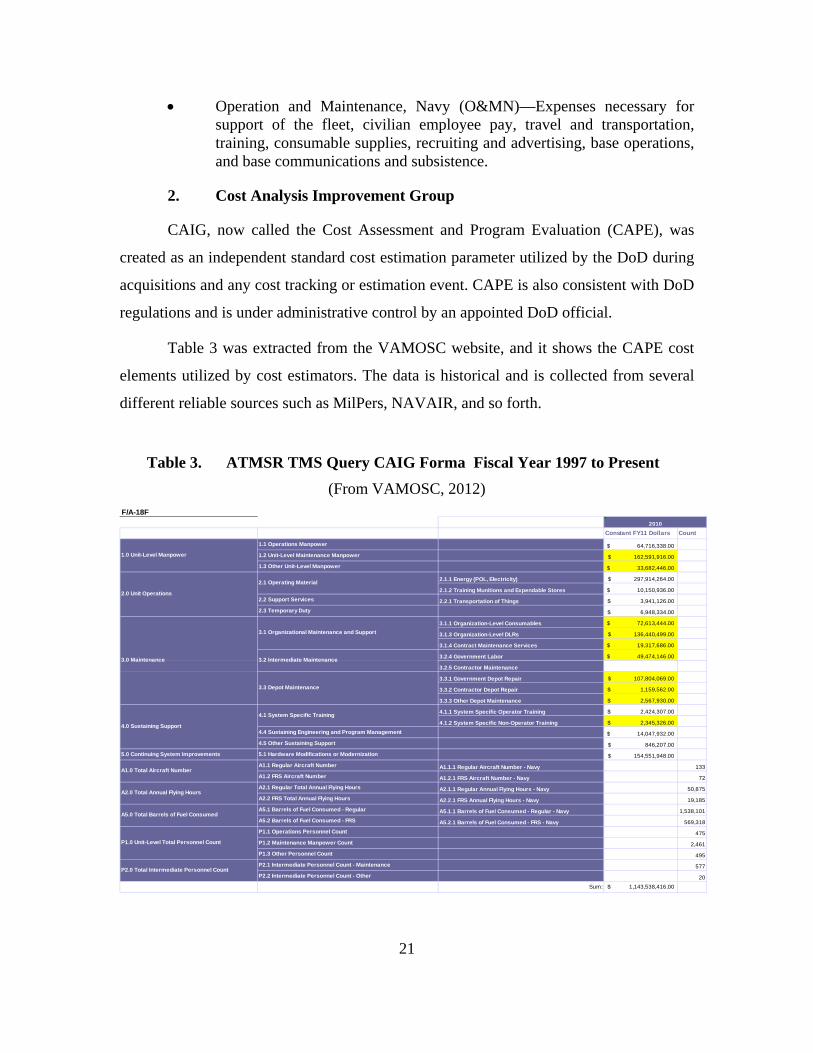
Table 3 was extracted from the VAMOSC website, and it shows the CAPE cost
elements utilized by cost estimators. The data is historical and is collected from several
different reliable sources such as MilPers, NAVAIR, and so forth.
Table 3. ATMSR TMS Query CAIG Forma Fiscal Year 1997 to Present
(From VAMOSC, 2012)
F/A-18F
Constant FY11 Dollars Count
1.1 Operations Manpower 64,716,338.00$
1.2 Unit-Level Maintenance Manpower 162,591,916.00$
1.3 Other Unit-Level Manpower 33,682,446.00$
2.1.1 Energy (POL, Electricity) 297,914,264.00$
2.1.2 Training Munitions and Expendable Stores 10,150,936.00$
2.2 Support Services 2.2.1 Transportation of Things 3,941,126.00$
2.3 Temporary Duty 6,948,334.00$
3.1.1 Organization-Level Consumables 72,613,444.00$
3.1.3 Organization-Level DLRs 136,440,499.00$
3.1.4 Contract Maintenance Services 19,317,686.00$
3.2.4 Government Labor 49,474,146.00$
3.2.5 Contractor Maintenance
3.3.1 Government Depot Repair 107,804,069.00$
3.3.2 Contractor Depot Repair 1,159,562.00$
3.3.3 Other Depot Maintenance 2,567,930.00$
4.1.1 System Specific Operator Training 2,424,307.00$
4.1.2 System Specific Non-Operator Training 2,345,326.00$
4.4 Sustaining Engineering and Program Management 14,047,932.00$
4.5 Other Sustaining Support 846,207.00$
5.0 Continuing System Improvements 5.1 Hardware Modifications or Modernization 154,551,948.00$
A1.1 Regular Aircraft Number A1.1.1 Regular Aircraft Number - Navy 133
A1.2 FRS Aircraft Number A1.2.1 FRS Aircraft Number - Navy 72
A2.1 Regular Total Annual Flying Hours A2.1.1 Regular Annual Flying Hours - Navy 50,875
A2.2 FRS Total Annual Flying Hours A2.2.1 FRS Annual Flying Hours - Navy 19,185
A5.1 Barrels of Fuel Consumed - Regular A5.1.1 Barrels of Fuel Consumed - Regular - Navy 1,538,101
A5.2 Barrels of Fuel Consumed - FRS A5.2.1 Barrels of Fuel Consumed - FRS - Navy 569,318
P1.1 Operations Personnel Count 475
P1.2 Maintenance Manpower Count 2,461
P1.3 Other Personnel Count 495
P2.1 Intermediate Personnel Count - Maintenance 577
P2.2 Intermediate Personnel Count - Other 20
Sum: 1,143,538,416.00$
2010
1.0 Unit-Level Manpower
2.0 Unit Operations
2.1 Operating Material
3.0 Maintenance
3.1 Organizational Maintenance and Support
3.2 Intermediate Maintenance
3.3 Depot Maintenance
4.0 Sustaining Support
4.1 System Specific Training
A1.0 Total Aircraft Number
A2.0 Total Annual Flying Hours
A5.0 Total Barrels of Fuel Consumed
P1.0 Unit-Level Total Personnel Count
P2.0 Total Intermediate Personnel Count

22
The following are level elements as defined by CAPE (2007):2
1.0 Unit3-level manpower includes the costs of all operators, maintenance, and other support manpower at operating units. Unit-level manpower costs are intended to capture direct costs (i.e., costs of unit-level individuals that can be clearly associated with the system performing its intended defense mission). It includes MilPers costs (e.g., basic pay, allowances, entitlements, etc.).
1.2 Unit-level maintenance manpower is the cost of all military, civilian, and contractor manpower that performs unit–level maintenance on a primary system, associated support equipment, and unit-level training devices.
1.3 Other unit-level manpower is the cost of all military, civilian, and contractor manpower that performs administrative, security, logistics, safety, engineering, and other mission support functions at the unit level.
3.0 Maintenance includes the costs of labor (outside of the scope of the unit level) and materials at all levels of maintenance in support of the primary system, simulators, training devices, and associated support equipment.4
3.1 Organizational maintenance and support includes the cost of materials and other costs used to maintain a primary system, training devices, simulators, and support equipment.
3.1.1 Organization-level consumables include the costs of materials consumed in the maintenance and support of a primary system and their associated support and training equipment at the unit level. Illustrative types of maintenance consumables are coolants and deicing fluids.
3.1.3 Organization-level Depot Level Repairable (DLR) includes the net cost the operating unit incurs for DLR spares (also referred to as exchangeable items) used to maintain equipment at the unit level.
3.1.4 Contract maintenance services includes the separate costs of contract labor, materials, and assets used in providing maintenance
2 The CAPE level elements were taken directly from the VAMOSC User Manual and are in
accordance with DoDI 5000.02 and DoD 5000.4M. The elements display costs that are followed by the DoD while describing money estimates for various programs because it brings essential understanding to the true cost of a system as a whole
3 Unit in the purpose of this MBA project can be defined as a squadron- or Organizational-level command.
4 This cost is tracked by Numbers JCNs and order documents generated at the O-level.

23
services to a weapon system, subsystem, support equipment, training device, or simulator at the unit level.
3.2 Intermediate maintenance includes the cost of labor and materials and other costs expended by I-level maintenance organization in support of a primary system, simulators, training devices, and associated support equipment. Where I-level maintenance activities cannot be separately identified from O-level maintenance, the costs are often combined as either organizational or intermediate maintenance.
3.2.4 Government labor includes the costs (using DoD standard composite rates, or hourly equivalent) of military and government civilian manpower that performs intermediate maintenance on a primary system, simulators, training devices, or associated support equipment at I-level maintenance activities.
3.3 Depot maintenance includes the fully burdened cost of labor, material, and overhead incurred in performing major overhauls or other depot-level maintenance on a system, its components, or other associated equipment at centralized repair depots, contractor repair facilities, or on site by depot teams.
3.3.1 Government depot repair includes government labor, material, and support service costs for depot repair.
3.3.2 Contractor depot repair includes the separate costs of burdened contract labor, material, and assets used in providing maintenance services to a primary system, subsystem, or associated support equipment. If possible, labor, material and other costs should be displayed separately.
3.3.3 Other depot maintenance costs not otherwise included. For example, this could include second-destination transportation costs for weapons systems or subsystems requiring major overhaul or rework, special testing, environmental costs, transportation of field repair teams, and technical assistance that is unique to the system and not included elsewhere in the estimate.
4.0 Sustaining support includes support services provided by centrally managed support activities external to the units that own the operating systems.
4.1.2 System-specific non-operator training includes the costs of advanced system-specific training associated with maintenance and other support functions in units designated as primary training facilities. (VAMOSC, 2012)
24
3. Decision Knowledge Programming for Logistics Analysis and Technical Evaluation
DECKPLATE is a new reporting system based on the Cognos incorporated
analysis, query, and reporting tools. It provides report and query capabilities content-
equivalent with the current Naval Aviation Logistics Data Analysis (NALDA) systems
and allows reporting and analysis capability not available with the current systems. The
new web-based reporting system provides a sound basis for future implementation of
emerging DoN architectural requirements. DECKPLATE is the next generation data
warehouse for aircraft maintenance, flight, and usage data. The system provides a web-
based interface to a single source of the information currently being stored in multiple
NALDA systems. Through the use of Cognos analysis, query, and reporting tools, the
user has the capabilities to effectively obtain readiness data in a near real-time
environment, as well as history data for trend analysis and records reconstruction
(DECKPLATE, 2012).
Figure 2 displays data flow and how DECKPLATE serves as a centralized data
warehouse of all current aviation systems under the NAE.

25
Figure 2. DECKPLATE Data Flow
(From COMNAVAIRFORINST, 2012).
4. Aviation Financial Analysis Tool
AFAST was developed as a result of a study conducted at Commander, Naval Air
Forces Pacific (COMNAVAIRPAC) in 1994 by 23 reserve officers who were chief
executive officers (CEOs) or chief financial officers (CFOs) in their civilian capacity.
They were tasked by Vice Admiral Spane to advise him on how better to run
COMNAVAIRFOC Commander, Naval Air Force Pacific (COMNAVAIRPAC) like a
business. One of the study group’s conclusions was that while COMNAVAIRPAC’s
financial tracking and analysis were up to industry standards, there was no cost
management applied to the flying hour program (FHP). Their study had identified two
tools already in existence in the fleet that could be used as a source of data to build a cost
26
management system at COMNAVAIRPAC. Their recommendation was to develop
AFAST using those systems as data sources. The two systems identified were the
Aviation Store Keeper Information Tracking (ASKIT) system and Naval Aviation
Logistics Command Management Information System (NALCOMIS) AIMD Cost
Accounting (NACA) system. ASKIT was selected to provide flight hours and fuel costs
accumulated monthly by squadron and reported via the budget operating target report
(BOR). NACA input files, extracted from NALCOMIS, were selected as a source of
squadron and AIMD costs via the requisition and maintenance action form (MAF) data.
The reserve group was tasked to develop a prototype at Naval Air Station North Island.
The prototype evaluation was completed in October 1995, and the decision was made to
implement in all COMNAVAIRPAC activities that were supported by the NALCOMIS
within the AIMD. The implementation was completed in 1996, and training was provided
by the reserve group to the COMNAVAIRPAC staff. The original AFAST software was
developed by the reserve group and supported by a contract with the Naval Computer and
Telecommunications Station (NCTS) in San Diego, CA. This contract ended at the end of
fiscal year (FY) 1996 and subsequent support and development has been provided via a
commercial contractor (NAVAIR).
The AFAST program was monitored by the COMNAVAIRPAC FHP Executive
Steering Committee (ESC) to track the progress of cost reduction initiatives that were
undertaken. The ESC decided in FY1999 to involve the type wings in monitoring the
FHP costs in their respective type model aircraft. Training was provided to the Type
Wings and additional tools were developed to support the wing involvement. The original
tool (AFAST User) was enhanced, and two new tools were developed. The two new tools
were the Type Wing FHP Cockpit Chart and the TWING Detail Analysis tool. All
exported tools have been developed as MS Excel spreadsheets or MS Access databases to
ensure Navy/Marine Corps Intranet (NMCI) compatibility and compliance. The master
AFAST database is maintained at COMNAVAIRPAC on a dedicated file server. This
database is updated and maintained by AFAST contractors and used to produce the other
tools monthly. These tools are produced after the flight hours have been certified in the
comptrollers Aviation Cost Evaluation System (ACES), which is the official financial
27
reporting system used to produce the Flying Hour Cost Report. AFAST draws the BOR
data from ACES after certification. AFAST captures only direct maintenance costs as
documented via Intermediate Maintenance Activity (IMA) NALCOMIS. These costs are
the results of squadron and IMA requisitions generated in NALCOMIS and MAF data
used to identify BCM actions on repairable items. AFAST does not capture financial-
only transactions. These transactions include contract costs, financial adjustments,
carcass charges, and requisitions not submitted via NALCOMIS. The business rule
established at inception was that AFAST must capture 85% of costs to be an effective
cost management tool. Currently, AFAST captures approximately 90% of FHP costs
(AFAST, 2009).
C. DESCRIPTION OF DATA FIELDS USED
1. Job Control Number
JCN is a 9-to-11 alphanumeric characters number utilized to identify different
jobs conducted on the aircraft. The JCN is the main master data record (MDR) or
document utilized to track maintenance procedures and material discrepancies, and to
order parts and materials. It contains information such as man hours, order document
numbers, and all other fields described in the data fields. It also provides a link between
maintenance actions performed at I-level in support of the maintenance discrepancy
initiated under a particular JCN. There is only one JCN per repairable item; conversely,
there can be several consumable items ordered tracked under one JCN. An original JCN
would follow a set format that is separated into four sections.
First, a three-digit code that identifies the originating command. This code
is known as the ORG code.
Second, a three-digit Julian date to identify when the JCN was created.
Third, a three-digit serial number to identify, in sequence, the actual job
number.
28
Fourth, the suffix, or SUF, to identify a sub-assembly or sub-sub-
assemblies repair actions performed independently of the major
component repair and used only for I-level maintenance actions.
For example a repairable component, such as the GCU, will have a JCN (e.g.,
AD6259018) if there is another repairable part needed to fix the GCU at the I level, then
a suffix, would be added at the end of the original JCN (e.g., AD62590181A). Therefore,
by looking at the JCN, we can see whether there were other actions taken to repair the
part; moreover, we can identify other repairable components utilized to fix the original
sub-assembly (COMNAVAIRFORINST, 2012).
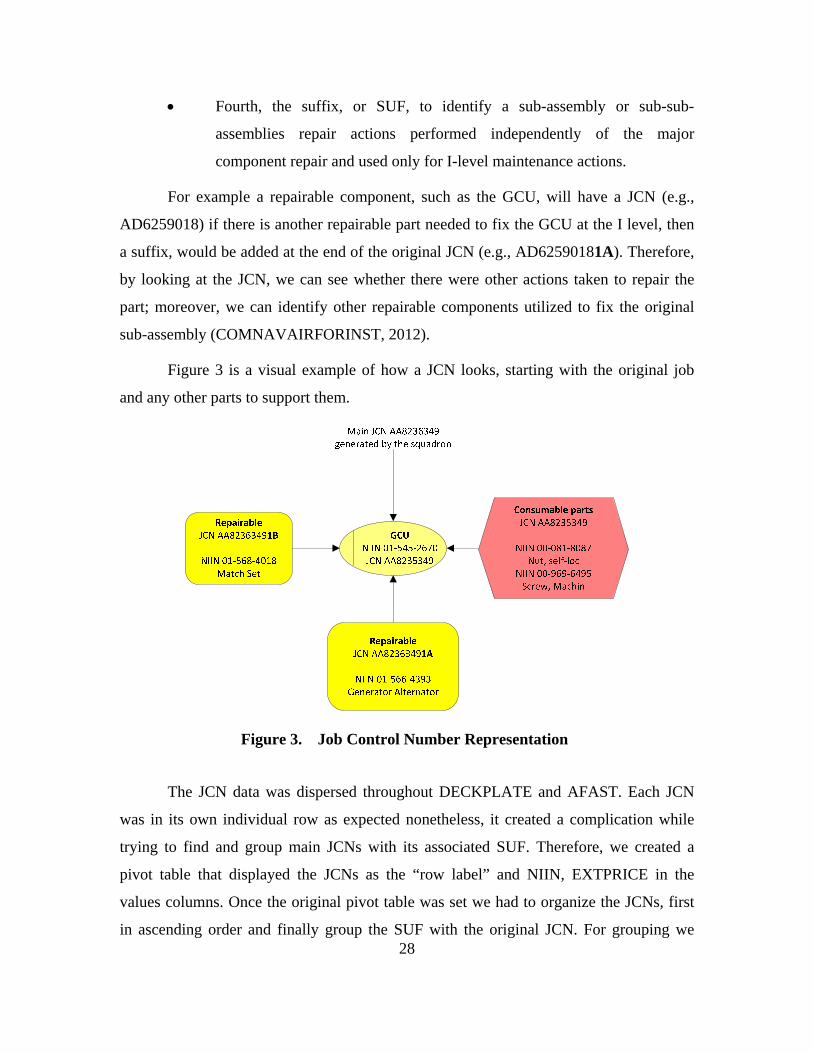
Figure 3 is a visual example of how a JCN looks, starting with the original job
and any other parts to support them.
Figure 3. Job Control Number Representation
The JCN data was dispersed throughout DECKPLATE and AFAST. Each JCN
was in its own individual row as expected nonetheless, it created a complication while
trying to find and group main JCNs with its associated SUF. Therefore, we created a
pivot table that displayed the JCNs as the “row label” and NIIN, EXTPRICE in the
values columns. Once the original pivot table was set we had to organize the JCNs, first
in ascending order and finally group the SUF with the original JCN. For grouping we
29
utilized the group row function from Excel at the end of the process we had several rows
of JCNs and its correspondent SUF. The new JCN pivot table was easier to read and it
showed the different charges against the original JCN which also represents charges
against the GCU. Another benefit of the JCN pivot table is that by adding the NIIN field
to the row label will display the NIINs ordered against the original JCN, in other words it
displays the parts required to fix the GCU.
Nevertheless, manually grouping the JCNs was a long and tedious task that is not
practical to maintenance officers in the fleet. However, there is a great deal of
information that can be gained by looking at this set.
2. Type Equipment Code
The type equipment code (TEC) is a four-digit character code used to identify the
complete end item or category of equipment being worked on. This number is used to
identify the type model series (TMS) involved (COMNAVAIRFORINST, 2012). Using
the TEC code to filter the data, trends in specific systems common to a variety of aircraft
can be found. For example, in our data, TEC code were used to organized groups of
aircraft with identical configurations the GCUs found in the FA-18 are used in the
following variants F/A-18E, F/A-18F and F/A-18G, the F/A-18G is the electronic counter
measure variant of the F/A-18 designed to replace the EA-6B. Once the data is grouped
by TEC codes it is easy to identify which group of aircraft if any is experiencing the
highest number of failures per aircraft. In our data we found that the F/A-18E is
experiencing roughly 13 failures per aircraft over the timeframe cover by our data, this is
the highest number of failures per aircraft compared to the other TMSs involved.
3. Commercial and Government Entity
Commercial and Government Entity (CAGE) is a five-position code assigned to
manufacturers and non-manufacturers, organizational entities and contractors of items
procured by agencies of the federal government. These codes help identify who
manufactured the part (COMNAVAIRFORINST, 2012).
30
4. Action Taken
Action Taken (AT) Code A is a one-character alphabetic or numeric code that
describes what action has been accomplished on the item identified by a Work Unit Code
(WUC). These codes include the multiple categories of BCMs, as well as information
regarding the repair (COMNAVAIRFORINST, 2012). The AT code provides the ability
to sort GCUs that were repaired from the GCUs that were BCM.
Using pivot tables and the AT codes as the sorting data field, then pair that
information to maintenance activity performing maintenance on the parts via the “action
origination short name” (a data field used in DECKPLATE), a consolidation the data
sorted by groups under each maintenance activity, this provides a summary of man hours,
parts ordered, and associated costs for each site. For example we could instantly see of
the 1,388 “BCM1 – repair not authorized” four of them were issued by the AIMD
onboard the USS RONALD REGAN. By organizing the data this way the total number
of items process for each AT code as well as the associated man hours can also easily be
identified.
5. Beyond Capable Maintenance
BCM, a term/code used by I-levels when repair is not authorized at that level or
when an activity is not capable of accomplishing the repair because of a lack of
equipment, facilities, technical skills, technical data, or parts (COMNAVAIRFORINST,
2012). BCM is also used when shop backlog precludes repair within the time limits
specified by existing directives. BCM codes are used to identify quantities and reasons
for GCUs to be sent off for depot-level repair.
6. A National Item Identification Number
A National (or North Atlantic Treaty Organization [NATO]) item identification
number (NIIN) is a nine-digit numeric code that uniquely identifies an item of supply in
the NATO Codification System (COMNAVAIRFORINST, 2012). NIINs allow us to
filter and identify each component and the number of components used to repair the
GCU. NIIN are extremely important while using pivot tables because the information
31
associated with the individual NIIN represent quantitative factors such cost in dollars,
man hours and items ordered. This information provided us with means to identify cost
drivers, frequently ordered items, and also man hours expend while repairing GCUs.
Therefore, by using the NIIN, we could see which of the internal components was failing,
how often, and how much it cost to repair.
7. Malfunction Description Code
Malfunction description code (MAL) is a three-character numeric or
alphanumeric code used to describe the malfunction occurring on or in an item identified
by a WUC (COMNAVAIRFORINST, 2012). Filtering the data by MAL codes and
counting the number of times a specific MAL code is used then organizing the MAL
codes by number of re-occurrences it a fast and easy way to see trends in specific types of
failures. For example 374 is the code representing an internal failure, this code appeared
1043 time, far more times than any other code, this information can be used as the first
step to identifying what the components are failing internally, these codes are utilized
throughout the maintenance process and very as new discrepancies and found and
discrepancies are documented against the part being repaired
8. Measures of Maintenance Hours
a. Elapsed Maintenance Time
Elapsed maintenance time (EMT) measures the duration of an event from
start to completion, regardless of the number of personnel performing the maintenance
(COMNAVAIRFORINST, 2012).
b. Man-Hours
Man-hours are used to measure the time each individual spends to
complete a single discrepancy (COMNAVAIRFORINST, 2012).
9. Serial Numbers
Removed/installed equipment serial numbers are located on the part and are
entered into maintenance data systems for record keeping. We used these numbers to

32
keep track of how GCUs are the moved through the maintenance and supply systems
(COMNAVAIRFORINST, 2012). Tracking these serial numbers could be useful to find
individual component failures. For example if there is an internal component that fails
continuously shows that the particular component has a high rate of failure and needs to
be stock in inventory. Conversely, if the component is not identified as a high failure
component by looking at different maintenance organizations we could conclude that
there is another factor creating the failure. Serial numbers pivot table could shed light on
internal failures that are affecting other internal parts or high utilization components due
to ordinary failure rates.
33
IV. RESULTS
Our analysis focuses on providing information associated with costs that are
followed and used by the DoD to describe financial estimates for various programs. Our
hope is to provide an essential understanding of the true cost associated with a system
and its subsystems, as well as, increase the accuracy and detail of the data used by CAPE
and other cost analysis groups during acquisition and budget estimation. The results
obtained by our analysis were from AFAST and DECKPLATE data fields relate and
influence current level elements as defined by CAPE.
A. JOB CONTROL NUMBERS
A JCN is the main MDR; thus, it creates the means to track all maintenance
actions back to the original job, a SUF JCN is added in order to accommodate an I-level
action, these SUF JCNs represent additional actions, parts and materials that are required
to repair the system associated with the main JCN, such as ordering a repairable part to
repair a GCU. Excel views the SUF JCN’s as an individual JCN which are not part of a
mother JCN, manually grouping JCN’s by the authors became a necessary evil. Table 4
displays an example of a pivot table which groups SUF JCNs into the original JCN.
JCN’s are extremely useful in this regard, the ability to track the parts and materials to
the original discrepancy helps to tell the story; however the tools in Excel do not
automatically group JCN’s together.
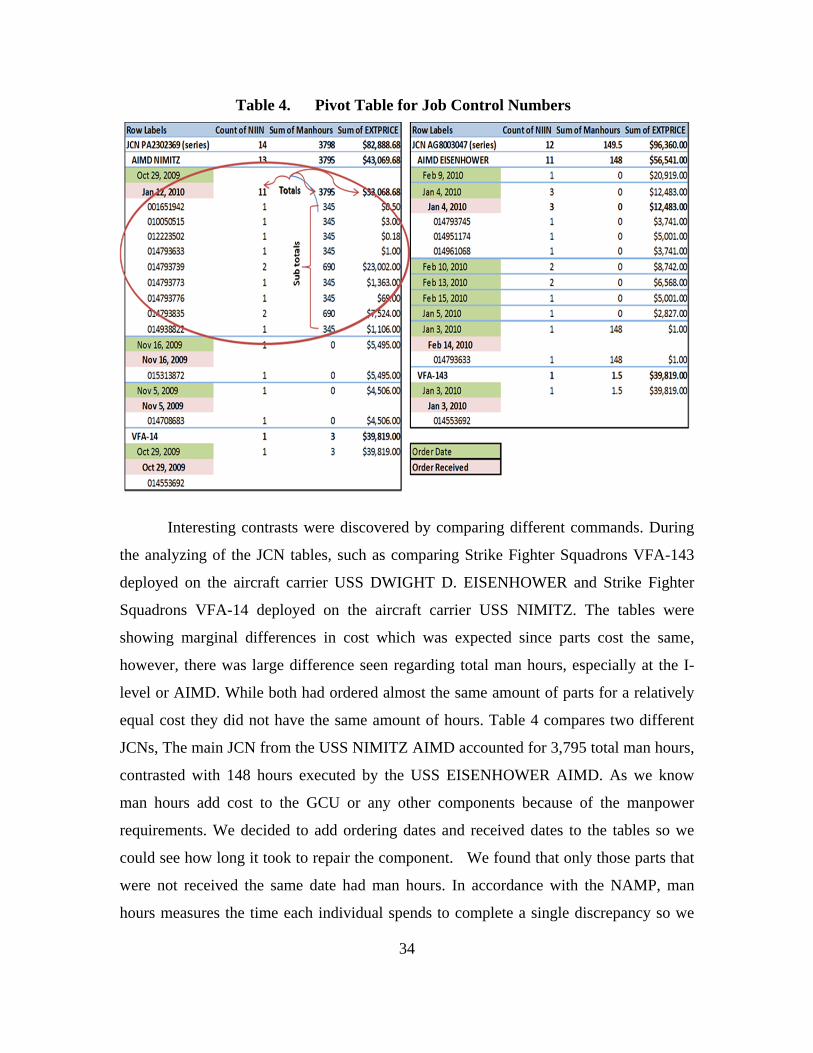
34
Table 4. Pivot Table for Job Control Numbers
Interesting contrasts were discovered by comparing different commands. During
the analyzing of the JCN tables, such as comparing Strike Fighter Squadrons VFA-143
deployed on the aircraft carrier USS DWIGHT D. EISENHOWER and Strike Fighter
Squadrons VFA-14 deployed on the aircraft carrier USS NIMITZ. The tables were
showing marginal differences in cost which was expected since parts cost the same,
however, there was large difference seen regarding total man hours, especially at the I-
level or AIMD. While both had ordered almost the same amount of parts for a relatively
equal cost they did not have the same amount of hours. Table 4 compares two different
JCNs, The main JCN from the USS NIMITZ AIMD accounted for 3,795 total man hours,
contrasted with 148 hours executed by the USS EISENHOWER AIMD. As we know
man hours add cost to the GCU or any other components because of the manpower
requirements. We decided to add ordering dates and received dates to the tables so we
could see how long it took to repair the component. We found that only those parts that
were not received the same date had man hours. In accordance with the NAMP, man
hours measures the time each individual spends to complete a single discrepancy so we

35
were surprised to see zero hours on parts that were received the same day. The example
on Table 4 shows a time frame of 45 days, at the same time, there are exactly 345 man
hours for each part. We thought that the 345 hours represented the time AIMD took to
repair that particular sub-component, for example the time it took to fix a circuit card.
However, when looking at a part common to both JCNs, NIIN 01–479–3633, we noticed
that this part was a packing which is a consumable part rather than a repairable item. We
believe these hours represent an awaiting-time laps rather than hours spent by
maintenance personnel doing repairs. We came to that conclusion because the other parts
that were received the same day have zero hours. Furthermore, the evidence of several
consumable items with the same times as each other clearly indicates that those hours
were not spent in repairing those individual components. Inaccurate representation of
man-hours affects the accuracy of manning, over documentation of man-hours will inflate
manning, under documentation will reduce manning and drastically affect readiness.
Getting these numbers correct is extremely important to personnel costs allocations and
to the DoD financial and operational planning.
B. TYPE EQUIPMENT CODE
TECs were used to distinguish variants in weapon systems and the associated
failure rates specific to that system. For example, the GCUs high failure rate has become
a problem for the F/A-18, and therefore, identifying the cause of the decreased mean time
between failures is important to correcting the problem. Using the TECs and JCNs, we
can determine the number of maintenance actions being performed to correct GCU
discrepancies. Table 5 illustrates how we can determine which variant is experiencing the
greatest rate of failure by comparing that variant’s data to the number of aircraft
associated with that TEC group.
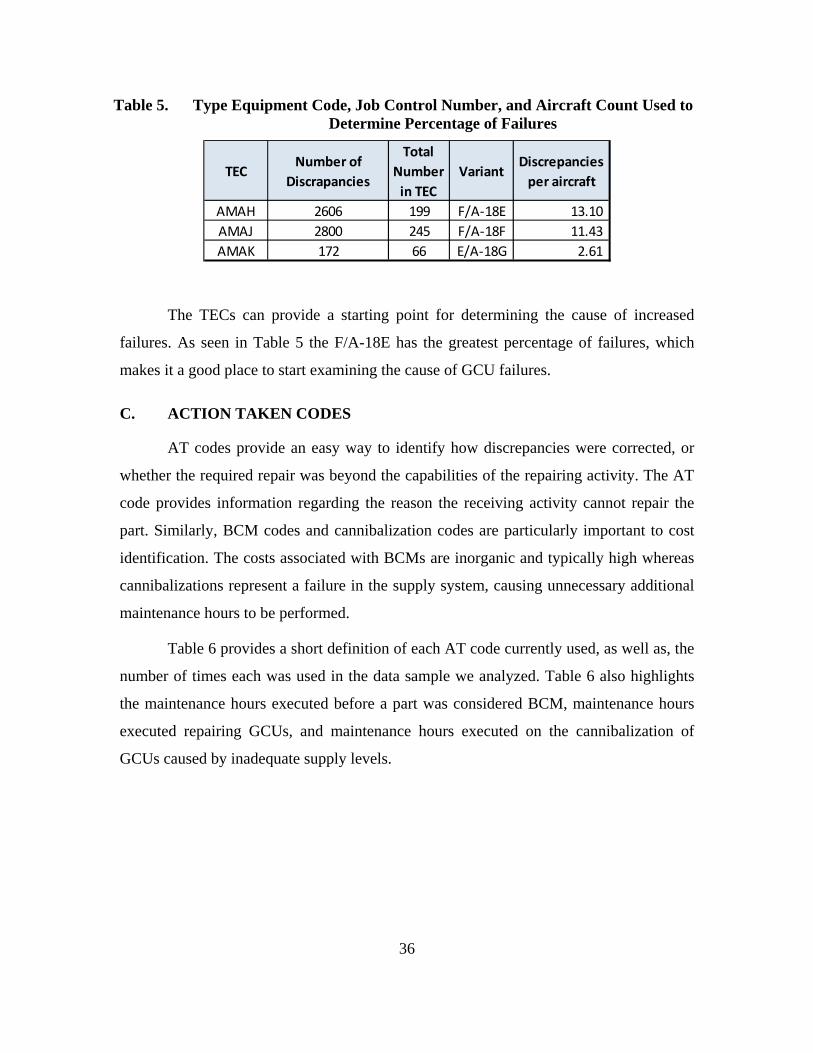
36
Table 5. Type Equipment Code, Job Control Number, and Aircraft Count Used to Determine Percentage of Failures
The TECs can provide a starting point for determining the cause of increased
failures. As seen in Table 5 the F/A-18E has the greatest percentage of failures, which
makes it a good place to start examining the cause of GCU failures.
C. ACTION TAKEN CODES
AT codes provide an easy way to identify how discrepancies were corrected, or
whether the required repair was beyond the capabilities of the repairing activity. The AT
code provides information regarding the reason the receiving activity cannot repair the
part. Similarly, BCM codes and cannibalization codes are particularly important to cost
identification. The costs associated with BCMs are inorganic and typically high whereas
cannibalizations represent a failure in the supply system, causing unnecessary additional
maintenance hours to be performed.
Table 6 provides a short definition of each AT code currently used, as well as, the
number of times each was used in the data sample we analyzed. Table 6 also highlights
the maintenance hours executed before a part was considered BCM, maintenance hours
executed repairing GCUs, and maintenance hours executed on the cannibalization of
GCUs caused by inadequate supply levels.
TECNumber of
Discrapancies
Total
Number
in TEC
VariantDiscrepancies
per aircraft
AMAH 2606 199 F/A‐18E 13.10
AMAJ 2800 245 F/A‐18F 11.43
AMAK 172 66 E/A‐18G 2.61
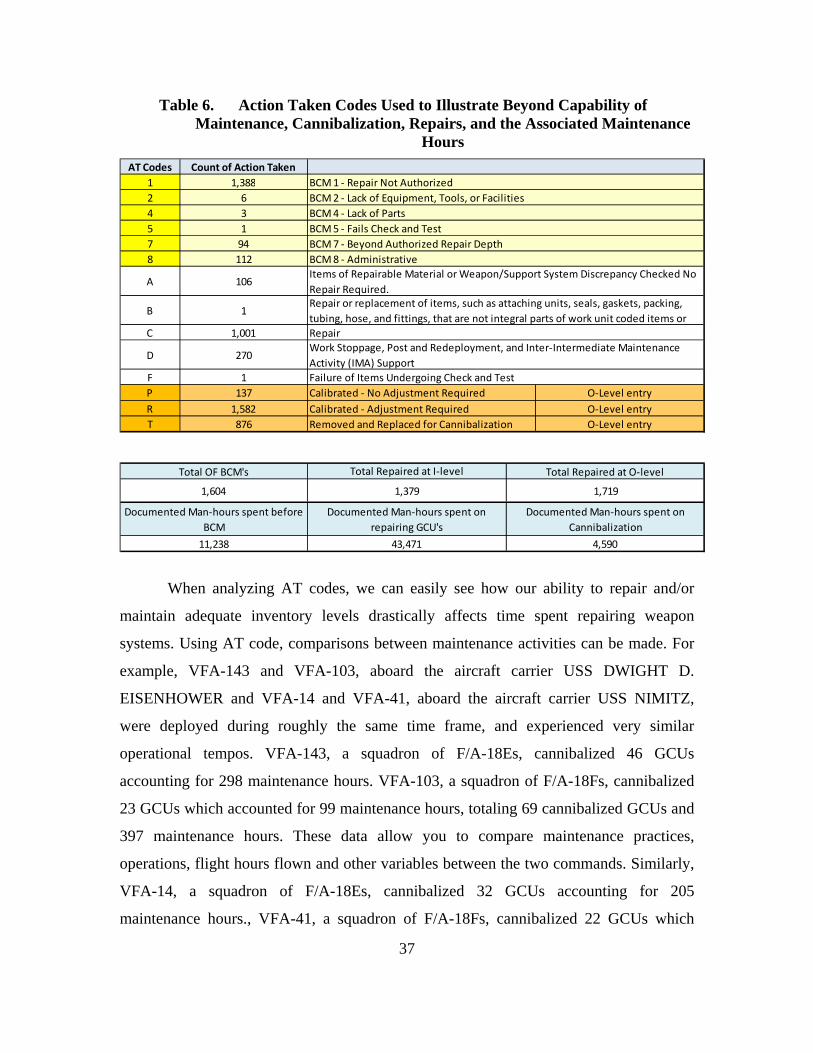
37
Table 6. Action Taken Codes Used to Illustrate Beyond Capability of Maintenance, Cannibalization, Repairs, and the Associated Maintenance
Hours
When analyzing AT codes, we can easily see how our ability to repair and/or
maintain adequate inventory levels drastically affects time spent repairing weapon
systems. Using AT code, comparisons between maintenance activities can be made. For
example, VFA-143 and VFA-103, aboard the aircraft carrier USS DWIGHT D.
EISENHOWER and VFA-14 and VFA-41, aboard the aircraft carrier USS NIMITZ,
were deployed during roughly the same time frame, and experienced very similar
operational tempos. VFA-143, a squadron of F/A-18Es, cannibalized 46 GCUs
accounting for 298 maintenance hours. VFA-103, a squadron of F/A-18Fs, cannibalized
23 GCUs which accounted for 99 maintenance hours, totaling 69 cannibalized GCUs and
397 maintenance hours. These data allow you to compare maintenance practices,
operations, flight hours flown and other variables between the two commands. Similarly,
VFA-14, a squadron of F/A-18Es, cannibalized 32 GCUs accounting for 205
maintenance hours., VFA-41, a squadron of F/A-18Fs, cannibalized 22 GCUs which
AT Codes Count of Action Taken
1 1,388
2 6
4 3
5 1
7 94
8 112
A 106
B 1
C 1,001
D 270
F 1
P 137
R 1,582
T 876
Documented Man‐hours spent before
BCM
Total Repaired at I‐level
1,3791,604
Total OF BCM's
Documented Man‐hours spent on
repairing GCU's
BCM 7 ‐ Beyond Authorized Repair Depth
BCM 8 ‐ Administrative
BCM 1 ‐ Repair Not Authorized
BCM 2 ‐ Lack of Equipment, Tools, or Facilities
BCM 4 ‐ Lack of Parts
BCM 5 ‐ Fails Check and Test
Calibrated ‐ No Adjustment Required
Calibrated ‐ Adjustment Required
Removed and Replaced for Cannibalization
Items of Repairable Material or Weapon/Support System Discrepancy Checked No
Repair Required.Repair or replacement of items, such as attaching units, seals, gaskets, packing,
tubing, hose, and fittings, that are not integral parts of work unit coded items or
Repair
Work Stoppage, Post and Redeployment, and Inter‐Intermediate Maintenance
Activity (IMA) Support
Failure of Items Undergoing Check and Test
O‐Level entry
O‐Level entry
O‐Level entry
Documented Man‐hours spent on
Cannibalization
1,719
Total Repaired at O‐level
43,47111,238 4,590
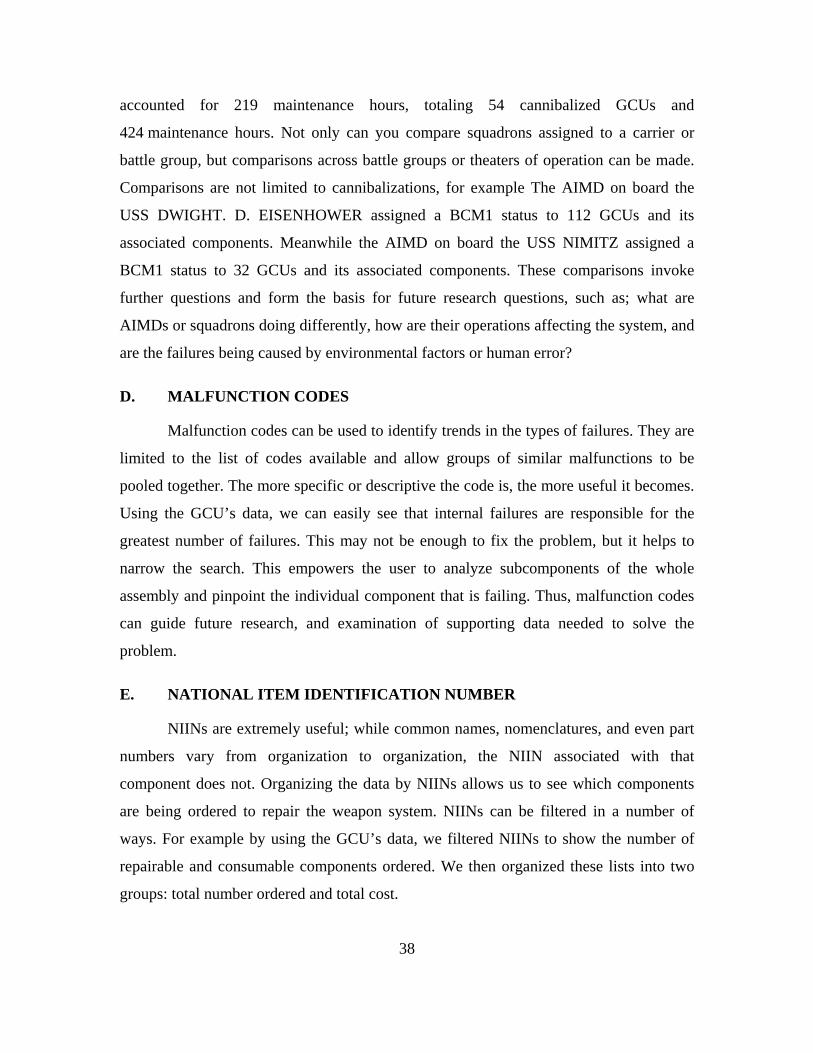
38
accounted for 219 maintenance hours, totaling 54 cannibalized GCUs and
424 maintenance hours. Not only can you compare squadrons assigned to a carrier or
battle group, but comparisons across battle groups or theaters of operation can be made.
Comparisons are not limited to cannibalizations, for example The AIMD on board the
USS DWIGHT. D. EISENHOWER assigned a BCM1 status to 112 GCUs and its
associated components. Meanwhile the AIMD on board the USS NIMITZ assigned a
BCM1 status to 32 GCUs and its associated components. These comparisons invoke
further questions and form the basis for future research questions, such as; what are
AIMDs or squadrons doing differently, how are their operations affecting the system, and
are the failures being caused by environmental factors or human error?
D. MALFUNCTION CODES
Malfunction codes can be used to identify trends in the types of failures. They are
limited to the list of codes available and allow groups of similar malfunctions to be
pooled together. The more specific or descriptive the code is, the more useful it becomes.
Using the GCU’s data, we can easily see that internal failures are responsible for the
greatest number of failures. This may not be enough to fix the problem, but it helps to
narrow the search. This empowers the user to analyze subcomponents of the whole
assembly and pinpoint the individual component that is failing. Thus, malfunction codes
can guide future research, and examination of supporting data needed to solve the
problem.
E. NATIONAL ITEM IDENTIFICATION NUMBER
NIINs are extremely useful; while common names, nomenclatures, and even part
numbers vary from organization to organization, the NIIN associated with that
component does not. Organizing the data by NIINs allows us to see which components
are being ordered to repair the weapon system. NIINs can be filtered in a number of
ways. For example by using the GCU’s data, we filtered NIINs to show the number of
repairable and consumable components ordered. We then organized these lists into two
groups: total number ordered and total cost.

39
Table 7 displays the top ten consumable items. Table 8 displays the top ten
repairable parts used to repair the GCU; items on each table are arranged by greatest to
least number of units ordered and display their costs.
Table 7. Top 10 Consumable Parts Organized by Number Ordered
Table 8. Top 10 Repairable Parts Organized by Number Ordered
From Tables 7 and 8, we can see how NIINs represent the frequency of items
ordered during a selected period to sustain repairs on a GCU. This information is used to
calculate future inventories and help maintenance professional see trends in items that are
been consumed at a higher rate than normal. More importantly, tracking the number of
NIIN’s being ordered and understanding the failure rates of the individual components
Nomen NIIN Number Ordered Total CostO‐RING 010050515 181 276.25$ O‐RING 001651942 127 42.71$ O‐RING 011192008 75 246.69$ TERMINAL 009507783 73 2,312.17$PACKING 012223502 52 27.90$ O‐RING 001660990 51 26.37$ O RING 000546940 38 13.78$ FILTERING DI 012217808 21 162.45$ GCU COVER 015526291 17 808.94$ F18 E/F G1 KI LLPOZ5436 13 0.13$
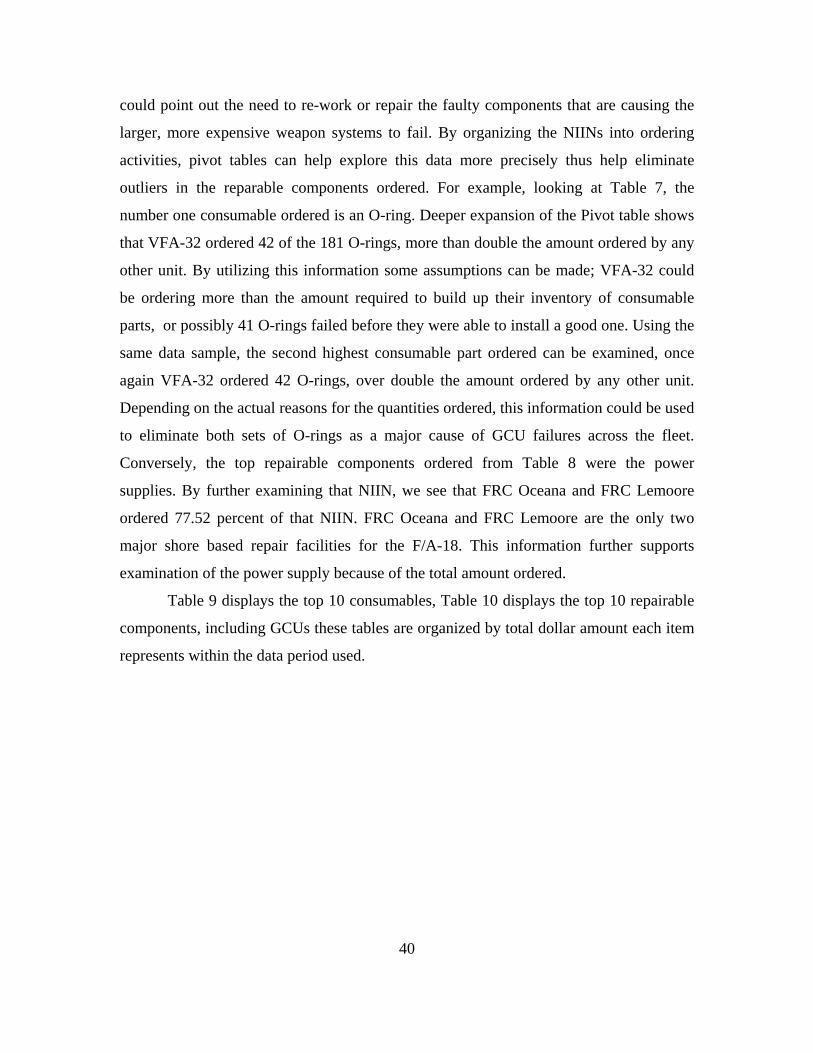
40
could point out the need to re-work or repair the faulty components that are causing the
larger, more expensive weapon systems to fail. By organizing the NIINs into ordering
activities, pivot tables can help explore this data more precisely thus help eliminate
outliers in the reparable components ordered. For example, looking at Table 7, the
number one consumable ordered is an O-ring. Deeper expansion of the Pivot table shows
that VFA-32 ordered 42 of the 181 O-rings, more than double the amount ordered by any
other unit. By utilizing this information some assumptions can be made; VFA-32 could
be ordering more than the amount required to build up their inventory of consumable
parts, or possibly 41 O-rings failed before they were able to install a good one. Using the
same data sample, the second highest consumable part ordered can be examined, once
again VFA-32 ordered 42 O-rings, over double the amount ordered by any other unit.
Depending on the actual reasons for the quantities ordered, this information could be used
to eliminate both sets of O-rings as a major cause of GCU failures across the fleet.
Conversely, the top repairable components ordered from Table 8 were the power
supplies. By further examining that NIIN, we see that FRC Oceana and FRC Lemoore
ordered 77.52 percent of that NIIN. FRC Oceana and FRC Lemoore are the only two
major shore based repair facilities for the F/A-18. This information further supports
examination of the power supply because of the total amount ordered.
Table 9 displays the top 10 consumables, Table 10 displays the top 10 repairable
components, including GCUs these tables are organized by total dollar amount each item
represents within the data period used.

41
Table 9. Top 10 Consumable Parts Organized by Total Cost of Items Ordered
Table 10. Top 10 Repairable Parts Organized by Total Cost of Items Ordered
Determining cost drivers and the components that have the greatest impact on the
budget is easy by utilizing NIINs to sort the data. This was also the same method used to
filter Tables 7 and 8. After examining the cost drivers shown on Table 10, additional data
mining revealed that FRC Oceana and FRC Lemoore consumed 85.33 percent of the cost
associated with the NIIN 015664394 the third highest cost driver to the DoD caused by
GCU failures. (We started looking there because the top two NIINs represent the
completed GCU assembly.) Again, because FRC Oceana and FRC Lemoore represent the
major repair facilities for the F/A-18, this information supports further examination of
circuit card costs.
Nomen NIIN Number Ordered Total CostSWITCH,PRESS 014938784 4 2,690.28$TERMINAL 009507783 73 2,312.17$CABLE ASSEMB 014080385 1 2,233.66$SOLENOID,ELE 008681880 1 1,796.20$COUPLING 011506744 10 1,455.66$ADAPTER,SPLI 010330117 1 1,187.22$RELAY,ELECTRO 011208774 1 1,022.72$CONNECTOR,PLU LLP234788 1 1,000.00$GCU COVER 15526291 17 808.94$ CONNECTOR,R 011632549 1 429.16$
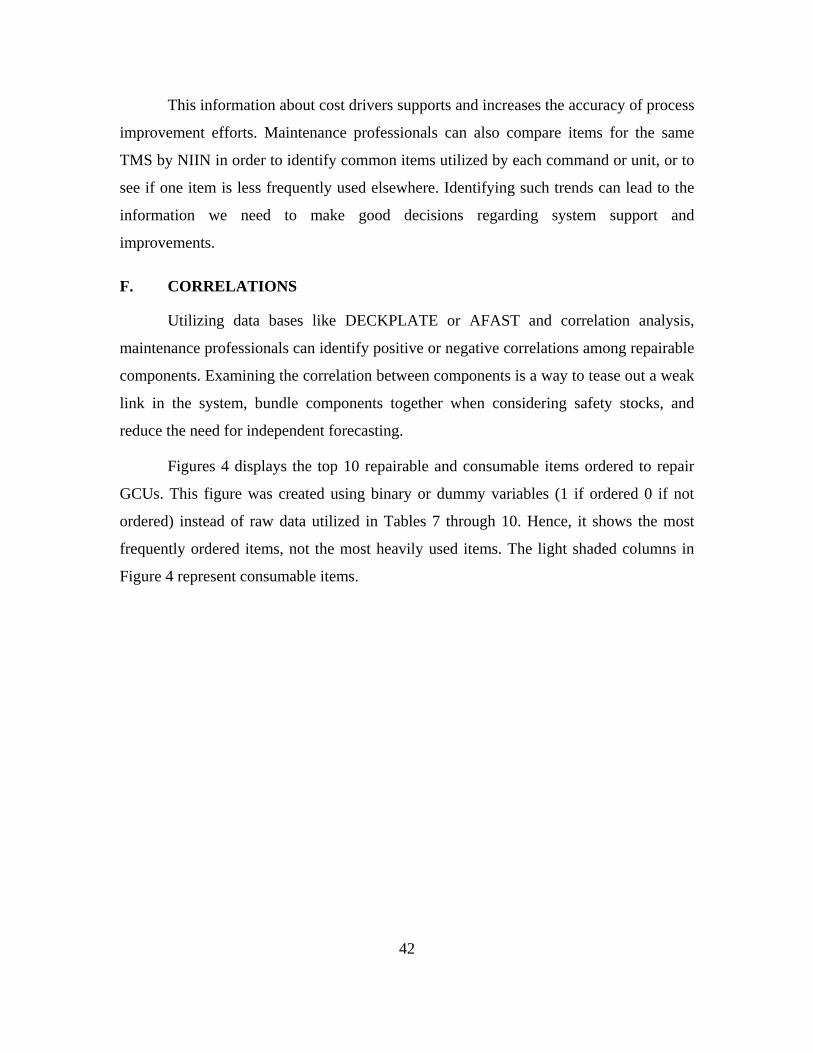
42
This information about cost drivers supports and increases the accuracy of process
improvement efforts. Maintenance professionals can also compare items for the same
TMS by NIIN in order to identify common items utilized by each command or unit, or to
see if one item is less frequently used elsewhere. Identifying such trends can lead to the
information we need to make good decisions regarding system support and
improvements.
F. CORRELATIONS
Utilizing data bases like DECKPLATE or AFAST and correlation analysis,
maintenance professionals can identify positive or negative correlations among repairable
components. Examining the correlation between components is a way to tease out a weak
link in the system, bundle components together when considering safety stocks, and
reduce the need for independent forecasting.
Figures 4 displays the top 10 repairable and consumable items ordered to repair
GCUs. This figure was created using binary or dummy variables (1 if ordered 0 if not
ordered) instead of raw data utilized in Tables 7 through 10. Hence, it shows the most
frequently ordered items, not the most heavily used items. The light shaded columns in
Figure 4 represent consumable items.
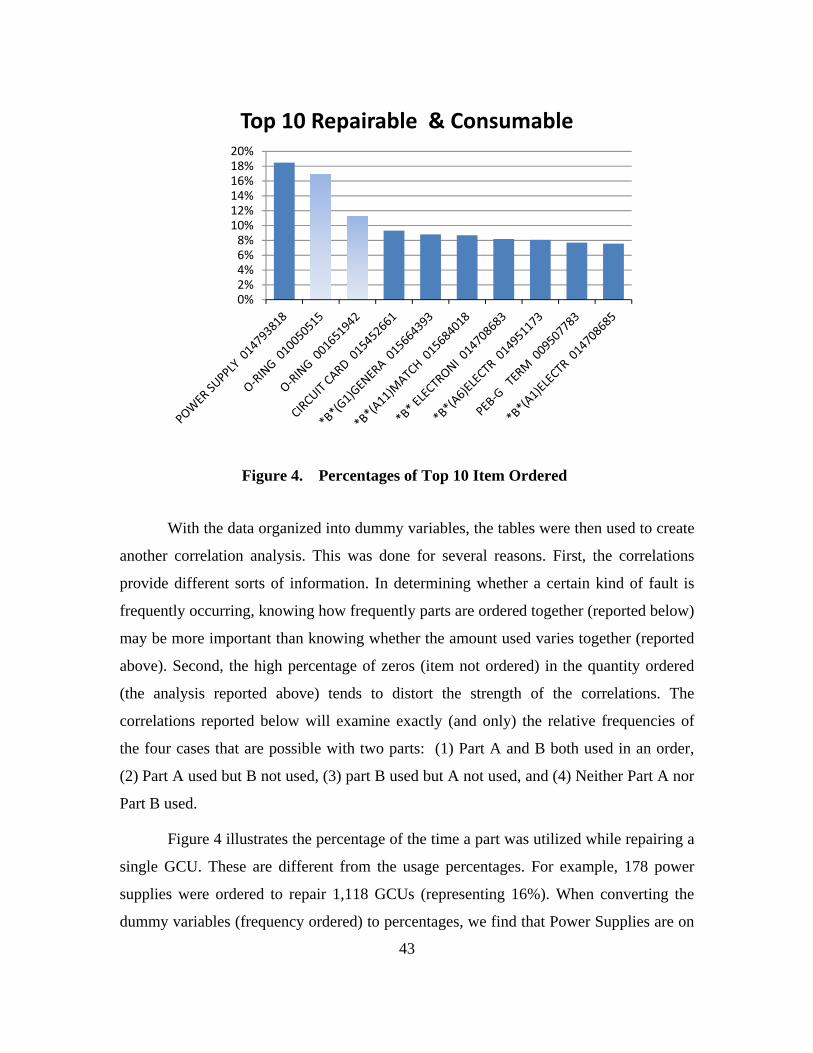
43
Figure 4. Percentages of Top 10 Item Ordered
With the data organized into dummy variables, the tables were then used to create
another correlation analysis. This was done for several reasons. First, the correlations
provide different sorts of information. In determining whether a certain kind of fault is
frequently occurring, knowing how frequently parts are ordered together (reported below)
may be more important than knowing whether the amount used varies together (reported
above). Second, the high percentage of zeros (item not ordered) in the quantity ordered
(the analysis reported above) tends to distort the strength of the correlations. The
correlations reported below will examine exactly (and only) the relative frequencies of
the four cases that are possible with two parts: (1) Part A and B both used in an order,
(2) Part A used but B not used, (3) part B used but A not used, and (4) Neither Part A nor
Part B used.
Figure 4 illustrates the percentage of the time a part was utilized while repairing a
single GCU. These are different from the usage percentages. For example, 178 power
supplies were ordered to repair 1,118 GCUs (representing 16%). When converting the
dummy variables (frequency ordered) to percentages, we find that Power Supplies are on
0%2%4%6%8%
10%12%14%16%18%20%
Top 10 Repairable & Consumable

44
18% of orders, as shown in Figure 4. This is because the raw data accounts for the
quantity ordered, while the ‘dummy variables’ only track whether an item was used (not
the quantity used). The percentage is also higher because some JCNs contained more than
one Generator. In accordance with the NAMP there should be one repairable per JCN
therefore, finding this discrepancy shows a problem in data collection. Similarly, O-Ring
0100515 was 16% in the usage data and 17% in the dummy variable form (frequency
ordered). But, not all the items were different from the raw data; the majorities were
exact matches and so helped verify the accuracy of our data.
Based on this analysis, bundling of the repairable parts and the consumable parts
might be considered. However, bundling repairable items must be based on a significant
correlation otherwise it could prove costly and inefficient. The identification of these
correlations is only the first step in the analysis required to determine which consumable
parts might be intelligently bundled with repairable items.
Table 11 illustrates the top ten items ordered from the data and also shows the Phi
() correlation between power supply, NIIN 01–479–3818 and electronic card, 01–470–
8685. The equation shown in the same table is the initial step towards finding the
significance of the correlation. This example shows that the closer the numbers are to
one, the higher their correlation to another component is. Nonetheless, numbers that are
very small are not necessarily uncorrelated; the values can be small because of the sheer
size of our sample. Table 11 also shows the 2x2 table utilized to explain the amount of
times an item is present (or not) in a JCN. For example, the power supply was present in
149 JCNs out of 2,425 total JCNs.
Once Phi is identified, it can be used to calculate the P-value, which will show the
significance of this correlation. Since Excel does not have a way to identify P-values for
Phi, it is helpful to know that according to Cramer (1946): mathematically Phi^2 is equal
to Chi^2 divided by n (the sample size) or 2 = /n. Therefore, Phi^2 multiplied by n is
equal to Chi^2 denoted = 2 * n. This is useful because Excel has a Chi^2 distribution
formula which shows the statistical significance of the correlation.
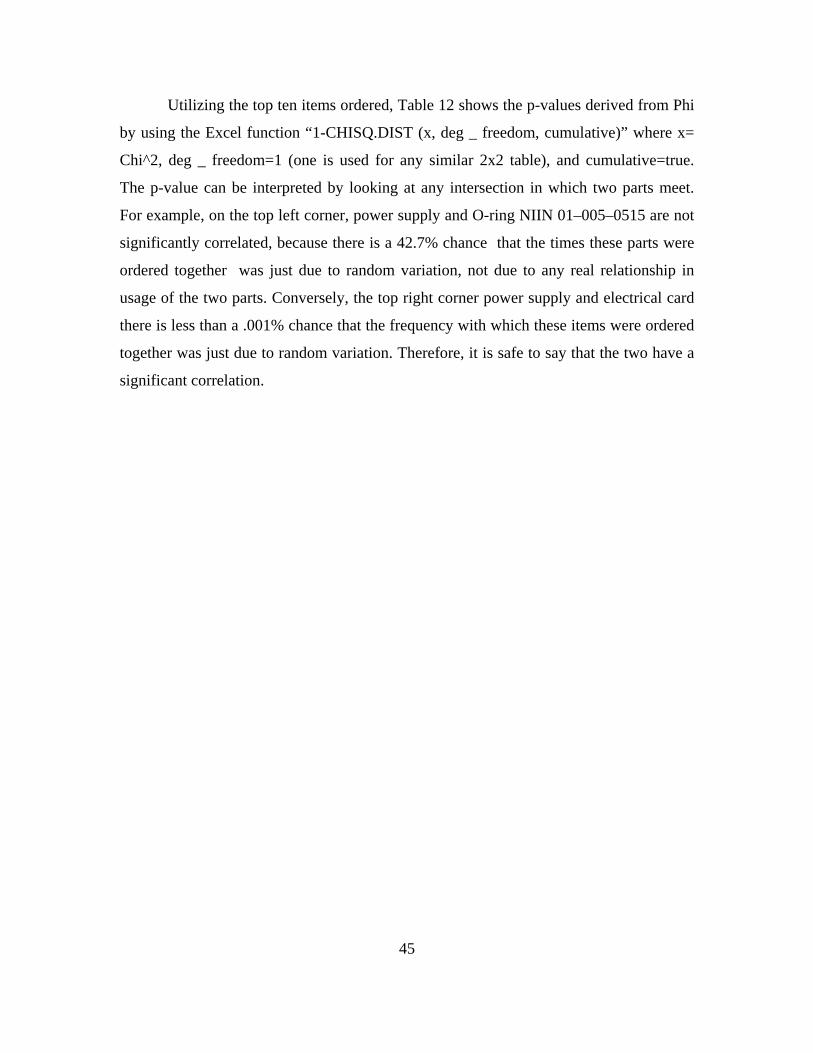
45
Utilizing the top ten items ordered, Table 12 shows the p-values derived from Phi
by using the Excel function “1-CHISQ.DIST (x, deg _ freedom, cumulative)” where x=
Chi^2, deg _ freedom=1 (one is used for any similar 2x2 table), and cumulative=true.
The p-value can be interpreted by looking at any intersection in which two parts meet.
For example, on the top left corner, power supply and O-ring NIIN 01–005–0515 are not
significantly correlated, because there is a 42.7% chance that the times these parts were
ordered together was just due to random variation, not due to any real relationship in
usage of the two parts. Conversely, the top right corner power supply and electrical card
there is less than a .001% chance that the frequency with which these items were ordered
together was just due to random variation. Therefore, it is safe to say that the two have a
significant correlation.
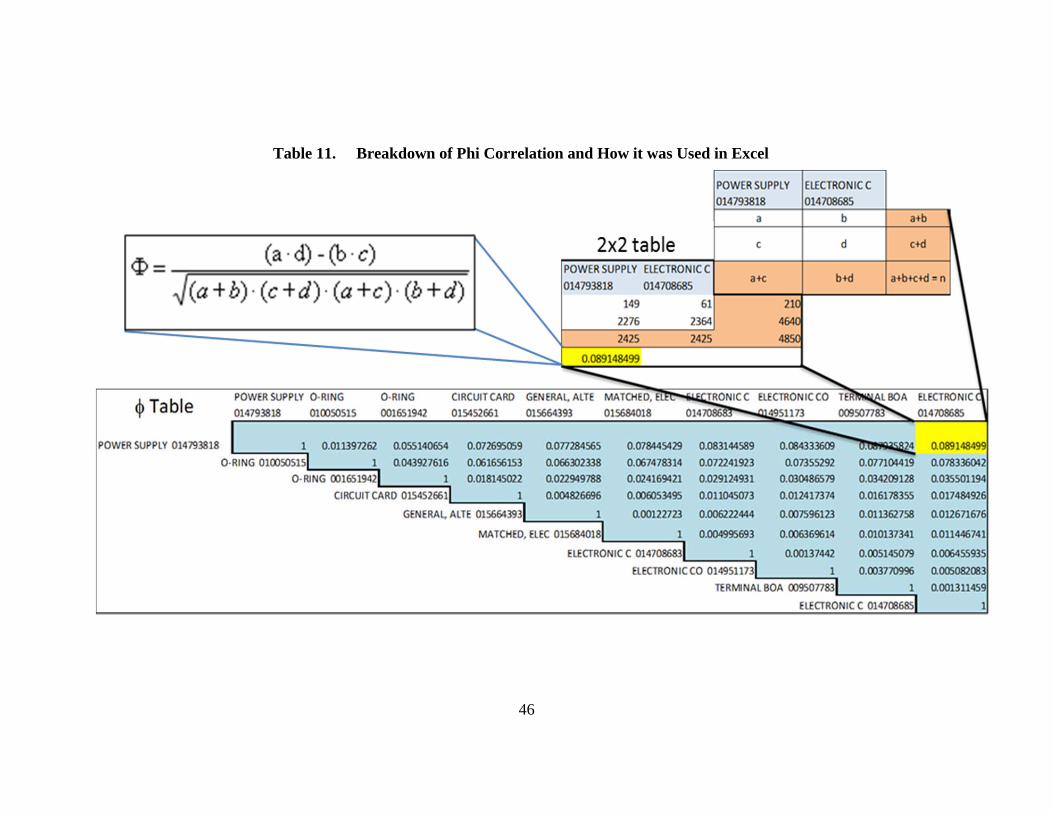
46
Table 11. Breakdown of Phi Correlation and How it was Used in Excel
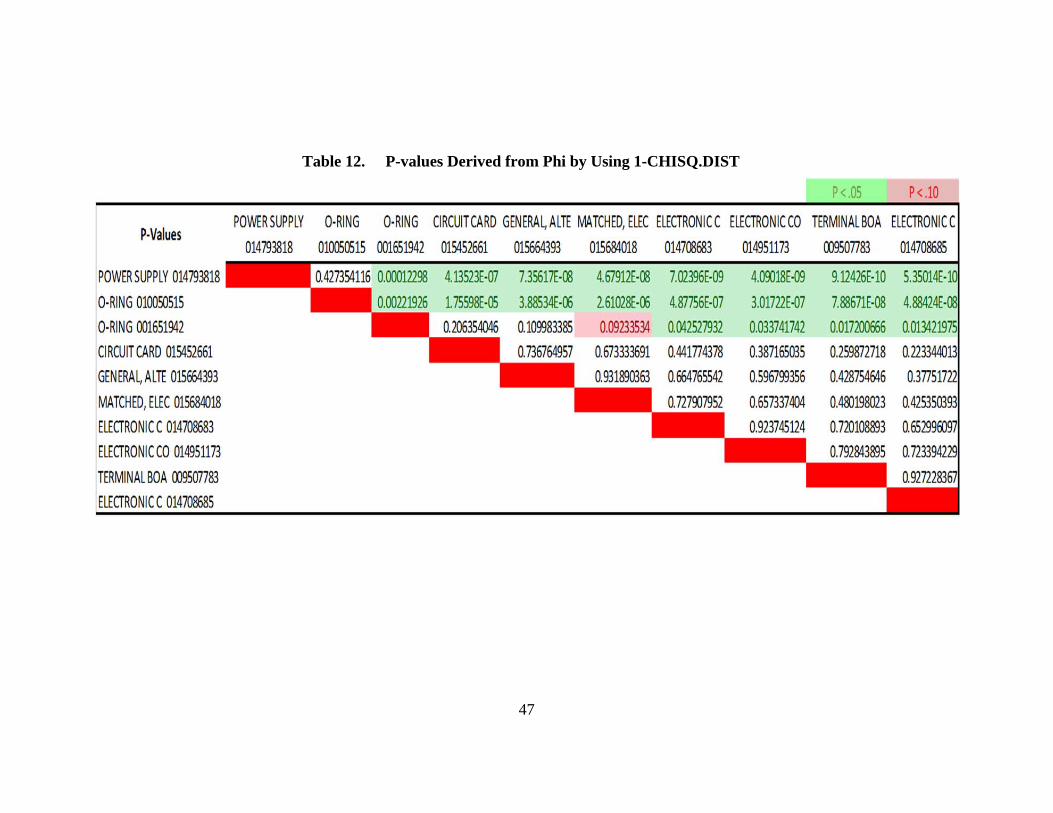
47
Table 12. P-values Derived from Phi by Using 1-CHISQ.DIST
48
The analysis of the correlation also reveals the following:
First, it is confirmed that O-rings are frequently used which was also shown by
Figure 4. Moreover, it showed O-ring NIIN 01–005–0515 as the top consumable item
ordered. Examining only usage data, one might conclude that a large safety stock of this
item should be maintained. But since previous analysis showed that a single squadron
used this item heavily, increased safety stocks would not be warranted to support all
squadrons, at least until the reason this squadron had excessive demand are determined.
Also, the Phi correlations showed that the usage of this O-ring is significantly correlated
to the usage of other O-rings, so any spike in demand at one squadron for this one O-ring
in isolation is especially curious, and would need further investigation before safety
stocks were adjusted.
Second, Table 12 shows that by using Phi the true picture emerges though the
correlation is small. It should be noted that there is still an indication of these parts being
ordered together, hence the need to observe the failures in parts, such as the electrical
card and the terminal board, since the correlation is stronger.
G. VAMOSC
The VAMOSC database is a great source of information but does not yield usable
results for the purposes of this project. We tried using NAMSR directly from the
VAMOSC website by using a query data under WUC 4211800, 42A1E00, 42A1E90,
42X1E40, but without success. Contacting VAMOSC for assistance and providing our
specific requirements, VAMOSC representatives provided the following fields of data:
Fiscal Year, Type/Model/Series-Aircraft, NIIN, Nomenclature, AVDLR Cost, BCM
Count, I-Level Consumable Cost, Depot-Level Consumable Cost, Total Consumable
Cost, O-Level Cannibalization Count, I-Level Cannibalization Count, O-Level Labor
Hours, I-Level Labor Hours, and Depot-Level Labor Hours. However, the lack of
subcomponent data at this level rendered this very useful database impractical and not
worth analyzing for our purposes. With that said it is hard to understand why a
component such as the GCU, which is known to have a high failure rate, and in turn
drastically affects cost and readiness. We had hoped to find large and detailed amounts
49
of data for components such this because of their impact on the Navy and knowing the
purpose of acquisition cost analysis systems such as VAMOSC and the CAPE
estimations is to project O&S cost of future weapon systems. The lack of component and
subcomponent data suggests these data fields did not include order-level data or man
hours utilized, which would have been essential to conduct a diagnostic analysis on cost
drivers’ estimation for future weapon systems. Furthermore, we are left with this question
-- why is such data, collected by the Navy, missing from the VAMOSC data base?

50
THIS PAGE INTENTIONALLY LEFT BLANK
51
V. CONCLUSIONS
A. SUMMARY
The data systems used by the DoD have to be treated as an investment. These
systems are tools that not only keep spending in the spotlight, but also allow maintenance
professionals to implement cost-avoidance methods. Those methods which involve
observing changes to man-hours, lead times and cannibalization or consumption rates, are
necessary to make smart maintenance and budgetary decisions. Although the
Maintenance Data System (MDS) already provides information available to support a
bird’s eye view of combined unit operating cost for top tier commands’ decision-making,
it denies a comprehensive view of low-level commands’ best practices, limiting the
ability of Cost Assessment and Program Evaluation (CAPE) and other such entities to
make accurate cost estimations.
In this thesis, we constructed Pivot Tables to provide a view of cost and
operations across the merging of AFAST and DECKPLATE datasets. We demonstrated
the value of this multiple-data set view of the data in several examples. Our ability to
organize data from multiple sources into groups allowed identification of trends;
establishing highs and lows in quantities ordered and other useful analyses. The Pivot
tables we created can isolate dates where noticeable changes occur, which can help
pinpoint the cause of the change or at the very least, narrow the search. For example, in a
hypothetical scenario we could assume the Active Electronically Scanned Array
(AESA)’s system installation on the F/A 18, illustrated in Figure 1, represents the root
cause of the sudden increase of GCU failures. The AESA’s system was installed in 2005
and the data range used in our analysis did not cover this time period. However, we
believe the methods we used would support this assumption.
The answer to our primary research question is equivocal: based on our analysis,
data systems do not appear to be capturing all the data necessary for decision making at
the Organizational and Intermediate Levels. While we were able to find useful
information about the GCU at the Organizational and Intermediate levels, we
52
encountered limitations in the data. Data from two primary sources were merged,
however this merged view still produced an incomplete picture. The data lacked the
necessary detail required to accurately predict proper inventories, safety stocks, and costs
associated with Organizational, Intermediate, and Depot-level maintenance. Some data
sources, which we thought would prove useful, lacked sufficient granularity to support
our analysis.
Specifically, the consolidation of man-hours, lack of data regarding Awaiting
Maintenance (AWM) times, and the misleading representation of Elapsed Maintenance
Time (EMT), made it difficult, if not impossible, to make accurate assumptions regarding
safety stocks and inventory levels. In regards to the parts and materials being ordered, the
data captured combined with the ability to assign that part to a Job Control Number
(JCN), provided an opportunity to identify trends in failed parts and the ability to group
them.
Given our experience in the fleet and knowledge of the data being collected, we
believe current systems are capturing the necessary data to make cost effective
maintenance decisions at the Organizational and Intermediate levels, however, as the data
is consolidated and pushed upstream critical data fields are left out, and not represented
in a consolidated data system. We had hoped the merging of AFAST and DECKPLATE
data would provide the necessary information, but it did not, therefore we cannot
definitely say current data systems capture the necessary data to make cost effective
maintenance decisions at the Organizational and Intermediate levels.
B. RESEARCH LIMITATIONS
We were unable to obtain a DECKPLATE account in order to explore the
capabilities of the database and verify the current data collected. However, pursuing a
DECKPLATE account was not necessary because our sponsors at NAVAIR provided
pre-filtered data, containing a merging of databases utilized by the DoD. This data proved
to be very useful. We would recommend that similar access be made available to all
maintenance officers in the fleet. This access would provide aviation maintenance
53
professionals with valuable information that could be used to improve decision making
and allow a more proactive approach to inventory control, logistics, and maintenance
support.
VAMOSC although a great tool for capturing the cost of major components, such
as the F/A-18 or the F-35, did not provide the same capabilities at the subcomponent
level. For example, the F/A-18 Type/Model/Series (TMS) CAPE shows costs associated
with the TMS at levels starting from personnel, labor hours, parts, and overhead, all the
way down to the Organizational level cost of parts and materials. However, because a
component or subcomponent, such as a mission computer or radar system that is part of
the same TMS, would not have the same detail; thus, the possibility of seeing O&S costs
at the basic component level was not available. VAMOSC is very useful at capturing
detailed data at the weapon system level (e.g., F/A-18 Super Hornet program) as Table 3
shows. However, the history of GCU failures cannot be tracked or analyzed with
VAMOSC data.
AFAST’s data is limited to spending, so pairing it with other data is time
consuming and difficult. AFAST did bring additional awareness, raising questions like:
“Why doesn’t your organizations’ spending match other sister commands?,” “Why has
spending increased on particular items?” and most importantly, “What are others doing
right so that those better business practices can be implemented across the board?”
AFAST did not contain the same level of detail as DECKPLATE, which is
understandable because DECKPLATE incorporates more databases to its centralized
warehouse. We encountered instances in which data was captured by DECKPLATE but
was missing from AFAST, even though AFAST should have captured the data. For
example, the JCN was located at both databases; however, AFAST had blank fields
containing no data.
Our research could have benefited from more data fields, specifically AWM
reason codes which represent a reason for maintenance to stop and accounts for
maintenance hours between worked maintenance hours. Table 13 is a list of AWM codes
and their meaning:

54
Table 13. List of AWM Codes and their Meaning
Knowing the times associated with the AWM codes in Table 13 would
dramatically improve the usefulness of this data. For example knowing the Waiting Parts
(WP) would define how long a system had to wait for parts or materials to arrive before
maintenance could continue repairing the component. Having this data field and grouping
components in this manner would provide better insight when calculating the quantities
of materials needed to maintain readiness.
C. RECOMMENDATIONS
In conducting our analysis, we found we needed data from multiple sources, and
we found data integrity issues which seemed to revolve around data capture, which
hampered our analysis. Hence, we recommend removing as much of the manual input to
the system as possible, accompanied by the merging of data collecting sources to tie
information together. We believe this is essential to maximizing the use of the vast
amounts of data collected by the DoD.
Adopting a data system that works to consolidate collected data would increase
the number of ways we can compare and measure data. Consolidating data views to
facilitate the sort of analysis we report in this thesis is an approach which will empower
aviation maintenance professionals to take a more proactive role instead of the reactive,
budgetary role currently employed. Such a system would fill in gaps we found in our
analysis when using AFAST data, and trying to use VAMOSC data.
Based on our analysis of the data we extracted, we have come to believe that
maintenance systems in O and I-level maintenance organizations should be merged and
completely seamless, and these systems should interact with a single supply system that
55
can match locations, dates, and times to materials. These data should be provided in real
time, or as close to real time as possible, throughout a single maintenance and supply
system used by the DoD. Maintenance hours should not be the only time that is tracked
because in-work date and date completed do not provide enough information. A supply
system that provides the time that a part spends in the supply system and all the other
steps or stops along the way is extremely valuable. These times can be used to calculate
wait times and identify bottlenecks. These time periods should match maintenance data
systems times entered for work being stopped and/or awaiting parts. Trouble shooting
and logistics supporting times must be accurately factored in. These seamless systems
should be able to provide current, as well as historic, logistics data.
Knowing when and where parts and materials are, and who is ordering or
consuming them, can be used to determine whether the process, location, and installation
could benefit from consolidation. Maintenance systems need to be designed to track
installed components and flag their time in service by capturing the service life of
components in their intended environment. Decision-makers would have the ability to see
the mean time between failures of the components that make up the weapon system. This
data, in conjunction with accurate lead times and consumption rates, can be used to
provide better estimates on safety stocks and improve the cost and accuracy of inventory
management.
Naval aviation professionals are proud of the amount and richness of the data
collected by the fleet. However, we occasionally encountered data that in our opinion and
experience as naval maintenance officers was questionable. We believe our databases are
limited by human input errors, and missing data fields, thus resulting in significant
limitations regarding the data available for research. Incorporating more automation in
our data collecting system, while, keeping no value added redundancy out would reduce
the chance of human error.
D. CONCLUSIONS
The DoD has access to all of the information described in this chapter and for the
most part, is actively collecting this information in multiple data systems that are not
linked. It would require extensive amounts of time and money to filter and organize this
56
information into useful data, but a data system that could consolidate this information has
the potential to save time and money. A consolidated system would meet the needs of
multiple entities in the DoD, from budgeting to manpower, contracting to trouble
shooting weapon systems. This would be a worthwhile investment that should and can
be, based off of existing technology. This data collection and the interactive analysis
tools are essential to all decision makers while implementing cost related decisions
moreover these tools could bring the current reactive mind set to a change, that would
add cost avoidance technics initiated placed at hands of the leaders at the lowest levels.
Our hope is that we have furthered the discussion for the extensive use of automated data
collection systems, and added to the momentum for improved implementations of
standardized data collection and organization processes throughout the DoD.

57
LIST OF REFERENCES
Commander, Naval Air Systems Command. (2010, June). Air vehicle systems propulsion and power, E/F/G GCU reliability/availability/growth issues. Naval Air Systems Command, MD: Author. Presentation Slide 3.
Commander, USAMC Logistics Support Activity (1997, May 30). Department of Defense handbook acquisition logistics. USAMC Logistics Support Activity: Author.
COMNAVAIRFORINST 4790.2B. (2012, May 15). The naval aviation maintenance program (NAMP). (CH14, p14–62) Washington, DC: Author.
Cramer, H. (1946). Mathematical methods of statistics. Princeton, NJ: Princeton University Press.
Romero, A. T., II, & Elliott, D. B. (2009, December). Developing a United States Marine Corps organizational and intermediate level maintenance performance cost model (Master’s thesis, Naval Postgraduate School) Retrieved from http://handle.dtic.mil/100.2/ADA514397
Unger, E. J. (2009). An examination of the relationship between usage and operating-and-support costs of U.S. Air Force aircraft. Santa Monica, CA: RAND.
Visibility and Management of Operating and Support Costs (VAMOSC). (2012). Aviation type/model/series reporting user manual. Retrieved from https://www.vamosc.navy.mil/

58
THIS PAGE INTENTIONALLY LEFT BLANK

59
BIBLIOGRAPHY
AFAST. (2009). About AFAST. Retrieved from https://www.portal.navy.mil/comnavairfor/N42/N422/AFAST/Help/Training%20Aids/About%20AFAST.html
Birkler, J., Graser, J. C., Arena, M. V., Cook, C. R., Lee, G. T., Lorell, M. A., & Grossman, J. (2001). Assessing competitive strategies for the joint strike fighter: Opportunities and options. Santa Monica, CA: RAND.
COMNAVAIRFORINST 4790.2B. (2012, May 15). The naval aviation maintenance program (NAMP). Washington, DC: Author.
Cooper, R., & Kaplan, R. S. (1988a, April). How cost accounting distorts product costs. Retrieved from http://www.business.aau.dk/~hojen/indexfiler/4scm/CostAccountingDistortsProductCosts.pdf
Cooper, R., & Kaplan, R. S. (1988b, September–October). Measure costs right: Make the right decisions. Harvard Business Review. Retrieved from http://host.uniroma3.it/facolta/economia/db/materiali/insegnamenti/588_3930.pdf
Cost Analysis Improvement Group (CAIG). (2007), Office of the Secretary Of Defense Cost Analysis Improvement Group. Retrieved from http://www.navair.navy.mil/air40/air42/toc_files/o_s_cost_estimating_guide_oct_2007.pdf
Cramer Harald. (1946). Mathematical methods of statistics. Princeton, NJ: Princeton University Press.
DeLozier, R. C., & Wilkinson, V. K. (1986, September). A method for forecasting repair and replacement needs for naval aircraft: Phase II. Retrieved from http://www.ornl.gov/info/reports/1986/3445600709623.pdf
DECKPLATE. (2012). Decision knowledge programming for logistics analysis and technical evaluation. Retrieved from http://www.navair.navy.mil/logistics/deckplate/
DoD 5555.4M, Cost Analysis Guidance and Procedures. Assistant Secretary of Defense, December 1992. Retrieved from http://www.dtic.mil/whs/directives/corres/pdf/500004m.pdf
DoDI 5000.02, Operation of the Defense Acquisition System. Retrieved from http://www.dtic.mil/whs/directives/corres/pdf/500002p.pdf
60
Dixon, M. C. (2006). The maintenance costs of aging aircraft: Insights from commercial aviation. Santa Monica, CA: RAND.
Government Accountability Office (GAO). (2010, July 20). DoD needs better information and guidance to more effectively manage and reduce operating and support cost of major weapon systems (GAO-10–717). Washington, DC: Author.
Hua, Z. S., Zhang, B., Yang, J., & Tan, D. S. (2007). A new approach of forecasting intermittent demand for spare parts inventories in the process industries. The Journal of the Operational Research Society, 58(1), 52–62.
Military Standard (MIL-STD). (1983, April 11). Logistic support analysis (MIL-STD-1388–1A). Washington, DC: Author.
Naval Air Systems Command. (2010). E/F/G GCU reliability/availability/growth issues. [power point presentation for CAPT Darrah]Retrieved from Naval Air Systems Command.
Naval Air Systems Command. (2008, December 12). F/A-18 Hornet strike fighter. Retrieved from http://www.navy.mil/navydata/fact_display.asp?cid=1100&tid=1200&ct=1
OPNAV INSTRUCTION 3000.12A: Operational availability handbook, a practical guide for military systems, sub-systems and equipment. Washington, DC: Department of the Navy. Retrieved from http://doni.daps.dla.mil/Directives/03000%20Naval%20Operations%20and%20Readiness/03–00%20General%20Operations%20and%20Readiness%20Support/3000.12A.pdf
Romero, A. T., II, & Elliott, D. B. (2009, December). Developing a United States Marine Corps organizational and intermediate level maintenance performance cost model (Master’s thesis, Naval Postgraduate School). Retrieved from http://handle.dtic.mil/100.2/ADA514397
Tyszkiewicz , M. T., & Daggett, S. (1998, December 9). A defense budget primer. Retrieved from http://www.fas.org/sgp/crs/natsec/RL30002.pdf
Unger, E. J. (2009). An examination of the relationship between usage and operating-and-support costs of U.S. Air Force aircraft. Santa Monica, CA: RAND.
United States Navy. (2009, May 26). F/A-18 Hornet strike fighter. Retrieved from http://www.navy.mil/navydata/fact_display.asp?cid=1100&tid=1200&ct=1
Visibility and Management of Operating and Support Costs (VAMOSC). (2012). About VAMOSC. Retrieved from https://www.vamosc.navy.mil/
61
INITIAL DISTRIBUTION LIST
1. DefenseTechnical Information Center Ft. Belvoir, Virginia 2. Dudley Knox Library Naval Postgraduate School Monterey, California