Embed Size (px)
Citation preview

The Energy Evolution
an analysis of alternative vehicles and fuels to 2100
A publication of The National Hydrogen Association
© 2009

Page i
Abstract
The Energy Evolution
Abstract //
Every day, we hear about a more environmentally friendly vehicle or fuel with the potential to reduce our de-pendence on oil. We know we need alternatives but, when there are so many options, even the most educated consumer can get confused.
Several alternative energy vehicle systems and fuels are constructive choices in the near- and mid-term; each one plays a role in transitioning America away from our dependence on petroleum when we drive. The Energy Evolution: An Analysis of Alternative Vehicles and Fuels to 2100 compares more than 15 of the most promising distinct fuel and vehicle alternatives over a 100-year period, in scenarios where one fuel and vehicle alternative becomes dominant in the vehicle mix over time. The scenarios evaluate the performance and viability of each alternative in terms of impact on greenhouse gases, urban air pollution, oil imports, and societal costs.
This report presents an analysis and discussion of the key findings from this comprehensive study, assess-ing environmental sustainability, energy security and economic vitality, in the context of America’s passenger vehicle transportation system. A huge amount of research exists to support the findings. However, for the purposes of the report, the information presented will focus upon the four primary alternatives pursued by the major automotive original equipment manufacturers. The results of other fuel/vehicle scenario simulations are discussed where appropriate.
The electronic version of this report and the complete body of research supporting this report can be found on the National Hydrogen Association’s website at http://www.hydrogenassociation.org/evolution. Where pos-sible, references to additional research are provided in this report, to make it easier for readers to both find and navigate through the data.
Key Conclusions //
A scenario in which
hydrogen-powered fuel
cell vehicles dominate
the marketplace is the best
scenario for America.
Hydrogen used in a fuel cell vehicle
(FCV) is the only transportation fuel
that could, in conjunction with hybrids,
plug-in hybrids and biofuels, cut
greenhouse gas (GHG) pollution by
80 percent below 1990 levels and
simultaneously:
allow America to reach petroleum •
energy quasi-independence* by
mid-century
eliminate nearly all controllable •
urban air pollution, by the end of the
century; and
reduce societal costs by up to •
$600 billion per year by 2100.
The cost of building a
hydrogen fueling infra-
structure is affordable,
though government incentives
will be needed to support the
introduction of the hydrogen and fuel
cell vehicle transportation solution.
It will cost about $9 billion to add 6,500
hydrogen pumps to existing gasoline
stations over the next 10 years.
Costs will outpace revenues for the
next 11 years, by approximately $300
million per year. This $3.2 billion
shortfall could be made up through
private venture capital or government
incentives. By 2023, analysis
indicates revenues will be sufficient to
have paid back this investment in full.
By 2018, hydrogen fuel providers will
make a 10 percent, after-tax return
on investment, reducing the need
for government incentives to build
and maintain the infrastructure after
that time.
Like today's purchasers of hybrid
vehicles, initial FCV owners will have
to pay extra for their zero-emission
vehicles but, over time, as volumes
increase, production costs will
decrease.
The National Research Council
(NRC), in its 2008 report on hydrogen
and fuel cell vehicles, estimates
the total government investment to
offset the initially-higher costs of both
fuel cell vehicles, and subsidizing
the hydrogen infrastructure, will
be about $48 billion over 15 years
($40 billion for FCVs and $8 billion
for infrastructure). The Oak Ridge
National Lab estimates even lower
government incentives might be
required for infrastructure.
All the hydrogen needed
to fuel hydrogen-powered
vehicles can be produced
from domestic energy sources.
This can mitigate the impact of
energy price fluctuations and
macroeconomic risks that flow from
our heavy dependence on imported
oil and leaves us less dependent on
energy from regions that are beset
with political risk.
Accelerated investment is
needed now.
Hydrogen, along with
several technologies and fuels, plays
an important role in the evolution
of America's passenger vehicle
transportation system away from
petroleum. More action, investment
and commitment is needed today,
publicly and privately, to transition these
technologies into tomorrow.
321
4
*The point where oil consumption in the light duty vehicle sector can be met with current US domestic oil production

Page ii
Table of Contents
The Energy Evolution
Table of Contents //
1.0 Executive Summary page 1
2.0 Key Findings page 6
3.0 Approach page 10
3.1 Vehicle/Fuel Scenarios page 11
3.1.1 Vehicle/Fuel Combination Comparison Matrix page 13
3.2 Report Assumptions page 14
3.2.1 Computer Simulation Models Assumptions page 14
3.3 Report Research page 15
3.4 Simulation Models page 15
3.5 Industry Cooperation & Independent Review page 16
3.6 Comparison with National Research Council Report page 16
4.0 Assessing Environmental Stability page 18
4.1 Greenhouse Gas Impacts: Vehicle/Fuel Scenario Highlights page 19
4.1.2 Greenhouse Gases per Vehicle Rankings page 20
4.2 Urban Air Pollution Impacts: Vehicle/Fuel Scenario Highlights page 21
4.2.1 Urban Air Pollution per Vehicle Rankings page 21
4.3 Non-sustainable Fuel Options page 22
5.0 Assessing Energy Security page 24
5.1 Oil Consumption Impacts: Vehicle/Fuel Scenario Highlights page 25
5.1.2 Oil Consumption per Vehicle page 26
5.1.3 Oil Consumption per Vehicle over Time page 26
6.0 Assessing Economic Vitality page 27
6.1 Societal Costs Impacts: Vehicle/Fuel Scenario Highlights page 28
6.1.2 Societal Costs per Vehicle Rankings page 29

Page iii
Table of Contents
The Energy Evolution
Table of Contents //
Figures //
6.2 Hydrogen Infrastructure Cost Analysis page 30
6.2.1 Fueling Station Capacity Factor page 31
6.2.2 Hydrogen versus Gasoline Infrastructure Costs page 31
6.3 Hydrogen Infrastructure Costs versus Societal Savings page 31
6.4 Commercial Hydrogen Cost Perspective page 33
6.5 Comparison of Other Hydrogen Infrastructure Cost Estimates page 34
6.5 Early Vehicle Costs page 36
7.0 Conclusions page 37
8.0 Glossary page 39
1.0 Environmental, Energy Security and Economic Vitality Impacts of Four Major Vehicle/Fuel Scenarios
page 2
3.1 Vehicle/Fuel Combinations page 12
4.1 Greenhouse Gas Pollution for the Four Main Vehicle/Fuel Scenarios page 19
4.1.2 Greenhouse Gas Pollution Reduction Factors Relative to ICEVs page 20
4.2 Urban Air Pollution Costs for the Four Main Vehicle/Fuel Scenarios page 21
4.2.1 Urban Air Pollution Cost Reduction Factors Relative to ICEVs page 22
5.1 Oil Consumption for the Four Main Vehicle/Fuel Scenarios page 25
5.1.2 Oil Consumption Reduction Factors Relative to ICEVs page 26
6.1 Total Societal Costs for the Four Main Vehicle/Fuel Scenarios page 28
6.1.2 Total Societal Cost Reduction Factors Relative to ICEVs page 29

Page iv
Table of Contents
The Energy Evolution
Figures //
Appendices // Available by request from the National Hydrogen Association
6.3a Annual Societal Cost Savings vs. Annual Hydrogen Infrastructure Costs (to 2100)
page 32
6.3b Annual Societal Cost Savings vs. Annual Hydrogen Infrastructure Costs (to 2025)
page 32
6.4a Costs, Revenues and Net Cash Flow for Hydrogen Fueling Station Owners (to 2100)
page 33
6.4b Costs, Revenues, Annual Net Cash Flow and Cumulative Cash Flowfor Hydrogen Fueling Station Owners (to 2025)
page 33
6.5 Government Investment Required to Incentivize a Hydrogen On-Site Fueling System
page 34
6.6 Fuel Cell Vehicle Market Share Comparisons page 36
1 Hydrogen 101
2 Transportation Scenario Assumptions
3 Marginal Grid Mix and GHG, Inputs
4 Natural Gas Resources, Inputs
5 Transportation Market Matrices
6 Computer Simulation Sensitivity Studies
The Energy Evolution
1.0
Executive Summary

Page 2
Executive Summary
The Energy Evolution
The economic progress of the last century has been built largely on petroleum. However, growing global de-mand for, and a finite supply of, oil makes it imperative for us to look for different ways to power our society.
Every day we hear about a more environmentally friendly fuel or vehicle with the potential to reduce our dependence on oil. We know we need alternatives: ones that are secure and locally available; that will improve the environment, not pollute it; that will be available for many generations to come; and that are economically viable. But when there are so many options, even the most educated consumer can get confused. Are gasoline hybrids the solution? Will plug-in hybrids, fueled with ethanol or gasoline, meet our long-term needs? Will battery electric cars ease our oil dependence? Are hydrogen vehicles viable?
The fact is, over the course of this century, the cars we drive, and the fuels we use for transportation, will change. They have to, if we are to reduce greenhouse gas pollution, urban air pollution, our con-sumption of oil, and the costs we pay as a society because of our dependence on oil for transportation.
The Energy Evolution Results //
Many viable alternative fuel/vehicle technologies already exist or are under development that could help us approach a sustainable automotive transportation system. By analysing scenarios that assume each alternative becomes predominant over the course of the century (in a vehicle mix that may include a combination of other vehicles, such as hybrids, plug-ins, biofuels, battery electric and hydrogen vehicles) the research behind The Energy Evolution report determines the impact of each upon the environment, energy security, and the economic vitality of the United States of America.
oil consumption: billion barrels per yeargreenhouse gas pollution: billion tonnes CO2 equivalent per year
urban air pollution costs: $US billion per year total societal costs: $US billion per year
Figure 1.0
These four graphs
clearly show that, of
the four major fuel/
vehicle alternatives
being developed by
automotive OEMs, the
hydrogen powered
fuel cell vehicle is the
only one which (when
dominant in a mix of
vehicles over time)
can reduce green-
house gas pollution to
80 percent below 1990
levels, and simultane-
ously reduce oil con-
sumption, eliminate
nearly all controllable
urban air pollution;
and reduce societal
costs by $600 billion
per year by the end of
this century.
2010 2100
3.0
1.5 1990 GHG levels
60% below 1990 GHG levels
80% below 1990 GHG levels
GICEV
GHEV
GPHEV
EtPHEV
BEV
HFCV
2010 21002060
8.0
4.0
GICEV
GHEV
GPHEVEtPHEV
HFCV, BEV, HICEV energy quasi-independence †
2010 2100
60
30
GICEV
GHEV
GPHEVEtPHEV
BEV
HFCV
particulate matter from tire and brake wear
2010 2100
700
350
GICEV
GHEV
GPHEVEtPHEV
BEVHFCV
KEY gasoline plug-in hybrid electric vehicle scenario
ethanol plug-in hybrid electric vehicle scenario
hydrogen fuel cell vehicle scenario
battery electric vehicle scenario
gasoline hybrid electric vehicle scenario
gasoline internal combustion engine vehicle scenario

Page 3
Executive Summary
Gasoline hybrid electric
vehicles (HEVs) will cut
the growth rate of GHGs,
oil consumption and urban air pol-
lution in the near-term, but all three
will continue to rise as the number
of vehicles on the road, and miles
travelled per vehicle, increases.
Gasoline plug-in hybrids
(GPHEVs)—assuming the
lithium ion batteries
required become affordable and
achieve their specific energy goal
of 150 watts per kilogram; and up to
75 percent of vehicles are able to
recharge at night, on a “greener,” low-
carbon grid—could cut pollution and
oil use. But, as vehicle miles travelled
grow over time, GHG pollution would,
at best, return to just below 1990
levels. Oil consumption would remain
at 2.5 million barrels per year. Urban
air pollution would increase. Societal
costs would decrease by about $200
billion per year by the end of the cen-
tury, compared to gasoline HEVs.
Ethanol PHEVs
(EtPHEVs)—assuming
most ethanol is made from
biomass other than corn
kernels, and production increases
to approximately 120 billion gallons
per year, compared to the seven
billion gallons per year produced
today—could cut GHG pollution to 25
percent below 1990 levels and cut oil
consumption to two billion barrels per
year (still four times the energy quasi-
independence level). They would also
reduce societal costs by $250 billion
per year by 2100, compared to gaso-
line HEVs. However, they would make
no improvement in urban air pollution
over gasoline PHEVs.
Battery electric vehicles
(BEVs)—assuming afford-
able batteries are developed,
providing consumers with 250-300
mile range and fast recharge times
of less than 20 minutes—could cut
GHGs to 60 percent below 1990 lev-
els. They would also allow America to
achieve energy quasi-independence.
Finally, they would eliminate almost
as much urban air pollution as hy-
drogen vehicles, and reduce societal
costs by almost as much as FCVs.
Hydrogen internal com-
bustion engine hybrids
(HICEVs) could
cut GHGs to approximately 70
percent of 1990 levels and cut oil
consumption by the same amount
as FCVs. They would reduce urban
air pollution to slightly below today’s
levels, though levels would increase
by 2100 if all hydrogen were burned
in ICEs. Finally, they would reduce
societal costs by almost as much
as FCVs.
1
2
4
5
3
The Energy Evolution
The Role of Hydrogen //
As the graphs in Figure 1.0 illustrate, The Energy Evolution research finds that only one fuel, hydrogen, in a fuel cell vehicle (FCV), (as part of a mix of fuels and vehicles on the road, including hybrids, plug-in hybrids and biofuels) can cut greenhouse gas (GHG) pollution to 80 percent below 1990 levels and simultaneously:
allow America to reach petroleum energy quasi-independence by mid-century •(meaning a reduction in the use of petroleum by the transportation sector to such an extent that, in a crisis, all remaining non-transportation and critical transporta-tion needs could be fulfilled using U.S. domestic resources).eliminate nearly all controllable urban air pollution.•reduce societal costs* by $600 billion per year by 2100, compared to today’s gasoline •internal combustion engines, and by $420 billion compared to gasoline hybrids.
This hydrogen FCV scenario assumes vehicle costs become competitive; that hydrogen is affordable, available and production transitions over time to cleaner, low-carbon sources; and that fuel cell vehicles become predominant over time in a vehicle mix that includes hybrids, plug-in hybrids and biofuels.
The Other Alternatives //
The other mainstream fuel/vehicle options (battery electric vehicles and internal combustion hybrid elec-tric vehicles fueled by gasoline, diesel, ethanol and hydrogen) may play an important role in making the transition away from petroleum-based fuels. Development of hybrid vehicles synergistically advances de-velopment of the electric drive train and battery storage needed in fuel cell electric vehicles, for example.
*societal costs:
the monetized costs of
GHG pollution, urban
air pollution, and oil
consumption (includ-
ing the military costs
of defending imported
oil)

Page 4
Executive Summary
The Energy Evolution
Two other alternatives exist that are considered a way to reduce the impact of gasoline for transporta-tion. Neither option is sustainable, long-term, as both rely on finite fossil fuels.
Diesel internal combustion vehicles• (ICEVs) will have minimal environmental impact (if they replaced gasoline ICEVs); while they have slightly higher efficiency and consume less petroleum, the reduction in GHGs compared to using gasoline is very small compared to other options such as biofuels or FCVs.Natural gas vehicles • (NGVs) would diversify our energy sources and have a greater environmental impact than diesel and gasoline ICEVs because natural gas burns more cleanly. Natural gas HEVs would keep GHGs close to today’s levels (but still higher than the target 1990 levels) and natural gas PHEVs would reduce GHGs to approximately 20 percent below 1990 levels.
The Energy Evolution Assumptions //
In addition to the assumption that all technical and economic issues are resolved with respect to the dif-ferent vehicle alternatives, as described above, a number of fuel source assumptions are also made:
hydrogen is made initially from natural gas, transitioning to hydrogen from bio-•mass, from coal with carbon capture and storage (CCS), from natural gas with CCS and, eventually, from electrolysis of water using renewable and nuclear electricityelectricity to charge PHEVs and BEVs is assumed to be made from the west coast •grid mix (less coal generation and more hydroelectricity than the rest of the nation), transitioning to more renewable electricity, coal with CCS, and more nuclear power
PHEVs have all-electric ranges between 12 to 52 miles, and derive 18 percent to •65 percent of their energy from the electrical grid
ethanol for PHEVs is made initially from corn, transitioning to hemi-cellulose •and cellulose feed stocks over the century, with production of cellulosic ethanol or equivalent rising to 120 billion gallons per year by mid-century
In terms of market penetration, the models assume alternative vehicles will enter the market accord-ing to S-shaped logistics curves, modified as needed to keep the annual growth in new vehicle sales below 300,00 in any one year, with HEVs reaching the potential for 50 percent of annual sales by 2024; PHEVs by 2031 and FCVs by 2035. In addition, multiple types of alternative vehicles are assumed to be sold each year.
Why Hydrogen? //
Consumers need not sacrifice their lifestyles to benefit from using hydrogen and, in fact, could improve their way of life. Fuel-efficient FCVs can be made to look, feel and refuel like today’s automobiles, yet offer a smoother, quieter, zero-emission ride. The fueling infrastructure supporting large volume deploy-ment of FCVs can be commercially viable in the range of $2-3 dollars per gallon of gasoline equivalent. One kilogram of hydrogen has approximately the same energy content as one gallon of gasoline and so, assuming hydrogen costs $4-6 per kilogram and that a fuel cell is at least twice as efficient as an internal combustion engine, the cost per mile in a FCV would be similar to that of gasoline at $2-3 per gallon used in a conventional gasoline car.
Great progress has been made in the last decade in hydrogen production, storage, and delivery, and FCV and distributed energy technologies. Though many challenges face the full implementation of the

Page 5
Executive Summary
The Energy Evolution
virtually pollution-free economy enabled by hydrogen, solutions to those challenges are within reach and, in many respects, are prone to fewer side effects than the alternatives. They can be attained with less investment than that for maintaining the existing oil and gas infrastructure, while reaping staggering societal cost savings (as illustrated in the Figure 1.0) that come from cleaner air and less dependence on foreign energy resources.
Even broader economic benefits will accrue as a result of adopting hydrogen, positively affecting America’s ability to compete in the global economy and its ability to draw on a variety of different sourc-es of energy. The benefits of energy source diversity cannot be overstated. Each of the energy sources for hydrogen production is, to a greater or lesser extent, produced domestically. This has the effect of mitigating the impact of energy price fluctuations or macroeconomic risks that flow from our heavy dependence on imported oil and leave us less dependent on energy from regions that are beset with political risk. An even greater benefit, however, flows from hydrogen’s effect on the competitive forces that contain costs. Hydrogen’s ability to draw on multiple energy sources encourages greater competi-tion within the energy industry, rather than steering investment toward a single source and recreating the heavy dependency we now have on petroleum. This should lower the cost of energy, improve the cost competitiveness, and increase the rate of return on investing and producing goods and services in the United States.

The Energy Evolution
2.0
Key Findings
Page 7
Key Findings
The Energy Evolution
2
1
3
There is no silver bullet solution for making our passenger vehicle transportation system sustainable.
A mix of transportation fuels and vehicles will transition America towards a more secure, environmentally-sustainable and economically viable and vital energy future.
Gasoline hybrid vehicles may cut the growth of greenhouse gases, urban •air pollution and oil consumption. However, over time, these reductions will decrease, and oil consumption will increase as the number of vehicles grows and as those vehicles travel more each year.Gasoline plug-in hybrids will help reduce greenhouse gas pollution back •to below 1990 levels, but only if batteries become affordable and electricity from the grid becomes “greener.”Ethanol plug-in hybrids will cut greenhouse gas pollution to about 25 •percent below 1990 levels by 2100, but only if cellulosic ethanol produc-tion becomes viable.
Hydrogen, in a fuel cell vehicle (as part of a mix of fuels and vehicles on the road, including hybrids, plug-in hybrids and biofuels) is the only transporta-tion fuel that can cut greenhouse gas (GHG) pollution by 80 percent below 1990 levels and simultaneously:
help America reach petroleum energy quasi-independence by mid-century; •eliminate nearly all controllable urban air pollution, by the end of the •century; andreduce societal costs (the monetized costs of GHG pollution, urban air •pollution, and oil consumption (including the military costs of defend-ing imported oil)) by $600 billion per year by 2100, compared to today’s gasoline internal combustion engines, and by $420 billion compared to gasoline hybrids.
All the hydrogen needed to fuel hydrogen-powered vehicles can be pro-duced from domestic energy sources.
This has the effect of mitigating the impact of energy price fluctuations or macroeconomic risks that flow from our heavy dependence on imported oil and leaves us less dependent on energy from regions that are beset with political risk. It also allows the U.S. to choose the resources that make the most economic and environmental sense.
We know how to make clean hydrogen and its production will transition over time, as volumes increase and technology develops.
Today, most hydrogen is made by reforming natural gas (a non-renewable, transitional re-source), or using electricity which can also produce emissions. However, hydrogen production will transition to renewables and other emission-free technologies, including nuclear. Even today’s hydrogen offers environmental benefits as a transportation fuel, when compared to gasoline: hydrogen made from natural gas and used in a fuel cell car produces about half of the well-to-wheels greenhouse gas emissions of a gasoline internal combustion vehicle, because a fuel cell car is two to three times more efficient.
4

Page 8
KeyFindings
The Energy Evolution
5
7
6
The cost of building a hydrogen fueling infrastructure is affordable
Coordinating the addition of on-site hydrogen fueling systems to match the introduction of FCVs in a geographic region minimizes the infrastructure costs per vehicle and maximizes the utilization of that infrastructure.
The Energy Evolution analysis shows it will cost approximately $9 billion to add 6,500 hydro-gen fueling pumps to existing gasoline stations over the next 10 years.
Costs will outpace revenues for the next eleven years, by approximately $500 million per year. The $3.2 billion shortfall could be made up in the form of private venture capital, or in the form of government incentives. By 2023, analysis indicates revenues will be sufficient to have paid back this investment in full.
By 2018, hydrogen fuel providers will make a 10 percent, after-tax return on investment, negating the need for government incentives to build and maintain the infrastructure after that time.
The cost of producing initial fuel cell vehicles will be greater than the cost of conventional gasoline cars.
However, over time, with increased volume in production, fuel cell vehicle costs should come down. Like today's purchasers of hybrid vehicles, initial fuel cell vehicle owners will have to pay extra for their zero-emission vehicles.
Government incentives will be needed initially to support the introduction of the hydrogen and fuel cell vehicle transportation solution.
The National Research Council (NRC), in its 2008 report on hydrogen and fuel cell vehicles, estimates the total government investment to offset the initially-higher costs of fuel cell ve-hicles, and of subsidizing the hydrogen infrastructure, will be about $48 billion over 15 years ($8 billion for infrastructure and $40 billion for fuel cell vehicles). The Oak Ridge National Lab estimates even lower government incentives might be required; as low as $1.5 billion to $8 billion for the hydrogen infrastructure, and $6.5 billion to $21 billion cumulative over the next 25 years for fuel cell vehicle buy-down incentives. Either level of investment would be minor compared to the societal savings estimated to reach $400 billion to $600 billion per year by the end of this century.
Hydrogen, along with a number of other technologies and fuels, plays an important role in the evolution of America’s passenger vehicle transporta-tion system away from petroleum.
Viable technologies and alternatives exist today, but more action, investment and commit-ment is needed today, publicly and privately, to transition these technologies into tomorrow.
8

The Energy Evolution
3.0
The Energy Evolution Approach

Page 10
Approach
Alternative vehicles will be introduced into the transportation market over many decades and fuel sources will change over time, particularly as carbon constraints are imposed. As mentioned Alternative vehicles will be introduced into the transportation market over many decades and fuel sources will change over time, particularly as carbon constraints are imposed. As mentioned earlier, The Energy Evolution consid-ers a number of fuel/vehicle scenarios that show the gradual introduction of new vehicle types (with a dominant alternative in each scenario by 2100) and estimates the benefits to society of each fuel/vehicle combination.
While the research behind this report evaluates scenarios for 15 fuel/vehicle alternatives, the report is focused primarily on the four fuel/vehicle combinations most actively pursued by the world’s major automotive companies:
The Energy Evolution
gasoline hybrid
electric vehicles
gasoline plug-in hybrid
electric vehicles
ethanol plug-in hybrid
electric vehicles
hydrogen fuel cell
vehicles1 2 3 4
The ground rules for The Energy Evolution research were simple:
Evaluate plausible fuel/vehicle alternatives on the basis of their relative attributes to •contribute to environmental sustainability, energy security, and economic vitality.Rely only upon credible, peer reviewed publications and assumptions for the re-•search behind this report.Use simulation models as needed to provide new perspectives and insights.•
Several of the alternative energy vehicle systems prove to be very constructive choices in the near-term, as the report illustrates. Comparing and contrasting the various alternatives in the same context, rather than as stand-alone solutions (which is often the case when one vehicle or fuel alternative is being promoted over another), helps create clarity about the path forward in terms of America’s passenger transportation system. Evaluating the data in context builds understanding about the different benefits each fuel/vehicle scenario provides over the next 100 years, recognizing that what one fuel or vehicle of-fers today may not be of similar or equal benefit in the future. For example, hybrid vehicles today help us reduce greenhouse gas (GHG) pollution and our dependence on oil for transportation. However, this benefit diminishes if, over time, more and more miles are driven each year on our roads or if other alternatives evolve that offer more significant savings overall.
3.1 The Energy Evolution Fuel / Vehicle Scenarios //
While The Energy Evolution research considered six different vehicle types and six different fuels in the 100-year vehicle computer simulation, as shown in Figure 3.1 on Page 12, this report focuses on four dynamic scenarios to capture the essential differences between gasoline hybrid electric vehicles (HEVs), gasoline plug-in hybrids (PHEVs), ethanol PHEVs and hydrogen-powered fuel cell vehicles (FCVs). These are the primary vehicles and fuels being actively pursued today by most of the major automobile companies.

Page 11
Approach
The Energy Evolution
internal com-bustion engine vehicle (GICEV)
internal com-bustion engine hybrid electric vehicle (GHEV)
internal com-bustion engine plug-in hybrid electric vehicle
(GPHEV)
fuel cell hybrid electric vehicle
(FCV)
fuel cell plug-in hybrid electric
vehicle (FC PHEV)
battery electric vehicle (BEV)
fuel economy 1.00 1.39 1.39 2.45 2.45 n/a
gasoline REF x x n/a n/a n/a
diesel n/a x x n/a n/a n/a
natural gas x x x n/a n/a n/a
ethanol x x x n/a n/a n/a
hydrogen n/a x x x x n/a
electricity n/a n/a s n/a s x
Figure 3.1
This table illustrates the
fuel/vehicle combina-
tions considered in
the 100-year vehicle
simulation program (with
the four primary options
reviewed in this report
highlighted in orange).
The gasoline internal
combustion engine
vehicle is the comparison
reference. The top row
of the table shows the
assumed fuel economy
advantage of each alter-
native vehicle compared
to the reference.
x = primary fuel
s = secondary fuel
Notes on Scenarios
Gasoline HEV scenario: Sales of existing gasoline HEVs accelerate, reaching 50 percent of all vehicles sold by 2024 according to S-shaped logistic curves, modified as needed to keep annual growth in new vehicle sales below 300,000 in any one year, ending with 98 percent market share of all new car sales by 2100. All other vehicles are gasoline ICEVs, so this scenario captures the state of the transportation sector without any plug-in hybrids, battery electric vehicles (BEVs) or FCVs.
Gasoline PHEV scenario: Gasoline PHEV sales follow a logistics curve delayed by seven years compared to the gasoline HEV market penetration. The report assumes up to 75 percent of all vehicles can be charged at night. The remainder of the vehicle sales each year in this scenario are gasoline ICEVs and gasoline HEVs, with PHEV sales replacing HEVs and ICEVs in proportion to their prevalence on the road at that time.
Ethanol PHEV scenario: The report assumes ethanol PHEVs sales follow a similar logistics curve as the gasoline PHEV over the century, but with (cellulosic) ethanol production reaching 120 billion gallons per year by the 2060-2070 time period. All other vehicles are gasoline ICEVs or gasoline HEVs.
Hydrogen FCV scenario: FCV sales again follow a modified logistics curve delayed by eleven years com-pared to gasoline HEV sales, culminating in 98 percent of all vehicles sold by 2100. The remainder of the vehicle sales each year are composed of gasoline ICEVs, gasoline HEVs, gasoline and ethanol PHEVs, in proportion to their prevalence in the plug-in hybrid scenario for that year.
The following simulations were also considered:
Gasoline ICEV reference case: 100 percent conventional gasoline ICEVs with no hybrids or alternative fuels.

Page 12
Approach
The Energy Evolution
environmental
responsibility
climate change gases: the relative amounts •
of GHG contributions from each fuel/vehicle
system alternative
local air pollution: the relative amounts of •
non-GHG pollutants from each fuel/vehicle
system alternative
water usage: the relative amounts of local •
water usage from each fuel/vehicle system
alternative
•
energy
security
fossil fuel imports: the relative contribution •
to reducing fossil fuel imports (e.g., oil and
natural gas)
source diversity: the relative ability to draw •
upon multiple domestic energy sources
economic
vitality
additional infrastructure costs: the relative •
incremental cost of additional infrastructure
required for each fuel/vehicle system
life cycle ownership cost: the relative cost to •
own each fuel/vehicle system over the life of
the investment
consumer acceptance: the relative degree of •
consumer acceptance for each fuel/vehicle
system
national competitiveness: the relative benefit •
to national competitiveness provided by each
fuel/vehicle system (e.g. reduced dependence
on foreign energy sources, increased technol-
ogy intellectual property and expertise, and
energy cost stability)
321
BEV scenario: This scenario replaces the FCVs with grid-powered all-electric battery vehicles. No major auto-motive company is currently developing BEVs (with the possible exception of niche markets such as golf carts or very small “city cars”), presumably due to their limited range and long refueling time, so this scenario is unlikely unless there is a major breakthrough in battery or other electrical energy-storage technology.
Hydrogen ICE HEVs: This scenario replaces the fuel cell with an ICE, still powered by on-board hy-drogen and operating in the hybrid electric mode. While most automobile companies are focusing on FCVs, BMW, Mazda and Ford have been developing hydrogen-powered ICEs for many years.
Hydrogen fuel cell PHEVs: This scenario replaces the fuel cell with a fuel cell PHEV. It turns out that plugging in an FCV actually increases both greenhouse gas pollution and total societal costs until the last decades of the century, because hydrogen is cleaner than grid electricity until the 2080 time period. This illustrates that the FCV is a better choice than a plug-in FCV for purposes of reducing societal costs from pollution.
Finally, the Energy Evolution research also considered vehicles powered by natural gas and by diesel fuel. While these two fuels are not sustainable, they each have advocates promoting their use instead of gaso-line, as long as fossil fuels are still available at an affordable price.
3.1.1 Fuel/Vehicle Combination Comparison Matrix //
The basis for The Energy Evolution is a matrix comparing the various fuel/vehicle system alternatives in terms of energy security, environmental responsibility and economic vitality. Each alternative is evalu-ated using a number of key criteria under each broad theme.
The matrix was completed for four time periods: the immediate-term (2008 to 2012); the near-term (2013 to 2025); the mid-term (2026 to 2050); and the long-term (2051 to 2100). Behind the matrix is verifiable analysis explaining the ratings assigned. For the complete matrix, ratings assigned and analysis, see Appendix Five.

Page 13
Approach
The Energy Evolution
3.2 The Energy Evolution Report Assumptions //
Much of the existing body of research about transportation fuel and vehicle alternatives compares the energy security and environmental impacts of various alternative vehicles at a fixed point in time. For ex-ample, a 2001 well-to-wheels report (co-authored by GM, BP, ExxonMobil, Shell and Argonne National Lab) compared the GHG emissions for a large set of vehicle drive trains in 2010, with GM and Argonne adding criteria pollutant emissions in 2005 and running the analysis for 2016. These static comparisons are valuable, but do not convey the full story. Alternative vehicles will be introduced into the fleet over many decades and fuel sources will change over time, particularly if carbon constraints are imposed. The projected societal impacts will therefore change over time. Thus The Energy Evolution research considers scenarios that incorporate the gradual introduction of new vehicle types and estimates the long-term benefits to society of each fuel/vehicle combination.
Key assumptions of The Energy Evolution include
the types of alternative vehicles considered•the rate of introduction of alternative vehicles over time•the fuel economy of the alternatives•the vehicle miles traveled over time•the sources and costs of hydrogen over time•the electric utility marginal grid mix (made up of the higher cost electrical genera-•tors necessary to meet new loads) over timeexternality costs•
3.2.1 Computer Simulation Models: Assumptions //
The computer simulations used in the report assume all technical and economic issues are favorably resolved:
For fuel cell vehicles, costs become competitive; and hydrogen is affordable, avail-•able and transitions over time to low-carbon sources.For plug-in hybrids, affordable deep-discharge lithium ion batteries (or equivalent)•achieve their specific energy goal of 150 watts per kilogram; the electrical grid is con-verted to low-carbon sources; and up to 75 percent of vehicles have access to night-time charging outlets.For battery electric vehicles, affordable batteries are developed, providing 250 to 300 mile •range with fast recharge times of less than 20 minutes (to allow cross-country travel).
A number of fuel source assumptions are also made:
Hydrogen is made initially from natural gas, transitioning to hydrogen from bio-•mass, from coal with carbon capture and storage (CCS), from natural gas with CCS and eventually from electrolysis of water using renewable and nuclear electricity.Electricity to charge PHEVs and BEVs is assumed to be made from the west coast •grid mix (less coal generation and more hydroelectricity than the rest of the nation), transitioning to more renewable electricity, coal with CCS, and more nuclear power.PHEVs have all-electric ranges between 12 to 52 miles, and derive from 18 percent to •65 percent of their energy from the electrical grid.Ethanol for PHEVs is made initially from corn, transitioning to hemi-cellulose •

the GREET
extension model
This model extends the GREET
time horizon in ten-year incre-
ments from 2020 (the last time
period in the standard 1.8a model)
to 2100.
the market
penetration model
This model simulates the gradual
market penetration of alternative
fuels/ vehicles over the century,
and tabulates societal costs re-
sulting from urban air pollution,
greenhouse gas pollution and oil
consumptions. It also calculates
the cost of a distributed hydrogen
infrastructure.
the marginal grid
mix model
This model evaluates the likely
marginal grid mix for a given aver-
age grid mix for both the US
as a whole and for the Western
Electricity Coordinating Council
(WECC) grid mix for the states on
the west coast.
the electric
vehicle model
This model simulates the weight
compounding due to extra battery
weight for PHEVs and BEVs, and
calculates the necessary electricity
to run these vehicles over realistic
vehicle drive cycles.
Page 14
Approach
The Energy Evolution
and cellulose feed stocks over the century, with production of cellulosic ethanol or equivalent rising to 120 billion gallons per year by mid-century.
1. Michael W. Wang, “Greenhouse Gases, Regulated Emissions, and Energy Use in Transportation.” Argonne National Laboratory, http://www.transportation.anl.
gov/modeling_simulation/GREET/. Argonne has also released version 2.8a which includes the impact of vehicle manufacturing.
2. The DOE H2A model currently covers hydrogen production and delivery costs, with others in process: http://www.hydrogen.energy.gov/h2a_analysis.html.
3. "The Hydrogen Economy: Opportunities, Costs, Barriers and R&D Needs," Committee on Alternatives and Strategies for Future Hydrogen Production and
Use, National Research Council, National Academy of Engineering, 2004. http://www.nap.edu/catalog/10922.html.
4. "Transitions to Alternative Transportation Technologies—A Focus on Hydrogen," Committee on Assessment of Resource Needs for Fuel Cell and Hydrogen
Technologies, National Research Council of the National Academies, 2008, http://www.nap.edu/catalog/12222.html.
In terms of market penetration assumptions:
Alternative vehicles enter the market according to modified logistics curves, with •HEVs reaching the potential for 50 percent annual sales by 2024; PHEVs by 2031 and FCVs by 2035.Multiple types of alternative vehicles are assumed to be sold each year.•
A more detailed discussion of all assumptions appears in Appendix One.
3.3 The Energy Evolution Report Research //
Whenever possible, The Energy Evolution used data for its scenario modeling from previously-published work. To estimate oil consumption, greenhouse gas and urban air pollution, The Energy Evolution relies on the Argonne National Lab GREET 1.8a Model1.
To estimate hydrogen infrastructure capital costs, the report relies upon the US Department of En-ergy (US DOE) H2A Cost Model2 and two reports on the hydrogen economy by the National Research Council, one in 20043, and the second, released in 20084.
3.4 The Energy Evolution Simulation Models //
While the computer simulations used in the research behind this report are based primarily on the Ar-gonne National Laboratory GREET 1.8a model to estimate oil consumption, greenhouse gas and urban air pollution, and the US DOE H2A computer model to estimate hydrogen infrastructure capital costs, several other models were required to construct a century-long simulation for alternative vehicles and fuels. These models were developed, borrowed and/or modified from previous development programs:
4321

Page 15
Approach
The Energy Evolution
For more detailed discussion of the models used, please refer to Appendix Two. More information about the hydrogen infrastructure analysis methodology is included in the discussion of hydrogen infra-structure costs in section six (Assessing Economic Vitality) of this report.
3.5 The Energy Evolution Report: Industry Cooperation and Independent Review //
The Energy Evolution: An Analysis of Alternative Vehicles and Fuels to 2100 is the collaborative effort be-tween a number of different organizations: BP, Canadian Hydrogen Energy Company, General Atomics, General Motors, H2GEN Innovations, Inc., Plug Power, Praxair, Inc., Sentech, Inc., University of Montana, Shell Hydrogen, LLC and Xcel Energy. The Energy Evolution uses the Argonne National Laboratory GREET model 1.8a to calculate the greenhouse gas, oil consumption and urban air pollution impacts. Key elements of The Energy Evolution: were also independently reviewed by a number of or-ganizations and individuals, including: the US Department of Energy, the National Renewable Energy Laboratory and the US Fuel Cell Council.
3.6 Comparison of the National Research Council and The Energy Evolution Alternative Vehicle Assessments //
The new 2008 edition of the National Research Council report5 fully supports the main conclusion of The Energy Evolution simulation model with respect to hydrogen and fuel cell vehicles. The report con-cludes that a “portfolio” of transportation options will be required to meet America’s GHG and gasoline reduction goals. Options such as advanced ICEVs, biofuels and gasoline HEVs will help reduce GHGs and gasoline use, but hydrogen and FCVs are required to achieve ultra-low gasoline consumption and reduce GHG pollution by 2050.
However, there are some significant differences between the NRC report and The Energy Evolution assessments:
The NRC assessment does not include plug-in hybrids, diesel vehicles, natural gas •vehicles or battery electric vehicles in its modeling.The NRC assessment does not analyze urban air pollution or the total societal costs •of the alternatives.The NRC time horizon goes to 2050 (vs. 2100 for • The Energy Evolution assessment), but the NRC assumes somewhat faster ramp-up of FCV sales, reaching 80 percent market share by 2050 versus 66 percent for The Energy Evolution model. Neverthe-less, the NRC assessment provides almost the same imperative for hydrogen and FCVs, with respect to GHGs and oil consumption, as The Energy Evolution assess-ment with more modest FCV sales profiles.Since the NRC model does not consider PHEVs or BEVs, the report does not •address electrical utility grid pollution.The NRC assessment evaluates the potential government incentives to buy-down •
the cost of FCVs, while The Energy Evolution report does not include FCV cost incentives.
5. "Transitions to Alternative Transportation Technologies—A Focus on Hydrogen," Committee on Assessment of Resource Needs for
Fuel Cell and Hydrogen Technologies, National Research Council of the National Academies, pre-publication copy, 2008.

The Energy Evolution
4.0
Assessing Environmental Sustainability

Page 17
Environ-mentalSustain-ability
The Energy Evolution
The Energy Evolution uses the Argonne National Laboratory GREET model 1.8a to calculate the greenhouse gas (GHG) pollution and urban air pollution for each fuel/vehicle combina-tion. The GREET model was extended out to 2100 using a number of assumptions described in Appendix One for hydrogen, ethanol and electricity production. For research purposes, The Energy Evolution uses ethanol as a surrogate for liquid biofuels. Thus, bio-butanol or other bio-derived fuels may be used instead of, or in addition to, ethanol.
The mix of electrical generation plants over time is a key input to model, because the grid mix de-termines the social benefits of plug-in hybrid electric vehicle (PHEVs) and battery-powered electric vehicles (BEVs). While some discussion on this topic is included later in this section, for more detailed analysis see Appendix Three.
Without modifications to the current grid mix, PHEVs and BEVs will not significantly decrease GHG emissions or urban air pollution, due to the preponderance of coal-based marginal power in the US. “Marginal” power refers to the electrical generator that is used to produce additional power when new loads are added to the grid (as would be the case when charging PHEVs or when using electrolyzers to produce hydrogen from water). This generator generally has the highest generation costs at the time the new load is added (because lower-cost generation is already in use). It is usually either natural gas or coal-fired.
Two electric grid scenarios are used in the model to capture the two extremes in treatment of GHG emissions:
A grid with no carbon constraints• : this scenario starts with the current US aver-age marginal grid mix as projected by the US Department of Energy’s (US DOE)Energy Information Administration to evolve over the next 30 years in the absence of any carbon constraints, with extrapolations to 2100 (assuming no efforts to curb greenhouse gases)1.A grid with carbon constraints• : to simulate the impact of significant reductions in GHGs, this scenario begins with the current West Coast average marginal grid mix. This grid mix contains less electricity produced by coal and more hydroelectric than the national average, with relatively rapid introduction of zero or near-zero GHG electrical sources such as coal-fired integrated gasification combined cycle (IGCC) plants with carbon capture and storage (CCS), and with major expansion of renew-ables and nuclear power over the century. West Coast energy consumption is based on the Western Electricity Coordinating Council (WECC) region, because Califor-nians consume electricity from an interconnected grid that includes 11 western states and two Canadian provinces (although transmission line choke-points limit imports of Canadian electricity to California).
In keeping with the goal of comparing equal performance vehicles, the BEV modeled in this analysis is assumed to have a 300 mile range which, with weight compounding, implies a very heavy vehicle, even using advanced lithium ion (Li-Ion) batteries. It is assumed the Li-Ion battery companies achieve the US DOE’s specific energy goal for vehicle batteries of 150 Watt hours per kilogram, which is a 50 percent improvement over the best current full scale Li-Ion energy battery pack.
1. Annual Energy Outlook with Projections to 2030, Reference Case: http://www.eia.doe.gov/oiaf/aeo/index.html.

Page 18
Environmen-tal Sustain-ability
The Energy Evolution
Two separate sets of data were calculated for each fuel/ vehicle combination:
Per Vehicle Data• : Individual per vehicle environmental ratings were calculated with-out regard to the number of vehicles on the road. These individual vehicle ratings change as the method of producing hydrogen, ethanol and electricity varies.Market Penetration Impact• : A computer simulation model was written to calculate the impact of each fuel/vehicle type, taking into account various scenarios for the number of vehicles on the road as a function of time. Vehicles requiring significant technology and/or cost improvements (such as BEVs and fuel cell vehicles (FCVs)) were assumed to enter the marketplace later than current options (such as gasoline hybrid electric vehicles (HEVs) or ethanol internal combustion vehicles (ICEVs)) already on the road. The model was extended to 2100 to capture the effects of a substantial number of alternative vehicles on the road.
4.1 Greenhouse Gas Impacts: Fuel/Vehicle Scenario Highlights //
The results of the simulations, in terms of the impact of each fuel/vehicle combination on greenhouse gases, show that the FCV scenario (when FCVs become the dominant vehicles in the vehicle mix by the end of the century) is the only one that can achieve an 80 percent reduction below 1990 GHG levels from the transportation sector, as illustrated in Figure 4.1. However, even with the FCV approaching 100 percent market share by 2100, reducing GHGs to 80 percent below 1990 levels does not occur until 2080, or three decades after the 2050 target advocated by climate change groups. Faster FCV market penetration and/or more aggressive conversion of hydrogen to low-carbon sources would be required to meet 80 percent below 1990 levels by 2050.
In other dominant-vehicle scenarios, hydrogen-powered internal combustion engine hybrids (ICE HEVs) could achieve GHG levels 70 percent below 1990 levels by 2085, still short of the 2050 target, but better than any other non-hydrogen alternative. All-electric battery electric vehicles, if accepted by virtually all drivers, could approach 60 percent below 1990 GHG levels by the end of the century.
Figure 4.1
Greenhouse gas
pollution to 2100
for the four main
vehicle scenarios and
a reference case with
100 percent gasoline
ICEVs. Also shown
are the 1990 GHG
levels for US passen-
ger vehicles, along
with the lines for 60
and 80 percent below
1990 levels.
greenhouse gas pollution: billion tonnes CO2 equivalent per year
2010 2100
3.0
1.5 1990 GHG levels
60% below 1990 GHG levels
80% below 1990 GHG levels
GICEV
GHEV
GPHEV
EtPHEV
BEV
HFCV

Page 19
Environmen-tal Sustain-ability
The Energy Evolution
Cellulosic ethanol plug-in hybrids (PHEVs) could reduce GHGs to 20 percent below 1990 levels by the end of the century. And the gasoline PHEV could, at best, reduce GHG back to 1990 levels by 2080, despite the aggressive assumptions regarding low-carbon electrical generators. These assumptions are: that, by 2070, the electrical grid has 88 percent low-carbon sources: 51 percent renewable, 13 percent nuclear and 24 percent coal-based integrated gasification combined cycle (IGCC) with carbon capture and storage (IGCC refers to a power plant using synthetic gas typically derived by gasifying coal. This gas is often used to power a gas turbine generator whose waste heat is passed to a steam turbine system.); and that PHEVs eventually reach an all-electric range of more than 50 miles and derive more than 65 percent of their power from this low-carbon grid.
4.1.2 Greenhouse Gases per Vehicle Rankings //
The Energy Evolution also calculates the GHG reduction factors on a per vehicle basis, for the near-term (now until 2020), the mid-term (2020 to 2050) and the long-term (2050 to 2100) in the simulation model. The reduction factor is defined as the GHG pollution from a single conventional gasoline vehicle divided by the GHG pollution from a single alternative vehicle, such as a FCV. Results are illustrated in Figure 4.1.2.
Notes on Greenhouse Gas Reduction Factors
Hydrogen FCVs initially cut greenhouse gases by a factor of two per vehicle compared to gasoline ICEVs, increasing to a reduction factor of 11.1 over time, as sources of hydrogen become greener.
Hydrogen ICE HEVs initially cut GHGs by 1.4, growing to a 6 to one reduction in the long-term.
Ethanol PHEVs initially cut GHGs by 1.8 times, growing to a factor of 5 over time.
BEVs initially increase GHG emissions by a factor of 1.1, due to the preponderance of coal electricity on the margin, even on the West Coast. BEVs eventually cut GHGs by a factor of 4, once the grid’s carbon content is reduced substantially.
Figure 4.1.2
Greenhouse gas
reduction factors
for alternative fuel/
vehicle combina-
tions, relative to
gasoline ICEVs. Note:
electricity is assumed
to come from the
west coast marginal
grid mix with carbon
constraints.
GHG reduction factor relative to gasoline ICEVs
-
4.0
8.0
12.0
FCV H2 ICE HEV EtOH PHEV BPEV Gasoline PHEV Gasoline HEV
12
8
4
HFCV HICEV EtPHEV
Red
uctio
n Fa
ctor
BEV Gasoline PHEV
Gasoline HEV
long-term
mid-term
near-term

Page 20
Environmen-tal Sustain-ability
The Energy Evolution
Gasoline PHEVs reduce GHGs by a factor of 1.4 to start, growing to a factor of 2.5 in the long-term, once the carbon footprint of the electrical grid is reduced and the fraction of PHEV energy drawn from the grid reaches 60 percent or more.
The key per vehicle results reported in this section for both greenhouse gas impacts and below, in re-spect to urban air pollution, all assume the US implements stringent carbon constraints on the electrical grid in the coming decades. Without carbon constraints, hydrogen vehicles would achieve even more significant advantages over the alternative fuel/vehicle combinations that depend on grid charging for some or all of their energy.
4.2 Urban Air Pollution Impacts: Fuel/Vehicle Scenario Highlights //
The results of the fuel/vehicle scenario simulations, in terms of the impact of each alternative on urban air pollution, as illustrated in Figure 4.2, show that the hydrogen FCV scenario (where FCVs become the dominant vehicle by 2100) is the only one that would reduce urban air pollution costs toward zero by the end of the century (excluding particulates caused by tire and brake wear; a challenge common to all vehicles).
The other three primary fuel/vehicle combinations will generate steady or gradually rising costs of pollution over the century (according to the GREET mode). BEVs, if deployed, would reduce urban air pollution to perhaps 30 percent below today’s levels, but emissions would level out and even increase slightly toward the end of the century as more vehicle miles are travelled.
Figure 4.2
Urban air pollution
costs for the four
main vehicle sce-
narios and gasoline
ICEV reference case.
(Pollutant emissions
in grams per mile per
year multiplied by
dollars per kilo-
gram societal cost,
summed over all
pollutants.)
urban air pollution costs: $US billion per year
4.2.1 Urban Air Pollution per Vehicle Rankings //
The report also calculates the urban air pollution reduction factors on a per vehicle basis, for the near-term (now until 2020), the mid-term (2020 to 2050) and the long-term (2050 to 2100) in the simulation model. The reduction factor is defined as the urban air pollution from a single gasoline ICEV divided by the urban air pollution from a single alternative vehicle. Results are illustrated in Figure 4.2.1. on Page 22.
2010 2100
60
30
GICEV
GHEV
GPHEVEtPHEV
BEV
HFCV
particulate matter from tire and brake wear

Page 21
Environmen-tal Sustain-ability
The Energy Evolution
Notes on Urban Air Pollution Cost Reduction Factors
FCVs initially reduce urban air pollution by a factor of 1.7 per vehicle relative to gasoline ICEVs, grow-ing to 4.4 over time.
BEVs initially cut air pollution by 1.2, growing to 3.1 over time.
Hydrogen PHEVs initially cut air pollution by 1.1, growing to a three to one reduction in the long-term.
Ethanol PHEVs initially cut air pollution by a factor of 1.4, growing to 2.2 in the long-term.
Gasoline PHEVs initially cut urban air pollution by a factor of 1.3, growing to 1.9 in the long-term.
As mentioned above, the key per vehicle results for urban air pollution, as with greenhouse gases, all assume the US implements stringent carbon constraints in the coming decades.
4.3 Non-Sustainable Fuel Options //
Although diesel fuel and compressed natural gas are both derived from fossil fuels and as such are non-sustainable, there are advocates for using these two fuels as we transition to more sustainable transporta-tion alternatives. They are included in the analysis for comparison purposes only. Figures illustrating the scenario simulations for these two alternatives can be found in Appendix Six.
Diesel fuel has the primary advantage of higher fuel economy with compression ignition than gasoline with spark ignition. In an average of several sources, the diesel compression ignition direct injection (CIDI) engine has approximately 11 percent better fuel economy. Thus converting from gasoline to diesel engines will reduce GHGs and oil consumption to some degree. However, on the scales being considered, this difference is negligible and the results for the diesel PHEV are almost the same as the gasoline PHEVs for GHGs. For all practical purposes, the gasoline vehicle results can represent the die-
Figure 4.2.1
Urban air pollution
cost reduction fac-
tors for alternative
vehicle/fuel combina-
tions, relative to
gasoline ICEVs.
-
1.5
3.0
4.5
FCV BPEV H2 ICE HEV EtOH PHEV Gasoline PHEV Gasoline HEV
4.5
3.0
1.5
HFCV HICEV EtPHEV BEV Gasoline PHEV
Gasoline HEV
Urban air pollution cost reduction factors
Red
uctio
n Fa
ctor
s
long-term
mid-term
near-term

Page 22
Environmen-tal Sustain-ability
The Energy Evolution
sel fuel results for GHGs and oil consumption.Urban air pollution is reduced more by diesel PHEVs than gasoline PHEVs (according to the GREET
model). Even so, the diesel air pollution holds steady and begins to rise at the end of the century.Shifting to natural gas would have a major impact on oil imports, cutting oil consumption almost the
same as hydrogen vehicles or BEVs. Natural gas vehicles (NGVs) would also cut GHG pollution com-pared to gasoline counterparts. In fact, non-hybrid NGVs would cut GHGs nearly as much as gasoline HEVs and natural gas PHEVs would cut GHGs by approximately 24 percent below 1990 levels by the end of the century. But natural gas PHEVs could not approach the 60 to 80 percent reduction sought for climate change goals.
Finally, a natural gas PHEV would reduce urban air pollution more than a gasoline PHEV. Air pollu-tion would remain nearly flat until the last quarter of the century with natural gas PHEVs, then begin rising slowly.
There are two other major drawbacks to converting to a natural gas fueling system. First, the cost of installing compression, storage and dispensing equipment for either natural gas or hydrogen is approxi-mately the same. It is doubtful that energy companies would invest in a natural gas infrastructure know-ing that it would be a temporary measure. Second, the supplies of natural gas are limited. The natural gas infrastructure to support mass market penetration of NGV hybrids would equal all projected US natural gas consumption by the end of the century. Even the natural gas PHEV scenario would increase US natural gas consumption by 25 percent (compared to approximately 12 percent required temporarily for natural gas to supply the interim hydrogen production).
For more information, and additional figures, illustrating these scenarios, see Appendix Six.

The Energy Evolution
5.0
Assessing Energy Security

Page 24
EnergySecurity
The Energy Evolution
The Energy Evolution assesses the question of energy security by looking at oil consumption for the fuel/vehicle combinations considered. Reducing oil consumption for transportation, and looking to other fueling alternatives, will positively affect America’s ability to compete in the global economy. Even broader economic benefits will accrue as a result of using hydrogen, because of our ability to make it from a variety of different sources of energy. The benefits of energy source diversity cannot be overstated. Each of the energy sources for hydrogen production is, to a greater or lesser extent, produced domesti-cally. This has the effect of mitigating the impact of energy price fluctuations and macroeconomic risks that flow from our heavy dependence on imported oil and leaves us less dependent on energy from regions that are beset with political risk .
The computer simulation program (based on the Argonne GREET 1.8a model used to estimate urban air pollution and greenhouse gas pollution impacts) also calculates the amount of oil consumed for each of the alternative fuel/vehicle scenarios.
5.1 Oil Consumption Impacts: Fuel/Vehicle Scenario Highlights //
The hydrogen fuel cell vehicle (FCV), the hydrogen internal combustion engine hybrid electric vehicle (ICE HEV) and the battery electric vehicle (BEV) scenarios all reduce oil consumption more than any other primary fuel/vehicle combination, with petroleum use near zero by the end of the century, as il-lustrated in Figure 5.1. In 2060, oil consumption reaches energy “quasi-independence,” defined as the
Figure 5.1
Oil consumption for
the four main vehicle
scenarios, and gasoline
ICE reference case.
oil consumption: billion barrels per year
point where oil consumption in the light duty vehicle sector can be met with current US domestic oil production in time of crisis to satisfy all non-transportation and heavy duty transportation needs (as-suming no further decline in US oil production capacity and no further increase in non-transportation oil use). The reference cases of battery electric vehicles (BEVs) and hydrogen ICE HEVs, though not shown in Figure 5.1, follow this same path toward zero oil consumption. Gasoline hybrid electric vehicles (HEVs) stabilize oil consumption initially, but oil consumption increases in the last half of the century. And, gasoline and ethanol plug-in hybrids (PHEVs) cut oil consumption, but do not approach energy independence.
2010 21002060
8.0
4.0
GICEV
GHEV
GPHEVEtPHEV
HFCV, BEV, HICEV energy quasi-independence †

Page 25
EnergySecurity
The Energy Evolution
5.1.2 Oil Consumption per Vehicle Rankings //
The Energy Evolution calculates, for each fuel/vehicle combination, an oil consumption reduction factor, defined as the oil consumption for a gasoline ICEV divided by the oil consumption for the alternative vehicle. These oil reduction factors were calculated for the near-term (now until 2020), the mid-term (2020 to 2050) and the long-term (2050 to 2100) in the simulation model. The key results, illustrated in Figure 5.1.2, show that:
FCVs, hydrogen ICE HEVs and BEVs will all cut oil consumption to a small frac-•tion of current consumption per vehicle (because of their negligible oil consump-tion, their results extend beyond the scale of the Figure);Ethanol PHEVs will cut oil use per vehicle by seven times to start, rising to more •than 12 times in the long-term; and Gasoline PHEVs will cut oil use by a factor of two in the beginning, growing over •time to a factor of 3.4 as the all-electric range increases and operation in the internal combustion mode decreases.
5.1.3 Oil Consumption per Vehicle over Time //
The GREET model calculates the total petroleum consumption for each fuel/vehicle option, measuring energy used per mile. Consumption decreases as the fuel economy of all vehicles increases over time. Very little oil is consumed for either hydrogen or electricity generation, but ethanol production does consume petroleum in various aspects of grain and ethanol production and delivery. The quantity of oil consumed per gallon of ethanol decreases as production technology evolves from all corn ethanol to cel-lulosic ethanol over the century. Petroleum consumption also decreases for PHEVs as the fraction of all electric range increases and more of the energy to run the PHEV comes from the electrical grid.
Figure 5.1.2
Oil consumption
reduction factors for
alternative vehicle/
fuel combinations,
relative to gasoline
ICEVs.
-
10.0
20.0
FCV H2 ICE HEV BPEV EtOH PHEV Gasoline PHEV Gasoline HEV
20
10
HFCV HICEV EtPHEV BEV Gasoline PHEV
Gasoline HEV
Oil consumption reduction factors
Red
uctio
n Fa
ctor
s
long-term
mid-term
near-term

The Energy Evolution
6.0
Assessing Economic Vitality

Page 27
EconomicVitality
The Energy Evolution
The Energy Evolution monetizes the cost of three major societal challenges (urban air pollution, oil con-sumption and hydrogen infrastructure) to derive a single figure-of-merit for each fuel/vehicle combina-tion. Urban air pollution cost constituents were calculated using the Argonne National Laboratory GREET 1.8a model; the simulation then summed the product of each pollutant in grams/mile/year multiplied by the average of five societal cost estimates for each pollutant (see Appendix One for details on pollutant cost estimates). Greenhouse gas (GHG) pollution was costed at $25 per metric tonne in 2010, rising linearly to $50 per tonne by 2100.
Oil consumption was costed at a flat $60 per barrel over the century, to represent the combination of societal economic costs and military costs of defending imported oil. For example, various sources have estimated a military cost of protecting oil at an average of approximately $100 billion per year (see the Externality Costs section of Appendix Two.) Amortizing that cost over 10 million barrels per day of imported oil corresponds to a cost of $27 per barrel. The $60 per barrel costs can be represented as $27 per barrel military cost and $33 per barrel balance of trade and other economic costs to society for importing petroleum.
The cost of installing a distributed hydrogen infrastructure was calculated in the 100-year simulation model using the US Department of Energy’s H2A cost model for on-site steam methane reformers. Fur-ther discussion of the modeling and assumptions can be found later in this section, as well as discussion about the cost of fuel cell vehicles in the early stages of commercial introduction.
6.1 Societal Cost Impacts: Fuel/Vehicle Scenario Highlights //
The results of the scenario simulations illustrate that the fuel cell vehicle (FCV) scenario (where FCVs become the dominant vehicle by 2100) will reduce societal costs more than any other option, cut-ting costs by $600 billion per year by 2100 compared to gasoline internal combustion engine vehicles (ICEVs), and by $420 billion per year compared to gasoline hybrid electric vehicles (HEVs). Although not shown in Figure 6.1, the battery electric vehicle (BEV) and the hydrogen internal combustion engine
Figure 6.1
Societal costs for
the four main vehicle
scenarios, and gaso-
line ICE reference
case.
total societal costs: $US billion per year
hybrid electric vehicle (ICE HEV) both cut societal costs nearly as much as in the FCV scenario, and the ethanol plug-in hybrid (PHEV) would cut societal costs by $250 billion per year by 2100 compared to gasoline HEVs. The gasoline PHEV would reduce societal costs by $200 billion per year by 2100 compared to gasoline HEVs.
2010 2100
700
350
GICEV
GHEV
GPHEVEtPHEV
BEVHFCV

Page 28
EconomicVitality
The Energy Evolution
6.1.2 Societal Costs per Vehicle Rankings //
The report also calculates the societal cost reduction factors on a per vehicle basis for the near-term (now until 2020), the mid-term (2020 to 2050) and the long-term (2050 to 2100) in the simulation model, as illustrated in Figure 6.1.2. The cost reduction factor is defined as the societal cost of the gasoline ICEV (air pollution cost plus greenhouse gas cost plus imported oil economic and military costs) divided by the societal cost of the alternative fuel/vehicle combination.
Figure 6.1.2
Societal cost reduc-
tion factors for
alternative vehicle/
fuel combinations,
relative to gasoline
ICEVs.
-
10.0
20.0
FCV H2 ICE HEV BEV EtOH PHEV Gasoline PHEV Gasoline HEV
20
10
BEV Gasoline PHEV
Gasoline HEV
Notes on Societal Cost Reduction Factors
Hydrogen FCVs will immediately reduce the total societal costs related to air pollution, greenhouse gas and oil import costs of operating gasoline ICEVs by a factor of 7.8 per vehicle. This cost reduction will eventually increase to a factor of more than 20 to one as each FCV put on the road will cut societal costs by a factor of 20 compared to a gasoline vehicle.
Hydrogen ICE PHEVs will immediately cut societal costs by five to one, increasing to 6.6 to one in the mid-term, and 13.2 to one in the long-term.
BEVs will initially cut total societal costs by a factor of four, growing to a factor of 10.6 over time (assum-ing that battery goals can be achieved and drivers accept the long charging times).
Ethanol PHEVs will reduce total societal costs by a factor of four, growing eventually to a factor of seven times reduction. Ethanol production capacity will likely limit this ethanol PHEV option to less than 30 percent of the total vehicles on the road, but this per-vehicle calculation does not take into account the marketability of the vehicle, or the availability of the fuel.
Gasoline PHEVs will initially cut societal costs by 1.7, growing to 2.9 over time.
Gasoline HEVs will only cut societal costs by the ratio of improvement in fuel economy of the HEV over the ICEV, taken as 1.36 to one in the modeling.
HFCV HICEV EtPHEV
Societal cost reduction factors
Red
uctio
n Fa
ctor
s
long-term
mid-term
near-term
Page 29
EconomicVitality
The Energy Evolution
6.2 Hydrogen Infrastructure Costs Analysis //
The US DOE’s H2A hydrogen infrastructure cost model predicts the cost of providing hydrogen will be minimized initially by installing steam methane reformers at fueling stations to convert natural gas and water to hydrogen. This avoids the necessity of installing a costly hydrogen pipeline system that would be severely under-utilized when there are very few hydrogen vehicles on the road. Hydrogen fueling stations are added when and where they are needed to match the introduction of hydrogen vehicles in each region of the country.
The market penetration model used to produce the data in this report calculates the annual cost of installing on-site steam methane reformers, compression, storage and dispensing equipment to serve the hydrogen vehicles expected in the subsequent years. For purposes of estimating GHGs and urban air pollution, the assumption is that hydrogen production shifts gradually from on-site distributed genera-tion to central production with either truck or pipeline delivery. For costing purposes, however, it is easier to estimate costs and avoid the complexity of deciding when and where to begin building large central hydrogen production plants and hydrogen pipeline distribution systems. It is assumed that the shift to central production will occur when there are enough FCVs in a given region to make central production and hydrogen delivery by either truck or pipeline less costly than on-site distributed gen-eration. Therefore, the costs calculated here should be considered an upper bound on the hydrogen infrastructure system.
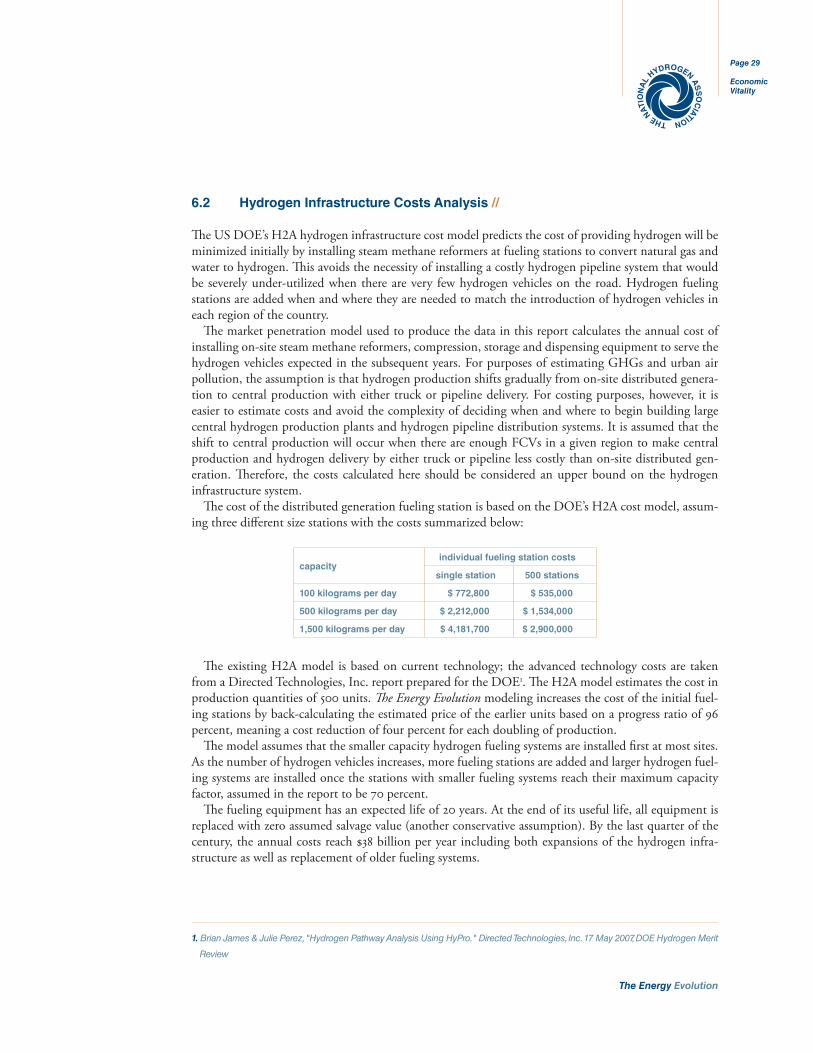
The cost of the distributed generation fueling station is based on the DOE’s H2A cost model, assum-ing three different size stations with the costs summarized below:
capacityindividual fueling station costs
single station 500 stations
100 kilograms per day $ 772,800 $ 535,000
500 kilograms per day $ 2,212,000 $ 1,534,000
1,500 kilograms per day $ 4,181,700 $ 2,900,000
The existing H2A model is based on current technology; the advanced technology costs are taken from a Directed Technologies, Inc. report prepared for the DOE1. The H2A model estimates the cost in production quantities of 500 units. The Energy Evolution modeling increases the cost of the initial fuel-ing stations by back-calculating the estimated price of the earlier units based on a progress ratio of 96 percent, meaning a cost reduction of four percent for each doubling of production.
The model assumes that the smaller capacity hydrogen fueling systems are installed first at most sites. As the number of hydrogen vehicles increases, more fueling stations are added and larger hydrogen fuel-ing systems are installed once the stations with smaller fueling systems reach their maximum capacity factor, assumed in the report to be 70 percent.
The fueling equipment has an expected life of 20 years. At the end of its useful life, all equipment is replaced with zero assumed salvage value (another conservative assumption). By the last quarter of the century, the annual costs reach $38 billion per year including both expansions of the hydrogen infra-structure as well as replacement of older fueling systems.
1. Brian James & Julie Perez, "Hydrogen Pathway Analysis Using HyPro." Directed Technologies, Inc. 17 May 2007, DOE Hydrogen Merit
Review

Page 30
EconomicVitality
The Energy Evolution
6.2.1 Fueling Station Capacity Factor //
The average capacity factor of hydrogen fueling stations approaches 70 percent capacity (the maximum used in The Energy Evolution modeling) in 2018, within a few years of hydrogen vehicles beginning large scale market penetration and, in this model, after a cumulative hydrogen infrastructure investment of $9 billion for 6,500 hydrogen stations. At this point, the fuel providers will start making the 10 percent real, after-tax return on the capital investments that is assumed in the model in order to calculate the price of hydrogen to drivers. In other words, little or no additional government incentives would be required to continue building the hydrogen infrastructure after the 2016 to 2018 time period.
6.2.2 Hydrogen versus Gasoline Infrastructure Costs //
In 2008, The Oil and Gas Journal estimates that the energy companies will spend nearly $200 billion in the US on capital items1. Some of these expenditures are for natural gas and some for non-motor fuel uses of crude oil. This report estimates the fraction of these capital expenditures that should be attrib-uted to gasoline and diesel fuel, in order to compare the amount with the cost of a building a hydrogen infrastructure.
To estimate this split between motor fuel and non-motor fuel, consider that the energy companies produced more natural gas (19 quads) in the US than oil (13.2 quads). However, the production of gaso-line from crude oil is much more capital intensive than the processing of line natural gas from well-head gas. One measure of this cost is the price charged for these two products. In 2006, natural gas prices av-eraged $6.24/million British Thermal Units (MBTU), while gasoline averaged $21.06/MBTU (including highway taxes). Subtracting 48 cents per gallon ($3.84/MBTU) in highway taxes, gasoline cost $17.22/MBTU. These costs were multiplied by the production of oil and gas to extrapolate net revenues from natural gas of $119 billion, and $227 billion for oil turned into gasoline.
By this revenue measure, natural gas accounted for 35 percent of the total capital expenditures, so 65 percent (or $130 billion) of the $200 billion spent in 2008 can be attributed to petroleum. Gasoline and diesel fuel account for approximately 67 percent of the output from US oil refineries2, so the final estimate of their share of capital expenditures for 2008 is $87 billion.
6.3 Hydrogen Infrastructure Costs versus Societal Savings //
The annual cost of the hydrogen infrastructure is minor compared to the annual societal savings by replacing gasoline ICEVs with hydrogen FCVs, as shown in Figure 6.3a on Page 31, remembering the total societal savings in the FCV scenario include savings from gasoline HEVs, gasoline and ethanol PHEVs deployed before FCVs enter the marketplace, in addition to the FCV savings; only those savings attributed directly to the FCVs are shown in these figures. Annual societal savings from reduced urban air pollution, reduced GHGs and reduced oil imports exceed $600 billion every year at the end of the century, which is sixteen times the annual cost to maintain the hydrogen infrastructure at that time. Recall, however, that the hydrogen infrastructure costs are predicated on a distributed hydrogen system. If central hydrogen production is less costly, then infrastructure costs could decrease. On the other hand, if carbon constraints force the construction of more expensive hydrogen production options, then these hydrogen infrastructure costs could increase.
1. Marilyn Radler, "Capital Budgets to grow in US, drop in Canada," Oil & Gas Journal, April 28. 2008, Page 20 and "Oil and gas capital
spending to rise in US, fall in Canada," Oil & Gas Journal, Volume 105, Issue 13, April 2, 2007
2. Stacy C. Davis & Susan W. Diegel, "Transportation Energy Data Book, "26th Edition, Center for Transportation Analysis, Oak Ridge
National Laboratory #6978, US DOE, 2007, Table 1.10

Page 31
EconomicVitality
The Energy Evolution
The scale of Figure 6.3a is expanded in Figure 6.3b to show the societal savings compared to the initial hydrogen infrastructure costs in the early years of hydrogen vehicle introduction. By 2021, the societal savings are greater than the annual hydrogen infrastructure costs. While energy companies would pay for a hydrogen infrastructure, the benefits (including cost savings) of reduced pollution and oil con-sumption accrue to all Americans. In order to stimulate the early deployment of a transportation fueling system that will benefit all people for the foreseeable future, government needs to plays a role.
Figure 6.3a
Comparison of the
annual societal
costs savings from
operating hydrogen-
powered fuel cell
vehicles compared to
the annual hydrogen
fuel infrastructure
costs.
$-
$350
$700
2010 2100
Total Societal Savings w/r to ICEVs Total Societal Savings w/r to HEVs (Base Case) Oil Savings
Pollution Savings GHG Savings H2 Infrastructure Capital Expenses
700
350
$US billions per year
2010 2100
oil import savings
hydrogen infrastructure investments
urban air pollution savings
greenhouse gas pollution savings
total societal savings relative to gasoline internal combustion hybrid electric vehicles
total societal savings relative to gasoline internal combustion vehicles
Figure 6.3 b
Annual societal sav-
ings and hydrogen
infrastructure costs in
the early years of FCV
market penetration
(expanded scale of
Figure 6.3a).
-
3.00
6.00
9.00
1 2 3 4 5 6 7 8 9 10 11 12 13 14 15 16
9.0
6.0
3.0
$US billions per year
2010 2025
hydrogen infrastructure investments
total societal savings rela-tive to gasoline internal combustion engine hybrid electric vehicles and gasoline internal combus-tion engine vehicles

Page 32
EconomicVitality
The Energy Evolution
6.4 Commercial Hydrogen Cost Perspective //
The total costs (capital expenses, operation and maintenance, natural gas costs), revenues and net cash flow for the aggregate group of fueling station owners are shown in Figure 6.4a, assuming that they sell hydrogen at a 20 percent discount below the cost of gasoline. In this example, the price of gasoline is $4 per gallon, and hydrogen sells for $3.20 per gallon on an energy-equivalent basis. Assuming the FCV has 2.45 times greater fuel economy than the gasoline car, a FCV driver would pay the equivalent of $3.20 divided by 2.45, therefore $1.31 per gallon on a range-equivalent basis. This leaves 80 cents per gallon margin for highway taxes (averaging about 48 cents per gallon) and a reduced cost for FCV drivers.
The cash flow is negative in the early years of FCV market penetration as shown in Figure 6.4b. In this scenario, the hydrogen fueling operators in the aggregate reach positive cash flow by 2019. The net cumulative cash flow reaches negative $3.2 billion, with a maximum negative annual cash flow in any
Figure 6.4a
Total costs, revenues
and net cash flow for
all hydrogen fueling
station owners com-
bined, with hydrogen
sold at 20 percent
discount below
gasoline (assumed
to be $4 per gallon),
to 2100.
Figure 6.4b
Total costs, revenues,
annual net cash flow
and cumulative cash
flow for all hydrogen
fueling station own-
1000
20
10
0
-10
500
2010
2010 2100
20252018
0
-500
hydrogen capital costs
cumulative net cash flow
total hydrogen fueling system costs
natural gas costs
annual net cash flow
hydrogen sales revenue
$US billion per year
$US billion per year

Page 33
EconomicVitality
The Energy Evolution
year of less than $450 million. Thus the total incentives required to jump-start the hydrogen infrastruc-ture could be as low as $3.2 billion.
This $3.2 billion short-fall could be bridged by some combination of private venture capital, govern-ment incentives, loan guarantees, etc. After 2025 revenues would be sufficient for the energy companies to make significant return on their investments in hydrogen infrastructure.
6.5 Comparison of Other Hydrogen Infrastructure Cost Estimates //
Understanding the initial cost of the hydrogen infrastructure, before there are enough fuel cell vehicles to provide sufficient return on investment, is important since government incentives or private invest-ment will be required to cover these costs. The Energy Evolution model predicts a net short fall (after accounting for revenues from selling hydrogen), and subsequent need for investment, of between $3 billion and $7 billion in these early years (from 2012 to the early 2020s); the National Research Council (NRC) and the Oak Ridge National Laboratory (ORNL) have also estimated the initial incentives re-quired to jump-start the hydrogen fueling system.
The 2008 edition of the NRC report on hydrogen1 concludes that $8 billion to $10 billion will be needed between 2008 and 2023 for capital expenditures on the initial hydrogen fueling systems. The NRC did not take into account hydrogen revenues to the fueling station operator. For comparison, The Energy Evolution model estimates higher capital costs of $16.4 billion over this time period, but hydrogen revenues reduce the net required investments to the $3 to $7 billion range. It’s important to note that the amount of investment required is a function of the prices of gasoline and natural gas. Figure 6.5 il-lustrates how an increase in the price of gasoline is reflected in a decrease in the amount of investment required.
0.00
4.00
8.00
12.00
1 2 3 4 5 6 7 8 9 10 11 12 13
12.0
8.0
$2.00 $5.00
4.0
Figure 6.5
Maximum cumulative
incentive and maxi-
mum annual incentive
required to incentivize
a hydrogen on-site
investment required ($US billions)
price of gasoline ($US per gallon)
annual investment
cumulative investment
1. "Transitions to Alternative Transportation Technologies—A Focus on Hydrogen," Committee on Assessment of Resource Needs for
Fuel Cell and Hydrogen Technologies, National Research Council of the National Academies, prepublication copy, 2008

Page 34
EconomicVitality
The Energy Evolution
The ORNL took a different approach1, assuming that the government would provide subsidies to the fueling station operator on a sliding scale, starting with $1.3 million per hydrogen fueling system in 2012, dropping to $700,000 in 2017, and then to $300,000 from 2021 to 2025. These subsidies would not be dependent on capital costs, which the ORNL acknowledges would be greater than the actual costs for a hydrogen fueling system, estimated at $3.3 million each in 2012.
The ORNL estimates even lower government incentives might be required than those proposed by the NRC: as low as $1.5 billion to $8 billion for the hydrogen infrastructure, and $6.5 to $21 billion cumula-tive over the next 25 years for fuel cell vehicle buy-down incentives, with the largest annual incentive being between $1 billion and $6 billion per year. Interestingly, ORNL also points out that the projected subsidies for ethanol will reach $6 billion per year by 2012. If the ethanol subsidy continues at $6 billion per year for the 13 years ORNL analyzes in its study, then ethanol would receive $78 billion cumulative in subsidies to support a small fraction of vehicles on the road, while the total hydrogen and fuel cell vehicle subsidy over these same 13 years would be as little as $8 billion (ORNL’s lower estimate for fuel and vehicles combined) to, at most, $48 billion (the NRC estimate for fuel and vehicles combined).
The magnitude of these three estimates of required government subsidies are similar, as summarized in the following table, even though the studies had differing assumptions.
Comparison of NRC and NHA hydrogen infrastructure cost estimates
NRC NHA ORNL*
capital cost (2008-2023) $8 billion $16.4 billion
operating costs $8 billion $14.8 billion
total cumulative costs $16 billion $31.2 billion
cumulative H2 revenues** -- ($37.1 billion)
incentives required $8 to $10 bil-
lion
$3.2 to $7
billion
$1.5 to $8 bil-
lion
* Oak Ridge proposes fuel infrastructure incentives independent of capital costs
** Assumes hydrogen is sold at $3.20 per gallon of gasoline on a range equivalent basis
As shown in Figure 6.6 on Page 36, the ORNL study assumed the most aggressive FCV market penetration, reaching 95 percent market share by 2050, while the NRC assumed percent and this NHA study assumes only 65 percent FCV market share by 2050.
1. David L. Greene & Paul N. Leiby, Oak Ridge National Laboratory, Brian James & Julie Perez, Directed Technologies, Inc., et al, and Sig
Gronich, “Analysis of the Transition to Hydrogen Fuel Cell Vehicles and the Potential Hydrogen Energy Infrastructure Requirements,”
ONRL/TM-2008/30, March 2008.

Page 35
EconomicVitality
The Energy Evolution
The NRC listed the capital expenditure estimate as the required government incentive, apparently as-suming that the hydrogen revenues would cover only the operating costs (although it did not state this explicitly). The ORNL did not explicitly estimate either the capital or operating costs for the fueling stations. Instead it postulated the government would buy down part of the costs, with the stated as-sumption that the fueling station owner would cover the remaining capital costs and operating costs with hydrogen revenue.
6.6 Early Vehicle Costs //
In the previous section, estimates were made about the cost of installing the early hydrogen infrastruc-ture before there are enough FCVs on the road to fully pay for that infrastructure through hydrogen sales. The automobile companies will face a similar challenge: the cost of producing initial fuel cell vehicles will be much greater than the cost of conventional gasoline cars. Over time, with mass produc-tion, FCV costs should come down, but initial FCV owners will have to pay extra for their zero-emission vehicles.
In addition to providing incentives for starting up the hydrogen infrastructure, the government may have to offer subsidies initially to cover the added cost of FCVs. The NRC and the ORNL reports both estimate incentives to buy-down all or part of the incremental cost of the FCV. The NRC report concludes that up to $40 billion might be required to cover increased FCV costs over baseline gasoline ICEVs. The ORNL report suggests that the government might not be required to cover the full in-cremental cost between gasoline ICEVs and FCVs, presumably on the assumption that many drivers, particularly early adopters, would be willing to pay some incremental cost for a high efficiency zero emission vehicle like the FCV. The ORNL suggests some combination of the government cost sharing of just 50 percent of the difference between a gasoline HEV (not an ICEV) and the FCV, or a 100 percent tax credit on that cost difference. They estimated a total cumulative government cost over the 2012-2025 time period of between $6.5 billion and $21 billion for vehicle incentives, or less than half the incentive estimated by the NRC.
0
0.2
0.4
0.6
0.8
1
1.2
2005 2015 2025 2035 2045 2055 2065 2075 2085 2095
100
60
20
2015 21002050
Figure 6.6
Annual US fuel
cell vehicle sales
compared to the 2008
NRC/NAE and Oak
Ridge data through
fuel cell vehicle market share of new car sales (%)
NRC case 1a (accelerated FCV)
ORLN case 3 (fastest FCV)
NRC case 1 (primary)
ORLN case 1 (slowest growth)
NHA
NRC case 1b (partial success)

The Energy Evolution
7.0
Conclusions

Page 37
Conclusions
The Energy Evolution
The economic progress of the last century has been built largely on petroleum. Our transportation sys-tem is heavily reliant upon it, however the growing global demand for and finite supply of oil make it imperative for us to look for different ways to power our society.
Achieving a sustainable automotive transportation system is a necessity to address our national energy challenges. Every day we hear about a more environmentally friendly fuel or vehicle with the potential to reduce our dependence on oil and, over the course of this century, the cars we drive, and the fuels we use for transportation, will change. They have to, if we are to reduce greenhouse gas pollution, urban air pollution, our consumption of oil, and the costs we pay as a society because of our dependence on oil for transportation.
While the National Hydrogen Association produced this report, the Association did not expect the results of the analysis to be so compellingly in favor of hydrogen. Hydrogen is secure, available, environ-mentally sustainable and economically viable and our research shows that hydrogen is the single most important legacy we can leave our society in the long-term.
Several viable alternative fuel/vehicle technologies already exist (hybrid electric vehicles) or are under-development (gasoline plug-in hybrids, battery electric vehicles and gasoline vehicles) to help us move toward a sustainable automotive transportation system. This mix is important to the transformation of the U.S. transportation system and must be encouraged for the near-term. However,
This study illustrates that only a scenario where hydrogen, used in a fuel cell vehicle (FCV), becomes dominant will simultaneously:
• cut greenhouse gas (GHG) pollution by 80 percent below 1990 levels;• reach petroleum energy quasi-independence by 2060;• eliminate nearly all controllable urban air pollution by the end of the century; and• reduce societal costs by up to $600 billion per year by 2100.
All the hydrogen needed to fuel hydrogen-powered vehicles can be produced from domestic energy sources, with the effect of mitigating the impact of energy price fluctuations or macroeconomic risks that flow from our heavy dependence on imported oil, and leaving us independent of energy from regions that are beset with political risk. And from production to distribution, the cost of building a hydrogen fueling infrastructure is affordable, especially when compared to the cost of maintaining the existing petroleum fueling infrastructure and its associated externality costs.
However, more action, investment and commitment is needed today to transition today’s transport-tion technologies into tomorrow and, specifically, to support the introduction of the hydrogen and fuel cell vehicle transportation solution. Public and private investment will play an important role in the evolution of America’s passenger vehicle transportation system away from petroleum.

The Energy Evolution
8.0
Glossary

Page 39
Glossary
The Energy Evolution
British Thermal Unit (BTU) unit of heat energy equal to the amount of heat re-•quired to raise the temperature of one pound of wa-ter by one degree Fahrenheit at sea level
carbon capture and
storage (CCS)
the process of capturing carbon dioxide (CO• 2), the main greenhouse gas, from large point sources such as fos-sil fuel power plants and storing it underground or in the ocean instead of releasing it into the atmosphere
carbon monoxide (CO) a colorless, odorless gas created whenever a fuel (such as •wood, gasoline, coal, natural gas, or kerosene) is burningcarbon monoxide interferes with blood’s abil-•ity to carry oxygen to the body’s tissues and re-sults in numerous adverse health effects
cellulosic ethanol ethanol fuel produced from cellulose, a naturally occurring •complex carbohydrate polymer found in plant cell walls
electricity grid the system comprising numerous lines and necessary auxiliary •systems for the transmission and distribution of electricity
feedstock any material that can be converted to an-•other form of fuel or energy product
fuel cell vehicle (FCV) a vehicle that is powered by a fuel cell that con-•verts the energy of a fuel (typically hydrogen) di-rectly to electricity and heat without combustionthe resulting electricity drives an electric motor, mak-•ing a fuel cell vehicle an all-electric vehicle
greenhouse gas a gas which acts like the glass in a greenhouse, trapping heat •in the earth’s atmosphere, to cause the greenhouse effecttwo of the most common greenhouses gases are carbon di-•oxide and methane, the main constituent of natural gas
hybrid electric ve-
hicle (HEV)
a vehicle that uses a combustion engine system to-•gether with an electric motor propulsion system
integrated gasification
combined cycle (IGCC)
a power plant using synthetic gas (syngas) typi-•cally derived by gasifying coalthis gas is often used to power a gas turbine generator •whose waste heat is passed to a steam turbine system
internal combustion engine
vehicle (ICEV)
a car that has a gasoline-powered engine, which combusts •the fuel, creating mechanical energy to propel the vehicle

Page 40
Glossary
The Energy Evolution
logistics curve a logistic function or logistic curve models the S-curve of growth •of some set (P) where P might be though of as populationthe initial stage of growth is approximately exponential; then, as •saturation begins, the growth slows, and at maturity, stops
marginal grid mix made up of the higher cost electrical generators that have to be •turned on to meet new loads such as charging vehicle batteries
marginal power the electrical generator that is used to produce ad-•ditional power when new loads are added to the elec-tricity grid (generally the generator with the highest operating costs, either natural gas or coal-fired)
nitrogen oxides (NOx) a general term pertaining to compounds of nitric acid (NO), •nitrogen dioxide (NO2), and other oxides of nitrogennitrogen oxides are created during combustion processes, and •are major contributors to smog formation and acid deposition
particles smaller than
10 microns (PM-10)
particulate matter less than 10 microns in size •(a micron is one millionth of a meter)particle pollutants include dust, ash, soot, lint, smoke, pol-•len, spores, algal cells and other suspended materialsparticles of this size are small enough to en-•ter deep into the lungs and cause irritation
particles smaller than
2.5 microns (PM-2.5)
particulate matter less than 2.5 microns in size•particulates are often the most visible form of air pol-•lution since they reduce visibility and leave dirty de-posits on windows, painted surfaces and textilesthe smaller PM-2.5 particles are believed to create •greater health risk than the larger PM-10 particles.
plug-in hybrid electric
vehicle (PHEV)
a hybrid vehicle with extra batteries that can be recharged by •connecting a plug to an electric power source (or the grid)
quad a unit of energy equal to one quadrillion (10• 15) BTUstotal US energy consumption is roughly 100 quads per year•
sulfur oxides (SOx) a family of gases, including sulfur dioxide (SO2) formed •when sulfur, or fossil fuels containing sulphur, burn in airthese gases contribute to acid rain and particu-•late formation in the lower atmosphere
volatile organic
compounds (VOC)
gaseous compounds containing carbon that readily evaporate•sources include fuel spills, industrial sites, some •household products, and combustion enginesa key ingredient in the formation of photochemical ozone, •a primary urban smog constituent and health threat