Embed Size (px)
Citation preview

An AHP Model of World Class Manufacturing Enablers for Indian Manufacturing Organizations
Ekta1, Dr. Rajeev Saha2
PG Student, Dept. of Mechanical Engineering, YMCA UST, Faridabad, Haryana1
Assistant Professor, Dept. of Mechanical Engineering, YMCA UST, Faridabad, Haryana2
[email protected], [email protected]
Abstract
The concept of World Class Manufacturing is essential for manufacturing firms for facing the competition in the market. Every manufacturing firm wants to attain the status of world class manufacturer. The purpose of this study is to identify World Class Manufacturing enablers (WCM) for Indian manufacturing firms and analyzing the weightages of the enablers with the help of AHP model. In this study 79 WCM enablers have been identified through literature review, opinions from experts and have been validated with the help of the survey conducted in different manufacturing firms. These enablers have been divided into 9 groups for developing the AHP hierarchical model for WCM implementation. These nine groups of enablers serve as criterion for the hierarchal model and the enablers under these criterions serves as the sub criterions for the AHP model. At the fourth level three manufacturing firms TATA MOTORS, HONDA and EICHER have been chosen as the alternatives. In criterions Manufacturing practices got the highest weightage, customer focus get the second highest weightage. A survey was conducted for the usage of enablers by these three alternatives and TATA MOTORS got the highest weightage of 0.3534 which shows that the enablers are best implemented in TATA MOTORS.
Keywords: WCM, Enablers, AHP, Model, manufacturing organizations.
1. Introduction
Due to changes in the global business environment, with the development of worldwide competition among the manufacturing firms and onset of the IT through firms have put pressure on business to constantly audit and make changes to their old manufacturing system. Global competition, rapidly changing technologies and shorter product life cycles have contributed in making the current manufacturing environment extremely competitive. Customers are demanding a greater variety of high quality, low cost goods and services. Organisations must consequently develop new methods and perspectives to meet these market needs in a timely and cost effective fashion. Achievement of an organization is organization's capacity to remain ahead of trends and to react powerfully to new market’s scope and variances thus the need to create and execute manufacturing techniques that show unmistakable outcomes and making the correct association with enhance business execution and incentive for all partners [1]. If a firm continues to excel in manufacturing, it may dominate world markets, in which case it would be called a “World-Class Manufacturer”. The Indian manufacturing firms are somewhat lacking in the manufacturing excellence at global level. In this study the WCM enablers have been identified and a hierarchical model have been developed with help of AHP technique for helping the Indian manufacturing firms to implement the WCM techniques for excellence in manufacturing and attaining global recognition leading to good profits and market share. The weightages for different criterions and sub
International Journal of Management, Technology And Engineering
Volume 8, Issue VI, JUNE/2018
ISSN NO : 2249-7455
Page No:142

criterions will help manufacturing firms to focus on the factors having more weightages.
2. Literature Review 2.1 World Class Manufacturing (WCM) World Class Manufacturing system have many definitions but all have the same meaning that is world best manufactures are known as World Class Manufacturing [2]. The manufactures who achieve dominance in global business environment and competition using their manufacturing skills, as a strategic tool are known to be World Class Manufacturers [3]. World class manufacturing system is a trend that originated by multi-functional teams and encompasses ideas of manufacturing design, continuous improvement of the process, total quality management and generalization of quality functions [4]. The result of implementation of WCM in an organization is the increase of the efficiency of organization in different areas of the organization by elimination of losses, wastage and losses due to safety [5].
2.1.1 Identified Enablers of WCM 79 enablers of WCM in the manufacturing organizations have been identified by the literature review and have been validated by the survey conducted in the manufacturing industries. The enablers have been divided into 9 groups 1. Focus on Competitive Quality (FCQ) 2. Implement Lean Manufacturing systems (LMS) 3. Total Productive Maintenance (TPM) 4. Cost Efficiency (CE) 5. Customers Focus (CUSF) 6. Company Policies (CMP) 7. Human Resources (HR) 8. Manufacturing Practices (MANP) 9. Quality Tools (QLT) Enablers in these groups with abbreviations have been shown in Table no. 1 to 9
Table 1. Enablers under group Focus on Competitive Quality
Needs of customers [6], [5], [16-17], [27] NCUS
Total quality control [6],[17],[19-20], [23], [27] TQC Intelligent manufacturing [6], [23] IM Total quality management [6], [11], [15], [18],[23], [25] TQM Kaizen [7], [12-15], [24] KAZ Kaizen blitz [7], [13] KAZB Kaikeku [7], [13] KAK Focused Improvement [8], [13], [14], [25] FI Strategic Flexibility [10] SF Improvement Culture [13], [27] IMC Top Management Commitment [13], [15-17], [19] TMC Process Quality Management [16] PQM Six Sigma [11], [15], [18] SS
Table 2. Enablers under group Implementation of Lean Manufacturing System
Just In Time Production [6], [19], [21], [23], [25] JIT
Just In Time Purchasing [6], [19], [23] JITP
Kanban [6], [14], [23] KAN
Logistic management [6] LM
International Journal of Management, Technology And Engineering
Volume 8, Issue VI, JUNE/2018
ISSN NO : 2249-7455
Page No:143

Optimised production technology [6] OPT
5S [14], [18-19] 5S
Lean six sigma [9] LSS
MUDA [12] MUD
MURI Analysis [14] MUR
Mura Analysis [14] MURI
Single Minute Exchange of Dies [14], [19] SMED
Table 3. Enablers under group Total Productive Maintenance
Autonomous and Professional maintenance [5], [8], [14], [28] APM
Early Equipment Maintenance [5], [14], [28] EEM
Early Product Management [14], [28] EPM
AM Tag [14], [28] AMT
WO tag [14], [28] WOT
PM tag [14] , [28] PMT
Maintenance cycles [14], [28] MC
Control cycles [14], [28] CC
Poke yoke [14-15], [19], [28] POK
Standard Operating Procedure [13], [28] SOP
Table 4. Enablers under group Cost efficiency
Cost deployment [5], [8], [14] CD
Electronic Data Interchange [6], [21] EDI
Simultaneous Engineering [6], [21] SE Reduced operating costs [6] ROC
Manufacturing Resource Planning [6], [21], [23] MRPII
Business Process re-engineering [6], [13], [23] BPR
Material Requirement Planning [6], [23] MRP
Table 5. Enablers under group Customer Focus
Response of Customers [6] RCUS
Logistics and Customer Services [8], [14], [18], [27] LCS
Customer Management[13], [15], [21] CM
Table 6. Enablers under group Company Policies
Global issues [6], [28] GLB
Local competitiveness [6], [28] LCS
Improving the range and quality of services [6], [28] QULS
Take advantage of being an early adopter [6], [28] EAD
Avoiding losing market share to competitors who are already implementing [6], [28]
MKTS
New Opportunities [6], [28] NOP
Time to market [6], [17], [28] TMKT
Electronic Commerce [6], [17] ECOM
Enterprise Resource Planning [6], [23] ERP
International Journal of Management, Technology And Engineering
Volume 8, Issue VI, JUNE/2018
ISSN NO : 2249-7455
Page No:144

Supply Chain Management [6], [13], [16], [23], [27] SCM
Safety [5], [8], [14], [25] SAF
Energy [14] ENE
Supplier Relationship Management [16], [18], [21] SRM
Table 7. Enablers under Human Resources
Quality circles [6], [23] QLC
People Development Programs [5], [8], [13-14], [27] PDP
Employee Involvement [13], [16] EI
Team Work [13], [16] TW
Quality Culture [13], [17] QC
Table 8. Enablers under group Manufacturing Practices
Flexible Manufacturing System [6], [15], [21], [23], [28] FMS
Computer Aided Design [6], [21], [23], [28] CAD
Computer Aided Manufacturing [6], [21], [23], [28] CAM
Computer Integrated Manufacturing [6] , [21], [23], [28] CIM
Group Technology [6], [28] GT
Agile Manufacturing [18], [21], [27-28] AMT
Table 9. Sub Criterion for Quality Tools
Statistical Process Control [19] SPC
X-Matrix [14] X-M
Material Matrix [14] MM
QA Matrix [14] QAM
QA Network [14] QAN
Inspection Cycles [14] INC
5W+IH [14] 5W
4M [14] 4M
5G [14] 5G
Shop Floor Management [13] SFM
Benchmarking [6], [13], [18], [21], [23] BNM
2.2 Analytic Hierarchy Process (AHP)
In numerous industrial engineering applications the ultimate decision depends on the assessment of various alternatives in terms of various criteria. This issue may turn into an exceptionally troublesome one when the criteria are defined in various units or the related information is hard to be evaluated. The Analytic Hierarchy Process (AHP) is a compelling methodology in managing with this sort of choice issues. The Analytic Hierarchy Process was introduced by Saaty [29-30] and is a multi-criteria decision-making approach. Qualitative and quantitative criteria are included into AHP technique. When there are multiple criteria and sub-criteria in the decision-making process then AHP is an ideal method for ranking alternatives. On the basis of the judgment of decision maker AHP gives a methodology for ranking alternative courses of action with respect to the importance of the criteria and the extent to which they are fulfilled by each alternative. These judgments in AHP are expressed in form of pairwise comparisons of items on a given level of the hierarchy with respect to their effect on the next higher level. The ease of
International Journal of Management, Technology And Engineering
Volume 8, Issue VI, JUNE/2018
ISSN NO : 2249-7455
Page No:145

importance of one item with respect to another is represented by the pairwise comparisons for achieving a goal or a criterion. An estimate of the ratio of the weights of the two criteria being compared is represented by pairwise comparison. AHP uses a ratio scale for judgments; the relative importance of the criteria in achieving the goal of the hierarchy is reflected by alternative weights [31]. A number of papers have been published in different areas which uses AHP for the selection of best alternatives. AHP have not been applied yet in field of WCM implementation so for best choice selection it has been used here.The different area in which AHP is recently used is shown in Table 10.
Table 10. Application of AHP in different areas
S.NO. Source RESEARCH FIELD
1. Singla et al.[32] Effectiveness of technology push strategies for achieving sustainable development
2. Pandey et al. [33] Green lean Six Sigma implementation
3. Gupta and Dubey [34] Ranking of Educational Web Sites in Indian Perspective
4. Bali and Amin [35] Supplier evaluation and selection
5. Singh [36] Implement Green Supply Chain Management in an automobile industry
3. Research Methodology In this article at first the enablers have been identified and validated through the survey. After this they have been grouped into 9 groups i.e. Focus on competitive quality, implementation of lean manufacturing, total productive maintenance, cost efficiency, customer focus, company policies, human resources, manufacturing practices and quality tools. After this AHP approach have been applied for calculating the priority of the enablers for groups and enablers in that groups.
3.1 AHP Methodology Steps followed in in AHP approach are as follows:
Problem statement is defined and the overall objective/goal of the problem is defined.
After this the identification of the criteria and sub-criteria affecting the overall objective of the problem are defined.
Develop the hierarchical structure of different levels of the problem constituting the overall objective, criteria, sub-criteria and alternatives.
Pairwise comparisons of each element in the corresponding level is done and are given numerical values according to the 9 point scale as shown in Table 11 developed by Satty [37]. This requires n (n – 1)/2 comparisons, where n is the number of elements. Diagonal elements are equal or 1 because their comparison is with themselves and the other elements will be reciprocals of the earlier pairwise comparisons.
Table 11. Satty [37] AHP 9-point Scale
scale Degree of preference
1 Equal importance
3 Moderate importance of one factor over another
5 Strong or essential importance
International Journal of Management, Technology And Engineering
Volume 8, Issue VI, JUNE/2018
ISSN NO : 2249-7455
Page No:146

7 Very strong importance
9 Extreme importance
2,4,6,8 Values for inverse comparison
Do necessary calculations for finding out the Consistency Index (CI), Consistency
Ratio (CR) and normalized values for each criterion, sub criterion and alternative. If the CI and CR are in the desired range then decision is taken on the basis of the
normalized values; otherwise the whole the procedure is repeated until these values are in the desired range.
The rank to each alternative is given by multiplication of each value in weight from the sub-criteria column by the respective value in the criteria weight column, then multiplying by the value for each available alternative and summing the results. Then the alternative with the highest sum is best option.
4. WCM AHP Model In the present case, the main objective is to select the best WCM organization in which WCM enablers have been applied and which have focus on competitive quality, implemented lean manufacturing concept, focused on TPM, have good company policies and is customer focused. This goal is placed at the top level of hierarchy i.e. WCM implementation have been placed on the top level. Nine groups of enablers have been for achievement of this goal. Which have been further divided into sub criterions. At the lowest level three manufacturing firms have been placed TATA MOTORS, HONDA and EICHER. The nine criterions are the nine groups in which enablers have been divided as discussed and their sub criterions re the enablers which come under these nine groups which have been shown in Table no. 1 to Table no. 9. The AHP model of WCM has been shown in Figure 1. 4.1 Weightage calculations for level 2 of WCM hierarchy Pair wise comparisons were made on the basis of the survey conducted. The pairwise comparison matrix has been shown in Table 12. In pair wise comparison the diagonal elements are compared with the element itself, so the value 1 is assigned in diagonal. Now the comparison of element 2 with respect to the element 1 will be the reciprocal of the comparison of element 1 with respect to element 2. So, in lower triangular matrix the elements are reciprocal of the corresponding elements of the upper triangular elements. The values are assigned on the nine point scale shown in the Table 11.The pairwise comparison matrix for criterion for WCM has been shown Table 12.
Table 12. Pairwise comparison matrix for criterion
FCQ LMS TPM CE CUS CM HR MANP QLT FCQ 1 3 2 0.5 0.5 2 2 0.33 2 LMS 0.33 1 0.5 0.5 0.5 0.5 0.5 0.2 0.5 TPM 0.5 2 1 2 0.5 3 0.5 2 2 CE 2 2 0.5 1 0.5 1 0.5 0.2 0.5 CUS 2 2 2 2 1 3 2 2 3 CM 0.5 2 0.333 1 0.33 1 0.33 0.2 1
HR 0.5 2 2 2 0.5 3.0 1 0.5 0.5 MANP 3 5 0.5 5 0.5 5 2 1 2 QLT 0.5 2 0.5 2 0.33 1 2 0.5 1 SUM 10.36 21 9.33 16 4.67 19.5 10.83 6.93 12.5
International Journal of Management, Technology And Engineering
Volume 8, Issue VI, JUNE/2018
ISSN NO : 2249-7455
Page No:147

Figure 1. AHP WCM model
Level 4
WCM Implementation
QLT
HR CMP CUSF
CE TPM FCQ MANP LMS
NCUS TQC IM TQM KAZ KAZB FI SF KAK IMC TMC PQM SS
JIT JITP KAN LM OPT 5S LSS MUD MUR MURI
APM EEM EPM AMT WOT PMT MC CC POK SOP
CD EDI SE ROC MRPI I BPR MRP
RCUS LCS CM
GLB LCS QULS EAD MKTS NOP TMKT ECOM ERP SCM SAF ENE SRM
QLC PDP EI TW QC
FMS CAD CAM CIM GT AMT
SPC X-M MM QA M QAN INC 5W 4M 5G SFM BNC
TATA EICHER HONDA
Level 1
Level 2
Level 3
International Journal of Management, Technology And Engineering
Volume 8, Issue VI, JUNE/2018
ISSN NO : 2249-7455
Page No:148

After pairwise comparison the sum of the columns is taken and each element in the column is divided by the sum of that particular column. Now after dividing the sum of each column will be 1, if checked. After this the sum of the rows is taken and the averages of the rows are found out. The normalized matrix for WCM enablers has been shown in Table 13.
Table 13. Normalized matrix for criterion
FCQ LMS TPM CE CUSF CM HR MANP QLT WEIGHTAGE
FCQ 0.096 0.143 0.214 0.031 0.107 0.102 0.185 0.048 0.160 0.121
LMS 0.032 0.048 0.054 0.031 0.107 0.026 0.046 0.029 0.040 0.046
TPM 0.048 0.095 0.107 0.125 0.107 0.154 0.046 0.289 0.160 0.126
CE 0.193 0.095 0.054 0.063 0.107 0.051 0.046 0.017 0.040 0.074
CUSF 0.193 0.095 0.214 0.125 0.214 0.154 0.185 0.289 0.240 0.190
CMP 0.048 0.095 0.036 0.063 0.071 0.051 0.030 0.029 0.080 0.056
HR 0.048 0.095 0.214 0.125 0.107 0.155 0.092 0.072 0.040 0.106
MANP 0.292 0.238 0.054 0.313 0.107 0.256 0.185 0.144 0.160 0.194
QLT 0.048 0.187 0.054 0.125 0.071 0.051 0.185 0.072 0.080 0.097
These average of the rows are the priority vectors or in simple words weights for
the each criterion. The ranking is done on the basis of these priority vectors but before this the consistency must be checked. Consistency is checked because of the human prioritization and errors involved. If Consistency ratio is less than 0.1 or less than 10% then the ranking can be done for the given weights obtained. If consistency ratio is more than that then the necessary changes have to be done in the pairwise comparisons till the consistency ratio becomes less than 0.1.
Consistency ratio = CI / RI Where CI = Consistency index and CI = (ƛmax – N) / (N-1) Where, ƛmax = Maximum Eigen value N = No. of comparisons Consistency measure is calculated, summation is done and after that average is taken and the average obtained is called as maximum Eigen value i.e. ƛmax. Here , ƛmax = 10.240 RI = Random index which depends on the no. of the elements in the comparison. From Figure 2. RI value for N=9 is 1.45. CI = 0.155 Consistency Ratio = 0.10 which is equal 0.1 hence results are consistent. Hence the results obtained are consistent and ranking can be done on the basis of the priority vectors.
N 1 2 3 4 5 6 7 8 9 10 11 12 13
RI 0 0 0.6 0.9 1.1 1.2 1.3 1 1.5 1.5 1.51 1.5 1.55
Figure 2. RI values for N [37] Here, Enabler MANP i.e. manufacturing practices have highest weightage of 0.194 that is 19.4 %. Hence, for a manufacturing firm to implement WCM successfully they should focus manufacturing practices. CUSF i.e. customer focus has almost equal importance as that of MANP 0.19. While the LMP i.e. lean manufacturing implementation has least weightage of 4%.
International Journal of Management, Technology And Engineering
Volume 8, Issue VI, JUNE/2018
ISSN NO : 2249-7455
Page No:149

4.2 Weightage Calculations for Level 3 of WCM Hierarchy Here weightages are calculated for the sub criterions present in the third level of hierarchy. The weightages obtained are local weightages for sub criterions. Global weightages for each sub criterion will be obtained by multiplying the weightages of criterions in level two with the weightages of the sub criterion for that particular criterion. Weightages for sub criterion have been shown from Table no 14 to Table no. 22. In criterion Focus on Competitive Quality; sub criterions customer focus, TQC and TQM have maximum weightage of 0.14. In criterion Implementation of lean manufacturing; sub criterions logistic management has maximum weightage of 0.218. In criterion TPM; sub criterion control cycles has maximum weightage of 0.272. In criterion Cost efficiency; cost deployment has maximum weightage of 0.276. In criterion customer focus; sub criterions response of customers and customer services has maximum weightage of 0.40. In criterion company policies criterion safety has maximum weightage of 0.172. In criterion Human resources sub criterion i.e. Quality culture has maximum weightage of 0.31. In criterion Manufacturing practices; sub criterion computer aided manufacturing has maximum weightage of 0.379. In criterion Quality tools; sub criterion 4M has maximum weightage of 0.224.
4.3 Weightage Calculations for Level 4 WCM Hierarchy In this three WCM firms TATA MOTORS, EICHER and HONDA have been chosen as alternatives. A survey was conducted to find out the WCM enablers being used by these firms and the weightage of each sub criterion is calculated for these organizations. At first global weightage of each sub criterion is calculated by multiplying the weightage of the criterion in level 2 of hierarchy with the weightage of the sub criterions in level 3 of WCM hierarchy. After this weightage of each sub criterion in level 2 is calculated for the alternatives by multiplying the weightages of TATA MOTORS, EICHER and HONDA for each sub criterion. At last all the weightages of the sub criterion for each firm is summed up and the firm with the highest weightage will be the best manufacturing firm which have successfully implemented WCM enablers.
In criterion Focus on Competitive Quality summation of all weightages for TATA MOTORS, EICHER and HONDA of sub criterions comes out to be 0.0408, 0.0408 and 0.0390 respectively. The calculations have been shown in Table 23.
In criterion Implementation of Lean Manufacturing System summation of all weightages for TATA MOTORS, EICHER and HONDA of sub criterions comes out to be 0.0169, 0.0127 and 0.0162 respectively. The calculations have been shown in Table 24.
In criterion TPM summation of weightages comes out to be 0.0455, 0.0428 and 0.0373 respectively for TATA MOTORS, EICHER and HONDA as shown in Table 25.
In criterion Cost efficiency summation of weightages comes out to be 0.0284, 0.0235 and 0.0220 for TATA MOTORS, EIHER and HONDA respectively as shown in Table 26.
For criterion Customer focus summation of weightages comes out to be 0.0632, 0.0632 and 0.0632 for TATA MOTORS, EICHER and HONDA respectively. The calculations have been shown in Table 27.
For Company Policies the summation is 0.0287, 0.0252 and 0.0289 respectively for three alternatives as shown in Table 28. In the same way the calculations for other criterions have been shown from Table no. 29 to Table no.31.
International Journal of Management, Technology And Engineering
Volume 8, Issue VI, JUNE/2018
ISSN NO : 2249-7455
Page No:150
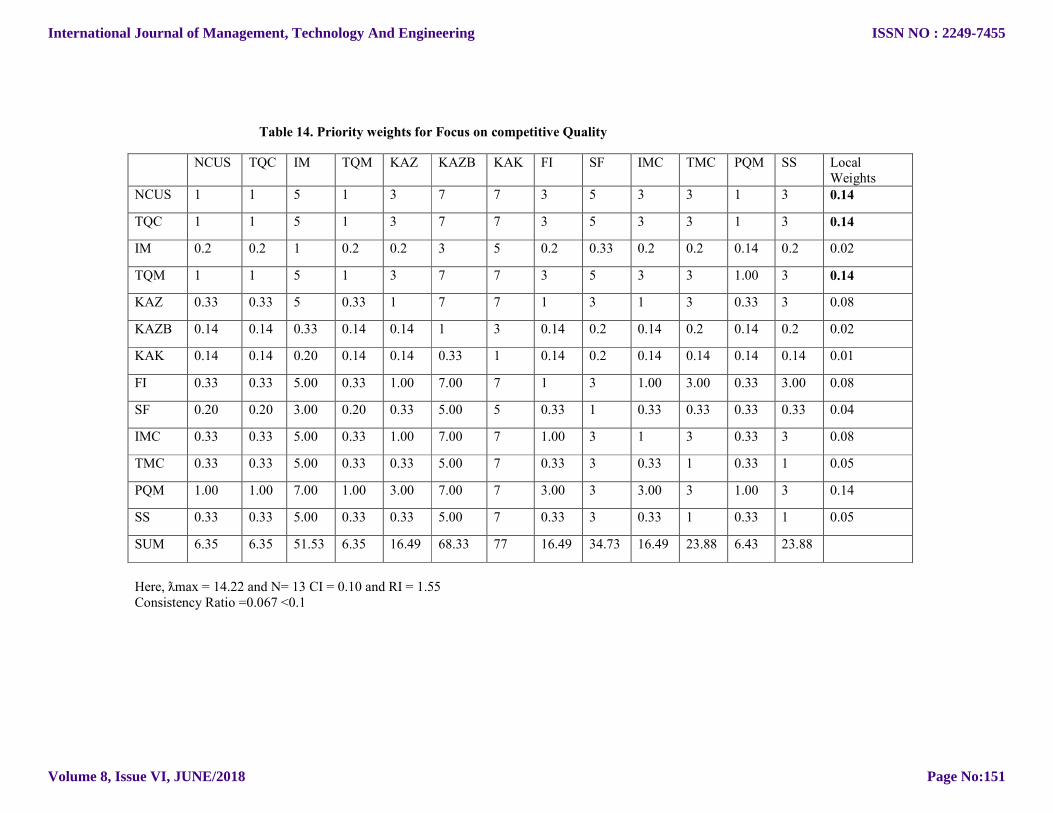
Table 14. Priority weights for Focus on competitive Quality
Here, ƛmax = 14.22 and N= 13 CI = 0.10 and RI = 1.55 Consistency Ratio =0.067 <0.1
NCUS TQC IM TQM KAZ KAZB KAK FI SF IMC TMC PQM SS Local Weights
NCUS 1 1 5 1 3 7 7 3 5 3 3 1 3 0.14
TQC 1 1 5 1 3 7 7 3 5 3 3 1 3 0.14
IM 0.2 0.2 1 0.2 0.2 3 5 0.2 0.33 0.2 0.2 0.14 0.2 0.02
TQM 1 1 5 1 3 7 7 3 5 3 3 1.00 3 0.14
KAZ 0.33 0.33 5 0.33 1 7 7 1 3 1 3 0.33 3 0.08
KAZB 0.14 0.14 0.33 0.14 0.14 1 3 0.14 0.2 0.14 0.2 0.14 0.2 0.02
KAK 0.14 0.14 0.20 0.14 0.14 0.33 1 0.14 0.2 0.14 0.14 0.14 0.14 0.01
FI 0.33 0.33 5.00 0.33 1.00 7.00 7 1 3 1.00 3.00 0.33 3.00 0.08
SF 0.20 0.20 3.00 0.20 0.33 5.00 5 0.33 1 0.33 0.33 0.33 0.33 0.04
IMC 0.33 0.33 5.00 0.33 1.00 7.00 7 1.00 3 1 3 0.33 3 0.08
TMC 0.33 0.33 5.00 0.33 0.33 5.00 7 0.33 3 0.33 1 0.33 1 0.05
PQM 1.00 1.00 7.00 1.00 3.00 7.00 7 3.00 3 3.00 3 1.00 3 0.14
SS 0.33 0.33 5.00 0.33 0.33 5.00 7 0.33 3 0.33 1 0.33 1 0.05
SUM 6.35 6.35 51.53 6.35 16.49 68.33 77 16.49 34.73 16.49 23.88 6.43 23.88
International Journal of Management, Technology And Engineering
Volume 8, Issue VI, JUNE/2018
ISSN NO : 2249-7455
Page No:151

Table 15. Priority Weights for Implementation of Lean Manufacturing System
ƛmax = 12.1305, N= 11, CI = 0.1130 and RI = 1.53 Consistency Ratio = 0.073 < 0.1
JIT JITP KAN LM OPT 5S LSS MUD MUR MUR SMED Local weights
JIT 1 3 0.2 0.2 0.2 0.2 0.2 0.2 0.2 0.2 0.3333 0.0232
JITP 0.3 1 0.2 0.142 0.142 0.142 0.20 0.20 0.2 0.2 0.2 0.0154
KAN 5 5 1 0.333 0.333 0.333 0.333 1 0.333 1 3 0.0628
LM 5 7 3 1 3 3 3 3 3 3 5 0.2181
OPT 5 7 3 0.333 1 3 3 3 3 3 5 0.1746
5S 5 7 3 0.333 0.333 1 3 3 3 3 3 0.1397
LSS 5 5 3 0.333 0.333 0.333 1 3 1 3 3 0.1014
MUD 5 5 1 0.333 0.333 0.333 0.333 1 0.333 1 3 0.0628
MUR 5 5 3 0.333 0.333 0.333 1 3 1 3 3 0.1014
MUR 5 5 1 0.333 0.333 0.333 0.333 1 0.333 1 3 0.0628
SMED 3 5 0.333 0.2 0.2 0.333 0.333 0.333 0.333 0.333 1 0.0378
SUM 44.3 55 18.73 3.876 6.542 9.342 12.73 18.73 12.73 18.73 29.53
International Journal of Management, Technology And Engineering
Volume 8, Issue VI, JUNE/2018
ISSN NO : 2249-7455
Page No:152

Table 16. Priority Weights for Sub criterions Of TPM
ƛmax = 11.0345, N = 10 CI = 0.114 and RI = 1.49 Consistency Ratio = 0.07715 < 0.1
APM EEM EPM AMT WOT PMT MC CC POK SOP Local Weights
APM 1 0.333 1 5 5 5 0.333 0.2 3 0.333 0.0806
EEM 3 1 3 7 5 5 0.333 0.333 3 0.333 0.1183
EPM 1 0.333 1 5 5 3 0.333 0.2 3 0.333 0.0745
AMT 0.2 0.143 0.2 1 0.3333 0.333 0.142 0.143 0.2 0.142 0.0171
WOT 0.2 0.2 0.2 3 1 0.333 0.2 0.143 0.333 0.2 0.0255
PMT 0.2 0.2 0.333 3 3 1 0.2 0.2 0.333 0.2 0.0353
MC 3 3 3 7 5 5 1 0.333 5 1 0.1631
CC 5 3 5 7 7 5 3 1 5 3 0.2726
POK 0.333 0.333 0.333 5 3 3 0.2 0.2 1 0.2 0.0499
SOP 3 3 3 7 5 5 1 0.333 5 1 0.1631
SUM 16.933 11.542 17.066 50 39.333 32.667 6.742 3.086 25.867 6.743
International Journal of Management, Technology And Engineering
Volume 8, Issue VI, JUNE/2018
ISSN NO : 2249-7455
Page No:153
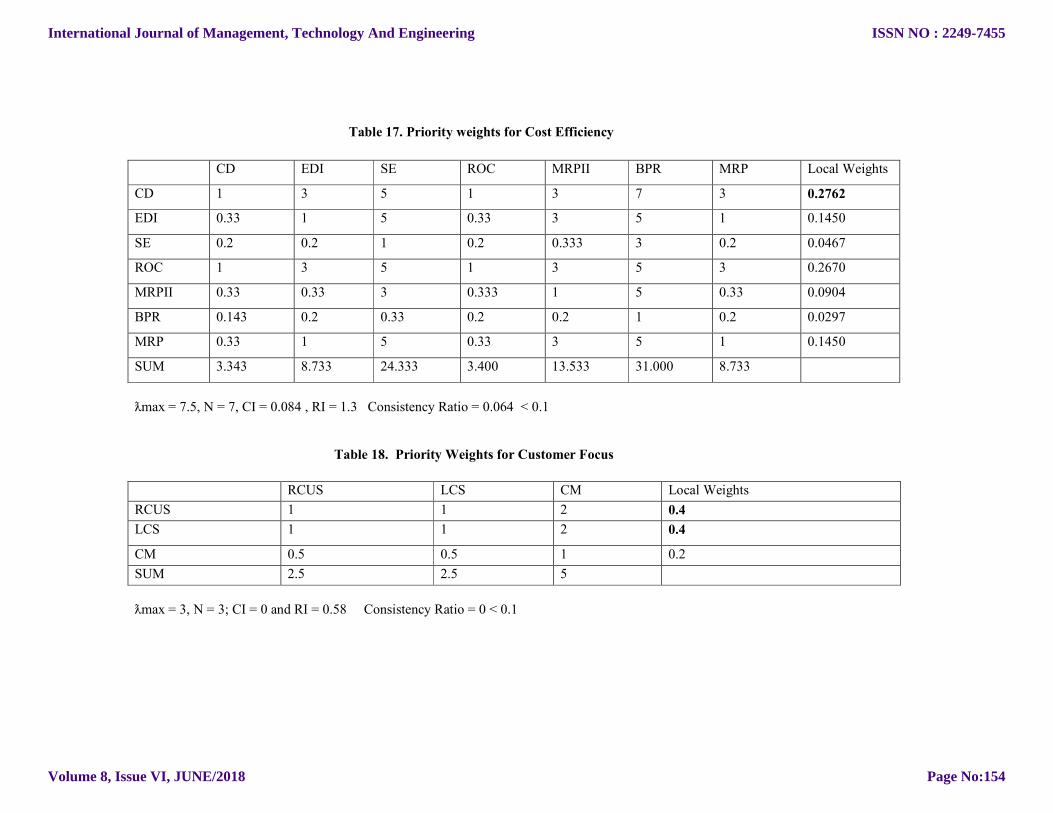
Table 17. Priority weights for Cost Efficiency
ƛmax = 7.5, N = 7, CI = 0.084 , RI = 1.3 Consistency Ratio = 0.064 < 0.1
Table 18. Priority Weights for Customer Focus
ƛmax = 3, N = 3; CI = 0 and RI = 0.58 Consistency Ratio = 0 < 0.1
CD EDI SE ROC MRPII BPR MRP Local Weights
CD 1 3 5 1 3 7 3 0.2762
EDI 0.33 1 5 0.33 3 5 1 0.1450
SE 0.2 0.2 1 0.2 0.333 3 0.2 0.0467
ROC 1 3 5 1 3 5 3 0.2670
MRPII 0.33 0.33 3 0.333 1 5 0.33 0.0904
BPR 0.143 0.2 0.33 0.2 0.2 1 0.2 0.0297
MRP 0.33 1 5 0.33 3 5 1 0.1450
SUM 3.343 8.733 24.333 3.400 13.533 31.000 8.733
RCUS LCS CM Local Weights
RCUS 1 1 2 0.4
LCS 1 1 2 0.4
CM 0.5 0.5 1 0.2
SUM 2.5 2.5 5
International Journal of Management, Technology And Engineering
Volume 8, Issue VI, JUNE/2018
ISSN NO : 2249-7455
Page No:154

Table 19. Priority Weights for Sub Factors of Company Policies
ƛmax = 14.17, N = 13, CI = 0.097 and RI = 1.551 Consistency Ratio = 0.063 < 0.1
GLB LCS QULS EAD MKTS NOP TMKT ECOM ERP SCM SAF ENE SRM Local Weights
GLB 1 5 3 1 5 0.333 5 3 5 3 0.333 3 1 0.1047
LCS 0.2 1 0.2 0.2 3 0.143 1 0.2 1 0.2 0.143 0.2 0.2 0.0198
QULS 0.333 5 1 0.333 5 0.333 5 1 5 1 0.333 3 0.333 0.0666
EAD 1 5 3 1 7 0.333 5 3 5 3 0.333 3 1 0.1072
MKTS 0.2 0.333 0.2 0.143 1 0.2 0.333 0.2 0.333 0.2 0.143 0.2 0.143 0.0144
NOP 3 7 3 3 5 1 7 3 7 3 1 3 3 0.1758
TMKT 0.2 1 0.2 0.2 3 0.143 1 0.2 1 0.2 0.143 0.2 0.2 0.0198
ECOM 0.333 5 1 0.333 5 0.333 5 1 5 1 0.333 3 0.333 0.0666
ERP 0.2 1 0.2 0.2 3 0.143 1 0.2 1 0.2 0.143 0.2 0.2 0.0198
SCM 0.333 5 1 0.333 5 0.333 5 1 5 1 0.333 3 0.333 0.0666
SAF 3 7 3 3 7 1 7 3 7 3 1 3 3 0.1784
ENE 0.333 5 0.333 0.333 5 0.333 5 0.333 5 0.333 0.333 1 0.333 0.0526
SRM 1 5 3 1 7 0.333 5 3 5 3 0.333 3 1 0.1072
SUM 11.13 52.33 19.13 11.08 61 4.962 52.33 19.13 52.33 19.13 4.905 25.8 11.07
International Journal of Management, Technology And Engineering
Volume 8, Issue VI, JUNE/2018
ISSN NO : 2249-7455
Page No:155

Table 20. Priority Weights for Sub Criterion of Human Resources
ƛmax = 5.17, N = 5, CI = 0.044 and RI = 1.1 Consistency Ratio = 0.04 < 0.1
Table 21. Priority Weights for Sub Criterions of Manufacturing Practices
ƛmax = 6.4102, N = 6, CI = 0.0821 and RI = 1.24 Consistency Ratio = 0.067 < 0.1
QLC PDP EI TW QC Local Weights
QLC 1 2 0.3333 0.333333333 0.3333 0.09821
PDP 0.5000 1 0.2500 0.2500 0.2500 0.06223
EI 3 4 1 0.5000 1 0.24347
TW 3 4 2 1 0.5000 0.27916
QC 3 4 1 2 1 0.31694
SUM 10.5 15 4.58333 4.08333 3.0333
FMS CAD CAM CIM GT AMT Local Weights
FMS 1 0.3333 0.2 0.3333 0.3333 3 0.0758
CAD 3 1 0.3333 3 3 3 0.2302
CAM 5 3 1 3 3 5 0.3792
CIM 3 0.3333 0.3333 1 1 3 0.1324
GT 3 0.3333 0.3333 1 1 3 0.1324
AMT 0.3333 0.3333 0.2 0.3333 0.3333 1 0.0500
SUM 15.3333 5.3333 2.4 8.6667 8.6667 18
International Journal of Management, Technology And Engineering
Volume 8, Issue VI, JUNE/2018
ISSN NO : 2249-7455
Page No:156

Table 22. Priority Weights for Sub Criterions of Quality Tools
ƛmax =12.03701, N = 11, CI = 0.1037 and RI = 1.51 Consistency Ratio = 0.687 < 0.1.
SPC X-M MM QAM QAN INC 5W 4M 5G SFM BNC Local Weights
SPC 1 5 3 0.333 0.333 0.333 0.333 0.333 5 1 3 0.0702
X-M 0.2 1 0.333 0.2 0.2 0.2 0.2 0.143 1 0.2 0.2 0.0188
MM 0.3333 3 1 0.2 0.2 0.2 0.2 0.2 3 0.333 0.333 0.0315
QAM 3 5 5 1 1 0.333 1 0.333 5 3 3 0.1125
QAN 3 5 5 1 1 0.333 1 0.333 5 3 3 0.1125
INC 3 5 5 3 3 1 3 0.333 5 3 3 0.1732
5W 3 5 5 1 1 0.333 1 0.333 5 3 3 0.1125
4M 3 7 5 3 3 3 3 1 7 3 3 0.2243
5G 0.2 1 0.333 0.2 0.2 0.2 0.2 0.143 1 0.2 0.2 0.0188
SFM 1 5 3 0.333 0.333 0.333 0.333 0.333 5 1 3 0.0702
BNC 0.333 5 3 0.333 0.333 0.333 0.333 0.333 5 0.333 1 0.0554
SUM 18.06 47 35.66 10.6 10.6 6.6 10.6 3.819 47 18.06 22.73
International Journal of Management, Technology And Engineering
Volume 8, Issue VI, JUNE/2018
ISSN NO : 2249-7455
Page No:157
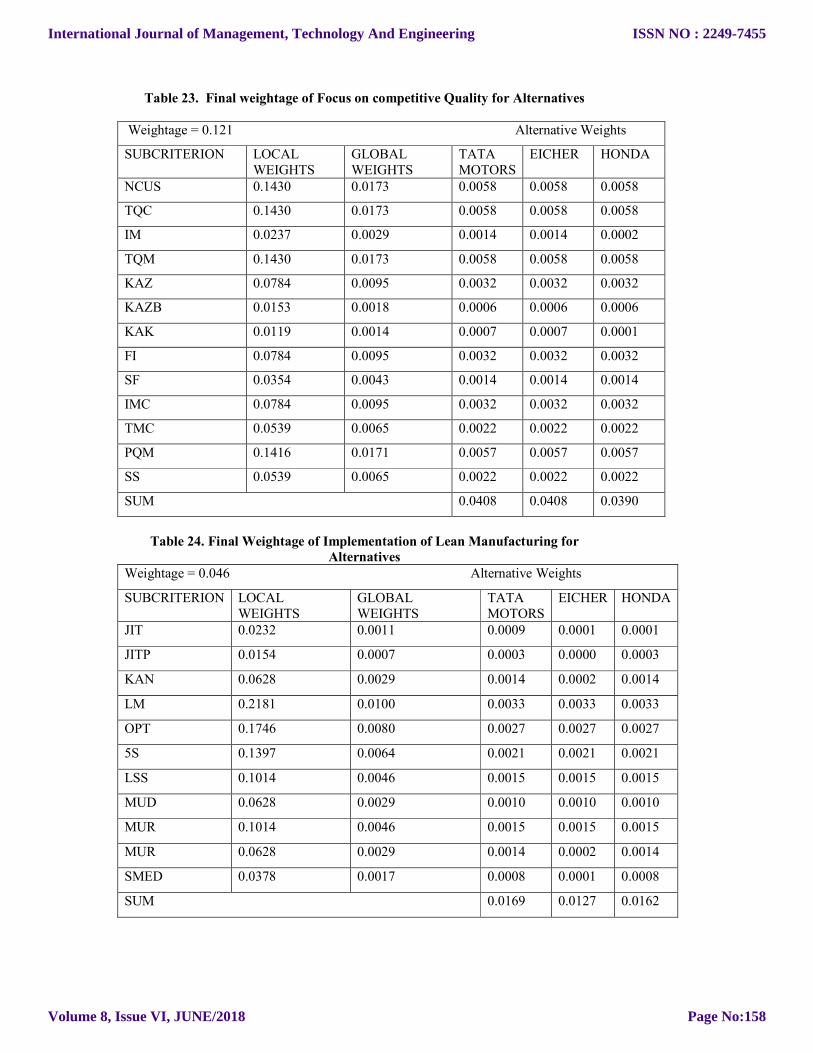
Table 23. Final weightage of Focus on competitive Quality for Alternatives Weightage = 0.121 Alternative Weights
SUBCRITERION LOCAL WEIGHTS
GLOBAL WEIGHTS
TATA MOTORS
EICHER HONDA
NCUS 0.1430 0.0173 0.0058 0.0058 0.0058
TQC 0.1430 0.0173 0.0058 0.0058 0.0058
IM 0.0237 0.0029 0.0014 0.0014 0.0002
TQM 0.1430 0.0173 0.0058 0.0058 0.0058
KAZ 0.0784 0.0095 0.0032 0.0032 0.0032
KAZB 0.0153 0.0018 0.0006 0.0006 0.0006
KAK 0.0119 0.0014 0.0007 0.0007 0.0001
FI 0.0784 0.0095 0.0032 0.0032 0.0032
SF 0.0354 0.0043 0.0014 0.0014 0.0014
IMC 0.0784 0.0095 0.0032 0.0032 0.0032
TMC 0.0539 0.0065 0.0022 0.0022 0.0022
PQM 0.1416 0.0171 0.0057 0.0057 0.0057
SS 0.0539 0.0065 0.0022 0.0022 0.0022
SUM 0.0408 0.0408 0.0390
Table 24. Final Weightage of Implementation of Lean Manufacturing for
Alternatives Weightage = 0.046 Alternative Weights
SUBCRITERION LOCAL WEIGHTS
GLOBAL WEIGHTS
TATA MOTORS
EICHER HONDA
JIT 0.0232 0.0011 0.0009 0.0001 0.0001
JITP 0.0154 0.0007 0.0003 0.0000 0.0003
KAN 0.0628 0.0029 0.0014 0.0002 0.0014
LM 0.2181 0.0100 0.0033 0.0033 0.0033
OPT 0.1746 0.0080 0.0027 0.0027 0.0027
5S 0.1397 0.0064 0.0021 0.0021 0.0021
LSS 0.1014 0.0046 0.0015 0.0015 0.0015
MUD 0.0628 0.0029 0.0010 0.0010 0.0010
MUR 0.1014 0.0046 0.0015 0.0015 0.0015
MUR 0.0628 0.0029 0.0014 0.0002 0.0014
SMED 0.0378 0.0017 0.0008 0.0001 0.0008
SUM 0.0169 0.0127 0.0162
International Journal of Management, Technology And Engineering
Volume 8, Issue VI, JUNE/2018
ISSN NO : 2249-7455
Page No:158
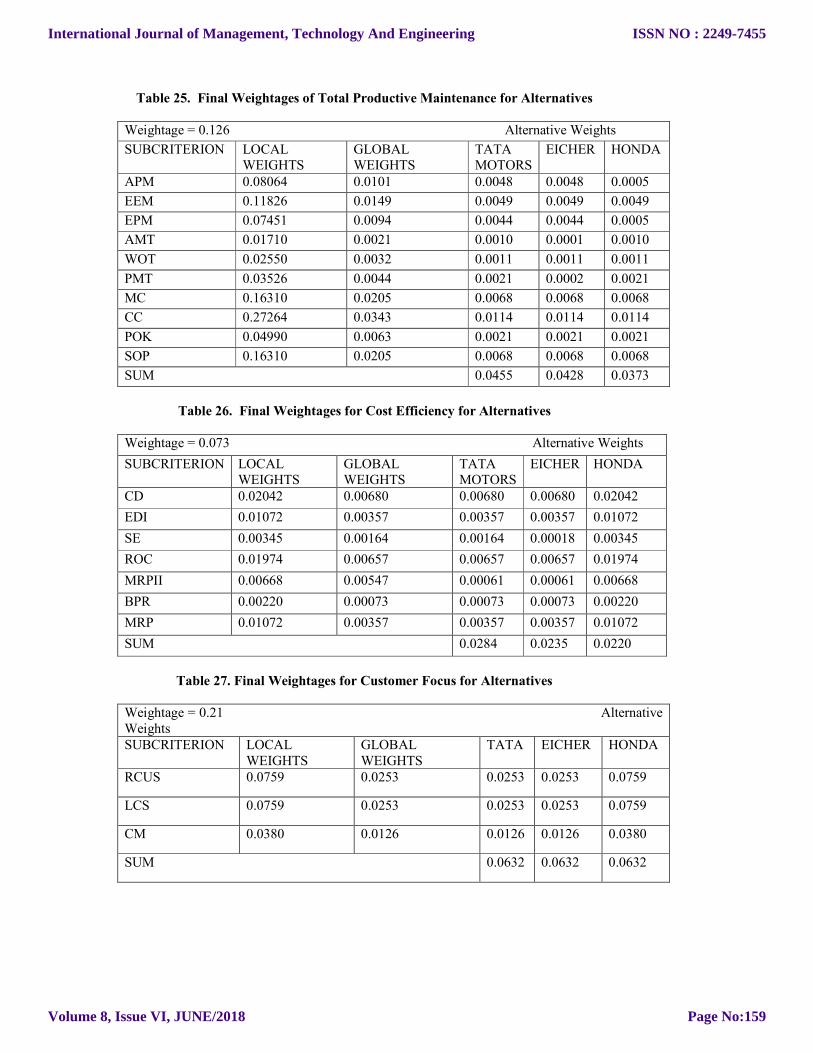
Table 25. Final Weightages of Total Productive Maintenance for Alternatives
Weightage = 0.126 Alternative Weights
SUBCRITERION LOCAL WEIGHTS
GLOBAL WEIGHTS
TATA MOTORS
EICHER HONDA
APM 0.08064 0.0101 0.0048 0.0048 0.0005
EEM 0.11826 0.0149 0.0049 0.0049 0.0049
EPM 0.07451 0.0094 0.0044 0.0044 0.0005
AMT 0.01710 0.0021 0.0010 0.0001 0.0010
WOT 0.02550 0.0032 0.0011 0.0011 0.0011
PMT 0.03526 0.0044 0.0021 0.0002 0.0021
MC 0.16310 0.0205 0.0068 0.0068 0.0068
CC 0.27264 0.0343 0.0114 0.0114 0.0114
POK 0.04990 0.0063 0.0021 0.0021 0.0021
SOP 0.16310 0.0205 0.0068 0.0068 0.0068
SUM 0.0455 0.0428 0.0373
Table 26. Final Weightages for Cost Efficiency for Alternatives
Weightage = 0.073 Alternative Weights
SUBCRITERION LOCAL WEIGHTS
GLOBAL WEIGHTS
TATA MOTORS
EICHER HONDA
CD 0.02042 0.00680 0.00680 0.00680 0.02042
EDI 0.01072 0.00357 0.00357 0.00357 0.01072
SE 0.00345 0.00164 0.00164 0.00018 0.00345
ROC 0.01974 0.00657 0.00657 0.00657 0.01974
MRPII 0.00668 0.00547 0.00061 0.00061 0.00668
BPR 0.00220 0.00073 0.00073 0.00073 0.00220
MRP 0.01072 0.00357 0.00357 0.00357 0.01072
SUM 0.0284 0.0235 0.0220
Table 27. Final Weightages for Customer Focus for Alternatives
Weightage = 0.21 Alternative Weights SUBCRITERION LOCAL
WEIGHTS GLOBAL WEIGHTS
TATA EICHER HONDA
RCUS 0.0759 0.0253 0.0253 0.0253 0.0759
LCS 0.0759 0.0253 0.0253 0.0253 0.0759
CM 0.0380 0.0126 0.0126 0.0126 0.0380
SUM 0.0632 0.0632 0.0632
International Journal of Management, Technology And Engineering
Volume 8, Issue VI, JUNE/2018
ISSN NO : 2249-7455
Page No:159

Table 28. Final Weightages foe Company Policies for Alternatives Weightage = 0.056 Alternative Weights SUBCRITERION LOCAL
WEIGHTS GLOBAL WEIGHTS
TATA MOTORS
EICHER HONDA
GLB 0.0059 0.0020 0.0020 0.0020 0.0059
LCS 0.0011 0.0001 0.0005 0.0005 0.0011
QULS 0.0037 0.0018 0.0002 0.0018 0.0037
EAD 0.0060 0.0020 0.0020 0.0020 0.0060
MKTS 0.0008 0.0004 0.0004 0.0000 0.0008
NOP 0.0098 0.0033 0.0033 0.0033 0.0098
TMKT 0.0011 0.0004 0.0004 0.0004 0.0011
ECOM 0.0037 0.0012 0.0012 0.0012 0.0037
ERP 0.0011 0.0004 0.0004 0.0004 0.0011
SCM 0.0037 0.0012 0.0012 0.0012 0.0037
SAF 0.0100 0.0033 0.0033 0.0033 0.0100
ENE 0.0029 0.0014 0.0002 0.0014 0.0029
SRM 0.0060 0.0020 0.0020 0.0020 0.0060
SUM 0.0194 0.0170 0.0195
Table 29. Final Weightage for Human Resources for Alternatives Weightage = 0.11 Alternative Weights
SUBCRITERION LOCAL WEIGHTS
GLOBAL WEIGHTS
TATA MOTORS
EICHER HONDA
QLC 0.0982 0.0104 0.0035 0.0035 0.0035
PDP 0.0622 0.0066 0.0022 0.0022 0.0022
EI 0.2435 0.0257 0.0086 0.0086 0.0086
TW 0.2792 0.0295 0.0098 0.0098 0.0098
QC 0.3169 0.0334 0.0111 0.0111 0.0111
SUM 0.0351 0.0351 0.0351
Table 30. Final Weightage for Manufacturing Practices for Alternatives Weightage = 0.194 Alternative Weights
SUBCRITERION LOCAL WEIGHTS
GLOBAL WEIGHTS
TATA MOTORS
EICHER HONDA
FMS 0.0758 0.0147 0.0049 0.0049 0.0049
CAD 0.2302 0.0447 0.0149 0.0149 0.0149
International Journal of Management, Technology And Engineering
Volume 8, Issue VI, JUNE/2018
ISSN NO : 2249-7455
Page No:160

CAM 0.3792 0.0737 0.0245 0.0245 0.0245
CIM 0.1324 0.0257 0.0086 0.0086 0.0086
GT 0.1324 0.0257 0.0086 0.0086 0.0086
AMT 0.0500 0.0097 0.0079 0.0009 0.0009
SUM 0.0694 0.0623 0.0623
Table 31. Final Weightage for Quality Tools for Alternatives Weightage = 0.097 Alternative Weights
SUBCRITERION LOCAL WEIGHTS
GLOBAL WEIGHTS
TATA MOTORS
EICHER HONDA
SPC 0.0702 0.0068 0.0023 0.0023 0.0023
X-M 0.0188 0.0018 0.0015 0.0002 0.0002
MM 0.0315 0.0031 0.0014 0.0014 0.0002
QAM 0.1125 0.0109 0.0036 0.0036 0.0036
QAN 0.1125 0.0109 0.0036 0.0036 0.0036
INC 0.1732 0.0168 0.0056 0.0056 0.0056
5W 0.1125 0.0109 0.0036 0.0036 0.0036
4M 0.2243 0.0218 0.0072 0.0072 0.0072
5G 0.0188 0.0018 0.0009 0.0001 0.0009
SFM 0.0702 0.0068 0.0023 0.0023 0.0023
BNC 0.0554 0.0054 0.0025 0.0025 0.0003
SUM 0.0346 0.0325 0.0298
Now all the final weightages obtained for the alternatives TATA, EICHER
and HONDA are added for each criterion as shown in Table 6.31. The manufacturing organization with maximum weightage will be best for WCM implementation and other companies should use the enablers used by that organization for implementation of WCM in the organization.
Weightage of TATA = 0.3534 Weightage of EICHER = 0.33 Weightage of HONDA = 0.3245
Table 32. Final weightages for Alternatives CRITERION TATA MOTORS EICHER HONDA
FCQ 0.0408 0.0408 0.0390
LMS 0.0169 0.0127 0.0162
TPM 0.0455 0.0428 0.0373
CE 0.0284 0.0235 0.0220
CUSF 0.0632 0.0632 0.0632
CMP 0.0194 0.0170 0.0195
HR 0.0351 0.0351 0.0351
MANP 0.0694 0.0623 0.0623
QLT 0.0346 0.0325 0.0298
SUM 0.3534 0.3300 0.3245
International Journal of Management, Technology And Engineering
Volume 8, Issue VI, JUNE/2018
ISSN NO : 2249-7455
Page No:161
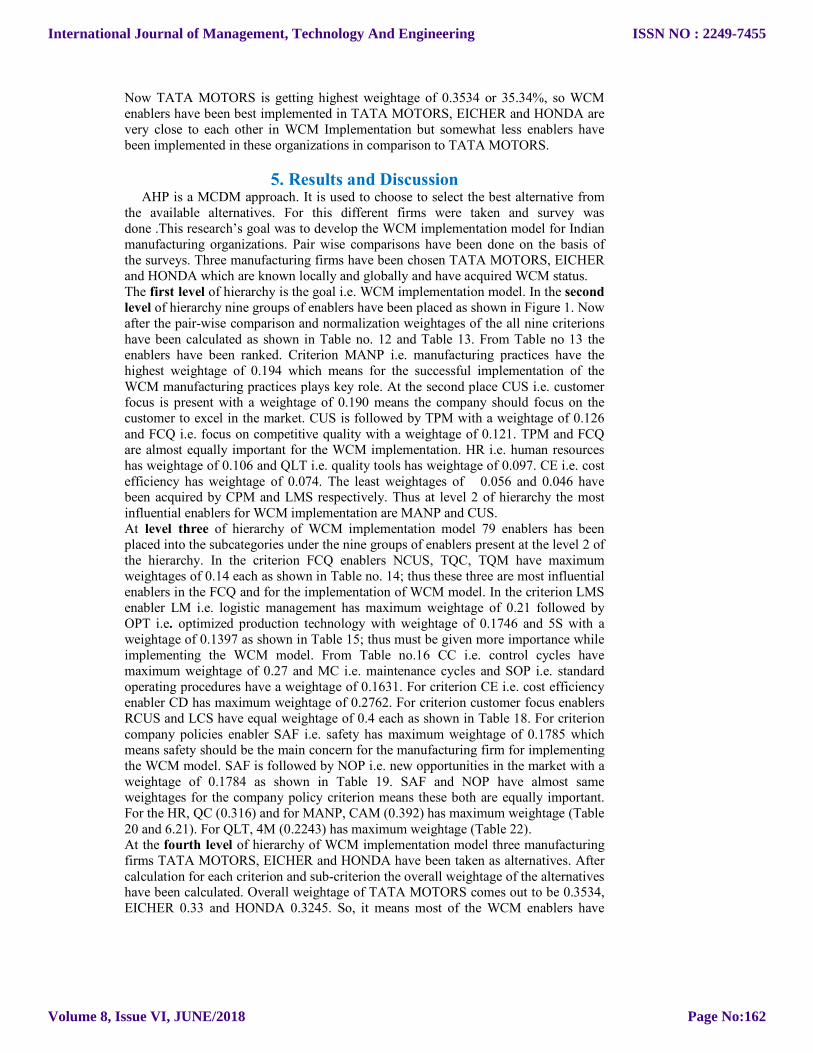
Now TATA MOTORS is getting highest weightage of 0.3534 or 35.34%, so WCM enablers have been best implemented in TATA MOTORS, EICHER and HONDA are very close to each other in WCM Implementation but somewhat less enablers have been implemented in these organizations in comparison to TATA MOTORS.
5. Results and Discussion AHP is a MCDM approach. It is used to choose to select the best alternative from the available alternatives. For this different firms were taken and survey was done .This research’s goal was to develop the WCM implementation model for Indian manufacturing organizations. Pair wise comparisons have been done on the basis of the surveys. Three manufacturing firms have been chosen TATA MOTORS, EICHER and HONDA which are known locally and globally and have acquired WCM status. The first level of hierarchy is the goal i.e. WCM implementation model. In the second level of hierarchy nine groups of enablers have been placed as shown in Figure 1. Now after the pair-wise comparison and normalization weightages of the all nine criterions have been calculated as shown in Table no. 12 and Table 13. From Table no 13 the enablers have been ranked. Criterion MANP i.e. manufacturing practices have the highest weightage of 0.194 which means for the successful implementation of the WCM manufacturing practices plays key role. At the second place CUS i.e. customer focus is present with a weightage of 0.190 means the company should focus on the customer to excel in the market. CUS is followed by TPM with a weightage of 0.126 and FCQ i.e. focus on competitive quality with a weightage of 0.121. TPM and FCQ are almost equally important for the WCM implementation. HR i.e. human resources has weightage of 0.106 and QLT i.e. quality tools has weightage of 0.097. CE i.e. cost efficiency has weightage of 0.074. The least weightages of 0.056 and 0.046 have been acquired by CPM and LMS respectively. Thus at level 2 of hierarchy the most influential enablers for WCM implementation are MANP and CUS. At level three of hierarchy of WCM implementation model 79 enablers has been placed into the subcategories under the nine groups of enablers present at the level 2 of the hierarchy. In the criterion FCQ enablers NCUS, TQC, TQM have maximum weightages of 0.14 each as shown in Table no. 14; thus these three are most influential enablers in the FCQ and for the implementation of WCM model. In the criterion LMS enabler LM i.e. logistic management has maximum weightage of 0.21 followed by OPT i.e. optimized production technology with weightage of 0.1746 and 5S with a weightage of 0.1397 as shown in Table 15; thus must be given more importance while implementing the WCM model. From Table no.16 CC i.e. control cycles have maximum weightage of 0.27 and MC i.e. maintenance cycles and SOP i.e. standard operating procedures have a weightage of 0.1631. For criterion CE i.e. cost efficiency enabler CD has maximum weightage of 0.2762. For criterion customer focus enablers RCUS and LCS have equal weightage of 0.4 each as shown in Table 18. For criterion company policies enabler SAF i.e. safety has maximum weightage of 0.1785 which means safety should be the main concern for the manufacturing firm for implementing the WCM model. SAF is followed by NOP i.e. new opportunities in the market with a weightage of 0.1784 as shown in Table 19. SAF and NOP have almost same weightages for the company policy criterion means these both are equally important. For the HR, QC (0.316) and for MANP, CAM (0.392) has maximum weightage (Table 20 and 6.21). For QLT, 4M (0.2243) has maximum weightage (Table 22). At the fourth level of hierarchy of WCM implementation model three manufacturing firms TATA MOTORS, EICHER and HONDA have been taken as alternatives. After calculation for each criterion and sub-criterion the overall weightage of the alternatives have been calculated. Overall weightage of TATA MOTORS comes out to be 0.3534, EICHER 0.33 and HONDA 0.3245. So, it means most of the WCM enablers have
International Journal of Management, Technology And Engineering
Volume 8, Issue VI, JUNE/2018
ISSN NO : 2249-7455
Page No:162

been implemented in the TATA MOTORS as compared to the HONDA and EICHER hence the Indian manufacturing organizations must adopt the enablers used by the TATA MOTORS for the excellence in manufacturing.
6. Conclusion The implementation of WCM practices can help a manufacturing organization to compete in the current competitive environment. The WCM AHP model developed in this article will help industries and policy makers for focusing on the enablers having more weightages. Small Indian manufacturing firms will be able to figure out on which enabler they should focus for excellence in manufacturing and will help them to gain a brand name in the competitive environment. There are also some limitations associated with this study as the priority weights depend on the knowledge of the human and may be biased and some results may fluctuate. Further other modeling techniques like ANP, DEMATEL, TISM can also be applied for studying the relationship among these enablers and can be used for a particular manufacturing organization.
References 1. Bucker Inc., (2003), "World Class Manufacturing Performance Measures",
Management Education and Consulting, Tri-State Parkway 2. Falah, K.L, Zairi, M. and Ahmed, A.M (1998), The role of supply- chain
management in world class manufacturing, International Journal of Physical Distribution and Logistics Management,Vol.33 No.5,pp396-407.
3. Kodali, R. and K.S. Sang wan, (2004), Performance value analysis foe the justification of world class manufacturing system, Journal of Advanced Manufacturing Systems, Vol. 3 No.1, pp. 85-102.
4. Shana, g. Sumy, (1994), new rules for world class companies, IEEE spectrum, July.
5. Gajdzik, B. (2013). World class manufacturing in metallurgical enterprise Metalurgija, 52(1), 131-134.
6. Ismail Salaheldin, S., & Eid, R. (2007). The implementation of world class manufacturing techniques in Egyptian manufacturing firms: An empirical study. Industrial Management & Data Systems, 107(4), 551-566.
7. Sukarma, L., Azmi, H., & Abdullah, N. L. (2014). The Impact of World Class Manufacturing Practices on Company Performance: A Critical Review. Applied Mechanics & Materials, (564).
8. Murino, T., Naviglio, G., Romano, E., Guerra, L., Revetria, R., Mosca, R., & Cassettari, L. C. A. (2012). A world class manufacturing implementation model. Applied mathematics in electrical and computer engineering, 978-1.
9. Albliwi, S. A., Antony, J., & Lim, S. A. H. (2015). A systematic review of Lean Six Sigma for the manufacturing industry. Business Process Management Journal, 21(3), 665-691.
10. Lau, R. S. (1996). Strategic flexibility: a new reality for world-class manufacturing. SAM Advanced Management Journal, 61(2), 11.
11. Snyder, K., Ingelsson, P., & Bäckström, I. (2016). Enhancing the study of Lean transformation through organizational culture analysis. International Journal of Quality and Service Sciences, 8(3), 395-411.
12. Suárez-Barraza, M. F., Dahlgaard-Park, S. M., Rodríguez-González, F. G., & Durán-Arechiga, C. (2016). In search of “Muda” through the TKJ diagram. International Journal of Quality and Service Sciences, 8(3), 377-394.
International Journal of Management, Technology And Engineering
Volume 8, Issue VI, JUNE/2018
ISSN NO : 2249-7455
Page No:163

13. Ma, J., Lin, Z., & Lau, C. K. (2017). Prioritising the enablers for the successful implementation of Kaizen in China: a Fuzzy AHP study. International Journal of Quality & Reliability Management, 34(4), 549-568..
14. De Felice, F., Petrillo, A., & Monfreda, S. (2013). Improving operations performance with world class manufacturing technique: a case in automotive industry. In Operations Management. InTech.
15. Haleem, A., Sushil, Qadri, M. A., & Kumar, S. (2012). Analysis of critical success factors of world-class manufacturing practices: an application of interpretative structural modelling and interpretative ranking process. Production Planning & Control, 23(10-11), 722-734.
16. Aquilani, B., Silvestri, C., Ruggieri, A., & Gatti, C. (2017). A systematic literature review on total quality management critical success factors and the identification of new avenues of research. The TQM Journal, 29(1), 184-213.
17. Kasul, R. A., & Motwani, J. G. (1994). Identification of world class manufacturing factors: a synthesis of literature. International Journal of Commerce and Management, 4(1/2), 50-68.
18. De Felice, F., & Petrillo, A. (2015). Optimization of Manufacturing System through World Class Manufacturing. IFAC-PapersOnLine, 48(3), 741-746.
19. Nazir, S.M. 2012. World-Class Manufacturing Practices-The Best Strategy for Indian Manufacturing Organization toEndure in New Millennium. Abhinav National Monthly Refereed Journal of Research in Commerce & Management,1(6), pp.144-160.
20. Singh, K., & Ahuja, I. P. S. (2012). Transfusion of total quality management and total productive maintenance: a literature review. International Journal of Technology, Policy and Management, 12(4), 275-311.
21. S. J. Gorane, Ravi Kant, (2016) "Supply chain practices: An implementation status in Indian manufacturing organisations". Benchmarking: An International Journal, 23(5), pp.1076-1110.
22. Bhamu, J. and Sang wan, K.S. (2014) Lean manufacturing: literature review and research issues. International Journal of Operations & Production Management,34(7), pp. 876-940.
23. Schonberger, R. (1987), World Class Manufacturing Casebook: Implementing JIT and TQC, The Free Press, Mankato, MN.
24. Anh, P. C., Yen, T. T. H., & Matsui, Y. (2014). Empirical study on transferability of kaizen practices in Vietnamese manufacturing companies.
25. Furlan, A., Vinelli, A., & Dal Pont, G. (2011). Complementarity and lean manufacturing bundles: an empirical analysis. International Journal of Operations & Production Management, 31(8), 835-850.
26. Goriwondo, W. M., Mhlanga, S., & Mutsambwa, T. (2013). Agility for sustainability in Zimbabwe: A case study for manufacturing companies in Bulawayo. China-USA Business Review, 12(1).
27. Digalwar, A. K., & Sangwan, K. S. (2007). Development and validation of performance measures for world class manufacturing practices in India. Journal of Advanced Manufacturing Systems, 6(01), 21-38.
28. Ekta and Saha ,R. (2017). World Class Manufacturing: A Review. World. International Journal of Engineering Technology Science and Research, 4(11), PP. 625-630.
29. Saaty, T.L. (1977). A Scaling Method for Priorities in Hierarchical Structures, Journal of Mathematical Psychology, 15: 57-68.
30. Saaty, T.L. (1994). Fundamentals of Decision Making and Priority Theory with the AHP. RWS Publications,Pittsburgh, PA, U.S.A.
International Journal of Management, Technology And Engineering
Volume 8, Issue VI, JUNE/2018
ISSN NO : 2249-7455
Page No:164

31. Maggie, C.Y.T. and Tummala, V.M.R. (2001) ‘An application of the AHP in vendor selection of a telecommunications system’, Omega, Vol. 29, No. 2, pp.171–182.
32. Singla, A., Ahuja, I. S., & Sethi, A. S. (2018). An examination of effectiveness of technology push strategies for achieving sustainable development in manufacturing industries. Journal of Science and Technology Policy Management.
33. Pandey, H., Garg, D., & Luthra, S. (2018). Identification and ranking of enablers of green lean Six Sigma implementation using AHP. International Journal of Productivity and Quality Management, 23(2), 187-217.
34. Gupta, H., & Dubey, S. K. (2018). Ranking of Educational Web Sites in Indian Perspective for Usability Evaluation. In Intelligent Communication, Control and Devices (pp. 839-845). Springer, Singapore.
35. Bali, S., & Amin, S. S. (2017). An analytical framework for supplier evaluation and selection: a multi-criteria decision making approach. International Journal of Advanced Operations Management, 9(1), 57-72.
36. Singh, M. (2017). Identification of Critical Success Factors (CSF’s) to implement Green Supply Chain Management (GSCM) in an automobile industry using Analytical Hierarchy Process (AHP) technique. Journal of Automation and Automobile Engineering, 2(2, 3).
37. Saaty, T. L. (1980). The analytic hierarchy process: planning, priority setting, resources allocation. New York: McGraw, 281.
International Journal of Management, Technology And Engineering
Volume 8, Issue VI, JUNE/2018
ISSN NO : 2249-7455
Page No:165