Embed Size (px)
Citation preview
Eleventh Floor, Menzies Building Monash University, Wellington Road CLAYTON Vic 3800 AUSTRALIA Telephone: from overseas: (03) 9905 2398, (03) 9905 5112 61 3 9905 2398 or 61 3 9905 5112 Fax: (03) 9905 2426 61 3 9905 2426 e-mail: [email protected] Internet home page: http//www.monash.edu.au/policy/
Paper presented to the International Conference on
“Growth, Distribution and Social Accounting Matrices”, 25-26 October 2007, Daejeon, Korea
An Aggregate Social Accounting Matrix
For the Australian Economy: Data Sources and Methods
by
FELICITY PANG Centre of Policy Studies
Monash University G.A. MEAGHER
Centre of Policy Studies Monash University
and G.C. LIM MIAESR
The University of Melbourne
General Working Paper No. G-158 August 2006 (Revised October 2009)
ISSN 1 031 9034 ISBN 0 7326 1565 8
The Centre of Policy Studies (COPS) is a research centre at Monash University devoted to quantitative analysis of issues relevant to Australian economic policy.

An Aggregate Social Accounting Matrix for the Australian Economy: Data Sources and Methods
by
FELICITY PANG, G.A. MEAGHER and G.C. LIM
Centre of Policy Studies Monash University
& MIAESR
The University of Melbourne

ii
Abstract A social accounting matrix is a framework for organising information about income,
expenditure and financial flows in the economy. This paper describes a methodology
for compiling such a matrix for the Australian economy as it existed in 1996-97. It
distinguishes between five institutions, namely, households, non-financial
corporations, financial corporations, the general government and the external sector,
and identifies linkages between them. The matrix is so constructed that
i) for every row there is a corresponding column;
ii) the totals of corresponding rows and columns are equal;
iii) every entry is a receipt when read in its row context and a payment when
read in its column context.
However, it does not distinguish between different industries or commodities and, to
that extent, is properly regarded as an aggregate matrix. It forms part of the database
for ORANI-ID, an applied general equilibrium model of the Australian economy
designed for analysing the effect of changes in the economic environment on the
distribution of income.
JEL Classification: D30, D50, E10
Key Words: Social Accounting Matrix, Applied General Equilibrium, Income
Distribution

i
ii
Contents Page
I. Introduction 1
II. Preparation of Data from the Input-Output Tables (IOT) Bulletin 2 III. Preparation of Data from the Australian System of National Accounts (ASNA Bulletin) 4 IV. Construction of the Social Accounting Matrix 11
iii
List of Tables Page
1. The structure of a Social Accounting Matrix 13 2. Aggregate Input-Output Table, Input-Output Tables Basis,
1996-97, $million 15
3. Aggregate Input-Output Table, Conversion from IOT to ASNA Basis, 1996-97, $million 16
4. Aggregate Input-Output Table, ANSA Basis, 1996-97, $million 20
5. Allocation of Investment Expenditure, 1996-97, $million 21 6. Allocation of Interest Flows, 1996-97, $million 22
7. Allocation of Dividend Flows, 1996-97, $million 24 8. Allocation of Reinvested Earnings on Direct Foreign 26 Investment, 1996-97, $million 9. Allocation of Rent on Natural Assets, 1996-97, $million 26 10. Allocation of Social Assistance Benefits, 1996-97, $million 27 11. Allocation of Non-life Insurance Claims, 1996-97, $million 27 12. Allocation of Non-life Insurance Premiums, 1996-97, $million 28
13. Allocation of Other Current Transfers, 1996-97, $million 29 14. Allocation of Capital Transfers, 1996-97, $million 30 15. Allocation of Non-produced Non-financial Assets, 31 1996-97, $million 16. Summary Matrix of Financial Flows, 1996-97 32 17.1. Financial Assets by Institution, 1996-97, $billion 34
17.2. Allocation of Financial Assets, 1996-97, $million 37 18. Revised Matrix of Financial Assets, 1996-97, $million 40 19. Borrowing and Lending Matrix, 1996-97, $million 43 20. Households Income Account, 1996-97, $million 44
iv
21. Non-financial Corporations Income Account, 1996-97, 46 $million 22. Financial Corporations Income Account, 1996-97, $million 47 23. General Government Income Account, 1996-97, $million 48
24. External Sector Income Account, 1996-97, $million 50 25. Households Capital Account, 1996-97, $million 52 26. Non-financial Corporations Capital Account, 1996-97, 53 $million 27. Financial Corporations Capital Account, 1996-97, $million 54 28. General Government Capital Account, 1996-97, $million 55 29. External Sector Capital Account, 1996-97, $million 56 30. Social Accounting Matrix, 1996-97, $million 57

v
1
An Aggregate Social Accounting Matrix for the Australian Economy: Data Sources and Methods1
by
Felicity Pang, G.A. Meagher and G.C. Lim I. Introduction
A social accounting matrix is a framework for organising information about income,
expenditure and financial flows in the economy. A description of the elements that
typically appear in such a matrix has been set out in Table 1. The matrix is so
constructed that
(i) for every row there is a corresponding column;
(ii) the totals of corresponding rows and columns are equal;
(iii) every entry is a receipt when read in its row context and a payment when
read in its column context.
Thus the first column of the matrix itemises the costs incurred (i.e., payments made)
in the production of the economy’s output of goods and services. The first row
itemises the receipts that accrue to producers from the sale of that output. The
payment made by producers to the owners of the factors of production (i.e., value
added in production) is a receipt from the point of view of those owners; hence it
appears in the second row. Once received, payments must be made from the value
added fund to the owners of particular factors for current and capital purposes. These
payments are itemised in the second column. When appropriately disaggregated by
industry and/or commodity, the information contained in the first two rows and
columns is essentially the same as that contained in an input-output table.
1 This paper is an updated version of An Aggregate Social Accounting Matrix for the Australian Economy: Data Sources and Methods (1988) by G.C. Lim, G.A. Meagher, S.J.Lee and F. Moppi, IAESR Working Paper No.1/1988, University of Melbourne. A version of the present paper was presented to the 2007 International Conference on “Growth, Distribution and Social Accounting Matrices” conducted by the Korean National Statistical Office, Daejeon, South Korea, October 2007.
2
The remaining rows and columns are made up of current and capital accounts for each
of the identified institutions, i.e., households, corporations, government and foreigners
in our example. These accounts keep track of the transfers (including taxes,
government benefits, borrowings and lendings) which accommodate the difference
between the expenditure of institutions and their factor incomes.
In this paper we compile a social accounting matrix for the Australian economy as it
existed in 1996-97. The matrix distinguishes between five institutions: households
(including unincorporated enterprises), non-financial corporations (public and
private), financial corporations (public and private), general government
(Commonwealth, State and Local) and the external sector. However it does not
distinguish between different industries or commodities and, to that extent, is properly
regarded as an aggregate matrix.
We draw on data from three main sources:
(i) Australian National Accounts, Input-Output Tables 1996-97, Catalogue
No.5209.0, Australian Bureau of Statistics, Canberra, 2001;
(ii) Australian National Accounts, Australian System of National Accounts,
2003-04, Catalogue No.5204.0, Australian Bureau of Statistics, Canberra,
2004;
(iii) 1997-98 Budget Paper No.1, Budget Statements 1997-98, Australian
Government, Canberra, 1997.
For brevity, we shall refer to these documents as the IOT, ASNA and BS bulletins,
respectively. In what follows, we describe the preparation of data from different
sources (Sections II and III), before drawing them together (Section IV) to form the
institutions’ accounts and the final social accounting matrix.
II. Preparation of Data from the Input-Output Tables (IOT) Bulletin
Table 2 contains an input-output table (aggregated across industries and commodities)
for the Australian economy of 1996-97. This information is taken from Table 4 of the
3
IOT bulletin 2 and, as such, does not conform precisely to corresponding data
published in the ASNA bulletin. The purpose of this section is to describe our method
for adjusting the IOT data to impose conformity with the ASNA data.
We begin with the control totals shown in the first section (labelled Step 1) of Table
3. All these totals are taken from Tables 5 and 12 of the ASNA bulletin and are
preserved in our final version of the input-output table. To proceed to Step 2, the
column totals shown in the Total uses row in Step 1 are distributed across the rows in
the same proportions as in Table 2. Thus, for example, the value 110 for final
consumption expenditure by households on complementary imports is calculated from
the expression (111 x 312765 / 315235).
The only exception to this rule occurs in the column for Change in inventories.
Because elements in this column have different signs in Table 2, the usual
proportional method is unsuitable; it would result in more indirect tax revenue being
collected when stocks are run down more quickly. To avoid this problem the method
is applied to the difference between the relevant column totals and employs absolute
rather than signed values. For example, the sum of the absolute values of the entries
in the Change in inventories column in Table 2 is 3942 and we require the sum of the
signed values to be increased by 970 (i.e., from -980 to -10). Hence the value -1849 in
the Total intermediate uses row in Step 2 is obtained from the expression
(-2452) + (2452 / 3942) x 970. Similarly, the value 1649 in the Complementary inputs row is obtained from
+1323 + (1323 / 3942) x 970.
The table of Step 2 is incomplete in that, in the Total industry uses column, it contains
no entries for intermediate uses, imports or taxes. This deficiency is made good in
Step 3, the procedure consisting of three operations. First we assign totals to imports
of intermediate goods and indirect taxes on production. From Step 1, total usage of
imports is 103590. From Step 2, usage of imports in all activities except production is
2 For consistency with the ASNA tables, the numbers which appear in the input-output table have been rounded to nearest million dollars in Table 2. Note that the labeling of the rows in Tables 2, 3 and 4 of this document follows the conventions of Table 4 of the IOT Bulletin and must be read in that context. Specifically, IOT Table 4 is headed Industry by Industry Flow Table 1996-97.
4
46370 (i.e., 250 + 46120). Hence the usage of imports as intermediate inputs is
obtained as the residual 57220. Similarly, the value of 33408 for total indirect taxes
on production is obtained as the residual (61760 - 25213 - 3139). Next we distribute
total imports of intermediate goods (57220) between complementary and competitive
imports in the same proportions as in Table 2. Thus the value 57139 for competitive
imports is given by (57220 x 56889 / (81 + 56889)). Indirect taxes are distributed in
the same manner, the value 13623 for taxes less subsidies on products being obtained
from (33408 x 13378 / (13378 + 19428)). Finally we assign a value to intermediate
usage of domestically produced commodities on the assumption that the domestic
share is the same as in Table 2. That is, the value 471163 for all commodities is
obtained from the expression
(412134 + 81 + 56889) x (57220 / (81 + 56889)). Thus, the value of 413943 for domestic commodities is the difference between all
commodities and imports (i.e., 471163 – 57220).
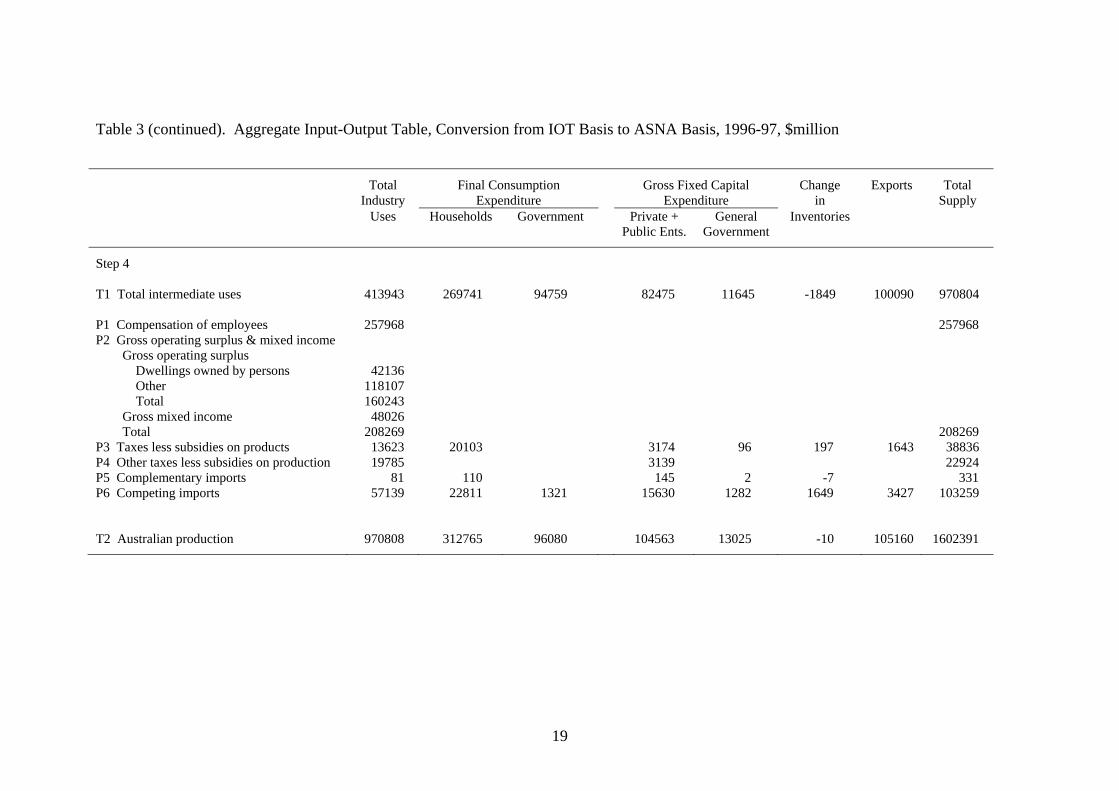
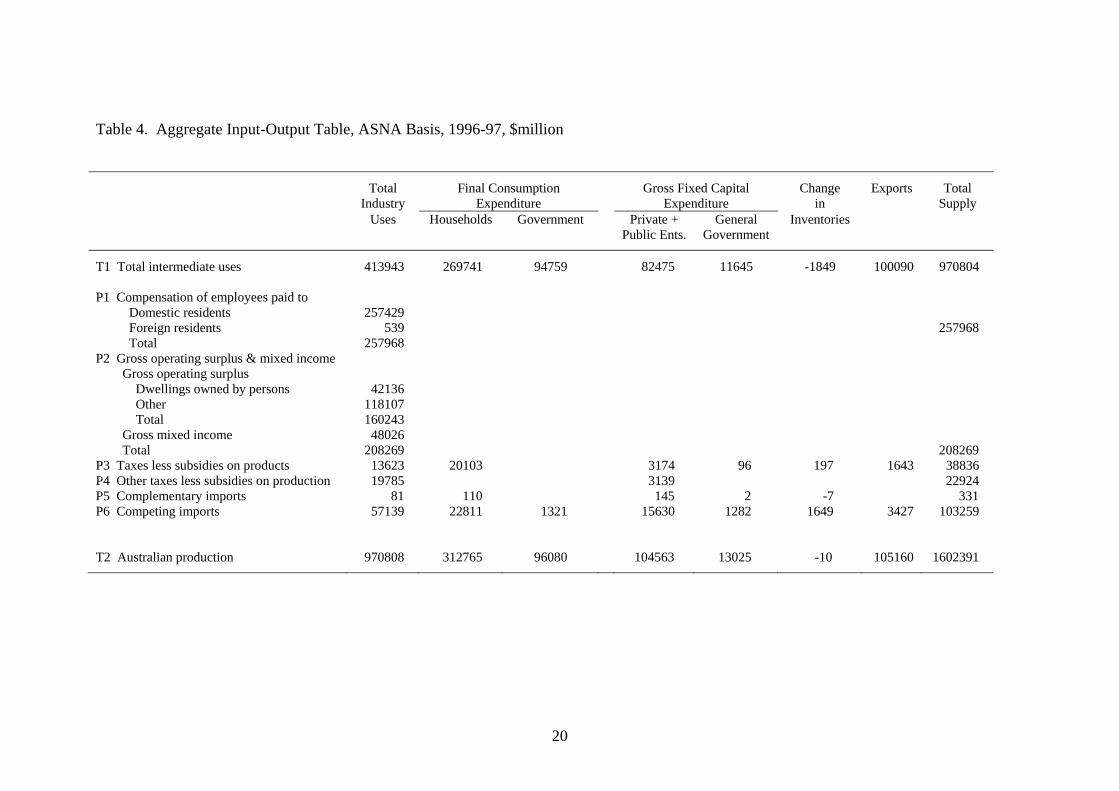
To complete the conversion of the input-output table from an IOT basis to an ASNA
basis, it remains to add the two partial tables of Steps 2 and 3. The result is shown as
Step 4. The final table is also presented separately as Table 4, with one additional
disaggregation. In Table 4, a distinction is drawn between compensation of
employees paid to domestic residents and foreign residents paid by producers. The
data for this disaggregation comes from Table 54 of the ASNA bulletin.
III. Preparation of Data from the Australian System of National Accounts
(ASNA) Bulletin
The ASNA bulletin includes information on investment expenditure, interest
payments and receipts, and dividend payments and receipts. Each of these categories
must be allocated between the institutions identified in the social accounting matrix.
In this section we describe procedure for making the required allocations.
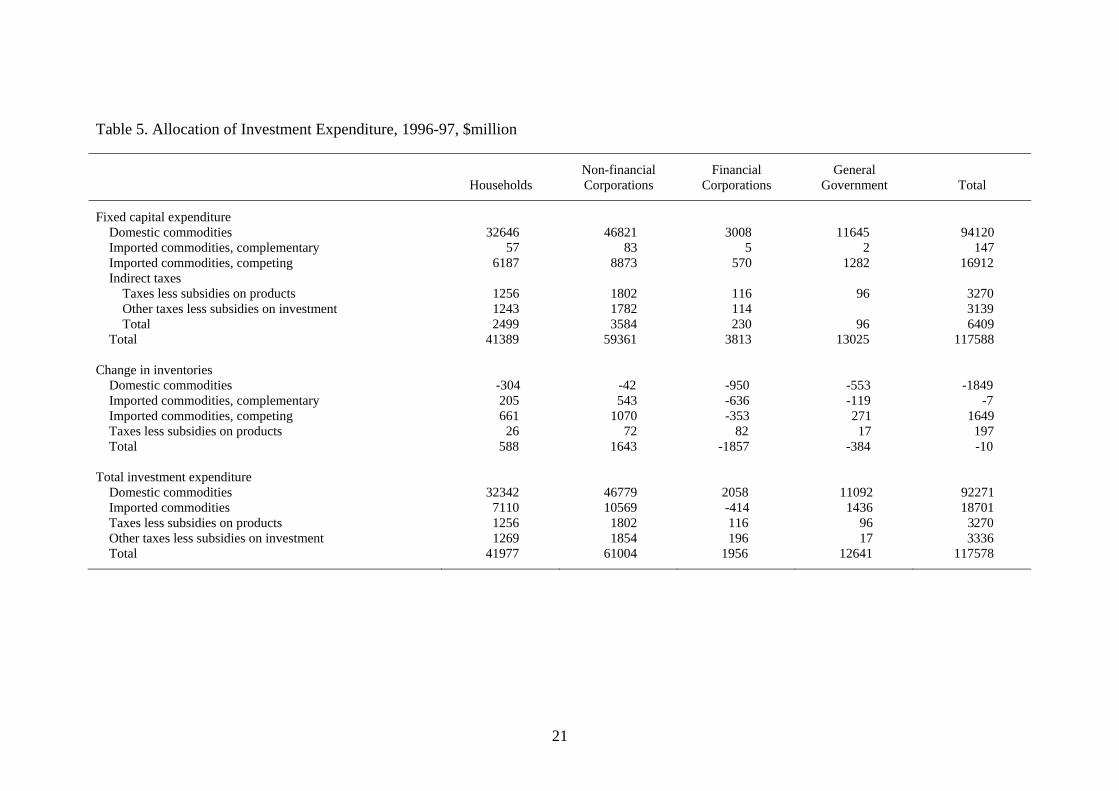
Table 5 contains matrices of investment expenditure by institution and type of
expenditure. The row totals for fixed capital and change in inventories are taken from
5
Table 4 of this document. The column totals come from Tables 28, 36 42 and 49 of
the ASNA bulletin.
In the matrix for fixed capital, the distribution of total government expenditure across
the rows is obtained directly from Table 4. For households, non-financial corporations
and financial corporations, the column totals are distributed in proportion to the
elements of another column of Table 4, namely, the column showing fixed capital
expenditure by the private sector (households and corporations) and public
corporations. Thus the value 32646 for household expenditure on domestic
commodities is calculated from the expression (41389 x 82475 / 104563), the value
83 for non-financial corporations’ expenditure on imported commodities from (59361
x 145 / 104563), and the value 114 for financial corporations’ payments of other taxes
less subsidies on production from (3813 x 3139 / 104563).
In Table 4, the column for Change in inventories contains an amount 197 for Taxes
less subsidies on products. As a matter of convenience 3 , this amount is first
distributed between the identified institutions in proportion to the absolute values of
the total change in their inventories, and then included with Other taxes less subsidies
on investment. Furthermore, the presence of positives and negatives in the Change in
inventories column makes the method used for distributing fixed capital unsuitable
and the RAS method4 is adopted. In applying the method, the value 2000 is first
added to every cell of the matrix to eliminate negative values. At the conclusion of
the procedure, these values are subtracted again yielding the second matrix of Table 5.
The matrix for total investment expenditure is obtained from the other two.
3 The SAM described in this paper is prepared with a view to incorporating it in the database for a modified version of the ORANI-G model. The relevant version of the model is described in the paper ORANI-G: A Generic Single-Country Computable General Equilibrium Model prepared by J.M. Horridge for the ORANI-G course at Monash University, June 2003. It does not acknowledge the existence of taxes on changes in inventories. 4 See, for example, United Nations, Handbook of National Accounting, Studies in Methods, ST/ESA/STAT/SER.F/74, Sales No. F.99 SV11.4, Chapter IX.
6
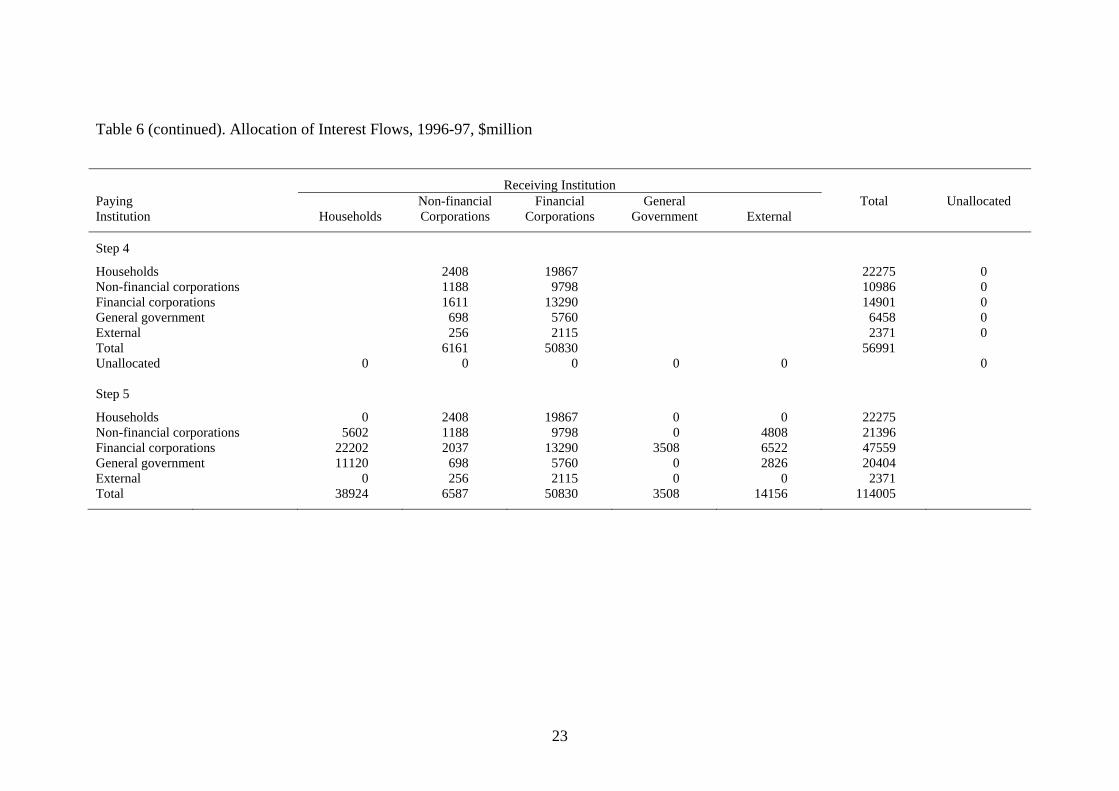
The allocation of interest flows5 is set out in Table 6. It proceeds in five steps:
(1) The matrix of Step 1 shows the total amounts of interest paid and received by
each institution, the data being taken from the ASNA bulletin (Tables 27, 35,
40, 46 and 54). All entries in the table for Step 1 appear in a marginal row or
column labelled ‘unallocated’. The purpose of the remaining steps is to
distribute progressively the unallocated entries to elements in the interior of
the matrix representing bilateral flows.
(2) At this step, four operations are performed. Firstly, an imputed payment 15029
(ASNA bulletin, Table 35) of property income attributed to insurance policy
holders is identified. This payment is made by financial corporations to
households and non-financial corporations. Table 27 of the ASNA bulletin
shows the amount received by the non-financial corporations is 426. The
amount received by households (14603) is determined as a residual. Secondly,
from ASNA Table 40, an imputed payment of 7826 representing interest on
unfunded superannuation payments is made by general government to
households. Thirdly, we assume that all remaining interest payments received
by general government are interest on bank deposits, i.e., they are paid by
financial corporations. Finally, we assume that the household and external
sectors pay interest only to non-financial and financial corporations. The zero
entries in the matrix for Step 2 reflect these assumptions. The matrix also
includes a total row and a total column for the flows allocated at Step 2. The
unallocated row (column) for Step 2 is obtained by subtracting the total row
(column) for Step 2 from the unallocated row (column) for Step 1.
(3) Interest payments to the household and external sectors are distributed
between non-financial corporations, financial corporations and general
government in proportion to the entries in the unallocated column for Step 2.
(Recall that we assumed zero entries in the household and external rows at
Step 2). Thus the payment 5602 by non-financial corporations to households is
calculated from
16495 x 21396 / (21396 + 29022 + 12578), 5 Interest includes interest, imputed interest and property income attributed to insurance policy holders.
7
and the payment 4808 by non-financial corporations to foreigners from 14156 x 21396 / (21396 + 29022 + 12578).
(4) Interest payments to non-financial and financial corporations are distributed
between all five institutions according to the elements of the unallocated
column for Step 3. Thus the payment 1611 by financial corporations to non-
financial corporations is calculated from (6161 x 14901 / 56991) and the
payment 19867 by households to financial corporations from (50830 x 22275 /
56991).
(5) The final table of bilateral interest flows is obtained by adding the matrices
(excluding the unallocated row and column) for Steps 1 to 4.
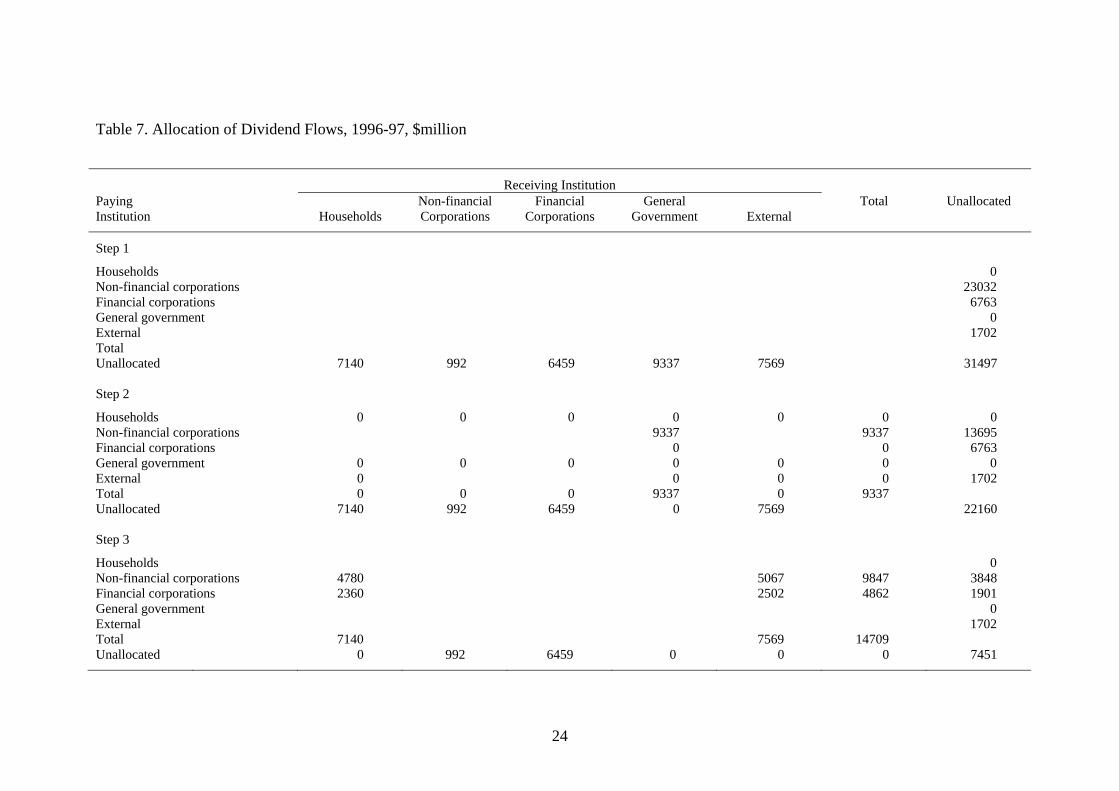
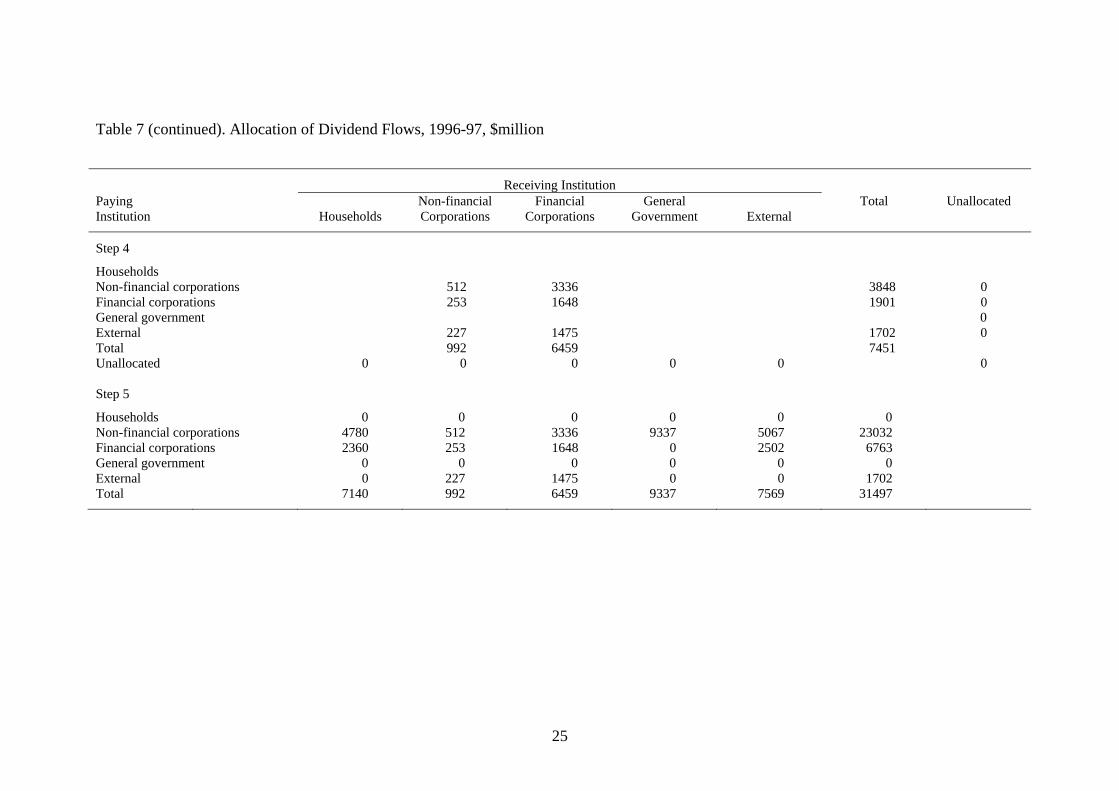
The allocation of dividend flows is set out in Table 7 and follows the same pattern as
the allocation of interest flows. It proceeds in five steps:
(1) The unallocated totals are taken from Tables 27, 35, 40, 46 and 54 of the
ASNA bulletin.
(2) The government is assumed to receive dividends only from the non-financial
corporations. The external sector is assumed to pay dividends only to non-
financial and financial corporations.
(3) Dividends received by households and the external sector are distributed
between non-financial and financial corporations in proportion to the elements
of the unallocated column of Step 2. Thus the payment 4780 by non-financial
corporations to households is calculated from (7140 x 13695) / (13695 +
6763).
(4) Dividends received by non-financial and financial corporations are distributed
between the non-financial, financial and external sectors in proportion to the
elements of the unallocated column of Step 3. Thus the transfer 512 between
different non-financial corporations is calculated from (3848 x 992 / 7451),
and the payment 1475 by the external sector to financial corporations from
(1702 x 6450 / 7451).
8
(5) The final table (Step5) of bilateral dividend flows is obtained by adding the
matrices for Steps 1 to 4.
The next task is to allocate secondary income of various types by institution. The
column and row totals are taken from Tables 27, 35, 40, 46 and 54 of the ASNA
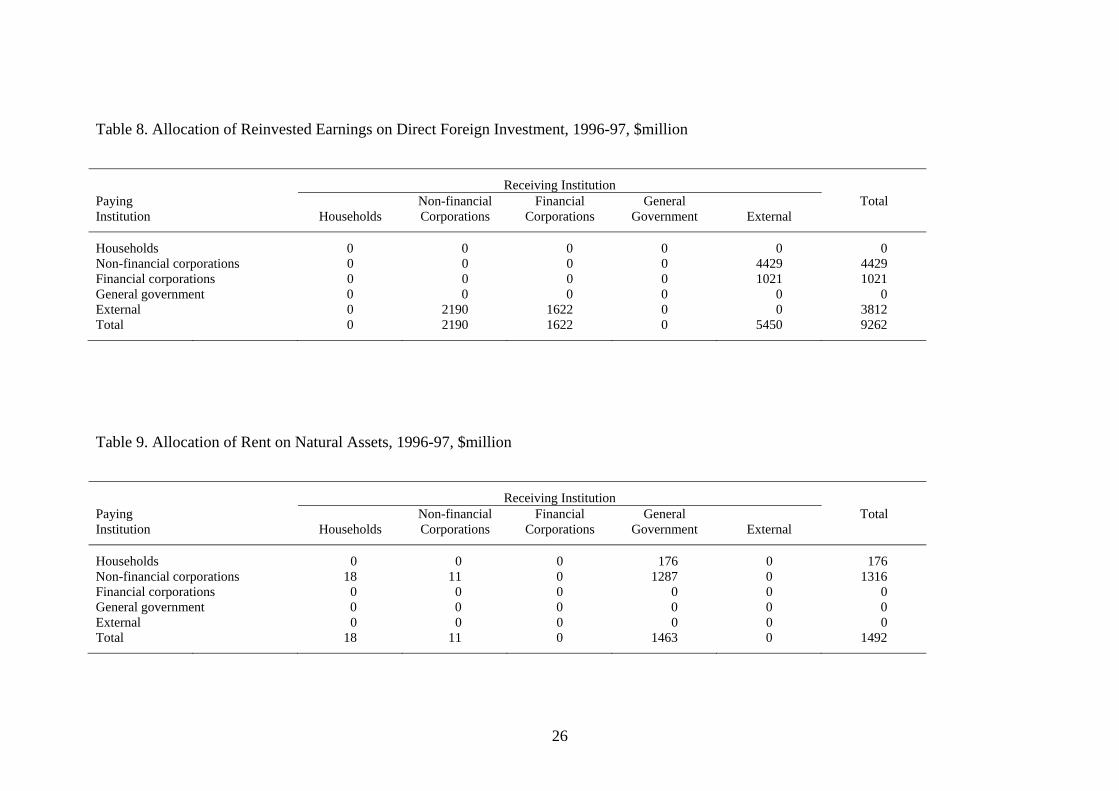
bulletin. Table 8 is a matrix showing the allocation of Reinvested earnings on direct
foreign investment. Reinvested earnings are paid by non-financial corporations,
financial corporations and the external sector and are received by the same
institutions. It is assumed that non-financial and financial corporations only make
payments to the external sector and the external sector only makes payments to non-
financial and financial corporations.
Table 9 sets out the allocation of Rent on natural assets. It is assumed that the rent
176 paid by households is received only by the general government and that the rent
1316 paid by non-financial corporations is received only by households, non-financial
corporations and general government. This implies that the entire amounts of rent
received by households and non-financial corporations are paid by non-financial
corporations. Thus households and non-financial corporations receive rent payments
of 18 and 11, respectively, the remaining 1287 of the 1316 being received by general
government.
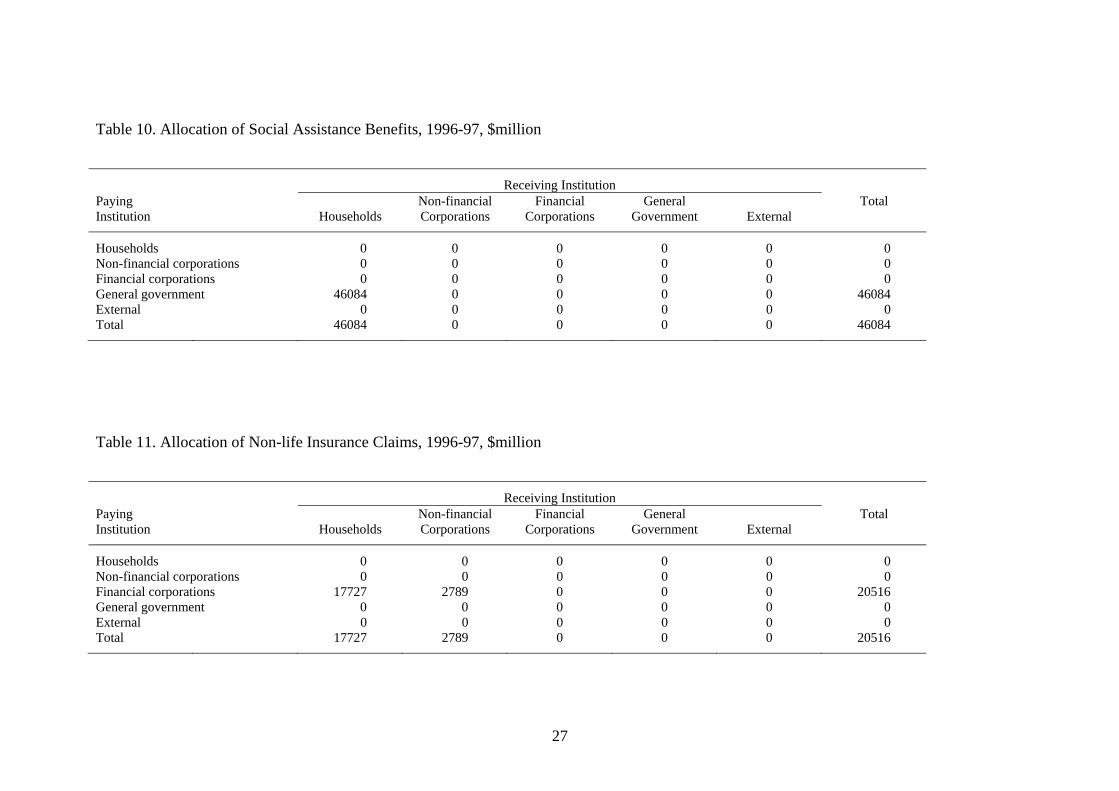
The allocation of Social assistance benefits (Table 10) is straightforward because the
general government is the only institution that pays such benefits and households is
the only institutions that receives them. The allocation of Non-life insurance claims6
(Table 11) is determined in an analogous manner.
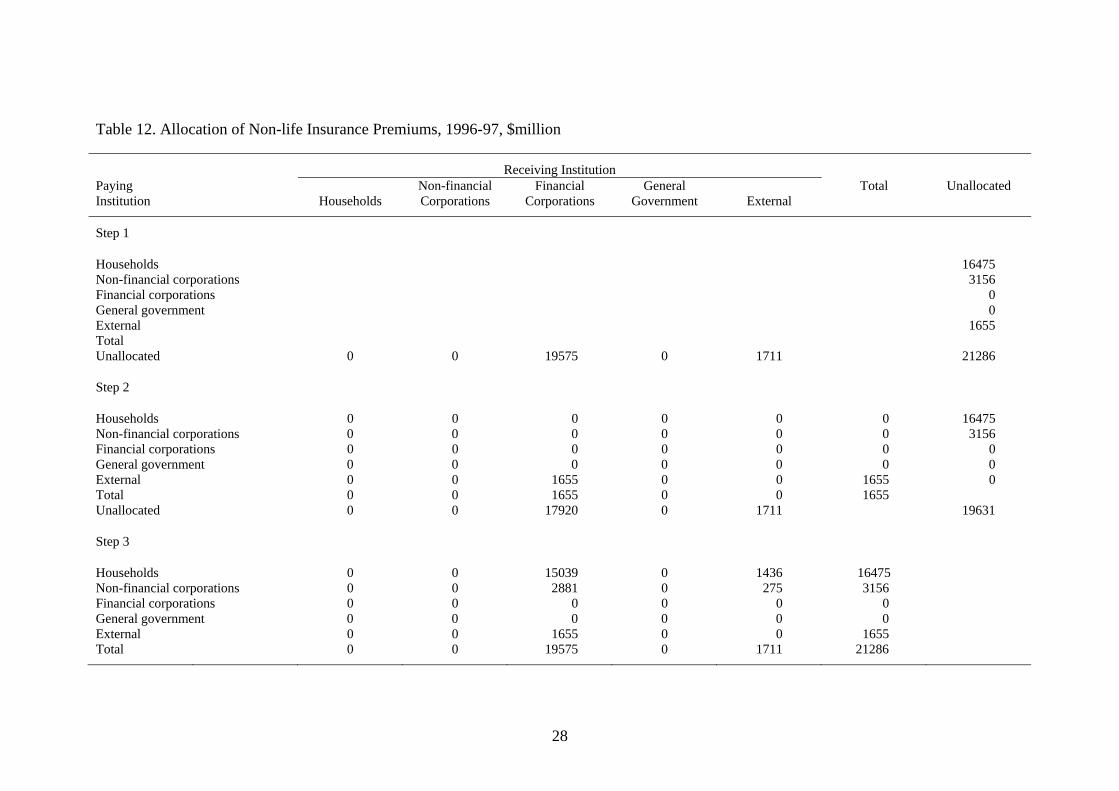
In the case of Non-life insurance premiums,7 the paying institutions are households,
non-financial corporations and the external sector while the receiving institutions are
financial corporations and the external sector (see Table 12). The allocation consists
of three steps:
6 Non-life insurance claims received by households include workers’ compensation. 7 Non-life premiums paid by households include social contributions for workers’ compensation.
9
(1) Control totals from the ASNA bulletin (Tables 27, 35, 46 and 54) are assigned
to the unallocated row and column of the matrix.
(2) The entire amount 1655 paid by the external sector is assumed to be received
by financial corporations.
(3) The remaining premiums paid to financial corporations and the external sector
are distributed between households and non-financial corporations in
proportion to the unallocated column of Step 2. Thus the payment 15039 by
households to financial corporations is calculated from (17920 x 16475) /
(16475 + 3156) and the payment 275 by non-financial corporations to the
external sector from (1711 x 3156) / (16475 + 3156).
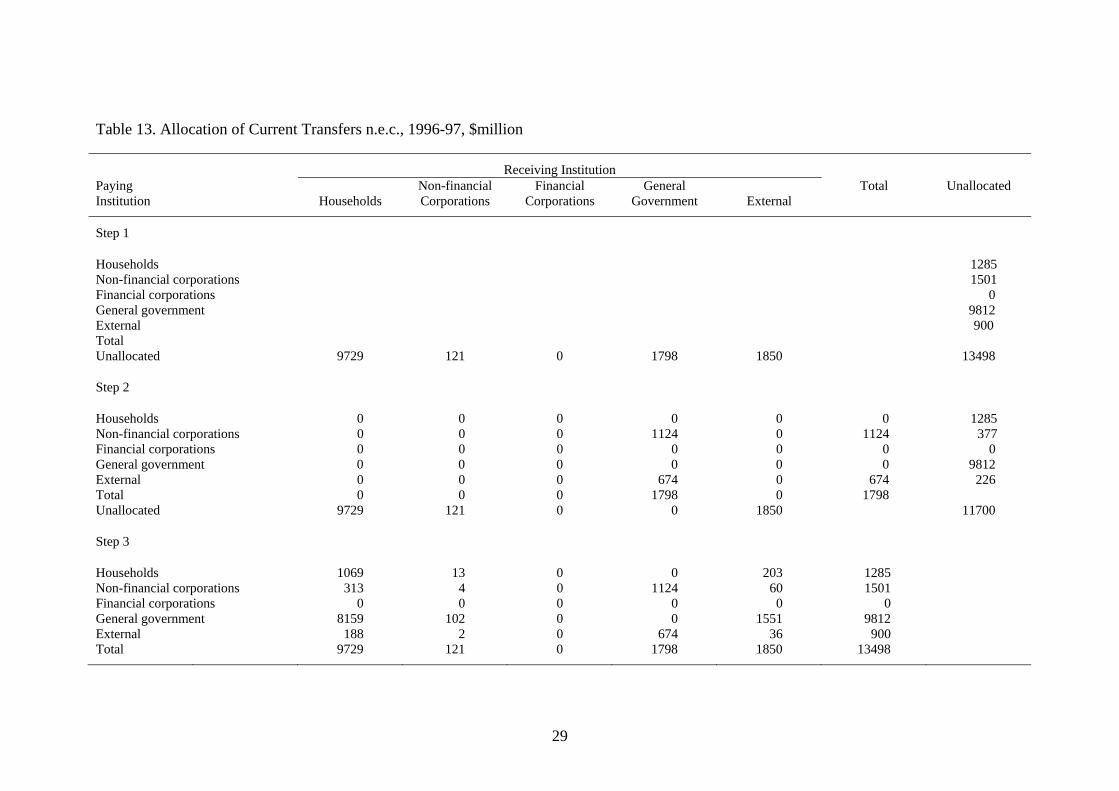
Table 13 sets out the allocation of Current transfers n.e.c.8 The procedure is similar to
that of Table 12 and consists of three steps:
(1) Control totals are taken from the ASNA bulletin (Tables 27, 35, 40, 46 and
54) are assigned to the unallocated row and column of the matrix.
(2) General government is assumed to receive transfers only from non-financial
corporations and the external sector and that the transfers are in proportion to
the unallocated column of Step 1. Thus the payment 1124 by non-financial
corporations to general government is calculated from the expression (1798 x
1501) / (1501 + 900).
(3) Transfers paid to households, non-financial corporations and the external
sector are allocated between the paying institutions in proportion to the
unallocated column of Step 2. Thus the value 203 paid by households to the
external sector is calculated from (1850 x 1285) / 117000.
Table 14 shows the allocation of Capital transfers. For this category, the ASNA
bulletin (Tables 28, 36, 42, 49 and 54) directly identifies a number of bilateral flows
8 Current transfers n.e.c. to domestic institutions include transfers to non-profit institutions. Transfers to the external sector include current taxes on income, wealth, etc.
10
as set out at Step 1. Given these bilateral flows, only one distribution of the
unallocated transfer is possible. This distribution is shown at Step 2.
The final allocation is for Non-produced non-financial assets. The control totals at
Step 1 of Table 15 are taken from the ASNA bulletin (Tables 28, 36, 42 and 54). At
Step 2, the unallocated column totals are distributed between the disposing institutions
in proportion to the row totals in the unallocated column.
To complete the construction of the social accounting matrix, we require information
on the flow of funds between the five institutions. Such information is also available
from the ASNA bulletin and the relevant matrix is reproduced in Table 16.
The financial flows matrix shows the amount of 11 financial assets bought and sold
by the various institutions. A negative purchase (i.e., a negative acquisition of a
financial asset) indicates that sales from the stock of the asset purchased by the
lending institution in previous years exceed purchases of the asset in the current year.
Similarly, a negative sale of an asset (i.e., a negative incurrence of a financial
liability) indicates that repurchases of the asset from the stock sold by the borrowing
institution in previous years exceed sales of the asset in the current year. Sales and
purchases must be allocated between institutions to arrive at the bilateral flows
required for the social accounting matrix. The data manipulations are conducted in
terms of the 11 ASNA asset types.
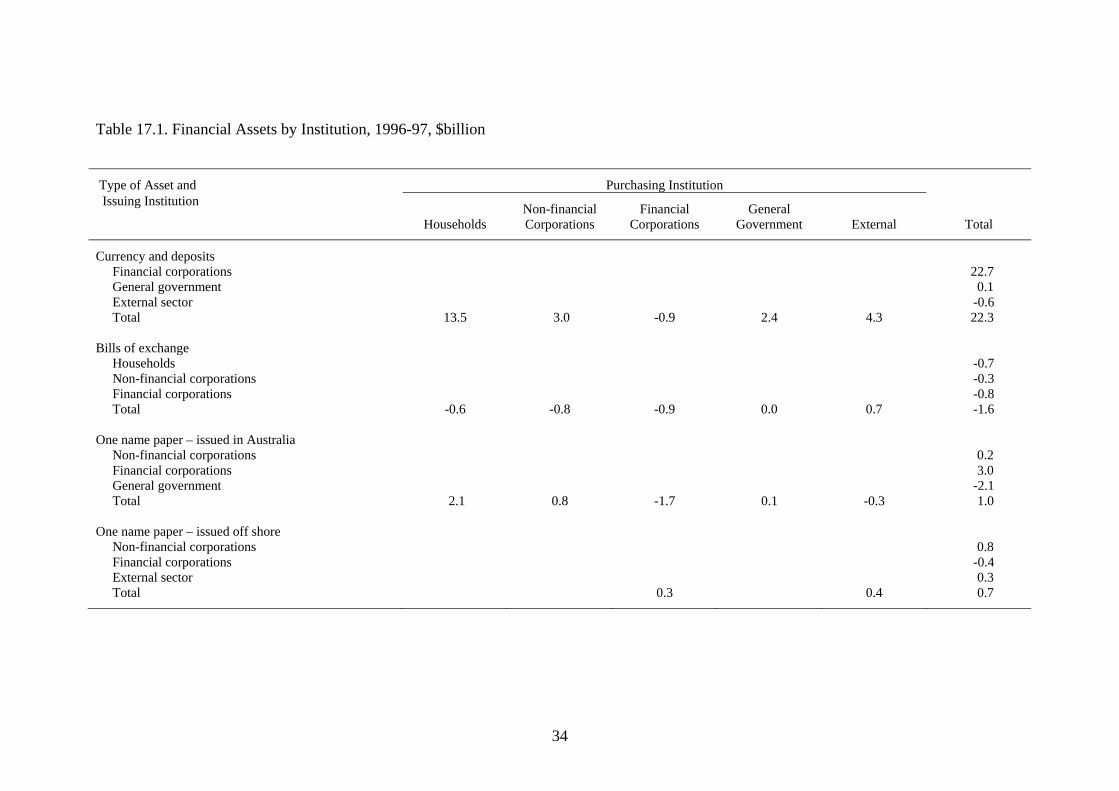
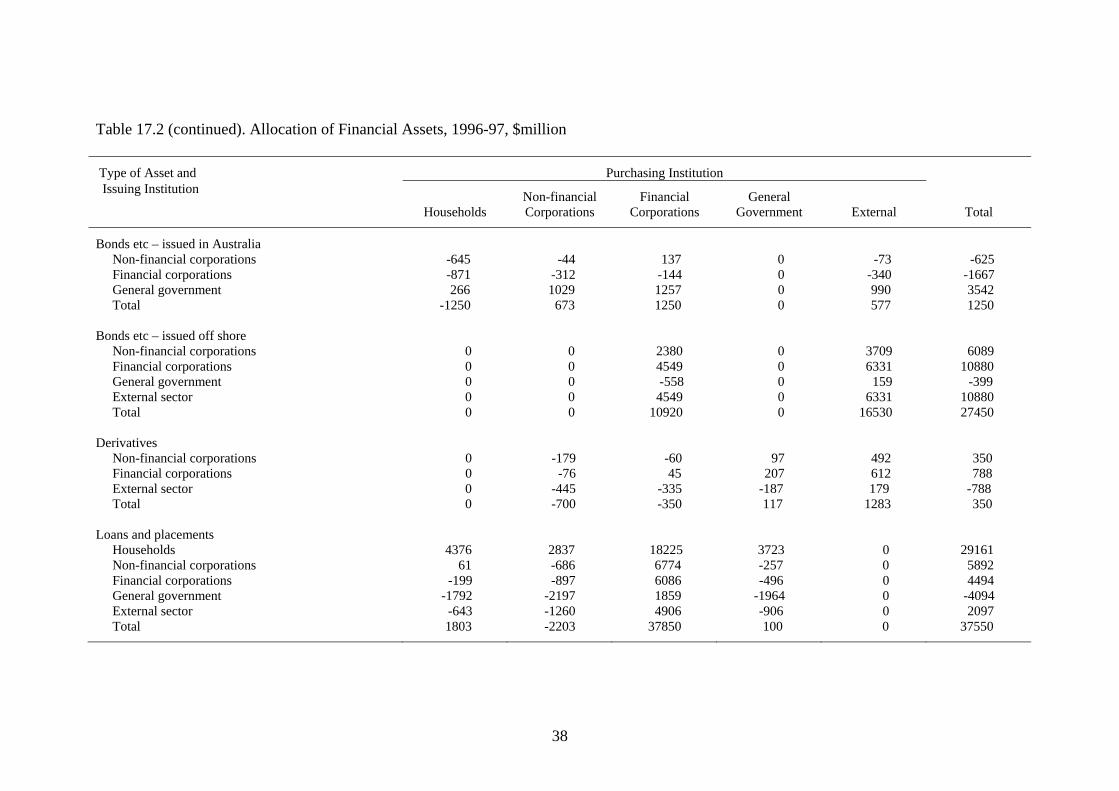
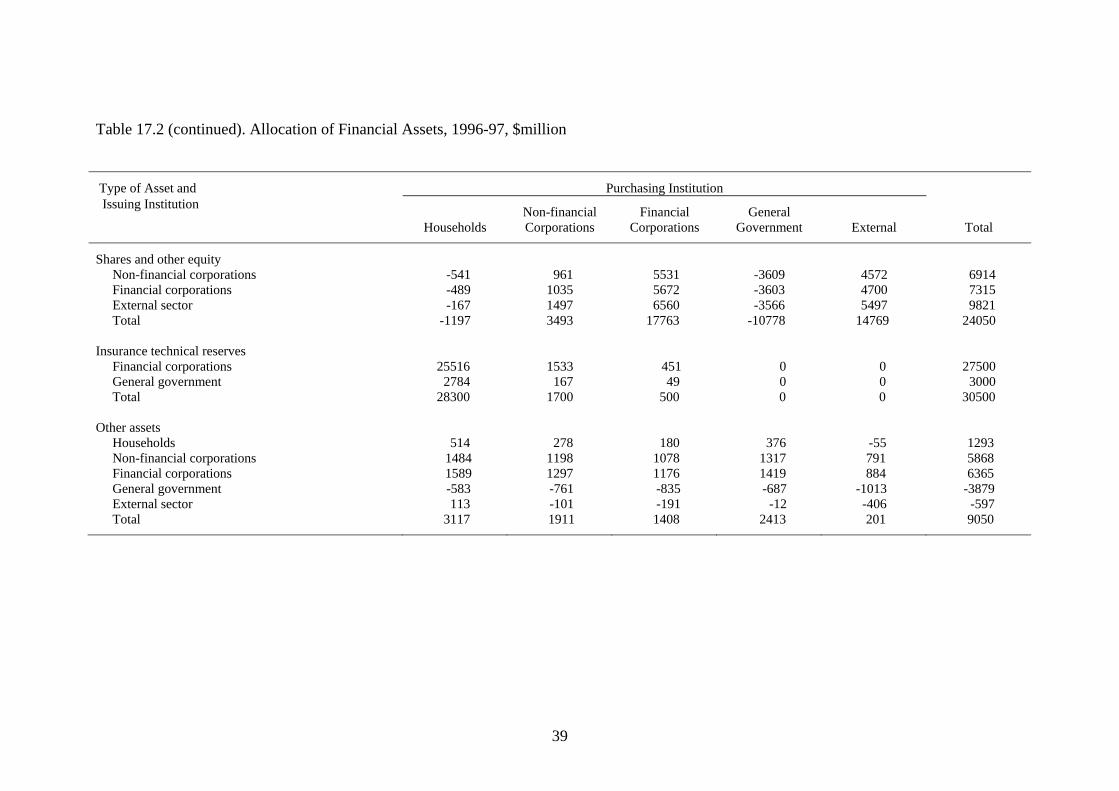
Table 17.1 shows the row and column sums for each financial asset (expressed in
billion dollars) taken from Table 16. It is evident that the total of the row sums is not
equal to the total of the column sums for every asset due to rounding errors. To
impose consistency, the row and column sums are scaled so that they add to the
average of the two totals. The result (expressed in millions of dollars) is shown in
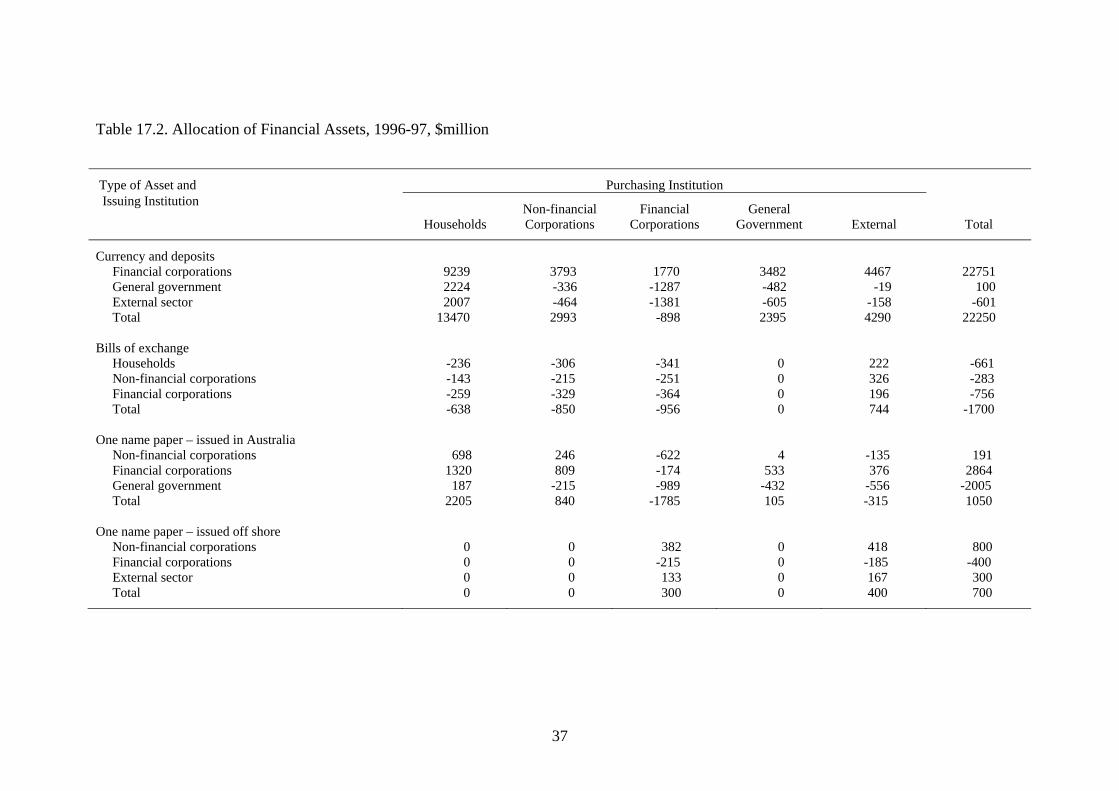
Table 17.2. The bilateral flows of assets between the institutions are determined via
the method adopted for Change in inventories in Table 5. For each asset, a provisional
flow is assigned to each cell of the matrix and the row and column totals adjusted
accordingly. The assigned flow is the same for all cells and is large enough to ensure
that none of the adjusted totals is negative. The RAS method is then employed to
revise the cell so as to conform to the row and column totals. Finally, the original
11
provisional flow is subtracted from each cell and the row and column totals adjusted.
The results of this procedure are also shown in Table 17.2.
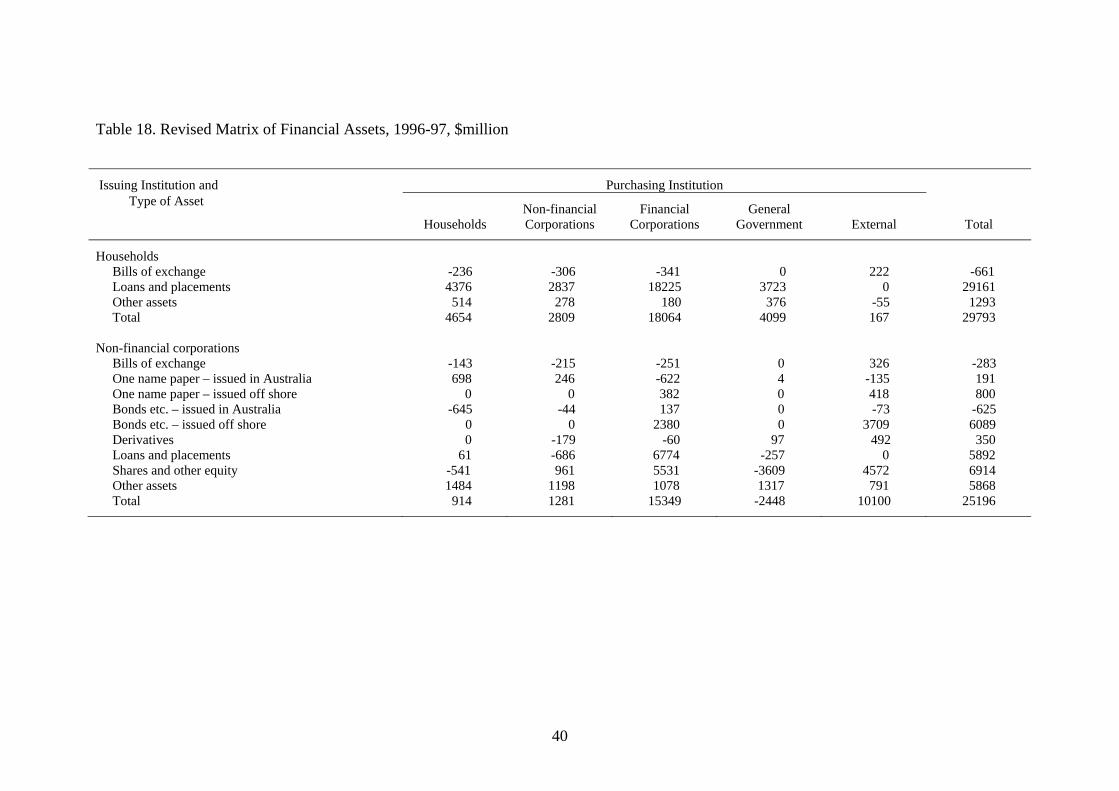
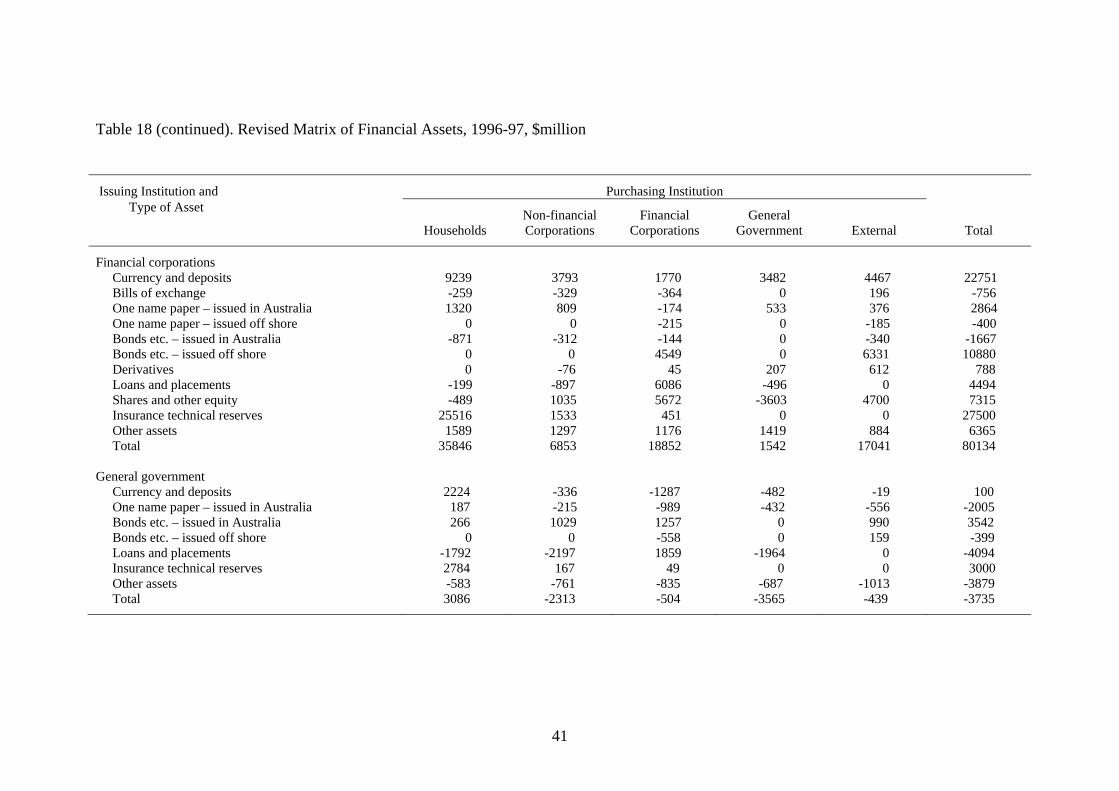
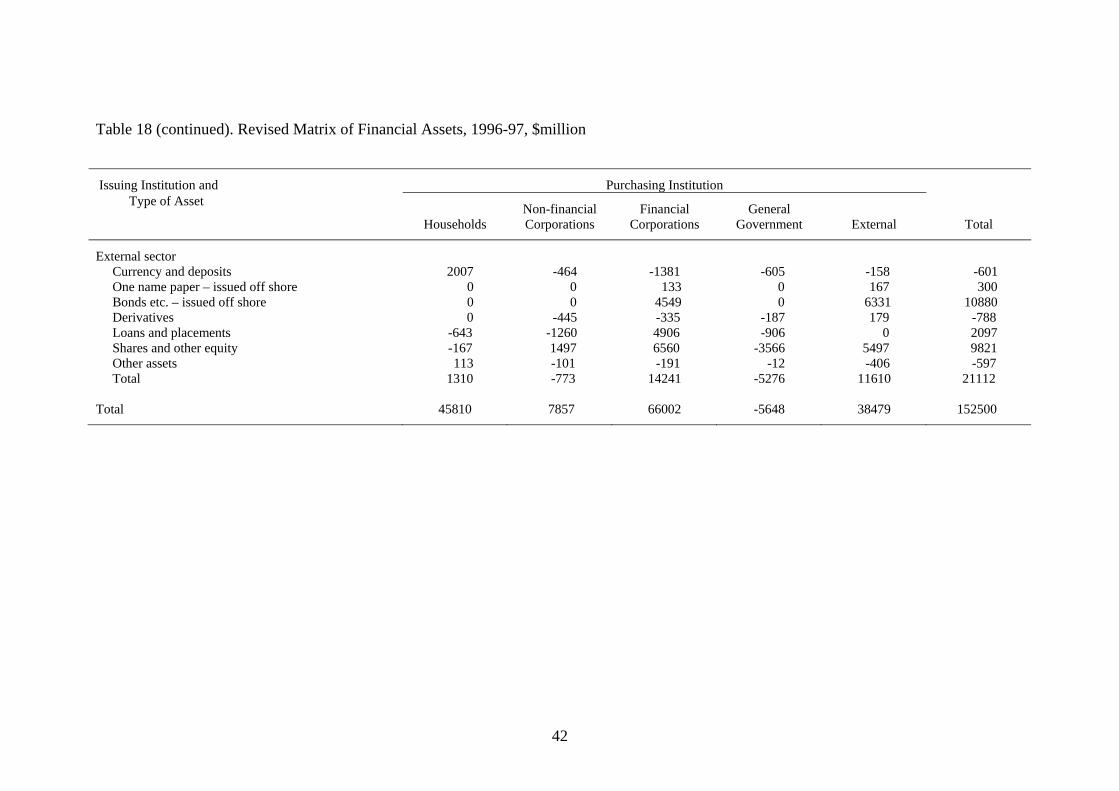
Table 18 shows the same information as Table 17.2 except that the asset flows have
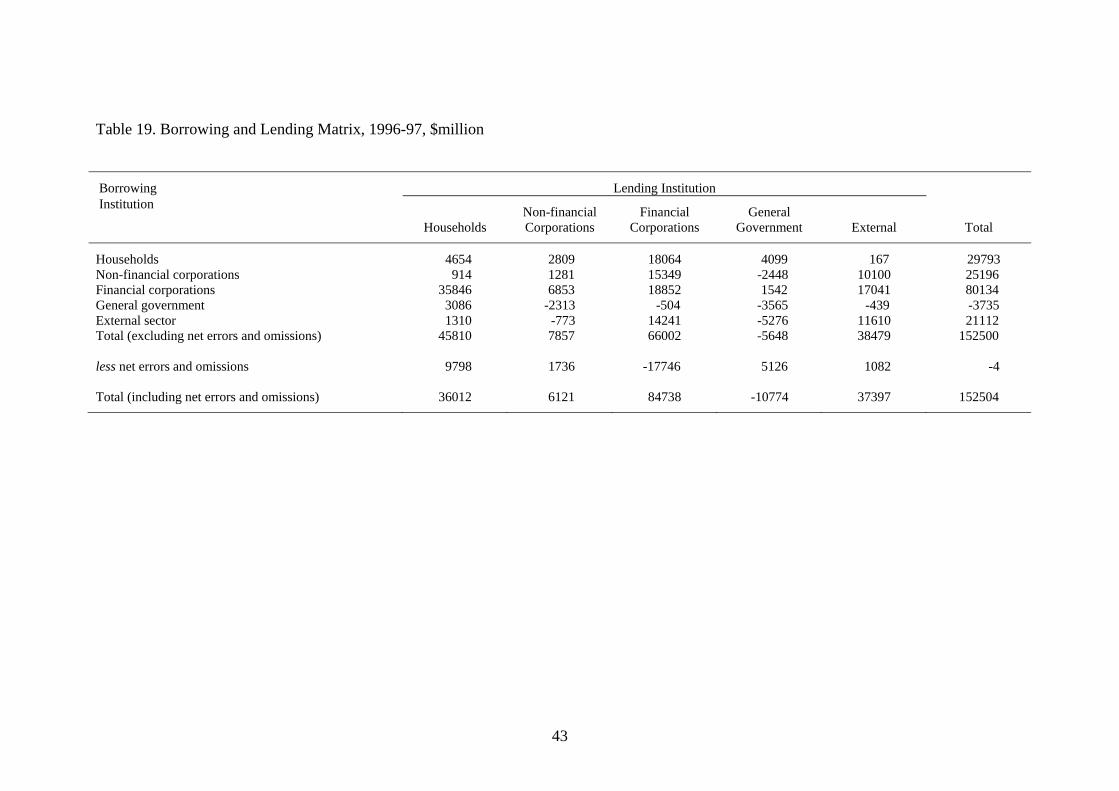
been grouped by issuing institution rather than by type of asset. When the flows of
Table 18 are aggregated across assets, the summary matrix of borrowing and lending
shown in Table 19 is obtained.
IV. Construction of the Social Accounting Matrix
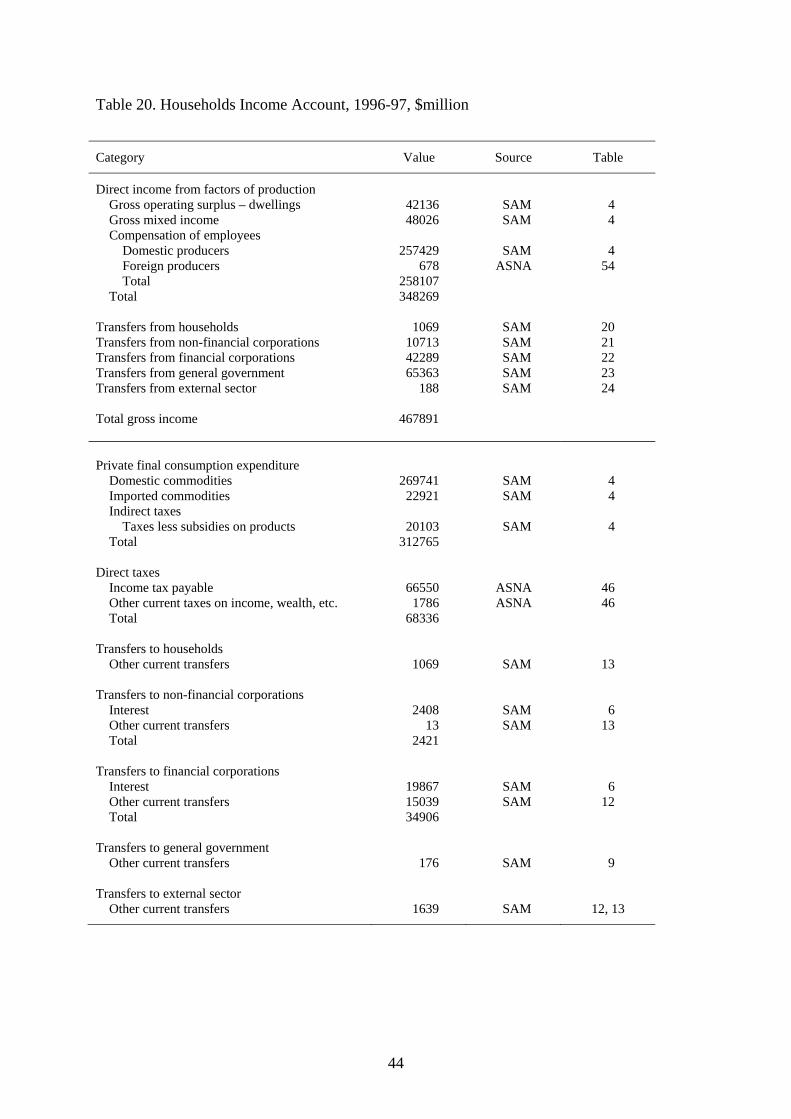
Tables 20 to 29 contain current accounts and capital accounts for the five institutions,
i.e., households, non-financial corporations, financial corporations, general
government and the external sector.9 Generally speaking, the origin of the value of an
item in these accounts is indicated in the columns labelled ‘Source’ and ‘Table’. In all
such cases except one, the value is taken from a table in the ASNA bulletin (source
ASNA) or from a table in this document (source SAM). Thus, on the expenditure side
of the households current account (Table 20), the value 66550 for ‘Income tax
payable’ has been obtained from Table 46 of the ASNA bulletin and the value 2408
for payments of interest, etc. from Table 6 of this document. The exception is the
value 6337 for unemployment benefits in the government current account (Table 23).
This has been obtained from Table 6.5 of source BS.10 In cases when the source is not
indicated, the value of the item can be derived from other items in the table be taking
a sum or a difference.
Each item appears twice in the accounts, once as an income item and once as an
expenditure item. To avoid unnecessary repetition, more detail has been included on
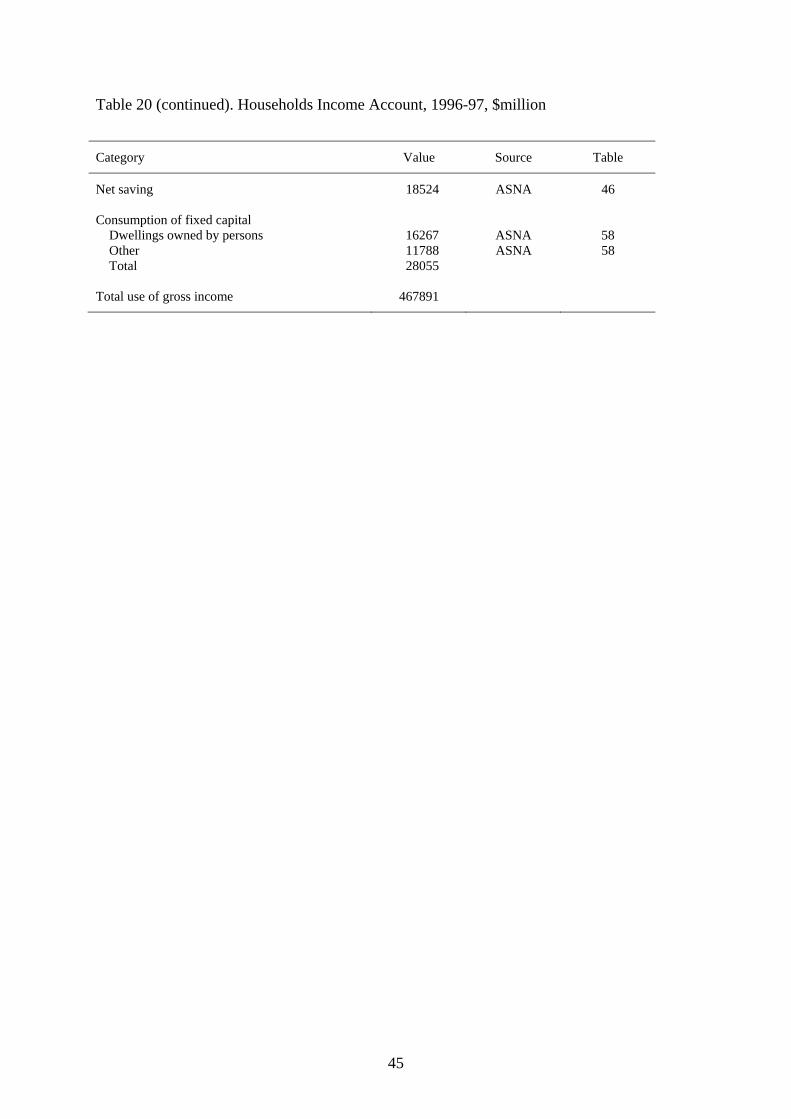
9 In these tables, the category Other current transfers contains non-life insurance premiums, rent on natural assets, non-life insurance claims and reinvested earnings on direct foreign investment. The category Capital transfers accounts for acquisitions and disposals of non-produced non-financial assets. Note also that gross disposable income shown in Table 46 of the ASNA bulletin is the sum of final consumption expenditure, net saving and consumption of fixed capital. However, gross disposable income exceeds the sum of the three by 1. For adding-up consistency, the value of net saving (which is derived as the residual) has been reduced from 18525 to 18524. 10 More specifically, information from the BS bulletin has been used to allocate social assistance benefits between unemployment benefits and other benefits. Here, unemployment benefits refer to newstart allowance, job search allowance and partner allowance.
12
the expenditure side than on the income side. For example, the entry 61250 for
transfers from general government on the income side of the households current
(Table 20) is broken down into interest, other current transfers, unemployment
benefits and other social assistance benefits on the expenditure side of the government
current account (Table 23).
Together with Tables 4 and 8, the current and capital accounts provide all the
information we need to assemble a social accounting matrix. The process involves
only transparent aggregations and hence we shall not enter into a detailed
commentary. The culmination of the paper, a social accounting matrix for the
Australian economy of 1996-97, appears as Table 30.
13
Table 1. The Structure of a Social Accounting Matrix
1 2 3 4 5 6 Factors Households Corporations Government Foreigners Production of current current current current activities Production account account account account
1 Production Inter-industry Consumer Government Exports of activities transactions expenditure on expenditure on goods and domestic goods domestic goods services
2 Factors of Gross value production added in production
3 Households Wages & gross Payments of Government Transfers by current operating surplus interest & transfers to foreigners to account of unincorporated dividends households households enterprises to households
4 Corporations Gross operating Transfers by Government Transfers by current surplus of households to transfers to foreigners to account corporations corporations corporations corporations
5 Government Indirect taxes Government Indirect taxes Company Indirect taxes current on production gross operating on consumption taxes on exports account surplus Income taxes Direct taxes on foreigners
6 Foreigners Imports of Consumer Property Government Imported current intermediate expenditure on income to expenditure on component account goods imports foreigners imports of exports
7 Households Household capital saving account Consumption of fixed capital
8 Corporations Corporation capital saving account Consumption of fixed capital
9 Government Government
capital saving account Consumption of fixed capital
10 Foreigners Balance capital on external account account
11 Total Total cost of Total factor Current Current Current Current production costs outlays by outlays by outlays by outlays by households corporations government foreigners
14
Table 1 (continued). The Structure of a Social Accounting Matrix
7 8 9 10 11 Households Corporations Government Foreigners Total capital capital capital capital account account account account
1 Production Expenditure Expenditure Expenditure Total gross activities on domestic on domestic on domestic output capital goods capital goods capital goods
2 Factors of Total production factor income
3 Households Current current receipts of account households
4 Corporations
Current current receipts of account
corporations
5 Government Indirect taxes Indirect taxes
Current current on capital on capital receipts of account goods goods
government
6 Foreigners Expenditure Expenditure Expenditure Current current on imported on imported on imported receipts of account capital goods capital goods capital goods foreigners
7 Households Net lending by Net lending and Net lending by Capital capital corporations capital transfers foreigners to receipts of account to households by government households households to households
8 Corporations Net lending by Net lending and Net lending by Capital capital households to capital transfers foreigners to receipts of account corporations by government corporations corporations to corporations
9 Government Net lending by Net lending by Net lending by Capital capital households to corporations foreigners to receipts of account government to government government government
10 Foreigners Net lending by Net lending by Net lending and Capital capital households to corporations to capital transfers receipts of account foreigners foreigners by government foreigners to foreigners
11 Total Capital Capital Capital Capital outlays by outlays by outlays by outlays by households corporations government foreigners
15
Table 2. Aggregate Input-Output Table, Input-Output Tables Basis, 1996-97, $million
Total Final Consumption Gross Fixed Capital Change Exports Total Industry Expenditure Expenditure in Supply Uses Households Government Private + General Inventories Public Ents. Government
T1 Total intermediate uses 412134 271871 94903 84662 11429 -2452 100090 972637 P1 Compensation of employees 257193 257193 P2 Gross operating surplus & mixed income 213534 213534 P3 Taxes less subsidies on products 13378 20262 3258 94 158 1643 38793 P4 Other taxes less subsidies on production 19428 3222 22650 P5 Complementary imports 81 111 149 2 -9 334 P6 Competing imports 56889 22991 1323 16045 1258 1323 3427 103256 T2 Australian production 972637 315235 96226 107336 12783 -980 105160 1608397
16
Table 3. Aggregate Input-Output Table, Conversion from IOT Basis to ASNA Basis, 1996-97, $million
Total Final Consumption Gross Fixed Capital Change Exports Total Industry Expenditure Expenditure in Supply Uses Households Government Private + General Inventories Public Ents. Government
Step 1 Total intermediate uses Compensation of employees 257968 257968 Gross operating surplus & mixed income Gross operating surplus Dwellings owned by persons 42136 Other 118107 Total 160243 Gross mixed income 48026 Total 208269 208269 Taxes less subsidies on production and imports 61760 Imports of goods and services 103590 Total uses 312765 96080 104563 13025 -10 105160
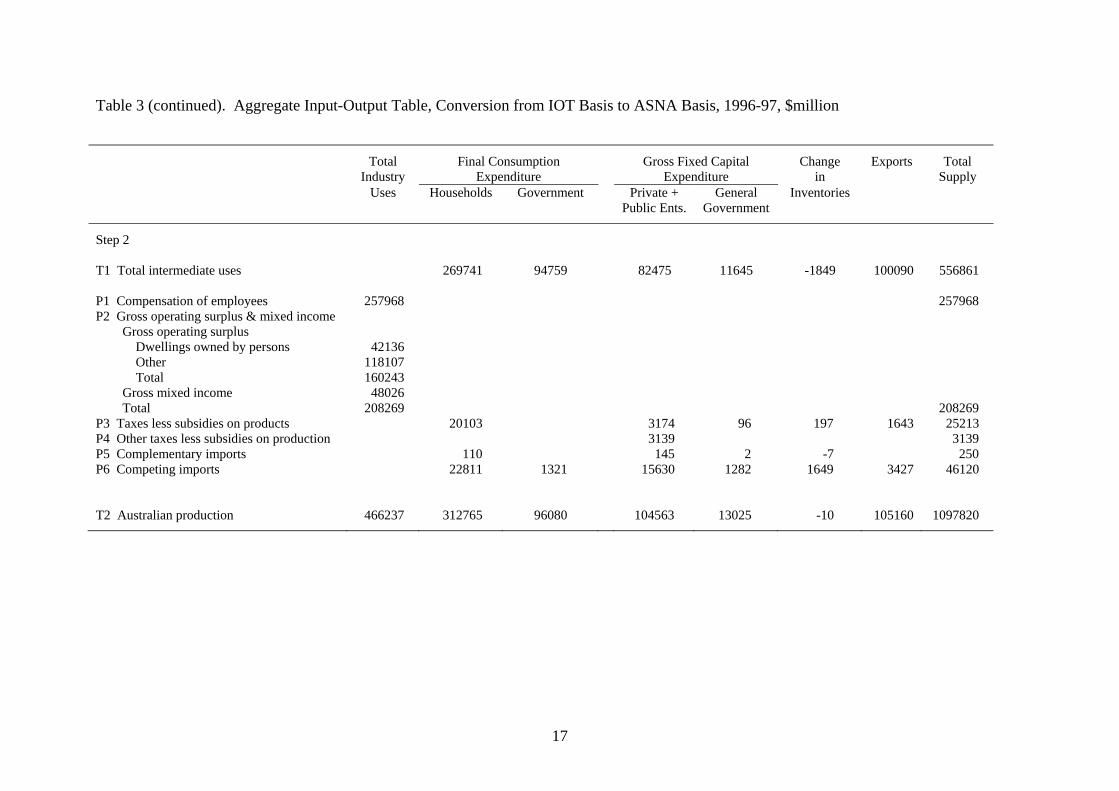
17
Table 3 (continued). Aggregate Input-Output Table, Conversion from IOT Basis to ASNA Basis, 1996-97, $million
Total Final Consumption Gross Fixed Capital Change Exports Total Industry Expenditure Expenditure in Supply Uses Households Government Private + General Inventories Public Ents. Government
Step 2 T1 Total intermediate uses 269741 94759 82475 11645 -1849 100090 556861 P1 Compensation of employees 257968 257968 P2 Gross operating surplus & mixed income Gross operating surplus Dwellings owned by persons 42136 Other 118107 Total 160243 Gross mixed income 48026 Total 208269 208269 P3 Taxes less subsidies on products 20103 3174 96 197 1643 25213 P4 Other taxes less subsidies on production 3139 3139 P5 Complementary imports 110 145 2 -7 250 P6 Competing imports 22811 1321 15630 1282 1649 3427 46120 T2 Australian production 466237 312765 96080 104563 13025 -10 105160 1097820
18
Table 3 (continued). Aggregate Input-Output Table, Conversion from IOT Basis to ASNA Basis, 1996-97, $million
Total Final Consumption Gross Fixed Capital Change Exports Total Industry Expenditure Expenditure in Supply Uses Households Government Private + General Inventories Public Ents. Government
Step 3 T1 Total intermediate uses 413943 413943 P1 Compensation of employees P2 Gross operating surplus & mixed income Gross operating surplus Dwellings owned by persons Other Total Gross mixed income Total P3 Taxes less subsidies on products 13623 13623 P4 Other taxes less subsidies on production 19785 19785 P5 Complementary imports 81 81 P6 Competing imports 57139 57139 T2 Australian production 504571 504571
19
Table 3 (continued). Aggregate Input-Output Table, Conversion from IOT Basis to ASNA Basis, 1996-97, $million
Total Final Consumption Gross Fixed Capital Change Exports Total Industry Expenditure Expenditure in Supply Uses Households Government Private + General Inventories Public Ents. Government
Step 4 T1 Total intermediate uses 413943 269741 94759 82475 11645 -1849 100090 970804 P1 Compensation of employees 257968 257968 P2 Gross operating surplus & mixed income Gross operating surplus Dwellings owned by persons 42136 Other 118107 Total 160243 Gross mixed income 48026 Total 208269 208269 P3 Taxes less subsidies on products 13623 20103 3174 96 197 1643 38836 P4 Other taxes less subsidies on production 19785 3139 22924 P5 Complementary imports 81 110 145 2 -7 331 P6 Competing imports 57139 22811 1321 15630 1282 1649 3427 103259 T2 Australian production 970808 312765 96080 104563 13025 -10 105160 1602391
20
Table 4. Aggregate Input-Output Table, ASNA Basis, 1996-97, $million
Total Final Consumption Gross Fixed Capital Change Exports Total Industry Expenditure Expenditure in Supply Uses Households Government Private + General Inventories Public Ents. Government
T1 Total intermediate uses 413943 269741 94759 82475 11645 -1849 100090 970804 P1 Compensation of employees paid to Domestic residents 257429 Foreign residents 539 257968 Total 257968 P2 Gross operating surplus & mixed income Gross operating surplus Dwellings owned by persons 42136 Other 118107 Total 160243 Gross mixed income 48026 Total 208269 208269 P3 Taxes less subsidies on products 13623 20103 3174 96 197 1643 38836 P4 Other taxes less subsidies on production 19785 3139 22924 P5 Complementary imports 81 110 145 2 -7 331 P6 Competing imports 57139 22811 1321 15630 1282 1649 3427 103259 T2 Australian production 970808 312765 96080 104563 13025 -10 105160 1602391
21
Table 5. Allocation of Investment Expenditure, 1996-97, $million
Non-financial Financial General Households Corporations Corporations Government Total
Fixed capital expenditure Domestic commodities 32646 46821 3008 11645 94120 Imported commodities, complementary 57 83 5 2 147 Imported commodities, competing 6187 8873 570 1282 16912 Indirect taxes Taxes less subsidies on products 1256 1802 116 96 3270 Other taxes less subsidies on investment 1243 1782 114 3139 Total 2499 3584 230 96 6409 Total 41389 59361 3813 13025 117588 Change in inventories Domestic commodities -304 -42 -950 -553 -1849 Imported commodities, complementary 205 543 -636 -119 -7 Imported commodities, competing 661 1070 -353 271 1649 Taxes less subsidies on products 26 72 82 17 197 Total 588 1643 -1857 -384 -10 Total investment expenditure Domestic commodities 32342 46779 2058 11092 92271 Imported commodities 7110 10569 -414 1436 18701 Taxes less subsidies on products 1256 1802 116 96 3270 Other taxes less subsidies on investment 1269 1854 196 17 3336 Total 41977 61004 1956 12641 117578

22
Table 6. Allocation of Interest Flows, 1996-97, $million
Receiving Institution Paying Non-financial Financial General Total Unallocated Institution Households Corporations Corporations Government External
Step 1
Households 22275 Non-financial corporations 21396 Financial corporations 47559 General government 20404 External 2371 Total Unallocated 38924 6587 50830 3508 14156 114005 Step 2
Households 0 0 0 0 22275 Non-financial corporations 0 21396 Financial corporations 14603 426 3508 18537 29022 General government 7826 0 7826 12578 External 0 0 0 0 2371 Total 22429 426 3508 0 26363 Unallocated 16495 6161 50830 0 14156 87642 Step 3
Households 22275 Non-financial corporations 5602 4808 10410 10986 Financial corporations 7599 6522 14121 14901 General government 3294 2826 6120 6458 External 2371 Total 16495 14156 30651 Unallocated 0 6161 50830 0 0 0 56991
23
Table 6 (continued). Allocation of Interest Flows, 1996-97, $million
Receiving Institution Paying Non-financial Financial General Total Unallocated Institution Households Corporations Corporations Government External
Step 4
Households 2408 19867 22275 0 Non-financial corporations 1188 9798 10986 0 Financial corporations 1611 13290 14901 0 General government 698 5760 6458 0 External 256 2115 2371 0 Total 6161 50830 56991 Unallocated 0 0 0 0 0 0 Step 5
Households 0 2408 19867 0 0 22275 Non-financial corporations 5602 1188 9798 0 4808 21396 Financial corporations 22202 2037 13290 3508 6522 47559 General government 11120 698 5760 0 2826 20404 External 0 256 2115 0 0 2371 Total 38924 6587 50830 3508 14156 114005
24
Table 7. Allocation of Dividend Flows, 1996-97, $million
Receiving Institution Paying Non-financial Financial General Total Unallocated Institution Households Corporations Corporations Government External
Step 1
Households 0 Non-financial corporations 23032 Financial corporations 6763 General government 0 External 1702 Total Unallocated 7140 992 6459 9337 7569 31497 Step 2
Households 0 0 0 0 0 0 0 Non-financial corporations 9337 9337 13695 Financial corporations 0 0 6763 General government 0 0 0 0 0 0 0 External 0 0 0 0 1702 Total 0 0 0 9337 0 9337 Unallocated 7140 992 6459 0 7569 22160 Step 3
Households 0 Non-financial corporations 4780 5067 9847 3848 Financial corporations 2360 2502 4862 1901 General government 0 External 1702 Total 7140 7569 14709 Unallocated 0 992 6459 0 0 0 7451
25
Table 7 (continued). Allocation of Dividend Flows, 1996-97, $million
Receiving Institution Paying Non-financial Financial General Total Unallocated Institution Households Corporations Corporations Government External
Step 4
Households Non-financial corporations 512 3336 3848 0 Financial corporations 253 1648 1901 0 General government 0 External 227 1475 1702 0 Total 992 6459 7451 Unallocated 0 0 0 0 0 0 Step 5
Households 0 0 0 0 0 0 Non-financial corporations 4780 512 3336 9337 5067 23032 Financial corporations 2360 253 1648 0 2502 6763 General government 0 0 0 0 0 0 External 0 227 1475 0 0 1702 Total 7140 992 6459 9337 7569 31497
26
Table 8. Allocation of Reinvested Earnings on Direct Foreign Investment, 1996-97, $million
Receiving Institution Paying Non-financial Financial General Total Institution Households Corporations Corporations Government External
Households 0 0 0 0 0 0 Non-financial corporations 0 0 0 0 4429 4429 Financial corporations 0 0 0 0 1021 1021 General government 0 0 0 0 0 0 External 0 2190 1622 0 0 3812 Total 0 2190 1622 0 5450 9262
Table 9. Allocation of Rent on Natural Assets, 1996-97, $million
Receiving Institution Paying Non-financial Financial General Total Institution Households Corporations Corporations Government External
Households 0 0 0 176 0 176 Non-financial corporations 18 11 0 1287 0 1316 Financial corporations 0 0 0 0 0 0 General government 0 0 0 0 0 0 External 0 0 0 0 0 0 Total 18 11 0 1463 0 1492
27
Table 10. Allocation of Social Assistance Benefits, 1996-97, $million
Receiving Institution Paying Non-financial Financial General Total Institution Households Corporations Corporations Government External
Households 0 0 0 0 0 0 Non-financial corporations 0 0 0 0 0 0 Financial corporations 0 0 0 0 0 0 General government 46084 0 0 0 0 46084 External 0 0 0 0 0 0 Total 46084 0 0 0 0 46084
Table 11. Allocation of Non-life Insurance Claims, 1996-97, $million
Receiving Institution Paying Non-financial Financial General Total Institution Households Corporations Corporations Government External
Households 0 0 0 0 0 0 Non-financial corporations 0 0 0 0 0 0 Financial corporations 17727 2789 0 0 0 20516 General government 0 0 0 0 0 0 External 0 0 0 0 0 0 Total 17727 2789 0 0 0 20516
28
Table 12. Allocation of Non-life Insurance Premiums, 1996-97, $million
Receiving Institution Paying Non-financial Financial General Total Unallocated Institution Households Corporations Corporations Government External
Step 1
Households 16475 Non-financial corporations 3156 Financial corporations 0 General government 0 External 1655 Total Unallocated 0 0 19575 0 1711 21286
Step 2
Households 0 0 0 0 0 0 16475 Non-financial corporations 0 0 0 0 0 0 3156 Financial corporations 0 0 0 0 0 0 0 General government 0 0 0 0 0 0 0 External 0 0 1655 0 0 1655 0 Total 0 0 1655 0 0 1655 Unallocated 0 0 17920 0 1711 19631
Step 3
Households 0 0 15039 0 1436 16475 Non-financial corporations 0 0 2881 0 275 3156 Financial corporations 0 0 0 0 0 0 General government 0 0 0 0 0 0 External 0 0 1655 0 0 1655 Total 0 0 19575 0 1711 21286
29
Table 13. Allocation of Current Transfers n.e.c., 1996-97, $million
Receiving Institution Paying Non-financial Financial General Total Unallocated Institution Households Corporations Corporations Government External
Step 1
Households 1285 Non-financial corporations 1501 Financial corporations 0 General government 9812 External 900 Total Unallocated 9729 121 0 1798 1850 13498
Step 2
Households 0 0 0 0 0 0 1285 Non-financial corporations 0 0 0 1124 0 1124 377 Financial corporations 0 0 0 0 0 0 0 General government 0 0 0 0 0 0 9812 External 0 0 0 674 0 674 226 Total 0 0 0 1798 0 1798 Unallocated 9729 121 0 0 1850 11700
Step 3
Households 1069 13 0 0 203 1285 Non-financial corporations 313 4 0 1124 60 1501 Financial corporations 0 0 0 0 0 0 General government 8159 102 0 0 1551 9812 External 188 2 0 674 36 900 Total 9729 121 0 1798 1850 13498
30
Table 14. Allocation of Capital Transfers, 1996-97, $million
Receiving Institution Paying Non-financial Financial General Total Unallocated Institution Households Corporations Corporations Government External
Step 1
Households 0 95 95 857 Non-financial corporations 0 0 0 858 0 858 0 Financial corporations 0 0 0 0 0 0 0 General government 369 2488 44 0 2901 266 External 0 0 0 2200 Total 369 2488 44 953 0 3854 Unallocated 2200 246 0 0 877 3323
Step 2
Households 0 246 0 95 611 952 Non-financial corporations 0 0 0 858 0 858 Financial corporations 0 0 0 0 0 0 General government 369 2488 44 0 266 3167 External 2200 0 0 0 0 2200 Total 2569 2734 44 953 877 7177
31
Table 15. Allocation of Non-produced Non-financial Assets, 1996-97, $million
Acquiring Institution Disposing Non-financial Financial General Total Unallocated Institution Households Corporations Corporations Government External
Step 1
Households 0 Non-financial corporations 18 Financial corporations 0 General government 27 External 0 Total Unallocated 0 0 39 0 6 45
Step 2
Households 0 0 0 0 0 0 Non-financial corporations 0 0 16 0 2 18 Financial corporations 0 0 0 0 0 0 General government 0 0 23 0 4 27 External 0 0 0 0 0 0 Total 0 0 39 0 6 45
32
Table 16. Summary Matrix of Financial Flows, 1996-97
Non-financial Financial General Households Corporations Corporations Government External Total
A. Capital formations and savings, $million
1. Net saving 18525 1924 2208 -2903 19754 2. Net capital transfers 1617 1876 44 -2214 -1323 1323 3. Gross fixed capital formation 41389 59361 3813 13025 117588 4. Net lending (+) / borrowing (-) 6219 -19075 3614 -7039 16285 4
B. Financial account, $billion
5. Acquisition of financial assets Currency and deposits 13.5 3.0 -0.9 2.4 4.3 22.3 Bills of exchange -0.6 -0.8 -0.9 0.7 -1.6 One name paper – issued in Australia 2.1 0.8 -1.7 0.1 -0.3 1.0 One name paper – issued off shore 0.3 0.4 0.7 Bonds etc – issued in Australia -1.3 0.7 1.3 0.6 1.3 Bonds etc – issued off shore 10.9 16.5 27.4 Derivatives -0.6 -0.3 0.1 1.1 0.3 Loans and placements 1.8 -2.2 37.8 0.1 37.5 Shares and other equity 1.2 3.5 17.8 -10.8 14.8 24.1 Insurance technical reserves 28.3 1.7 0.5 30.5 Other accounts receivable 3.1 1.9 1.4 2.4 0.2 9.0 Total 45.6 7.9 66.2 -5.8 38.4 152.5
33
Table 16. (continued). Summary Matrix of Financial Flows, 1996-97
Non-financial Financial General Households Corporations Corporations Government External Total
6. Incurrence of liabilities Currency and deposits 22.7 0.1 -0.6 22.2 Bills of exchange -0.7 -0.3 -0.8 -1.8 One name paper – issued in Australia 0.2 3.0 -2.1 1.1 One name paper – issued off shore 0.8 -0.4 0.3 0.7 Bonds etc – issued in Australia -0.6 -1.6 3.4 1.2 Bonds etc – issued off shore 6.1 10.9 -0.4 10.9 27.5 Derivatives 0.4 0.9 -0.9 0.4 Loans and placements 29.2 5.9 4.5 -4.1 2.1 37.6 Shares and other equity 6.9 7.3 9.8 24.0 Insurance technical reserves 27.5 3.0 30.5 Other accounts payable 1.3 5.9 6.4 -3.9 -0.6 9.1 Total 29.9 25.3 80.5 -4.1 20.8 152.4 7. Financial surplus (+) or deficit (-) 15.7 -17.4 -14.3 -1.7 17.6 0.0 8. Difference (line 4 – line 7) -9.5 -1.7 17.9 -5.3 -1.3 0.0 9. Net lending (+) or borrowing (-) (line 4) 6.2 -19.1 3.6 -7.0 16.3 0.0
34
Table 17.1. Financial Assets by Institution, 1996-97, $billion
Type of Asset and Purchasing Institution Issuing Institution Non-financial Financial General Households Corporations Corporations Government External Total
Currency and deposits Financial corporations 22.7 General government 0.1 External sector -0.6 Total 13.5 3.0 -0.9 2.4 4.3 22.3 Bills of exchange Households -0.7 Non-financial corporations -0.3 Financial corporations -0.8 Total -0.6 -0.8 -0.9 0.0 0.7 -1.6 One name paper – issued in Australia Non-financial corporations 0.2 Financial corporations 3.0 General government -2.1 Total 2.1 0.8 -1.7 0.1 -0.3 1.0 One name paper – issued off shore Non-financial corporations 0.8 Financial corporations -0.4 External sector 0.3 Total 0.3 0.4 0.7
35
Table 17.1 (continued). Financial Assets by Institution, 1996-97, $billion
Type of Asset and Purchasing Institution Issuing Institution Non-financial Financial General Households Corporations Corporations Government External Total
Bonds etc – issued in Australia Non-financial corporations -0.6 Financial corporations -1.6 General government 3.4 Total -1.3 0.7 1.3 0.6 1.3 Bonds etc – issued off shore Non-financial corporations 6.1 Financial corporations 10.9 General government -0.4 External sector 10.9 Total 10.9 16.5 27.4 Derivatives Non-financial corporations 0.4 Financial corporations 0.9 External sector -0.9 Total -0.6 -0.3 0.1 1.1 0.3 Loans and placements Households 29.2 Non-financial corporations 5.9 Financial corporations 4.5 General government -4.1 External sector 2.1 Total 1.8 -2.2 37.8 0.1 37.5
36
Table 17.1 (continued). Financial Assets by Institution, 1996-97, $billion
Type of Asset and Purchasing Institution Issuing Institution Non-financial Financial General Households Corporations Corporations Government External Total
Shares and other equity Non-financial corporations 6.9 Financial corporations 7.3 External sector 9.8 Total -1.2 3.5 17.8 -10.8 14.8 24.1 Insurance technical reserves Financial corporations 27.5 General government 3.0 Total 28.3 1.7 0.5 30.5 Other assets Households 1.3 Non-financial corporations 5.9 Financial corporations 6.4 General government -3.9 External sector -0.6 Total 3.1 1.9 1.4 2.4 0.2 9.0
37
Table 17.2. Allocation of Financial Assets, 1996-97, $million
Type of Asset and Purchasing Institution Issuing Institution Non-financial Financial General Households Corporations Corporations Government External Total
Currency and deposits Financial corporations 9239 3793 1770 3482 4467 22751 General government 2224 -336 -1287 -482 -19 100 External sector 2007 -464 -1381 -605 -158 -601 Total 13470 2993 -898 2395 4290 22250 Bills of exchange Households -236 -306 -341 0 222 -661 Non-financial corporations -143 -215 -251 0 326 -283 Financial corporations -259 -329 -364 0 196 -756 Total -638 -850 -956 0 744 -1700 One name paper – issued in Australia Non-financial corporations 698 246 -622 4 -135 191 Financial corporations 1320 809 -174 533 376 2864 General government 187 -215 -989 -432 -556 -2005 Total 2205 840 -1785 105 -315 1050 One name paper – issued off shore Non-financial corporations 0 0 382 0 418 800 Financial corporations 0 0 -215 0 -185 -400 External sector 0 0 133 0 167 300 Total 0 0 300 0 400 700
38
Table 17.2 (continued). Allocation of Financial Assets, 1996-97, $million Type of Asset and Purchasing Institution Issuing Institution Non-financial Financial General Households Corporations Corporations Government External Total
Bonds etc – issued in Australia Non-financial corporations -645 -44 137 0 -73 -625 Financial corporations -871 -312 -144 0 -340 -1667 General government 266 1029 1257 0 990 3542 Total -1250 673 1250 0 577 1250 Bonds etc – issued off shore Non-financial corporations 0 0 2380 0 3709 6089 Financial corporations 0 0 4549 0 6331 10880 General government 0 0 -558 0 159 -399 External sector 0 0 4549 0 6331 10880 Total 0 0 10920 0 16530 27450 Derivatives Non-financial corporations 0 -179 -60 97 492 350 Financial corporations 0 -76 45 207 612 788 External sector 0 -445 -335 -187 179 -788 Total 0 -700 -350 117 1283 350 Loans and placements Households 4376 2837 18225 3723 0 29161 Non-financial corporations 61 -686 6774 -257 0 5892 Financial corporations -199 -897 6086 -496 0 4494 General government -1792 -2197 1859 -1964 0 -4094 External sector -643 -1260 4906 -906 0 2097 Total 1803 -2203 37850 100 0 37550
39
Table 17.2 (continued). Allocation of Financial Assets, 1996-97, $million
Type of Asset and Purchasing Institution Issuing Institution Non-financial Financial General Households Corporations Corporations Government External Total
Shares and other equity Non-financial corporations -541 961 5531 -3609 4572 6914 Financial corporations -489 1035 5672 -3603 4700 7315 External sector -167 1497 6560 -3566 5497 9821 Total -1197 3493 17763 -10778 14769 24050 Insurance technical reserves Financial corporations 25516 1533 451 0 0 27500 General government 2784 167 49 0 0 3000 Total 28300 1700 500 0 0 30500 Other assets Households 514 278 180 376 -55 1293 Non-financial corporations 1484 1198 1078 1317 791 5868 Financial corporations 1589 1297 1176 1419 884 6365 General government -583 -761 -835 -687 -1013 -3879 External sector 113 -101 -191 -12 -406 -597 Total 3117 1911 1408 2413 201 9050
40
Table 18. Revised Matrix of Financial Assets, 1996-97, $million
Issuing Institution and Purchasing Institution Type of Asset Non-financial Financial General Households Corporations Corporations Government External Total
Households Bills of exchange -236 -306 -341 0 222 -661 Loans and placements 4376 2837 18225 3723 0 29161 Other assets 514 278 180 376 -55 1293 Total 4654 2809 18064 4099 167 29793 Non-financial corporations Bills of exchange -143 -215 -251 0 326 -283 One name paper – issued in Australia 698 246 -622 4 -135 191 One name paper – issued off shore 0 0 382 0 418 800 Bonds etc. – issued in Australia -645 -44 137 0 -73 -625 Bonds etc. – issued off shore 0 0 2380 0 3709 6089 Derivatives 0 -179 -60 97 492 350 Loans and placements 61 -686 6774 -257 0 5892 Shares and other equity -541 961 5531 -3609 4572 6914 Other assets 1484 1198 1078 1317 791 5868 Total 914 1281 15349 -2448 10100 25196
41
Table 18 (continued). Revised Matrix of Financial Assets, 1996-97, $million Issuing Institution and Purchasing Institution Type of Asset Non-financial Financial General Households Corporations Corporations Government External Total
Financial corporations Currency and deposits 9239 3793 1770 3482 4467 22751 Bills of exchange -259 -329 -364 0 196 -756 One name paper – issued in Australia 1320 809 -174 533 376 2864 One name paper – issued off shore 0 0 -215 0 -185 -400 Bonds etc. – issued in Australia -871 -312 -144 0 -340 -1667 Bonds etc. – issued off shore 0 0 4549 0 6331 10880 Derivatives 0 -76 45 207 612 788 Loans and placements -199 -897 6086 -496 0 4494 Shares and other equity -489 1035 5672 -3603 4700 7315 Insurance technical reserves 25516 1533 451 0 0 27500 Other assets 1589 1297 1176 1419 884 6365 Total 35846 6853 18852 1542 17041 80134 General government Currency and deposits 2224 -336 -1287 -482 -19 100 One name paper – issued in Australia 187 -215 -989 -432 -556 -2005 Bonds etc. – issued in Australia 266 1029 1257 0 990 3542 Bonds etc. – issued off shore 0 0 -558 0 159 -399 Loans and placements -1792 -2197 1859 -1964 0 -4094 Insurance technical reserves 2784 167 49 0 0 3000 Other assets -583 -761 -835 -687 -1013 -3879 Total 3086 -2313 -504 -3565 -439 -3735
42
Table 18 (continued). Revised Matrix of Financial Assets, 1996-97, $million
Issuing Institution and Purchasing Institution Type of Asset Non-financial Financial General Households Corporations Corporations Government External Total
External sector Currency and deposits 2007 -464 -1381 -605 -158 -601 One name paper – issued off shore 0 0 133 0 167 300 Bonds etc. – issued off shore 0 0 4549 0 6331 10880 Derivatives 0 -445 -335 -187 179 -788 Loans and placements -643 -1260 4906 -906 0 2097 Shares and other equity -167 1497 6560 -3566 5497 9821 Other assets 113 -101 -191 -12 -406 -597 Total 1310 -773 14241 -5276 11610 21112 Total 45810 7857 66002 -5648 38479 152500
43
Table 19. Borrowing and Lending Matrix, 1996-97, $million
Borrowing Lending Institution Institution Non-financial Financial General Households Corporations Corporations Government External Total
Households 4654 2809 18064 4099 167 29793 Non-financial corporations 914 1281 15349 -2448 10100 25196 Financial corporations 35846 6853 18852 1542 17041 80134 General government 3086 -2313 -504 -3565 -439 -3735 External sector 1310 -773 14241 -5276 11610 21112 Total (excluding net errors and omissions) 45810 7857 66002 -5648 38479 152500 less net errors and omissions 9798 1736 -17746 5126 1082 -4 Total (including net errors and omissions) 36012 6121 84738 -10774 37397 152504
44
Table 20. Households Income Account, 1996-97, $million
Category Value Source Table
Direct income from factors of production Gross operating surplus – dwellings 42136 SAM 4 Gross mixed income 48026 SAM 4 Compensation of employees Domestic producers 257429 SAM 4 Foreign producers 678 ASNA 54 Total 258107 Total 348269 Transfers from households 1069 SAM 20 Transfers from non-financial corporations 10713 SAM 21 Transfers from financial corporations 42289 SAM 22 Transfers from general government 65363 SAM 23 Transfers from external sector 188 SAM 24 Total gross income 467891 Private final consumption expenditure Domestic commodities 269741 SAM 4 Imported commodities 22921 SAM 4 Indirect taxes Taxes less subsidies on products 20103 SAM 4 Total 312765 Direct taxes Income tax payable 66550 ASNA 46 Other current taxes on income, wealth, etc. 1786 ASNA 46 Total 68336 Transfers to households Other current transfers 1069 SAM 13 Transfers to non-financial corporations Interest 2408 SAM 6 Other current transfers 13 SAM 13 Total 2421 Transfers to financial corporations Interest 19867 SAM 6 Other current transfers 15039 SAM 12 Total 34906 Transfers to general government Other current transfers 176 SAM 9 Transfers to external sector Other current transfers 1639 SAM 12, 13
45
Table 20 (continued). Households Income Account, 1996-97, $million
Category Value Source Table
Net saving 18524 ASNA 46 Consumption of fixed capital Dwellings owned by persons 16267 ASNA 58 Other 11788 ASNA 58 Total 28055 Total use of gross income 467891
46
Table 21. Non-financial Corporations Income Account, 1996-97, $million
Category Value Source Table
Gross operating surplus 98349 ASNA 27 Transfers from households 2421 SAM 20 Transfers from non-financial corporations 1715 SAM 21 Transfers from financial corporations 5079 SAM 22 Transfers from general government 800 SAM 23 Transfers from external sector 2675 SAM 24 Total gross income 111039 Direct taxes Income taxes 16138 ASNA 27 Transfers to households Interest 5602 SAM 6 Dividends 4780 SAM 7 Other current transfers 331 SAM 9, 13 Total 10713 Transfers to non-financial corporations Interest 1188 SAM 6 Dividends 512 SAM 7 Other current transfers 15 SAM 9, 13 Total 1715 Transfers to financial corporations Interest 9798 SAM 6 Dividends 3336 SAM 7 Other current transfers 2881 SAM 12 Total 16015 Transfers to general government Dividends 9337 SAM 7 Other current transfers 2411 SAM 9, 13 Total 11748 Transfers to external sector Interest 4808 SAM 6 Dividends 5067 SAM 7 Other current transfers 4764 SAM 8, 12, 13 Total 14639 Net saving 1924 ASNA 27 Consumption of fixed capital 38147 ASNA 27 Total use of gross income 111039
47
Table 22. Financial Corporations Income Account, 1996-97, $million
Category Value Source Table
Gross operating surplus 9012 ASNA 35 Transfers from households 34906 SAM 20 Transfers from non-financial corporations 16015 SAM 21 Transfers from financial corporations 14938 SAM 22 Transfers from general government 5760 SAM 23 Transfers from external sector 6867 SAM 24 Total gross income 87498 Direct taxes Income taxes 6152 ASNA 35 Transfers to households Interest 22202 SAM 6 Dividends 2360 SAM 7 Other current transfers 17727 SAM 11 Total 42289 Transfers to non-financial corporations Interest 2037 SAM 6 Dividends 253 SAM 7 Other current transfers 2789 SAM 11 Total 5079 Transfers to financial corporations Interest 13290 SAM 6 Dividends 1648 SAM 7 Total 14938 Transfers to general government Interest 3508 SAM 6 Transfers to external sector Interest 6522 SAM 6 Dividends 2502 SAM 7 Other current transfers 1021 SAM 8 Total 10045 Net saving 2208 ASNA 35 Consumption of fixed capital 3279 ASNA 35 Total use of gross income 87498
48
Table 23. General Government Income Account, 1996-97, $million
Category Value Source Table
Gross operating surplus 10746 ASNA 40 Direct taxes Households 68336 SAM 20 Non-financial corporations 16138 SAM 21 Financial corporations 6152 SAM 22 External sector 985 SAM 24 Total 91611 Indirect taxes Production Taxes less subsidies on products 13623 SAM 4 Other taxes less subsidies on production 19785 SAM 4 Subsidies 7020 ASNA 40 Total 40428 Current expenditure Households 20103 SAM 4 External sector 1643 SAM 4 Total 21746 Capital expenditure Households 2525 SAM 5 Non-financial corporations 3656 SAM 5 Financial corporations 312 SAM 5 General government 113 SAM 5 Total 6606 SAM 5 Total 68780 Transfers from households 176 SAM 20 Transfers from non-financial corporations 11748 SAM 21 Transfers from financial corporations 3508 SAM 22 Transfers from external sector 674 SAM 24 Total gross income 187243
Final consumption expenditure Domestic commodities 94759 SAM 4 Imported commodities 1321 SAM 4 Total 96080 Transfers to households Interest 11120 SAM 6 Other current transfers 8159 SAM 13 Social assistance benefits Unemployment benefits 6616 BS 6.5 Other 39468 BS 6.5 Total 46084 SAM 10 Total 65363
49
Table 23 (continued). General Government Income Account, 1996-97, $million
Category Value Source Table
Transfers to non-financial corporations Interest 698 SAM 6 Other current transfers 102 SAM 13 Total 800 Transfers to financial corporations Interest 5760 SAM 6 Transfers to external sector Interest 2826 SAM 6 Other current transfers 1551 SAM 13 Total 4377 SAM Subsidies 7020 ASNA 40 Net saving -2903 ASNA 40 Consumption of fixed capital 10746 ASNA 40 Total use of gross income 187243
50
Table 24. External Sector Income Account, 1996-97, $million
Category Value Source Table
Compensation of employees 539 SAM 4 Imports of goods and services Production 57220 SAM 4 Current expenditure Households 22921 SAM 4 General government 1321 External sector 3427 SAM 4 Total 27669 Capital expenditure Households 7110 SAM 5 Non-financial corporations 10569 SAM 5 Financial corporations -414 SAM 5 General government 1436 SAM 5 Total 18701 Total 103590 Transfers from households 1639 SAM 20 Transfers from non-financial corporations 14639 SAM 21 Transfers from financial corporations 10045 SAM 22 Transfers from general government 4377 SAM 23 Transfers from external sector 36 SAM 24 Total income of non-residents 134865
Exports of goods and services Domestic commodities 100090 SAM 4 Imported commodities 3427 SAM 4 Indirect taxes Taxes less subsidies on products 1643 SAM 4 Total 105160 Direct taxes Income tax 985 ASNA 54 Transfers to households Compensation of employees 678 ASNA 54 Other current transfers 188 SAM 13 Total 866 Transfers to non-financial corporations Interest 256 SAM 6 Dividends 227 SAM 7 Other current transfers 2192 SAM 8, 13 Total 2675 Transfers to financial corporations Interest 2115 SAM 6 Dividends 1475 SAM 7 Other current transfers 3277 SAM 8, 12 Total 6867
51
Table 24 (continued). External Sector Income Account, 1996-97, $million
Category Value Source Table
Transfers to general government Other current transfers 674 SAM 13 Transfers to external sector Other current transfers 36 SAM 13 Balance on external income account 17602 ASNA 54 Total use of income of non-residents 134865
52
Table 25. Households Capital Account, 1996-97, $million
Category Value Source Table
Consumption of fixed capital 28055 SAM 20 Net saving 18524 SAM 20 Borrowing from: Households 4654 SAM 19 Non-financial corporations 2809 SAM 19 Financial corporations 18064 SAM 19 General government 4099 SAM 19 External sector 167 SAM 19 Total 29793 Capital transfers from: General government 369 SAM 14 External sector 2200 SAM 14 Total 2569 Finance of gross accumulation 78941
Gross investment expenditure Domestic commodities 32342 SAM 5 Imported commodities 7110 SAM 5 Indirect taxes Taxes less subsidies on products 1256 SAM 5 Other taxes less subsidies on investment 1269 SAM 5 Total 2525 Total 41977 Lending to: Households 4654 SAM 19 Non-financial corporations 914 SAM 19 Financial corporations 35846 SAM 19 General government 3086 SAM 19 External sector 1310 SAM 19 Total 45810 Capital transfers to: Non-financial corporations 246 SAM 14 General government 95 SAM 14 External sector 611 SAM 14 Total 952 less net errors and omissions 9798 SAM 19 Gross accumulation 78941
53
Table 26. Non-financial Corporations Capital Account, 1996-97, $million
Category Value Source Table
Consumption of fixed capital 38147 SAM 21 Net saving 1924 SAM 21 Borrowing from: Households 914 SAM 19 Non-financial corporations 1281 SAM 19 Financial corporations 15349 SAM 19 General government -2448 SAM 19 External sector 10100 SAM 19 Total 25196 Capital transfers from: Households 246 SAM 14 General government 2488 SAM 14 Total 2734 Finance of gross accumulation 68001
Gross investment expenditure Domestic commodities 46779 SAM 5 Imported commodities 10569 SAM 5 Indirect taxes Taxes less subsidies on products 1802 SAM 5 Other taxes less subsidies on investment 1854 SAM 5 Total 3656 Total 61004 Lending to: Households 2809 SAM 19 Non-financial corporations 1281 SAM 19 Financial corporations 6853 SAM 19 General government -2313 SAM 19 External sector -773 SAM 19 Total 7857 Capital transfers to: Financial corporations 16 SAM 15 General government 858 SAM 14 External sector 2 SAM 15 Total 876 less net errors and omissions 1736 SAM 19 Gross capital accumulation 68001
54
Table 27. Financial Corporations Capital Account, 1996-97, $million
Category Value Source Table
Consumption of fixed capital 3279 SAM 22 Net saving 2208 SAM 22 Borrowing from: Households 35846 SAM 19 Non-financial corporations 6853 SAM 19 Financial corporations 18852 SAM 19 General government 1542 SAM 19 External sector 17041 SAM 19 Total 80134 Capital transfers from: Non-financial corporations 16 SAM 15 General government 67 SAM 14, 15 Total 83 Finance of gross accumulation 85704
Gross investment expenditure Domestic commodities 2058 SAM 5 Imported commodities -414 SAM 5 Indirect taxes Taxes less subsidies on products 116 SAM 5 Other taxes less subsidies on investment 196 SAM 5 Total 312 Total 1956 Lending to: Households 18064 SAM 19 Non-financial corporations 15349 SAM 19 Financial corporations 18852 SAM 19 General government -504 SAM 19 External sector 14241 SAM 19 Total 66002 less net errors and omissions -17746 SAM 19 Gross capital accumulation 85704
55
Table 28. General Government Capital Account, 1996-97, $million
Category Value Source Table
Consumption of fixed capital 10746 SAM 23 Net saving -2903 SAM 23 Borrowing from: Households 3086 SAM 19 Non-financial corporations -2313 SAM 19 Financial corporations -504 SAM 19 General government -3565 SAM 19 External sector -439 SAM 19 Total -3735 Capital transfers from: Households 95 SAM 14 Non-financial corporations 858 SAM 14 Total 953 Finance of gross accumulation 5061
Gross investment expenditure Domestic commodities 11092 SAM 5 Imported commodities 1436 SAM 5 Indirect taxes Taxes less subsidies on products 96 SAM 5 Other taxes less subsidies on investment 17 SAM 5 Total 113 Total 12641 Lending to: Households 4099 SAM 19 Non-financial corporations -2448 SAM 19 Financial corporations 1542 SAM 19 General government -3565 SAM 19 External sector -5276 SAM 19 Total -5648 Capital transfers to: Households 369 SAM 14 Non-financial corporations 2488 SAM 14 Financial corporations 67 SAM 14, 15 External sector 270 SAM 14, 15 Total 3194 less net errors and omissions 5126 SAM 19 Gross capital accumulation 5061
56
Table 29. External Sector Capital Account, 1996-97, $million
Category Value Source Table
Balance on external account 17602 SAM 24 Borrowing from: Households 1310 SAM 19 Non-financial corporations -773 SAM 19 Financial corporations 14241 SAM 19 General government -5276 SAM 19 External sector 11610 SAM 19 Total 21112 Capital transfers from: Households 611 SAM 14 Non-financial corporations 2 SAM 15 General government 270 SAM 14, 15 Total 883 Finance of gross accumulation 39597
Lending to: Households 167 SAM 19 Non-financial corporations 10100 SAM 19 Financial corporations 17041 SAM 19 General government -439 SAM 19 External sector 11610 SAM 19 Total 38479 Capital transfers to: Households 2200 SAM 14 less net errors and omissions 1082 SAM 19 Gross capital accumulation 39597
57
Table 30. Social Accounting Matrix, 1996-97, $million
1 2 3 4 5 6 7 Factors Households Non-financial Financial Government Foreigners Production of Current Corporations Corporations Current Current Activities Production Account Current Current Account Account Account Account
1 Production Activities 413943 0 269741 0 0 94759 100090
2 Factors of Production 466237 0 0 0 0 0 0
3 Households Current Account 0 347591 1069 10713 42289 65363 866
4 Non-financial Corporations Current Account 0 98349 2421 1715 5079 800 2675
5 Financial Corporations Current Account 0 9012 34906 16015 14938 5760 6867
6 Government Current Account 33408 10746 88615 27886 9660 7020 3302
7 Foreigners Current Account 57220 539 24560 14639 10045 5698 3463
8 Households Capital Account 0 0 46579 0 0 0 0
9 Non-financial Corporations Capital Account 0 0 0 40071 0 0 0
10 Financial
Corporations Capital Account 0 0 0 0 5487 0 0
11 Government
Capital Account 0 0 0 0 0 7843 0
12 Foreigners Capital Account 0 0 0 0 0 0 17602
13 Net Errors and Omissions -4 0 0 0 0 0 0
14 Total 970804 466237 467891 111039 87498 187243 134865
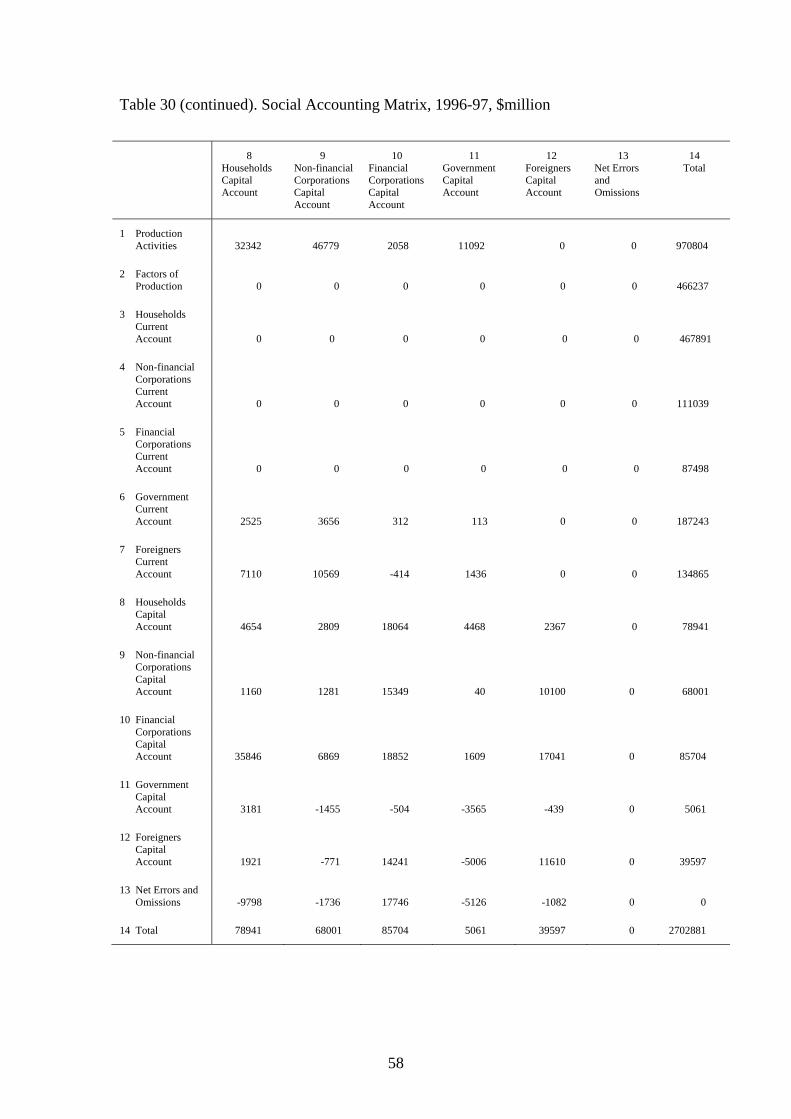
58
Table 30 (continued). Social Accounting Matrix, 1996-97, $million
8 9 10 11 12 13 14 Households Non-financial Financial Government Foreigners Net Errors Total Capital Corporations Corporations Capital Capital and Account Capital Capital Account Account Omissions Account Account
1 Production Activities 32342 46779 2058 11092 0 0 970804
2 Factors of Production 0 0 0 0 0 0 466237
3 Households Current Account 0 0 0 0 0 0 467891
4 Non-financial Corporations Current Account 0 0 0 0 0 0 111039
5 Financial Corporations Current Account 0 0 0 0 0 0 87498
6 Government Current Account 2525 3656 312 113 0 0 187243
7 Foreigners Current Account 7110 10569 -414 1436 0 0 134865
8 Households Capital Account 4654 2809 18064 4468 2367 0 78941
9 Non-financial Corporations Capital Account 1160 1281 15349 40 10100 0 68001
10 Financial
Corporations Capital Account 35846 6869 18852 1609 17041 0 85704
11 Government
Capital Account 3181 -1455 -504 -3565 -439 0 5061
12 Foreigners Capital Account 1921 -771 14241 -5006 11610 0 39597
13 Net Errors and Omissions -9798 -1736 17746 -5126 -1082 0 0
14 Total 78941 68001 85704 5061 39597 0 2702881