Embed Size (px)
Citation preview
1
2003-2004
Social Accounting Matrix for India1:
Method of Construction and Analysis V.P Ojha*, Barun Deb Pal*, Sanjib Pohit*, Joyashree Roy**
* The authors are respectively Senior Consultant, Research Analyst,
and Senior Fellow (Chief Economist) of National council of Applied Economic Research, New Delhi
** Professor of Economics and Co-ordinator Global Change Programme, Jadavpur University,
Kolkata
Abstract
This paper provides the latest SAM for Indian economy with wide variety of disaggregation for
Energy sector and sectors that are relevant for environmental and climate policy evaluation. Social
accounting matrix (SAM) for India 2003-04 shows the interaction between production, income,
consumption and capital accumulation. It can be used to provide an analysis of the interrelationship
between the production structure of an economy and the distribution of incomes and expenditures of
different household groups. It shows 9 household groups and can be used as basic data base for CGE
modeling of the Indian economy. This SAM consists of 36 sectors of the economy, 3 factors of
production and 9 categories of occupational households. Indian economy is becoming structurally
biased towards capital intensive sectors like service and energy production. Most energy intensive
sector is the energy production sector itself followed by transport and manufacturing as of 2003-2004.
Key words: SAM, India, Climate sensitive sectors, CGE model, Energy intensity, energy consumption by household category
1 The research is sponsored by Ministry of Environment and Forest, Government of India. But the conclusions and views presented here are those of the authors.
2
S o c i a l A c c o u n t i n g M a t r i x f o r I n d i a
1. Introduction
Social accounting matrix (SAM) is a tool within national income accounting framework that
provides a conceptual basis for examining both growth and distributional aspects within a single
analytical framework. It helps in presenting in a single matrix the interaction between production,
income, consumption and capital accumulation.
One fundamental law of economics is for every income there is corresponding outlay or
expenditure. A social accounting matrix, or SAM, is a simple and efficient way of representing this
fundamental law.
A social accounting matrix is defined as a single entry accounting system whereby each
macroeconomic account is represented by a column for outgoings (payments) and a row for incomings
(receipts) (Round, 1981a:). It is represented in the form of a square matrix with rows and columns,
which brings together data on production and income generation as generated by different institutional
groups and classes, on the one hand, and data about expenditure of these incomes by them on the
other. In a SAM, incomings are indicated as receipts for the row accounts in which they are located
and outgoings are indicated as expenditure for their column accounts. Since all incomings must be, in
a SAM, accounted for by total outgoings, the total of rows and columns must be equal for a given
account. Taylor (1983) sees the SAM as a tabular presentation of the accounting identities, stating that
incomings must be equal to outgoings for all sectors of the economy.
SAM is a data Base. The data sources for a SAM come from input-output tables, national
income statistics, and household income and expenditure statistics. Therefore, SAM is broader than
an input-output table and national accounts. It shows more details about all kinds of transactions within
an economy. An input-output table records economic transactions alone irrespective of the social
background of the end users. A SAM, on the contrary attempts to classify various institutions to their
socio-economic backgrounds instead of their economic or functional activities” (Chowdhury &
Kirkpatrick, 1994:58).
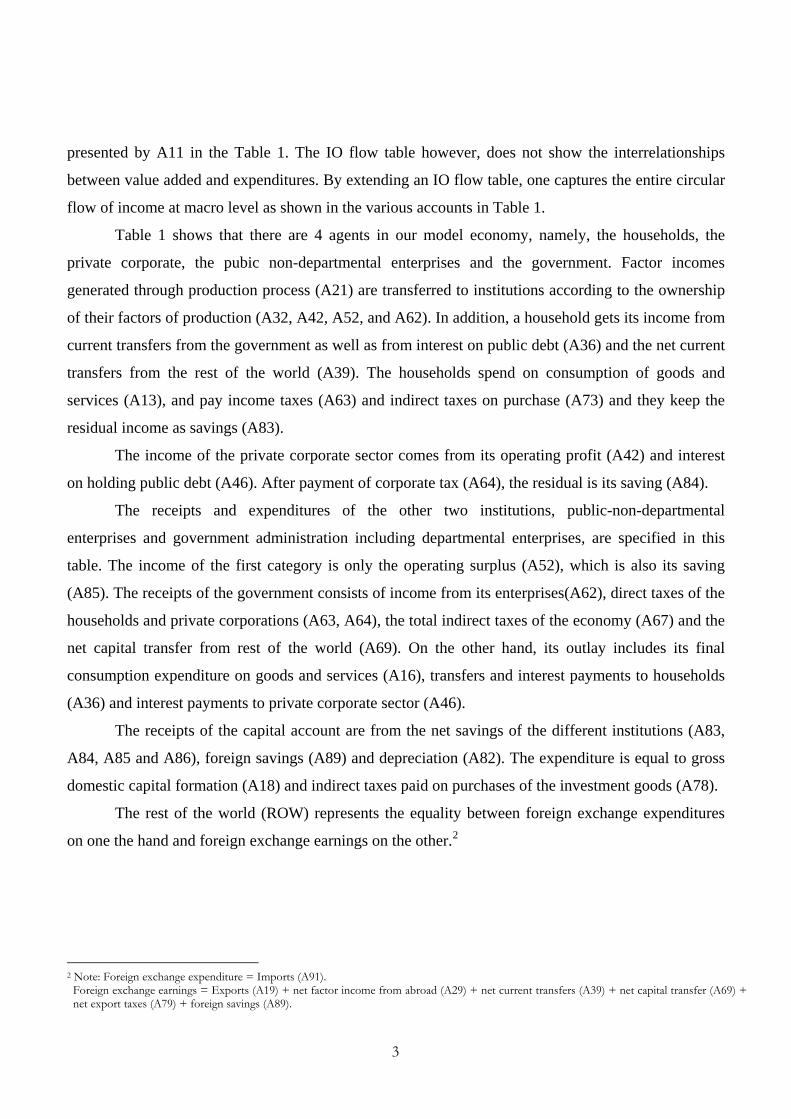
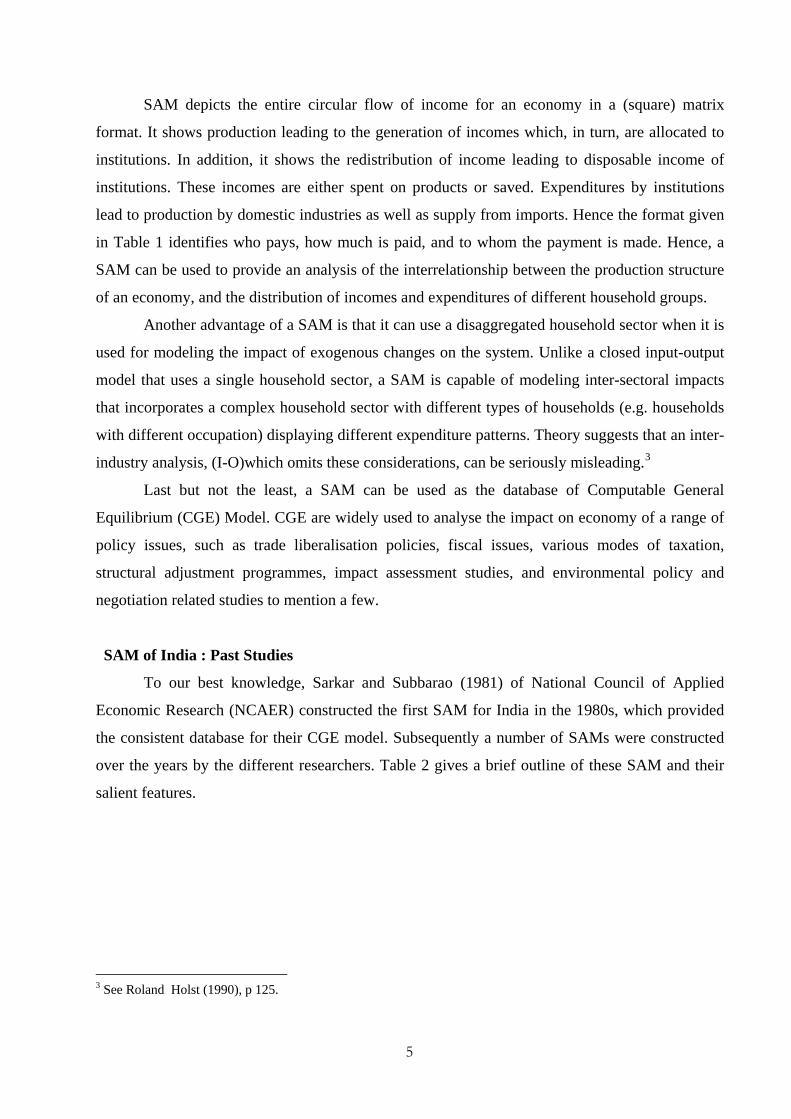
Various components of a hypothetical SAM is shown in schematic format in Table 1. The
receipts of the production account are from the intermediate demand and final demand consisting of
expenditures of households and government, investment and net exports (export minus imports). The
cost of production includes gross value added and indirect taxes. The inter-industry flows are
3
presented by A11 in the Table 1. The IO flow table however, does not show the interrelationships
between value added and expenditures. By extending an IO flow table, one captures the entire circular
flow of income at macro level as shown in the various accounts in Table 1.
Table 1 shows that there are 4 agents in our model economy, namely, the households, the
private corporate, the pubic non-departmental enterprises and the government. Factor incomes
generated through production process (A21) are transferred to institutions according to the ownership
of their factors of production (A32, A42, A52, and A62). In addition, a household gets its income from
current transfers from the government as well as from interest on public debt (A36) and the net current
transfers from the rest of the world (A39). The households spend on consumption of goods and
services (A13), and pay income taxes (A63) and indirect taxes on purchase (A73) and they keep the
residual income as savings (A83).
The income of the private corporate sector comes from its operating profit (A42) and interest
on holding public debt (A46). After payment of corporate tax (A64), the residual is its saving (A84).
The receipts and expenditures of the other two institutions, public-non-departmental
enterprises and government administration including departmental enterprises, are specified in this
table. The income of the first category is only the operating surplus (A52), which is also its saving
(A85). The receipts of the government consists of income from its enterprises(A62), direct taxes of the
households and private corporations (A63, A64), the total indirect taxes of the economy (A67) and the
net capital transfer from rest of the world (A69). On the other hand, its outlay includes its final
consumption expenditure on goods and services (A16), transfers and interest payments to households
(A36) and interest payments to private corporate sector (A46).
The receipts of the capital account are from the net savings of the different institutions (A83,
A84, A85 and A86), foreign savings (A89) and depreciation (A82). The expenditure is equal to gross
domestic capital formation (A18) and indirect taxes paid on purchases of the investment goods (A78).
The rest of the world (ROW) represents the equality between foreign exchange expenditures
on one the hand and foreign exchange earnings on the other.2
2 Note: Foreign exchange expenditure = Imports (A91). Foreign exchange earnings = Exports (A19) + net factor income from abroad (A29) + net current transfers (A39) + net capital transfer (A69) + net export taxes (A79) + foreign savings (A89).
4
Table 1: A schematic Social Accounting Matrix (SAM) for India.
Expenditures s Production
Account Factors of Production
Households
Private Corporate
Public Non-Departmental
Government Indirect Taxes
Capital Account
Rest Worl
on t
Input-Output Table A11
Private consumption
A13
Govt. Consumption
A16
Investment A18
Exp
of on
Value added (VA)
A21
NeInco
lds VA income A32
Govt. transfers, interest on debt
A36
NetTr
e te
Operating Profits A42
Interest on Debt A46
on-nta
Operating Surplus
A52
ent Income from Enterprises
A62
Income and Wealth taxes
A63
Corporate Taxes A64
Total indirect taxes A67
NeT
Taxes on intermediate
A71
Taxes on purchases
A73
Taxes on purchases
A76
Taxes on investment
goods A78
Tae
Depreciation A82
Households Savings
A83
Corporate Savings
A84
Public non-departmental
Savings A85
Government savings
A86
Forei
e Imports A91
5
SAM depicts the entire circular flow of income for an economy in a (square) matrix
format. It shows production leading to the generation of incomes which, in turn, are allocated to
institutions. In addition, it shows the redistribution of income leading to disposable income of
institutions. These incomes are either spent on products or saved. Expenditures by institutions
lead to production by domestic industries as well as supply from imports. Hence the format given
in Table 1 identifies who pays, how much is paid, and to whom the payment is made. Hence, a
SAM can be used to provide an analysis of the interrelationship between the production structure
of an economy, and the distribution of incomes and expenditures of different household groups.
Another advantage of a SAM is that it can use a disaggregated household sector when it is
used for modeling the impact of exogenous changes on the system. Unlike a closed input-output
model that uses a single household sector, a SAM is capable of modeling inter-sectoral impacts
that incorporates a complex household sector with different types of households (e.g. households
with different occupation) displaying different expenditure patterns. Theory suggests that an inter-
industry analysis, (I-O)which omits these considerations, can be seriously misleading.3
Last but not the least, a SAM can be used as the database of Computable General
Equilibrium (CGE) Model. CGE are widely used to analyse the impact on economy of a range of
policy issues, such as trade liberalisation policies, fiscal issues, various modes of taxation,
structural adjustment programmes, impact assessment studies, and environmental policy and
negotiation related studies to mention a few.
SAM of India : Past Studies
To our best knowledge, Sarkar and Subbarao (1981) of National Council of Applied
Economic Research (NCAER) constructed the first SAM for India in the 1980s, which provided
the consistent database for their CGE model. Subsequently a number of SAMs were constructed
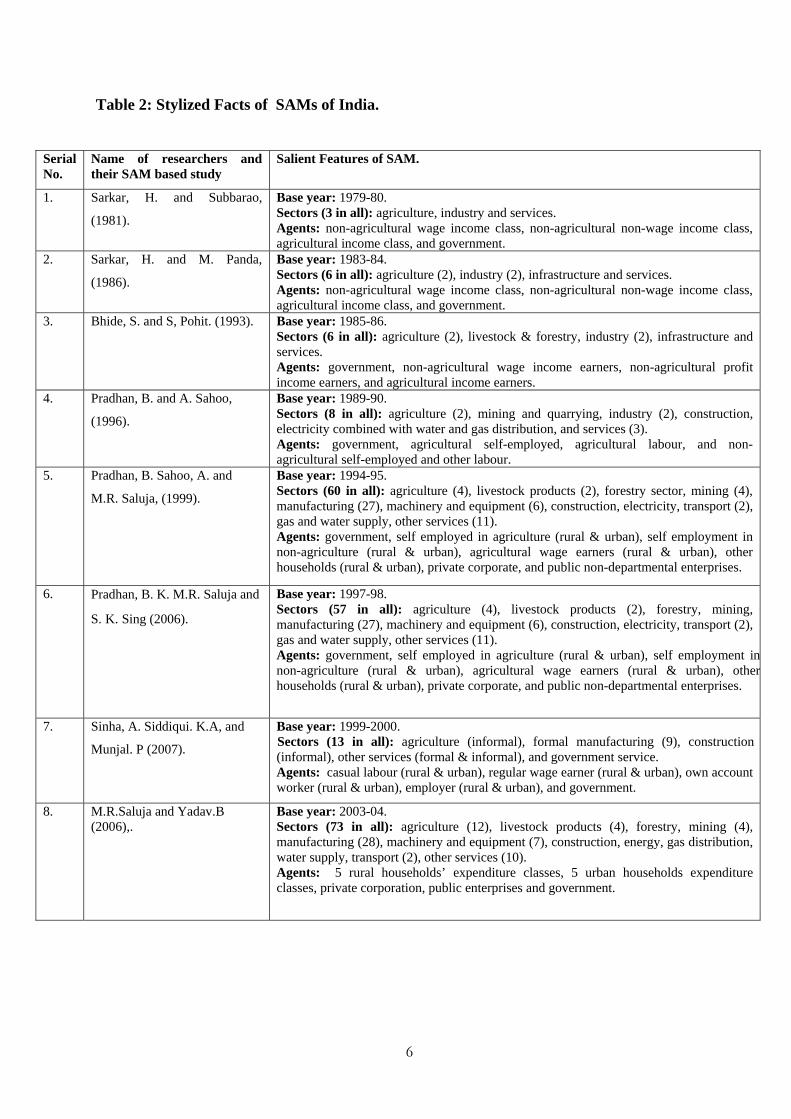
over the years by the different researchers. Table 2 gives a brief outline of these SAM and their
salient features.
3 See Roland Holst (1990), p 125.
6
Table 2: Stylized Facts of SAMs of India.
Serial No.
Name of researchers and their SAM based study
Salient Features of SAM.
1. Sarkar, H. and Subbarao,
(1981).
Base year: 1979-80. Sectors (3 in all): agriculture, industry and services. Agents: non-agricultural wage income class, non-agricultural non-wage income class, agricultural income class, and government.
2. Sarkar, H. and M. Panda,
(1986).
Base year: 1983-84. Sectors (6 in all): agriculture (2), industry (2), infrastructure and services. Agents: non-agricultural wage income class, non-agricultural non-wage income class, agricultural income class, and government.
3. Bhide, S. and S, Pohit. (1993). Base year: 1985-86. Sectors (6 in all): agriculture (2), livestock & forestry, industry (2), infrastructure and services. Agents: government, non-agricultural wage income earners, non-agricultural profit income earners, and agricultural income earners.
4. Pradhan, B. and A. Sahoo,
(1996).
Base year: 1989-90. Sectors (8 in all): agriculture (2), mining and quarrying, industry (2), construction, electricity combined with water and gas distribution, and services (3). Agents: government, agricultural self-employed, agricultural labour, and non-agricultural self-employed and other labour.
5. Pradhan, B. Sahoo, A. and
M.R. Saluja, (1999). Base year: 1994-95. Sectors (60 in all): agriculture (4), livestock products (2), forestry sector, mining (4), manufacturing (27), machinery and equipment (6), construction, electricity, transport (2), gas and water supply, other services (11). Agents: government, self employed in agriculture (rural & urban), self employment in non-agriculture (rural & urban), agricultural wage earners (rural & urban), other households (rural & urban), private corporate, and public non-departmental enterprises.
6. Pradhan, B. K. M.R. Saluja and
S. K. Sing (2006).
Base year: 1997-98. Sectors (57 in all): agriculture (4), livestock products (2), forestry, mining, manufacturing (27), machinery and equipment (6), construction, electricity, transport (2), gas and water supply, other services (11). Agents: government, self employed in agriculture (rural & urban), self employment innon-agriculture (rural & urban), agricultural wage earners (rural & urban), otherhouseholds (rural & urban), private corporate, and public non-departmental enterprises.
7. Sinha, A. Siddiqui. K.A, and
Munjal. P (2007). Base year: 1999-2000.
Sectors (13 in all): agriculture (informal), formal manufacturing (9), construction (informal), other services (formal & informal), and government service. Agents: casual labour (rural & urban), regular wage earner (rural & urban), own account worker (rural & urban), employer (rural & urban), and government.
8. M.R.Saluja and Yadav.B (2006),.
Base year: 2003-04. Sectors (73 in all): agriculture (12), livestock products (4), forestry, mining (4), manufacturing (28), machinery and equipment (7), construction, energy, gas distribution, water supply, transport (2), other services (10). Agents: 5 rural households’ expenditure classes, 5 urban households expenditure classes, private corporation, public enterprises and government.
7
It is clear from the Table 2 that the SAMs constructed before 1996 were highly aggregated
in nature and most of them have three households classes. Not only that, these SAMs are quite old
and their socio-economic classifications are based on data for the 1970.To some extent, SAM
constructed in the post 1996 period addressed these shortcomings.
A lacuna of the constructed SAMs of India is the aggregate treatment of energy sectors.
For example, in the SAM constructed by Pradhan and Saluja (2006), the electricity sector is
modeled as a single entity. Thus, the above SAMs do not reveal the cost structure of different
forms of electricity, viz. nuclear, hydro, non-hydro etc. According to Plan document, biomass
constitutes nearly 30 percent of primary energy supply in India.4 However, in the existing SAMs,
biomass is embedded in the agriculture, livestock, forestry, food and beverages industry and paper
industry sectors.
Motivation behind our interest in constructing a new SAM for Indiais to apply it in
environment related CGE model for India. Given the lacunae of the existing SAMs as mentioned
earlier, it is clear that the existing SAMs are not suitable for our purpose. In this context we plan
to construct a detailed SAM for India, which can be used as the consistent database for CGE
model explicitly showing environment and climate sensitive sectors. The same SAM may be used
by other researchers for constructing SAM based models for analysing policy related issues .
After looking at the data availability, our need, and time constraint, we have decided to construct
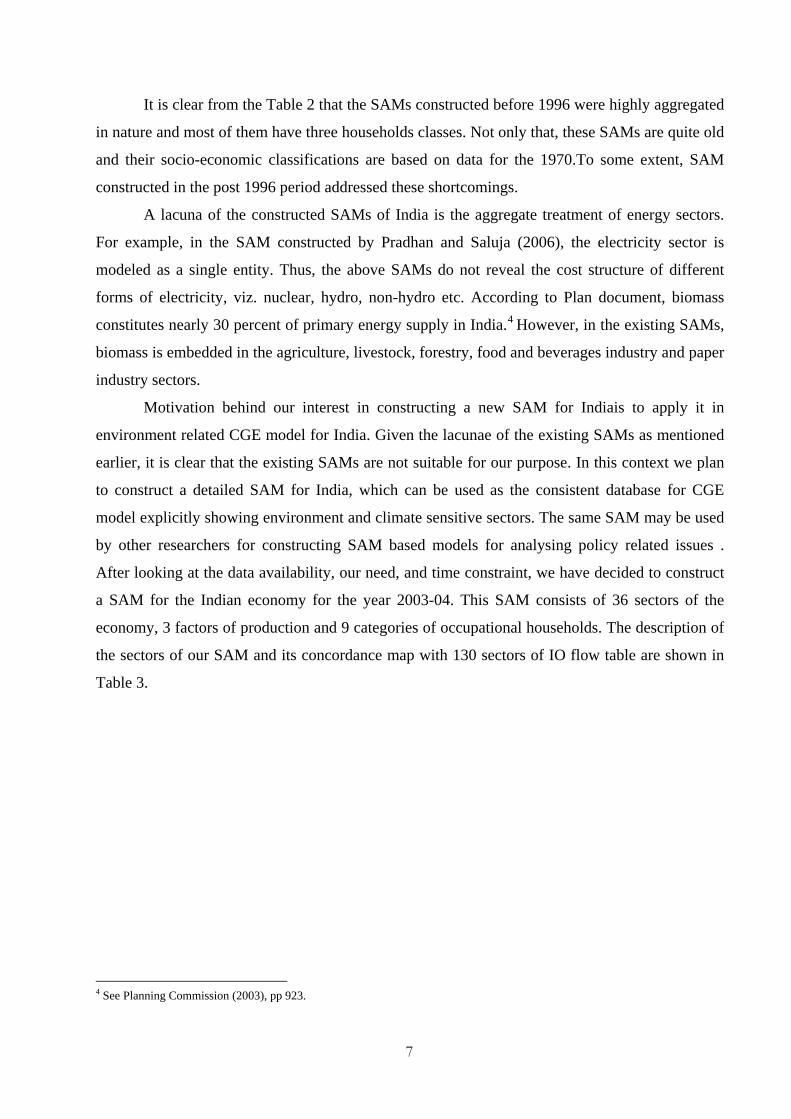
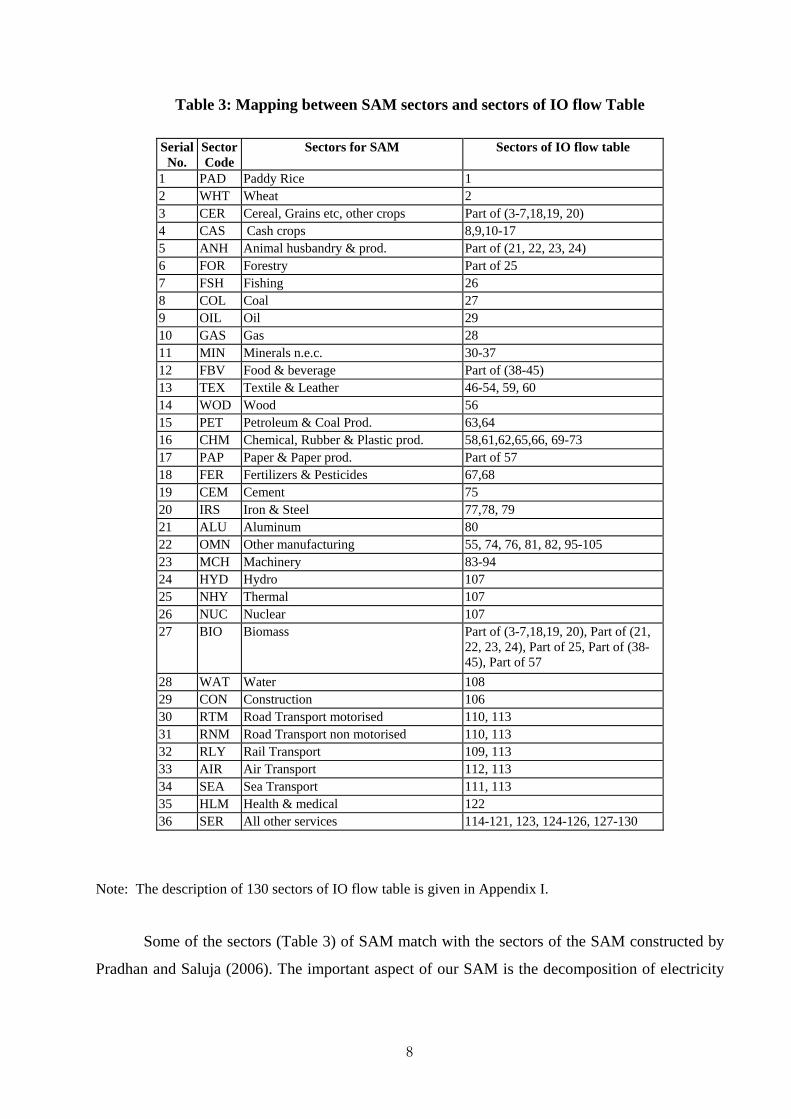
a SAM for the Indian economy for the year 2003-04. This SAM consists of 36 sectors of the
economy, 3 factors of production and 9 categories of occupational households. The description of
the sectors of our SAM and its concordance map with 130 sectors of IO flow table are shown in
Table 3.
4 See Planning Commission (2003), pp 923.
8
Table 3: Mapping between SAM sectors and sectors of IO flow Table
Serial No.
Sector Code
Sectors for SAM Sectors of IO flow table
1 PAD Paddy Rice 1 2 WHT Wheat 2 3 CER Cereal, Grains etc, other crops Part of (3-7,18,19, 20) 4 CAS Cash crops 8,9,10-17 5 ANH Animal husbandry & prod. Part of (21, 22, 23, 24) 6 FOR Forestry Part of 25 7 FSH Fishing 26 8 COL Coal 27 9 OIL Oil 29 10 GAS Gas 28 11 MIN Minerals n.e.c. 30-37 12 FBV Food & beverage Part of (38-45) 13 TEX Textile & Leather 46-54, 59, 60 14 WOD Wood 56 15 PET Petroleum & Coal Prod. 63,64 16 CHM Chemical, Rubber & Plastic prod. 58,61,62,65,66, 69-73 17 PAP Paper & Paper prod. Part of 57 18 FER Fertilizers & Pesticides 67,68 19 CEM Cement 75 20 IRS Iron & Steel 77,78, 79 21 ALU Aluminum 80 22 OMN Other manufacturing 55, 74, 76, 81, 82, 95-105 23 MCH Machinery 83-94 24 HYD Hydro 107 25 NHY Thermal 107 26 NUC Nuclear 107 27 BIO Biomass Part of (3-7,18,19, 20), Part of (21,
22, 23, 24), Part of 25, Part of (38-45), Part of 57
28 WAT Water 108 29 CON Construction 106 30 RTM Road Transport motorised 110, 113 31 RNM Road Transport non motorised 110, 113 32 RLY Rail Transport 109, 113 33 AIR Air Transport 112, 113 34 SEA Sea Transport 111, 113 35 HLM Health & medical 122 36 SER All other services 114-121, 123, 124-126, 127-130
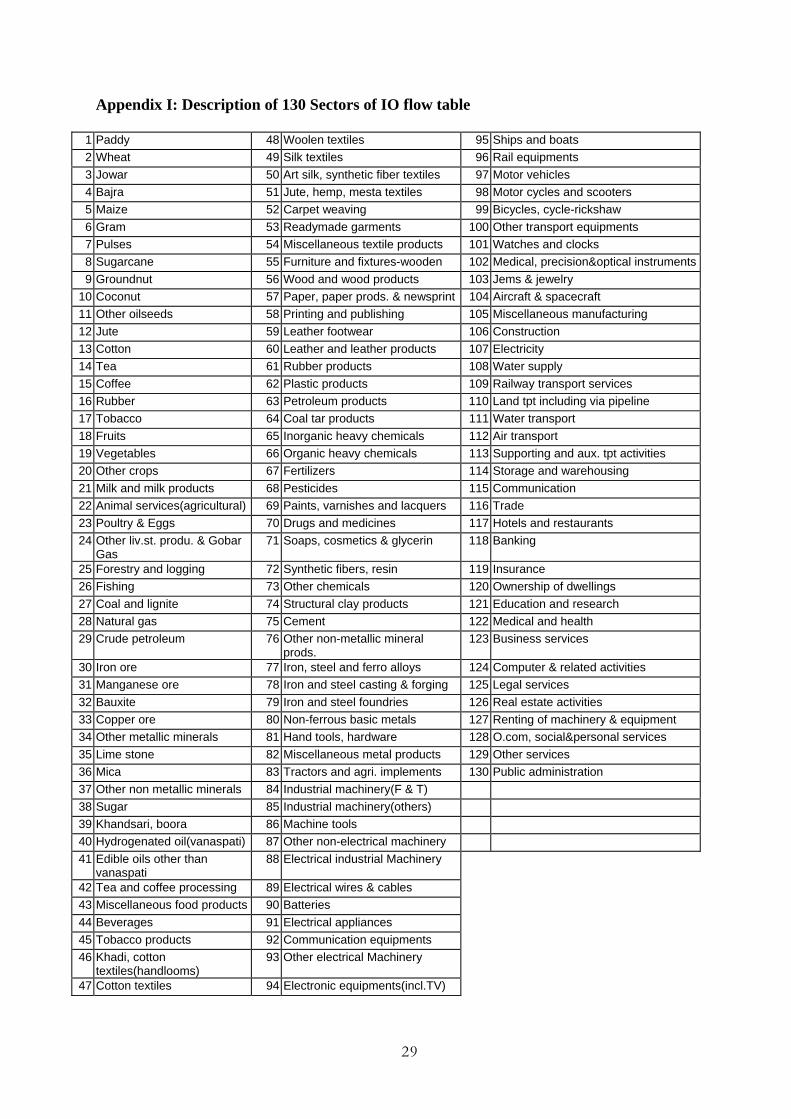
Note: The description of 130 sectors of IO flow table is given in Appendix I.
Some of the sectors (Table 3) of SAM match with the sectors of the SAM constructed by
Pradhan and Saluja (2006). The important aspect of our SAM is the decomposition of electricity
9
sector into three separate sectors viz. hydro, nuclear and non-hydro. The non-hydro energy sector
includes thermal, wind power, solar energy, etc. However, given India’s energy balance, thermal
is the main constituent of this group.5 Another salient feature of this SAM is the incorporation of
biomass as a separate sector. The biomass is an alternative source of commercial and domestic
fuel. The transport sector has been decomposed into 5 transport services sectors viz. road
transport motorised, road transport non-motorised, rail transport, water transport, and air
transport.
We have considered 4 economic agents in our proposed SAM viz. households, government,
public non-departmental enterprises, and private corporate. Moreover, the households sector is
decomposed into 9 occupational households group. This household’s classification is based on the
household’s classification given by National Sample Survey Organisation (NSSO).6 Thus, our
SAM consists of 12 economic agents. The description of these 12 economic agents is given in
Table 4.
Table 4: Description of Economic Agents Agent code Description
RH1 Rural non-agricultural self employed
RH2 Rural agricultural labour
RH3 Rural other labour
RH4 Rural agricultural self employed
RH5 Rural other households
UH1 Urban self employed
UH2 Urban salaried class
UH3 Urban casual labour
UH4 Urban other households
PVT Private corporate
PUB Public non-departmental enterprises
GOV Government
5 In future, we will plan to decompose it further
6 See NSSO (2000-01), Households Consumption Expenditure on Various Commodities, pp A-20.
10
Next section 2 describes the methodology of construction of SAM. The aggregation of IO
flow table is discussed in section 3. Section 4 deals with the extension of IO flow table and
finally, section 5 provides important analytical insights and concluding remarks.
2. Methodology of Construction of SAM
The core of a SAM is an input-output table. The Central Statistical Organisation (CSO)
has prepared 130 sectors commodity X commodity inter-industry flow matrix, make matrix and
absorption matrix for the year 2003-04. Since we have made an attempt to construct a SAM in a
commodity X commodity framework for the year 2003-04, we have used the inter-industry flow
(IO flow) matrix to serve our purpose.
But the concordance map (shown in Table 3) of our sectors with 130 sectors of IO flow
table indicates that sectors like biomass, hydro electricity, nuclear electricity, non-hydro
electricity, road transport mechanised, and road transport non-mechanised do not have a one to
one mapping with 130 sectors. To complete our exercise we need to construct rows and columns
for these sectors. The procedure is given below.
2.1. Expansion of electricity sector (hydro, non-hydro and nuclear)
The Hydro Electricity Corporation of India (HECI) and Nuclear Power Corporation of
India (NPCI) publish their annual accounts for every year. The informations from these have been
used to construct the columns of hydro and nuclear electricity sectors. Once we get the column of
hydro and nuclear electricity sectors, we subtract them from aggregate electricity sector to obtain
the column of non-hydro electricity sector. Thus we get the total output (i.e. column sum) of each
electricity sector and their corresponding share with aggregate electricity sector’s output. We
apply this share to the row of aggregate electricity sector to obtain the rows of these electricity
sectors separately.
2.2. Construction of Biomass sector
The biomass supplies originate in a) agricultural residuals b) animal husbandry residual c)
fire wood d) food & beverages industry residuals and e) paper & paper industry residuals.
According to CSO (1989), only the 5 percent of agricultural residuals are taken as biomass and
rests of the part are considered to be consumed by livestock sector.7
The use of biomass can be divided into two parts viz. non-commercial purpose and
commercial purpose. Non-commercial biomass is mainly used as cooking fuels, which comes
7 See CSO (1989), National Accounts Statistics India, p 45.
11
from agriculture, animal husbandry and forestry sectors. On the other hand, commercial biomass
use has two parts viz. commercial non-modern biomass use and modern biomass use. The
commercial non-modern biomass use considers the use of charcoal and commercial fuel wood
and these are available from forestry sector. The paper and sugar industry are the main
contributors of modern biomass. This modern biomass is used mainly for biofuels. Apart from
this the biomass can also be used for the production of chemicals, plastic, as well as reducing
agent for steel production (charcoal) and for construction purpose.
Now the data on residue from agriculture, animal husbandry and firewood are available
from National Accounts Statistics (NAS) of India. On the other hand the Annual Survey of
Industries (ASI) gives the data on commercial non-modern biomass use as well as modern
biomass use statistics for the year 2000-01. We use ASI data on biomass use to obtain total
biomass output originating from industries for the year 2000-01. Again, industrial biomass mainly
originate from paper and food and beverages industry. We use their ratio of output of the year
2000-01 to split up this industrial biomass according to their origin. To obtain the industrial
biomass output for the year 2003-04 we first estimate the share of paper and food and beverages
industries in biomass production and apply this to their total output of the year 2003-04. Thus we
get the total biomass output of the year 2003-04.
Once we have derived total output data on biomass, we need to estimate its row and
column. But, as there is no available data on input structure of biomass sector, it is very difficult
to make a column of this sector. In this case we have considered these 5 types of residual viz.
agricultural, animal husbandry, firewood, food and beverages industry and paper industry residue
as by products of their mother sectors and apply the input structure of their mother sector to these
by-products.8
To make a row of biomass sector, we first make separate rows for the agricultural, animal
husbandry , firewood, and industrial residue. As we mentioned earlier, the agricultural and animal
husbandry residuals are mainly used as cooking fuel. But in the agricultural production process,
these residuals are also used as organic fertiliser. So we distribute these residuals into the
agriculture related sectors on the basis of the rows of their mother sectors and the rest of the part
is treated as Private Final Consumption Expenditure (PFCE). Since the firewood is mainly used as
cocking fuel, we have treated the fire wood output as PFCE. As the industrial biomass use by
8 See Pradhan, Saluja and Sing (2006), p 141-143.

12
each industry statistics for the year 2000-01 is available from theAnnual Survey Industries (ASI),
we use this ratio to distribute the industrial biomass output of the year 2003-04.
The point to be noted is that these residuals are included under their corresponding mother
sectors described in IO flow table 2003-04. So after obtaining the columns and rows of these
residuals, we have subtracted them from the columns and rows of their corresponding mother
sectors to obtain the independent rows and columns of these residuals. At last, we add up these
columns and rows to get a column and row of biomass sector.
2.3. Expansion of transport service sector
The transport service comprises of transport activities and services incidental to transport.
The IO flow table 2003-04 includes 4 transport activities viz. lands transport, railway, water, and
air transport. On the other hand the lands transport sector has been broken up into two road
transport sectors in our SAM and they are viz. mechanised road transport and non-mechanised
road transport sectors. . So to complete the expansion of IO flow table we have to break up the
land transport activity of IO flow table 2003-04 into mechanised road transport and non-
mechanised road transport activities. The relevant data sources and the procedure followed by us
are given below.
The mechanised road transport includes buses, trucks, taxies, auto rikshaws and tramways.
The total material consumption of mechanised road transport is estimated separately for public
and private sectors. For the public sector undertakings, input structure is estimated by analysing
the annual reports of State Road Transport Corporations and Budget Documents of Centre, States
and Local bodies. As regards private sector, material consumption is estimated separately for
passenger and freight traffic. The input cost and item-wise details of the inputs are estimated
separately on the basis of norms obtained from the results of the latest Enterprise Survey (ES)
1993-94. The column of mechanised road transport activities thus obtained is subtracted from the
road transport activity’s column of IO flow table 2003-04 to obtain the column of non-
mechanised road transport activity.
Our next task is to construct the rows of these two road transport activities. To do this we
estimate the output share of each road transport activities in total land transport activity’s output.
Using this share to the land transport activity’s row of IO flow table 2003-04 we obtain the
different rows of mechanised and non-mechanised road transport activities.
The services incidental to transports described in IO flow table 2003-04 comprises of
packing, crating, operations of travel agencies etc. These services are associated with shipping,
air, railways and mechanised road transport. In our SAM there is no separate account of this
13
sector rather it has been merged with sea, air, railways and mechanised road transport sectors.
Therefore we have to break-up the row and column of this services incidental to transport sector
according to transport activities in which these services are associated. To do this we have applied
the share of output of each transport sector to the row and column of this services incidental to
transport sector. The rows and columns thus obtained are added to the row and column of sea, air,
railways and mechanised road transport sectors and hence we get the five transport sectors exactly
match with transport sectors described in our SAM.
3. Aggregation of IO flow table
After expanding the 130 sectors IO flow table 2003-04 we obtain a 134 sectors IO flow
table of India for the same year.9 According to our sectoral scheme we aggregate the 134-sector
IO flow table to obtain 36 sector IO flow table. The next step is to extend the accounts of 36
sector IO flow table into accounts for the 36 sectors SAM. This involves primarily decomposition
of gross value added into depreciation, wage and non-wage income, and of PFCE and personal
income into economic categories of households which is given in the following section.
4. Extension of IO flow table to SAM
This section deals with the methodology and the data sources for the decomposition of
gross value added into depreciation, wage and non-wage income. The PFCE and personal
incomes are divided into households according to their occupation. The other relevant accounts
for the SAM are also discussed in this section.
4.1. Decomposition of Gross value added into depreciation, Wage and Non-Wage Income
The decomposition of gross value added into wage (including imputed) and non-wage
income (capital income) has been done for 36 sectors of the economy for 2003-04. The sources of
data and methods used are given below by broad sectors of our SAM.
4.1.1. Agriculture and Allied Activities (Sectors 1 to 7 of SAM)
The aggregate Net Value Added (NVA) for agriculture, forestry and fishing sector is
available from NAS. We first calculate the net value added (NVA) separately for these sectors by
using the depreciation to Gross Value Added (GVA) ratio for the entire agricultural sector, as
available from the NAS. As we have considered 4 sectors under agriculture and an animal
husbandry sector as separate activity in our SAM, we divide the aggregate NVA of agricultural
9 To be specific, the added four new sectors are hydro electricity, nuclear electricity, road transport non-motorised and biomass.
14
sector into these five sectors on the basis of above-mentioned method. The NAS also gives the
breakdown of the NVA into compensation to employees (CE) and operating surplus/mixed
income. The Central Statistical Organisation (CSO) divides the mixed income under the
unorganised part of agriculture and animal husbandry sectors into the income of family labour
and operating surplus for 1980-81 to 1989-90. We use the proportion of 1989-90 to disaggregate
the mixed income of 2003-04 into the above two categories. The wage income due to family
labour, obtained this way, has been added to the actual wage income from the organised and
unorganised components to get the total income due to labour. After obtaining the total labour
income of the aggregate agriculture sector we distribute this labour income into 4 agriculture-
related sectors by using the proportion of NVA as obtained earlier. The remaining part of the net
domestic product is the operating surplus. We add depreciation with this operating surplus to
obtain the sector specific capital income.
On the other hand, due to non-availability of relevant data for forestry and fishing , the
mixed income of unorganised part is divided into wage income and operating surplus by using the
same ratio as in agriculture. Total value added in each of these sectors is divided into its
components by applying the same method as used for agriculture.
Since land is an important part of the capital in crop husbandry, non-wage income is
divided into income from land and other capital. This is done by using information from the
publication of Ministry of Agriculture.10
4.1.2 Mining and Quarrying (Sectors 8 to 11 of SAM)
In our SAM 2003-04 there are 4 sectors under mining. They are namely coal, crude
petroleum, natural gas and minerals n.e.c. The IO flow table 2003-04 gives the GVAs of these 4
sectors. Now we have to decompose these GVAs into depreciation, wage and non-wage income
with the help of data available from NAS. The NAS divides the GVA into NVA and depreciation
of the aggregate mining and quarrying sector and also gives the decomposition of NVA into wage
and non-wage income of the same sector. We first apply the ratio between GVA and depreciation
of the aggregate mining and quarrying sector to the independent GVA of Coal, crude petroleum
and minerals sectors to obtain the NVAs of these sectors. Next we decompose these NVAs into
wage and non-wage income by using the ratio of wage and non-wage income of the aggregate
mining and quarrying sector. The depreciation of each of these sectors is added with their non-
10See Ministry of Agriculture (2000), Cost of Cultivation of Principal Crops in India (CCS).
15
wage income to obtain the gross capital income of these sectors respectively. Now we have to
estimate the wage and non-wage income of the natural gas sector.
As the natural gas sector of the IO flow table 2003-04 is merged with gas distribution
sector, we have subtracted the GVA of gas distribution sector from the GVA of natural gas sector
of the IO flow table 2003-04. Once we have obtained the GVA of independent natural gas sector
we apply the same method as applied for the coal, crude petroleum and minerals sectors to obtain
the depreciation, wage and non-wage income of the independent natural gas sector. Now we have
to decompose the GVA of gas distribution sector into depreciation, wage and non-wage income.
The data on depreciation and NVA of the gas distribution sector is directly available from the
NAS. The NAS also divides the NVA into wage and non-wage income of the organised as well as
unorganised part of the combined electricity, gas and water supply sector. We have subtracted the
wage and non-wage income of the electricity and water supply sectors from the same of the
organised part of the combined sector to obtain the wage and non-wage income of the organised
gas distribution sector.11 The wage and non-wage income of unorganised part of the combined
sector is treated as wage and non-wage income of the gas distribution sector.12 The wage and non-
wage income thus obtained for the gas distribution sector is added with the same of independent
natural gas sector. Finally we add up the depreciation of independent natural gas and gas
distribution sectors with the non-wage income of the natural gas sector of IO flow table 2003-04
to obtain the gross capital income of the gas sector.
4.1.3. Manufacturing Industries (Sectors 12 to 23 of SAM)
The output of manufacturing industries comprises of the outputs of the registered and
unregistered sectors. The GVA at two-digit level of industrial classification for 2003-04 given in
NAS is divided into wage and non-wage income on the basis of ASI data for 2003-04. For
unregistered manufacturing, the NSSO gives estimate of GVA, emoluments, number of hired and
total workers for the year 2000-01.13 In case of self-employed workers, the imputed values based
on the data for hired workers are used. Using the proportion of different components of GVA for
2000-01 for the registered sectors to the 2003-04 GVA of the unregistered sector, we obtain the
components of GVA at the 2-digit level industrial classification for the year 2003-04. Adding 11 See the section 4.1.6 and 4.1.7, the method of estimation of wage and non-wage income of the electricity and water supply sectors.
12 Note: The unorganised part of the combined electricity, gas and water supply sector is mainly deals with gas distribution sector.
13 See NSSO (2001), Unorganised Manufacturing sector of India.
16
these values for registered and unregistered sector we obtain the components of the GVA for the
entire manufacturing sector at 2-digit level. Finally we use the ratios for each 2-digit level
industrial group for all the sectors under that group to obtain the wage and non-wage incomes for
different sectors under manufacturing. Since the sectors like cement, fertilisers, etc; have output
mainly from the organised sector, we have directly used the ASI ratios.
The sectors 12-23 are those which are giving special focus under Climate Change as well
as broaden environmental debate.
4.1. 4. Transport (Sectors 30 to 34 of SAM)
The estimates of wage and non-wage income for the organised part of the transport sector
are available from the NAS. Since the organised transport sector contains three-transport sector,
the NVA of these sectors are divided by the same ratio that is used for entire organised transport
sector. To divide the GVA into wage and non-wage income of the unorganised transport sector
we use the information available from Enterprise Survey of CSO 1993-94.
4.1.5 Other Services sector (Sectors 35 & 36 of SAM)
Besides these transport sectors there are another two services sector described in our
SAM, i.e. health and medical services and other services. Health is an important impact factor in
climate change and environmental literature. The net value added data on different service sectors
are available from NAS. We add up the wage and non-wage income of different services to obtain
the value added of these two sectors. We have treated mixed income as non-wage income of
service sectors.
4.1.6. Electricity (Sectors 24 to 26)
The electricity sector comprises of three different electricity sectors (i.e. hydro, non-hydro
and nuclear) in our SAM. The data on GVA and depreciation for the hydro and nuclear electricity
sectors are available respectively from the annual accounts of HECI and NPCI. On the other hand
the NVA and depreciation of aggregate electricity sector is available from NAS. As we have
NVA and depreciation of hydro and nuclear electricity sectors, we can easily estimate the NVA
and depreciation of the non-hydro electricity sector.14 Now we have to decompose the NVAs of
these electricity sectors into wage and non-wage income. The NAS gives the decomposition of
NVA for the aggregate electricity, gas and water supply sectors. Using this ratio of wage and non-
wage income we obtain the wage and non-wage income of these 3 electricity sectors. Next we add
14 Note: NVA (non-hydro) = NVA (electricity) – NVA (Hydro) – NVA (non-hydro), Depreciation (non-hydro) = Depreciation (electricity) – Depreciation (hydro) – Depreciation (non-hydro).
17
the depreciation with the non-wage income of these electricity sectors to obtain the total non-
wage income of these separate electricity sectors.
4.1.7. Water Supply (Sector 28 of SAM)
The decomposition of GVA into NVA and depreciation is given in NAS for water supply
sector. Now we have to decompose the NVA of water supply sector into wage and non-wage
income. In this case the NAS data does not provide the data on wage and non-wage income of the
water supply sector separately. Therefore, to decompose the NVA of water supply sector we have
used the ratio of wage and non-wage income of the combined electricity, gas and water supply
sector. The non-wage income of the water supply sector thus obtained is added with the
depreciation of this sector to obtain the gross non-wage income of this sector.
4.1. 8. Biomass (Sector 27 of SAM)
As discussed in section 2, we have estimated the GVAs of the sectors under biomass sector. Now
we have to divide the GVA into wage and non-wage income of the sectors under biomass. In this
case we first decompose the GVA of each sector under biomass (like agriculture residual, fire
wood, animal husbandry residual, food and beverages industry residual and paper industry
residual) and then we add up their wage and non-wage income to obtain the same for biomass
sector. To do this we have used the ratio of wage and non-wage income (inclusive of
depreciation) of their corresponding mother sectors like agriculture, forestry, animal husbandry,
food and beverages, and paper industry sectors.
4.1. 9. Construction (Sector 29 of SAM)
Mixed income, excluding the interest payments under unorganised sector is assumed as
wage income. For organised sector the wage and non-wage income are separately available from
NAS.
4.2. Distribution of sector-wise Consumption Expenditure by occupational categories of households
In the updated IO flow table we have obtained the sector (commodity) wise private final
consumption expenditure (PFCE) for the year 2003-04. Now we have to decompose these PFCEs
into the 9 households classes. The NSSO in its 61st round gives the distribution of per capita
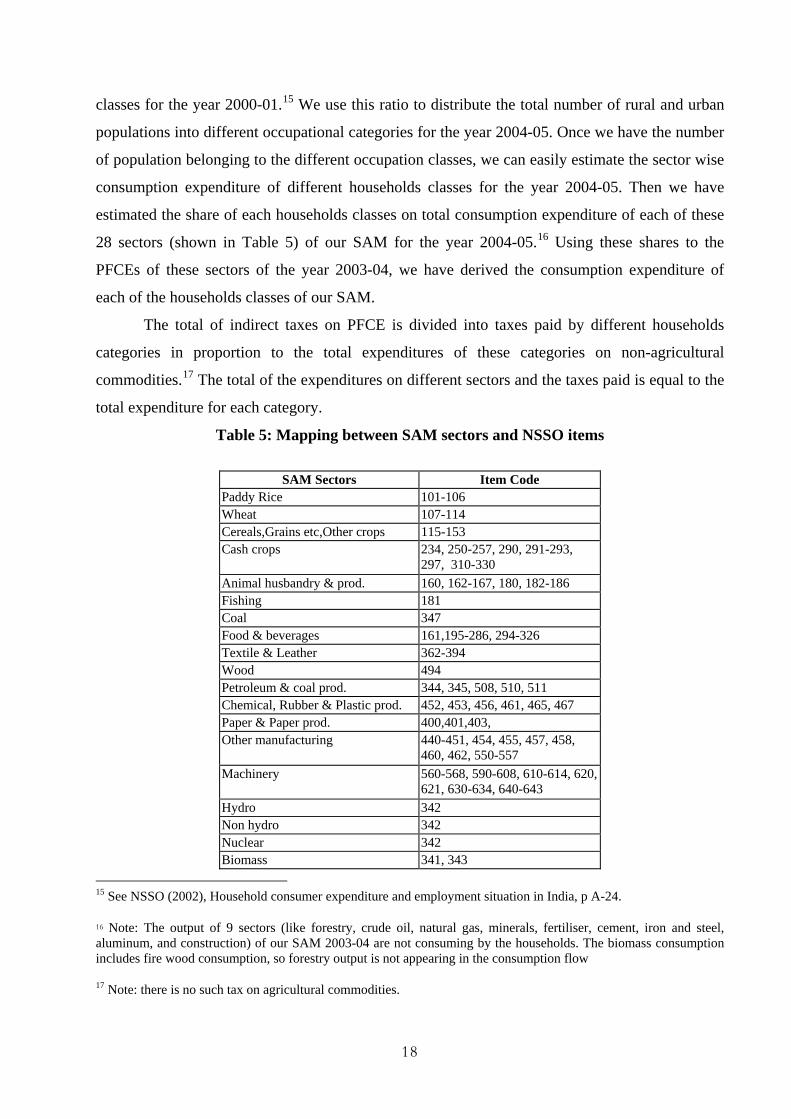
household expenditure for more detailed level of classification of commodities for 2004-05. A
map of concordance between our sectors and NSSO’s item is shown in Table 5. On the other hand
the NSSO also gives the distribution of rural population among the five rural occupational
households classes and the urban population among the four urban occupational households
18
classes for the year 2000-01.15 We use this ratio to distribute the total number of rural and urban
populations into different occupational categories for the year 2004-05. Once we have the number
of population belonging to the different occupation classes, we can easily estimate the sector wise
consumption expenditure of different households classes for the year 2004-05. Then we have
estimated the share of each households classes on total consumption expenditure of each of these
28 sectors (shown in Table 5) of our SAM for the year 2004-05.16 Using these shares to the
PFCEs of these sectors of the year 2003-04, we have derived the consumption expenditure of
each of the households classes of our SAM.
The total of indirect taxes on PFCE is divided into taxes paid by different households
categories in proportion to the total expenditures of these categories on non-agricultural
commodities.17 The total of the expenditures on different sectors and the taxes paid is equal to the
total expenditure for each category.
Table 5: Mapping between SAM sectors and NSSO items
SAM Sectors Item Code Paddy Rice 101-106 Wheat 107-114 Cereals,Grains etc,Other crops 115-153 Cash crops 234, 250-257, 290, 291-293,
297, 310-330 Animal husbandry & prod. 160, 162-167, 180, 182-186 Fishing 181 Coal 347 Food & beverages 161,195-286, 294-326 Textile & Leather 362-394 Wood 494 Petroleum & coal prod. 344, 345, 508, 510, 511 Chemical, Rubber & Plastic prod. 452, 453, 456, 461, 465, 467 Paper & Paper prod. 400,401,403, Other manufacturing 440-451, 454, 455, 457, 458,
460, 462, 550-557 Machinery 560-568, 590-608, 610-614, 620,
621, 630-634, 640-643 Hydro 342 Non hydro 342 Nuclear 342 Biomass 341, 343
15 See NSSO (2002), Household consumer expenditure and employment situation in India, p A-24.
16 Note: The output of 9 sectors (like forestry, crude oil, natural gas, minerals, fertiliser, cement, iron and steel, aluminum, and construction) of our SAM 2003-04 are not consuming by the households. The biomass consumption includes fire wood consumption, so forestry output is not appearing in the consumption flow
17 Note: there is no such tax on agricultural commodities.
19
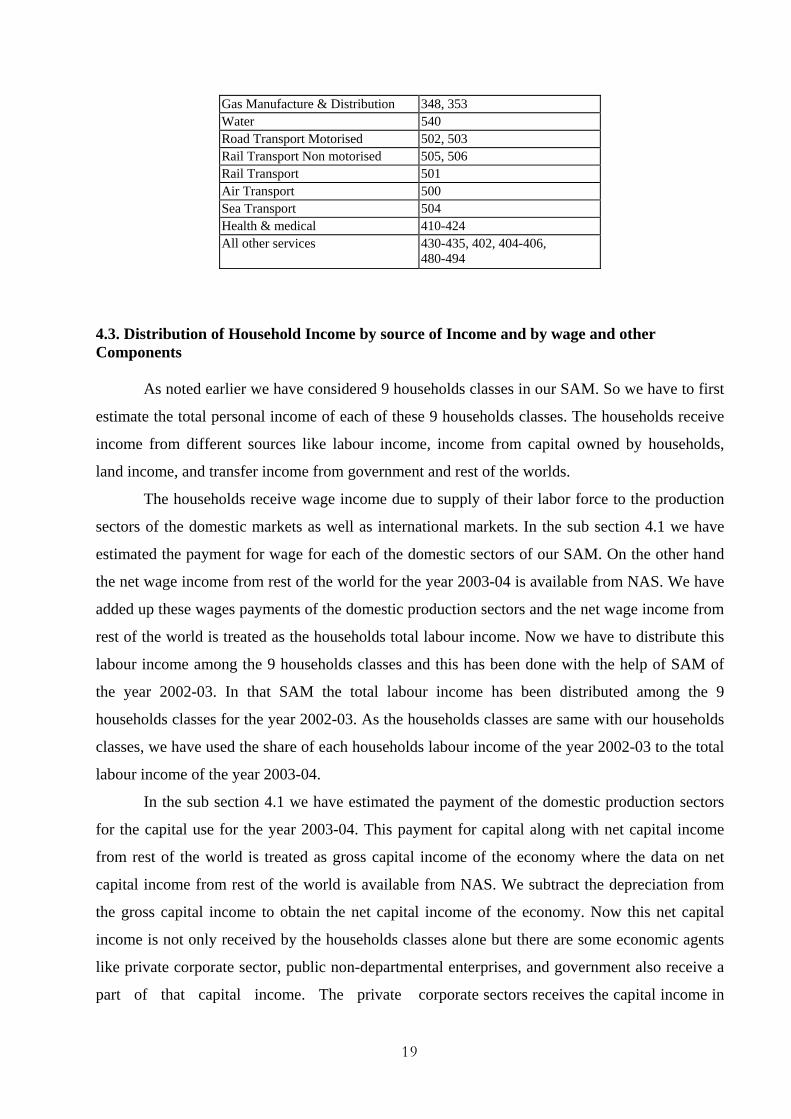
Gas Manufacture & Distribution 348, 353 Water 540 Road Transport Motorised 502, 503 Rail Transport Non motorised 505, 506 Rail Transport 501 Air Transport 500 Sea Transport 504 Health & medical 410-424 All other services 430-435, 402, 404-406,
480-494 4.3. Distribution of Household Income by source of Income and by wage and other Components
As noted earlier we have considered 9 households classes in our SAM. So we have to first
estimate the total personal income of each of these 9 households classes. The households receive
income from different sources like labour income, income from capital owned by households,
land income, and transfer income from government and rest of the worlds.
The households receive wage income due to supply of their labor force to the production
sectors of the domestic markets as well as international markets. In the sub section 4.1 we have
estimated the payment for wage for each of the domestic sectors of our SAM. On the other hand
the net wage income from rest of the world for the year 2003-04 is available from NAS. We have
added up these wages payments of the domestic production sectors and the net wage income from
rest of the world is treated as the households total labour income. Now we have to distribute this
labour income among the 9 households classes and this has been done with the help of SAM of
the year 2002-03. In that SAM the total labour income has been distributed among the 9
households classes for the year 2002-03. As the households classes are same with our households
classes, we have used the share of each households labour income of the year 2002-03 to the total
labour income of the year 2003-04.
In the sub section 4.1 we have estimated the payment of the domestic production sectors
for the capital use for the year 2003-04. This payment for capital along with net capital income
from rest of the world is treated as gross capital income of the economy where the data on net
capital income from rest of the world is available from NAS. We subtract the depreciation from
the gross capital income to obtain the net capital income of the economy. Now this net capital
income is not only received by the households classes alone but there are some economic agents
like private corporate sector, public non-departmental enterprises, and government also receive a
part of that capital income. The private corporate sectors receives the capital income in
20
the form of operating profits, the public non-departmental enterprises receives the same in the
form of operating surplus and the government receives capital income in the from of
entrepreneurship income. The data on operating surplus, operating profit and the income from
entrepreneurship are available from NAS for the year 2003-04. So the remaining part of the
capital income is capital income of the households. We have distributed this capital income
among the households classes by using the share of each households capital income as available
from SAM of the year 2002-03.
Next we have to estimate the land income received by the households classes. The point to
be noted here that, only the rural agricultural self- employed class households receive the income
from land. In this case we have taken the total payment for land factor (as obtained in the section
3.1) as the total land income of that class.
Other sources of households income are transfer income from government and the net
current transfer from the rest of the world. The NAS gives data on current transfer from
government and also the net current transfer from the rest of the world. Now the government
transfer includes direct government transfer to the households and the other is interest payment
for debt. A part of this interest payment of the government goes to the private corporate sectors
due to their holding of public shares, bonds etc. With the help of SAM 2002-03 we have
estimated the interest income received by the private corporate sector. Now the remaining part of
the government transfer is distributed among the households classes by using the ration given in
SAM 2002-03.
Thus we have obtained the households personal income from different sources i.e. row
total of each households classes in our SAM. The households personal income obtained in the
above way did not match with the column total of each of the households classes of our SAM. A
pro-rata adjustment has been made to obtain the control total i.e. row total of each households
classes in our SAM.
4.4. Construction of Tax Account (Direct and Indirect taxes)
Though indirect taxes are part of the government activities, we have made it a separate
account in order to simplify the presentation of the detailed structure of taxes. The indirect taxes
reported in the SAM are net of subsidies (net indirect taxes). The net indirect taxes on household
consumption and government consumption are inclusive of sale taxes and excise for domestic
production, and taxes on imported commodities (custom) used for consumption. The
21
decomposition of net indirect taxes across production sectors is done with the help of the IO flow
table.
Total direct taxes as obtained from the NAS are distributed among different categories of
households in the following manner. Land revenue is paid by self employed agricultural
households. The other direct taxes are distributed among different categories of households in
proportion to their personal income, assuming no direct tax to be paid by agricultural and non-
agricultural labour households and self employed rural agricultural households.
4.5. Construction of Capital Account
This account represents the macro balancing of savings and investments. Net savings
include those by the households, the private corporate sector, the public non-departmental
enterprises, the government and the rest of the world. Net saving along with the depreciation
equals gross domestic capital formation. In the case of households the savings of different
categories are derived by subtracting their consumption and direct taxes from their total personal
income.
Retained earnings of the private corporate sector and the non-departmental public
enterprises are treated as their savings. The difference between the revenue and current
expenditure of the government is its saving. Foreign savings meet the difference between gross
domestic capital formation and gross domestic saving.
4.6 Treatment of Foreign Trade
The record of foreign trade is given under the row and column head of Rest Of the World
(ROW) in our SAM. According to the Table 1, the column of ROW describes the exports of
goods and services, net factor income from abroad, net capital transfer to the government, other
current transfer to the households and private corporate and foreign savings. The data on exports
are directly available from IO flow table 2003-04 and the data other than exports are available
from NAS and the published statistics of Reserve Bank of India (RBI).18 We put these data under
the column of ROW in such a manner that the column total of ROW must be equal to the total
imports. In the IO FLOW table 2003-04 the imports are recorded in the column of imports with
negative entries. But in our SAM we put this data under the row head of ROW with positive
entry.
18 See Reserve Bank of India (2006), Hand Book of Statistics on Indian Economy.
22
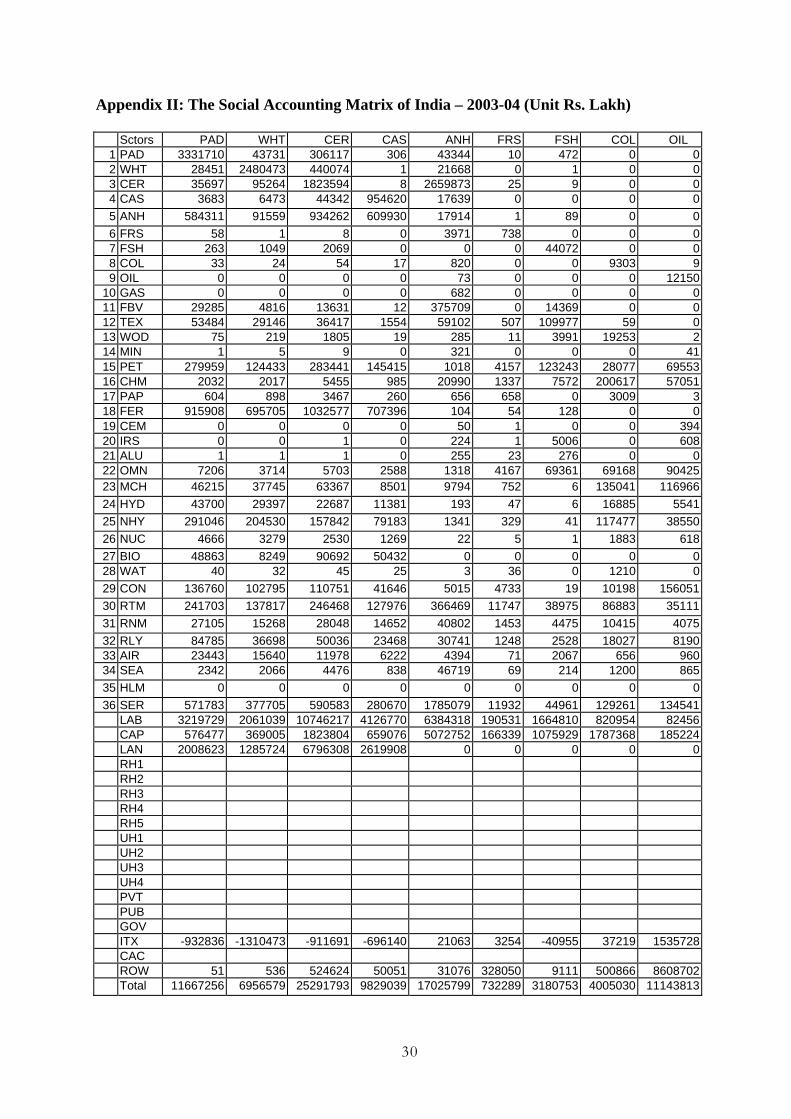
2003-04 SAM for India: An Analysis
2003-04 SAM for India, consists of 36 producing sectors, 3 factors of production, and 4
economic institutions including household sector, which are classified into 9 broad categories
according to their occupation. The IO flow table for 2003-04 has been, first expanded to match
with sectors of our SAM and then we extend the various accounts (viz. GVA, PFCE, personal
income, etc) of IO flow table to make these as accounts of a SAM. This SAM is given in
Appendix III.
The commodity X commodity part of this matrix gives the inter industry flow of
intermediate inputs. The rows for Labour, Capital and Land give the primary input into each
sector. Only the agricultural sectors are using these three as primary inputs, and the rest of the
sectors are using only labour and capital as primary inputs in their production process.
Interestingly, the net factor income from abroad (under column head ROW and rows Labour and
Capital) are seen to be substantially negative. This shows that there is a net repatriation.
The factors of production receive their factor payments, which in turn go to the different
household categories as their income. The values can be read from the rows for rural and urban
households and the columns under Labour, Capital and Land. The households also receive
transfer payments from the government and from rest of the world.
The private and public enterprises earn gross profits on account of capital and the private
firms also receive net transfers from the government. The row under Capital A/C gives the
savings. These are calculated as residuals and hence are balancing entries. The government is seen
to be a net dissaver.
The imports of various commodities are given by the entries in the row for the Rest of the
World (“ROW”). Under the column ROW, we have exports of the commodities, net factor
income from abroad, transfers to the rural and urban households, net indirect taxes and foreign
savings.
Indian Economic Structure: Preliminary Analysis
As of 2003-2004 Indian Economy is emerging in a service sector led growth path. Service
sector has the highest contribution to the GDP with 47% share compared to manufacturing
sector’s contribution at 20%, agriculture at 20% followed by transport at 7%, Energy at 5% and
Forestry with 0.14%.
23
Table 6.1 Sectoral Share of GDP in total GDP of the year 2003-04 (Unit: Rs.billion).
Agri Fors Energy Manu Transport Service Total GDP at factor costs
50491 357 13134 51993 18511 12046 254942
Sector wise
Share
19.8% 0.14% 5% 20.4% 7.3% 47.5% 100%
Source: Authors’ estimate
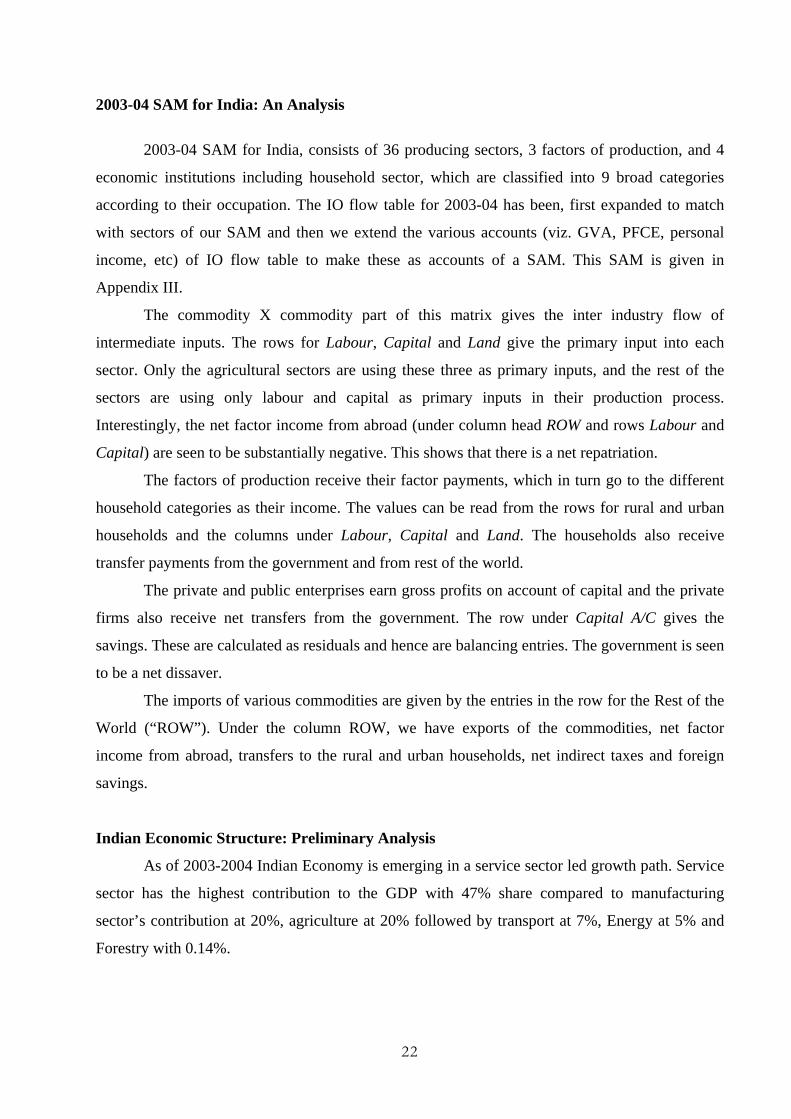
The activity composition defines the development pathway and has important implication for
energy consumption and hence emission. Indian economic structure with service sector bias
positions the economy in an advantageous position in the current climate change debate. Because
of relatively low energy intensity of service sector (Chart 6.1) from production side or supply side
Indian economy enjoys the benefit of relatively low energy intensity. Over all energy intensity19
of Indian economy is 0.84.
Figure 6.1: Labour Capital & Energy Intensity
19 Rupee worth of Energy use for rupee worth of GDP (at factor cost) production.
Labour Capital & Energy Intensity
0.00
0.05
0.10
0.15
0.200.25
0.30
0.35
0.40
0.45
Agri
Fors
Ener
gy
Man
u
Tran
spor
t
Serv
ice
Sectors
Inte
nsity Lab intensity
Cap intensityEnergy Intensity
24
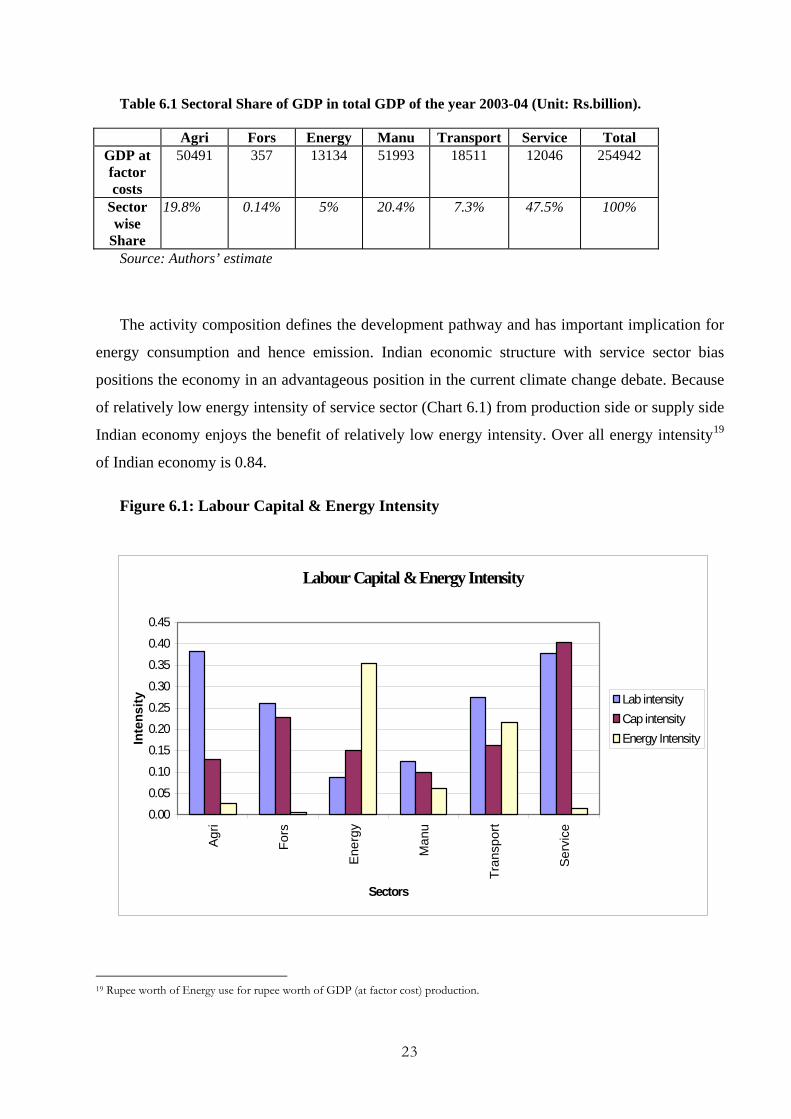
Diagram 6.2. Rural Households Consumption Expenditure.
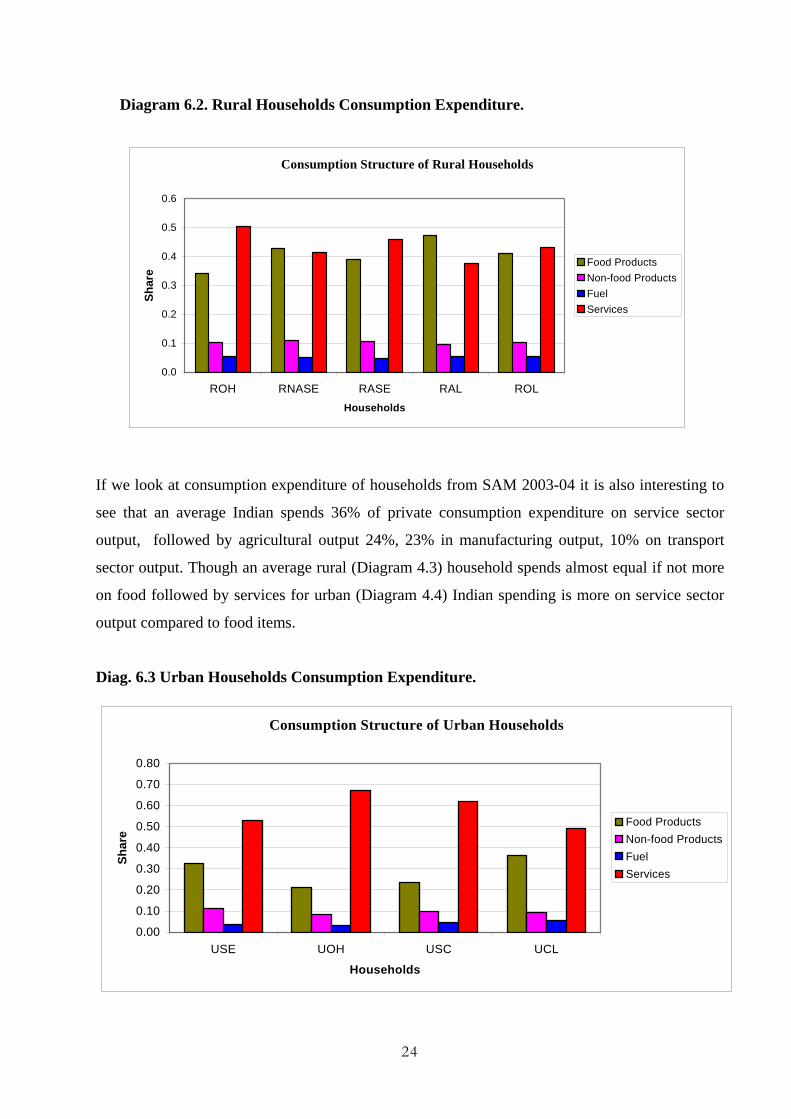
If we look at consumption expenditure of households from SAM 2003-04 it is also interesting to
see that an average Indian spends 36% of private consumption expenditure on service sector
output, followed by agricultural output 24%, 23% in manufacturing output, 10% on transport
sector output. Though an average rural (Diagram 4.3) household spends almost equal if not more
on food followed by services for urban (Diagram 4.4) Indian spending is more on service sector
output compared to food items.
Diag. 6.3 Urban Households Consumption Expenditure.
Consumption Structure of Rural Households
0.0
0.1
0.2
0.3
0.4
0.5
0.6
ROH RNASE RASE RAL ROLHouseholds
Shar
e
Food ProductsNon-food ProductsFuel Services
Consumption Structure of Urban Households
0.00
0.10
0.20
0.30
0.40
0.50
0.60
0.70
0.80
USE UOH USC UCL
Households
Shar
e
Food ProductsNon-food ProductsFuel Services
25
This indicates that lifestyle of average Indian is also less energy intensive. One clear
indication is that Indian economic structure both from production and consumption side as of
2003-04 is on low energy low emission pathway. This does not rule out existence of potential of
efficiency enhancement and hence further reduction of emissions but all these need further
analysis.
5. Conclusion
In this paper, we have focused on motivation and method of construction of 2003-04 SAM
and some observations on the economic structure for India based on preliminary analysis. The
SAM highlights the income distribution across the occupational classes, which makes it important
tool over and above I-O table. We could observe how consumption structure is varying across
various social groups. SAM itself is not a model. Once the closure rule is specified, SAM
becomes a model. With the help of multiplier analysis, one can compute income and employment
effects at the sectoral level of various policy shocks.
Although the 2003-04 SAM is significant extension of the multi-sectoral framework
for Indian Economy, it still falls short in representing elements such as pollutants, environmental
quality, natural resources, and most of their interactions with economic activities in the real
world. Neither the impact of economic activities on the environment nor the constraints of the
environmental quality on production and welfare have been reflected directly in a SAM
framework.
26
References Airport Authority of India (2003-04): Annual Report.
http://civilaviation.nic.in/moca/acts_rules/AAI/aai-ind.htm.
Bhide, S. and S, Pohit. (1993): Forecasting and policy analysis through a CGE model for India,
Margin, NCAER, New Delhi, Vol.25, No-3, P 271-285.
Central Statistical Organisation (1989): National Accounts Statistics of India: Sources and
Methods, Government of India.
Central Statistical Organisation (1994): National Accounts Statistics: Factor Incomes 1980-81-
1989-90, Government of India.
Central Statistical Organisation (2006): National Account Statistics, Government of India.
Central Statistical Organisation (2008): Input Output Transaction table (2003-04), Government of
India
Central Statistical Organisation (2000 & 2004): Annual Survey of Industries, Factory Sectors,
Government of India.
Central Statisrical Organisation, (2003-04), Annual survey of Industries, Government of India.
Central Statistical Organisation (1994): Enterprise Survey 1993-94, Hotel Restaurants and
Transport Sectors, Government of India.
Central Statisrical Organisation, (1993-94), Enterprise Survey: A Report on Transport sectors of
India, Government of India.
Chowdhury, A & Kirkpatrick, C.(1994), Development Policy and Planning: An Introduction to
Models and Techniques, London and New York:Routledge.
De Janvry, A and K Subbarao (1986): Agricultural Price Policy and Income Distribution in India,
Oxford University Press, New Delhi.
Devrajan, S, J D Lewis and S Robinson (1991): From Stylised to Applied Models: Building Multi-
Sector CGE Models for Policy Analysis, Working Paper no 616, Department of Agriculture and
Natural Resources, University of California, Berkeley.
Dredging Corporation of India Ltd. (2003-04): Annual reports.
www.researchandmarkets.com/reports/370561/dredging_corporation_of_india_ltd_2006.pdf.
Directorate General of Civil Aviation (2003-04): Annual Reports.
http://dgca.nic.in/reports/stat-ind.htm.
Fritz Breuss, K Steininger (1998): Biomass Energy Use to reduce Climate Change: A general
Equilibrium Analysis for Austria, Journal of Policy Modeling.
Gas Authority of India Ltd.(2003-04): Annual Reports.
27
http://www.gailonline.com/homepage/homenew.htm
Hydro Electricity Corporation of India (2003-04): Annual Report. http://www.nhpcindia.com/
Inland Water Transport Corporation (Calcutta and Kerala): Annual Income and Expenditure
Accounts (2003-04).
Ministry of Agriculture (2000): Cost of Cultivation of Principal Crops in India, Government of
India.
National Sample Survey Organisation (NSSO) (2000-01): Household Consumption Expenditure
and Employment, Government of India.
Nuclear Power Corporation of India (2003-04): Annual Financial Statements. www.npcil.nic.in.
Pradhan, Basanta K, Sahoo, Amarendra and Saluja, M.R (1999): A Social Accounting matrix for
India 1994-95, Economics and Political weekly, 34 (48).
Pradhan, Basanta K, and Roy, P.K. (2003): The well Being of Indian Households: MIMAP – India
Survey Report, Tata McGraw Hill, New Delhi.
Prdhan, Basanta K, M.R Saluja and Sing, S.K. (2006): A Social Accounting Matrix for India,
Concepts, construction and Applications, Sage Publication, New Delhi.
Pradhan, Basanta K and Sahoo, Amarendra (1996): Social Accounting Matrix and its Multipliers
for India, Margin, NCAER, New Delhi, Jan-May, 28, and no.2.
Planning Commission of India (2003): Annual Five-Year Plan 2002-07, Government of India,
Vol. I & Vol. II.
Roy Joyashree (2000): Energy Indicator Analysis for India, Research project sponsored by
OECD/IEA, Paris.
Roland-Holst, David (1990): Inter-industry Analysis with Social Accounting Methods, Economic
Systems Research, Vol. II, Issue II.
Round, J. I.(1981a), Income Distribution within A Social Accounting Matrix: A Review of Some
Experience in Malaysia and Other L.D.C.’s, Development Economics Research Centre-
University of Warwick, Discussion Paper No: 3, March 1981.
Sarkar, H. and Subbarao,(1981), A short term Macro-forecasting Model for India: Structure and
Uses, Indian Economic Review, 16 (1-2).
Sarkar, H and Panda, M (1986): Quantity-Price Money Interaction in a CGE Model, Margin,
NCAER, New Delhi, Vol. 18, No.3, pp 31-47.
Saluja, M.R, Yadav, B (2006): The Social Accounting Matrix of India, Planning Commssion,
Government of India.
28
Subramanian (1993): Agricultural Trade Liberalisation and India, Development Center Studies,
OECD, Paris.
System of National Accounts (1993): Commission of the European Communities, IMF, OECD,
UN, and World Bank.
Sinha, A. Siddiqui, K.A, and Munjal, P (2007). A SAM Framework for the Indian Informal
Economy, Oxford University Press.
State Transport Corporation of India (2003-04): Annual Report
Taylor, L.(1983), Structuralist Macroeconomics: Applicable Models for the Third World, New
York:Basic Books Inc.
29
Appendix I: Description of 130 Sectors of IO flow table
1 Paddy 48 Woolen textiles 95 Ships and boats 2 Wheat 49 Silk textiles 96 Rail equipments 3 Jowar 50 Art silk, synthetic fiber textiles 97 Motor vehicles 4 Bajra 51 Jute, hemp, mesta textiles 98 Motor cycles and scooters 5 Maize 52 Carpet weaving 99 Bicycles, cycle-rickshaw 6 Gram 53 Readymade garments 100 Other transport equipments 7 Pulses 54 Miscellaneous textile products 101 Watches and clocks 8 Sugarcane 55 Furniture and fixtures-wooden 102 Medical, precision&optical instruments9 Groundnut 56 Wood and wood products 103 Jems & jewelry
10 Coconut 57 Paper, paper prods. & newsprint 104 Aircraft & spacecraft 11 Other oilseeds 58 Printing and publishing 105 Miscellaneous manufacturing 12 Jute 59 Leather footwear 106 Construction 13 Cotton 60 Leather and leather products 107 Electricity 14 Tea 61 Rubber products 108 Water supply 15 Coffee 62 Plastic products 109 Railway transport services 16 Rubber 63 Petroleum products 110 Land tpt including via pipeline 17 Tobacco 64 Coal tar products 111 Water transport 18 Fruits 65 Inorganic heavy chemicals 112 Air transport 19 Vegetables 66 Organic heavy chemicals 113 Supporting and aux. tpt activities 20 Other crops 67 Fertilizers 114 Storage and warehousing 21 Milk and milk products 68 Pesticides 115 Communication 22 Animal services(agricultural) 69 Paints, varnishes and lacquers 116 Trade 23 Poultry & Eggs 70 Drugs and medicines 117 Hotels and restaurants 24 Other liv.st. produ. & Gobar
Gas 71 Soaps, cosmetics & glycerin 118 Banking
25 Forestry and logging 72 Synthetic fibers, resin 119 Insurance 26 Fishing 73 Other chemicals 120 Ownership of dwellings 27 Coal and lignite 74 Structural clay products 121 Education and research 28 Natural gas 75 Cement 122 Medical and health 29 Crude petroleum 76 Other non-metallic mineral
prods. 123 Business services
30 Iron ore 77 Iron, steel and ferro alloys 124 Computer & related activities 31 Manganese ore 78 Iron and steel casting & forging 125 Legal services 32 Bauxite 79 Iron and steel foundries 126 Real estate activities 33 Copper ore 80 Non-ferrous basic metals 127 Renting of machinery & equipment 34 Other metallic minerals 81 Hand tools, hardware 128 O.com, social&personal services 35 Lime stone 82 Miscellaneous metal products 129 Other services 36 Mica 83 Tractors and agri. implements 130 Public administration 37 Other non metallic minerals 84 Industrial machinery(F & T) 38 Sugar 85 Industrial machinery(others) 39 Khandsari, boora 86 Machine tools 40 Hydrogenated oil(vanaspati) 87 Other non-electrical machinery 41 Edible oils other than
vanaspati 88 Electrical industrial Machinery
42 Tea and coffee processing 89 Electrical wires & cables 43 Miscellaneous food products 90 Batteries 44 Beverages 91 Electrical appliances 45 Tobacco products 92 Communication equipments 46 Khadi, cotton
textiles(handlooms) 93 Other electrical Machinery
47 Cotton textiles 94 Electronic equipments(incl.TV)
30
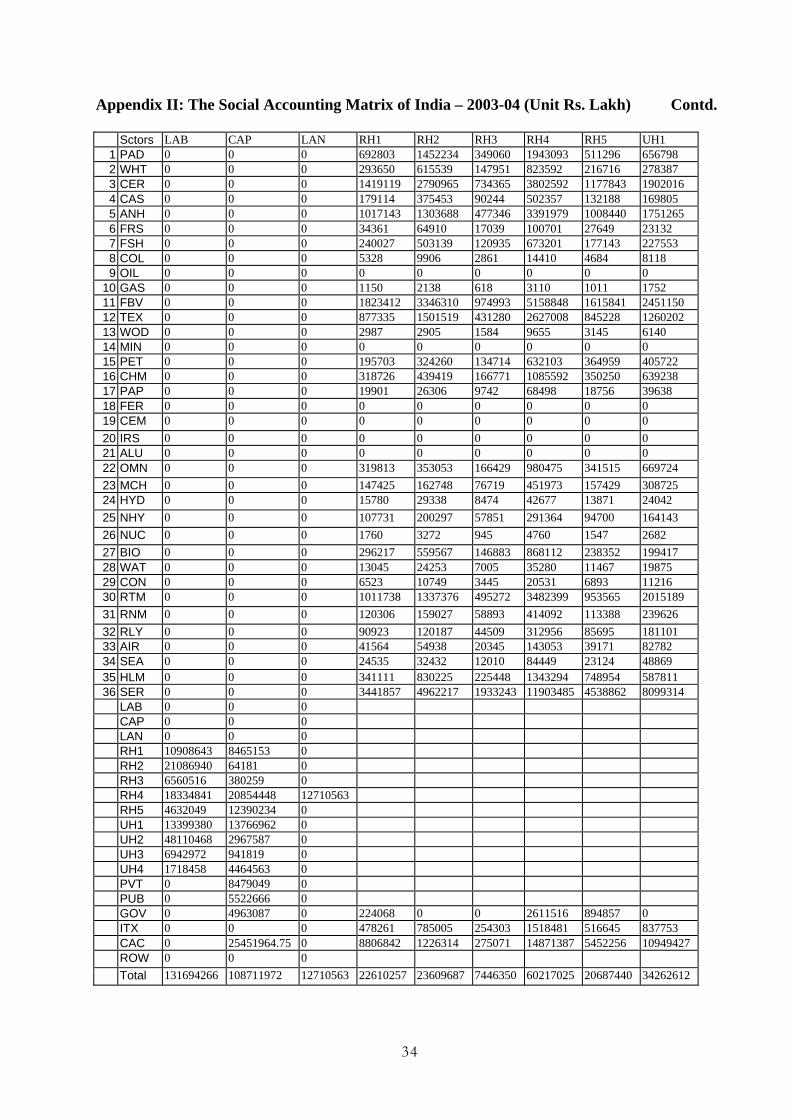
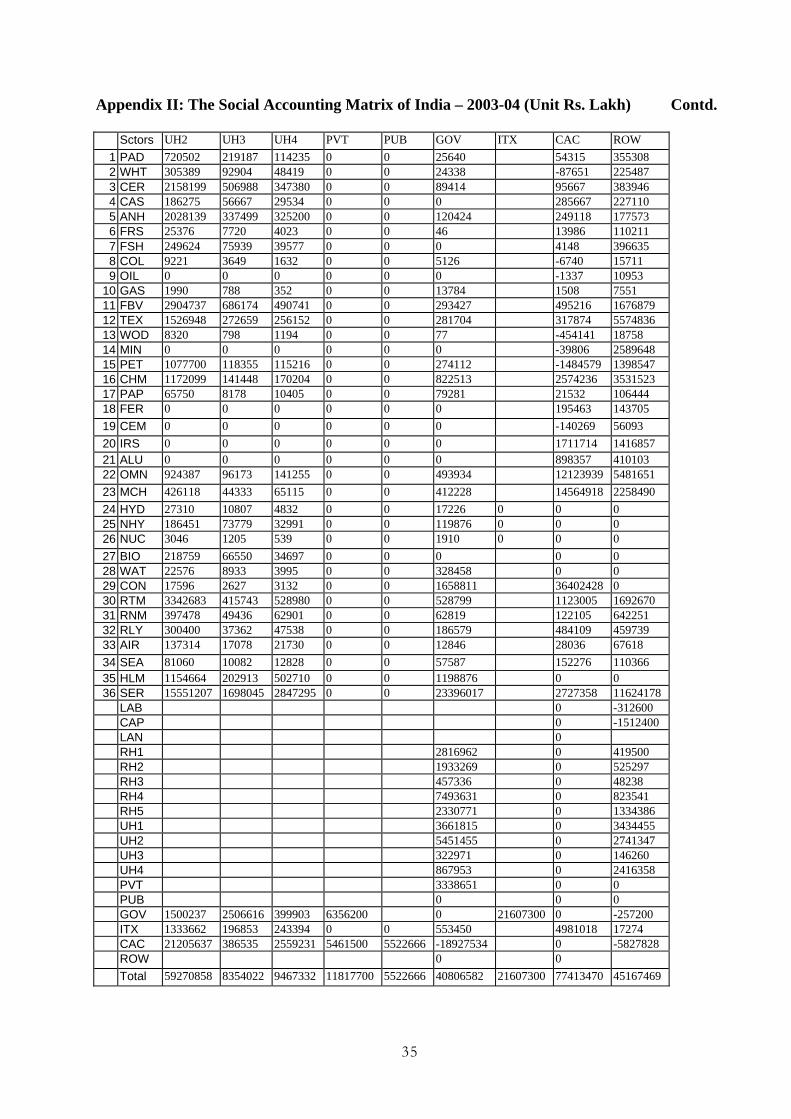
Appendix II: The Social Accounting Matrix of India – 2003-04 (Unit Rs. Lakh)
Sctors PAD WHT CER CAS ANH FRS FSH COL OIL 1 PAD 3331710 43731 306117 306 43344 10 472 0 02 WHT 28451 2480473 440074 1 21668 0 1 0 03 CER 35697 95264 1823594 8 2659873 25 9 0 04 CAS 3683 6473 44342 954620 17639 0 0 0 05 ANH 584311 91559 934262 609930 17914 1 89 0 06 FRS 58 1 8 0 3971 738 0 0 07 FSH 263 1049 2069 0 0 0 44072 0 08 COL 33 24 54 17 820 0 0 9303 99 OIL 0 0 0 0 73 0 0 0 12150
10 GAS 0 0 0 0 682 0 0 0 011 FBV 29285 4816 13631 12 375709 0 14369 0 012 TEX 53484 29146 36417 1554 59102 507 109977 59 013 WOD 75 219 1805 19 285 11 3991 19253 214 MIN 1 5 9 0 321 0 0 0 4115 PET 279959 124433 283441 145415 1018 4157 123243 28077 6955316 CHM 2032 2017 5455 985 20990 1337 7572 200617 5705117 PAP 604 898 3467 260 656 658 0 3009 318 FER 915908 695705 1032577 707396 104 54 128 0 019 CEM 0 0 0 0 50 1 0 0 39420 IRS 0 0 1 0 224 1 5006 0 60821 ALU 1 1 1 0 255 23 276 0 022 OMN 7206 3714 5703 2588 1318 4167 69361 69168 9042523 MCH 46215 37745 63367 8501 9794 752 6 135041 11696624 HYD 43700 29397 22687 11381 193 47 6 16885 554125 NHY 291046 204530 157842 79183 1341 329 41 117477 3855026 NUC 4666 3279 2530 1269 22 5 1 1883 61827 BIO 48863 8249 90692 50432 0 0 0 0 028 WAT 40 32 45 25 3 36 0 1210 029 CON 136760 102795 110751 41646 5015 4733 19 10198 15605130 RTM 241703 137817 246468 127976 366469 11747 38975 86883 3511131 RNM 27105 15268 28048 14652 40802 1453 4475 10415 407532 RLY 84785 36698 50036 23468 30741 1248 2528 18027 819033 AIR 23443 15640 11978 6222 4394 71 2067 656 96034 SEA 2342 2066 4476 838 46719 69 214 1200 86535 HLM 0 0 0 0 0 0 0 0 036 SER 571783 377705 590583 280670 1785079 11932 44961 129261 134541
LAB 3219729 2061039 10746217 4126770 6384318 190531 1664810 820954 82456 CAP 576477 369005 1823804 659076 5072752 166339 1075929 1787368 185224 LAN 2008623 1285724 6796308 2619908 0 0 0 0 0 RH1 RH2 RH3 RH4 RH5 UH1 UH2 UH3 UH4 PVT PUB GOV ITX -932836 -1310473 -911691 -696140 21063 3254 -40955 37219 1535728 CAC ROW 51 536 524624 50051 31076 328050 9111 500866 8608702 Total 11667256 6956579 25291793 9829039 17025799 732289 3180753 4005030 11143813
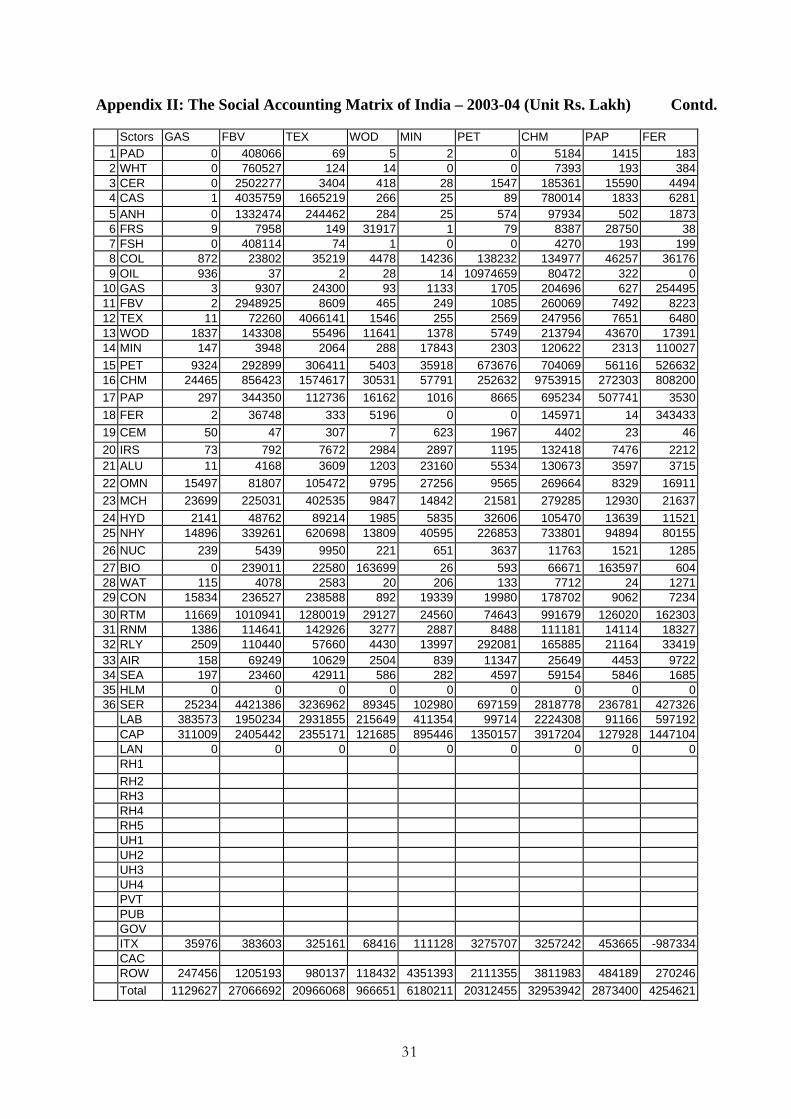
31
Appendix II: The Social Accounting Matrix of India – 2003-04 (Unit Rs. Lakh) Contd.
Sctors GAS FBV TEX WOD MIN PET CHM PAP FER 1 PAD 0 408066 69 5 2 0 5184 1415 1832 WHT 0 760527 124 14 0 0 7393 193 3843 CER 0 2502277 3404 418 28 1547 185361 15590 44944 CAS 1 4035759 1665219 266 25 89 780014 1833 62815 ANH 0 1332474 244462 284 25 574 97934 502 18736 FRS 9 7958 149 31917 1 79 8387 28750 387 FSH 0 408114 74 1 0 0 4270 193 1998 COL 872 23802 35219 4478 14236 138232 134977 46257 361769 OIL 936 37 2 28 14 10974659 80472 322 0
10 GAS 3 9307 24300 93 1133 1705 204696 627 25449511 FBV 2 2948925 8609 465 249 1085 260069 7492 822312 TEX 11 72260 4066141 1546 255 2569 247956 7651 648013 WOD 1837 143308 55496 11641 1378 5749 213794 43670 1739114 MIN 147 3948 2064 288 17843 2303 120622 2313 11002715 PET 9324 292899 306411 5403 35918 673676 704069 56116 52663216 CHM 24465 856423 1574617 30531 57791 252632 9753915 272303 80820017 PAP 297 344350 112736 16162 1016 8665 695234 507741 353018 FER 2 36748 333 5196 0 0 145971 14 34343319 CEM 50 47 307 7 623 1967 4402 23 4620 IRS 73 792 7672 2984 2897 1195 132418 7476 221221 ALU 11 4168 3609 1203 23160 5534 130673 3597 371522 OMN 15497 81807 105472 9795 27256 9565 269664 8329 1691123 MCH 23699 225031 402535 9847 14842 21581 279285 12930 2163724 HYD 2141 48762 89214 1985 5835 32606 105470 13639 1152125 NHY 14896 339261 620698 13809 40595 226853 733801 94894 8015526 NUC 239 5439 9950 221 651 3637 11763 1521 128527 BIO 0 239011 22580 163699 26 593 66671 163597 60428 WAT 115 4078 2583 20 206 133 7712 24 127129 CON 15834 236527 238588 892 19339 19980 178702 9062 723430 RTM 11669 1010941 1280019 29127 24560 74643 991679 126020 16230331 RNM 1386 114641 142926 3277 2887 8488 111181 14114 1832732 RLY 2509 110440 57660 4430 13997 292081 165885 21164 3341933 AIR 158 69249 10629 2504 839 11347 25649 4453 972234 SEA 197 23460 42911 586 282 4597 59154 5846 168535 HLM 0 0 0 0 0 0 0 0 036 SER 25234 4421386 3236962 89345 102980 697159 2818778 236781 427326
LAB 383573 1950234 2931855 215649 411354 99714 2224308 91166 597192 CAP 311009 2405442 2355171 121685 895446 1350157 3917204 127928 1447104 LAN 0 0 0 0 0 0 0 0 0 RH1 RH2 RH3 RH4 RH5 UH1 UH2 UH3 UH4 PVT PUB GOV ITX 35976 383603 325161 68416 111128 3275707 3257242 453665 -987334 CAC ROW 247456 1205193 980137 118432 4351393 2111355 3811983 484189 270246 Total 1129627 27066692 20966068 966651 6180211 20312455 32953942 2873400 4254621
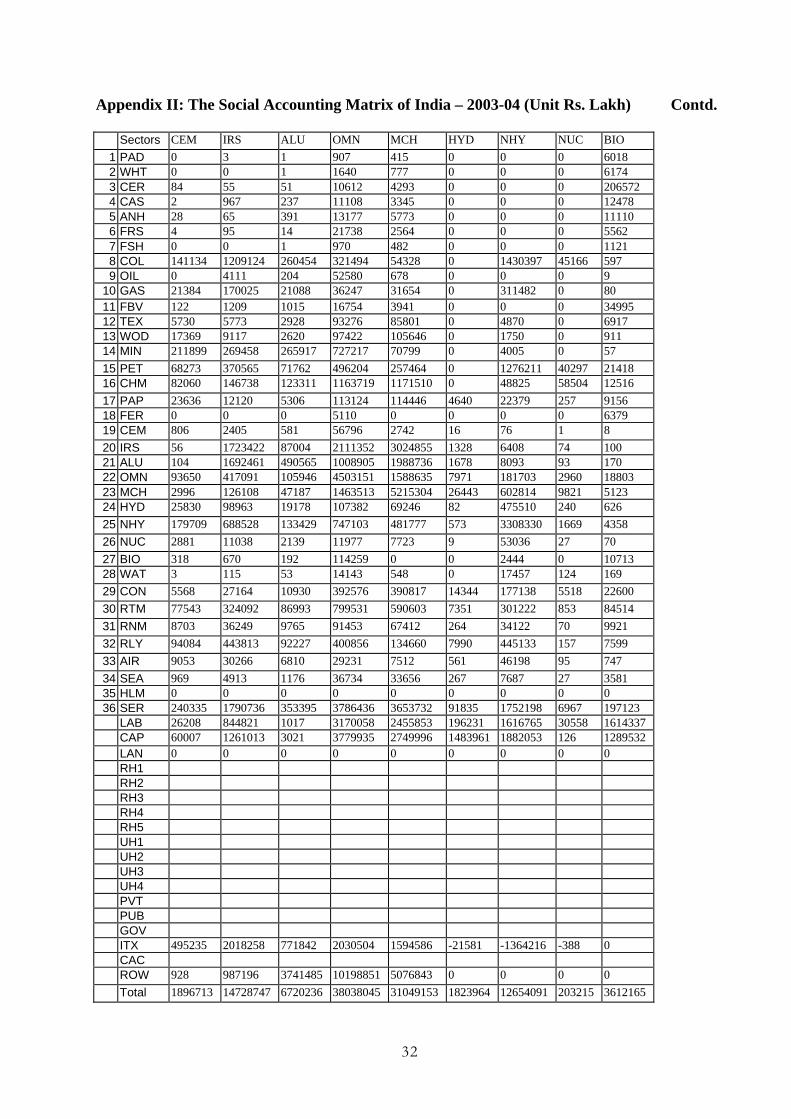
32
Appendix II: The Social Accounting Matrix of India – 2003-04 (Unit Rs. Lakh) Contd.
Sectors CEM IRS ALU OMN MCH HYD NHY NUC BIO 1 PAD 0 3 1 907 415 0 0 0 6018 2 WHT 0 0 1 1640 777 0 0 0 6174 3 CER 84 55 51 10612 4293 0 0 0 206572 4 CAS 2 967 237 11108 3345 0 0 0 12478 5 ANH 28 65 391 13177 5773 0 0 0 11110 6 FRS 4 95 14 21738 2564 0 0 0 5562 7 FSH 0 0 1 970 482 0 0 0 1121 8 COL 141134 1209124 260454 321494 54328 0 1430397 45166 597 9 OIL 0 4111 204 52580 678 0 0 0 9
10 GAS 21384 170025 21088 36247 31654 0 311482 0 80 11 FBV 122 1209 1015 16754 3941 0 0 0 34995 12 TEX 5730 5773 2928 93276 85801 0 4870 0 6917 13 WOD 17369 9117 2620 97422 105646 0 1750 0 911 14 MIN 211899 269458 265917 727217 70799 0 4005 0 57 15 PET 68273 370565 71762 496204 257464 0 1276211 40297 21418 16 CHM 82060 146738 123311 1163719 1171510 0 48825 58504 12516 17 PAP 23636 12120 5306 113124 114446 4640 22379 257 9156 18 FER 0 0 0 5110 0 0 0 0 6379 19 CEM 806 2405 581 56796 2742 16 76 1 8 20 IRS 56 1723422 87004 2111352 3024855 1328 6408 74 100 21 ALU 104 1692461 490565 1008905 1988736 1678 8093 93 170 22 OMN 93650 417091 105946 4503151 1588635 7971 181703 2960 18803 23 MCH 2996 126108 47187 1463513 5215304 26443 602814 9821 5123 24 HYD 25830 98963 19178 107382 69246 82 475510 240 626 25 NHY 179709 688528 133429 747103 481777 573 3308330 1669 4358 26 NUC 2881 11038 2139 11977 7723 9 53036 27 70 27 BIO 318 670 192 114259 0 0 2444 0 10713 28 WAT 3 115 53 14143 548 0 17457 124 169 29 CON 5568 27164 10930 392576 390817 14344 177138 5518 22600 30 RTM 77543 324092 86993 799531 590603 7351 301222 853 84514 31 RNM 8703 36249 9765 91453 67412 264 34122 70 9921 32 RLY 94084 443813 92227 400856 134660 7990 445133 157 7599 33 AIR 9053 30266 6810 29231 7512 561 46198 95 747 34 SEA 969 4913 1176 36734 33656 267 7687 27 3581 35 HLM 0 0 0 0 0 0 0 0 0 36 SER 240335 1790736 353395 3786436 3653732 91835 1752198 6967 197123
LAB 26208 844821 1017 3170058 2455853 196231 1616765 30558 1614337 CAP 60007 1261013 3021 3779935 2749996 1483961 1882053 126 1289532 LAN 0 0 0 0 0 0 0 0 0 RH1 RH2 RH3 RH4 RH5 UH1 UH2 UH3 UH4 PVT PUB GOV ITX 495235 2018258 771842 2030504 1594586 -21581 -1364216 -388 0 CAC ROW 928 987196 3741485 10198851 5076843 0 0 0 0 Total 1896713 14728747 6720236 38038045 31049153 1823964 12654091 203215 3612165
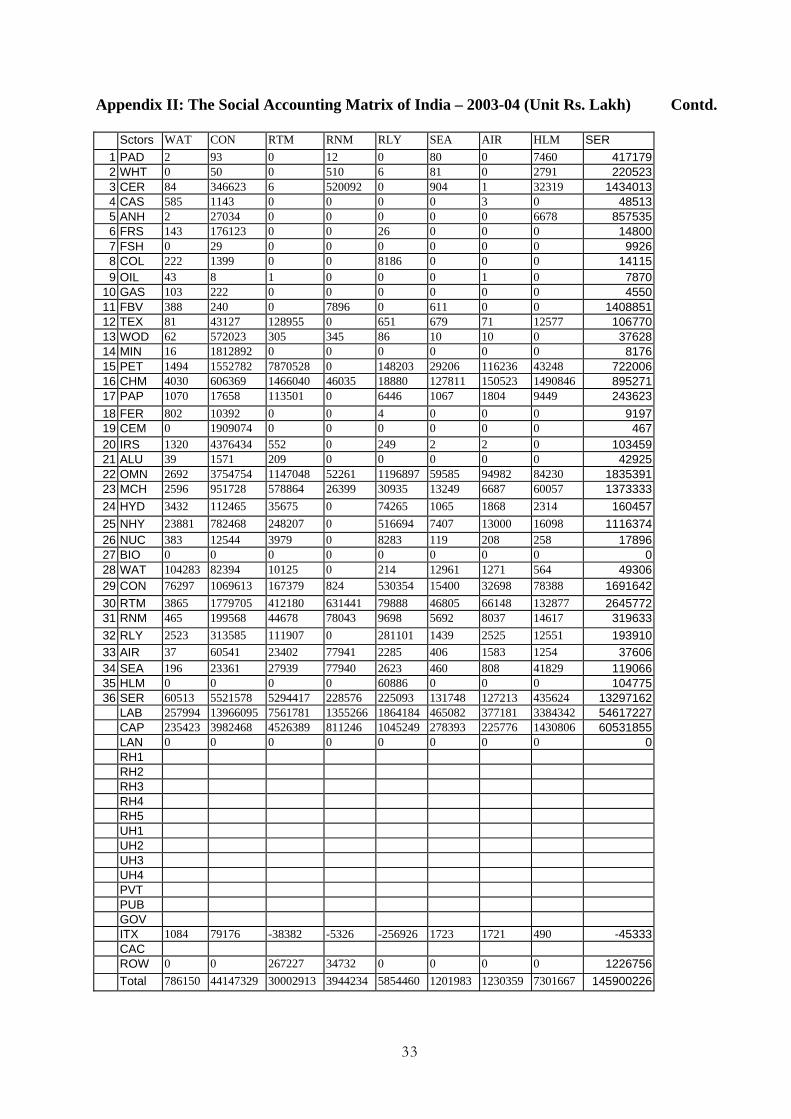
33
Appendix II: The Social Accounting Matrix of India – 2003-04 (Unit Rs. Lakh) Contd.
Sctors WAT CON RTM RNM RLY SEA AIR HLM SER 1 PAD 2 93 0 12 0 80 0 7460 417179 2 WHT 0 50 0 510 6 81 0 2791 220523 3 CER 84 346623 6 520092 0 904 1 32319 1434013 4 CAS 585 1143 0 0 0 0 3 0 48513 5 ANH 2 27034 0 0 0 0 0 6678 857535 6 FRS 143 176123 0 0 26 0 0 0 14800 7 FSH 0 29 0 0 0 0 0 0 9926 8 COL 222 1399 0 0 8186 0 0 0 14115 9 OIL 43 8 1 0 0 0 1 0 7870
10 GAS 103 222 0 0 0 0 0 0 4550 11 FBV 388 240 0 7896 0 611 0 0 1408851 12 TEX 81 43127 128955 0 651 679 71 12577 106770 13 WOD 62 572023 305 345 86 10 10 0 37628 14 MIN 16 1812892 0 0 0 0 0 0 8176 15 PET 1494 1552782 7870528 0 148203 29206 116236 43248 722006 16 CHM 4030 606369 1466040 46035 18880 127811 150523 1490846 895271 17 PAP 1070 17658 113501 0 6446 1067 1804 9449 243623 18 FER 802 10392 0 0 4 0 0 0 9197 19 CEM 0 1909074 0 0 0 0 0 0 467 20 IRS 1320 4376434 552 0 249 2 2 0 103459 21 ALU 39 1571 209 0 0 0 0 0 42925 22 OMN 2692 3754754 1147048 52261 1196897 59585 94982 84230 1835391 23 MCH 2596 951728 578864 26399 30935 13249 6687 60057 1373333 24 HYD 3432 112465 35675 0 74265 1065 1868 2314 160457 25 NHY 23881 782468 248207 0 516694 7407 13000 16098 1116374 26 NUC 383 12544 3979 0 8283 119 208 258 17896 27 BIO 0 0 0 0 0 0 0 0 0 28 WAT 104283 82394 10125 0 214 12961 1271 564 49306 29 CON 76297 1069613 167379 824 530354 15400 32698 78388 1691642 30 RTM 3865 1779705 412180 631441 79888 46805 66148 132877 2645772 31 RNM 465 199568 44678 78043 9698 5692 8037 14617 319633 32 RLY 2523 313585 111907 0 281101 1439 2525 12551 193910 33 AIR 37 60541 23402 77941 2285 406 1583 1254 37606 34 SEA 196 23361 27939 77940 2623 460 808 41829 119066 35 HLM 0 0 0 0 60886 0 0 0 104775 36 SER 60513 5521578 5294417 228576 225093 131748 127213 435624 13297162
LAB 257994 13966095 7561781 1355266 1864184 465082 377181 3384342 54617227 CAP 235423 3982468 4526389 811246 1045249 278393 225776 1430806 60531855 LAN 0 0 0 0 0 0 0 0 0 RH1 RH2 RH3 RH4 RH5 UH1 UH2 UH3 UH4 PVT PUB GOV ITX 1084 79176 -38382 -5326 -256926 1723 1721 490 -45333 CAC ROW 0 0 267227 34732 0 0 0 0 1226756 Total 786150 44147329 30002913 3944234 5854460 1201983 1230359 7301667 145900226
34
Appendix II: The Social Accounting Matrix of India – 2003-04 (Unit Rs. Lakh) Contd.
Sctors LAB CAP LAN RH1 RH2 RH3 RH4 RH5 UH1 1 PAD 0 0 0 692803 1452234 349060 1943093 511296 656798 2 WHT 0 0 0 293650 615539 147951 823592 216716 278387 3 CER 0 0 0 1419119 2790965 734365 3802592 1177843 1902016 4 CAS 0 0 0 179114 375453 90244 502357 132188 169805 5 ANH 0 0 0 1017143 1303688 477346 3391979 1008440 1751265 6 FRS 0 0 0 34361 64910 17039 100701 27649 23132 7 FSH 0 0 0 240027 503139 120935 673201 177143 227553 8 COL 0 0 0 5328 9906 2861 14410 4684 8118 9 OIL 0 0 0 0 0 0 0 0 0
10 GAS 0 0 0 1150 2138 618 3110 1011 1752 11 FBV 0 0 0 1823412 3346310 974993 5158848 1615841 2451150 12 TEX 0 0 0 877335 1501519 431280 2627008 845228 1260202 13 WOD 0 0 0 2987 2905 1584 9655 3145 6140 14 MIN 0 0 0 0 0 0 0 0 0 15 PET 0 0 0 195703 324260 134714 632103 364959 405722 16 CHM 0 0 0 318726 439419 166771 1085592 350250 639238 17 PAP 0 0 0 19901 26306 9742 68498 18756 39638 18 FER 0 0 0 0 0 0 0 0 0 19 CEM 0 0 0 0 0 0 0 0 0 20 IRS 0 0 0 0 0 0 0 0 0 21 ALU 0 0 0 0 0 0 0 0 0 22 OMN 0 0 0 319813 353053 166429 980475 341515 669724 23 MCH 0 0 0 147425 162748 76719 451973 157429 308725 24 HYD 0 0 0 15780 29338 8474 42677 13871 24042 25 NHY 0 0 0 107731 200297 57851 291364 94700 164143 26 NUC 0 0 0 1760 3272 945 4760 1547 2682 27 BIO 0 0 0 296217 559567 146883 868112 238352 199417 28 WAT 0 0 0 13045 24253 7005 35280 11467 19875 29 CON 0 0 0 6523 10749 3445 20531 6893 11216 30 RTM 0 0 0 1011738 1337376 495272 3482399 953565 2015189 31 RNM 0 0 0 120306 159027 58893 414092 113388 239626 32 RLY 0 0 0 90923 120187 44509 312956 85695 181101 33 AIR 0 0 0 41564 54938 20345 143053 39171 82782 34 SEA 0 0 0 24535 32432 12010 84449 23124 48869 35 HLM 0 0 0 341111 830225 225448 1343294 748954 587811 36 SER 0 0 0 3441857 4962217 1933243 11903485 4538862 8099314
LAB 0 0 0 CAP 0 0 0 LAN 0 0 0 RH1 10908643 8465153 0 RH2 21086940 64181 0 RH3 6560516 380259 0 RH4 18334841 20854448 12710563 RH5 4632049 12390234 0 UH1 13399380 13766962 0 UH2 48110468 2967587 0 UH3 6942972 941819 0 UH4 1718458 4464563 0 PVT 0 8479049 0 PUB 0 5522666 0 GOV 0 4963087 0 224068 0 0 2611516 894857 0 ITX 0 0 0 478261 785005 254303 1518481 516645 837753 CAC 0 25451964.75 0 8806842 1226314 275071 14871387 5452256 10949427 ROW 0 0 0 Total 131694266 108711972 12710563 22610257 23609687 7446350 60217025 20687440 34262612
35
Appendix II: The Social Accounting Matrix of India – 2003-04 (Unit Rs. Lakh) Contd.
Sctors UH2 UH3 UH4 PVT PUB GOV ITX CAC ROW 1 PAD 720502 219187 114235 0 0 25640 54315 355308 2 WHT 305389 92904 48419 0 0 24338 -87651 225487 3 CER 2158199 506988 347380 0 0 89414 95667 383946 4 CAS 186275 56667 29534 0 0 0 285667 227110 5 ANH 2028139 337499 325200 0 0 120424 249118 177573 6 FRS 25376 7720 4023 0 0 46 13986 110211 7 FSH 249624 75939 39577 0 0 0 4148 396635 8 COL 9221 3649 1632 0 0 5126 -6740 15711 9 OIL 0 0 0 0 0 0 -1337 10953
10 GAS 1990 788 352 0 0 13784 1508 7551 11 FBV 2904737 686174 490741 0 0 293427 495216 1676879 12 TEX 1526948 272659 256152 0 0 281704 317874 5574836 13 WOD 8320 798 1194 0 0 77 -454141 18758 14 MIN 0 0 0 0 0 0 -39806 2589648 15 PET 1077700 118355 115216 0 0 274112 -1484579 1398547 16 CHM 1172099 141448 170204 0 0 822513 2574236 3531523 17 PAP 65750 8178 10405 0 0 79281 21532 106444 18 FER 0 0 0 0 0 0 195463 143705 19 CEM 0 0 0 0 0 0 -140269 56093 20 IRS 0 0 0 0 0 0 1711714 1416857 21 ALU 0 0 0 0 0 0 898357 410103 22 OMN 924387 96173 141255 0 0 493934 12123939 5481651 23 MCH 426118 44333 65115 0 0 412228 14564918 2258490 24 HYD 27310 10807 4832 0 0 17226 0 0 0 25 NHY 186451 73779 32991 0 0 119876 0 0 0 26 NUC 3046 1205 539 0 0 1910 0 0 0 27 BIO 218759 66550 34697 0 0 0 0 0 28 WAT 22576 8933 3995 0 0 328458 0 0 29 CON 17596 2627 3132 0 0 1658811 36402428 0 30 RTM 3342683 415743 528980 0 0 528799 1123005 1692670 31 RNM 397478 49436 62901 0 0 62819 122105 642251 32 RLY 300400 37362 47538 0 0 186579 484109 459739 33 AIR 137314 17078 21730 0 0 12846 28036 67618 34 SEA 81060 10082 12828 0 0 57587 152276 110366 35 HLM 1154664 202913 502710 0 0 1198876 0 0 36 SER 15551207 1698045 2847295 0 0 23396017 2727358 11624178
LAB 0 -312600 CAP 0 -1512400 LAN 0 RH1 2816962 0 419500 RH2 1933269 0 525297 RH3 457336 0 48238 RH4 7493631 0 823541 RH5 2330771 0 1334386 UH1 3661815 0 3434455 UH2 5451455 0 2741347 UH3 322971 0 146260 UH4 867953 0 2416358 PVT 3338651 0 0 PUB 0 0 0 GOV 1500237 2506616 399903 6356200 0 21607300 0 -257200 ITX 1333662 196853 243394 0 0 553450 4981018 17274 CAC 21205637 386535 2559231 5461500 5522666 -18927534 0 -5827828 ROW 0 0 Total 59270858 8354022 9467332 11817700 5522666 40806582 21607300 77413470 45167469
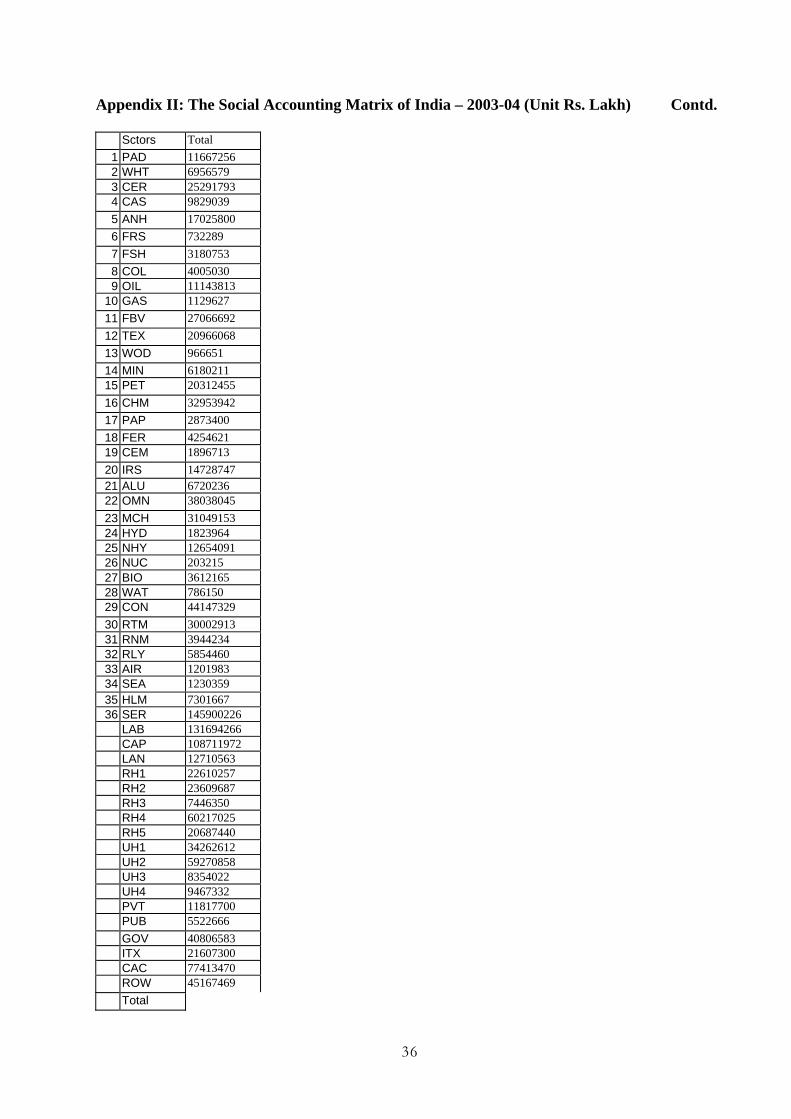
36
Appendix II: The Social Accounting Matrix of India – 2003-04 (Unit Rs. Lakh) Contd.
Sctors Total 1 PAD 11667256 2 WHT 6956579 3 CER 25291793 4 CAS 9829039 5 ANH 17025800 6 FRS 732289 7 FSH 3180753 8 COL 4005030 9 OIL 11143813
10 GAS 1129627 11 FBV 27066692 12 TEX 20966068 13 WOD 966651 14 MIN 6180211 15 PET 20312455 16 CHM 32953942 17 PAP 2873400 18 FER 4254621 19 CEM 1896713 20 IRS 14728747 21 ALU 6720236 22 OMN 38038045 23 MCH 31049153 24 HYD 1823964 25 NHY 12654091 26 NUC 203215 27 BIO 3612165 28 WAT 786150 29 CON 44147329 30 RTM 30002913 31 RNM 3944234 32 RLY 5854460 33 AIR 1201983 34 SEA 1230359 35 HLM 7301667 36 SER 145900226
LAB 131694266 CAP 108711972 LAN 12710563 RH1 22610257 RH2 23609687 RH3 7446350 RH4 60217025 RH5 20687440 UH1 34262612 UH2 59270858 UH3 8354022 UH4 9467332 PVT 11817700 PUB 5522666 GOV 40806583 ITX 21607300 CAC 77413470 ROW 45167469 Total

37