Embed Size (px)
Citation preview
An Advanced Analytic Solution for ESP Monitoring in Upstream Oil ProductionSession ID: 5-1964
DISCLAIMER
The information and/or opinions expressed in this
presentation are those of the authors and do not necessarily
represent official policy or position of Emerson Global Users
Exchange or Emerson Automation Solutions.

Photography and audio/video recording is not permitted in any session, or in the exhibition areas, without press credentials or written permission from the Emerson Exchange Board of Directors.
Inquiries should be directed to:
Thank you!
PHOTOGRAPHY & VIDEO RECORDING POLICY

• Rahul Raveendran,
Mitacs Accelerate Postdoc Fellow
University of Alberta | Spartan Controls
Email: [email protected]
• Warren Mitchell,
Operational Excellence Solutions
Spartan Controls Ltd.
Email: [email protected]
PRESENTERS

SPARTAN CONTROLS
• Western Canada’s Leading provider of
- Industrial automation
- Valves
- Measurement and
- Process control solutions
• Emerson Impact Partner
• > 900 employees
• Operational excellence
Solutions group > 40 employees

RESEARCH COLLABORATION
• NSERC Senior Industrial Research Chair in Control of Oil Sands Processes
- Chair holder: Biao Huang, Ph. D., P. Eng., Professor, Dept. Chemical and Materials Engineering, University of Alberta
- Industrial Partners
AGENDA
• Introduction- Process: Steam assisted gravity drainage process- Equipment: Electric submersible pumps (ESPs)- ESP reliability issues
• Monitoring Solutions- Monitoring based on performance curves
- Data-driven models for failure prediction
- Pattern recognition techniques
• Emerson’s Analytics Platform
• Business Results Achieved
• Summary
STEAM ASSISTED GRAVITY DRAINAGE (SAGD) WELLS
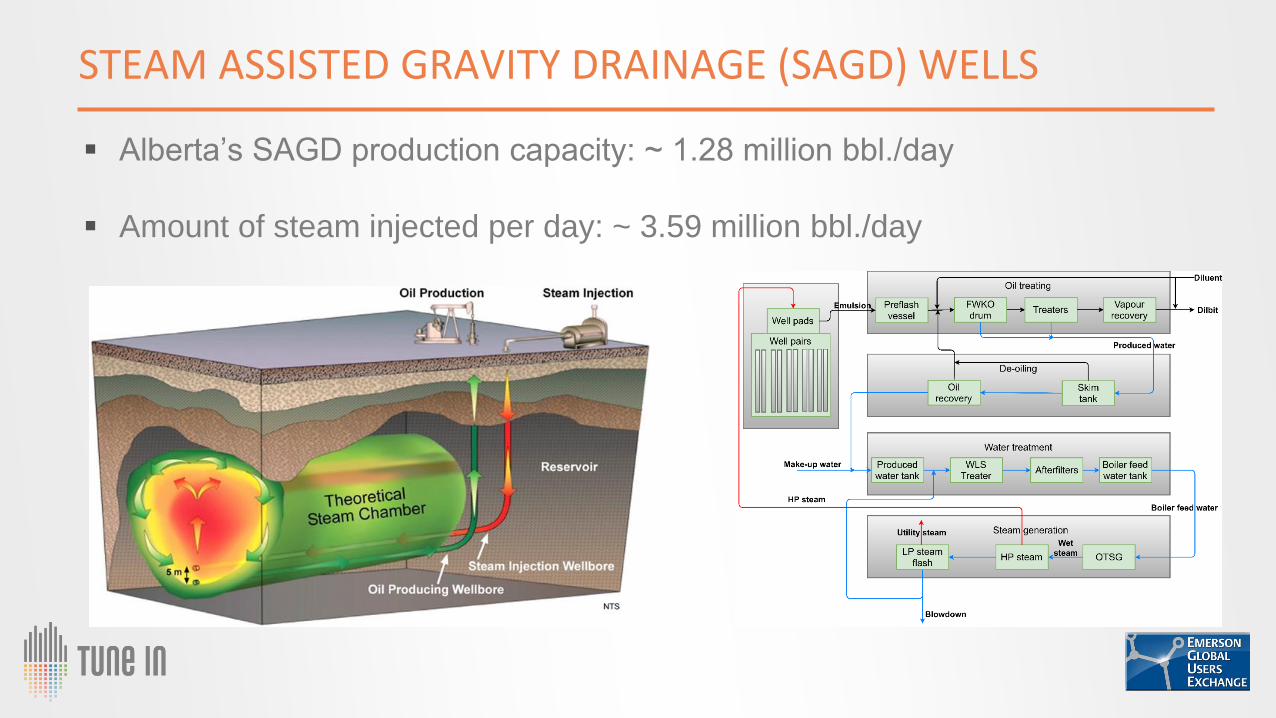
▪ Alberta’s SAGD production capacity: ~ 1.28 million bbl./day
▪ Amount of steam injected per day: ~ 3.59 million bbl./day
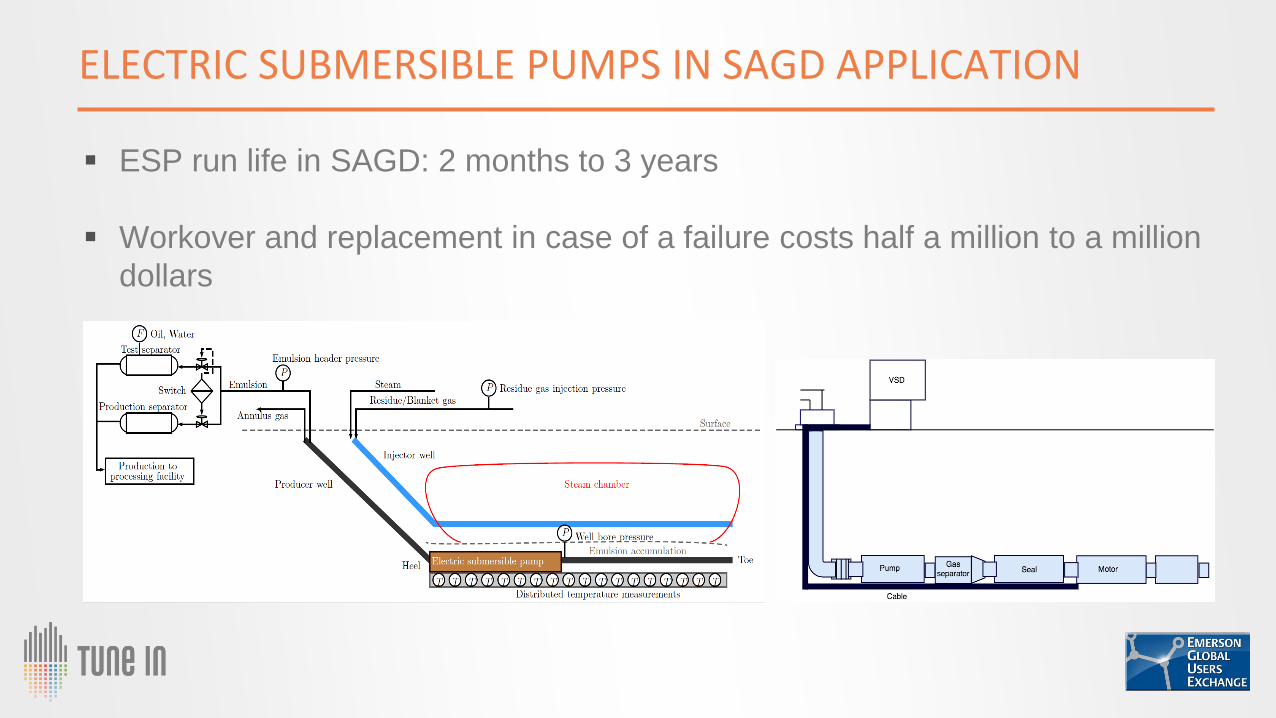
ELECTRIC SUBMERSIBLE PUMPS IN SAGD APPLICATION
▪ ESP run life in SAGD: 2 months to 3 years
▪ Workover and replacement in case of a failure costs half a million to a million
dollars
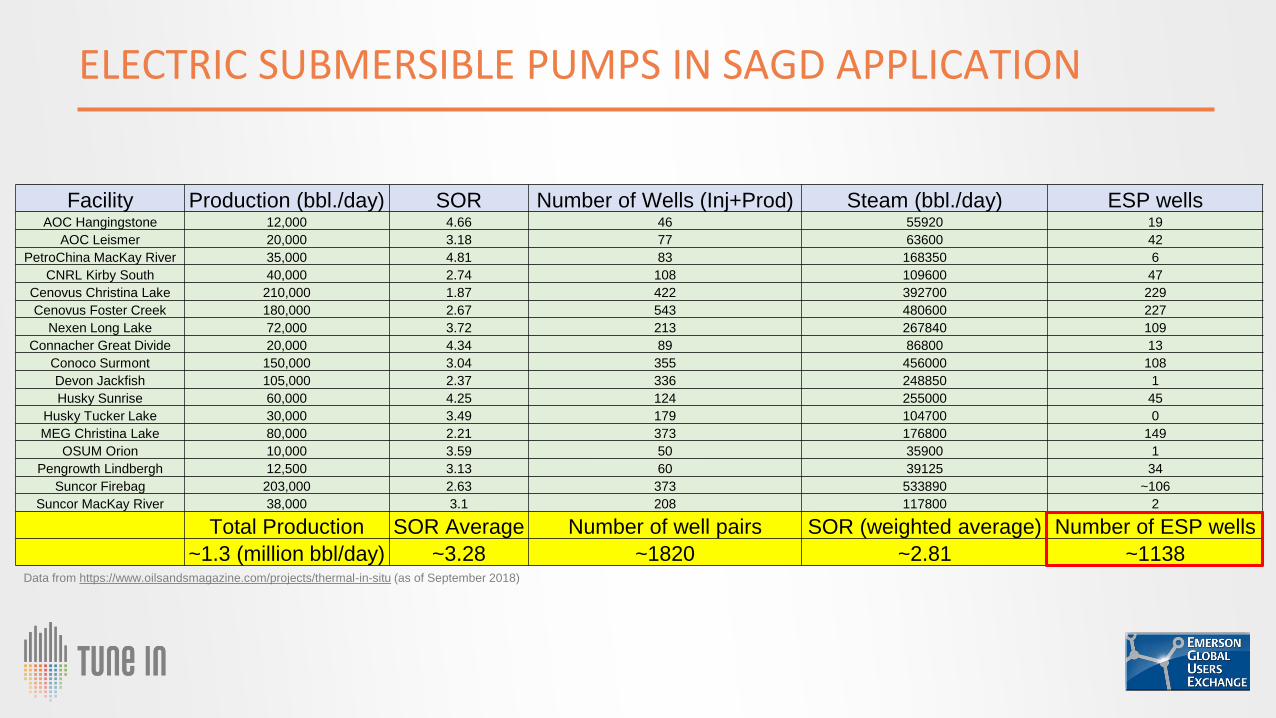
ELECTRIC SUBMERSIBLE PUMPS IN SAGD APPLICATION
Facility Production (bbl./day) SOR Number of Wells (Inj+Prod) Steam (bbl./day) ESP wellsAOC Hangingstone 12,000 4.66 46 55920 19
AOC Leismer 20,000 3.18 77 63600 42
PetroChina MacKay River 35,000 4.81 83 168350 6
CNRL Kirby South 40,000 2.74 108 109600 47
Cenovus Christina Lake 210,000 1.87 422 392700 229
Cenovus Foster Creek 180,000 2.67 543 480600 227
Nexen Long Lake 72,000 3.72 213 267840 109
Connacher Great Divide 20,000 4.34 89 86800 13
Conoco Surmont 150,000 3.04 355 456000 108
Devon Jackfish 105,000 2.37 336 248850 1
Husky Sunrise 60,000 4.25 124 255000 45
Husky Tucker Lake 30,000 3.49 179 104700 0
MEG Christina Lake 80,000 2.21 373 176800 149
OSUM Orion 10,000 3.59 50 35900 1
Pengrowth Lindbergh 12,500 3.13 60 39125 34
Suncor Firebag 203,000 2.63 373 533890 ~106
Suncor MacKay River 38,000 3.1 208 117800 2
Total Production SOR Average Number of well pairs SOR (weighted average) Number of ESP wells
~1.3 (million bbl/day) ~3.28 ~1820 ~2.81 ~1138Data from https://www.oilsandsmagazine.com/projects/thermal-in-situ (as of September 2018)
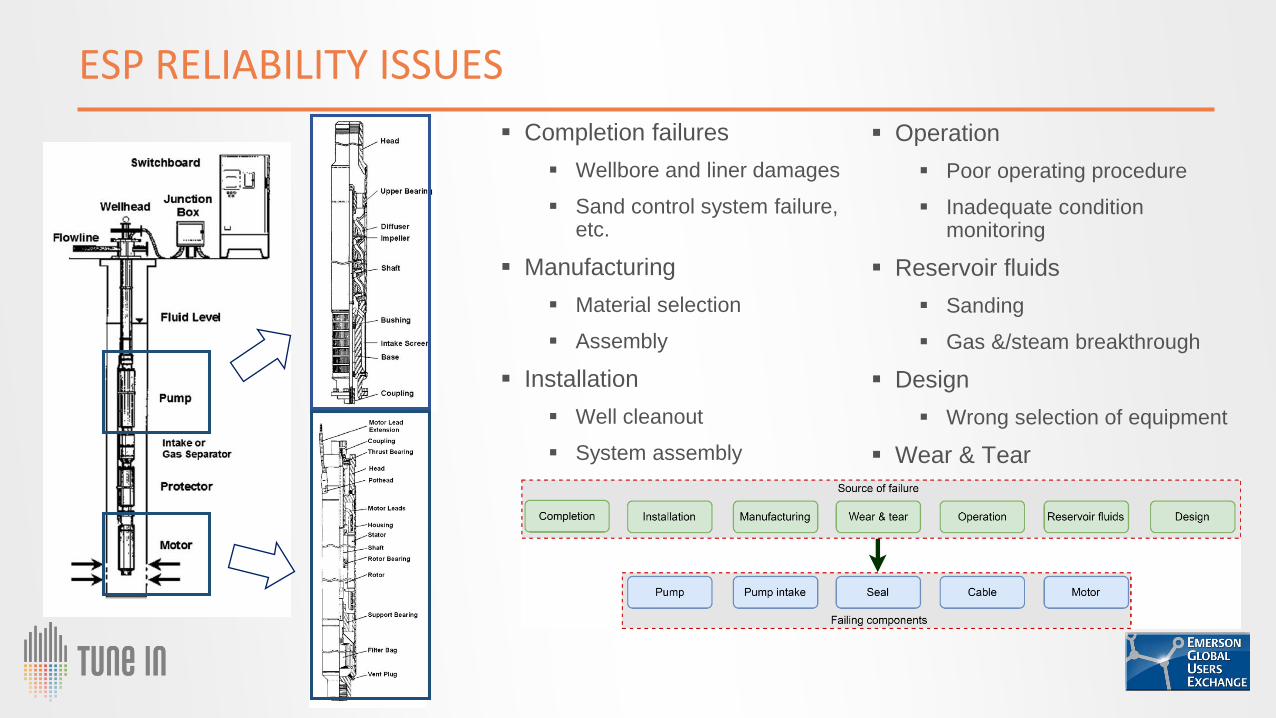
ESP RELIABILITY ISSUES
▪ Completion failures
▪ Wellbore and liner damages
▪ Sand control system failure, etc.
▪ Manufacturing
▪ Material selection
▪ Assembly
▪ Installation
▪ Well cleanout
▪ System assembly
▪ Operation
▪ Poor operating procedure
▪ Inadequate condition monitoring
▪ Reservoir fluids
▪ Sanding
▪ Gas &/steam breakthrough
▪ Design
▪ Wrong selection of equipment
▪ Wear & Tear
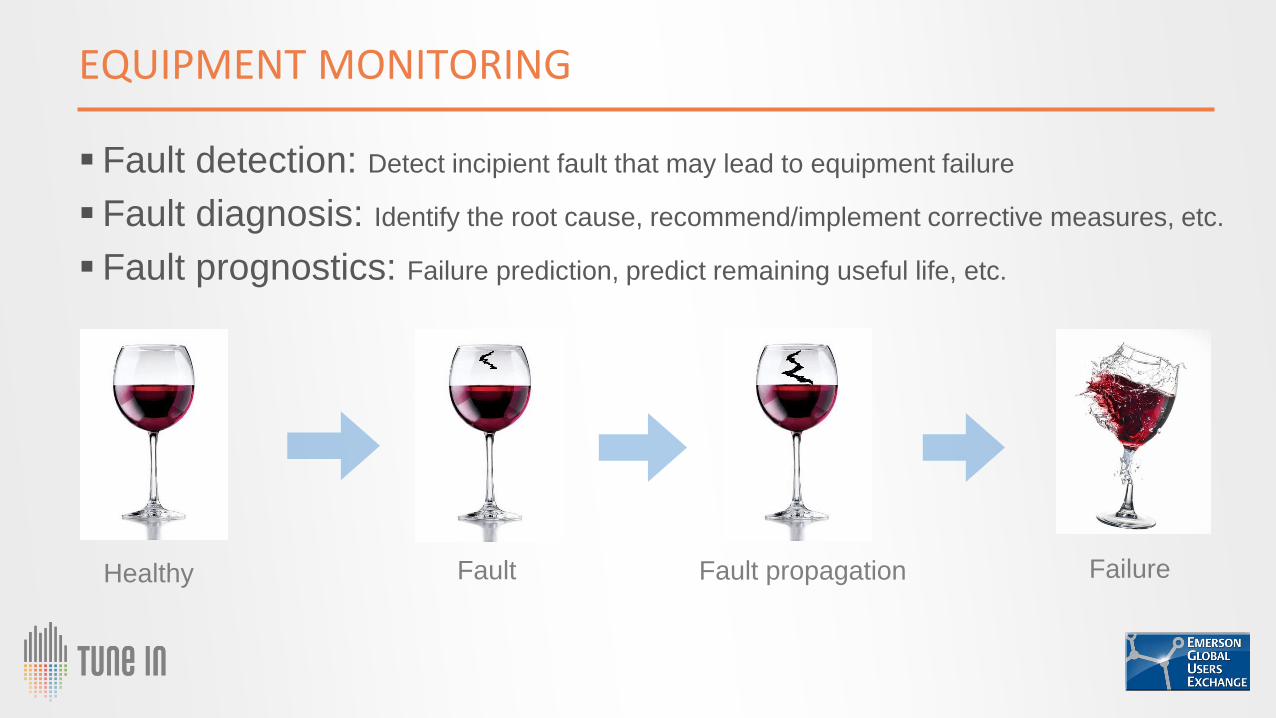
EQUIPMENT MONITORING
Healthy Fault FailureFault propagation
▪ Fault detection: Detect incipient fault that may lead to equipment failure
▪ Fault diagnosis: Identify the root cause, recommend/implement corrective measures, etc.
▪ Fault prognostics: Failure prediction, predict remaining useful life, etc.
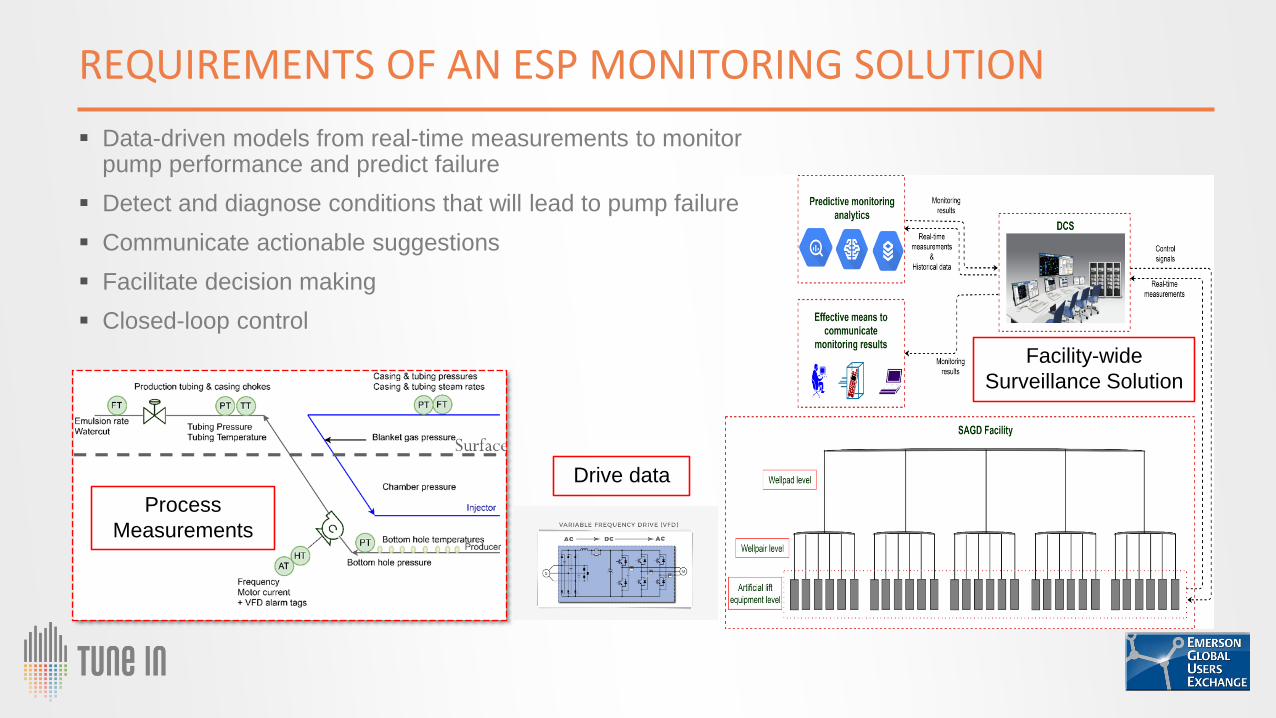
REQUIREMENTS OF AN ESP MONITORING SOLUTION
Facility-wide
Surveillance Solution
▪ Data-driven models from real-time measurements to monitor pump performance and predict failure
▪ Detect and diagnose conditions that will lead to pump failure
▪ Communicate actionable suggestions
▪ Facilitate decision making
▪ Closed-loop control
Process
Measurements
Drive data

PERFORMANCE MONITORING ALGORITHMS
Power
Supply
Variable
Frequency
DriveMotor
Fixed voltage
and frequencyRequired voltage
and frequency ESPVariable
torque load
▪ Characteristic curves reconstructed using data-driven models
▪ Online operating conditions are compared against the characteristic curves
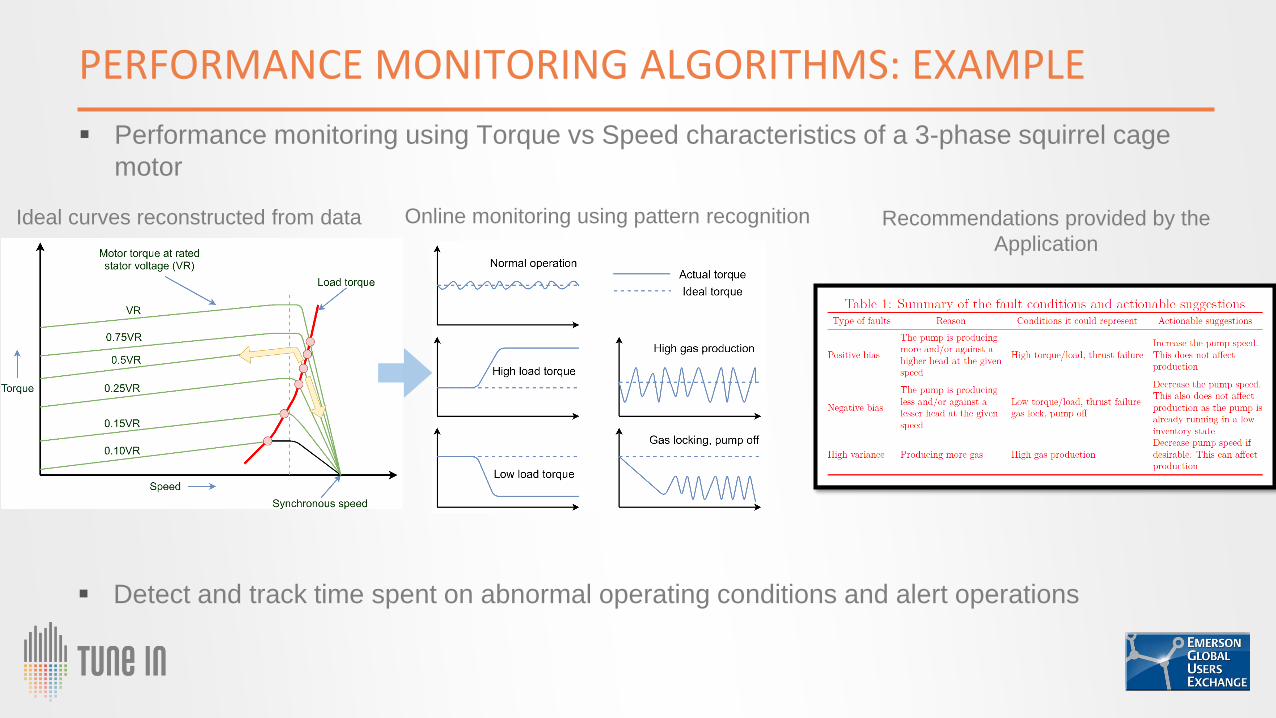
PERFORMANCE MONITORING ALGORITHMS: EXAMPLE
▪ Performance monitoring using Torque vs Speed characteristics of a 3-phase squirrel cage
motor
Ideal curves reconstructed from data Online monitoring using pattern recognition
▪ Detect and track time spent on abnormal operating conditions and alert operations
Recommendations provided by the
Application
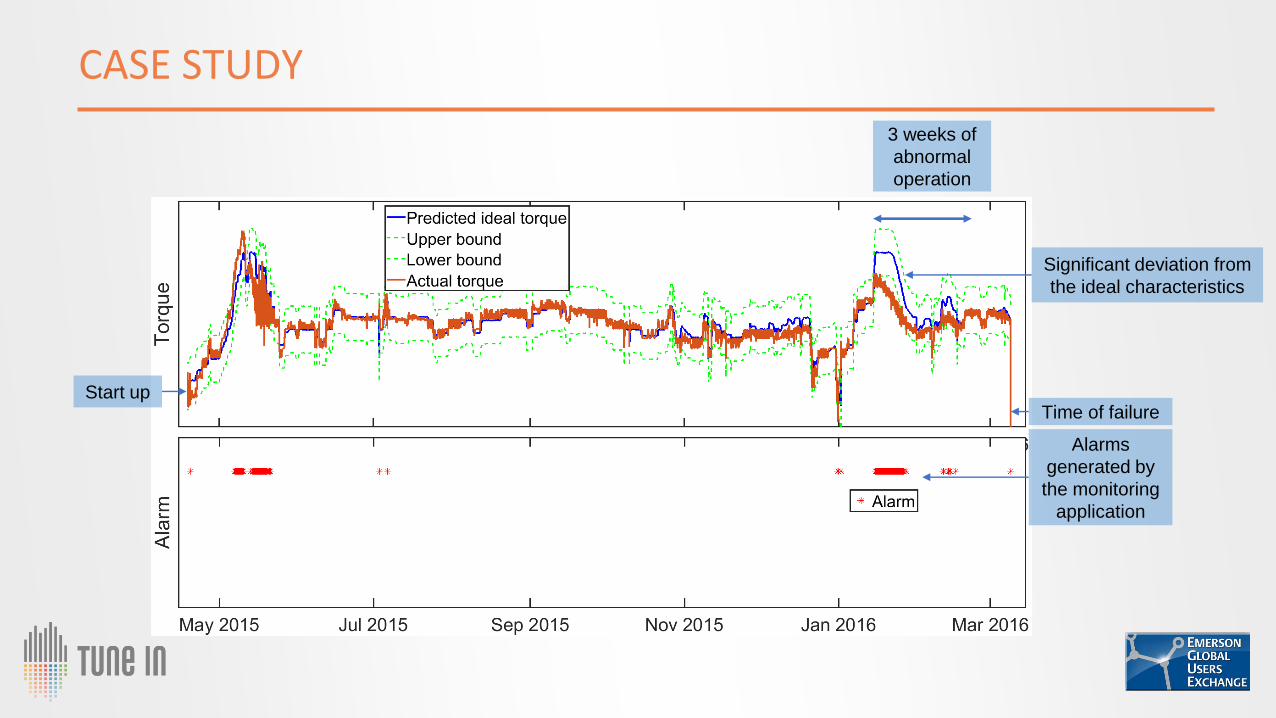
CASE STUDY
Time of failure
Alarms
generated by
the monitoring
application
Start up
3 weeks of
abnormal
operation
Significant deviation from
the ideal characteristics
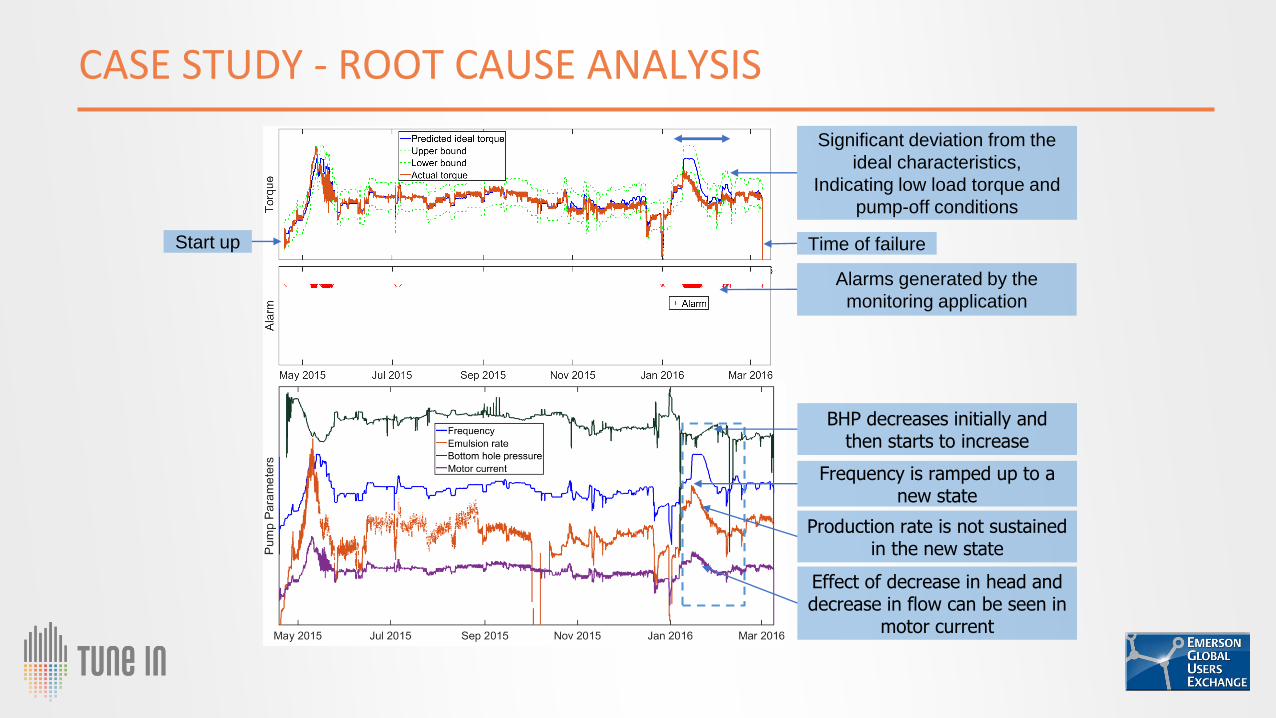
CASE STUDY - ROOT CAUSE ANALYSIS
Frequency is ramped up to a new state
BHP decreases initially and then starts to increase
Production rate is not sustained in the new state
Effect of decrease in head and decrease in flow can be seen in
motor current
Time of failure
Alarms generated by the
monitoring application
Significant deviation from the
ideal characteristics,
Indicating low load torque and
pump-off conditions
Start up
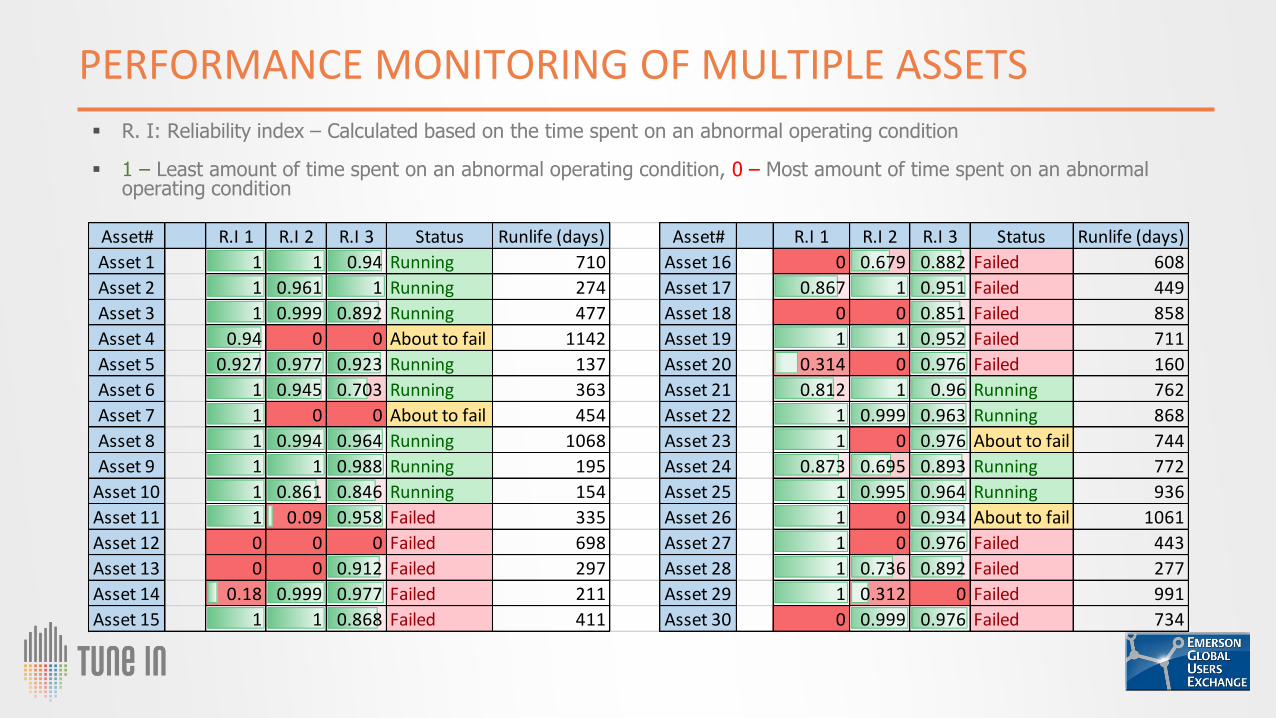
PERFORMANCE MONITORING OF MULTIPLE ASSETS
Asset# R.I 1 R.I 2 R.I 3 Status Runlife (days) Asset# R.I 1 R.I 2 R.I 3 Status Runlife (days)
Asset 1 1 1 0.94 Running 710 Asset 16 0 0.679 0.882 Failed 608
Asset 2 1 0.961 1 Running 274 Asset 17 0.867 1 0.951 Failed 449
Asset 3 1 0.999 0.892 Running 477 Asset 18 0 0 0.851 Failed 858
Asset 4 0.94 0 0 About to fail 1142 Asset 19 1 1 0.952 Failed 711
Asset 5 0.927 0.977 0.923 Running 137 Asset 20 0.314 0 0.976 Failed 160
Asset 6 1 0.945 0.703 Running 363 Asset 21 0.812 1 0.96 Running 762
Asset 7 1 0 0 About to fail 454 Asset 22 1 0.999 0.963 Running 868
Asset 8 1 0.994 0.964 Running 1068 Asset 23 1 0 0.976 About to fail 744
Asset 9 1 1 0.988 Running 195 Asset 24 0.873 0.695 0.893 Running 772
Asset 10 1 0.861 0.846 Running 154 Asset 25 1 0.995 0.964 Running 936
Asset 11 1 0.09 0.958 Failed 335 Asset 26 1 0 0.934 About to fail 1061
Asset 12 0 0 0 Failed 698 Asset 27 1 0 0.976 Failed 443
Asset 13 0 0 0.912 Failed 297 Asset 28 1 0.736 0.892 Failed 277
Asset 14 0.18 0.999 0.977 Failed 211 Asset 29 1 0.312 0 Failed 991
Asset 15 1 1 0.868 Failed 411 Asset 30 0 0.999 0.976 Failed 734
▪ R. I: Reliability index – Calculated based on the time spent on an abnormal operating condition
▪ 1 – Least amount of time spent on an abnormal operating condition, 0 – Most amount of time spent on an abnormal operating condition
MONITORING ALGORITHMS BASED ON VFD DATA: CASE STUDIES

CASE STUDY 1: PHASE CURRENTS, VOLTAGES AND POWER
Start up
Start up
Start up
Time of failure
Time of failure
Time of failure
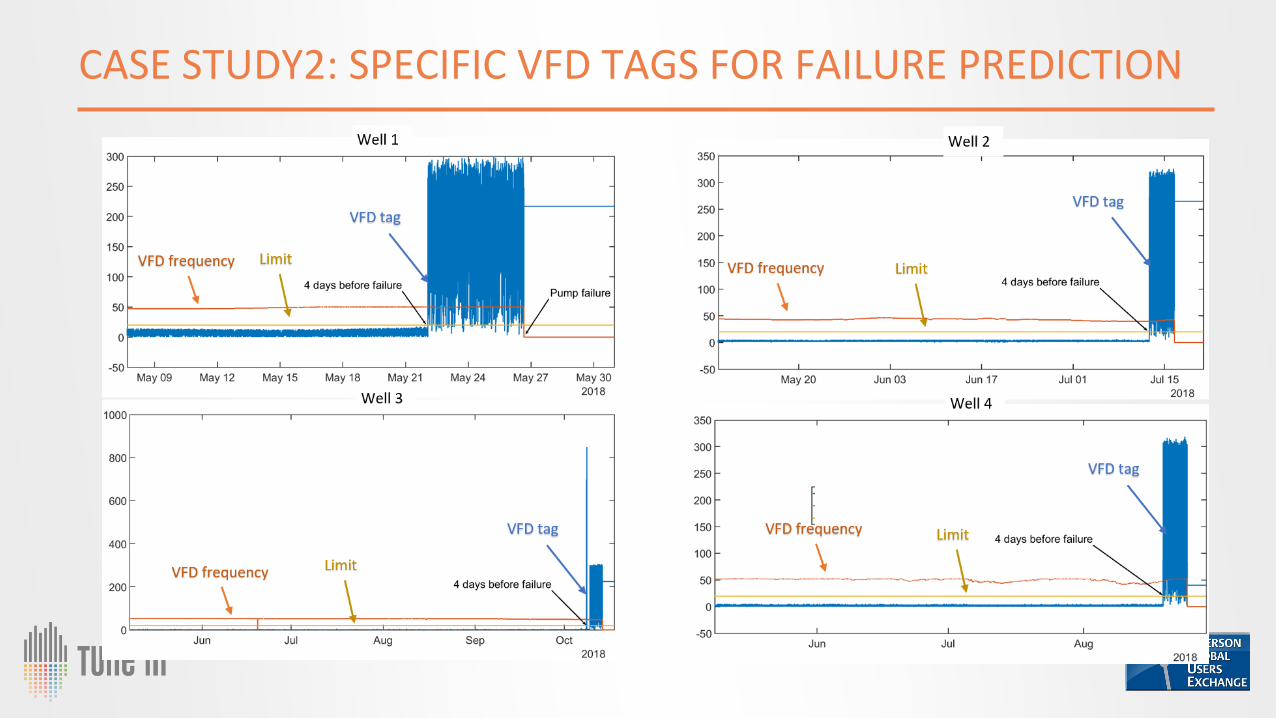
CASE STUDY2: SPECIFIC VFD TAGS FOR FAILURE PREDICTION
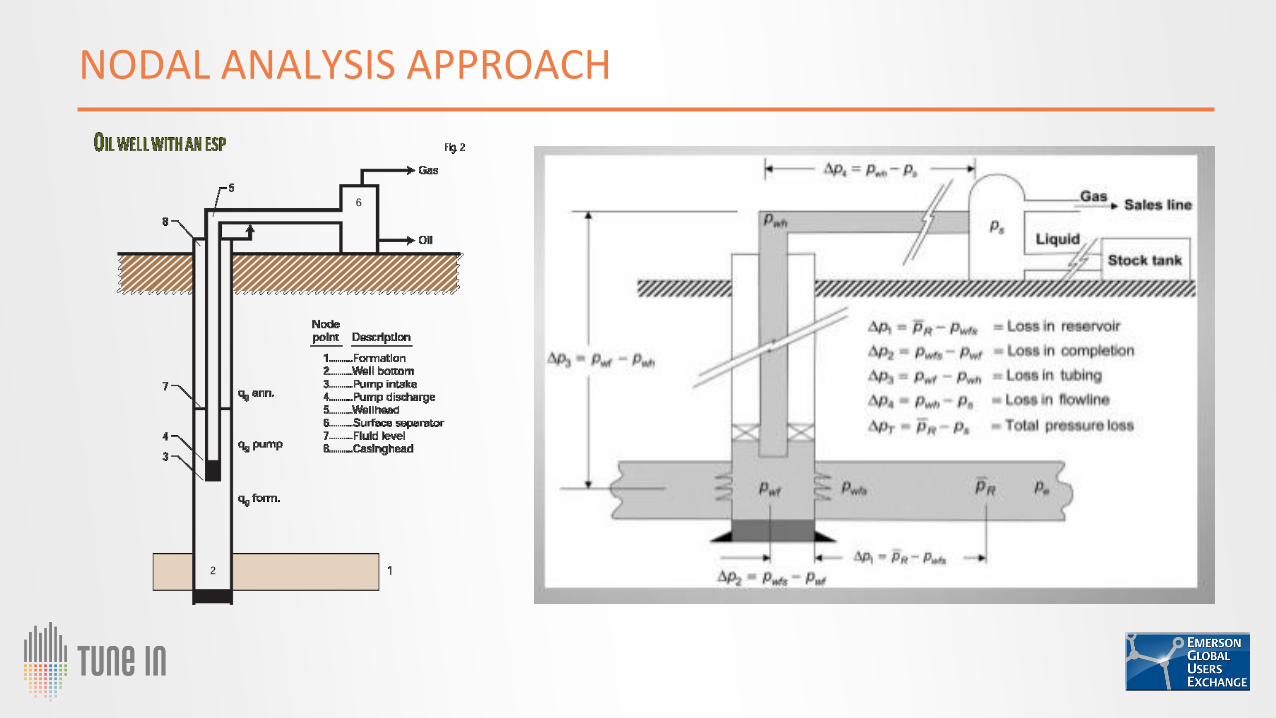
NODAL ANALYSIS APPROACH
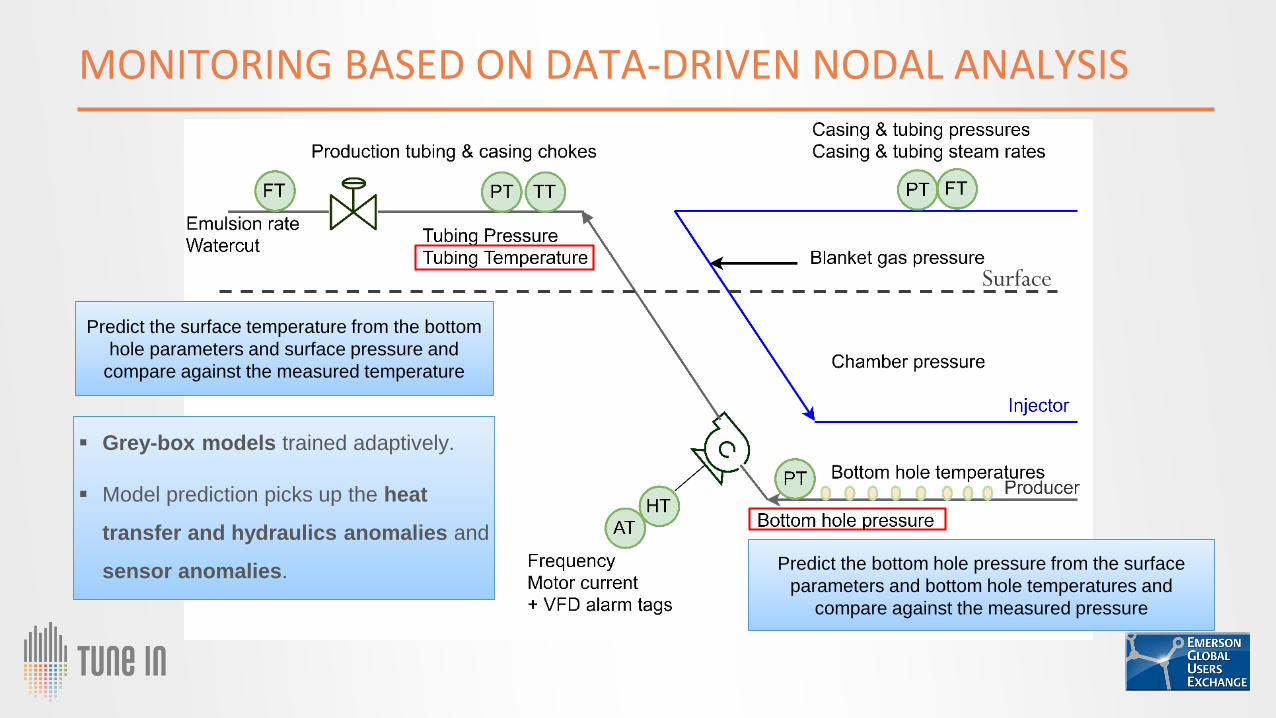
MONITORING BASED ON DATA-DRIVEN NODAL ANALYSIS
Predict the surface temperature from the bottom
hole parameters and surface pressure and
compare against the measured temperature
Predict the bottom hole pressure from the surface
parameters and bottom hole temperatures and
compare against the measured pressure
▪ Grey-box models trained adaptively.
▪ Model prediction picks up the heat
transfer and hydraulics anomalies and
sensor anomalies.
Surface
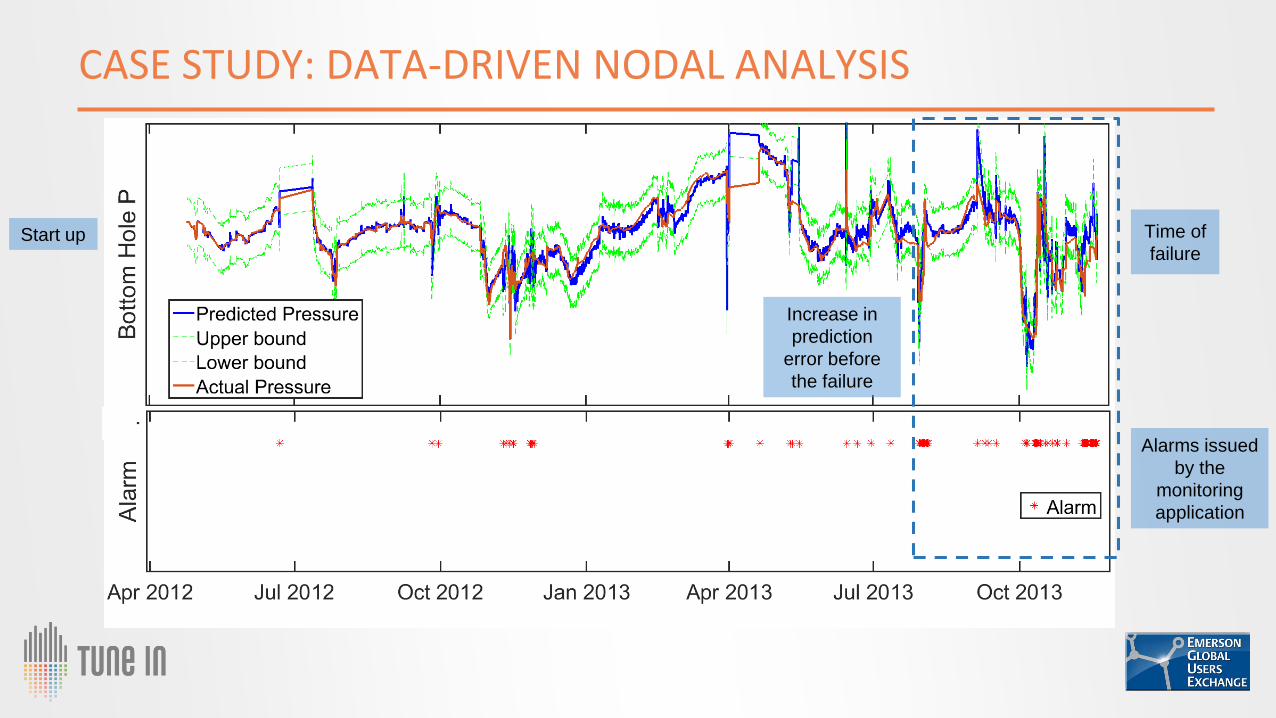
CASE STUDY: DATA-DRIVEN NODAL ANALYSIS
Start up Time of
failure
Alarms issued
by the
monitoring
application
Increase in
prediction
error before
the failure
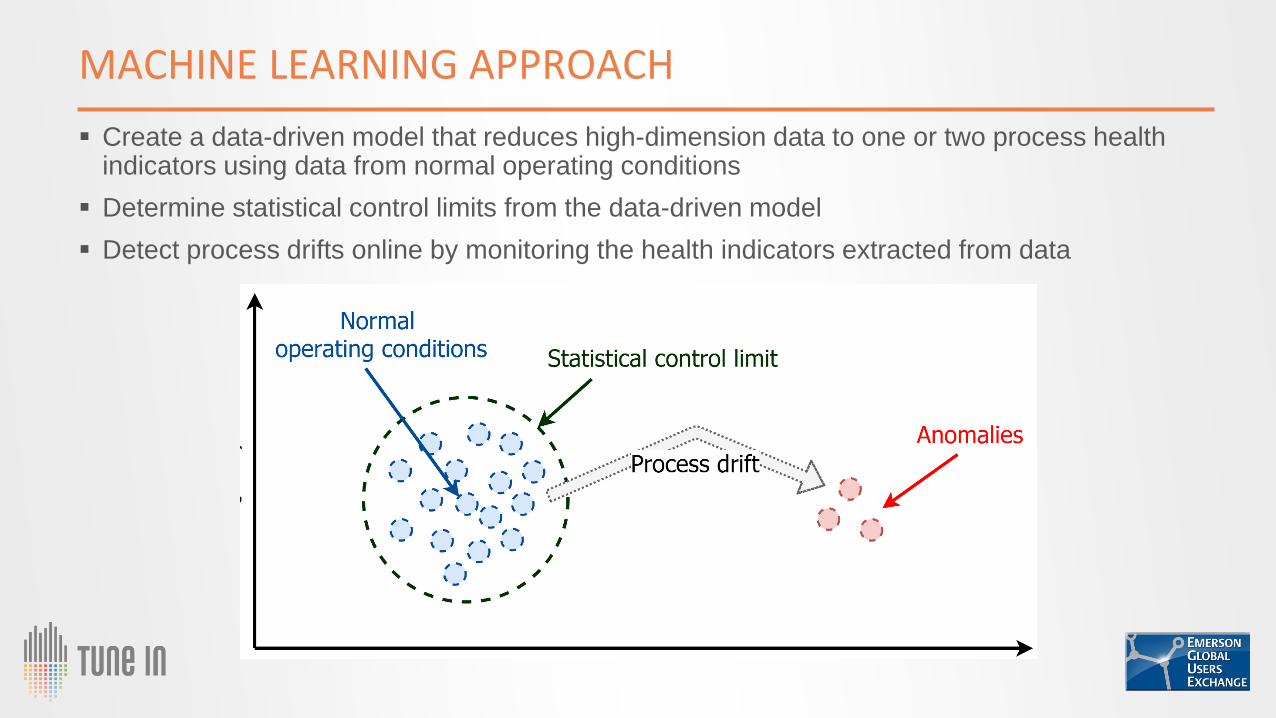
MACHINE LEARNING APPROACH
▪ Create a data-driven model that reduces high-dimension data to one or two process health indicators using data from normal operating conditions
▪ Determine statistical control limits from the data-driven model
▪ Detect process drifts online by monitoring the health indicators extracted from data
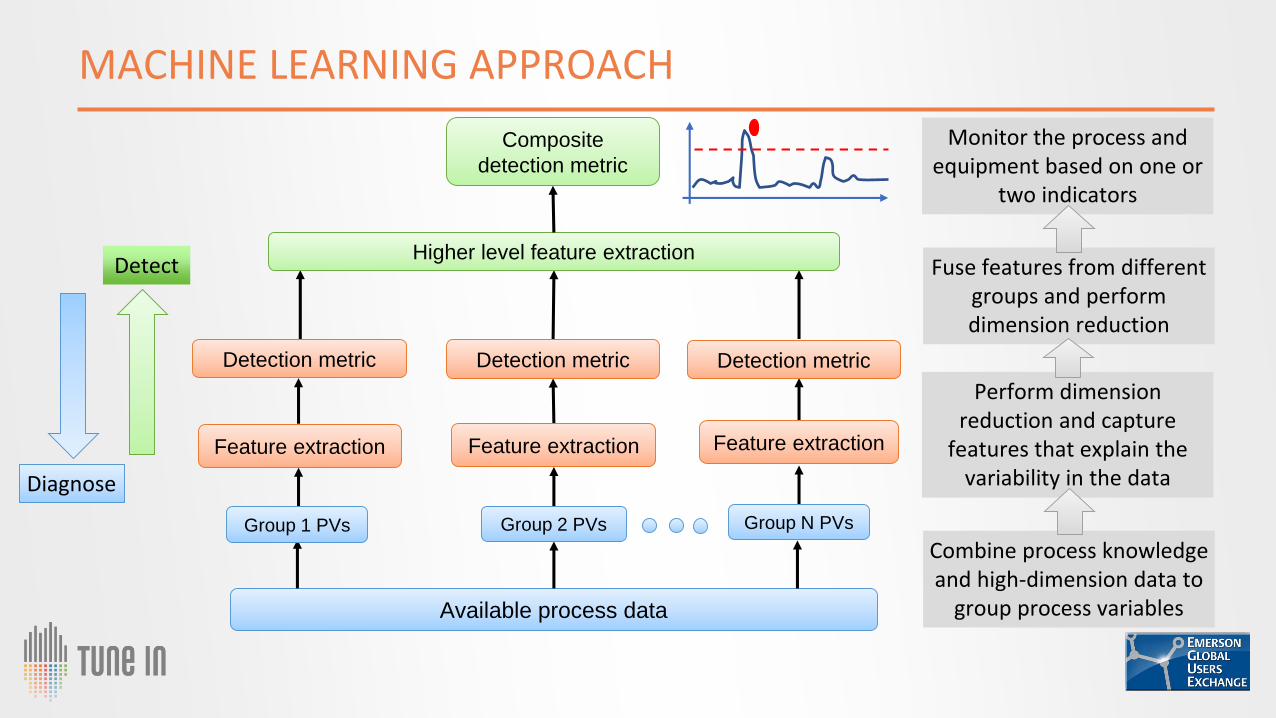
MACHINE LEARNING APPROACH
Higher level feature extraction
Available process data
Feature extraction Feature extraction Feature extraction
Group 1 PVs Group 2 PVs Group N PVs
Detection metric Detection metric Detection metric
Composite
detection metric
Combine process knowledge and high-dimension data to
group process variables
Perform dimension reduction and capture
features that explain the variability in the data
Fuse features from different groups and perform dimension reduction
Monitor the process and equipment based on one or
two indicators
Detect
Diagnose
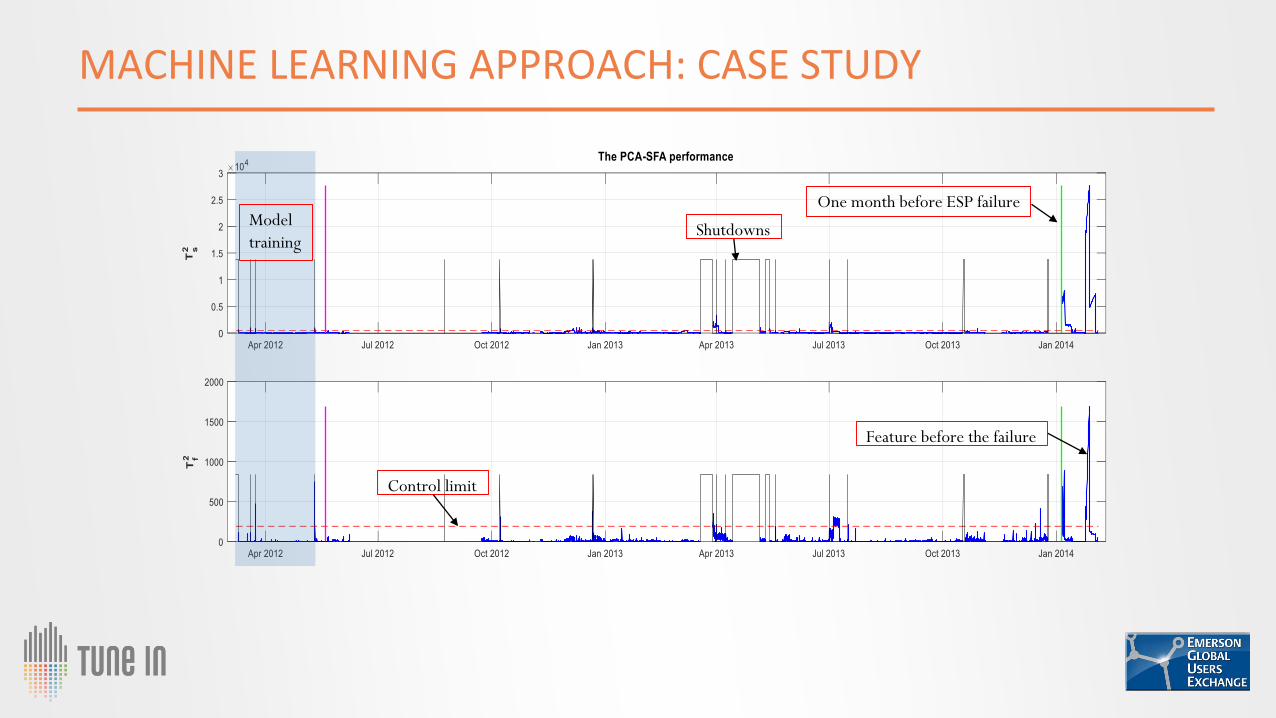
MACHINE LEARNING APPROACH: CASE STUDY
Model
training
One month before ESP failure
Shutdowns
Control limit
Feature before the failure
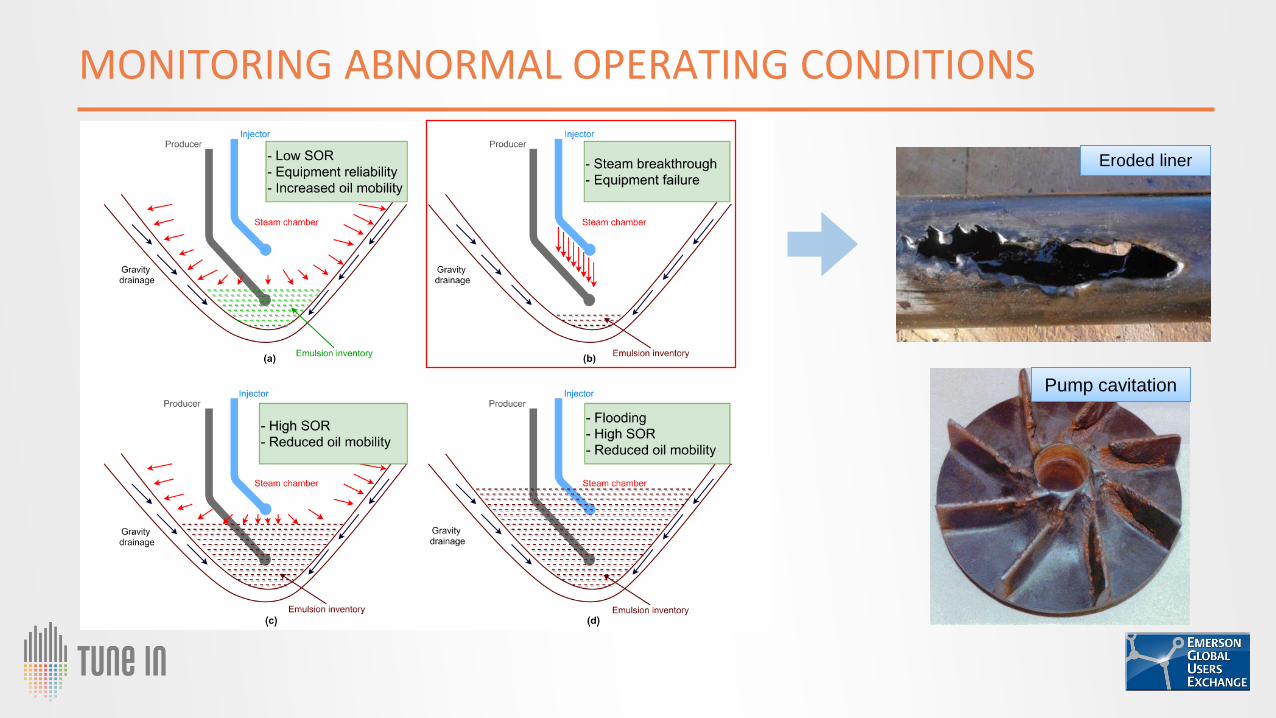
MONITORING ABNORMAL OPERATING CONDITIONS
Eroded liner
Pump cavitation

MACHINE LEARNING TO PREDICT STEAM BREAKTHROUGH
Correlation matrix of
the temperatures
measured along the
wellbore during
normal operation
Heel Toe
Hee
l
To
eH
ee
l
To
e
Heel Toe
Correlation matrix of
the temperatures
measured along the
wellbore just before
the incidents
▪ Patterns in temperature measurements along the
wellbore used to predict some of the abnormal incidents
▪ When steam breaks through some parts of the well,
measured temperatures in those parts tend to have
distinct trends compared to the rest of the well
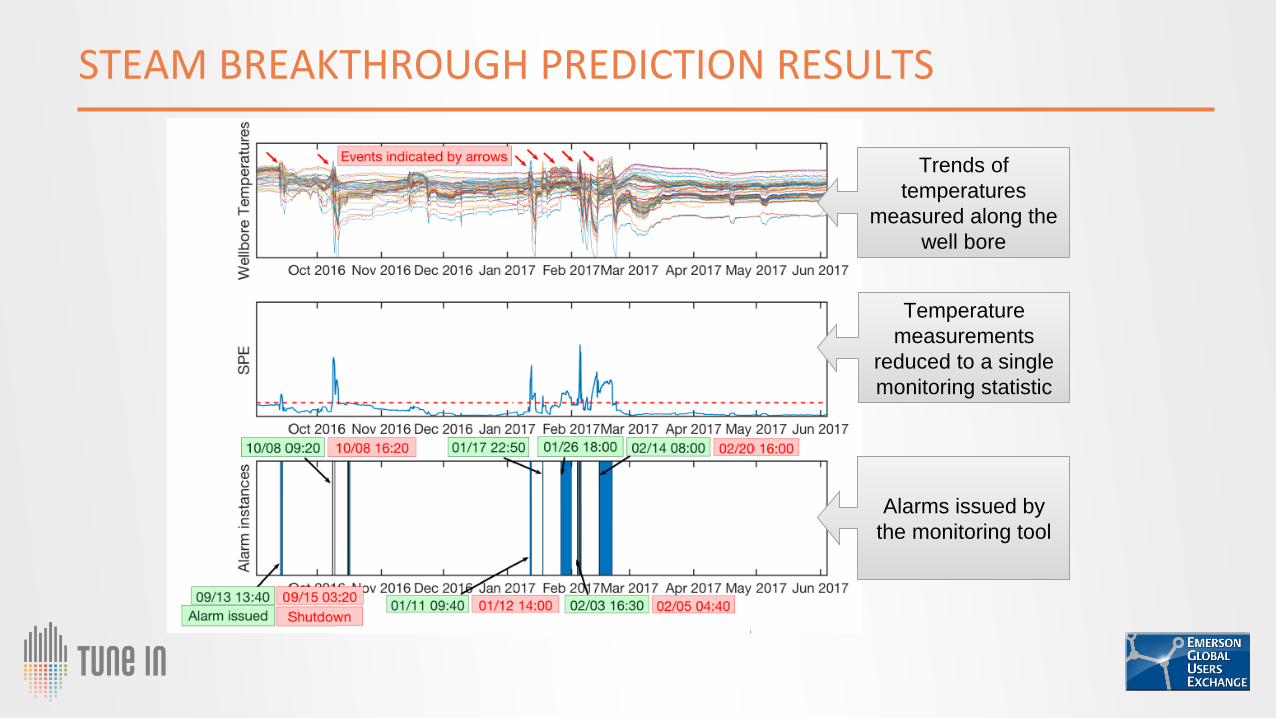
Trends of
temperatures
measured along the
well bore
Temperature
measurements
reduced to a single
monitoring statistic
Alarms issued by
the monitoring tool
STEAM BREAKTHROUGH PREDICTION RESULTS
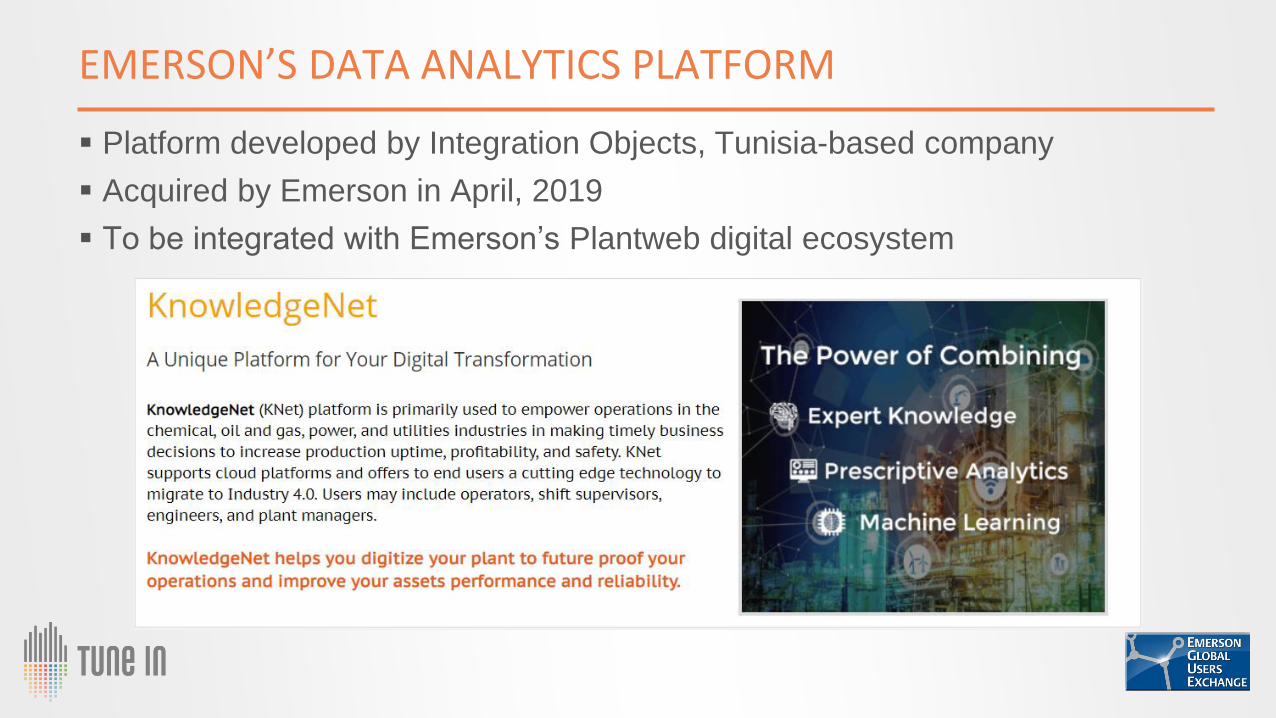
EMERSON’S DATA ANALYTICS PLATFORM
e▪ Platform developed by Integration Objects, Tunisia-based company
▪ Acquired by Emerson in April, 2019
▪ To be integrated with Emerson’s Plantweb digital ecosystem
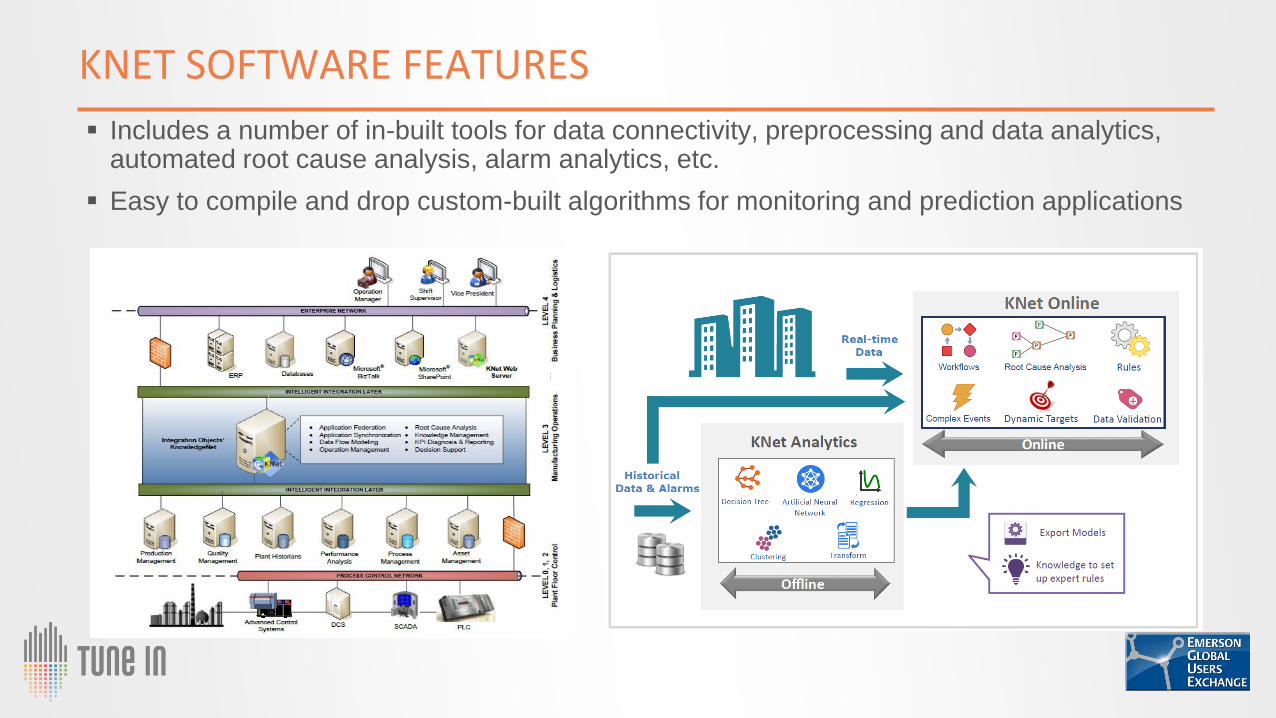
KNET SOFTWARE FEATURES
e▪ Includes a number of in-built tools for data connectivity, preprocessing and data analytics,
automated root cause analysis, alarm analytics, etc.
▪ Easy to compile and drop custom-built algorithms for monitoring and prediction applications
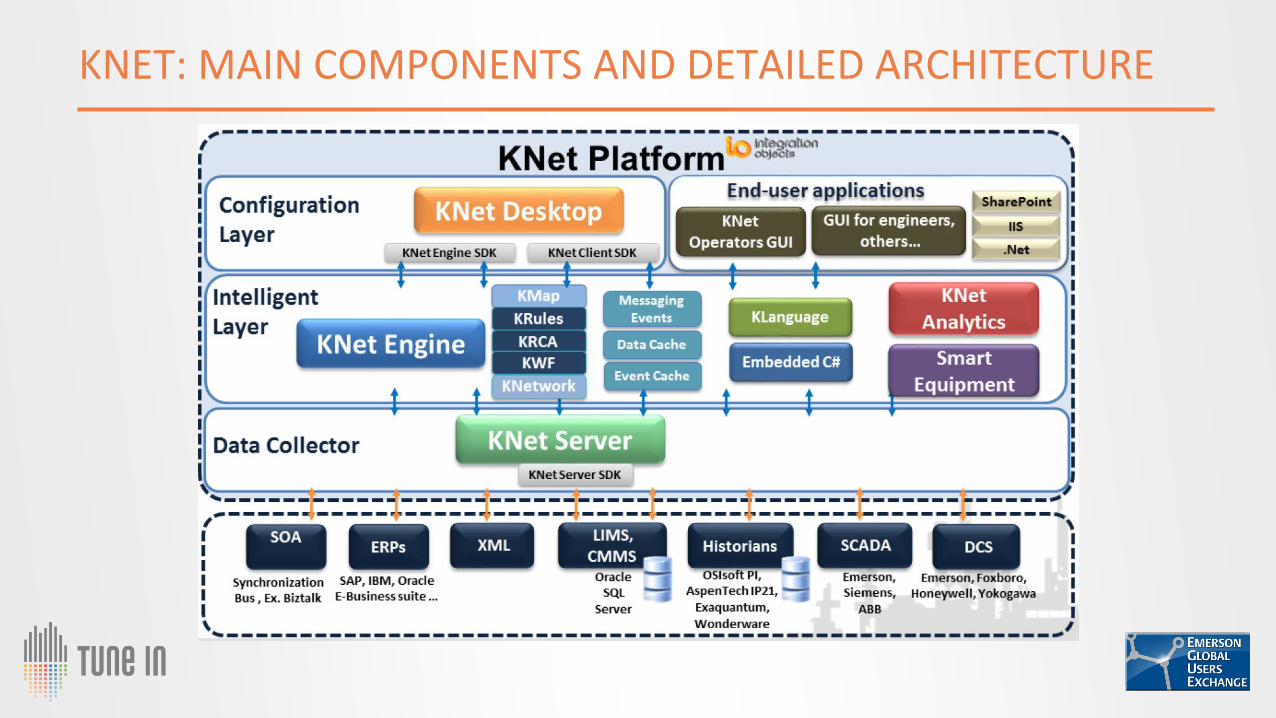
KNET: MAIN COMPONENTS AND DETAILED ARCHITECTURE
e
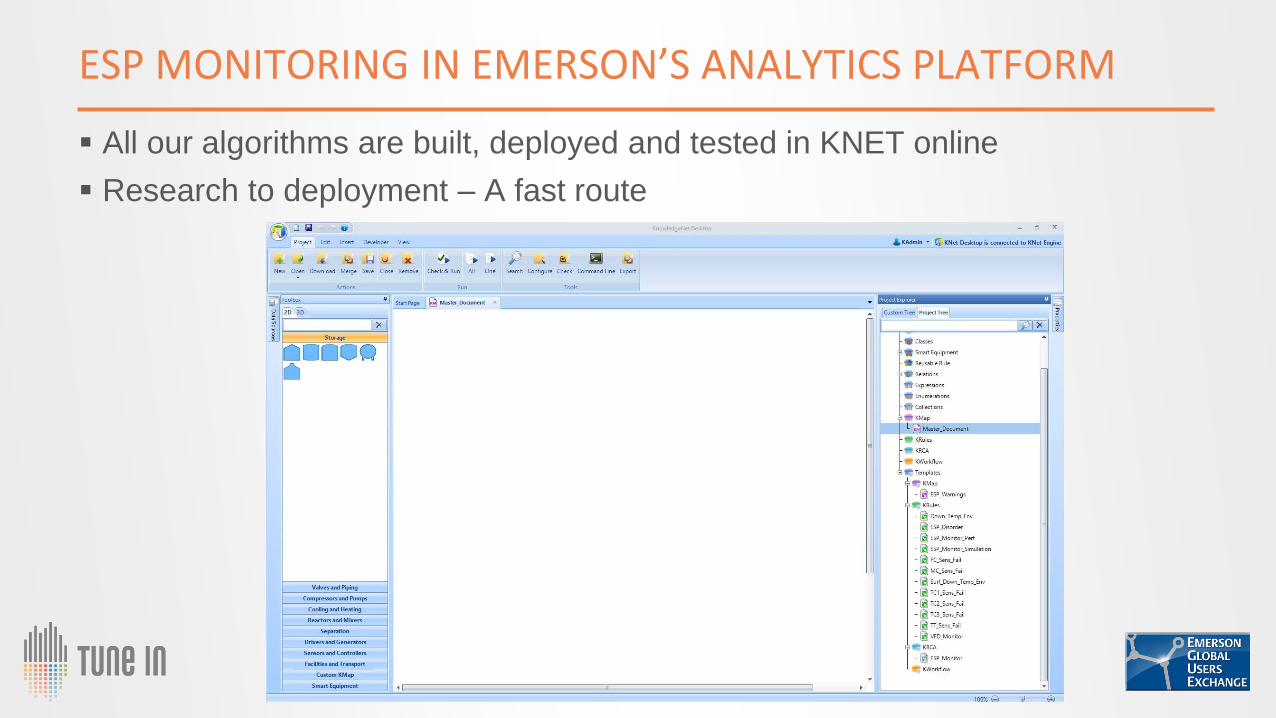
ESP MONITORING IN EMERSON’S ANALYTICS PLATFORM
▪ All our algorithms are built, deployed and tested in KNET online
▪ Research to deployment – A fast route

BUSINESS RESULTS ACHIEVED
• Field Trial:
- The performance monitoring application is currently being field tested with one of the
producers in the province to assess the financial benefits.
• Joint Industrial Project:
- A JIP to study data from multiple ESP installs at multiple producer sites has been initiated
in collaboration with Canadian Oil Sands Innovation Alliance (COSIA)
• Potential benefits:
- There are about 1100 thermal oil wells equipped with ESPs in Alberta
- One less rig over per well on an average can provide over 300 million dollars savings to
the industry

SUMMARY
• Electric submersible pumps (ESPs) are widely preferred artificial lift systems in upstream oil
production
• Keeping the ESPs operational is one of the important challenges faced by the operators
• Under the Industrial Research Chair, we have been investigating a number of different data-driven
algorithms for fault detection, diagnosis and failure prediction of ESPs
• Emerson’s analytics platform with its data connectivity and analytics capability allows taking the
research results to the field in a quick and easy manner
• Field tests are being conducted to properly assess the financial benefits

• Industrial research chair program:
- https://www.ualberta.ca/engineering/research/groups/oil-sands-process-control
• Spartan Controls
- https://www.spartancontrols.com/
• ESP Resources:
- https://www.elsevier.com/books/electrical-submersible-pumps-manual/takacs/978-1-85617-557-9
- http://jip.esprifts.com/
- https://www.onepetro.org/conference-paper/SPE-56663-MS
- https://www.onepetro.org/conference-paper/IPTC-17413-MS
• Analytics platform
- https://www.emerson.com/en-ca/news/corporate/emerson-acquires-knet-software
- https://integrationobjects.com/digital-transformation/products/knowledgenet/
WHERE TO GET MORE INFORMATION

• Presentations will be made available to registered attendees a few weeks after the conference.
• They will be available in emersonexchange365.com. You must be a member of EE365 to access them. Join the community now!
• Attendees will receive an email from the conference organizers when presentations are ready to be downloaded.
WHEN PRESENTATIONS WILL BE AVAILABLE

THANK YOU FOR ATTENDING!Remember to rate this session in the mobile app, and enjoy the rest of the conference!