Embed Size (px)
Citation preview

AN ABSTPACT OF THE THESIS OF
Ralph A. Petereit for the degree of Master of Ocean
Engineering in Civil Engineering presented on
July 28, 1987.
Title: The Static and Cyclic Pullout Behavior of Plate
Anchors in Fine Saturated Sand.
I
Abstract approved:Charles K. Sollitt
Anchors resistant to tensile loads are commonly used
in civil engineering practice. Anchors in the marine
environment are most frequently used for the mooring of
vessels. Only recently, with the expansion of the
offshore industry, has the need to develop more reliable
anchor systems become necessary. Embedded plate anchors
are one such system. The purpose of this study is to
investigate the behavior of plate anchors subjected to
static and cyclic loading.
A review of the different types of marine anchors is
made. A literature review encompassing the examination
of existing static theories and static and cyclic
experimental observations is conducted.
An experimental program has been conducted to
examine the response of circular, square and rectangular
plates to static and cyclic loading. The plate anchors
Redacted for privacy

are embedded in a saturated sand and loaded with an MTS
hydraulic testing apparatus.
It was found that the static pullout behavior is
influenced by pullout rate, depth of embedment, and to a
limited extent, anchor shape. Experimental results show
good agreement with several published theories. Cyclic
pullout behavior is dominated by a continuous
displacement of the anchor through the soil. The rate of
this displacement is governed by the magnitude of the
maximum cyclic load. Anchor displacement is also
influenced by the difference between the maximum and
minimum cyclic load.
THE STATIC AND CYCLIC PULLOUT
BEHAVIOR OF PLATE ANCHORS
IN FINE SATURATED SAND
by
Ralph A. Petereit
A THESIS
submitted to
Oregon State University
in partial fulfillment ofthe requirement for the
degree of
Master of Ocean Engineering
Completed July 28, 1987
Commencement June, 1988

D:
Professor of Ci ii Engineering in charge of major
of Department of Civil Engineering
Dean of Graduaté\ School
Date thesis presented July 28. 1987
Typed by the author for Ralph A. Petereit
Redacted for privacy
Redacted for privacy
Redacted for privacy

ACKNOWLEDGEMENTS
Financial support required for this study was
provided by the United States Coast Guard.
This report was completed by the author under the
guidance of Drs. Charles K. Sollitt and Ted S. Vinson.
Terry Dibble, Dave Standley and Andy Brickinan provided
invaluable technical support in instrumentation, data
acquisition and soil analysis.
TABLE OF CONTENTS
1.0 INTRODUCTION 1
1.1 Motivation 1
1.2 Background 1
1.3 scope 3
2.0 MARINE ANCHOR TYPES 6
2.1 Deadweight Anchors 6
2.2 Fluke Anchors 6
2.3 Mushroom Anchors 8
2.4 Propellant Embedment (Explosive) Anchors 8
2.5 Plate Anchors 102.6 Helix (Auger or Screw-In) Anchors 102.7 Vibratory Anchors 102.8 Pile Anchors 122.9 Hydropin Anchors 122.10 Suction Anchors 122.11 Gravity Anchors 142.12 Padlock Anchors 14
3.0 LITERATURE REVIEW 173.1 Introduction 173.2 Static Pullout Theories 183.3 Static Loading Observations 41
3.3.1 Transition Depth 413.3.2 Density 423.3.3 Overburden Pressure 433.3.4 Stress History 443.3.5 Short-Term Vs. Long-Term Loading 453.3.6 Saturation 473.3.7 Soil Dilatency 483.3.8 Particle Breakage 483.3.9 Soil Disturbance 493.3.10 Anchor Geometry 503.3.11 Plate Roughness 523.3.12 Angle of Inclination 52
3.4 Cyclic Loading Behavior 54
4.0 LABORATORY TEST PROGRAM 604.1 Introduction 604.2 Experimental Setup - Equipment and Apparatus 62
4.2.1 Test Tank 624.2.2 Anchor Design 684.2.3 Anchor Loading System 764.2.4 Data Acquisition 77
4.3 Soil Properties 784.4 Soil Preparation Procedure 784.5 Material Property Repeatability 83
5.0 STATIC LOADING BEHAVIOR OF ANCHOR PLATES IN SAND 865.1 Introduction 875.2 Review of Uplift Theories 885.3 Review of Experimental Observations 915.4 Laboratory Test Program 915.5 Laboratory Test Results 98
5.5.1 Effect of Loading Rate Upon PulloutCapacity 98
5.5.2 Effect of Load Upon AnchorDisplacement 101
5.5.3 Effect of Realtive Depth and AnchorShape 107
5.5.4 Effect of Tie Rod Friction 1105.5.5 Comparison of Static Capacity of
Circular Plates with PublishedTheories 112
5.6 Conclusions 1155.7 Acknowledgements 1165.8 References 1175.9 Notation 119
6.0 CYCLIC LOADING BEHAVIOR OF ANCHOR PLATES IN SAND 1206.1 Introduction 1206.2 Previous Work on Cyclic Loading Behavior 1226.3 Laboratory Test Program 1246.4 Effect of Cyclic Loading on Initial Anchor
Displacement 1276.5 Effect of Loading Frequency on Anchor
Displacement 1286.6 Effect of Cyclic Load on Anchor
Displacement and Pore Water Pressure 1286.7 Effect of Combined Static and Cyclic
Loading on Anchor Displacement and PoreWater Pressure 135
6.8 Conclusions 1386.9 Acknowledgements 1426.10 References 143
7.0 CONCLUSIONS 146
8.0 RECOMMENDATIONS 148
9.0 BIBLIOGRAPHY 149
APPENDIX A LIST OF SYMBOLS 160
APPENDIX B SOIL PROPERTIES 162
APPENDIX C STATIC LOADING DATA 174
APPENDIX D EQUIPMENT SPECIFICATIONS 180
APPENDIX E PERMISSION TO REPRODUCE COPYRIGHT 181MATERIAL
LIST OF FIGURES
FIGURE PAGE
2-1 Types of Deadweight Anchors 7
2-2 Drag Anchor 7
2-3 Propellant Erribedded Anchor - Penetration andKeying 9
2-4 Plate Anchor Erribedinent 11
2-5 Screw-in Anchors 11
2-6 Pile Anchor 13
2-7 Hydropin Anchor 13
2-8 Hydrostatic Anchor 15
2-9 Buried Suction Anchor 15
2-10 Gravity Anchor with Skirts 16
3-1 Shallow Anchor Failure 18
3-2 Deep Anchor Failure 18
3-3 Friction Cylinder Method 20
3-4 weight of Cone Method 20
3-5 Coefficients of Breaking Out Resistance 22
3-6 Shallow Anchor Definition (by Mariupol'skii,(1965) 25
3-7 Deep Anchor Definition (by Mariupol'skii, 1965) 25
3-8 Shallow Anchor Definition (by Matsuo, 1967) 27
3-9 Shallow Anchor Definition (by Meyerhofand Adams, 1968) 31
3-10 Deep Anchor Definition (by Meyerhofand Adams, 1968) 31
3-11 Holding Capacity Factors (by Beard, 1980) 35
3-12 Shallow Anchor Definition (by Sutherland,et al., 1983) 37

FIGURE PAGE
3-13 Deep Anchor Definition (by Sutherland,et al., 1983) 37
3-14 Anchor Failure Definition (by Chattopadhyayand Pise, 1986) 39
3-15 Anchor Failure Definition (by Murrayand Geddes, 1987) 39
3-16 Comparison of Anchor Uplift to AnchorDisplacement for 1.5 in. Diameter Anchors 46
3-17 Relative Anchor Movement as a Function ofNumber of Cycles 57
4-1 Water Inlet and Outlet to Test Tank 64
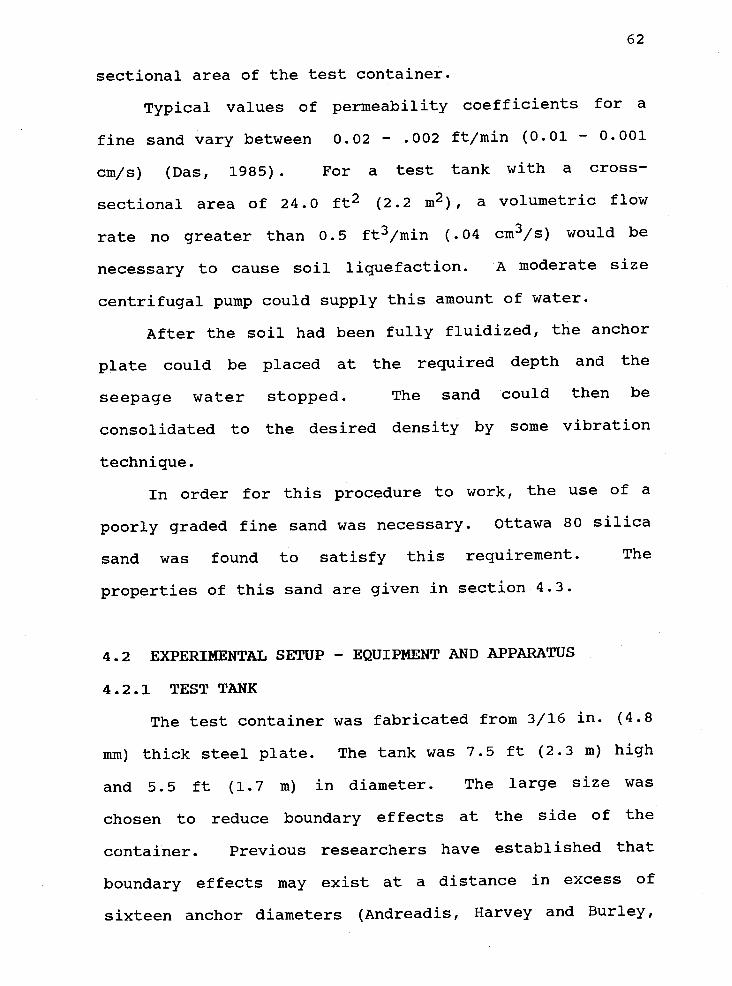
4-2 Water Manifold Piping System Inside Tank 64
4-3 Air Vibrator Mounted on Tank 66
4-4 Coarse Gravel Covering Manifold System 66
4-5 Geotextile in Place 69
4-6 Sand Ready to be Added to Tank 69
4-7 Test Tank Configuration 70
4-8 Center Piece Configuration 72
4-9 Pore Pressure Gauge Dimensions 73
4-10 Anchors, Centerpiece, and Tie Rod 74
4-11 Circular Anchor Attached to Tie Rod 74
4-12 Square Anchor Attached to Tie Rod 75
4-13 Rectangular Anchor Attached to Tie Rod 75
4-14 Data Acquisition Flowchart 79
4-15 Experimental Apparatus 80
4-16 Grain Size Distribution 82
5-1 Anchor Types with Centerpiece 93
5-2 Test Tank Configuration 96
5-3 Experimental Apparatus 99
FIGURE PAGE
5-4 Non-Dimensional Breakout Factor VersusPullout Rate for Circular Plate 100
5-5 Maximum Difference in Pore Water PressureBetween Top and Bottom of Circular PlateVersus Pullout Rate 102
5-6 Typical Anchor Displacement Curves 104
5-7 Circular Anchor Displacement Curves 105
5-8 Effect of Depth upon Anchor Displacement at
Maximum Uplift Resistance 106
5-9 Influence of Depth on Maximum Pullout Load 108
5-10 Breakout Factor Versus Relative Depth 111
5-il Effect of Depth upon Tie Rod FrictionalResistance 113
5-12 Comparison of Experimental Data with PublishedTheories after Deducting Tie Rod Friction 114
6-1 Load-Displacement Plot of First 12 Cycles ofCircular Plate 129
6-2 Effect of Load Period on Anchor Displacement(Load = 75% P) 129
6-3 Effect of Load Period on Anchor Displacement(Load = 50% 130
6-4 Effect of Load Period on Anchor Displacement(Load = 25% 130
6-5 Effect of Load Period on Rectangular AnchorDisplacement (Load = 75% P) 131
6-6 Effect of Load Period on Rectangular AnchorDisplacement (Load = 50% 131
6-7 Effect of Load on Circular Anchor Displacement 133
6-8 Change in Magnitude of the Peak-to-Peak PorePressure Response Above Circular Plate(f = 0.5 Hz) 133
6-9 Change in Magnitude of the Peak-to-Peak PorePressure Response Below Circular Plate(f = 0.5 Hz) 134

FIGURE PAGE
6-10 Difference Between the Maximum Negative PorePressures Above and Below Circular Plate(f = 0.5 Hz) 134
6-11 Effect of Combined Static and Cyclic Load onCircular Anchor Displacement (f = 0.5 Hz,Max Load = 75% P) 136
6-12 Change in Magnitude of the Peak-to-Peak PorePressure Response Above Circular Plate Due toCombined Static and Cyclic Loading (f 0.5 Hz,
Max Load = 75% P) 136
6-13 Change in Magnitude of the Peak-to-Peak PorePressure Response Below Circular Plate Due toCombined Static and Cyclic Loading (f= 0.5 Hz,Max Load = 75% u)
137
6-14 Difference Between the Maximum Negative PorePressures Above and Below Circular Plate Dueto Combined Static and Cyclic Loading(f = 0.5 Hz, Max Load = 75% P) 137
6-15 Effect of Combined Static and Cyclic Load onCircular Anchor Displacement (f = 0.5 Hz,Max Load = 50% 139
6-16 Change in Magnitude of the Peak-to-Peak PorePressure Response Above the Circular PlateDue to Combined Static and Cylic Loading(f = 0.5 Hz, Max Load = 50% P) 139
6-17 Change in Magnitude of the Peak-to-Peak PorePressure Response Below Circular Plate Due toCombined Static and Cyclic Loading(f = 0.5 Hz, Max Load = 50% 140
6-lB Difference Between the Maximum Negative PorePressures Above and Below Circular Plate Dueto Combined Static and Cyclic Loading(f 0.5 Hz, Max Load = 50% P) 140
6-19 Circular Anchor Displacement Due to 50%Double Load Amplitude 141
6-19 Circular Anchor Displacement Due to 25%Double Load Amplitude 141
B-1 Grain Size Distribution Compared withManufacturer's Data 163

I
FIGURE PAGE
B-2 Grain Size Distribution after Fluidizationand Compaction 165
B-3 Friction Angle Versus Confining Stress 171
C-i Load-Displacement Curves for Circular Plate(Deep) 177
C-2 Load-Displacement Curves for Circular Plate(Shallow) 177
C-3 Load-Displacement Curves for Square Plate(Deep) 178
C-4 Load-Displacement Curves for Square Plate(Shallow) 178
C-S Load-Displacement Curves for Rectangular Plate(Deep) 179
C-6 Load-Displacement Curves for Rectangular(Shallow) 179
D-3. Pneumatic Vibrator Vibration Curve 180
D-2 Centrifugal Water Pump Output Curve 180

P1EFACE
This thesis is the result of experimental work
conducted in Graf Hall at Oregon State University during
the years 1986 and 1987. Some of the work was intended
for publication. As such, chapters 5 and 6 are written
to stand alone. Some repetition will be noted. The
references in these chapters are listed at the end of
each chapter. The citations in the remainder of the
text, along with the references cited in the manuscript,
are collected into a comprehensive bibliography at the
end of the thesis.

THE STATIC AND CYCLIC PULLOUT BEHAVIOR OFPLATE ANCHORS
IN FINE SATURATED SAND
1.0 INTRODUCTION
1.1 MOTIVATION
Plate anchors are often embedded in soils to provide
tensile resistance to applied loads. By entraining large
volumes of soil when put under tension, a seemingly small
anchor can resist very large loads. This high holding-
capacity-to-weight ratio feature makes embedded plate
anchors especially suited for buoy moorings. Where the
use of massive deadweight anchors and heavy handling
equipment was once the rule for mooring buoys, embedded
anchors have gained in popularity due to their
simplicity, low weight, low cost and more recently,
reliability. Designed to be nonrecoverable, plate
anchors can be utilized for a wide range of tasks; from
long term mooring support for pleasure vessels and buoys
to temporary supplemental support for semi-submersible
oil platforms during periods of high storm surge.
1.2 BACKGROUND
Anchors resistant to tensile loads have been
utilized for some time and are commonly used in civil
engineering practice. Cable ties are used to support
hanging roofs. Grouted bars and tendons are commonly

2
used for building supports and anchored bulkheads (Hanna,
1982). High mast transmission towers often require
anchors at the corner posts to resist wind loading and
uneven conductor tensions. Uplift loads on very high
towers, such as those spanning rivers, and on towers
which must resist an angle of turn, can often be as high
as 800 kips (Adams and Klym, 1972; Robinson and Taylor,
1969). Smaller antennas and utility poles use anchors
and guy wires to provide tensile support. Helix anchors
are used to support mobile homes during periods of high
winds (Yokel, et al.). Cavern stabilization can also be
achieved through the use of tension anchors in the form
of anchor bars (Benson, et al., 1971).
The U.S. Navy and Marine Corps have needs for high-
capacity anchorages that can be installed by field units
without the use of heavy construction equipment. Some of
the requirements are for shelter tiedowns, plane
tiedowns, winch points for vehicles and suspension
footbridges (Dantz, 1966; Rocker, 1983).
At the Sizewell Nuclear Power Station in England,
cooling water tunnel shafts needed to be raised from
below the seabed, through twenty feet of sand, to the
seafloor. Sutherland (1965) was able to conduct model
anchor pullout tests to determine the required jacking
loads to raise these shafts.
The use of ground anchors, or embedded anchors, has
also been applied to the marine environment. Deadweight
3
and drag anchors have been used by vessels for centuries.
Only recently, with the increase in offshore exploration
and the development of the oil industry, has the need to
develop more reliable anchor systems become necessary.
Today, anchors provide support for many marine
structures, including buoys, oil platforms, drydocks and
submerged pipelines. Plate anchors have even been used
in salvage operations. After the sinking of the Sidney
E. Smith freighter in the St. Clair River off Port Huron
in 1972, anchors were used to clear the vessel from the
channel (Wyclif fe-Jones, 1975).
Due to the varied nature of the support
requirements, many types of anchors and anchor systems
have been developed. Of particular interest is the
embedded plate anchor. Plate anchor systems offer many
desirable features. They can resist large vertical and
horizontal loads (over 100 Rips), thereby enabling
shorter scope moorings and closer stationkeeping. They
do not drag across the bottom. Their weight is low,
simplifying handling. They do not protrude above the
seafloor. They can be installed on slopes and at great
depths (Taylor, 1982).
1.3 SCOPE
The purpose of this report is to investigate the
response of plate anchors to static and cyclic loading.
A laboratory test program is developed to examine the

4
behavior of plate anchors in saturated sand when
subjected to static and cyclic loading. A hydraulic
loading system is used to control the load to the anchor
plates. Data acquisition is achieved through an IBM-XT
personal computer and UnkelscopeTM software.
Circular, square and rectangular plates are used in
this study. These plates are fitted with miniature pore
pressure gauges above and below the plates to measure
pore water response. The soil used consists of a fine
saturated sand. The test container is a large steel
tank.
In part one of this study the effect of anchor
shape, depth, rate of pullout, load and tie rod friction
on the static loading behavior of the anchor plates is
investigated. Loading rates between .0007 in./sec and
0.27 in./sec are examined and anchor depths to 48 in. are
used. The static pullout load as a function of depth is
compared to the theories proposed by Balla (1961),
Mariupol'skii (1965), Matsuo (1968), Meyerhof and Adams
(1968), Sutherland, Finley and Fadl (1983), Murray and
Geddes (1987), Chattopadhyay and Pise (1986) and NCEL
(Beard, 1980).
In part two of this study the effect of frequency of
loading and cyclic load, represented as a percent of the
ultimate static load, on anchor pullout behavior is
examined. Sinusoidal loading frequencies between 1.0 and
2 Hz are used on plates embedded at a depth/anchor

5
diameter ratio of 9.
Static loading results indicate an increase in
ultimate uplift capacity with increasing depth and the
existence of a transition depth between a shallow and
deep anchor at a depth/diameter ratio of 9. Pullout
rate, along with the rod friction, can have an influence
on uplift capacity. A comparison of experimental data
for the circular plate with published theories shows good
agreement with Sutherland, et al. (1983), Murray and
Geddes (1987) and Chattopadhyay and PISO (1986).
Cyclic loading results with the circular plate
indicate a faster displacement with higher loads. When
the maximum cyclic load is kept constant and the minimum
load is varied, those cases where the minimum loads are
lower display a higher displacement rate. Pore pressure
values above and below the anchor indicate an initial
decreasing dynamic response which is dependant upon the
magnitude of the cyclic load. This response reaches a
constant value shortly after the commencement of loading
and continues until accelerated anchor pullout occurs.

2.0 MARINE ANCHOR TYPES
There are many types of anchors and anchor systems
in existence today. Most have been developed for a
specific purpose and to take advantage of the
geotechnical properties of the soil in which they will be
used. This chapter briefly reviews the features of the
most common anchors used in the marine environment.
2.1 DEADWEIGHT ANCHORS
A deadweight anchor (Fig. 2-1) consists of a dense
and heavy mass, usually steel or concrete, that is placed
on the seafloor to resist vertical and small horizontal
loads. Its ability to resist uplift loading is generally
equal to the submerged weight of the object. Although
they are simple to construct, deadweight anchors have
small holding-capacity-to-weight ratios. For instance, a
concrete anchor will moor less than three-tenths of its
in air weight. For this reason they are rarely used when
the required holding capacity exceeds 1500 lbs.
2.2 FLUKE ANCHORS
Fluke anchors (Fig. 2-2), also called drag or burial
anchors, are mainly used to resist lateral loads. The
anchor consists of a shank and usually two flukes which
penetrate into the sea bottom when the shank is pulled
laterally across the soil's surface. Fluke anchors can

(a) Sinker (b) Squat clump (c) Railroad rails or (d) Concrete slab withscrap iron sliest keys
effcient uplift * low overturning ow bulk, high high lateral capacity
easy to handle . mote area con- weight SCOUT Control
tacting soil low cost
SIt) Mushroom (g) Wedge (h) Slanted skirt (i) High lateral capacity,
(rCc fall
shallow burial shallow burial deeper burial free fall installation
low overturning uni-directional high lateral capacity
uni-directional
(ci Open frame withwcillhtcd corners
high lateral Capacityrrducrd lowering linedynamic tensionsshallow burial
r(j) Free fall
(DELCO
free fall installationefficient uplift
7
Fig. 2-1 Types of Deadweight Anchors (froni Taylor, 1982)
mooringmooring Lu.. line
mooring un. resting on abovescafloor sea!inor
p.
Fig. 2-2 Drag Anchor (from Rocker, 1985)
be placed in tandem to increase their holding power.
They are not very effective in resisting vertical loads
and become impractical in deep water due to the great
length of mooring line required to maintain a horizontal
load vector at the shank.
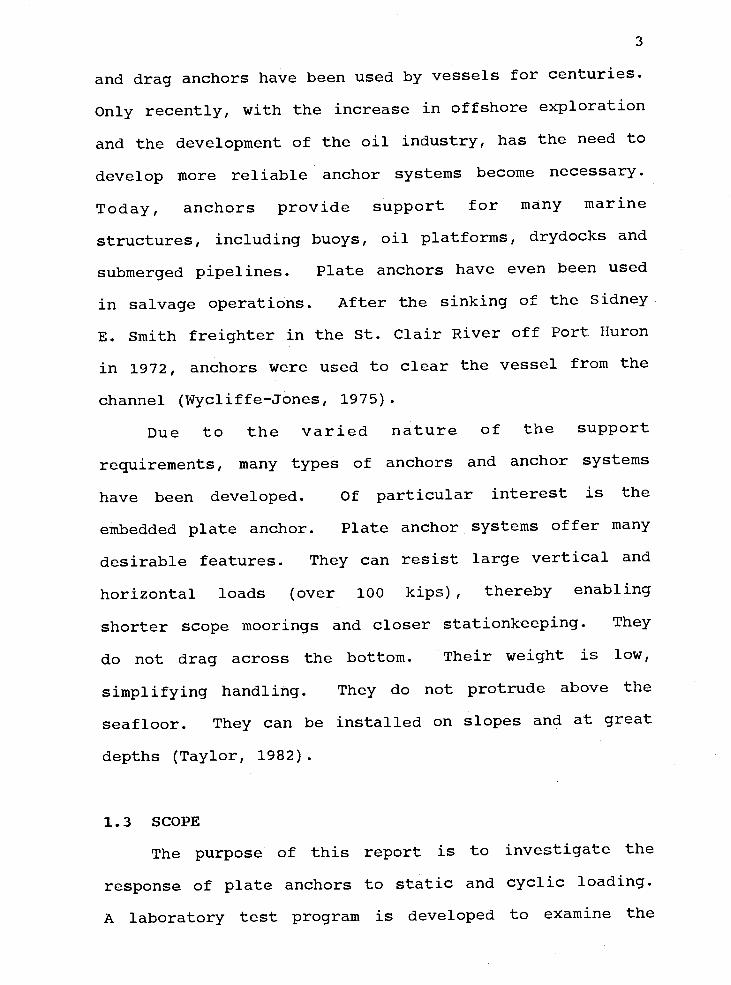
2.3 MUSHROOM ANCHORS
Mushroom anchors are bowl-shaped weights used mainly
in f.ine-grained soils. When placed on the seafloor, the
anchor sinks under its own weight thereby using the soil
above it to increase its uplift capacIty. This anchor
can also be dragged across the bottom to aid in its
embedment.
2.4 PROPELLANT EMBEDMENT (EXPLOSIVE) ANCHORS
These anchors consist of various shaped projectiles
which are driven into the soil by the use of explosives
(Fig. 2-3). The anchor is allowed to fall to the ocean
bottom where, upon contact, an explosive device
detonates, driving the anchor at high velocity into the
soil. The anchor is then rotated or "keyed" to present
its greatest bearing area to the soil surface. These
anchors have a very high holding-capacity-to-weight ratio
and can, if properly designed, even be driven into rock
and coral. The ordnance required for these anchors can
make them dangerous, however.

(j'H
D
thestabied
-keying
penetration
Fig. 2-3 Propellant Embedded Anchor - Penetrationand Keying (from Beard, 1980)

10
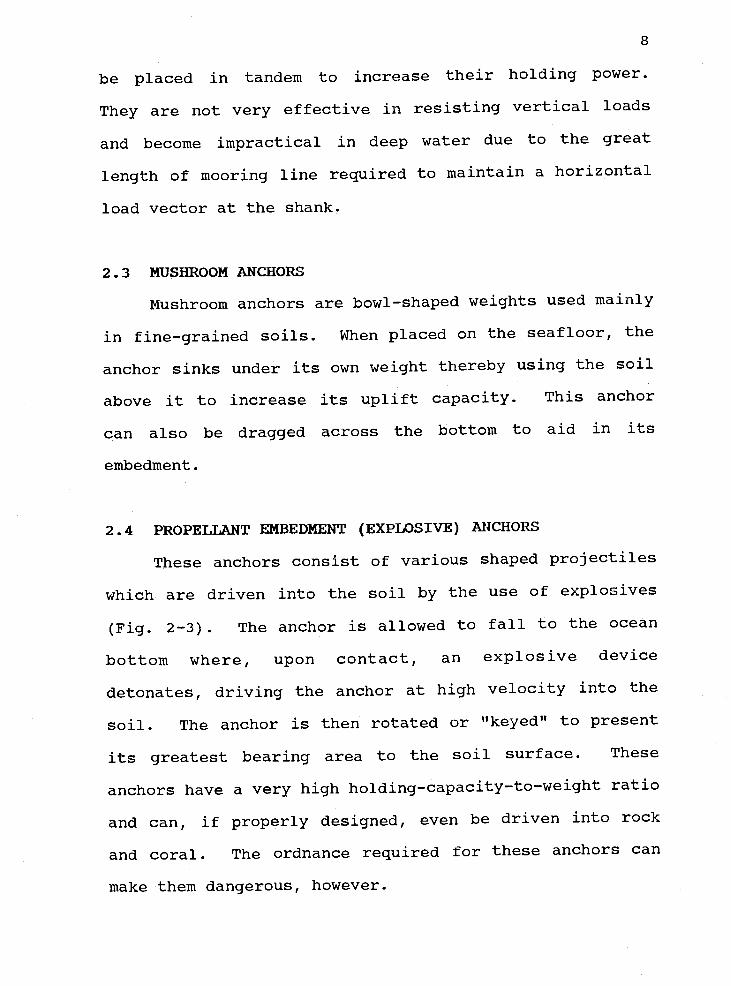
2.5 PlATE ANCHORS
Plate anchors (Fig. 2-4) are made up of various
shaped plates which are embedded edgewise into the seabed
by jets of water, air or a combination of both, or by the
use of a driving rod. When the plate reaches the desired
depth, it is rotated in the same manner as the explosive
anchor. This anchor also provides a high holding-
capacity-to-weight ratio.
2.6 HELIX (AUGER OR SCREW-IN) ANCHORS
These anchors consist of a shaft with helical
surfaces that can be screwed into the soil (Fig. 2-5).
They can only be used in shallow water where they are
easily controlled, although some have been tested to
depths of 500 feet. They are most commonly used to
anchor pipelines to the seafloor.
2.7 VIBRATORY ANCHORS
A vibrated anchor consists of a vibrator mounted on
a shaft with an attached fluke assembly. Counter-
rotating eccentric masses provide the vibration and the
vibrator is either electrically, pneumatically or
hydraulically driven. Upon contact with the seabed, the
anchor is vibrated to the required depth. Holding
capacities for these anchors can reach 40 kips in sand
and 25 kips in soft clays and clayey silts (Beard, 1973).
A disadvantage of this system is the long time required
11
I t I
\\ W
(a) Anchor driving U,) Driving rod removal (ci Anchor keying Id) Position of maximumcapacity
Fig. 2-4 Plate Anchor Embedment (from Rocker, 1983)
1
load
single ç
Hhelix
cmultihelix
II
(a) Types Ib) Screwing into ground (ci Final position
Fig 2-5 Screw-in Anchors (from Rocker, 1983)
12
to embed this anchor (up to 30 minutes). Since the
development of the propellant embedded anchors, the
vibratory anchors have not seen much use.
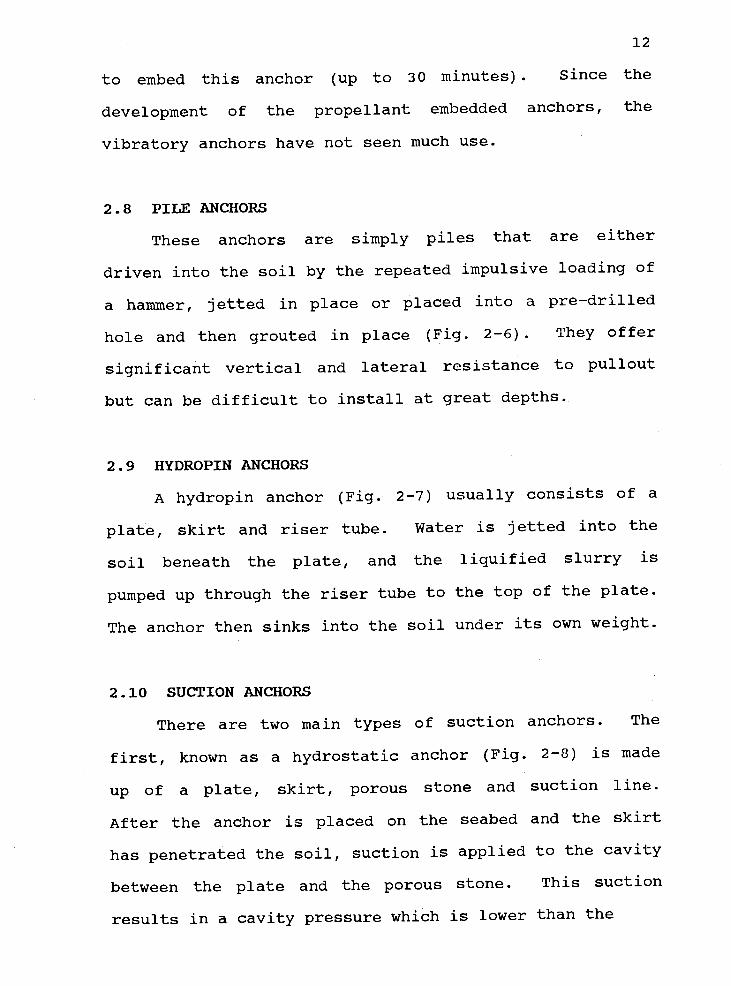
2.8 PILE ANCHORS
These anchors are simply piles that are either
driven into the soil by the repeated impulsive loading of
a hammer, jetted in place or placed into a pre-drilled
hole and then grouted in place (Fig. 2-6). They offer
significant vertical and lateral resistance to pullout
but can be difficult to install at great depths.
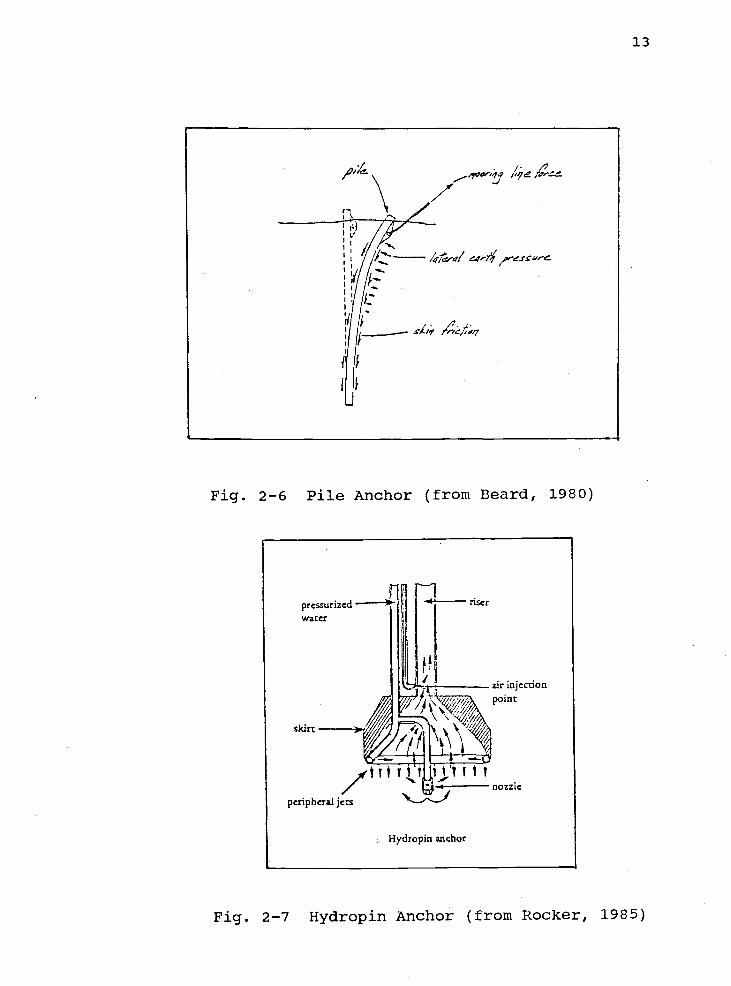
2.9 HYDROPIN ANCHORS
A hydropin anchor (Fig. 2-7) usually consists of a
plate, skirt and riser tube. Water is jetted into the
soil beneath the plate, and the liquified slurry is
pumped up through the riser tube to the top of the plate.
The anchor then sinks into the soil under its own weight.
2.10 SUCTION ANCHORS
There are two main types of suction anchors. The
first, known as a hydrostatic anchor (Fig. 2-8) is made
up of a plate, skirt, porous stone and suction line.
After the anchor is placed on the seabed and the skirt
has penetrated the soil, suction is applied to the cavity
between the plate and the porous stone. This suction
results in a cavity pressure which is lower than the
13
_,Vf
/ /i:
Ii
/ Ii--.
4/a'
lull
Fig. 2-6 Pile Anchor (from Beard, 1980)
r 1prcssurized riser
water
I- - ar injection
skirt
t t t T
peripheral jets
Hydropin anchor
Fig. 2-7 Hydropin Anchor (from Rocker, 1985)

14
surrounding hydrostatic pressure.
The other type is a buried suction anchor (Fig. 2-
9). It is installed by jetting water into the underlying
soil. After penetration to the desired depth, suction is
applied within the anchor. For both types of anchors,
the suction force keeps the anchor clamped to the soil.
These anchors work best in cohesionless soil and provide
short-term vertical resistance.
2.11 GRAVITY ANCHORS
Gravity anchors (Fig. 2-10) are essentially large
deadweight anchors used mainly with tension leg
platforms. The anchor consists of a shell which is
manufactured on land then towed to the anchor site. It
is then filled with a ballasting material and allowed to
sink to the ocean bottom.
2.12 PADLOCK 1NCHOR
The padlock anchor was developed by the Naval Civil
Engineering Laboratory (NCEL) to provide for a fixed
point mooring in the deep oceans. It consists of a
tripodal frame and three articulated bearing pads.
Embedment anchors are used with the system to increase
the holding power and "lock" the bearing pads to the
ocean bottom.

15
Force
Lifting HarnessAmbientPressure(P )a Pmp
Porous Stone
____________ _____________ Discha roe
Anchor Cavity
Pressure
/
Pressure underStone (P5)
Skirt
P <P <Pa s c
Fig. 2-8 Hydrostatic Anchor (as per Wilson andSahota, 1980)
Force
JetSupply SuctionLine Line
Filter
Jets0. $
0.40.
0.2 sP
Fig. 2-9 Buried Suction Anchor (as per Wang, Nacciand Deniars, 1975)

16
Force
Envelope
Bal1astigMaterial
4
Skirts
Fig. 2-10 Gravity Anchor with Skirts
Further descriptions, advantages and disadvantages
along with expressions for uplift and breakout capacities
of each anchor type may be found in Taylor, Jones and
Beard (1979), Beard (1980), Taylor (1982), and Datta and
Singh (1984).

17
3.0 LITERATURE REVIEW
3.1 INTRODUCTION
The ultimate uplift capacity of an embedment anchor
is defined as the magnitude of the force necessary to
completely withdraw an anchor from the soil in which it
is embedded. There are five main components that make up
this force; effective anchor weight, effective weight of
the soil, shear resistance along failure lines, adhesion
and cohesion (Vesic, 1971). The most difficult component
to determine is the effective weight of the soil mass
being pulled out. This is because in order to find the
volume of soil, the exact shape of the failure surface
must first be determined. Most theories therefore,
center around trying to define this failure surface.
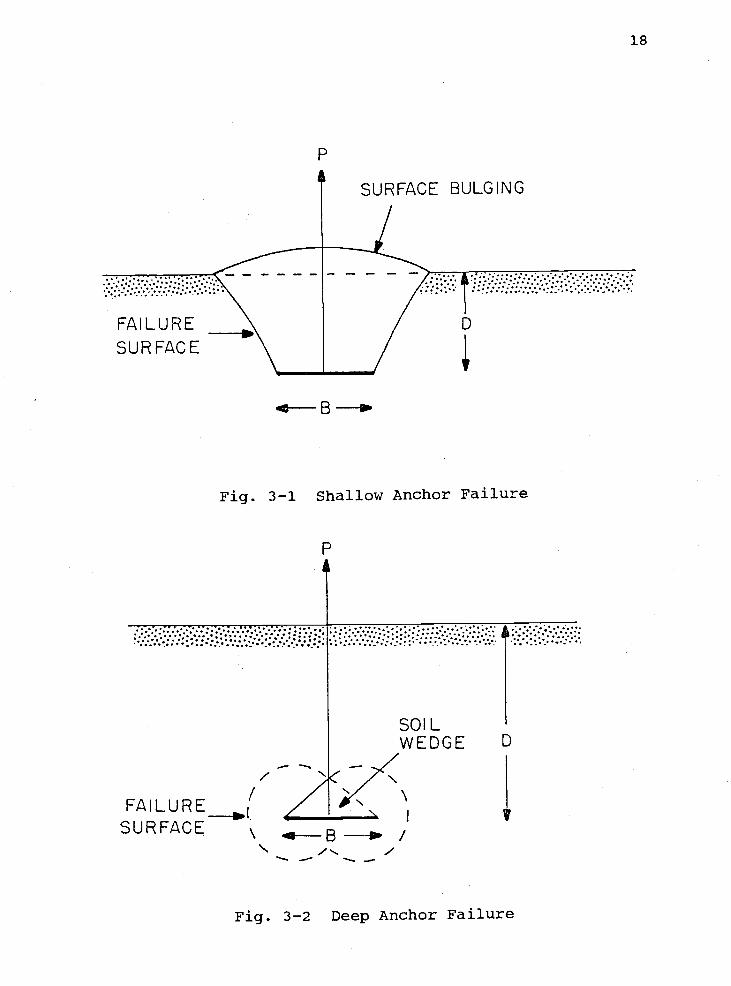
One of the most significant parameters used in
determining anchor pullout capacity is the depth of
embedment. An anchor is said to be "shallow" if bulging
of the soil's surface occurs as the anchor is vertically
displaced. An anchor is said to be "deep" if no bulging
is observed. When a deep anchor is displaced, soil flows
from above to below the anchor, unaffected by the surface
boundary.
The reason for the distinction between deep and
shallow anchors is because the modes of failure of each
are different and require separate analysis. Figs. 3-1
and 3-2 illustrate these two types of failure modes.
SURFACE \ B- /
- - -
SURFACE BULGING
-r
Fig. 3-1 Shallow Anchor Failure
Fig. 3-2 Deep Anchor Failure

19
3.2 STATIC PULLOUT THEORIES
One of the earliest methods used to describe
ultimate pullout capacity is the earth pressure or
friction cylinder method (Fig. 3-3). In this method, the
assumed failure surface extends vertically from the edge
of the anchor to the soil's surface. The pullout
capacity is then defined to be the sum of the weight of
the soil above the anchor and the frictional force of the
soil acting along the failure surface. This method is
generally valid only in loose soil. In addition, the
actual shear failure of the soil mass is not taken into
account and there is no provision made for cohesion
forces.
Another theory is the weight of cone method (Fig.
3-4). This method assumes that the failure surface is an
inverted truncated cone which intersects the soil's
surface at an angle of 45° - p/2, where is the soil's
internal angle of shearing resistance (angle of
friction). The pullout capacity is the weight of the
soil within this cone. A variation of this theory
provides for the inclusion of shearing resistance along
the soil's sliding surface. Limitations of this theory
include an inability to account for the proper soil
failure surface and the exclusion of cohesion forces.
Balla (1961) developed a systematic analysis of

20
Fig. 3-3 Friction Cylinder Method
P
\
w
F\\\
Fig. 3-4 weight of Cone Method
21
shallow anchor failure by first determining the shape of
the soil's failure surface. Mushroom foundations were
placed in a dry sand near a glass plate and loaded to
failure. The failure surfaces were then observed. From
these observations Balla determined that the meridian
section of the failure surface was part of a circle that
begins perpendicular to the anchor plate at its edge and
extends toward the surface, intersecting at an angle of
approximately 450 - p/2. The total pullout resistance
was determined by calculating the weight of the soil
within the failure volume, the difference between the
shaft weight and the soil weight that it displaces, the
anchor slab weight and the shearing resistance along the
failure surface. Balla made an approximate calculation
of this shearing resistance by using Kätter's equation
for the case of a circular sliding line and by assuming a
plane stress state. For the case of a dry cohesioniess
soil, he determined the total pullout resistance to be:
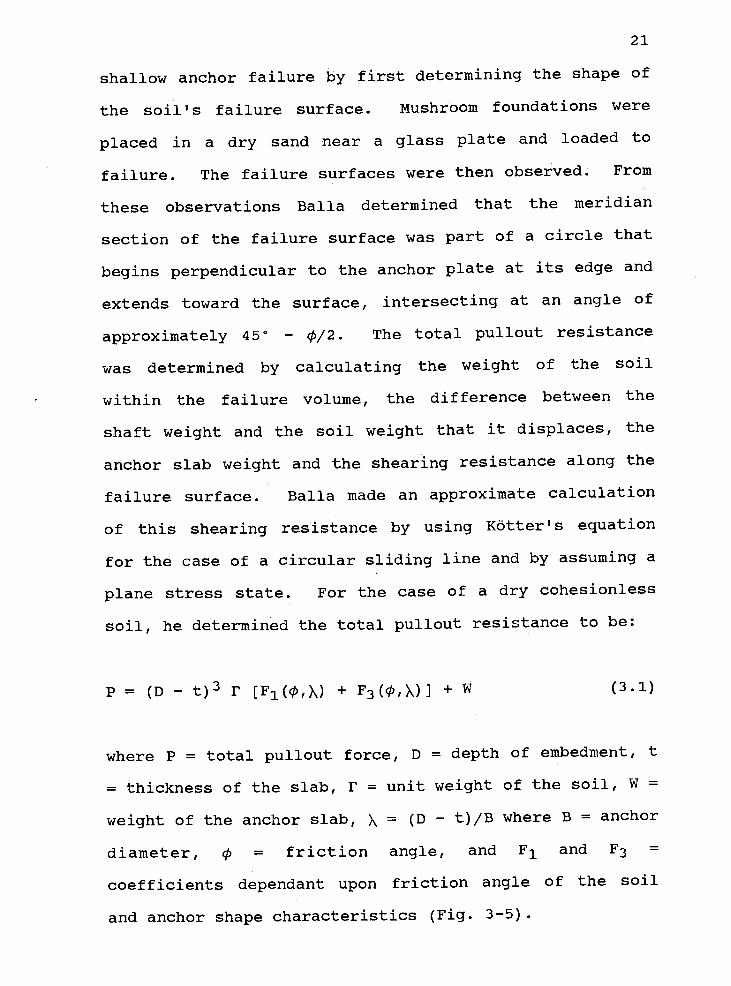
P = (D - t)3 r [F1(4) + F3(p,)] + W (3.1)
where P = total pullout force, D = depth of embedment, t
thickness of the slab, r = unit weight of the soil, W =
weight of the anchor slab, >, = (D - t)/B where B = anchor
diameter, 'p = friction angle, and F1 and F3 =
coefficients dependant upon friction angle of the soil
and anchor shape characteristics (Fig. 3-5).

2.4
2.2
2.0
1.6
1.4CY)
LL
r1.2
Ev)
I.
0.4
0.2
1.0
0 15 25 35
Friction Angle, çb
Fig. 3-5 Coefficients of Breaking Out Resistance(Balla, 1961)
45
1.2
1.4
1.6
1.8
2.0
2.2
2.4
2.6
3.0
4.0
22
A

23
Balla's model experiments in air dry sand showed
good agreement with his theory for a depth/diameter ratio
of less than four.
Mariupol'skii (1965), in his studies of shallow
anchors, noted that soil compacted above the anchor as it
was being loaded. At first the displacement was limited
to the cylindrical column of soil directly above the
anchor and diminished toward the surface. As the loading
increased and the anchor began displacing, soil adjacent
to this column was entrained by the effects of friction
and cohesion. As the limiting value of soil shear stress
was reached, tensile stresses caused the soil within the
wedge to separate from the surrounding soil mass at its
interface. The failure surface formed a cone with a
curvilinear generatrix, extending from the anchor to the
soil's surface (Fig. 3-6).
Mariupol'skii found that full scale tests and model
experiments confirmed his hypothesis of tensile failure.
He then defined shallow anchor ultimate pullout capacity
to be:
lrr 1rD[l-(B0/B)2 + 2KD/Btan] + 4cD/B
P = W+ 1B2-B021 (3.2)J 1 - (B0/B)2 - 2nD/B
where B0 = shaft diameter, K = coefficient of lateral
earth pressure, c = cohesion, and n = O.0025 (an
experimentally determined shape factor where çt' is in

24
degrees).
For deep anchors, Mariupol'skii assumed that failure
is accompanied by bulging of the soil into the cavity
which is formed below the anchor plate. As a limiting
condition is reached, the conical wedge of soil above the
anchor forces the soil above it to the sides and below
the anchor. The anchor then displaces at an almost
constant load.
To determine this load, he assumed that the work
required to displace the anchor a vertical distance s is
equivalent to the work required to expand a cylindrical
cavity of radius B0/2 and height s to radius B/2 (Fig. 3-
7). Mariupol'skii then determined the ultimate pullout
capacity for the deep anchor case to be:
pr (B2 -B02)
P W + + frBQL (3.3)
4(l-O.5tan)
where p = radial pressure required to expand the
cylindrical cavity, f =unit skin resistance along the
stem of the anchor and L = length of the shaft.
In his studies on the uplift loading of transmission
tower footings, Matsuo (1967) developed a theory to
determine the ultimate uplift capacity of shallow
foundations in dry soils. He assumed that as a soil mass
failed in shear due to the uplift loading of a footing,
the earth pressure condition changes from a semi-active
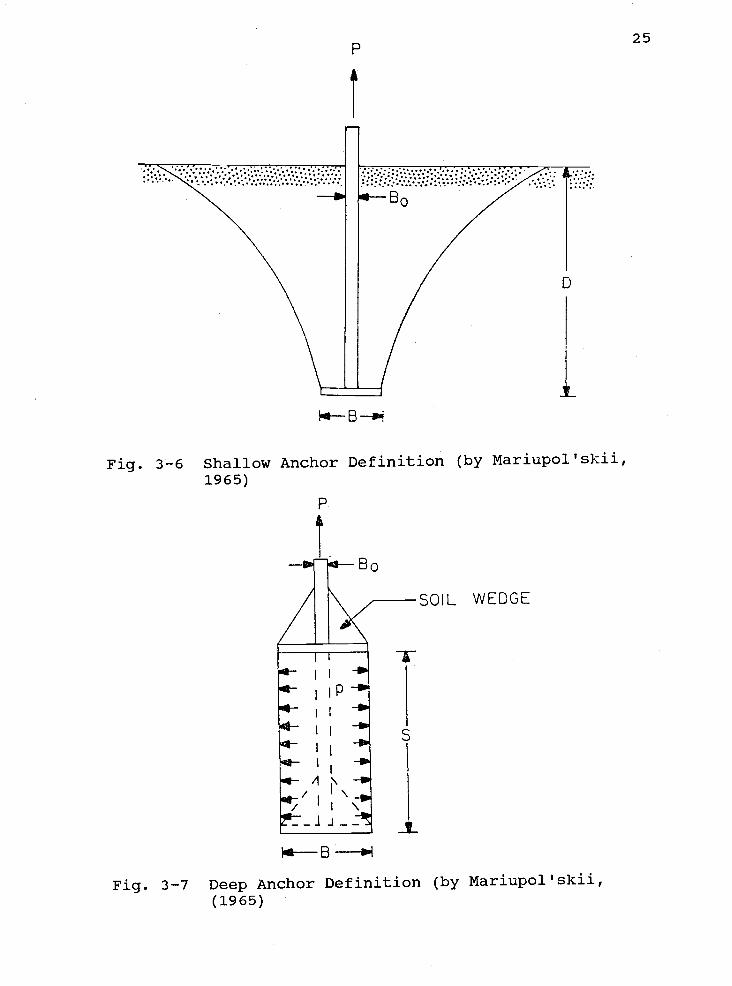
Fig. 3-6 Shallow Anchor Definition (by Mariupol'skii,1965)
P
SOIL WEDGE
I I
-II
-II
1
Fig. 3-7 Deep Anchor Definition (by Mariupol'skii,(1965)
25

26
condition near the footing to a passive condition at the
soil's surface. The soil's failure surface was then
assumed to be a combination of a logarithmic spiral and a
tangential straight line. Fig. 3-8 shows a definition
s]cetch of anchor failure by Matsuo. By summing the
moments due to the forces acting on the failed soil
volume about the center of the logarithmic spiral, and
setting them equal to zero, he determined the uplift
pressure on the footing. Other spirals were also
investigated, with the actual failure occurring along the
surface corresponding to the lowest footing uplift
pressure. After extensive analysis, Matsuo determined
the ultimate uplift capacity of a circular foundation to
be:
P = W + r(B23K1 - V3) + cB22K2 (3.4)
where: K1 = irf(a-l) (a2F1+aF2+abF3+bF4+F5+b)) (3.4.a)
K2 = ir[(a-l)(aF6+F7) + b(btana +2)) (3.4.b)
a and b = coefficients of the sliding surface, B2 = the
horizontal distance between the center of the shaft and
the junction between the logarithmic spiral and the
tangential straight line, V3 = volume of the footing
shaft, a = (450 + /2), and Fi (1 = 1 to 7) are
functions given in his paper.
Matsuo realized that calculating the pullout

27
I
Fig. 3-8 Shallow Anchor Definition (by Matsuo, 1967)
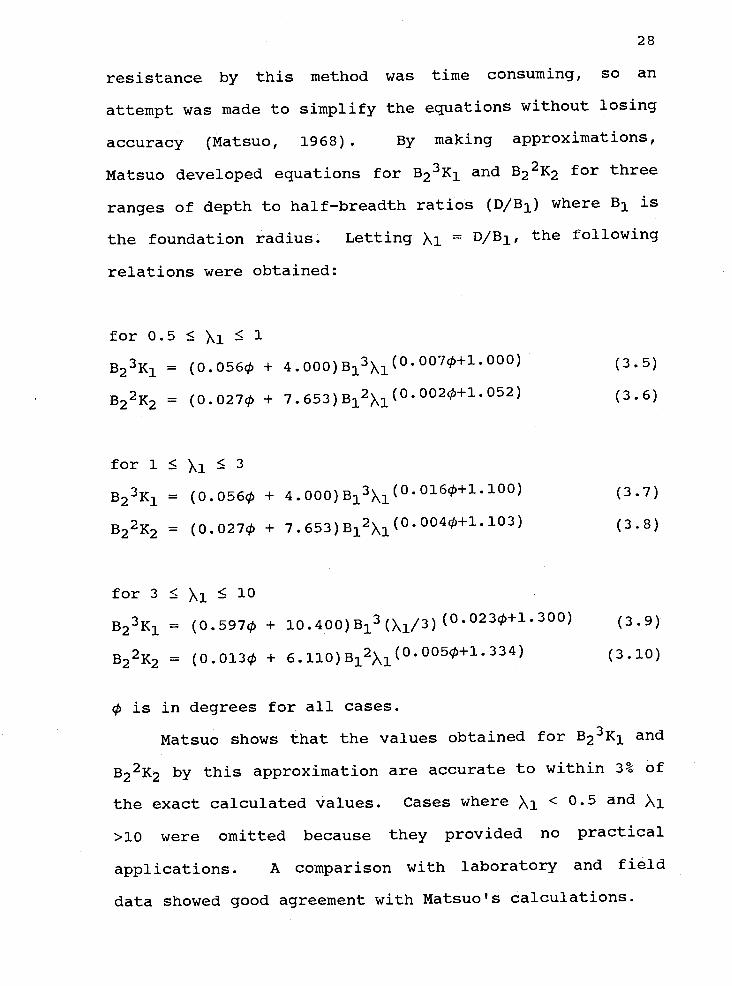
resistance by this method was time consuming, so an
attempt was made to simplify the equations without losing
accuracy (Matsuo, 1968). By making approximations,
Matsuo developed equations for B23K1 and B22K2 for three
ranges of depth to half-breadth ratios (D/B1) where B1 is
the foundation radius. Letting X1 = D/B, the following
relations were obtained:
for 0.5 Xi 1
B23K1 = (O.O56 + 4.00O)B13X1(°°°7'P"°°°) (3.5)
B22K2 = (O.0274 + 7.653)Bi2>l(002l52) (3.6)
for 1 S Xi 3
B23K1 = (O.056q + 4.00O)B13>1(°°'61--°°) (3.7)
B22K2 = (O.O27 + 7.653)B12X1(°°4P]"3) (3.8)
for 3 Xi 10
B23K1 (0.5974 + l0.400)B13(X1/3)(°°231"300) (39)
B22K2 = (0.0i3q + 6.iiO)B12X1(°-°°5-334) (3.10)
is in degrees for all cases.
Matsuo shows that the values obtained for B23K1 and
B22K2 by this approximation are accurate to within 3% of
the exact calculated values. Cases where < 0.5 and
>10 were omitted because they provided no practical
applications. A comparison with laboratory and field
data showed good agreement with Matsuo's calculations.

29
Meyerhof and Adams (1968) conducted model tests to
determine the uplift resistance of footings with special
reference to transmission tower footings. During these
tests they noted that the observed soil failure surfaces
were complex in nature. Simplifying assumptions about
the actual failure surfaces were made to develop a
general theory of uplift capacity. They assumed that the
failure surface extended vertically from the edge of the
footing to the soil's surface. The shearing resistance
on this surface could then be obtained by determining the
cohesion and passive earth pressure of the soil (Fig. 3-
9)
For footings at shallow depth, the following
equations for maximum uplift capacity were derived:
Strip Footing
P=2cD+rD2Ktanp+w (3.11)
Circular Footing
P = ircBD +s(7r/2)rBD2Ktan + W (3.12)
Rectangular Footing
P = 2cD(B+L) + I'D2 (2sB+LB)Kutan + W (3.13)
where Ku nominal uplift coefficient of earth pressure
on the vertical plane through the footing edge (about
0.95 for sand), s = shape factor (1 + mD/B) with a

30
maximum of (1+xnH/B) where H is the limiting depth of
shallow anchor failure, and in is a coefficient dependant
upon the friction angle (given in Table 3.1).
TABLE 3.1FRICTION ANGLE COEFFICIENTS
Friction Angle 20° 25° 30° 35° 40° 45° 48°
Coefficient in .05 .10 .15 .25 .35 .50 .60
Limiting H/B 2.5 3.0 4.0 5.0 7.0 9.0 11.0
Maximum s 1.12 1.30 1.60 2.25 3.45 5.50 7.60
For footings at great depth, Meyërhof and Adams
noted that the failure surface was prevented from
reaching the soilts surface by the compressibility and
deformation of the soil mass above the footing. Above a
certain depth, H, the failure surface ceases to exist
and additional resistance is provided by the surcharge
pressure of the soil above the failure surface (Fig. 3-
10). Eqs. 3.11, 3.12, and 3.13 were therefore modified
to include the surcharge pressure of the soil above the
failure surface arid provide the uplift capacity of deeply
buried footings.
Strip Footing
P = 2cH + F(2D-H)HKtanp + W (3.14)

3]-
I
-:i
1
Ii
Fig. 3-9 Shallow Anchor Definition (by Meyerhof andAdams, 1968)
_ B _Fig. 3-10 Deep Anchor Definition (by Meyerhof and
Adams (1968)
32
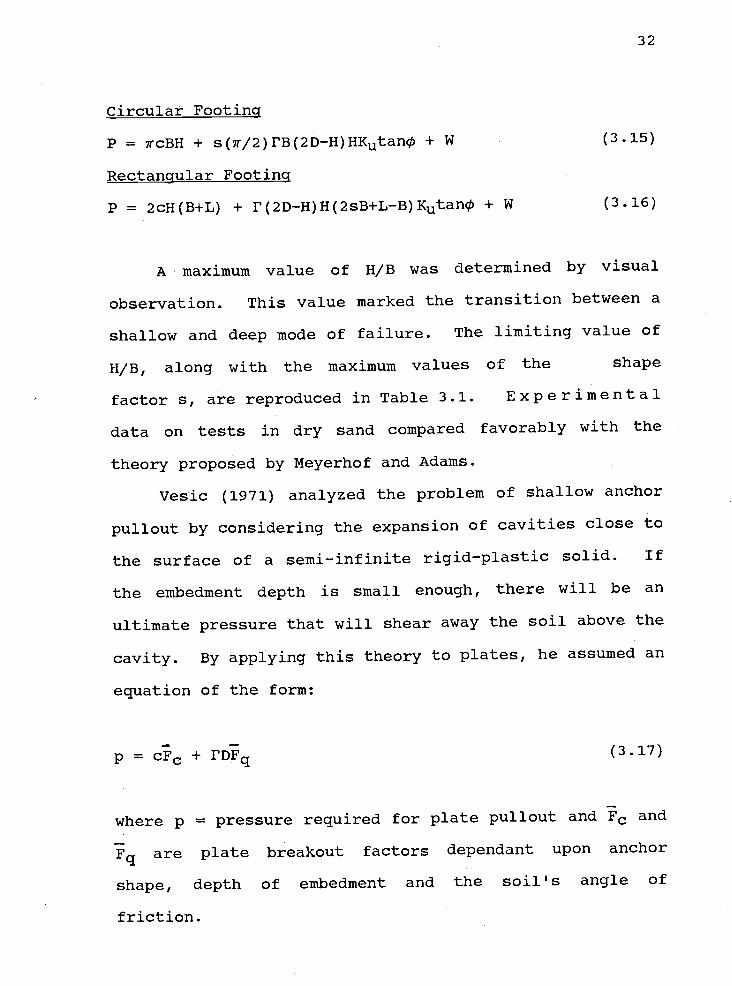
Circular Footing
P = ircBH + s(1r/2)rB(2D-}I)HKtan + W (3.15)
Rectangular Footing
P = 2cH(B+L) + r(2D-H)H(2sB+L-B)Ktanp + W (3.16)
A maximum value of H/B was determined by visual
observation. This value marked the transition between a
shallow and deep mode of failure. The limiting value of
H/B, along with the maximum values of the shape
factor s, are reproduced in Table 3.1. Experimental
data on tests in dry sand compared favorably with the
theory proposed by Neyerhof and Adams.
Vesic (1971) analyzed the problem of shallow anchor
pullout by considering the expansion of cavities close to
the surface of a semi-infinite rigid-plastic solid. If
the embedment depth is small enough, there will be an
ultimate pressure that will shear away the soil above the
cavity. By applying this theory to plates, he assumed an
equation of the form:
PCFc+1'DFq (3.17)
where p = pressure required for plate pullout and and
Fq are plate breakout factors dependant upon anchor
shape, depth of embedment and the soil's angle of
friction.

33
If the soil is cohesionless, the first term on the
right side of Eq. 3.17 drops out, leaving only p = FDFq.
Rearranging and separating the area from the pressure
term results in Fq = P/(rAD).
The problem then becomes one of finding appropriate
values of i and Fq. Calculated values for the breakout
factors (see Vesic, 1971 or Esquivel DIaz, 1967 for
numerical values) do not agree well with observed data.
Eq. 3.17 is still used however, but more often with
experimentally obtained breakout factors.
Vesic's (1971) solution for deep anchor pullout
resistance is similar to IIariupo1'skii's but was
developed more rigorously. Using his work with spherical
cavity expansion, Vesic used a modified form of equation
3.17 that included cylindrical cavity expansion factors,
F and F4 in lieu of plate breakout factors. These
factors depend upon anchor depth, soil density, cohesion,
angle of friction and the shear modulus of the soil.
This solution is based on the assumption that no volume
change occurs in the plastic zone surrounding the cavity.
These factors are very close to the point bearing
capacity factors of deep foundations. Eq. 3.17 rewritten
for deep anchors becomes:
p cF + rDF4 (3.18)
where F4 = (l+sin) (IrSec)(1' (3l8a)
= G/(C+rDtan) (a rigidity index) (3.l8.b)

34
G = shear modulus of the soil
F = (F4-i)cot (3.18.c)
The Naval Civil Engineering Laboratory (NCEL)
defines anchor holding capacity using dimensionless
factors in a manner similar to Vesic's method (Beard,
1980). Holding capacity factors are used to quantify the
friction and cohesion effects on static pullout. In
addition, a shape factor term from Skempton (1951) is
included to correct the equation for use with rectangular
anchors. The general equation for uplift capacity
according to NCEL is:
P A(cNc + r'DNq) (0.84 + 0.16 B/L) (3.19)
where N and Nq are holding capacity factors reproduced
in Fig. 3-li.
Sutherland, Finlay and Fadi (1983) developed a
pullout theory based upon extensive laboratory testing of
circular disks in dry sand. The tests were conducted at
various relative densities and ranges of depth/diameter
ratios up to 25. While they found that the soil's
failure surface for the shallow anchor case is generally
curved, the authors assumed that it could be approximated
by an inclined straight line extending from the anchor to
the soil's surface (Fig. 3-12). An approximate theory
was developed using empirical factors, the weight of the
soil within the failure volume and the shearing

Will
c:r
04)U
>)
U(0ci.
(0C.)
0I-
0=
10
1
(
I I I
350 -
14
Relative Embedment Depth, D/B
Fig. 3-11 Holding Capacity Factors (by Beard, 1980)
()01
36
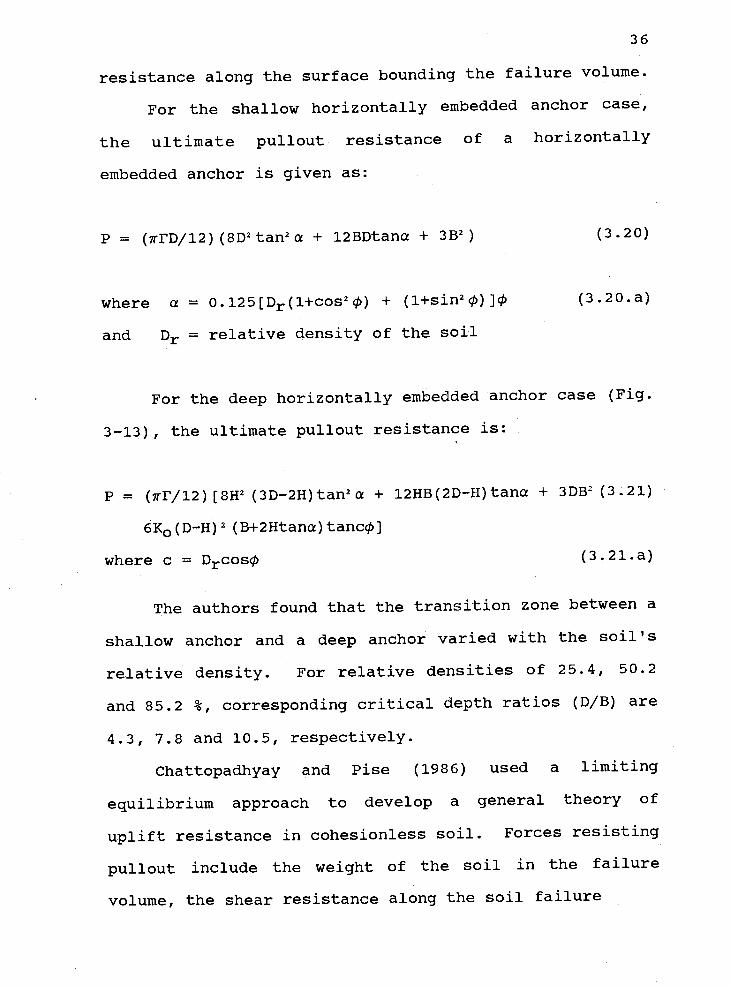
resistance along the surface bounding the failure volume.
For the shallow horizontally embedded anchor case,
the ultimate pullout resistance of a horizontally
embedded anchor is given as:
P = (irrD/12)(8D2tan2a + l2BDtana + 3B2) (3.20)
where a = O.l25[Dr(l+cos2b) + (l+sin2)] (3.20.a)
and Dr = relative density of the sOil
For the deep horizontally embedded anchor case (Fig.
3-13), the ultimate pullout resistance is:
P (nT/l2)8H2 (3D-2H)tan2a + 12HB(2D-H)tana + 3DB2 (3.21)
6K0 (D-H)2 (B+2lltana) tanc]
where c = DcOsq (3.21.a)
The authors found that the transition zone between a
shallow anchor and a deep anchor varied with the soil's
relative density. For relative densities of 25.4, 50.2
and 85.2 %, corresponding critical depth ratios (D/B) are
4.3, 7.8 and 10.5, respectively.
Chattopadhyay and Pise (1986) used a limiting
equilibrium approach to develop a general theory of
uplift resistance in cohesionless soil. Forces resisting
pullout include the weight of the soil in the failure
volume, the shear resistance along the soil failure

37
Fig. 3-12 Shallow Anchor Definition (by Sutherland,et al., 1983)
Fig. 3-13 Deep Anchor Definition (by Sutherland,et al., 1983)
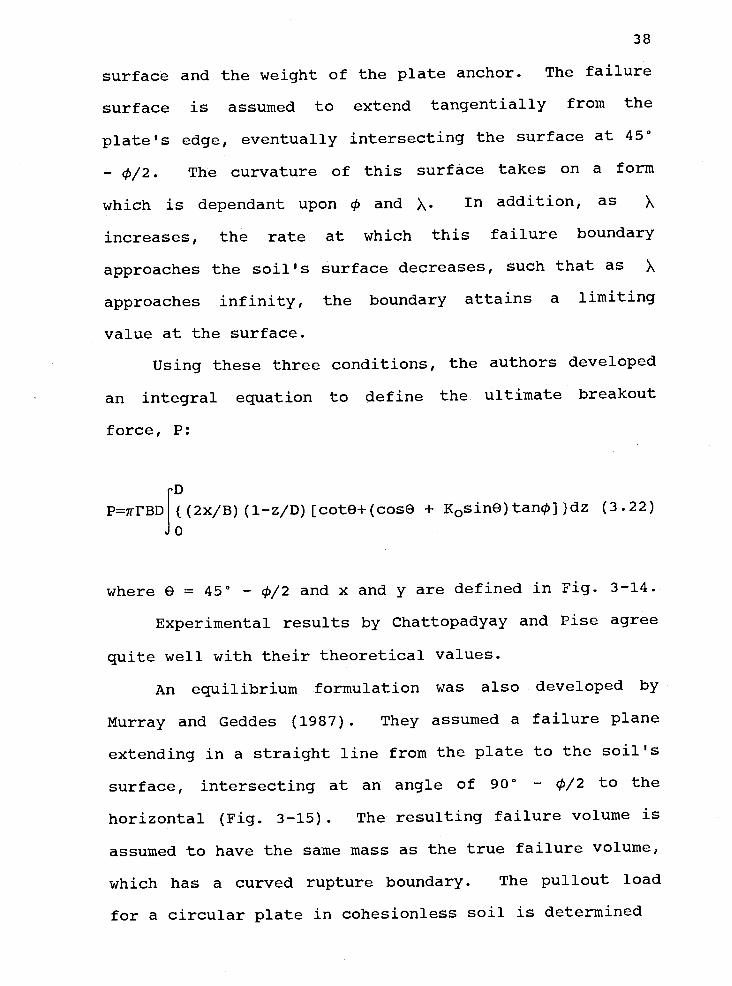
surface and the weight of the plate anchor. The failure
surface is assumed to extend tangentially from the
plate's edge, eventually intersecting the surface at 45°
- /2. The curvature of this surface takes on a form
which is dependant upon q and X. In addition, as X
increases, the rate at which this failure boundary
approaches the soil's surface decreases, such that as X
approaches infinity, the boundary attains a limiting
value at the surface.
Using these three conditions, the authors developed
an integral equation to define the ultimate breakout
force, P:
1D
P=IrFBDI { (2x/B) (l-z/D) [cote+(cose + K0sinO)tanJ }dz (3.22)
Jo
where e 45° - 0/2 and x and y are defined in Fig. 3-14.
Experimental results by Chattopadyay and Pise agree
quite well with their theoretical values.
An equilibrium formulation was also developed by
Murray and Geddes (1987). They assumed a failure plane
extending in a straight line from the plate to the soil's
surface, intersecting at an angle of 90° - 0/2 to the
horizontal (Fig. 3-15). The resulting failure volume is
assumed to have the same mass as the true failure volume,
which has a curved rupture boundary. The pullout load
for a circular plate in cohesionless soil is determined

39
Ii} B-WI
Fig. 3-14 Anchor Failure Definition (by Chattopadhyayand Pise, 1986)
A PP R OX I M AT E D
FAILURES U R FL C E
j I P
rçj
4- B -.1
Fig.3-15 Anchor Failure Definition (by Murray andGeddes, 1987)

40
from the following relationship:
P I'AD [l+2(D/B)(sin + sin(/2))(l+(2D/3B) (3.23)
tan(/2) (2-sin))]
This theory compared well to the authors' data from
experimental pullout tests in dense sand, but yielded
results for medium dense sand which were high.
It appears from this review that there is no
universally agreed upon theory to define the ultimate
vertical pullout capacity of embedded anchors. This is
because it is extremely difficult to predict the geometry
of the soil failure surface and to develop relationships
that apply to all soils under every conceivable
condition. Most theories seem to work well only on the
types of soils under investigation by the authors.
An analysis of the shallow anchor case is made
difficult by a lack of understanding of how soil stresses
interact with the seabed surface boundary.
For the deep anchor case, the analysis may not be as
difficult if the assumption is made that the anchor
behaves similar to a deep foundation, distributing
stresses above the plate in a continuous, homogeneous and
isotropic soil that is unaffected by the soil's surface
boundary. An analysis of the ultimate load bearing
capacity of deep foundations can be found in Meyerhof
(1976) or Vesic (1977).

41
3.3 STATIC LOADING OBSERVATIONS
In contrast to rigorous theoretical development,
many experimenters try to study only a few of the
parameters that influence anchor uplift capacity. Some
experiinentalists use regression analysis to generate
equations that will describe their observations. Most of
these equations are good only for a specific model or
soil. Others strive to determine breakout factors that
will satisfy Eqs. 3.17 and 3.18. There are numerous
factors that influence anchor uplift capacity. These are
discussed and identified with published experimental
observations.
3.3.1 TRANSITION DEPTH
The transition depth is the distance below the
soil's surface at which an anchor's failure mode changes
from shallow to deep. It is characterized by the
critical depth ratio D/B and depends heavily upon
relative density. An anchor is said to be shallow when
any anchor displacement results in an elevation change at
the soil's surface. In this case an anchor fails in
general shear. In a general shear failure, a well-
defined failure pattern exists which consists of a slip
surface that extends from the anchor's edge to the soil's
surface. An anchor is said to be deep when no surface
effects are seen when the anchor is displaced. In this
latter situation, the failure pattern is not easily

42
observed. The failure mode for deep anchors has been
compared to the punching shear failure seen in deep
foundations (Vesic, 1963, 1971). Many experiments have
been conducted to define the transition point between a
shallow and a deep anchor.
Baker and Kondner (1966) and Esquivel Diaz (1967)
conducted model tests in dense sand and found that
bulging of the soil surface occurred when D/13 < 6. Healy
(1971) used spherical anchors and found that the
transition zone was D/B < 6 for dense sands but D/B < 2
for loose sand. Beinben, Kalajian and Kupferman (1973)
studied anchors in moist and saturated sand and clay and
found the transition point to be D/B = 4 for both.
Clemence and Veesaert (1977) conducted model tests in
dense sand and discovered a "definite change in the
failure mode" at D/B = 5. Andreadis, Harvey and Burley
(1981) define an anchor to be shallow when D/B < 8.
Sutherland, Finley and Fadl (1983) found that the
transition point could be as high as D/B = 12 for a
relatively dense soil.
3.3.2 DENSITY
Soil density has a marked effect on uplift capacity.
It is universally accepted that an anchor embedded in
dense soil will have a higher uplift capacity than one
embedded in loose soil. The degree of difference is
dependent upon relative density and angle of friction.
43
Well documented studies verifying increased uplift
capacity in dense soil can be found in Sutherland (1965),
Healy (1971), Adams and Hayes (1967), Esquivel Diaz
(1967), Ovesen (1981) and Murray and Geddes (1987).
Kenanyan (1966) attributed this rise in capacity to a
higher friction angle, a decreased porosity and an
increase in the area of the failure surface. Adams and
Hayes (1967) visually observed that anchors in dense sand
affected a much greater volume than in loose sand.
3.3.3 OVERBURDEN PRESSURE
Overburden pressure is the force per unit area that
is acting above the soil sample under investigation. In
an effort to study the effects of overburden pressure on
anchor pullout capacity, Healy (1971) applied vacuum to
the inside of a container of sand which was completely
enclosed in a rubber membrane. In tests with overburden
stresses up to 11.6 psi, Healy found that the pullout
resistance increased monotonically with an increase of
overburden stress.
Knowing that an increase in overburden stress could
increase anchor uplift capacity, Stewart (1985) studied
the effects of soil layering. In his model experiments
he embedded an anchor in clay (glyben) and overlaid it
with layers of sand. After conducting pullout tests he
found that the layers of sand caused an increase in
anchor uplift capacity. However, in order to mobilize

44
the frictional resistance of the sand, the anchor had to
travel almost completely through the layer of clay.
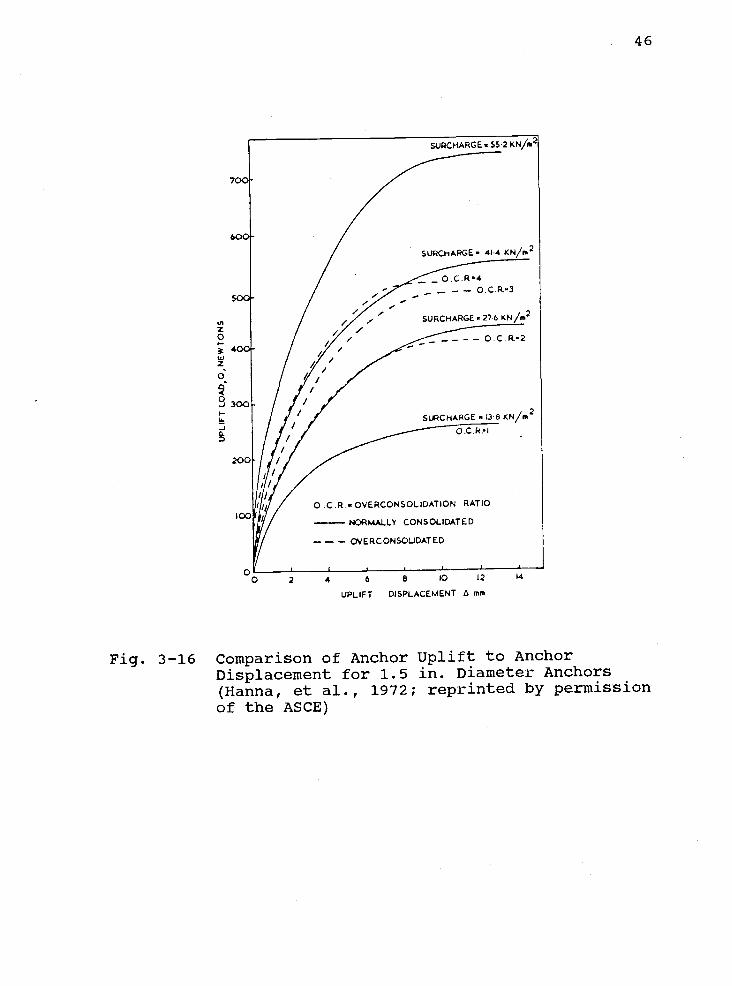
3.3.4 STRESS HISTORY
Hanna and Carr (1971) showed that soil stress
history is an important factor in anchor pullout. By
examining model anchors in overconsolidated sand they
found that the peak uplift capacity increased with
increasing overconsolidation ratio (OCR). An
overconsoljdated soil is one that is currently sensing an
overburden pressure lower than what it has experienced in
the past. An overconsolidation ratio is the ratio
between the preconsolidation pressure and the present
vertical pressure. For small overconsolidation ratios,
the peak value is only slightly less than in the normally
consolidated soil. As shown in Fig. 3-16, as the
overconsolidation ratio increases, the ultimate uplift
capacity also increases but appears to reach a limiting
value.
Seed and Chan (1961) found that the interval time
between loadings had an important influence upon sand
deformation. In tests with silty sand, the soil
deformation, measured as a percent of axial strain,
increased as the interval between loadings increased. A
possible explanation given for this phenomenon was that
upon loading, adsorbed water films displaced, resulting
in true particle to particle contact and increased
45
frictional resistance. If the soil does not have
adequate time to rebound and readsorb water, the strength
remains high. If the soil is given adequate time to
restore itself to its original condition, the strength is
reduced.
3.3.5 SHORT-TERM VS. LONG-TERM LOADING
Beard (1980) defines short-term holding capacity as
"the load required to cause anchor breakout when the
anchor is loaded rapidly to failure't. The ultimate
holding capacity is affected by the dissipation of
induced pore water pressure. Cohesionless soils drain
quickly, even though the soil may be loaded rapidly. For
most of these cases the uplift capacity is governed by
the soil's friction angle. However, if a cohesionless
soil is loaded so quickly that it is not allowed to
drain, then its strength will be adversely affected. The
strength change depends upon the soil's relative density.
The undrained shear strength of a loose sand is less than
it's drained shear strength, whereas in a dense sand, the
undrained strength is greater. Cohesive soils drain very
slowly and any attempt to define uplift capacity must
include the soil's undrained shear strength, Su.
Long-term static holding capacity is reached when
excess pore-water pressure in the soil has dissipated.
Since cohesionless soils drain rapidly, the long-term
holding capacity is considered to be equal to the short
z03:La2
-j
0 2 4 6 B 10 12 1.4
46
UPLIFT DISPLACEMENT mm
Fig. 3-16 Comparison of Anchor Uplift to AnchorDisplacement for 1.5 in. Diameter Anchors(Hanna, et al., 1972; reprinted by permissionof the ASCE)

47
-term drained holding capacity. Cohesive soils drain
slowly, but eventually reach equilibrium. Uplift
capacity for this case is governed by the soil's drained
strength parameters. Adams and Hayes (1967) examined the
long-term holding capacity of anchors embedded in clay
and found that they were considerably less than the
short-term holding capacity. Beard (1979) studied long-
term loading capacity on submerged clays and found that
for a normally consolidated clay, the long-term drained
strength was greater than the short-term strength in
almost all cases.
3.3.6 SATURATION
When any soil becomes submerged, water will fill the
void spaces between the soil particles. This water is
called pore water and the rate at which it flows is
dependent upon the soil's permeability. Pore pressure
serves to reduce the average intergranular stress between
soil particles.
Sutherland (1965) conducted anchor pullout tests in
dry and submerged sands and noted that there was a
reduction in pullout capacity for the submerged sands as
expected. However when he used the soil's effective unit
weight in Eq. 3-17, he obtained the same breakout factors
as in the dry sand. Matsuo (1967) noted as much as a 50%
decrease in pullout capacity of anchors embedded in
saturated sand over those embedded in dry sand.

48
3.3.7 SOIL DILATENCY
Soil dilatency (or shear dilatency) is the change in
volume that is associated with the shear distortion of an
element of granular soil. It is characterized by an
angle of dilatency ç&. If cli = 0, then the soil will
deform plastically with no volume change. Loose sands
often have small angles of dilatency. Dense sands,
however, often dilate when sheared. Dilatency causes the
soil above the anchor to ttlock up", and this has an
effect on anchor pullout capacity. Before an anchor can
fail, a greater plastic region must become affected by
the soil stress. Rowe and Davis (1982b) and Vermeer and
Sutjiadi (1985) found that anchor pullout capacity
increased with an increasing angle of dilatency.
3.3.8 P2RTICLE BREAKAGE
As uplift load is applied to an anchor, stresses are
transmitted to the surrounding soil. These stresses are
distributed throughout the skeletal structure of the soil
by particle to particle contact. If the stress is high
enough it is possible for the particle to break,
resulting in smaller particle sizes. Particle breakage
causes a reduction in volume and decreases the rate of
dilation. This phenomenon occurs mostly in cohesioniess
soils.
In his tests in dense sand, Healy (1971) noticed
that there was an increase in soil density around his

49
anchors due to sand grain breakage. Hardin (1985)
realized the importance of particle breakage and
developed equations to define the breakage potential of a
particle. He identified seven parameters that affect
particle crushing: particle size distribution, particle
shape, state of effective stress, effective stress path,
void ratio, particle hardness and the presence or absence
of water. Miura (1985) studied point resistance of steel
piles in sand and found that the work dissipated in the
particle crushing of sand can be as much as 80 - 90 % of
the total work done by the external force. He found that
the zone of crushing can extend to a depth of several
times the pile diameter.
3.3.9 SOIL DISTURBANCE
When an anchor is embedded into the seafloor, some
soil disturbance will occur. The amount of shear
strength lost is dependent upon the soil's sensitivity,
St. Sensitivity is defined as the ratio between
undisturbed compression strength and remolded compression
strength. Cohesionless soils have low sensitivity with
values approaching unity. Sensitivity ranges are given
as follows: insensitive 2<St<4, sensitive 4<St<8,
extrasensitive St>8. Many ocean soils with a high water
content have no remolded shear strength.
A cohesive soil can regain shear strength with time.
This process is known as thixotropy. For this reason an

50
anchor that is not loaded until the soil has regained
most of its strength will have a greater uplift capacity
than an anchor that is loaded immediately after
embedment. Rocker (1977) found that in clayey-silt, much
of the benefit of leaving the anchor undisturbed was
reached in only a few hours. Unfortunately, soils with a
sensitivity greater than 16 regain very little of their
original strength, even after waiting for a period of 4
months (Bowles, 1982).
Walker (1978) embedded various shaped anchors into
sand and clay by jetting. He found that generally, the
anchor embedded with the least amount of disturbance had
a higher uplift capacity. He also found that if air was
used as a jetting medium instead of water, a higher
uplift capacity would result.
3.3.10 PNCHOR GEONETRY
Anchors can take on many shapes. The most common
embedment anchor shapes are circular, square, rectangular
and cylindrical. Several researchers have examined the
effects of anchor geometry on uplift capacity. Matsuo
(1967) noted that the uplift resistance of a square
footing in sand is approximately 10% greater than that of
a circular footing with the same area. His
investigations established that anchor uplift generally
increased with increasing perimeters. In contradiction
to this finding, Ovesen (1981) used a centrifuge to
51
examine scale effects and discovered that circular and
square anchors, having the same area and buried at the
same depth, have the same uplift capacity. Das and
Seeley (1975) report that a square anchor in sand has a
slightly greater resistance than a circular one.
However, in equating the two anchors, the authors
compared the diameter of the circular anchor to the
length of the side of the square anchor. This gives the
square anchor a slightly greater area. Murray and Geddes
(1987) found that circular plates had higher
dimensionless load coefficients (P/LAD) than square
plates whose sides were equal to the circular plate
diameter.
Rowe and Davis (1982b) compared several rectangular
anchors and found that for shallow anchors in sand, the
ultimate uplift capacity decreased as the length-to-
breadth ratio of the anchor increased. When they
compared shallow circular and strip anchors in clay, Rowe
and Davis (1982a) found that the circular anchor capacity
was nearly twice that of the strip anchor. As the depth
increased, however, the differences diminished.
Andreadis, Harvey and Burley (1981) conducted
extensive static pullout tests on circular, cylindrical,
and conical anchors in preparation for cyclic pullout
experiments. Their results indicate that the cylindrical
anchor had the higher pullout capacity. They attributed
the higher capacity to the reduced movement of sand

52
around the edges of the anchor. They also found that
conical anchors, while comparable to other shaped anchors
at low loads, had a marked reduction in pullout capacity
as loads increased.
3.3.11 PLATE ROUGHNESS
Anchor plate roughness affects the anchor-soil
interface. Rowe and Davis (1982a, 1982b) conducted a
theoretical investigation and performed model tests on
plates in dry sand and clay and found that anchor
roughness had a negligible effect upon uplift capacity.
This was also noted by Rowe and Booker (1979a) who
observed a difference of less than one percent in the
stiffness, or load-displacement relationship, between a
smooth and rough anchor. contrary to this, Murray and
Geddes (1987) found that an increase in surface roughness
produced an increase in the ultimate uplift resistance.
3.3.12 ANGLE OF INCLINATION
Under field conditions, an anchor is rarely pulled
exactly vertically. In most cases the load will be
applied at an inclined angle. For a deeply embedded
inclined anchor, the uplift capacity can be expected to
be the same as for the deep vertical anchor. When the
anchor is shallow however, the surface boundary condition
will affect the uplift capacity. In each of the
experiments cited below the face of the anchor has been
53
placed perpendicular to the angle of pull so that it
offers the most resistance to pullout.
Kenanyan (1966) found that at the same depth,
pullout resistance increased with increasing angle of
inclination. This was confirmed by Meyerhof (1973a, b)
who also noted that the effect of inclination decreased
with depth. Colp and Herbich (1975) observed that the
more an anchor was inclined, the greater the number of
particles that were displaced. This indicated that the
volume involved in soil pullout increased with angle of
inclination. In their work on shallow anchors in sand,
Harvey and Burley (1973) found no substantial difference
in uplift capacity between horizontal and inclined anchor
plates. Ovesen (1981) in his centrifuge tests found that
the uplift capacity factor (a dimensionless
representation of uplift capacity) decreased slightly to
a minimum at 20° inclination. Above this value, the
uplift capacity increased.
3.4 CYCLIC LOADING BEHAVIOR
In contrast to the numerous theories and studies
that attempt to define and describe static pullout, there
is currently no theory to explain the cyclic loading
behavior of embedded anchors. After a review of the
differences in static pullout theories and of the
influences various parameters have on static pullout, it
is easy to understand why the complex behavior of cyclic
54
loading has been difficult to analyze.
Cyclic loads usually have periods of less than one
minute in duration and can result from earthquake loading
(frequency approximately 2 Hz), wave loading (0.05 <
frequency < 0.15 Hz) and cable strumming (5 < frequency <
20 Hz) (Hermann, 1981). Cyclic loading is to be
distinguished from dynamic loading. In dynamic loading,
the inertial forces of the soil mass and anchor plate
must be taken into consideration during analysis. Cyclic
loading ignores inertial forces and is simply a
repetition of the static loading case (Hanna, Sivapalan
and Senturk, 1978).
Experimental studies on the cyclic uplift capacity
of embedded anchors are relatively scarce. B e m b e n ,
Kalajian and Kupferman (1973) conducted static and cyclic
pullout tests of anchor plates and flukes in loose
saturated sand. They used a cyclic loading pattern with
a period of 8 seconds lasting up to 4 hours. They noted
that the net upward anchor displacement per cycle
decreased during the first few minutes but that a
constant value was soon reached. This constant value was
termed the cyclic creep rate.
In additional work, Bemben and Kupferman (1975)
extended their previous test interval to about one week
and found that the cyclic creep displacement of their
anchor never ceased. Visual observations revealed that
during cyclic loading tests, a wedge of soil immediately
55
above the anchor became "attached" to the fluke and moved
up together with the fluke. As the anchor was loaded and
displaced upward, soil flowed from above to below the
anchor. When it was unloaded, the anchor moved downward
due to soil rebound. The additional sand below the plate
prevented a total return of the anchor to its original
position, hence the occurrence of cyclic creep. As the
anchor neared the surface, bulging of the soil did not
occur as in the static case. This indicated that during
cyclic loading, soil stresses are confined to a smaller
region around the anchor than that observed in the static
loading case.
Clemence and Veesart (1977) conducted model tests in
dry sand and found that the uplift capacity of circular
plate anchors under dynamic loading was higher than under
static loading due to the inertial resistance of the soil
mass being pulled out and the increased shear resistance
due to rapid strain rates. By modifying their static
definition of pullout resistance to include inertial and
increased shear forces, Clemence and Veesart obtained
predicted results which agreed well with their
experimental data. No significant differences between
the static and cyclic failure surface profiles were
found.
Andreadis, Harvey and Burley (1978, 1981) conducted
static and cyclic loading tests on cylindrical anchors
connected to rigid tie rods in saturated sand. The

56
cyclic loading consisted of a 0.5 Hz sinusoidally varying
pattern which they determined imposed negligible inertia
forces and simulated drained soil conditions.
significant scale effects were found to exist, with the
larger anchors exhibiting a faster cyclic strength
deterioration due to the larger amount of soil flowing
from above to below the anchor plate. In all cases, as
shown in Fig. 3-17, an unceasing relative anchor movement
(cyclic creep) was observed to occur. They noted that as
anchor loading began, the anchor displaced through the
soil at a decreasing rate. A steady displacement rate
was soon reached. After a critical relative movement,
defined as the ratio of minimum cyclic displacement to
anchor diameter, had been reached, the anchor pullout
rate began to increase. The corresponding value of
critical relative movement was defined as the point of
anchor failure. As the cyclic load became a larger
percent of the static load, a higher relative cyclic
movement occurred after fewer cycles. Post-cyclic static
pullout tests revealed that stiffening of the soil had
occurred along with soil density changes. While stress
measurements showed that at the start of loading the sand
mass was affected at least 10 anchor diameters away,
continued repeated loading resulted in the confinement of
stresses to a more limited zone around the anchor.
In an effort to reduce the flow of soil around the
anchor, Andreadis and Harvey (1979) designed a two plate

*4
009
0.08
0.07
Q 05
U
003
0.02
0.01
57
_M1W 1viva
______A4WAV_Aa' Ajr
102 ios
Numb.r of cyc!es, N
Fig. 3-17 Relative Anchor Movement as a Functionof Number of Cycles (Andreadis, et. al,1981; reprinted by permission of theASCE)

58
anchor system which when loaded, caused a displacement of
the bottom plate which was less than the top plate. This
served to reduce the amount of soil flowing around the
anchor. While anchor life with this system was found to
increase by over 20 times that of a conventional plate
anchor, the cyclic creep phenomenon was never completely
eliminated.
Hanna and Al-Mosawe (1981) subjected prestressed
circular anchor plates embedded in dry sand to 60 second
period square wave load pulses in order to determine the
effects of prestressing on anchor pullout capacity. As
the number of cycles increased, the rate of anchor
displacement per cycle continued to decrease. Sand
breakdown was also observed, with the greatest amount of
particle crushing occurring just above the anchor plate.
This supposedly led to an increase in soil density and a
decrease in volume. Cyclic creep and increased static
pullout after repeated loading was partly attributed to
this particle crushing. During a previous study, Hanna,
Sivipalan and Senturk (1978) found that soil
overconsolidation ratios between 1 and 8 had little
effect on the cyclic creep behavior of the anchor.
Herxaann (1981) classified dynamic loading into two
types; impact loads and cyclic loads. Impact loads were
defined as single event loads of less than one minute in
duration with a load greater than the anchor's ultimate
static uplift capacity. Cyclic loads are repetitive in

59
nature, having frequencies between 0.05 and 20 Hz. and
loads less than the ultimate static uplift capacity. The
cyclic load must also have a peak-to-peak loading force
of at least 5% of the static anchor capacity otherwise
the loading is still considered to be static.
Conservative design curves were developed to aid in
determining the maximum cyclic loading that will result
in insignificant cyclic creep. The author notes that
cyclic creep is a poorly understood phenomenon and
recommends factors of safety between 1.25 and 1.75 on the
anchor load.
Clemence and smithling (1983) conducted cyclic
loading tests of single-helix screw anchors in a dry fine
sand. A cyclic loading frequency of 6 Hz with a varying
displacement amplitude was used. When the anchor was
installed, an increase in horizontal stresses was
observed. These stresses decreased during cyclic
loading. They concluded that anchor installation caused
a densification of sand around the anchor, but that the
soil loosened once cyclic loading began. A lower post-
cyclic static pullout capacity than that of a non-
cyclically loaded dead anchor was attributed to this soil
loosening. Prestressing the anchor caused an increase in
anchor life if the cyclic load to ultimate static load
ratio was kept below 3%. Above this ratio, a prestressed
anchor failed sooner than a deadweight anchor subjected
to cyclic loading.

:41]
4.0 LABORATORY TEST PROGRAM
A laboratory test program was conducted to
investigate the effects of depth, anchor shape, pullout
rate, period of cyclic loading and force of cyclic
loading upon anchor pullout behavior. A fine sand was
used as the test medium. The anchors under investigation
consisted of circular, square and rectangular steel
plates. A hydraulic loading device was utilized for
steady rate and cyclic anchor loading. The test
container was a 7.5 ft high by 5.5 ft diameter steel
tank. This chapter details the experimental setup,
anchor design, soil properties and testing procedure used
in this investigation.
4.1. INTRODUCTION
Standard preparation procedures to ensure repeatable
soil densities usually consist of pouring soil in a
uniform pattern into a test container from a set height.
The soil density is determined by the height of the fall
and the spreading rate.
In this investigation, a large test container and
the use of wet sand made this procedure prohibitively
cumbersome and time consuming. A soil preparation method
was therefore required that would produce repeatable
densities in a short period of time and with minimum
effort.
61
It was decided to use the upward seepage force of
water to reduce the effective stress of the soil to zero.
This causes soil instability resulting in fluid-like
behavior. This concept is represented by the following
relationship:
a' = Dr' icrDrw(4.1)
where a' = the effective stress of the soil, F' = the
buoyant weight of the soil, r' = the unit weight of
water, cr = the critical hydraulic gradient necessary
for zero effective stress and D = depth of measured
effective stress below the soil's surface.
The value of 1cr for most soils varies from 0.9 to
1.1. Using an average value of 1.0, the flow rate
necessary to cause quickening or liquefaction of the soil
can be determined from Darcy's Law:
V = kicr(4.2)
where v = the discharge velocity and k the coefficient
of permeability of the soil. The volumetric flow rate
can also be determined from the following relationship:
q = Akicr(4.3)
where q = the volumetric flow rate and A = the cross
62
sectional area of the test container.
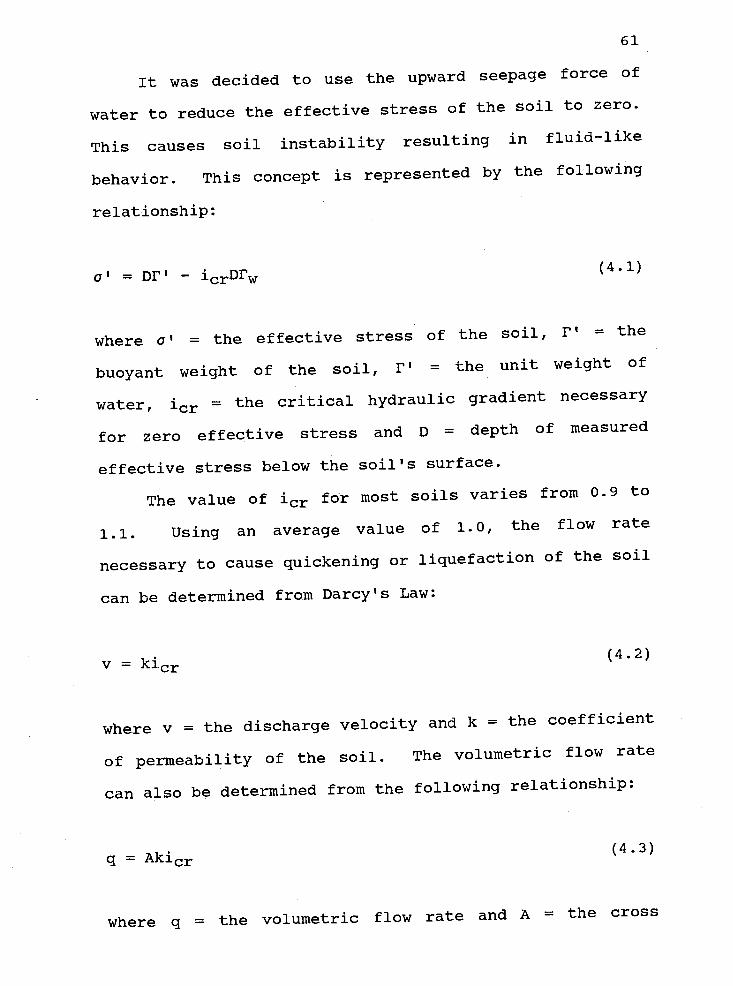
Typical values of permeability coefficients for a
fine sand vary between 0.02 - .002 ft/mm (0.01 - 0.001
cin/s) (Das, 1985). For a test tank with a cross-
sectional area of 24.0 ft2 (2.2 in2), a volumetric flow
rate no greater than 0.5 ft3/min (.04 cm3/s) would be
necessary to cause soil liquefaction. A moderate size
centrifugal pump could supply this amount of water.
After the soil had been fully fluidized, the anchor
plate could be placed at the required depth and the
seepage water stopped. The sand could then be
consolidated to the desired density by some vibration
technique.
In order for this procedure to work, the use of a
poorly graded fine sand was necessary. Ottawa 80 silica
sand was found to satisfy this requirement. The
properties of this sand are given in section 4.3.
4 2 EXPERIMENTAL SETUP - EQUIPMENT AND APPARATUS
4.2.1 TEST TANK
The test container was fabricated from 3/16 in. (4.8
mm) thick steel plate. The tank was 7.5 ft (2.3 m) high
and 5.5 ft (1.7 in) in diameter. The large size was
chosen to reduce boundary effects at the side of the
container. Previous researchers have established that
boundary effects may exist at a distance in excess of
sixteen anchor diameters (Andreadis, Harvey and Burley,
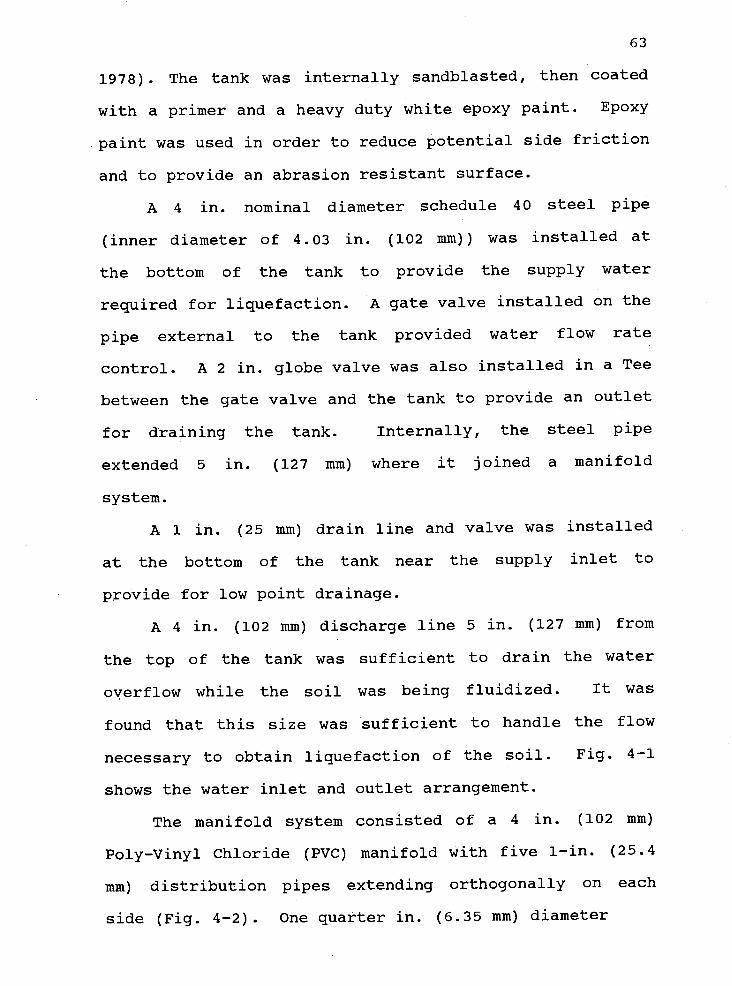
63
1978). The tank was internally sandblasted, then coated
with a primer and a heavy duty white epoxy paint. Epoxy
paint was used in order to reduce potential side friction
and to provide an abrasion resistant surface.
A 4 in. nominal diameter schedule 40 steel pipe
(inner diameter of 4.03 in. (102 mm)) was installed at
the bottom of the tank to provide the supply water
required for liquefaction. A gate valve installed on the
pipe external to the tank provided water flow rate
control. A 2 in. globe valve was also installed in a Tee
between the gate valve and the tank to provide an outlet
for draining the tank. Internally, the steel pipe
extended 5 in. (127 mm) where it joined a manifold
system.
A 1 in. (25 nun) drain line and valve was installed
at the bottom of the tank near the supply inlet to
provide for low point drainage.
A 4 in. (102 mm) discharge line 5 in. (127 mm) from
the top of the tank was sufficient to drain the water
overflow while the soil was being fluidized. It was
found that this size was sufficient to handle the flow
necessary to obtain liquefaction of the soil. Fig. 4-1
shows the water inlet and outlet arrangement.
The manifold system consisted of a 4 in. (102 mm)
Poly-Vinyl Chloride (PVC) manifold with five 1-in. (25.4
mm) distribution pipes extending orthogonally on each
side (Fig. 4-2). One quarter in. (6.35 mm) diameter
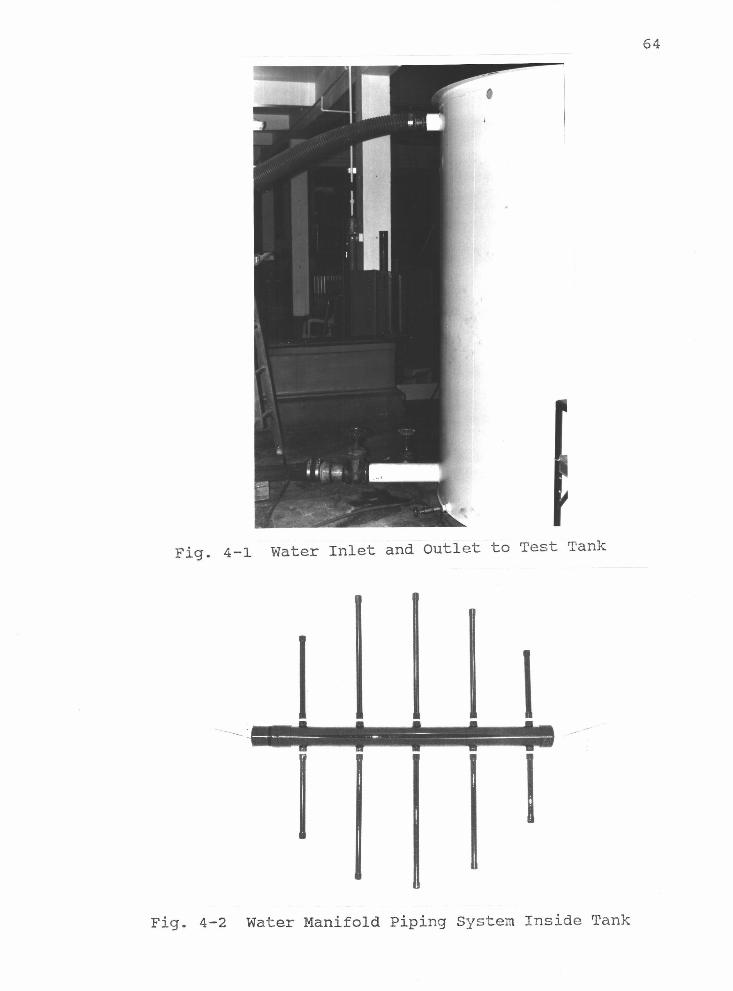
64
Fig. 4-1 Water Inlet and Outlet to Test Tank
Fig. 4-2 Water Manifold Piping System Inside Tank

65
holes were drilled into the bottom of the distribution
pipes at ½ in. (12 mm) intervals. The ends of the
manifold and the distribution pipes were capped.
The tank also had four 1½ in. (38 mm) equispaced
lifting eyes drilled 3 in. (76 itmi) from the top in order
to move and position the tank when it was empty. Angle
iron was welded around the top of the tank to stiffen the
perimeter and prevent bending of the tank top while it
was being moved.
The water for liquefaction was supplied by a
centrifugal pump which drew water from a sump. The pump
had a capacity of 1 ft3/sec (0.03 m3/s) at 59 psi (409
kPa). Pump specifications may be found in Appendix D.
A in. (6.4 mm) thick channel beam was bolted to
the angle iron at the top of the tank to provide support
for a B}i4 Long stroke National Air Vibrator (Fig. 4-3).
The vibrator was used to consolidate the soil after it
had been fluidized. It was installed on the beam of f
center to permit the anchor shaft to pass through a hole
in the center of the beam so that the vibrator would not
have to be removed before each test run. The vibrator
operated at 2000 to 3800 cycles per minute at a supply
air pressure between 40 and 100 psi. Vibrator
specifications may be found in Appendix D.
Inside the tank, gravel up to 1 in. (25 mm) in
diameter was placed on the bottom to allow for uniform
water distribution after the water exited the manifold

Fig. 4-3 Air Vibrator Mounted on Tank
Fig. 4-4 Coarse Gravel Covering Manifold System
67
system. This gravel was placed to a depth of 7½ in. (191
mm) so that the manifold system was just covered (Fig.
4-4)
A geotextile ring was constructed with the idea of
providing a barrier between the test sand and the
manifold system. It was desired that the fine test sand
not clog the manifold system thereby interfering with
flow distribution. The geotextile was a non-woven needle
punch type designated SUPAC 4NP and manufactured by the
Phillips Fiber Corporation. The frame for the geotextile
consisted of a length of 1 in. (25 mm) diameter PVC
piping filled with sand and glued together at the ends
forming a circular ring of the same diameter as the tank.
The geotextile was sewn around the tubular ring and a 6
in. (152 mm) skirt was sewn to the edge of the ring.
This ring of geotextile material was laid over the gravel
bed and sealed at the edges with duct tape and silicon
sealant (Fig. 4-5). Over this was laid another 5 in.
(127 mm) of gravel to prevent the geotextile cloth from
lifting of f the gravel bed during the fluidization
process. The extra gravel also pressed the skirt against
the side of the tank, providing an additional barrier
between the sand and the manifold. The total amount of
gravel used was 3200 lb. (1452 kg).
Ten thousand seven hundred (10,700) lb. (4854 kg) of
Ottawa 80 sand was then poured into the tank on top of
the gravel (Fig. 4-6). A schematic diagram of the test
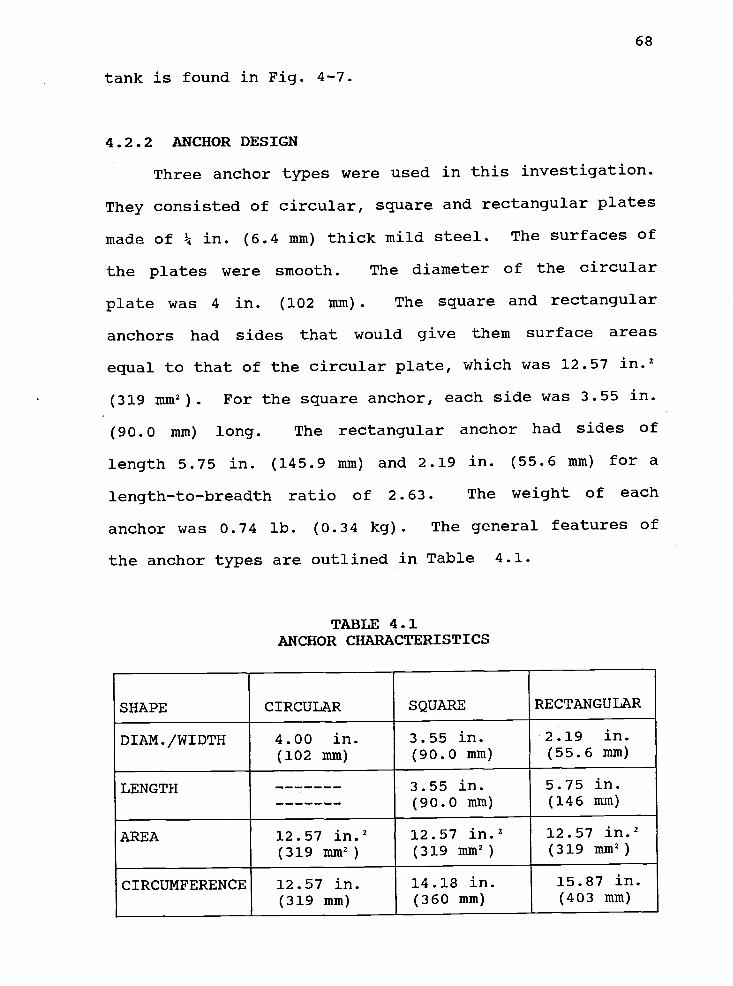
tank is found in Fig. 4-7.
4.2.2 ANCHOR DESIGN
Three anchor types were used in this investigation.
They consisted of circular, square and rectangular plates
made of in. (6.4 mm) thick mild steel. The surfaces of
the plates were smooth. The diameter of the circular
plate was 4 in. (102 mm). The square and rectangular
anchors had sides that would give them surface areas
equal to that of the circular plate, which was 12.57 in.2
(319 mm2). For the square anchor, each side was 3.55 in.
(90.0 mm) long. The rectangular anchor had sides of
length 5.75 in. (145.9 mm) and 2.19 in. (55.6 mm) for a
length-to-breadth ratio of 2.63. The weight of each
anchor was 0.74 lb. (0.34 kg). The general features of
the anchor types are outlined in Table 4.1.
TABLE 4.1ANCHOR CHARACTERISTICS
SHAPE CIRCULAR SQUARE RECTANGULAR
DIAN./WIDTH 4.00 in. 3.55 in. 2.19 in.
(102 mm) (90.0 mm) (55.6 mm)
LENGTH 3.55 in. 5.75 in.
(90.0nun) (146 nun)
AREA 12.57 j2 12.57 j2 12.57 ifl.2(319 mm2) (319 nun2) (319 mm2)
CIRCUMFERENCE 12.57 in. 14.18 in. 15.87 in.(319 mm) (360 mm) (403 mm)

Fig. 4-5 Geotextile in Place
Fig. 4-6 Sand Ready to be Added to Tank

WaterOutlet
Tie
Rod
Gravel
WaterInlet
To Load Actuator
J
ii[/////////,/ifi/'/iii,q,,// //f///il*(h,'b'i'/7
:;
-
-- -. I,
-
75
.-,, w. ..i -.1-. I ...
o a a aW0:2:
5.5 ft
(1.7 m)
Water
Sand
ft (2.3 m)
Anchor- Plate
- Geotextile
Manifold
Fig. 4-7 Test Tank Configuration
70

71
Each anchor had a removable centerpiece that
contained two pore pressure gauges. This piece, shown in
Fig. 4-8., was 0.875 in. (22.23 nun) in diameter and 2 in.
(50.8 inn) in length. The centerpiece was designed to be
removable so that the anchor shapes could be changed
without having to switch the pore pressure gauges between
anchors. Eight countersunk holes were drilled around the
base of the centerpiece for attachment to the anchor
shapes. The base was machined to allow seating of the
three anchor shapes and provide continuity between the
plate and the centerpiece. The pore pressure gauges were
sealed in place with a hardening glue so that there could
be no internal communication between gauges. One gauge
measured the pore pressure at the top of the anchor at
the intersection of the shaft and the plate. The other
gauge measured the pore pressure at the bottom of the
plate at the same radius as the top gauge but 180° apart.
The pore pressure gauges were manufactured by Druck,
Inc.. The transducer type was PDCR 81 and had a range of
5 psi. A schematic of the gauge used is shown in Fig. 4-
9. The anchors, centerpiece and tie rod are shown in
Figs. 4-10 through 4-13.
The shaft consisted of 1/8 in. steel pipe (O.D. 0.41
in., (10.5 nun)). The pore pressure wiring was routed
through this pipe and exited above the water level
through an in line Tee connection. While a smaller
diameter wire rope would have been preferable to reduce

PORE GAHOLE
7/8" l
>
-f'4
(
I"PORE GAUGE..
> HOLESI
/
2" II I
1.252'
IIlie" I I
II
. --.
T17/81
(a)
(b)
-i/4',
T
-32 HOLES FOR1LATE ATTACHMENT
72
Fig. 4-8 Centerpiece Configuration (a) Profile View(b) Plan View
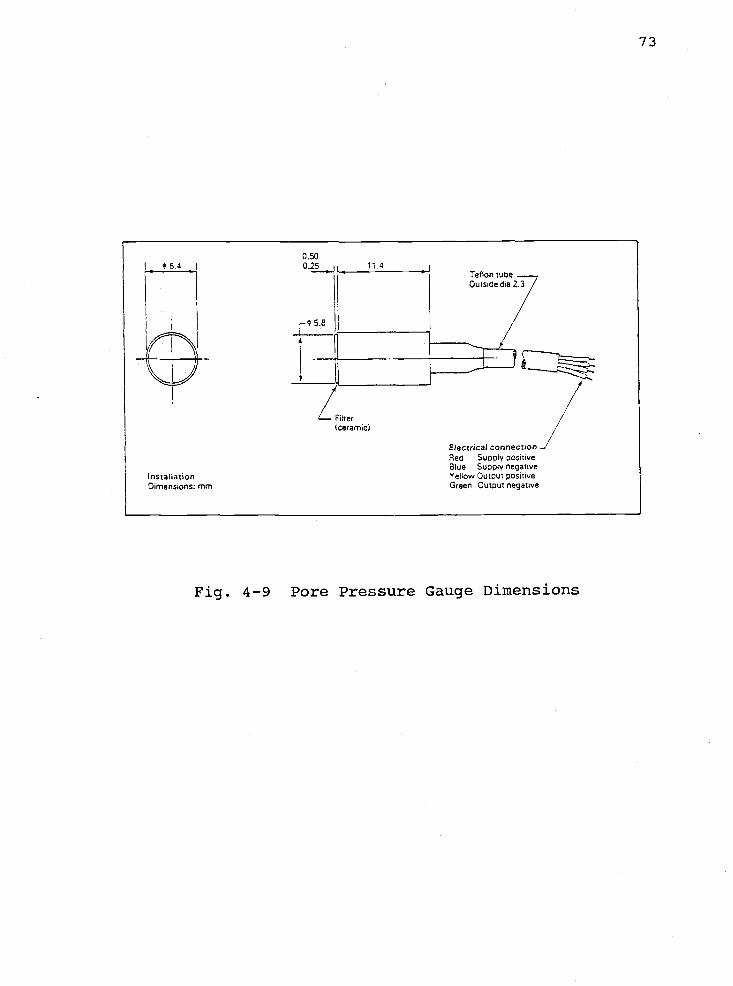
73
0.50I
+ 6.4 0.25 11.4Teflon tuoe
Hda 2 3_tside.
/Fiiter 7(ceramc
Electr:ca connectronRed Suopy positiveBlue Supply negative
Installation Yellow Outut positiveDimensions: mm Green Output negative
Fig. 4-9 Pore Pressure Gauge Dilnensions
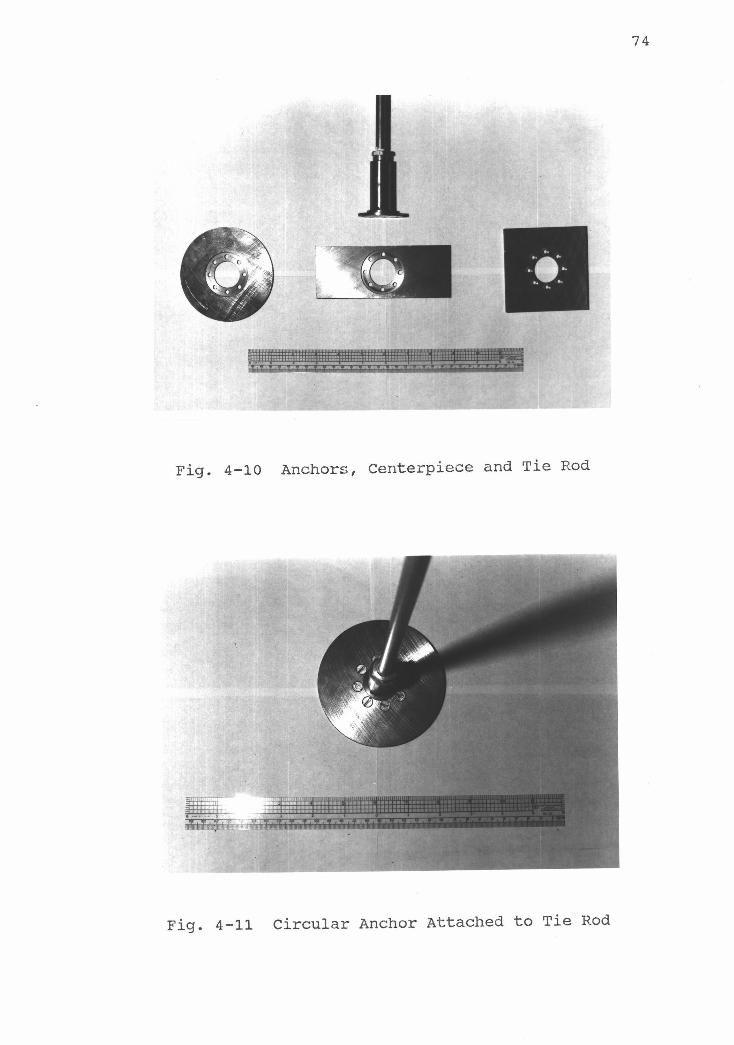
74
Fig. 4-10 Anchors, Centerpiece and Tie Rod
Fig. 4-11 Circular Anchor Attached to Tie Rod
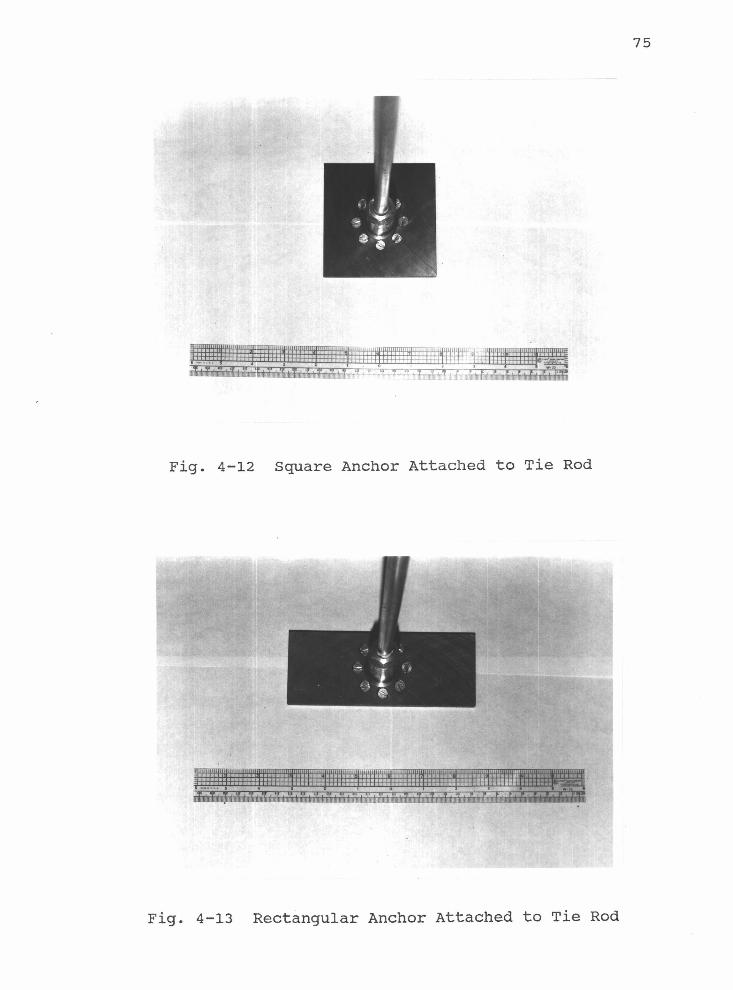
75
Fig. 4-13 Rectangular Anchor Attached to Tie Rod

76
shaft friction, rigid piping was necessary to permit
accurate plate positioning and to provide protection for
pressure gauge wiring. Additional 1/8 in. pipe was used
to join the Tee and the hydraulic actuator.
4.2.3 1NCHOR LOADING SYSTEM
An MTS model 506.01 hydraulic power system was used
to control the anchor loading process. This system had a
design hydraulic fluid flow rate of 3 gpm at 3000 psi.
The load actuator was mounted in a steel frame detached
from and above the center of the tank. The actuator had
an effective stroke of 6 in. (0.15 iii). A load cell was
attached to the lower end of the actuator. The tie rod
was connected to the load cell with a hinge type
connector. This allowed the slack to be taken out of the
loading system without having to frequently change the
tie rod lengths.
Control of the actuator was through an MTS 436
control unit and an MTS 406 controller. The control unit
consisted of a power supply and function generator
capable of providing various waveforms at a wide range of
frequencies. The controller provided the ability to
switch between load control and displacement control of
the actuator. A sinusoidal waveform with frequencies
ranging between 10 Hz. and 0.1 Hz. were used in this
investigation.
77
4.2.4 DATA ACQUISITION
The experimental program was designed to monitor and
record up to seven channels of data. These included
load, displacement, pore pressures above and below the
anchor plate and pore pressures at three other locations
inside the tank.
The load was monitored with 1000 lbf (model FLU-
2SGKT) and 5000 lbf (model FL5U-2SGKT) Strainsert
Universal Flat Load cells. The displacement was measured
with a linear variable differential transformer (LVDT).
Feedback from the load cell and LVDT was passed through
an MTS 436 Control Unit and MTS Controller and low pass
filters to an IBM-XT personal computer.
The electrical signals from the pore pressure gauges
were sent to the personal computer via voltage
amplifiers, low pass and anti-aliasing filters and analog
to digital converters. The signal conditioners and
voltage amplifiers were model PCI 20044T Burr Brown
strain gauge signal conditioners. Wavetek Rockland Model
432 low pass filters were used for anti-aliasing. The
analog devices consisted of RTI 815-F 16 channel
differential input A/D converters.
The software used for data acquisition was
UnkelscopeTM from Unkel Software, Inc.. This software
allowed real time observation of the anchor loading
process as well as post data collection analysis. A
strip chart recorder was also used to supply preliminary
78
and real time data. A flow chart depicting the data
acquisition process is outlined in Fig. 4-14. The
completed experimental setup is shown in Fig. 4-15.
4.3 SOIL PROPERTIES
The soil used in this investigation was Ottawa 80
silica sand. The properties of this sand are presented
in Table 4.2. The grain size distribution is shown in
Fig. 4-16. The procedures used to obtain these values
are outlined in Appendix B.
4.4 SOIL PREPI½RATION PROCEDURE
The following soil preparation procedure was
conducted prior to each run. It evolved from many tests
to determine the optimum fluidization and compaction
process that would produce repeatable soil densities.
The first step was to fluidize the soil by forcing
water into the bottom of the tank through the manifold
system. As water began seeping into the soil, the soil
mass began to lift. After rising about 4 in. (10.2 cm),
piping occurred, with water venting through the weakest
area of the soil. After the venting occurred, the flow
rate was increased to 0.1 ft3/sec (.0028 m/s). While
this flow quantity was more than necessary to cause
liquefaction, the water piping prevented the remainder of
the soil mass from fluidizing. By increasing the flow,
additional piping occurred. As soil within the pipe was
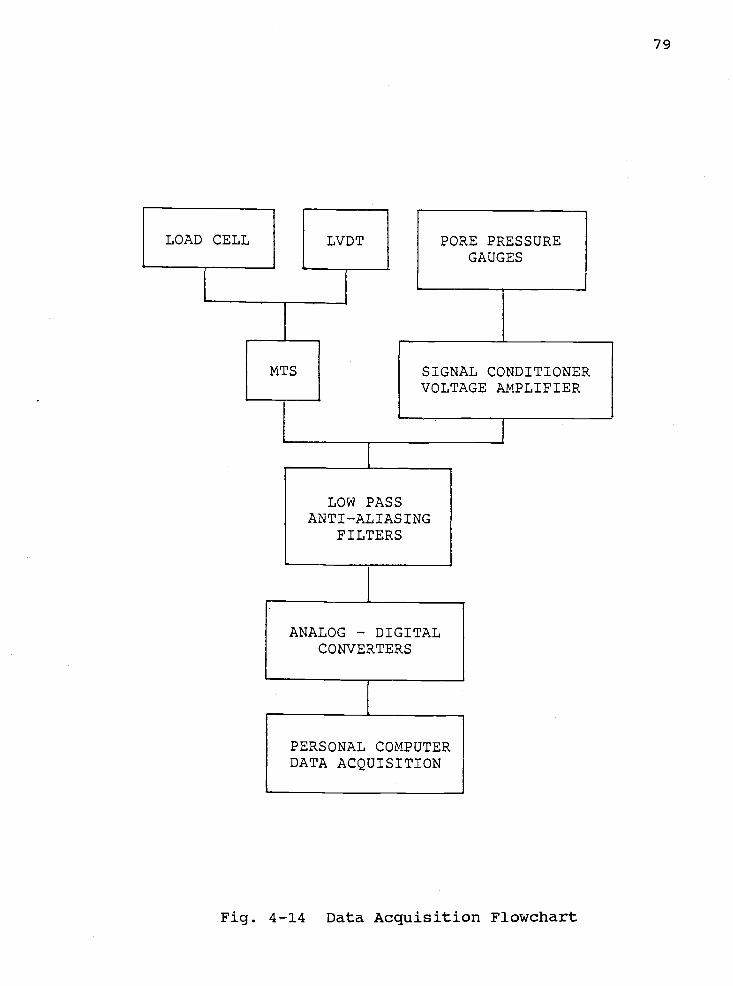
79
LOAD CELL LVDT PORE PRESSUREGAUGES
MTS SIGNAL CONDITIONERVOLTAGE AMPLIFIER
LOW PASSANTI-ALIASING
FILTERS
ANALOG - DIGITALCONVERTERS
PERSONAL COMPUTERDATA ACQUISITION
Fig. 4-14 Data Acquisition Flowchart

80
Fig. 4-15 Experimental Apparatus

TABLE 4.2SOIL PROPERTIES
NAME OTTAWA 80
SPECIFIC GRAVITY 2.65
PARTICLE SHAPE SUBANGULAR
COEFFICIENT OF UNIFORMITY, Cu 1.9
COEFFICIENT OF CURVATURE, C 0.9
UNIFIED SOIL SYSTEM CLASS. SP
ANGLE OF FRICTION 40°
MAX. DRY DENSITY 106.1 pcf(1.70 g/cm3)
MIN. DRY DENSITY 91.7 pcf(1.47 g/cm3)
IN-SITU DRY DENSITY 102.8 pcf(1.65 g/cm3)
EFFECTIVE UNIT DENSITY 64.0 pcf(1.02 g/cm3)
RELATIVE DENSITY, Dr 80 %
VOID RATIO, e 0.61
PERMEABILITY, k 0.0144 cm/s0.0057 in./sec
deposited on the surface, sand from the bottom of the
tank flowed into the space left by the transported soil.
After 25 minutes, piping no longer occurred and the
soil was completely fluidized. Allowing further
fluidization resulted in sand being discharged through
the water outlet at the top of the tank.
The anchor was then placed at the desired depth and

100
Li 75
2:L
H-2:50Lii
0LUa 25
0I
I I I II(IIJ I I I IIflIj I I I 111111 1 II 111111 1 11 I1FI11
102 io 1 10 102
GRAIN DIAMETER (mm)
Fig. 4-16 Grain Size Distribution

83
the water flow stopped. The sand was allowed to
consolidate under its own weight for 15 minutes. The
soil was then consolidated to the desired density by
vibrating the tank with the pneumatic vibrator for 13
minutes. During this consolidation process,
counterweights attached to the anchor tie shaft allowed
the anchor to settle under its own weight and the weight
of the settling sand. This procedure resulted in the
soil values found in Table 4.3.
The effect of the fluidization and consolidation
procedure on particle size and density gradients with
depth can be found in Appendix B, sections B.2 and B.5.
4.5 MATERIAL PROPERTY REPEATABILITY
A determination of sand density reproducability by
the experimental procedure outlined in section 4.3 was
made by conducting sand cone tests at the soil's surface
and at depths of 1 ft (0.31 in) and 2 ft (0.61 in). These
tests were conducted using ASTM Dl556-82 guidelines.
Five runs were conducted at the surface and three runs
were done at depths of 1 ft and 2 ft each. The average
densities and standard deviations at each depth are given
in Table 4.3.
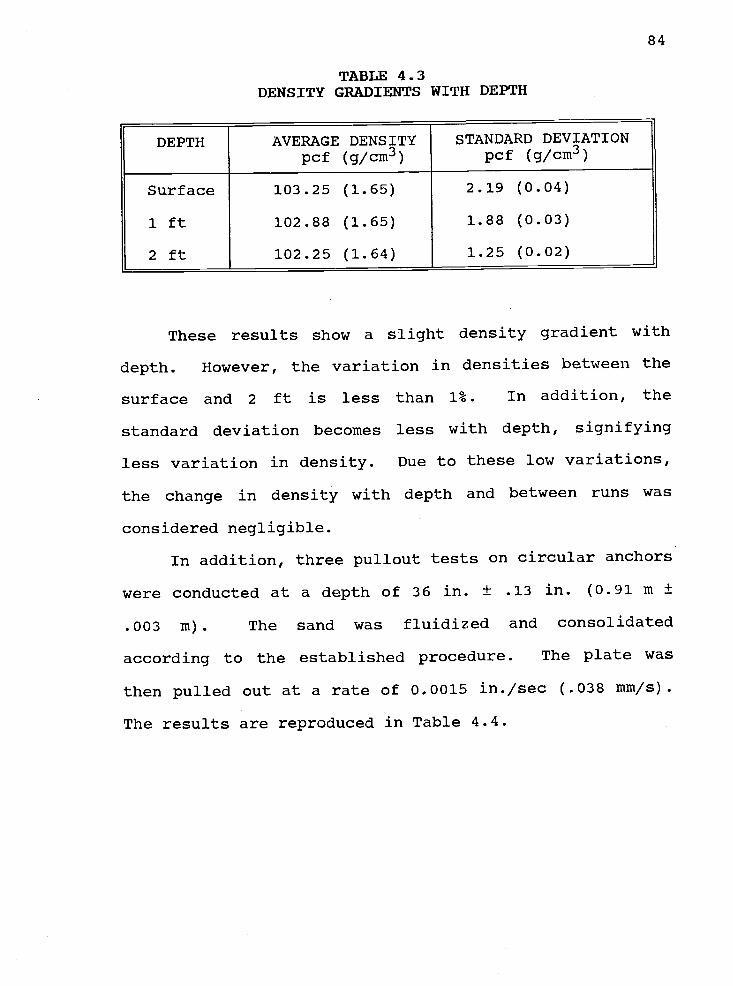
TABLE 4.3DENSITY GRADIENTS WITH DEPTH
DEPTH AVERAGE DENSITY STANDARD DEVIATIONpcf (g/cm3) pcf (g/ciu3)
Surface 103.25 (1.65) 2.19 (0.04)
1 ft 102.88 (1.65) 1.88 (0.03)
2 ft 102.25 (1.64) 1.25 (0.02)
These results show a slight density gradient with
depth. However, the variation in densities between the
surface and 2 ft is less than 1%. In addition, the
standard deviation becomes less with depth, signifying
less variation in density. Due to these low variations,
the change in density with depth and between runs was
considered negligible.
In addition, three pullout tests on circular anchors
were conducted at a depth of 36 in. ± .13 in. (0.91 in ±
.003 in). The sand was fluidized and consolidated
according to the established procedure. The plate was
then pulled out at a rate of 0.0015 in./sec (.038 minIs).
The results are reproduced in Table 4.4.
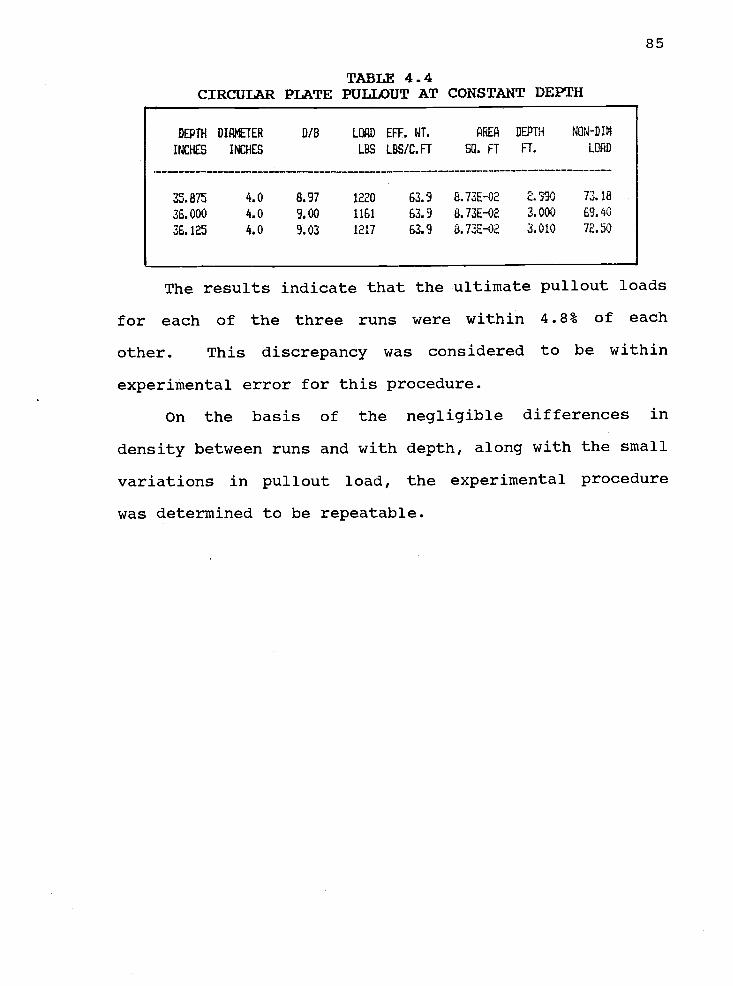
TABLE 4.4CIRCULAR PLATE PULLOUT AT CONSTANT DEPTH
DEPTH DIflNETER fl/B LOAD EFF. WI. QRE DEPTH NON-DIM
INCHES INCHES LBS LBS/C. FT SQ. FT FT. LOflD
35.875 4.0 8.97 1220 63.9 8.73E-02 2.990 73.18
36.000 4.0 9.00 1161 63.9 B.73E-02 3.000 69.O
36.125 4.0 9.03 1217 63.9 8.73E-02 3.010 72.50
The results indicate that the ultimate pullout loads
for each of the three runs were within 4.8% of each
other. This discrepancy was considered to be within
experimental error for this procedure.
On the basis of the negligible differences in
density between runs and with depth, along with the small
variations in pullout load, the experimental procedure
was determined to be repeatable.
5.0 STATIC LOADING BEHAVIOR OFANCHOR PLATES IN SAND
by RALPH A. PETEREIT1, A.M. ASCE andCHARLES K. SOLLITT2, N. ASCE
ABSTRACT: A laboratory test program is developed to
investigate the static pullout behavior of circular,
square and rectangular anchor plates in fine saturated
sand. The effect of pullout rate, load, depth of
embedment, shape and tie rod friction are examined. Test
results are compared with existing pullout theories.
Model test results reveal a specific loading rate at
which the ultimate pullout load begins to increase and
the difference in pore water pressure above and below the
anchor begins to decrease. The increased pullout load is
a result of soil dilatency. Of the three anchor shapes
examined, no significant shape effect on pullout load at
shallow depths was observed. Deep anchors, on the other
hand, appear to be influenced by plate shape. There
exists a transition depth at which a shallow anchor
becomes a deep anchor. Tie rod friction can contribute
to the ultimate static pullout load and should be
considered in the analysis of deep anchor uplift
capacity. The test results attained in the experimental
1Lieutenant, U.S. Coast Guard; Graduate Student,Oregon State University
2Chairman, Ocean Engineering Program, Oregon StateUniversity, Corvallis, OR 97331
program compare very favorably with existing analytical
theories for pullout resistance of anchors.
5.1 INTRODUCTION
The use of plate anchors to resist tensile loads and
overturning forces is quite common in civil engineering
practice. Uses include tensile support for hanging
roofs, building foundations and anchored bulkheads
(Hanna, 1982); high mast transmission towers (Adams and
Klym, 1972); mobile home support (Yokel, et al., 1982),
and cavern stabilization (Benson, et al., 1971).
Military requirements for low weight high-capacity
anchorages consist of shelter and plane tiedowns, winch
points for vehicles and suspension foot bridges (Dantz,
1966; Rocker, 1983).
Anchors in the marine environment have long been
used for the mooring of vessels. With the increase in
offshore exploration and the development of the oil
industry, the need for reliable and high capacity anchor
systems has become necessary. Today, anchors provide
support for many marine structures including buoys, oil
platforms, drydocks and submerged pipelines.
Due to the varied nature of support requirements,
many types of anchors and anchor systems have been
developed, Of particular interest is the embedded plate
anchor. Plate anchors offer many desirable features.
They can resist large vertical and lateral loads, they do

not drag across the bottom or protrude above the
seafloor, their weight is low, simplifying handling, and
they can be installed on slopes and at great depths
(Taylor, 1982).
In order to provide a better understanding of the
behavior of plate anchors a laboratory test program was
conducted to investigate the influence of pullout rate,
anchor shape, depth and tie rod friction on anchor uplift
capacity. The results from the test program are reported
herein. Pullout test results are then compared with
existing theories.
5.2 REVIEW OF UPLIFT THEORIES
A number of theories have been published describing
the behavior and passive uplift resistance of anchors.
Early theories included the friction cylinder and weight
of cone methods (Murphy, 1974). The friction cylinder
method assumes a soil failure surface extending
vertically from the plate edge to the soil's surface.
The uplift resistance is taken to be the weight of the
soil within this cylinder. The weight of cone method
assumes a failure plane extending from the anchor's edge
to the surface at an angle of 450 - /2, where is the
angle of friction. Neither method accurately describes
the actual observed soil failure mechanism.
Balla (1961) was one of the first to develop a
systematic analysis of shallow anchor failure. Through

visual observation he found that the meridian section of
the failure surface consisted of a circular arc. This
arc extended from the anchor's edge to the surface,
intersecting at an angle of 450 - /2.
By studying shallow anchor failure, Mariupol'skii
(1965) proposed that failure occurred not from sliding
along the failure surface, but from tension resulting in
vertical separation along this boundary. For the deep
anchor case, he assumed that the work necessary to
displace an anchor through a volume of soil was equal to
the work necessary to expand a cylinder of the same
volume.
In his work on the uplift loading of transmission
tower footings, Matsuo (1967, 1968) developed a shallow
anchor pullout theory that assumed an earth pressure
condition change from semi-active near the footing to
passive at the soil's surface. The cross section of the
soil's failure surface was then assumed to be a
combination of a logarithmic spiral and a tangential
straight line.
Meyerhof and Adams (1968) made simplifying
assumptions in developing a theory that assumed a failure
surface extending vertically from the edge of the footing
to the soil's surface. Uplift resistance was determined
from the cohesion and passive earth pressure acting on
this surface. General equations were developed to
describe the uplift resistance of strip, circular and
IiJ
rectangular footings.
Vesic (1971) analyzed the problem of shallow anchor
pullout by considering the expansion of cavities close to
the surface of a semi-infinite rigid-plastic solid. For
the deep anchor case, he conducted a rigorous development
of the pressure required to expand a spherical cavity.
For both the shallow and deep anchor cases, breakout
factors are used which take into account anchor depth,
soil density, cohesion, angle of friction and shear
modulus of the soil.
Sutherland, Finlay and Fadl (1983) developed a
pullout theory based on extensive laboratory testing of
circular anchors in sand. While they found that the
soil's failure surface for the shallow anchor case is
generally curved, it could be approximated by a straight
line. An approximate theory was developed using
empirical factors, the weight of the soil within the
failure volume, and the shearing resistance along the
surface bounding the failure volume.
Chattopadhyay and Pise (1986) and Murray and Geddes
(1987) used a limit equilibrium approach to determine the
maximum anchor uplift capacity. Each assumed a different
failure surface to determine the mass of the soil being
displaced. Experimental results were in close agreement
with theory in both cases.
There is currently no universally agreed upon theory
to define the ultimate vertical pullout capacity of
91
embedded anchors. This is due to the difficulty in
predicting the geometry of the soil's failure surface and
the development of relationships that apply to all soils
under every conceivable condition.
5.3 REVIEW OF EXPERIMENTAL OBSERVATIONS
In contrast to rigorous theoretical development,
many experimenters try to study only a few of the
parameters that influence anchor uplift capacity. Some
of these factors include transition depth from shallow to
deep anchor, soil density, overburden pressure, stress
history, short-term vs. long-term loading, saturation,
soil dilatency, particle breakage, soil disturbance,
anchor geometry, plate roughness, angle of anchor
inclination with the surface and earth pressure.
Further information on the influence of these parameters
is given in Petereit (1987).
5.4 LABORATORY TEST PROGRAM
A program of pullout tests was developed to
investigate the loading behavior of anchor plates in
saturated sand. The anchor plates were fabricated from
1/4 in. (6.35 mm) thick mild steel. Three anchor shapes
were used: circular, square and rectangular. The anchors
were manufactured so that each would have a surface area
of 12.57 in.2 (319.2 mm2). The geometric properties of
these anchors are outlined in Table 5.1.

TABLE 5.1ANCHOR SPECIFICATIONS
PARAMETER CIRCULAR SQUARE RECTANGULAR(1) (2) (3) (4)
DIAMETER/WIDTHa 4.00 3.55 2.19(101.6) (90.0) (55.6)
LENGTHa 355 575(90.0) (145.9)
AREAb 12.57 12.57 12.57(319.2) (319.2) (319.2)
CIRCUMFERENCEa 12.57 14.18 15.87(319.2) (360.2) (403.0)
am inches (millimeters)bin inches2 (millimeters2)
Each anchor had a removable centerpiece that
contained two Druck type PDCR-81 pore pressure gauges.
These gauges had a range of 5 psi (34.5 kPa) and were
used to measure the pore water response above and below
the plate at the intersection of the tie rod and the
plate. The centerpiece holding the pore pressure gauges
was 0.875 in. (22.23 mm) in diameter and 2 in. (50.8 mm)
long. Each plate was loaded centrally through a 0.41 in.
(10.45 mm) diameter steel tie rod. Fig. 5-1 shows the
anchors, centerpiece and pullout rod used in this
investigation.
The tests were conducted in a steel tank measuring
5.5 ft (1.68 in) in diameter and 7.5 ft (2.29 in) in
height. The large size was chosen to reduce boundary
effects at the side of the container. Previous
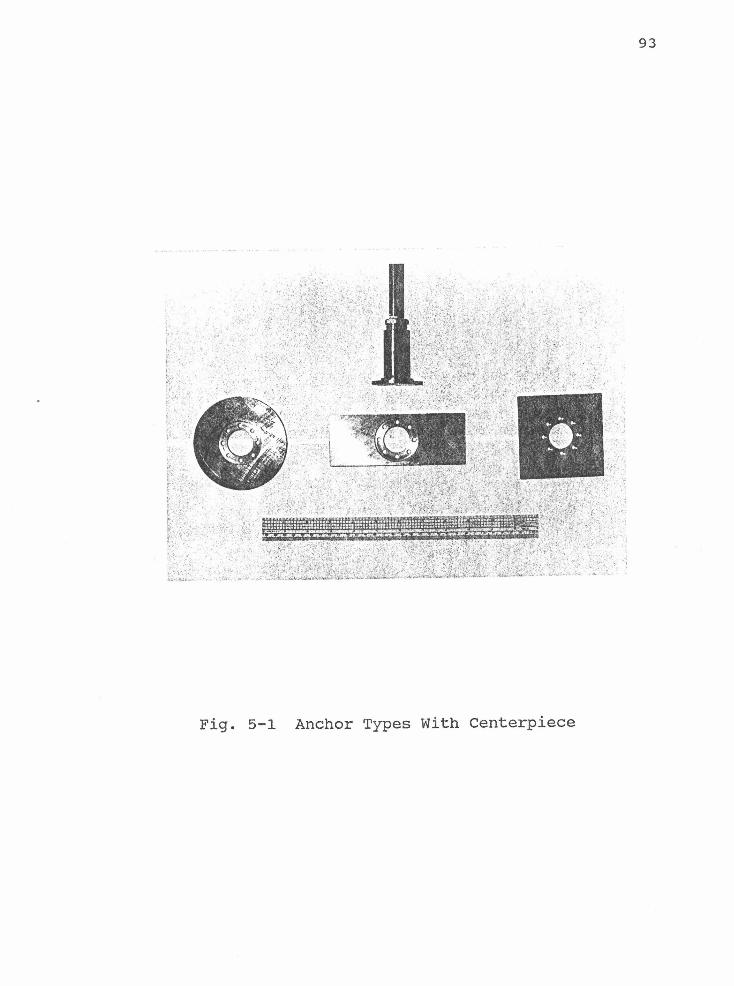
93
Fig. 5-1 Anchor Types With Centerpiece

94
researchers have established that boundary effects may
exist at a horizontal distance in excess of sixteen
anchor diameters (Andreadis, Harvey and Burley, 1981).
Ottawa 80 silica sand was used in all tests. The soil
properties are given in Table 5.2.
Due to the large quantity of sand that had to be
prepared for each test, a soil preparation method was
developed that would produce repeatable densities with a
minimum amount of time and effort. A manifold system,
consisting of a central 4.03 in. (102.3 mm) I.D. PVC pipe
and five equispaced orthogonal 1.05 in. (26.6 mm) I.D.
PVC distribution lines, was installed at the bottom of
the tank and covered with gravel. The purpose of this
pipe was to evenly disperse the water used to fluidize
the soil during preparation. A sheet of geotextile
material was laid over the gravel layer and sealed in
place at the tank wall. Another layer of gravel was
placed on top of the geotextile to hold it down during
the fluidization process. To this was added 10,700 lb
(4854 kg) of clean, uniform Ottawa 80 silica sand. The
test container is shown in Fig. 5-2.
The sand was then fluidized by forcing water up
through the soil at a rate of 0.1 ft3/sec (0.0028 m3/s)
for a period of 25 minutes. While this flow rate was
more than necessary to cause liquefaction, it hastened
the process and forced any air out of the sand which may
have entered through the piping external to the tank.

TABLE 5.2SOIL PROPERTIES
NAME OTTAWA 80
SPECIFIC GRAVITY 2.65
PARTICLE SHAPE SUBANGULAR
COEFFICIENT OF UNIFORMITY, C 1.9
COEFFICIENT OF CURVATURE, C 0.9
UNIFIED SOIL SYSTEM CLASS. SP
ANGLE OF FRICTION 40°
MAXIMUM DRY DENSITya 106.1(1.70)
MINIMUM DRY DENSITYa 91.7(1.47)
IN-SITU DRY DENSITya 102.8(1.65)
EFFECTIVE UNIT DENsITya 64.0(1.02)
RELATIVE DENSITY 80 %
VOID RATIO, e 0.61
PERNEABILITYb, k 0.0055(0.014)
am lbs per cubic ft (grams per cubic centimeter)bin inches per second (centimeters per second)
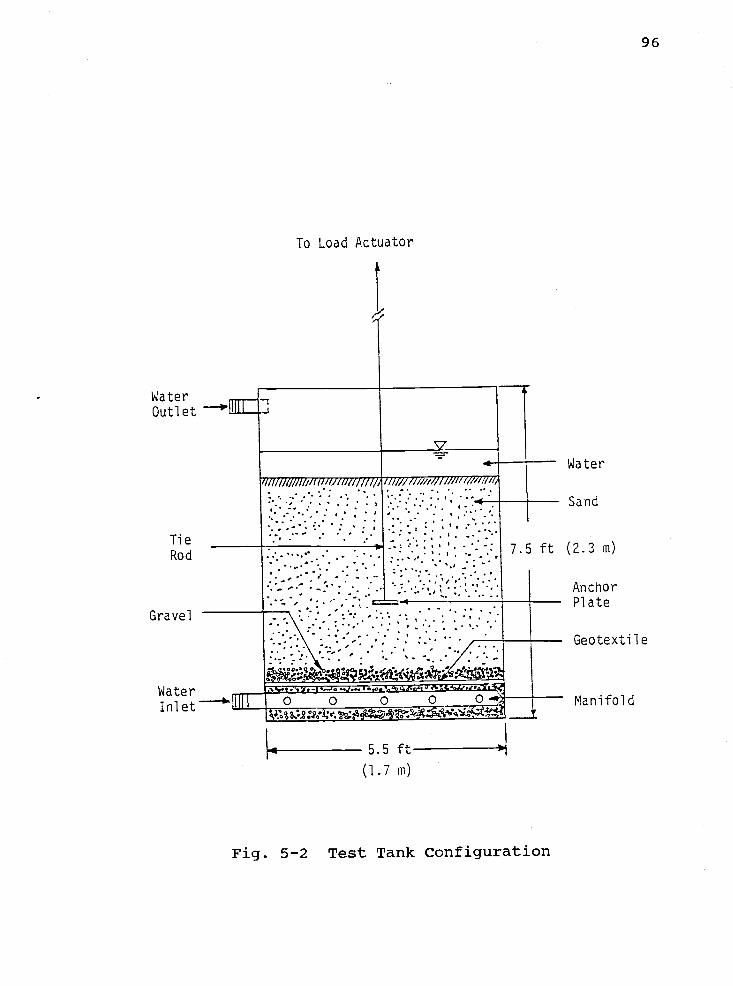
WaterOutlet 'IIIE
Ti e
Rod
Gravel
WaterInlet
To Load Actuator
'-I
_______--V1/i I//////J////Ii//I/l1/f/i/1f/ lf////////i//////J1/////f f/il,
75
-I
-
_j. J -*L. ..J.... I I
o o 0 0
5.5 ft
(1.7 m)
Water
Sand
ft (2.3 m)
Anchor- Plate
- Geotextile
Manifold
Fig. 5-2 Test Tank Configuration

97
Vibrating the tank for 13 minutes with a BH4 Long
stroke National Air Vibrator consolidated the soil to a
consistent relative density of 80%. This procedure
produced densities within 1% of each other and resulted
in repeatable anchor load errors of less than 4.8%.
To determine if particle size segregation had
occurred due to the soil preparation process, a sieve
analysis was conducted on the sand column at the surface
and at depths of 6 in. (0.15 in), 1 ft (0.31 rn), 2 ft
(0.61 in), 3 ft (0.91 in), and 4 ft (1.22 in). The analysis
was conducted after fluidizing the soil for 12 hours then
vibrating it for 13 minutes. The results showed that
most of the finer grained particles collected within the
top 6 in. (0.152 in) of the column. Below 1 ft (0.305 in)
however, the variation in mean particle size was less
than 0.5 percent and essentially equal to that of the
pre-fluidization particle size distribution.
An MTS model 506.01 hydraulic testing system was
utilized for anchor loading. Load was measured through
Strainsert Universal Flat Load cells and displacement was
measured with an LVDT. Electrical signals from the pore
pressure gauges were passed through Burr Brown model PCI
Z0044T signal conditioners and voltage amplifiers.
Electrical signals from all measurement devices were sent
through Wavetek Rockland Model 432 low pass and anti-
aliasing filters and RTI 815-F 16 Channel Analog to
Digital Converters. Data acquisition was with an IBM-XT

personal computer using UnkelscopeTM software. The
experimental setup is shown in Fig. 5-3. Details of the
experimental setup and procedure are given by Petereit
(1987)
5.5 LABORATORY TEST RESULTS
5.5.1 EFFECT OF LOADING RATE ON PULLOUT CAPACITY
The effect of loading rate on anchor pullout
capacity was investigated by loading the circular plate
at rates between 0.0007 in./sec (0.0178 mm/s) and 0.270
in./sec (6.858 minIs). The purpose of this part of the
investigation was to determine the pullout rate at which
the soil could be considered drained and unaffected by
changing pore pressure. This determination was necessary
for the static pullout tests which required drained
conditions.
As shown in Fig. 5-4, the non-dimensional pullout
load remained essentially constant below a loading rate
of approximately 0.01 in./sec (0.254 nun/s). At faster
pullout rates, the ultimate anchor load began increasing.
This increase is due to the dilative characteristics and
permeability of the sand used. Pore pressure gauges
above and below the plate, as well as at the side
boundary, showed a reduction in pore water pressure with
anchor loading for rates greater than 0.002 in./sec (0.05
minis). The magnitude of reduction, or suction, increased
as the loading rate increased.

Fig. 5-3 Experiniental Apparatus
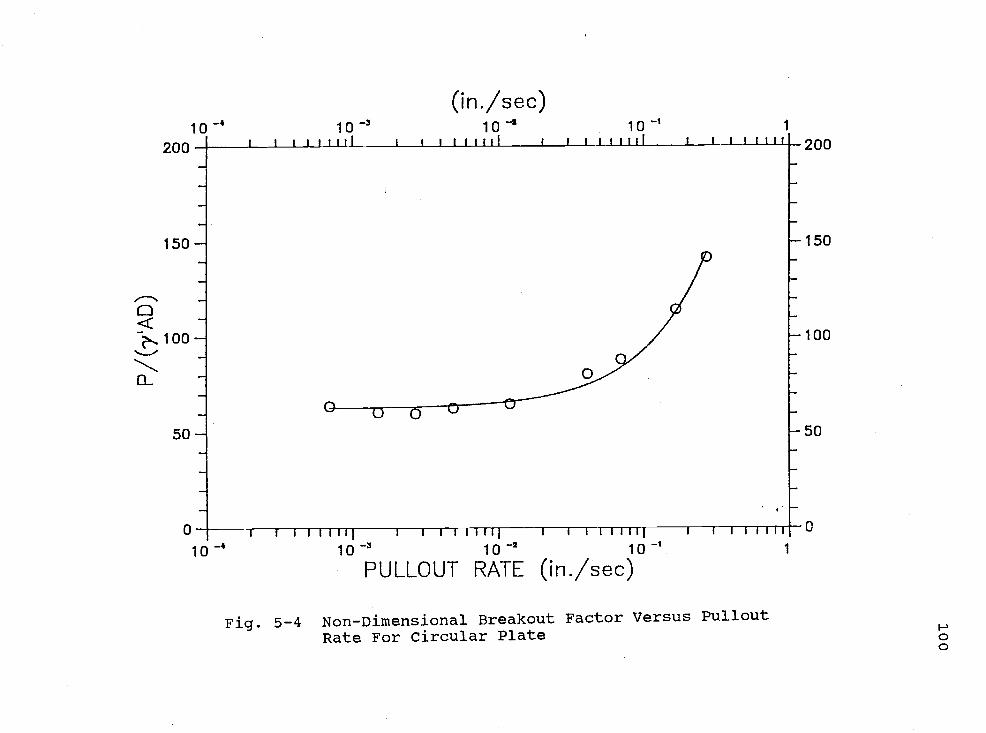
10
200
150
a100
a.
50
Ill-I
(in ./sec)
io-3 in-2 In-I I
10' 10_z 10_I
PULLOUT RATE (in./sec)
150
100
'I
Fig. 5-4 Non-Dimensional Breakout Factor Versus Pullout
Rate For Circular Plate 0

101
When the pore water pressure above the anchor is
subtracted from that below and compared with pullout rate
(Fig. 5-5), a general increase in suction is noted with
increasing rate. Negative values indicate lower pressure
below the plate than above it. This increase is
insufficient to be the sole cause of the increased
pullout capacities resulting from higher loading rates.
Below a rate of 0.002 in./sec (0.05 mm/s), the
negative pressure above the plate due to dilatency is
greater than that below the plate due to suction. In
these cases, the maximum pore pressure difference
occurred at the same time as the ultimate pullout load.
At rates higher than this, the suction below the anchor
is greater than that above it. In addition, the maximum
difference, which is presented in Fig. 5-5, occurred well
before the maximum pullout load, then decreased in
magnitude, sometimes becoming positive. At a pullout
rate of .070 in./sec (1.78 mm/s), the difference became
positive almost immediately after loading commenced.
This indicates that breaking of suction below the plate
occurred early.
As a result of these findings, a constant pullout
rate of 0.0015 in./sec (0.038 mm/s) was used in the
static pullout tests.
5.5.2 EFFECT OF LOAD UPON ANCHOR DISPLACEMENT
Typical load displacement curves for the circular
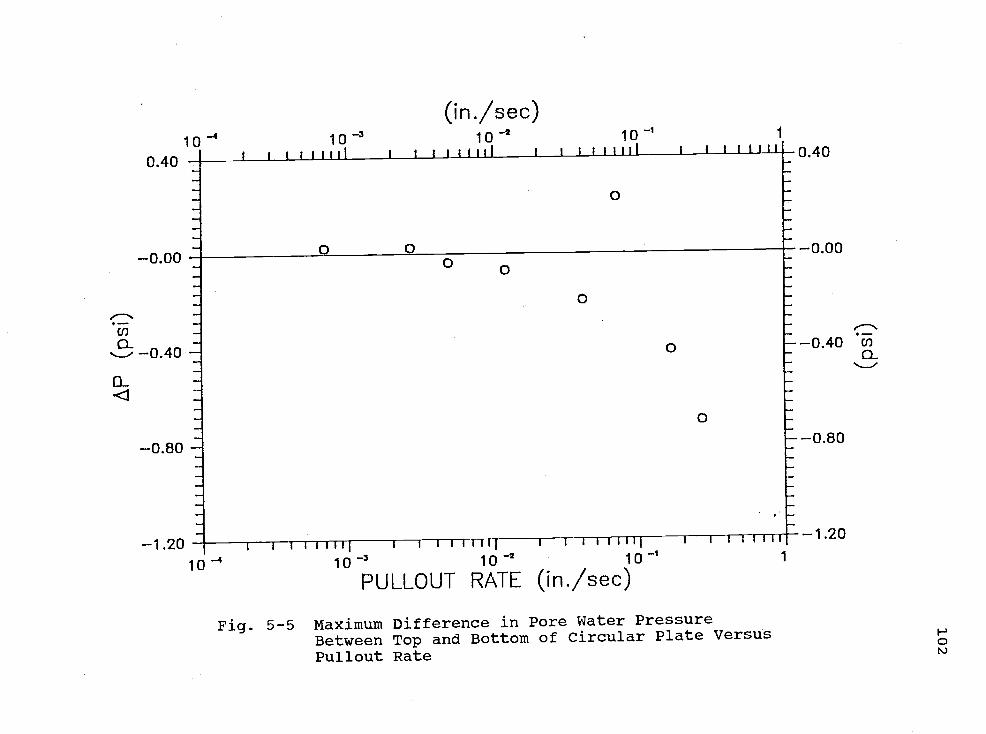
0.40
KI1iJ
C,)
CLs.' 0.40
0
eWII1
1.2010
(in ./sec)10_2 ioI
io 10_2 io
PULLOUT RATE (in./sec)
Fig. 5-5 Maximum Difference in Pore Water PressureBetween Top and Bottom of Circular Plate VersusPullout Rate
0.40
0.400
1.20
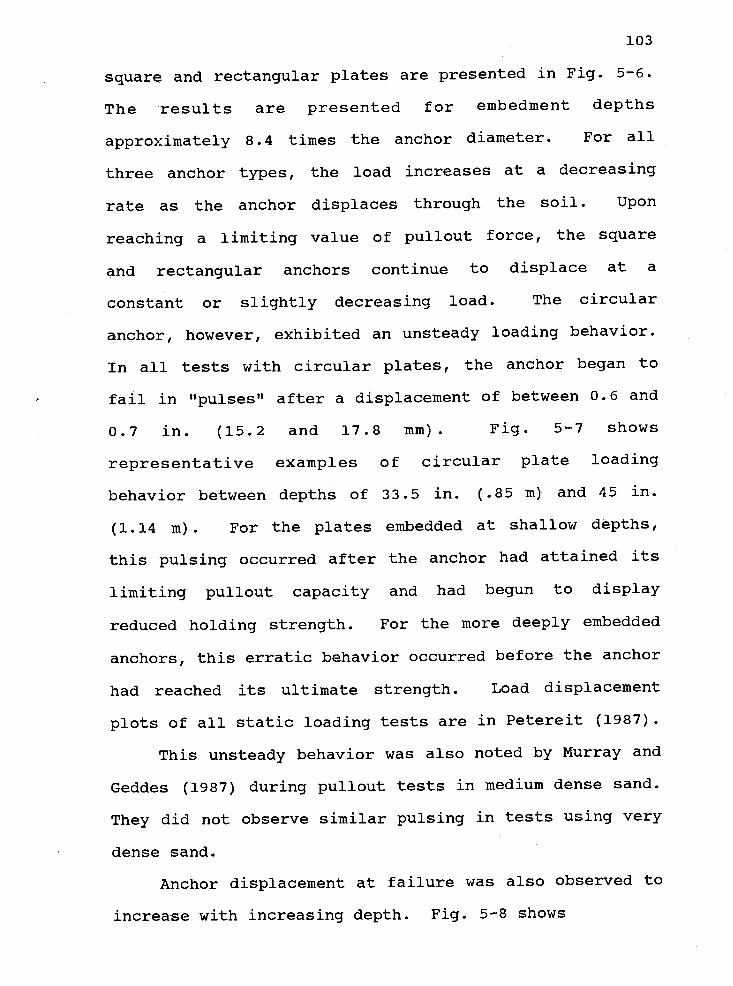
103
square and rectangular plates are presented in Fig. 5-6.
The results are presented for embedment depths
approximately 8.4 times the anchor diameter. For all
three anchor types, the load increases at a decreasing
rate as the anchor displaces through the soil. Upon
reaching a limiting value of pullout force, the square
and rectangular anchors continue to displace at a
constant or slightly decreasing load. The circular
anchor, however, exhibited an unsteady loading behavior.
In all tests with circular plates, the anchor began to
fail in "pulses" after a displacement of between 0.6 and
0.7 in. (15.2 and 17.8 mm). Fig. 5-7 shows
representative examples of circular plate loading
behavior between depths of 33.5 in. (.85 m) and 45 in.
(1.14 m). For the plates embedded at shallow depths,
this pulsing occurred after the anchor had attained its
limiting pullout capacity and had begun to display
reduced holding strength. For the more deeply embedded
anchors, this erratic behavior occurred before the anchor
had reached its ultimate strength. Load displacement
plots of all static loading tests are in Petereit (1987).
This unsteady behavior was also noted by Murray and
Geddes (1987) during pullout tests in medium dense sand.
They did not observe similar pulsing in tests using very
dense sand.
Anchor displacement at failure was also observed to
increase with increasing depth. Fig. 5-8 shows
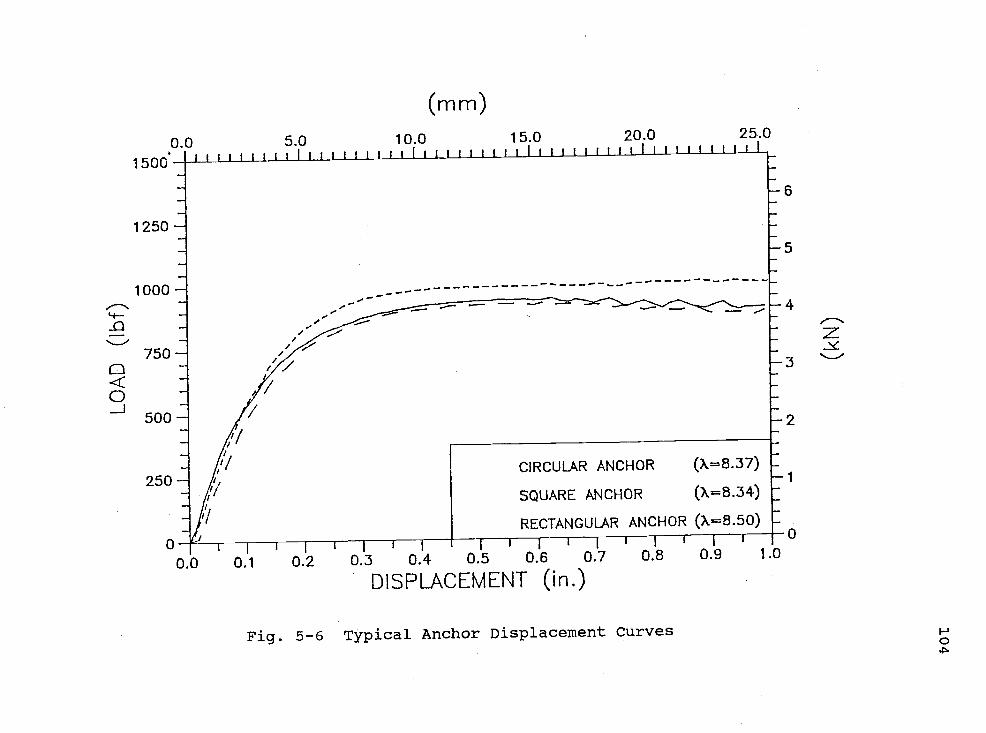
(mm)
I LLi Li ILJ. t I U Ii U LILJ LLI L LLLLI I U, L 1 L11i I LL.L L 1I_I
-6
1250--5
_______________________-
- - - - -4- --.-
750-o - -3
500- :2
250CIRCULAR ANCHOR (x=8.37)
: SQUARE ANCHOR (x=8.34) :
: RECTANGULAR ANCHOR (x=s.5o) :
0.0 0.1 0.2 0.3 0.4 0.5 0.6 0.7 0.8 0.9 1.0
DISPLACEMENT (in.)
Fig. 5-6 Typical Anchor Displacement Curves 0
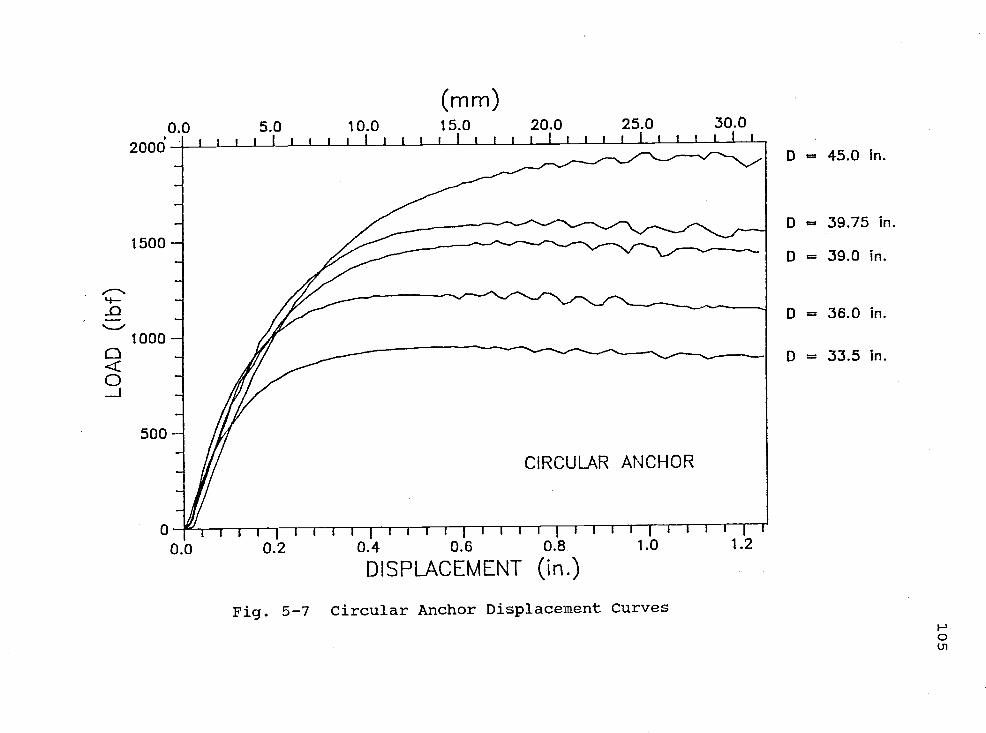
Ijil
i.isi.l
1500
1000a0J
500
(mm)5.0 10.0 15.0 20.0 25.0 30.0
0.2 0.4 0.6 0.8 1.0 1.2
DISPLACEMENT (in.)
Fig. 5-7 Circular Anchor Displacement Curves
0 45.0 in.
0 = 39.75 in.
D = 39.0 in.
0 = 36.0 in.
0 = 33.5 in.
0Lfl
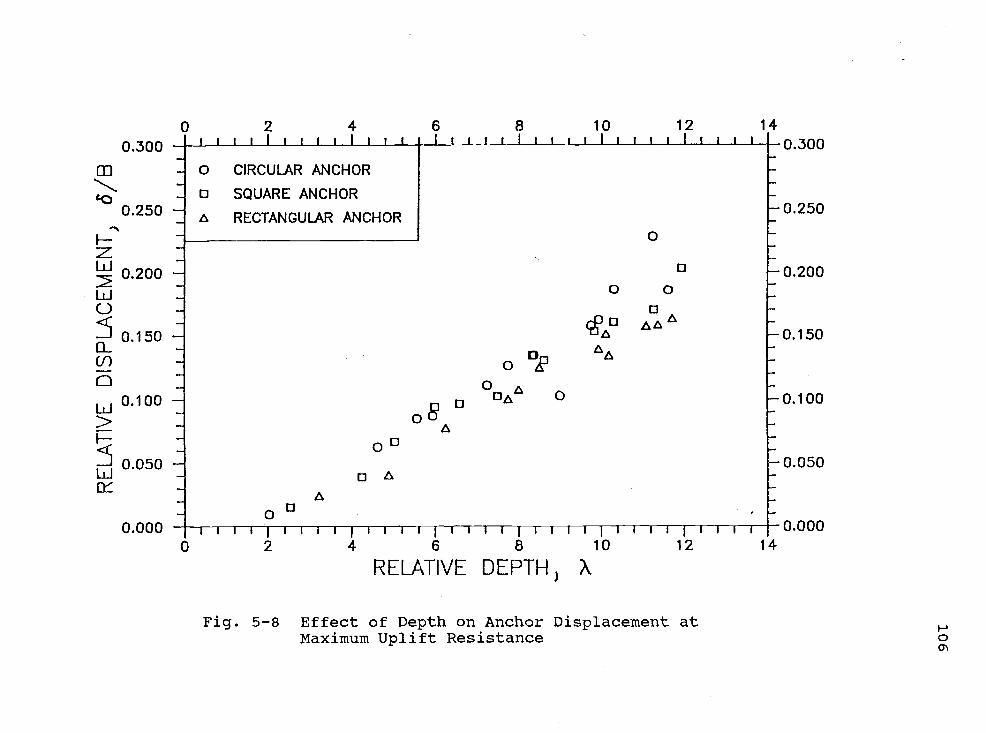
LS1iII
0.250
Iz0.200
0.150
aLii
0.100
>
0.050
[u1s1aIs
0 2 4 6 8 10 12 14
0.300
RELATIVE DEPTH) X
Fig. 5-8 Effect of Depth on Anchor Displacement atMaximum Uplift Resistance
0.250
0.200
0.150
0.100
['Allilli
[UXIIIIIJ
0
107
the increase in displacement as a function of relative
anchor depth. The displacement at maximum load was taken
to be the point where the anchor began displacing at
constant load or prior to observing a load decrease,
whichever occurred first. For the deep circular anchor,
which experienced unsteady behavior prior to failure, the
displacement at the onset of zero average slope was used.
Interestingly, the rectangular plate consistently
displaced less at failure than the circular and square
plates, and the square plate displaced slightly less than
the circular plate.
5.5.3 EFFECT OF RELATIVE DEPTH AND ANCHOR SHAPE
As with anchor displacement at failure, an increase
in pullout capacity with depth was also evident. Fig.
5-9 is a plot of the non-dimensional pullout load as a
function of relative depth. All three anchor types
exhibited an increasing load with depth. For ) less
than approximately 8.5, there was no observable
difference in maximum pullout load between the three
anchor shapes. It would appear that of the three anchor
shapes considered, none had a superior holding capacity
below this relative depth. Beyond a > value of 9
however, the load was significantly higher for the
circular plate than for the square and rectangular
plates. While no sediment surface displacement readings
were taken, a X value of 9 appeared to be the transition

I]
a50
0
25
Li]
2 4 10 12 14
100
RELATIVE DEPTH) X
Fig. 5-9 Influence of Depth on Maximum Uplift Resistance
75
50
25
109
depth between a shallow and a deep mode of failure. At
this value, a curve drawn through the data points
transitions from concave to convex. This inflection
point was noted by Sutherland, Finlay and Fadl (1983) to
coincide with the earliest detection of surface
displacement.
Beyond a ) value of 11, the data is scattered and a
few of the anchor tests even exhibited a decrease in
maximum uplift resistance with increasing relative depth.
This is not possible, even for deep anchors where the
soil's failure surface no longer reaches the surface
boundary. As a minimum, overburden pressure due to the
weight of the sand above the limiting depth would still
result in slightly increasing loads.
One reason for this variant behavior may be due to
the close proximity of the bottom boundary. The
geotextile separating the sand mass from the filter
gravel was located at a depth of 48 in. (1.22 m) or a
value equal to 12. The relative closeness of the anchor
to this boundary may have affected its loading behavior.
At a )value greater than 11, the anchor was within 4
in. (101 mm) of the bottom.
The influence of the side wall boundary on the soil
failure mechanism would appear to be negligible. The
tank wall was approximately 8 anchor diameters away.
Pore pressure readings at the tank wall revealed changes
less than .001 psi for loading rates less than 0.002
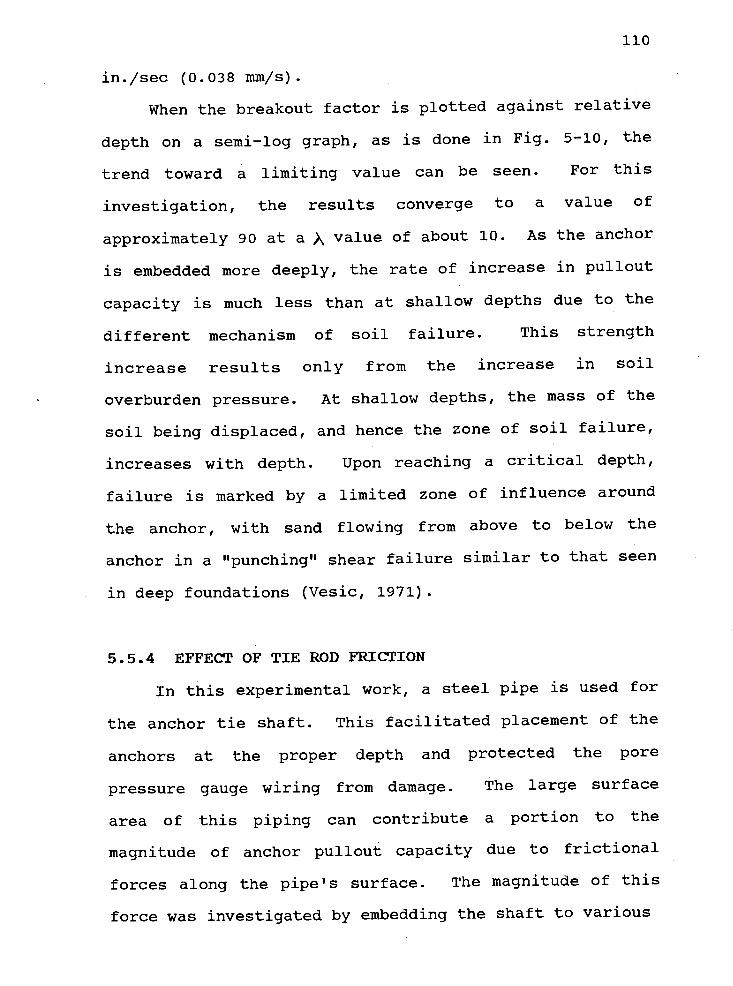
110
in./sec (0.038 iwm/s).
When the breakout factor is plotted against relative
depth on a semi-log graph, as is done in Fig. 5-10, the
trend toward a limiting value can be seen. For this
investigation, the results converge to a value of
approximately 90 at a A value of about 10. As the anchor
is embedded more deeply, the rate of increase in pullout
capacity is much less than at shallow depths due to the
different mechanism of soil failure. This strength
increase results only from the increase in soil
overburden pressure. At shallow depths, the mass of the
soil being displaced, and hence the zone of soil failure,
increases with depth. Upon reaching a critical depth,
failure is marked by a limited zone of influence around
the anchor, with sand flowing from above to below the
anchor in a "punching" shear failure similar to that seen
in deep foundations (Vesic, 1971).
55.4 EFFECT OF TIE ROD FRICTION
In this experimental work, a steel pipe is used for
the anchor tie shaft. This facilitated placement of the
anchors at the proper depth and protected the pore
pressure gauge wiring from damage. The large surface
area of this piping can contribute a portion to the
magnitude of anchor pullout capacity due to frictional
forces along the pipe's surface. The magnitude of this
force was investigated by embedding the shaft to various
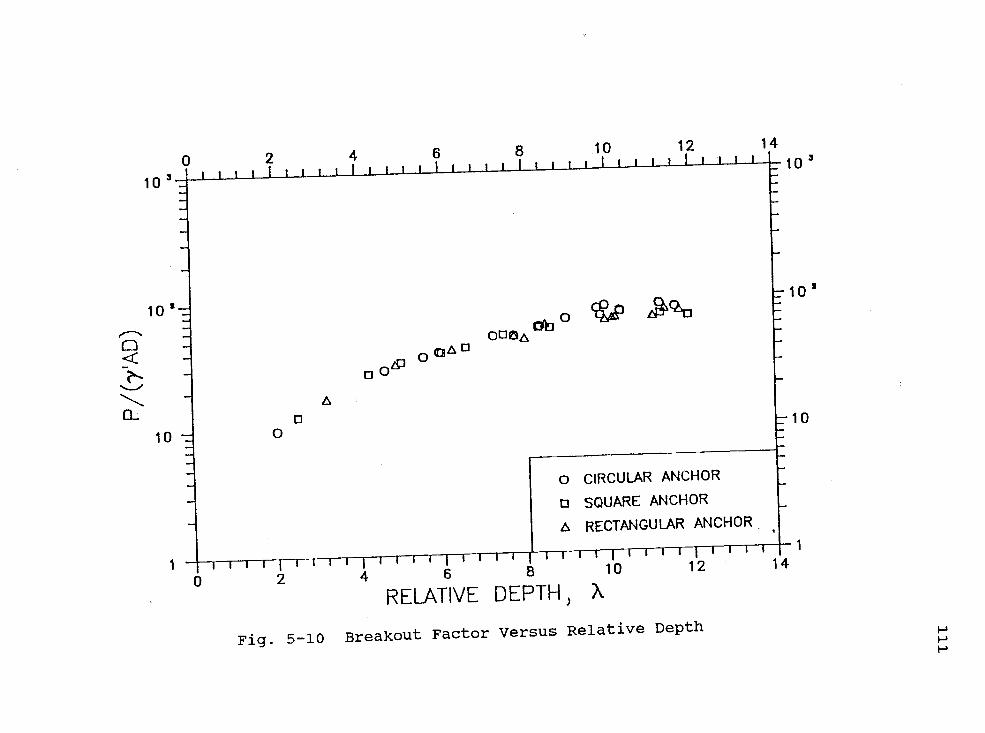
0
0
0
10*
10
2 410 12 14
io3
0 2 4 6 8 10 12
RELATIVE DEPTH X
Fig. 5-10 Breakout Factor Versus Relative Depth
14
102
10
fJ

112
depths and pulling it out at a constant rate of 0.0015
in./sec (0.038 min/s). This is the same rate at which the
static anchor pullout tests were conducted. As shown in
Fig. 5-11, the frictional load increases with depth.
The rate of increase also increases with depth. At
shallower depths, this frictional force is as high as 17%
of the anchor load. This percentage decreased to 10% at
greater depths. At shallow depths, the rod becomes part
of the pulled out soil mass and frictional forces can be
ignored. At deeper depths, part of the tie rod is
outside the soil failure zone and may need to be
considered in the analysis of anchor uplift capacity.
5.5.5 COI4P2RISON OF STATIC CAPACITY OF CIRCULAR PLATESWITh PUBLISHED THEORIES
The results of the circular anchor pullout tests are
compared with the theoretical work of other investigators
in Fig. 5-12. The magnitude of the anchor uplift
capacity was not reduced by the tie rod friction in the
comparison. Each of the theories plotted was calculated
at an angle of friction of 40°.
The test results agree well with some of the
theories. A limited number of tests were conducted to
compare with shallow anchor theories at very shallow
(D/B < 4) depths. The theory by Balla (1961) appears to
be relatively close, while that by Matsuo (1968) tends to
be slightly conservative.
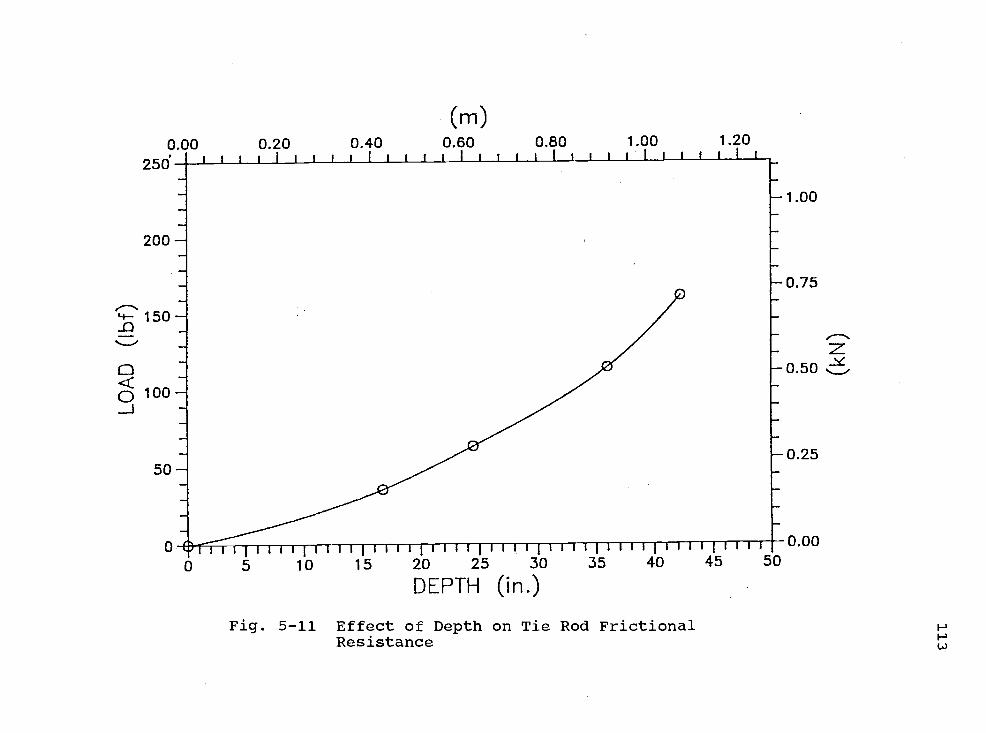
o nfl
250'
200
150
ao 100
50
(m)fl 9fl u14fl ft80 0.80 1.00 1.20
.1u5 10 15 20 25
DEPTH (in.)
Fig. 5-il Effect of Depth on Tie Rod FrictionalResistance
1.00
0.75
0.25
('XIII]
z

0
0
0
1004
75
25
2 4
WRIUPOL'SKII(l9ez)
6 8 10 12 14I i i i , I , i i i I i i , ' ' ' '
Fp 1°
0
/0 j96B)
5Q
25
I EXPERIMENTAL DATA
BALLA (1961)0 CIRCULAR ANCHOR
u t it
' ' 'i
' ' t i i j j J I gI
I [ -0
2 4 6 8 10 12 14
x
Fig. 5-12 Comparison of Experimental Data withPublished Theories After Deducting Tie Rod
Friction (ci=40°)
115
For relative depths greater than four, the theories
by Sutherland, Finlay and Fadi (1983), Chattopadhyay and
Pise (1986) and Murray and Geddes (1987) describe the
anchor uplift capacity most closely. The greatest
discrepancy comes from the determination of the critical
einbedment depth. Meyerhof and Adams (1968) limit the
maximum D/B ratio to 7 for an angle of friction of 400.
Sutherland, Finlay and Fadl (1983) specify a value
between 9 and 10 for the soil used in this experiment,
but their breakout factor rises too sharply beyond this
point. The theories by the Naval Civil Engineering
Laboratory (Beard, 1980) and Meyerhof and Adams (1968)
tend to be conservative.
5.6 CONCLUSIONS
Laboratory tests were conducted to determine the
pullout behavior of anchor plates in fine saturated sand.
Based on these test results, the following may be
concluded:
(1) Medium scale anchor pullout tests can be
conducted in test containers utilizing soil
fluidization/consolidation techniques for soil
preparation.
(2) For the specific soil studied there exists a
loading rate below which anchor pullout can be considered
static and soil conditions essentially drained.
(3) Circular anchors in dense sand exhibit unsteady

116
pullout behavior after displacing a certain distance.
Square and rectangular anchors did not exhibit this
behavior.
(4) The ultimate pullout load of anchor plates
increases with depth. Beyond a certain transition depth
the anchor is considered deep and the uplift capacity
increases at a slower rate.
(5) The three anchor shapes considered had little
influence upon pullout load at shallow depths, while the
circular plate exhibits a higher pullout resistance at
greater depths.
(6) Anchor displacement at maximum pullout load is
greatest for the circular plate and least for the
rectangular plate.
(7) Tie rod friction can contribute a significant
amount to deep anchor uplift capacity.
5.7 ACKNOWLEDGEMENTS
This work was funded by the
Guard. The authors would like to
Vinson for his insight into soil
Dibble, Dave Standley and Andy
invaluable technical support in i
acquisition and soil analysis.
United States Coast
thank Professor Ted
behavior, and Terry
Brickman for their
nstrunientat ion, data
117
5.8 REFE1ENCES
Andreadis, A., R.C. Harvey and E. Burley (1981).Embedded Anchor Response to Uplift Loading, Journiof Geotechnjcal Engineering, ASCE, Vol. 107, No.
GT1, Jan., pp. 59-78.
Adams, J. I. and T.W. Klym (1972). A Study of Anchoragesfor Transmission Tower Foundations, CanadianGeotechnical Journal, Vol. 9, No. 89, pp. 89-104.
Balla, A. (1961). The Resistance to Breaking Out ofMushroom Foundations for Pylons, Proceedings, 5thInternational Conference on Soil Mechanics andFoundation Engineering, Vol. 1, pp. 569-576.
Beard, R.M. (1980). "Holding Capacity of Plate Anchors,"Tech Report R-882, NCEL, Port Hueneme, California,Oct..
Benson, R.P., R.J. Conlon, A.H. Merritt, P. Joli-Coeurand D.U. Deere (1971). "Rock Mechanics andChurchill Falls," Symposium on Underground RockChambers, Phoenix, Arizona, Jan., pp. 407-486.
Chattopadhyay, B.C. and P.J. Pise (1986). Breakout Resis-tance of Horizontal Anchors in Sand, Soils andFoundations, Vol. 26, No. 4, Dec., pp. 16-22.
Dantz, P.A. (1966). "Light Duty, Expandable Land Anchor(30,000 Pound Class)," Tech Report R-472, NCEL,Port Hueneme, California, Aug..
Hanna, T.H. (1982), Foundations in Tension - GroundAnchors, Series on Rock and Soil Mechanics, Vol. 6.Transtech Publications; New York, New York.
Mariupol'skii, L.G. (1965). The Bearing Capacity ofAnchor Foundations, Soil Mechanics and FoundationEngineering, No. 1, pp. 26-32.
Matsuo, M. (1967). Study on Uplift Resistance of Footings(I), Soils and Foundations, Vol. 7, No. 4, Dec., pp.1-37.
Matsuo, M. (1968) Study on Uplift Resistance of Footings(II), Soils and Foundations, Vol. 8, No. 1, Mar.,
Pp. 18-48.
Meyerhof, G.G. and J.I. Adams (1968). The Ultimate UpliftCapacity of Foundations, Canadian GeotechnicalJournal, Vol. 5, No. 4, Nov., pp. 225-244.
118
Murphy, D. J. (1974). "Earth and Rock Anchors: A Review,"presented at the June 1974, ASCE GeotechnicalDivision Specialty Conference Workshop On AnalysisAnd Design Of Flexible Retaining Structures, held atAustin, Texas.
Murray, E.J. and J.D. Geddes (1987). Uplift of AnchorPlates in Sand, Journal of Geotechnical Engineering,ASCE, Vol. 113, No. 3, Proc. Paper 21301, Mar., pp.202-215.
Petereit, R.A. (1987). "The Static and Cyclic PulloutBehavior of Plate Anchors in Fine Saturated Sand,"thesis presented to Oregon State University, atCorvallis, Or., in 1987, in partial fulfillment ofthe requirements for the degree of Master of OceanEngineering.
Rocker, R.K. (1983) "Development of High-Capacity Ex-pedient Anchors for Shoreside Military Application,"Tech Note N-1660, Port Hueneme, California, Mar.
Sutherland, H.B., T.W. Finlay and M.O. Fadl (1983).Uplift Capacity of Embedded Anchors in Sand,Behaviour of Offshore Structures, C. Chryssostomidisand J.J. Conner, ed., Vol. 2, Hemisphere Publ.Corp., pp. 451-463.
Taylor, R.J. (1982). "Interaction of Anchors with Soiland Anchor Design," Tech Note N-l627, NCEL, PortHueneme, California, Apr..
Vesic, A.S. (1971). Breakout Resistance of ObjectsEmbedded in Ocean Bottom, Journal of the SoilMechanics and Foundation Division, ASCE, Vol. 97,No. SM 9, Proc. Paper 8372, Sep., pp. 1183-1205.
Yokel, F.Y., R.M. Chung, F.A. Rankin and W.C. Charles.(1982). Load Displacement Characteristics of ShallowSoil Anchors, National Bureau of Standards, BuildingScience Serial No. 142, May.
119
I (.]i
The following symbols are used in this paper:
A = Surface area of anchor plate;
B = Diameter of circular plate, Effective diameter ofsquare and rectangular plates;
C = Coefficient of curvature;
Cu = Uniformity coefficient;
D = Depth;
Dr = Relative density of soil;
e = Void ratio;
k = Permeability;
P = Anchor uplift load;
a' = Effective (submerged) unit weight of soil;
\ = Relative depth of anchor embedment (D/B);
= Anchor displacement; and
U = Angle of internal friction of soil.
120
6.0 CYCLIC LOADING BEHAVIOR OFANCHOR PLATES IN SAND
by RALPH A. PETEREIT1, A.M. ASCE andCHARLES K. SOLLITT2, M. ASCE
ABSTRACT: A laboratory test program is developed to
investigate the cyclic pullout behavior of circular and
rectangular anchor plates in fine sand. The effects of
anchor shape, loading frequency, magnitude of load and
combined static and cyclic loading are examined.
Model test results reveal cyclic loading results in
an unceasing anchor movement, even at loads as low as 15%
of the ultimate static uplift load. Higher cyclic loads
result in higher displacement rates. When the maximum
cyclic load is kept constant, those loadings with a
higher minimum load displace slower. Peak-to-peak pore
water pressure differences above and below the plate
decrease initially, then maintain a constant value until
anchor failure occurs. No significant difference in
loading behavior between circular and rectangular anchors
appears to exist.
6.1 INTRODUCTION
The resistance of embedded plate anchors to static
uplift forces has been the subject of many experimental
1Lieutenant, U.S. Coast Guard; Graduate Student,Oregon State University
2Chairman, Ocean Engineering Program, Oregon StateUniversity, Corvallis, OR 97331
121
studies over the past two decades (Sutherland, 1965;
Kenanyan, 1966; Baker and Kondner, 1966; Esquivel Diaz,
1967; Adams and Hayes, 1967; Healy, 1971; Hanna and Carr,
1971; Harvey and Burley, 1973; Das and Seeley, 1975; and
Coip and Herbich, 1975). Theoretical analyses usually
concentrate on determining the shape of the soil failure
surface. A limit equilibrium approach is then used to
determine the ultimate static pullout force. Several
theories have been published that attempt to define the
ultimate up lift capacity of anchors (Balla, 1961;
Mariupol'skii, 1965; Matsuo, 1967, 1968; Meyerhof and
Adams, 1968; Vesic, 1971, Sutherland, Finlay and Fadi,
1983; Chattopadhyay and Pise, 1986; and Murray and
Geddes, 1987).
Embedded anchors can also be subjected to cyclic
loads. Plate anchors embedded in the seafloor can
undergo cyclic and combined static and cyclic loading due
to forces from currents, tides, vortex shedding and wave
action. With the expansion of the offshore industry
comes an increased use of and reliability on embedded
plate anchors.
In order to provide a better understanding of the
behavior of plate anchors subjected to cyclic loads, a
laboratory study was conducted to investigate the
influence of anchor shape, anchor loading frequency, load
amplitude, combined static and cyclic loading, and number
of loading cycles on the displacement characteristics of
122
plate anchors.
6.2 PREVIOUS WORK ON CYCLIC LOADING BEHAVIOR
While theoretical analyses and experimental
investigations on the static uplift behavior of anchors
is abundant (Petereit, 1987), experimental studies on the
cyclic uplift behavior of embedded anchors is relatively
scarce.
Beinben, Kalajian and Kupferman (1973) conducted
static and cyclic pullout tests of anchor plates and
flukes in loose saturated sand. Using a cyclic loading
pattern with a period of 8 seconds lasting up to 4 hours,
they noted that the net upward anchor displacement per
cycle decreased during the first few minutes but that a
constant value was soon reached. They called this
constant value the cyclic creep rate.
By extending their test interval from 4 hours to 1
week, Bemben and Kupferman (1975) found that the cyclic
creep displacement of their anchor never ceased. Visual
observations revealed that a wedge of soil formed above
the anchor. This wedge moved up together with the anchor
as it displaced through the soil. Sand was also seen to
flow from above to below the plate as the anchor was
loaded and unloaded.
Andreadis, HArvey and Burley (1981) conducted static
and cyclic loading tests on cylindrical anchors connected
to rigid tie rods in saturated sand. Using a 0.5 Hz
123
sinusoidal loading pattern they noted that as loading
began, the anchor displaced through the soil at a
decreasing rate but soon reached a steady displacement
rate. Post-cyclic static pullout tests revealed that
stiffening of the soil had occurred along with soil
density changes. Repeated loading was also found to
result in the confinement of soil stresses to a more
limited zone around the anchor.
Andreadis and Harvey (1979) developed an anchor
system that reduced the movement of soil from above to
below the anchor. While the life of the anchor was
greatly extended, cyclic creep was never completely
eliminated.
Hanna and Al-Mosawe (1981) subjected prestressed
circular anchor plates embedded in dry sand to 60 second
period square wave load pulses. While prestressing was
found to increase the life of a cyclically loaded anchor,
cyclic creep still occurred. In addition, prestress was
gradually lost as cyclic loading continued. Soil
crushing above the plate also occurred along with a
corresponding change in soil density.
During a previous study, Hanna, Sivipalan and
Senturk (1978) found that soil overconsolidation ratios
between 1 and 8 had little effect on the cyclic creep
behavior of the anchor.
Hermann (1981) defined cyclic loads as having
frequencies between 0.05 and 20 Hz, loads less than the
L
124
ultimate static uplift capacity, and peak-to-peak load
forces of at least 5% of the static anchor uplift
capacity. Conservative design curves were developed to
aid in determining the maximum cyclic loading that would
result in insignificant cyclic creep.
Clemence and Siaithling (1983) subjected single-helix
screw anchors embedded in dry sand to a 6 Hz cyclic
loading pattern. Prestressing was found to increase
anchor life only if the cyclic loading was kept below 3%
of the ultimate static load. The process of anchor
installation resulted in an increase in horizontal
stresses. These stresses decreased during cyclic
loading.
In review, cyclic loading appears to result in an
unceasing movement of the anchor through the soil. This
movement is the result of the flow of sand grains from
above to below the anchor. Prestressing has little
influence in the long-term life of a cyclically loaded
anchor. Cyclic loading also results in particle crushing
and soil stress changes in the vicinity of the anchor.
6.3 LABORATORY TEST PROGRAM
The anchor plates used in this study consist of
circular and rectangular plates manufactured from 1/4 in.
(6.35 mm) thick mild steel. The surface area of each
anchor was 12.6 ifl.2 (319 nun2). The rectangular anchor
had a length-to-breadth ratio of 2.63. Each anchor was
125
fitted with pressure gauges above and below the plate to
monitor pore water pressure changes. The plates were
loaded centrally through a 0.41 in. (10.45 mm) diameter
steel tie rod.
The tests were conducted in a steel tank measuring
5.5 ft (1.7 iii) in diameter and 7.5 ft (2.3 m) in height.
Ottawa 80 silica sand, whose properties are shown in
Table 6.1, was used in all tests. The soil was prepared
using a fluidization/consolidation technique that was
found to produce repeatable densities within 1% of each
other. An NTS hydraulic loading system was used for
anchor loading. Data acquisition was with an IBM-XT
personal computer. Details of the experimental apparatus
and procedure are given by Petereit (1987).
In this investigation, the anchor plates are
sinusoidally loaded at frequencies ranging from 0.1 to 2
Hz. The initial anchor depth for all tests is 36 in.
(.914 m) ± .25 in. (6.35 mm). This corresponds to a
depth/diameter ratio of 9, which is the transition depth
as determined in Chapter 5. The double load amplitude,
or peak-to-peak load amplitude, is varied between 75% and
15% of the ultimate static pullout load, u The maximum
static uplift load for this depth is approximately 1100
lbf. In addition combined static and cyclic loading
conditions are examined.

126
TABLE. 6.1SOIL PROPERTIES
NAME OTTAWA 80
SPECIFIC GRAVITY 2.65
PARTICLE SHAPE SUBANGULAR
COEFFICIENT OF UNIFORMITY, Cu 1.9
COEFFICIENT OF CURVATURE, C 0.9
UNIFIED SOIL SYSTEM CLASS. SP
ANGLE OF FRICTION 400
MAX. DRY DENSITY 106.1 pcf(1.70 g/cra3)
MIN. DRY DENSITY 91.7 pcf(1.47 g/cm3)
IN-SITU DRY DENSITY 102.8 pcf(1.65 g/cin3)
EFFECTIVE UNIT DENSITY 64.0 pcf(1.02 g/cra3)
RELATIVE DENSITY, Dr 80 %
VOID RATIO, e 0.61
PERMEABILITY, k 0.0144 crrt/s0.0057 in./sec
127
6.4 EFFECT OF CYCLIC LOADING. ON INITIAL ANCHORDISPLACEMENT
For all of the tests conducted there is an obvious
decrease in anchor displacement per cycle during the
first 15 cycles. Due to the nature of the data
acquisition process, displacements are not recorded again
until 120 to 160 cycles. Fig. 6-1, a load-displacement
plot of the first 12 cycles of plate loading at a
frequency of 0.5 Hz at 75% u' graphically depicts this
phenomenon. Upon initial loading, the anchor displaces a
specific distance. When it is unloaded, the anchor
rebounds, but not to its initial position. On the next
loading cycle the anchor once again displaces and
rebounds. This second rebound however, results in the
anchor returning closer to its initial position. This
results in a decreasing nonrecoverable anchor
displacement. The decrease in absolute displacement
occurs in the beginning of the cyclic loading process,
after which movement through the soil remains relatively
constant.
Upon initial loading, stresses are imparted to the
soil skeletal system and changing pore pressures occur.
Pore pressure readings taken above and below the plate,
and in the surrounding soil mass, indicate negative pore
water pressures with anchor loading and positive
pressures on unloading. This is indicative of a dilative
soil, where an increase in the soil volume results from
128
anchor loading.
6.5 EFFECT OF LOADING FREQUENCY ON ANCHOR DISPLI&CE1{ENT
The circular plate is loaded at frequencies between
0.1 and 2 Hz at double load amplitudes of 75%, 50%, and
25% of the ultimate static uplift capacity u The
rectangular plate is loaded at double load amplitudes of
75% and 50% of The results are reproduced in the
form of displacement plots in Figs. 6-2, 6-3 and 6-4 for
the circular anchor, and Figs 6-5 and 6-6 for the
rectangular anchor. From this information it appears
that there is a difference in displacement at different
frequencies. While no clear trend exists to explain the
difference in displacement at different frequencies,
loadings and anchor shape, it appears that the
comparative rate of displacement at each frequency,
manifested by the slope of the displacement curves, is
represented by a logarithmic relationship for each double
load amplitude. This rate of displacement becomes less
as the double load amplitude decreases.
6.6 EFFECT OF CYCLIC LOAD ON ANCHOR DISPLACEMENT ANDPORE WATER PRESSURE
A comparative displacement plot of the circular
plate subjected to a 0.5 Hz sinusoidal waveform at double
load amplitudes between 75% and 15% of the static uplift
capacity is presented in Fig. 6-7. The results indicate

75C
'4-
50C00J
25C
).00 0.50 1.00 1
0.02 0.04 0.06
(mm)
2.50 3.00 .0
/rrrrr -rvi rnji v-rr
0.10 0.12 0.14 0.16
129
4.00
3.00
z
2.00
1.00
0.00
DISPLACEMENT (in.)
Fig. 6-1 Load-Displacement Plot of First 12 Cyclesof Circular Plate (f=O.5 Hz, Load=75%
zwtiJ
0
P(n
0
10
10-I
10
1 1010a 10
NUMBER OF CYCLES
Fig. 6-2 Effect of Load Period on Circular AnchorDisplacement (Load = 75%
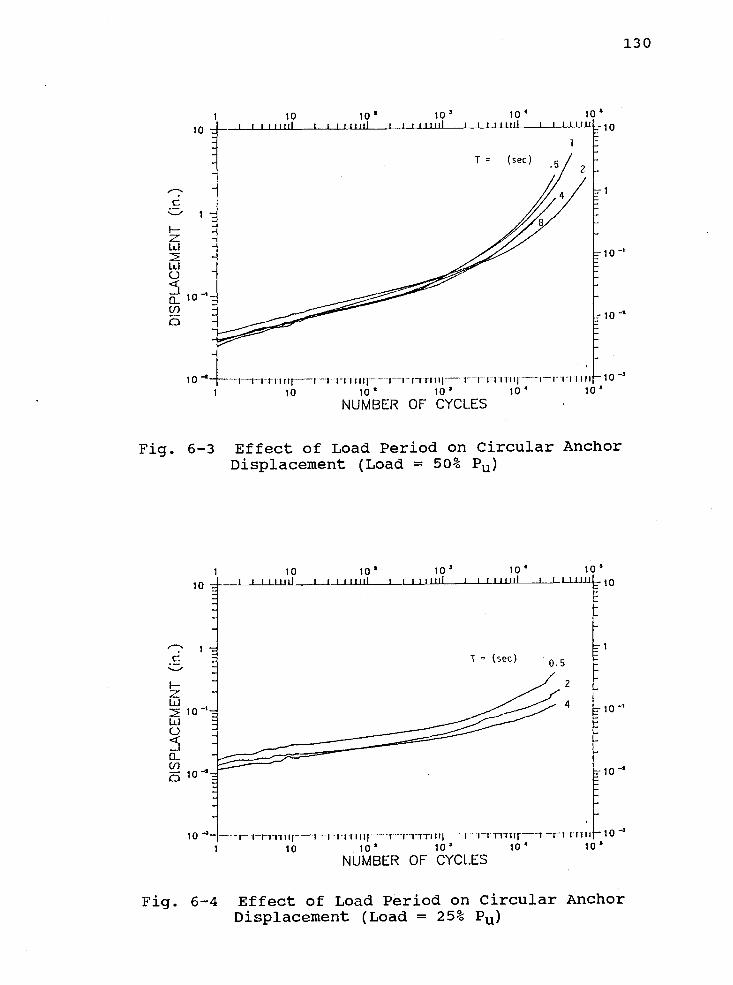
10
-,
I-zLU
uJC
1.(r)
0
130
a io iO 10'1 I I I I1I1 1.. LLH1JIL, 1. J._LILIJ. -10
10'
10 'f --r-1--rruhIl------I----i--r-rl nii--r-irirri,r,i.iinijrrrninf101 10 10' 10' 10' 10'
NUMBER OF CYCLES
Fig. 6-3 Effect of Load Period on Circular AnchorDisplacement (Load = 50% P)
10
' I
ILl
1OLU0
a-
-a10
10'
4io
2
4 10'
10-a
10 'j--r-- i-i-u-i ;i-- i-r-i--rru,t-----r------t--ru--u-i1rI--1---r-1rrrIlru -rt 1'rrIII 10
1 10 10' 10' i0 10'
NUMBER OF CYCLES
Fig. 6-4 Effect of Load Period on Circular AnchorDisplacement (Load = 25%

F-
Id
IdC-)
a.Cn
10
10'
10
1 10 10' 10
NUMBER OF CYCLES
Fig. 6-5 Effect of Load period on Rectangular AnchorDisplacenient (Load = 75% P)
131
10
C
I-.-zLu
U0a. 10(I)
D
10
10' 10' 10'i ij Lljtl L L.LUJ.111_____L_.LJLLLIJ 1 0
i rt (rrrrrrf11Tfl 10 '
1 10 10' 10' 10' 10'
NUMBER OF CYCLES
Fig. 6-6 Effect of Load Period on Rectangular AnchorDisplacement (Load = 50% u)
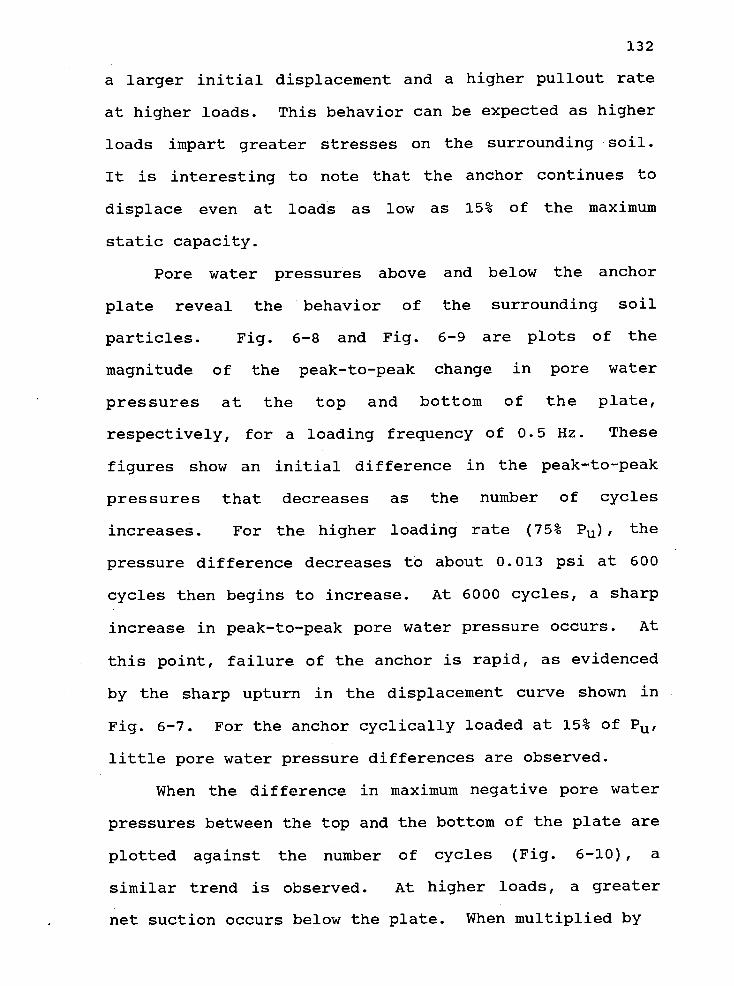
132
a larger initial displacement and a higher pullout rate
at higher loads. This behavior can be expected as higher
loads impart greater stresses on the surrounding soil.
It is interesting to note that the anchor continues to
displace even at loads as low as 15% of the maximum
static capacity.
Pore water pressures above and below the anchor
plate reveal the behavior of the surrounding soil
particles. Fig. 6-8 and Fig. 6-9 are plots of the
magnitude of the peak-to-peak change in pore water
pressures at the top and bottom of the plate,
respectively, for a loading frequency of 0.5 Hz. These
figures show an initial difference in the peak-to-peak
pressures that decreases as the number of cycles
increases. For the higher loading rate (75% )1 the
pressure difference decreases to about 0.013 psi at 600
cycles then begins to increase. At 6000 cycles, a sharp
increase in peak-to-peak pore water pressure occurs. At
this point, failure of the anchor is rapid, as evidenced
by the sharp upturn in the displacement curve shown in
Fig. 6-7. For the anchor cyclically loaded at 15% of P,
little pore water pressure differences are observed.
When the difference in maximum negative pore water
pressures between the top and the bottom of the plate are
plotted against the number of cycles (Fig. 6-10), a
similar trend is observed. At higher loads, a greater
net suction occurs below the plate. When multiplied by
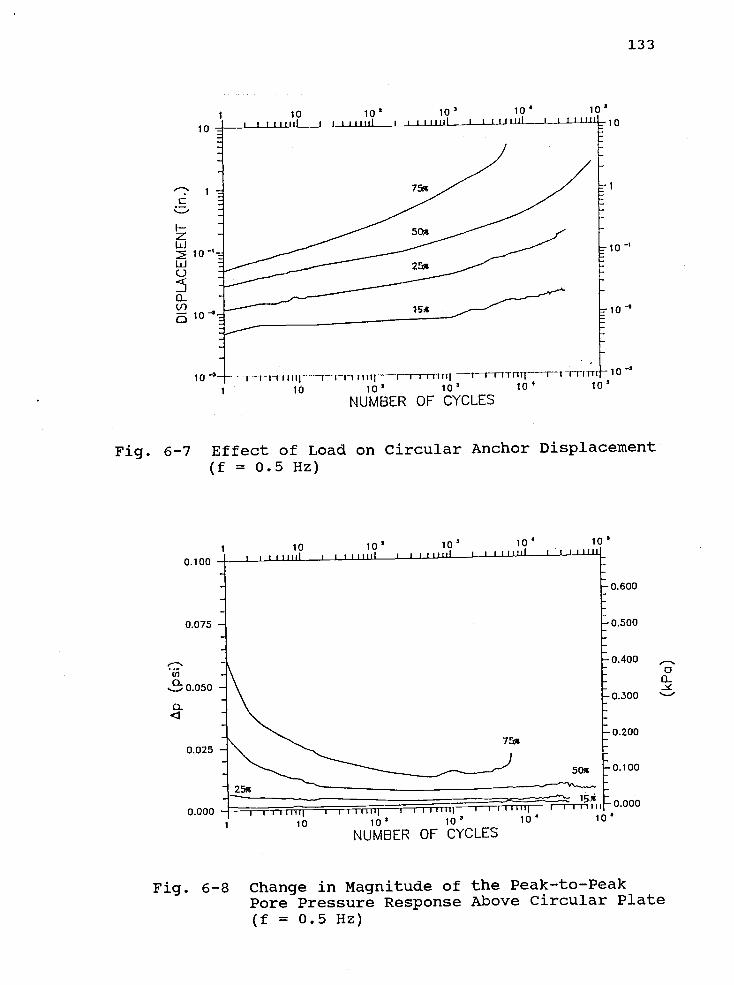
Izw10
IiJ
0
3-U)
10
133
10
10-s
10 2
10 % TIJ 1J 1rri II jIF rTt_rT11Tfr 1T1Tfl1FI rTi lTlf 10 '
102 io ioNUMBER OF CYCLES
Fig. 6-7 Effect of Load on Circular Anchor Displacement(f = 0.5 Hz)
0.100
0.075
I:',
.__- 0.050
0.025
0.000
0.600
0.500
0.400 ._.-.
a-
0.300 '-fl-
0.200
0.100
0.000
1 10 10 10 10 IV
NUMBER OF CYCLES
Fig. 6-8 Change in Magnitude of the Peak-to-PeakPore Pressure Response Above Circular Plate(f = 0.5 Hz)

0.100
0.075
(I)
a-.,o.050
1
0.025
0.000
IIII? I IIIII? IIII_.I
134
0.600
0.500
0.4000a-
0.300 '-
0.200
0.100
0.000
10 101 10' 10'
NUMBER OF CYCLES
Fig. 6-9 Change in Magnitude of the Peak-to-Peak PorePressure Response Below Circular Plate(f = 0.5 Hz)
0.000
0.010
U,
0'_, 0.015
1
0.020
0.025
0.030
0.007
0.057
00.107
0.157
0.207
10 10 10' 10' 10'
NUMBER OF CYCLES
Fig. 6-10 Difference Between the Maximum Negative PorePressures Above and Below Circular Plate(f = 0.5 Hz)

135
the area of the plate, the net force downward due to
suction is obtained. Even for the higher loads, this net
suction force is less than 0.02% of ultimate static load.
This indicates that the soil is well drained and that
suction effects have negligible influence on the cyclic
load capacity of the anchor.
6.7 EFFECT OF COMBINED STATIC AND CYCLIC LOAD ON ANCHORDISPLACEMENT AND PORE WATER PRESSURE.
The influence of a combined static and cyclic load
on anchor behavior is examined by keeping the maximum
cyclic load constant and varying the minimum load. Fig.
6-1]. is a displacement plot for the circular anchor
loaded to a maximum of 75% 'uThe minimum load is
varied between 0 and 50% of u The results indicate
that anchors with the greatest amount of unloading fail
faster than those unloaded a lesser amount. It appears
that the cyclic double load amplitude has a significant
effect on load pullout and that high maximum cyclic loads
do not necessarily result in rapid failure.
Peak-to-peak pore water pressure differences above
and below the plate show pressures that decrease in
magnitude as the number of cycles increases (Fig. 6-12
and Fig. 6-13). This trend is similar to that observed
in Fig. 6-8 and Fig. 6-9, where the maximum cyclic load
is varied but the minimum load is kept constant. As the
double load amplitude decreases, so does the peak-to-peak

5.0
4.0
3.o
uJ
w0
a(I)
1.0
0.0
IUUU 1U000 OOOitt a a liii a I a
75-0
75-10
75-25
z,uuu iLiui.
JJAILL'u(rnax)u(min)
0 5000 10000 15000 20000 25000 3000
136
0
125.0
100.0
75.0,
EE
50.0
25.0
NUMBER OF CYCLES
Fig. 6-11 Effect of Conthined Static and Cyclic Loadon Circular Anchor Displacement (f = 0.5 Hz,
Max Load = 75% P1k)
0.100
0.075
'a,
a
a
0.025
0.000
10 0 10 10 10
ii a L LI II Iti i a a it au a a a a I ial a a I 11111
u(rnaxYu(flaiI1)
75-0
75-10- 75-25-.--- 75-50I J IIII I I 1111
0.600
0.500
0.400 ,_
0a
0.300 '-P
0.200
0.100
0.000
10 1O 10 10' 10
NUMBER OF CYCLES
Fig. 6-12 Change in Magnitude of the Peak-to-Peak PorePressure Response Above Circular Plate Due toCombined Static and Cyclic Loading(f = 0.5 Hz, Max Load = 75% P)

0.100
0.060
0.060(I,
1
0.040
0.020
0.000
10 1I. 1U iv
IP
I I 1111111 I iiiiitl II
1111111 I I t_i__1J_i_tI
u (niax)'u (mit
137
0.600
0.500
0.400ci
0
0.300 -'
0.200
0.100
0.000
10 iOt 10 10 10*
NUMBER OF CYCLES
Fig. 6-13 Change in Magnitude of the Peak-to-Peak PorePressure Response Below Circular Plate Due toCombined Static and Cyclic Loading(f = 0.5 Hz, Max Load = 75% P)
0.000
0.005
0.010
ci.
a-
-0.020
0.025
0.030
0.007
0.057
0.107
0.157
0.207
10 102 10 10
NUMBER OF CYCLES
Fig. 6-14 Difference Between the Maximum Negative PorePressures Above and Below Circular Plate Dueto Combined Static and Cyclic Loading(f = 0.5 Hz, Max Load = 75% Pu)

138
pore water difference. After,a certain number of cycles,
this difference remains relatively constant as the anchor
displaces through the soil.
The difference in maximum negative pore pressure
between the top and the bottom of the plate is shown in
Fig. 6-14. While the individual curves appear unsteady
the trend is consistent with that observed in the
previous section.
Similar runs have been conducted with a maximum
cyclic load of 50% 1'u Minimum loads varied between 0
and 25%. The results are plotted in Fig. 6-15 through
Fig. 6-18. The trend is similar to those where the plate
is loaded to a maximum of 75% Pu, but with smaller
differences in peak-to-peak pore pressures.
When similar double load amplitudes with different
maximum loads are compared, as in Figs. 6-19 and 6-20, it
can be seen that those loadings with higher maximum
cyclic loads have a slightly higher displacement rate.
6.8 CONCLUSIONS
Laboratory test were conducted to determine the
cyclic pullout behavior of anchor plates in fine
saturated sand. Based on these test results, the
following may be concluded.
(1) Cyclic loading results in an unceasing anchor
movement, even at loads as low as 15% of the maximum
static uplift capacity.
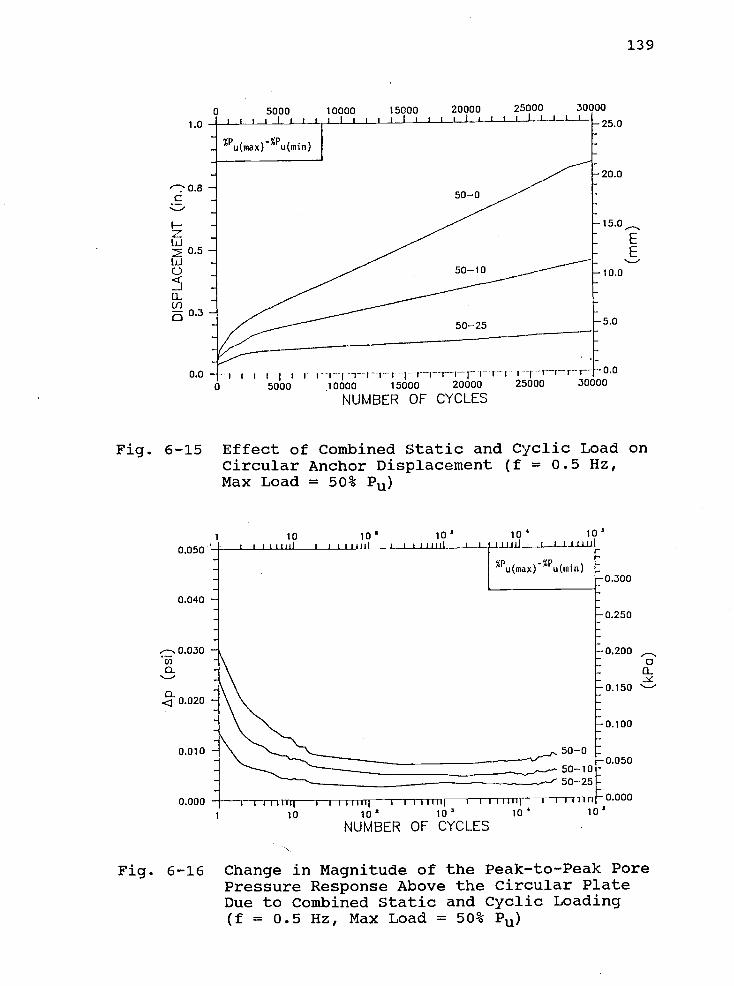
139
0 5000 10000 15000 20000 25000 30000
1.0-I I I I I I I I I
u(niax)u(rnftJ
-20.0
O.850-0
0.0 i I I IIIIri I[ rrrr 0.0
0 5000 10000 15000 20000 25000 30000
NUMBER OF CYCLES
Fig. 6-15 Effect of Combined Static and Cyclic Load onCircular Anchor Displacement (f = 0.5 Hz,Max Load = 50% Pu)
0.050
0.040
U)
- 0.020
0.010
0.000
1 10 10 10 10 10_J_J.J.LI_LLL! I I I III 1 I 1 I 11 IJj.__...L_..._..j.. _..1.1J1J.L.__.L..._L._LL.LLt
u(rnax)u(,nin)
I I I I I I I Ij I I I III II( I l I (Ill ljII a alan
0.300
0250
0.20000
0.150 -
0.100
0.050
0.000
10 102 i0 10 10'
NUMBER OF CYCLES
Fig. 6-16 Change in Magnitude of the Peak-to-Peak PorePressure Response Above the Circular PlateDue to Combined Static and Cyclic Loading(f = 0.5 Hz, Max Load = 50% u)
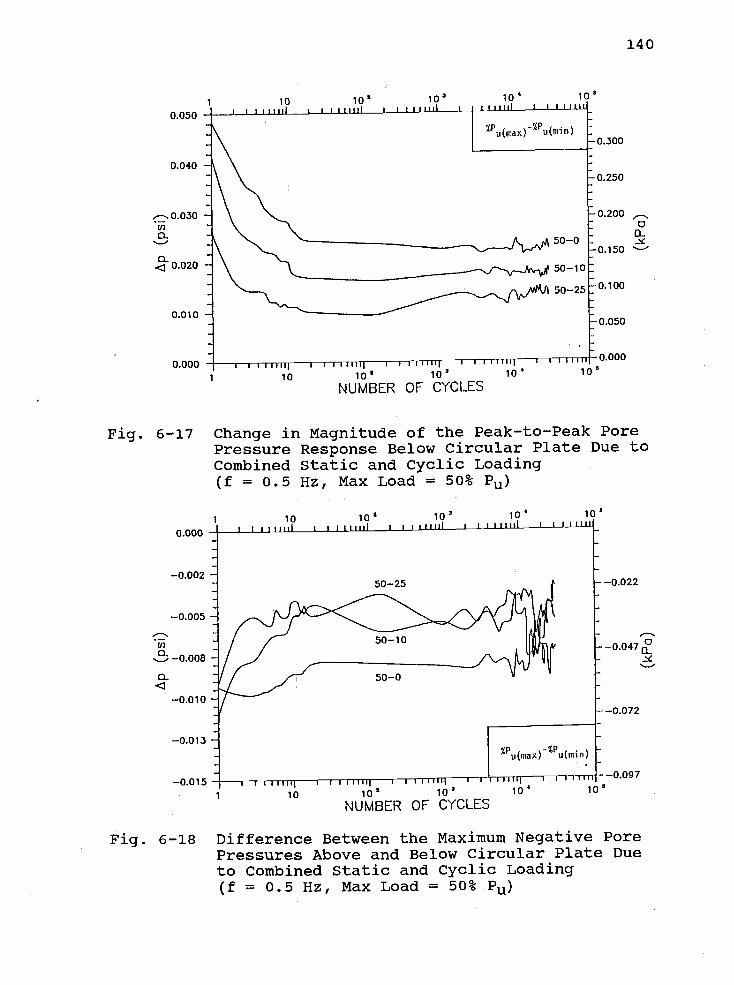
0.050
0.040
j-.:' 0.030
Cl,
cL
0.020
0.010
0.000
140
0.300
0.250
0.200 ,_..00
0.150 -'
0.100
0.050
0.000
3 4 5
10 10' 10 10 10
NUMBER OF CYCLES
Fig. 6-17 Change in Magnitude of the Peak-to-Peak PorePressure Response Below Circular Plate Due toCombined Static and Cyclic Loading(f 0.5 Hz, Max Load = 50%
0.000
0.002
0.005
C,,
CL... 0.008
CL
0.010
0.013
0.015
0.022
O.O47
0.072
0.097
1 10 10' 10' 10' 10'
NUMBER OF CYCLES
Fig. 6-18 Difference Between the Maximum Negative PorePressures Above and Below Circular Plate Dueto Combined Static and Cyclic Loading(f 0.5 Hz, Max Load = 50%

141
I.zLU
U0a. 10(I-)
a
10 '
10-I
1 10 10' 10' 10 10
NUMBER OF CYCLES
Fig. 6-19 Circular Anchor Displacement Due to 50%Double Load Amplitude
II
C
zLU
U0
a. 0(1)
a
10
10
10
10
1 10 10' 10' io lod
NUMBER OF CYCLES
Fig. 6-20 Circular Anchor Displacement Due to 25%Double Load Amplitude

142
(2) Higher cyclic loads result in a higher rate of
anchor displacement.
(3) At a constant maximum cyclic load, anchor
displacement rates decrease with increasing minimum
cyclic loads.
(4) When the double load amplitude load is kept
constant, those loadings with the higher minimum load
displace slower.
(5) Peak-to--peak pore water pressure differences
above and below the anchor decrease initially, then
maintain a constant value until anchor failure occurs.
(6) The effect of suction has a negligible
influence on cyclic pullout load.
(7) No significant differences in the loading
behavior between circular and rectangular plates appears
to exist.
6.9 ACKNOWLEDGENENTS
This work was funded by the United States Coast
Guard. The authors would like to thank Professor Ted
Vinson for his insight to soil behavior, and Terry
Dibble, Dave Standley and Andy Brickman for their
invaluable technical support in instrumentation, data
acquisition and soil analysis.
143
6.10 REFERENCES
Adams, J.I. and D.C. Hayes (1967). The Uplift Capacity ofShallow Foundations, Ontario Hydro Research Qrtly,
Vol. 19, No. 1, pp. 1-13.
Andreadis, A. and R. C. Harvey (1979). An Embedded Anchorwith an Improved Response to Repeated Loading, pp1.Ocean Res., Vol. 1, No. 4, Oct., pp. 171-176.
Andreadis, A., R.C. Harvey and E. Burley (1981). EmbeddedAnchor Response to Uplift Loading, ASCE J. Geotech.Eng. Div., Vol. 107, No. GT1, Jan., pp. 59-78.
Baker, W.H. and R.L. Kondner (1966). Pullout LoadCapacity of a Circular Earth Anchor Buried in Sand,Highway Research Record Number 108, National Academyof Sciences, National Research Council - HighwayResearch Board, pp. 1-10.
Balla, A. (1961). The Resistance to Breaking Out ofMushroom Foundations for Pylons, Proc. 5th mt.Conf. Soil Mech. Found. Eng., Vol. 1, pp. 569-576.
Bemben, S.M., E.H. Kalajian, and M. Kupferman (1973). TheVertical Holding Capacity of Marine Anchors in Sandand Clay Subjected to Static and Cyclic Loading,Offshore Technol. Conf., Vol. 2, paper 1912, pp.871-880.
Bemben, S.M. and M. Kupferivan (1975). The VerticalHolding Capacity of Marine Anchor Flukes Subjectedto Static and Cyclic Loading, Offshore Technol.Conf., paper 2185, pp. 363-374.
Chattopadhyay, B.C. and P.J. Pise (1986). BreakoutResistance of Horizontal Anchors in Sand, SoilsFound., Vol. 26, No. 4, Dec., pp. 16-22.
Clemence, S.P. and A.P. Sinithling (1983). Dynamic UpliftCapacity of Helical Anchors in Sand, CivilEngineering for Practicing and Design Engineers,Vol. 2, No. 3, pp. 345-367.
Esquivel Diaz, R.F. (1967). "Pullout Resistance of DeeplyBuried Anchors in Sand," M.S. Thesis, DukeUniversity, 57 pp.
144
Hanna, T.H. and R.W. Carr (1971). The Loading Behavior ofPlate Anchors in Normally and OverconsolidatedSands, Fourth Conf. on Soil Nech. and Found. inBudapest, Hungarian Academy of Sciences, Budapest,
Hungary, pp. 589-600.
Hanna., T.H., E. Sivapalan and A. Senturk (1978). TheBehaviour of Dead Anchors Subjected to Repeated and
Alternating Loads, Ground Eg., Vol. 11, No. 3,
Apr., pp. 38-34,40.
Hanna, T.H. and N.J. Al-Mosawe (1981). Performance ofPrestressed Anchors under Slow Repeated Loadings,Proc. Tenth mt. Conf. Soil Mech. Found. Eng., Vol.
2, Stockholm, Sweden, Jun. 15-19, pp. 127-132.
Harvey, R. C. and E. Burley (1973). Behaviour of ShallowInclined Anchorages in Cohesionless Sand, GroundEng., Vol. 6, No. 5, pp. 48-55.
Healy, K.A. (1971). Pullout Resistance of Anchors Buriedin Sand, ASCE J. Soil Mech. Found. Div., Vol. 97,
No. SM11, Nov., pp. 1615-1622.
Hermann, H.G. (1981). "Design Procedures For EmbedmentAnchors Subjected To Dynamic Loading Conditions,"Tech Report R-888, NCEL, Port Hueneme, California,Nov., 70 pp.
Kenanyan, AS. (1966). Experimental Investigation of theStability of Bases of Anchor Foundations, Soil Mech.Found. Eng., Vol. 4, No. 6, pp. 387-392.
Mariupol'skii, L.G. (1965). The Bearing Capacity ofAnchor Foundations, Soil Mech. Found. Eng., No. 1,
pp. 26-32.
Matsuo, M. (1967). Study on Uplift Resistance of Footings(I), Soils Found., Vol. 7, No. 4, pp.1-37.
Natsuo, M. (1968). Study on Uplift Resistance of Footings(II), Soils Found., Vol. 8, No. 1, pp. 18-48.
Meyerhof, G.G. and J.I. Adams (1968). The Ultimate UpliftCapacity of Foundations, Can. Geotech. J., Vol. 5,
No. 4, pp. 225-244.
Murray, E.J. and J.D. Geddes (1987). Uplift of AnchorPlates in Sand, ASCE J. Geotech. Eng, Vol. 113, No.
3, March, Proc. Paper 21301, pp. 202-215.
145
Petereit, R.A. (1987). "The Static and Cyclic PulloutBehavior of Plate Anchors in Fine Saturated Sand,"thesis presented to Oregon State University, at
Corvallis, Or., in 1987, in partial fulfillment ofthe requirements for the degree of Master of OceanEngineering.
Sutherland, H.B. (1965). Model Studies for Shaft RaisingThrough Cohesionless Soils, Pro.. Sixth Intl. Conf.Soil Nech. Found. Eng., Vol. II, Montreal, Canada,pp. 410-413.
Sutherland, H.B., T.W. Finlay and M.O. Fadi (1983).
Uplift Capacity of Embedded Anchors in Sand,Behaviour of Offshore Structures, C. Chryssostoxaidisand J.J. Conner, ed., Vol. 2, Hemisphere Pubi.Corp., 1983, pp. 451-463.
Vesic, A.S. (1971). Breakout Resistance of ObjectsEmbedded in Ocean Bottom, ASCE J. Soil Mech. Found.Div., Vol. 97, No. SM 9, Proc. Paper 8372, Sep., pp.1183-1205.
146
7.0 CONCLUSIONS
The following conclusions are made as a result of
this investigation:
(1) Medium scale anchor pullout tests can be
conducted in test containers utilizing soil
fluidization/coinpaction techniques for soil preparation.
(2) For this particular soil, there exists a
loading rate below which anchor pullout can be considered
static and soil conditions essentially drained.
(3) Circular anchors in dense sand exhibit unsteady
pullout behavior after displacing a certain distance.
Square and rectangular anchors did not exhibit this
behavior.
(4) The ultimate pullout load of anchor plates
increases with depth. Beyond a certain transition depth
the anchor is considered deep and the uplift capacity
increases at a slower rate.
(5) The three anchor shapes considered had little
influence upon pullout load at shallow depths, while the
circular plate exhibits a higher holding capacity at
greater depths.
(6) Anchor displacement at maximum pullout load is
greatest for the circular plate and least for the
rectangular plate.
(7) Tie rod friction can contribute to deep anchor
uplift capacity.
147
(8) Cyclic loading results in an unceasing anchor
movement, even at loads as low as 15% of the maximum
static uplift capacity.
(9) Higher cyclic loads result in a higher rate of
anchor displacement.
(10) At a constant maximum cyclic load, anchor
displacement rates decrease with increasing minimum
cyclic loads.
(11) Peak-to-peak pore water pressure differences
above and below the anchor decrease initially, then
maintain a constant value until anchor failure occurs.
(12) The effect of suction has a negligible
influence on cyclic pullout load.
(13) No significant differences in pullout behavior
were evident between circular and rectangular anchors.

148
8.0 RECOI4I4ENDATIONS
The following recommendations are made as a result
of this study:
(1) Anchor plates should be loaded for a greater
number of cycles through a greater displacement to
observe pore water response as the anchor nears the
surface and begins to fail rapidly.
(2) Post cyclic static pullouts should be conducted
to observe anchor behavior.
(3) The effect of different anchor embedment
techniques should be investigated.
(4) Full scale tests should be conducted to verify
the behavior observed in this investigation.

149
9.0 Bibliography
Adams, J.I. and D.C. Hayes (1967). The Uplift Capacity ofShallow Foundations, Ontario Hydro Research Ortly,
Vol. 19, No. 1, pp. 1-13.
Adams, J. I. and T.W. Klym (1972). A Study of Anchoragesfor Transmission Tower Foundations, Can. Geotech.
, Vol. 9, No. 89, pp. 89-104.
Andreadis, A., R.C. Harvey and E. Burley (1978).
Embedment Anchors Subjected to Repeated Loading,ASCE J. Geotech. Eng. Div., Vol. 104, No. GT7, Jul.,
pp. 1033-1036.
Andreadis, A. and R.C. Harvey (1979). An Embedded Anchorwith an Improved Response to Repeated Loading, Appi.Ocean Res., Vol. 1, No. 4, Oct., pp. 171-176.
Andreadis, A., R. C. Harvey and E. Burley (1981). EmbeddedAnchor Response to Uplift Loading, ASCE J. Geotech.Eng. Div., Vol. 107, No. GT1, Jan., pp. 59-78.
Baker, W.H. and R.L. Kondner (1966). Pullout LoadCapacity of a Circular Earth Anchor Buried in Sand,Highway Research Record Number 108, National Academyof Sciences, National Research Council - HighwayResearch Board, pp. 1-10.
Balla, A. (1961). The Resistance to Breaking Out ofMushroom Foundations for Pylons, Proc. 5th mt.Conf. Soil Mech. Found. Eng., Vol. 1, pp. 569-576.
Beard, R.M. (1973). "Direct Embedment Vibratory Anchor,"Tech Report R-791, NCEL, Port Hueneine, California,Jun, 29 pp.
Beard, R.N. (1979). "Long Term Holding Capacity ofStatically Loaded Anchors in Cohesive Soils," Tech
Note N-l545, NCEL, Port Hueneine, California, Jan.,
58 pp.
Beard, R.M. (1980). "Holding Capacity of Plate Anchors,"Tech Report R-882, NCEL, Port Hueneme, California,Oct., 87 pp.
Bemben, S .M., E.H. Kalaj ian, and M. Kupferman (1973). TheVertical Holding Capacity of Marine Anchors in Sandand Clay Subjected to Static and Cyclic Loading,Offshore Technol. Conf., Vol. 2, paper 1912, pp.871-880.

150
Bemben, S.M. and M. Kupferman (1975). The VerticalHolding Capacity of Marine Anchor Flukes Subjectedto Static and Cyclic Loading, Offshore Technol.Conf., paper 2185, pp. 363-374.
Benson, R.P., R.J. Conlon, A.H. Merritt, P. Joli-Coeurand D.U. Deere (1971). "Rock Mechanics and ChurchillFalls", Symposium on Underground Rock Chambers,Phoenix, Arizona, Jan., pp. 407-486.
Chattopadhyay, B.C. and P.J. Pise (1986). BreakoutResistance of Horizontal Anchors in Sand, SoilsFound., Vol. 26, No. 4, Dec., pp. 16-22.
Clemence, S.P. and C.J. Veesaert (1977). Dynamic PulloutResistance of Anchors in Sand, Intl. Syinp. SoilStruct. Interaction, 3-7 Jan., Univ. of Roorkee,Roorkee, U.P., India, pp. 389-397.
Clemence, S.P. and A.P. Smithling (1983). Dynamic UpliftCapacity of Helical Anchors in Sand, CivilEngineering for Practicing and Design Engineers,Vol. 2, No. 3, pp. 345-367.
Colp, J.L. and J.B. Herbich (1975). Inclined PulloutForces for Embedded Plate Anchors, Offshore Technol.Conf., paper 2182, pp. 333-342.
Dantz, P.A. (1966). "Light Duty, Expandable Land Anchor(30,000 Pound Class)," Tech Report R-472, NCEL,Port Hueneine, California, August, 52 pp.
Das, B.M. (1985). Principles of Geotechnical Engineering,PWS Publishers, Boston, Mass. 571 pp.
Das, B.M. and G.R. Seeley (1975). Pullout Resistance ofHorizontal Anchors, Civil Engineering in the Oceans,Proceedings, III, Jun. 9-12, Univ. of Deleware,Newark, Vol. 1, pp. 434-449.
Das, BM., R. Moreno and K.F. Dallo (1985). UltimatePullout Capacity of Shallow Vertical Anchors inClay, Soils Found., Vol. 25, No. 2, Jun., pp.148-152.
Datta, M. and P.K. Singh (1984). Anchors for OffshoreStructures - Geotechnical Aspects, Indian Geotech.
, Vol. 14, No. 4, pp. 255-281.
Esquivel Diaz, R.F. (1967). "Pullout Resistance of DeeplyBuried Anchors in Sand," M.S. Thesis, DukeUniversity, 57 pp.

151
Hanna, T.H., Foundations in Tension - Ground Anchors,Series on Rock and Soil Mechanics, Vol. 6. TranstechPublications; New York, 1982. 573 pp.
Hanna, T.H. and R.W. Carr (1971). The Loading Behavior ofPlate Anchors in Normally and OverconsolidatedSands, Fourth Conf. on Soil Mech. and Found. inBudapest, Hungarian Academy of Sciences, Budapest,Hungary, pp. 589-600.
Hanna, T.H., R. Sparks and M. Yilxnaz (1972). AnchorBehavior in Sand, ASCE J. Soil Mech. Found. Div.,Vol. 98, No. SM11, Proc. Paper 9338, Nov., pp.1187-1208.
Hanna, T.H., E. Sivapalan and A. Senturk (1978). TheBehaviour of Dead Anchors Subjected to Repeated andAlternating Loads, Ground Eng., Vol. 11, No. 3,
Apr., pp. 38-34,40.
Hanna, T.H. and M.J. Al-Mosawe (1981). Performance ofPrestressed Anchors under Slow Repeated Loadings,Proc. Tenth mt. Conf. Soil Mech. Found. Enci., Vol.2, Stockholm, Sweden, Jun. 15-19, pp. 127-132.
Hardin, B.O. (1985). crushing of Soil Particles, ASCE J.Geotech. Eng., Vol. 111, No. 10, pp. 1177-1192.
Harvey, R.C. and E. Burley (1973). Behaviour of ShallowInclined Anchorages in Cohesionless Sand, GroundEng., Vol. 6, No. 5, pp. 48-55.
Healy, K.A. (1971). Pullout Resistance of Anchors Buriedin Sand, ASCE J. Soil Mech. Found. Div., Vol. 97,No. SM11, Nov., pp. 1615-1622.
Hermann, H.G. (1981). "Design Procedures For EmbedmentAnchors Subjected To Dynamic Loading Conditions,"Tech Report R-888, NCEL, Port Hueneme, California,Nov., 70 pp.
Kenanyan, A.S. (1966). Experimental Investigation of theStability of Bases of Anchor Foundations, Soil Nech.Found. Eng., Vol. 4, No. 6, pp. 387-392.
Mariupol'skii, L.G. (1965). The Bearing Capacity ofAnchor Foundations, Soil Mech. Found. Eng.. No. 1,
pp. 26-32.
Matsuo, M. (1967). Study on Uplift Resistance of Footings(I), Soils Found., Vol. 7, No. 4, pp.1-37.
152
Matsuo, M. (1968). Study on Uplift Resistance of Footings(II), Soils Found., Vol. 8, No. 1, pp. 18-48.
Meyerhof, G.G. (1973a). Uplift Resistance of InclinedAnchors and Piles, Proc. 8th mt. Conf. Soil Mech.Found. Eng., Vol. 2, Moscow, USSR, pp. 167-172.
Meyerhof, G.G. (l973b). The Uplift Capacity ofFoundations under Oblique Loads, Can. Geotech. J.,Vol. 10, No. 1, Feb., pp. 64-70.
Meyerhof, G.G. (1976). Bearing Capacity and Settlement ofPile Foundations, ASCE J. Geotech. Eng. Div., Vol.102, No. GT3, pp. 197-228.
Meyerhof, G.G. and J.I. Adams (1968). The Ultimate UpliftCapacity of Foundations, Can. Geotech. J., Vol. 5,
No. 4, pp. 225-244.
Miura, N. (1985). Point Resistance of Piles in Sand,Proc. 11th mt. Conf. Soil Mech. Found. Eng., SanFrancisco, California, 12-16 Aug., Vol. 3, pp.1445-1448.
Murphy, D.J. (1974). Earth and Rock Anchors: A Review.A.S.C.E. Geotechnical Division Specialty ConferenceWorkshop on Analysis and Design of FlexibleRetaining Structures. Austin, Texas, Jun.
Murray, E.J. and J.D. Geddes (1987). Uplift of AnchorPlates in Sand, ASCE J. Geotech. Eng, Vol. 113, No.3, March, Proc. Paper 21301, pp. 202-215.
Ovesen, N.K. (1981). Centrifuge Tests of the UpliftCapacity of Anchors, Proc. Tenth mt. Conf. SoilMech. Found. Eng., Vol. 1, Stockholm, Sweden, June15-19, pp. 717-722.
Robinson and Taylor (1969). Selection and Performance ofAnchors for Guyed Transmissiuon Towers, Can.Geotech. J., Vol. 6, No. 2, pp. 119-137.
Rocker, R.K. (1977). "Reduction of Embedment AnchorCapacity Due to Sediment Disturbance," Tech NoteN-149l, NCEL, Port Hueneme, California, Jul., 30 pp.
Rocker, R.K. (1983). "Development of High-CapacityExpedient Anchors for Shoreside MilitaryApplication," Tech Note N-l660, Port Hueneme,California, Mar., 34 pp.
153
Rocker, R.K., ed. (1985). Handbook for MarineGeotechnical Engineering, Deep Ocean TechnologyProgram, NCEL Port Huenenie, Calif.
Rowe, R.K., and J.R. Booker (1979a). A Method of Analysisfor Horizontally Embedded Anchors in an ElasticSoil, mt. J. Numer. Anal. Methods Geoniech., Vol. 3,No. 2, Apr.-Jun., pp. 187-203.
Rowe, R.K. and E.H. Davis (1982a). The Behaviour ofAnchor Plates in Clay, Geotechnigue, Vol. 32, No. 1,pp. 9-24.
Rowe, R.K. and E.H. Davis (1982b). The Behaviour ofAnchor Plates in Sand, Geotechniciue, Vol. 32, No. 1,pp. 25-41.
Seed, H.B. and C.K. Chan (1961). Effect of Duration ofStress Application on Soil Deformation underRepeated Loading, Proc. Fifth mt. Conf. Soil Mech.and Found. Eng., Paris, Vol. 1, pp. 341-345.
Skempton, A.W. (1951). The Bearing Capacity of Clays,Building Research Congress, England.
Stewart, W. (1985). Uplift Capacity of Circular PlateAnchors In Layered Soil, Can. Geotech J., Vol. 22No. 4, Nov., pp. 589-592.
Sutherland, H.B. (1965). Model Studies for Shaft RaisingThrough Cohesionless Soils, Pro., Sixth Intl. Conf.Soil Mech. Found. Eng., Vol. II, Montreal, Canada,pp. 410-413.
Sutherland, H.B., T.W. Finlay and M.O. Fadi (1983).Uplift Capacity of Embedded Anchors in Sand,Behaviour of Offshore Structures, C. Chryssostomidisand J.J. Conner, ed., Vol. 2, Hemisphere Pubi.Corp., 1983, pp. 451-463.
Taylor, R.J. (1982). "Interaction of Anchors with Soiland Anchor Design," Tech Note N-1627, NCEL, PortHueneme, California, Apr., 44 pp.
Taylor, R.J., D. Jones and R.N. Beard (1979). Uplift-Resisting Anchors," Ocean Engineering, Vol. 6, No.1-2, pp. 3-137.
Vermneer, P.A. and W. Sutjiadi (1985). The UpliftResistance of Shallow Embedded Anchors, Proc. 11thIntl. Conf. Soil Nech. Found. Eng., San Francisco,California, 12-16 Aug. Vol. 3, pp. 1635-1638.
154
Vesic, A.S. (1963). Bearing Capacity of Deep Foundationsin Sand, HicThway Research Record No. 39, NationalAcademy of Sciences, National Research Council -
Highway Research Board, pp. 112-153.
Vesic, A.S. (1971). Breakout Resistance of ObjectsEmbedded in Ocean Bottom, ASCE J. Soil Mech. Found.Div., Vol. 97, No. SM 9, Proc. Paper 8372, Sep., pp.1183-1205.
Vesic, A.S. (1977). "Design of Pile Foundations",National Cooperative Highway Research ProgramSynthesis of Practice, No. 42, TransportationResearch Board, Wash., D.C.
Walker, R.T. (1978). "The Pullout Capacity of JettedMarine Embedment Anchors," thesis presented to theUniversity of Rhode Island at Kingston, R.I, in
1978 in partial fulfillment of the requirements forthe degree of Master of Science.
Wang, M.C., V.A. Nacci and K.R. Deniars (1975). Behaviorof Underwater Suction Anchor in Soil, Ocean Eng.,
Vol. 3, No. 1, Jun., pp. 47-62.
Wilson, Q. and B.S. Sahota (1980). Pull-out Parametersfor Buried Suction Anchors, Offshore Technol. Conf.,
paper 3816, pp. 205-216.
Wyclif fe-Jones, P.T. (1975). Ground Anchors used for shipsalvage operations, Ground Eng., Vol. 8, No. 3, pp.19-22.
Yokel, F.Y., R.M. Chung, F.A. Rankin and W.C. Charles(1982). "Load Displacement Characteristics ofShallow Soil Anchors", National Bureau of Standards,Building Science Serial No. 142, May, 1982, 163 pp.
ADDITIONAL BIBLIOGRAPHY NOT CITED
Au, M.S. (1968). "Pulloutand Anchor Piles inThesis, Duke University,
Resistance of Anchor PlatesSoft Bentonite Clay," M.S.53 pp.
Anderson, D.G. and G.R. Martin (1979). Effects of HighFrequency, Higher Strain Amplitude Loading on theProperties of Seafloor Soils, Civil EngineeringLaboratory, P0 No. N62583/77-NR-657, Port Hueneme,Calif., Jan., 172 pp.
155
Andreadis, A., Harvey, R.C. and Burley, E. (1979).
Embedded Sea Bed Anchors Subjected to RepeatedLoading, Trans. Royal Institution Naval Arch., Vol.121, pp. 179-189.
Andreadis, A. and R.C. Harvey (1981). A Design Procedurefor Embedded Anchors, Appi. Ocean Res., Vol. 3, No.
4, Oct., pp. 177-182.
Bhatnagar, R. S. (1969). "Pull Out Resistance of Anchorsin Silty Clay," M.S. Thesis, Duke University, 62 pp.
Bosakov, S.V. (1982). Anchor Design with Allowance forDiscontinuity in an Elastic Foundation Bed, SoilMech. Found. Eng., Vol. 19, No. 2, Mar.-Apr., pp.79-82.
Carr, R.W. and T.H. Hanna (1971). Sand MovementMeasurement Near Anchor Plates, ASCE J. Soil Mech.Found. Div., Vol. 97, No. SM5, May, pp. 833-840.
Clemence, S.P., ed. (1985). Uplift Behavior of AnchorFoundations in Soil, proceedings of a sessionsponsored by the Geotechnical Engineering Divisionof the ASCE, ASCE, New York, Oct. 24, 1985, 126 pp.
Cole, M.W. Jr. and R.W. Beck (1970). Small Anchor Teststo Predict Full Scale Holding Power, Society of.troleum Engineers. Journal, Vol. 10, No. 2, pp.127-133.
Dantz, P.A. (1968). "The Padlock Anchor - A Fixed PointAnchor System," Tech Report R-577, NCEL, PortHueneine, California, Nay, 37 pp.
Das, B.M. (1975). Pullout Resistance of Vertical Anchors,ASCE J. Geotech. Eng. DIV., Vol. 101, No. GT1, Proc.Paper 11040, Jan., pp. 87-91.
Das, B.M., G.R. Seeley and S.C. Das (1977). UltimateResistance of Deep Vertical Anchor in Sand, SoilsFound., Vol. 17, No. 2, Jun., pp. 52-56.
Davie, J.R. and H.B. Sutherland (1977). Uplift Resistanceof Cohesive Soils, ASCE J. Geotech. Eng. Div., Vol.103, No. GT9, Sep., pp. 935-952.
Davis, A.G. and C. Plumelle (1982). Full-scale Tests onGround Anchors in Fine Sand, ASCE J. Geotech. Eng.Div., Vol. 108, No. GT3, Mar., pp. 335-353.

156
Douglas, B.J. (1978). Effects of Rapid Loading Rates onthe Holding Capacity of Direct Embedment Anchors,Civil Engineering Laboratory, P0 No. M-R-420, PortHueneme, Calif. Oct., 101 pp.
Fotiyeva, N.N. and V.A. Litkin (1969). Design of DeepAnchor Plates, Soil Mech. Found. Eng., No.5,
Sep.-Oct., pp. 313-317.
Gouda, Z .M. and D. G. True (1977). "Dynamic Loading
Effects on Embedment Anchor Holding Capacity -
Interim Report," Tech Note N-1489, NCEL, Port
Hueneme, California, Jul., 69 pp.
Graham, 3. and J.G. Stuart (1971). Scale and BoundaryEffects in Foundation Analysis, ASCE 3. Soil Mech.Found. Div., Vol. 97, No. SN11, Proc. Paper 8510,
Nov., pp. 1533-1548.
Harvey, R.C. (1979). A Probabilistic Approach to AnchorDesign, Naval Archit., No. 4, Jul., pp. 153-154.
Harvey, R.C. and E. Burley (1976). Embedded AnchorsOffshore, Civil Engineerinci (Lond), Dec., pp.39-41.
Harvey, R.C., E. Burley and B. Nath (1978). Some Thoughtson Sea Bed Anchors, 3. Society Underwater Technol.,Dec., Vol. 4 No. 4, pp. 8-15.
Heifrich, S.C., R.L. Brazill and A.F. Richards (1976).Pullout Characteristics of a Suction Anchor in Sand,Offshore Technol. Conf., paper 2469, pp. 501-506.
Hollander, W.H. (1958). Earth Anchors may Help You
Prevent Pipe Flotation at River Crossings, Oil andGas Journal, Vol. 56, May, pp. 98-101.
Hoshiya, N. and J.N. Mandal (1984). Some Studies onAnchor Plates in Sand, Soils Found., Vol. 24, No. 1,
Mar., pp. 9-16.
Hueckel, S.M. (1957). Model tests on anchoring capacityof vertical and inclined plates, Proc. 4th IntConf. Soil Ivlech. Found. Eng., London, England, Vol.
II, pp. 99-103.
Ishihara, K. (1971). Factors Afecting Dynamic Propertiesof Soils, Proc. 4th Asian Reciional Conf. Soil Mech.
Found. Erig., Vol. 2, 26 Jul.-1 Aug., Bangkok,
Thailand, Za-Chieh Moh, Ed., pp. 87-100.

157
Ito, H. and Y. Kitahara (1982). Pulling-out Resistance ofElectric Transmission Tower Footing PartiallyPenetrating into the Surrounding Ground at itsBottom Slab, Intl. Syinp. Numer. Models Geomech.,Zurich, Switzerland, 13-17 Sep., pp. 677-686.
Lee, H.J. (1972). "Unaided Breakout of Partially EmbeddedObjects From Cohesive Seafloor Soils," TechReport R-755, NCEL, Port Hueneme, California, Feb.,
51 pp.
Lee, H.J. and J.E. Clausner (1979). "Seafloor SoilSampling and Geotechnical Parameter DeterminationHandbook," Tech Report R-873, NCEL, Port Hueneme,California, Aug., 128 pp.
LeLievre, B. and J. Tabatabaee (1981). The Performance ofMarine Anchors with Planar Flukes in Sand, Can.Geotech. J., Vol. 18, No. 4, Nov., pp. 520-534.
Nalloy, R.J. and P.J. Valent (1978). "Acoustic Siting andVerification of the Holding Capacity of EmbedmentAnchors," Tech Note N-1523, NCEL, Port Hueneme,California, Jul., 17 pp.
McCormick, M.E.(ed.) (1979). Anchoring Systems, New York,
Pergamon Press, Inc., pp. 3-138.
Mei, C.C., R.W. Yeung and K.F. Liue (1985). Lifting of aLarge Object from a Porous Seabed, J. Fluid Mech.,
Vol. 152, pp. 203-215.
Motherway, D.L., R.T. Walker and E.K. O'Conner (1977)."Development and Extension of the Jetted AnchorConcept For the Mooring of Coast Guard Buoys," U.S.Coast Guard Research and Development Center, AveryPoint, Groton, Connecticut, (NTIS, Springfield,Virginia), Sep.,12 pp.
Muga, B. J. (1968). "Ocean Bottom Breakout Forces," TechReport R-591, NCEL, Port Hueneme, California, Jun.,140 pp.
Naval Facilities Engineering Commmand, Department of the
Navy (1971). Design Manual: Soil Mechanics,Foundations, and Earth Structures, NAVFAC DN-7.
Neely, W.J., J.G. Stuart, and J. Graham (1973). FailureLoads of Vertical Anchor Plates in Sand, ASCE J.Soil Mech. Found. Div., Vol. 99, No. SM 9, Proc.
Paper 9980, Sept., pp. 669-685.

158
Ostermayer, H. and F. Scheele (1977). Research on GroundAnchors in Non-Cohesive Soils, Revue Francaise deGeotechniciue, No. 3, pp. 92-97.
Repnikov, L.N. and M.I. Gorbunov-Posadov (1969).Calculation of Anchor Plate for the GroundConsolidation Stage, Soil Mech. Found. Eng., No. 5,Sep.-Oct., pp. 308-312.
Rowe, RK., and J.R. Booker (1979b). The Analysis ofInclined Anchor Plates, Numer. Methods Geomech.,Proc. of the Third mt. Conf. on Nuiner. Methods inGeomech., Aachen, 2-6 Apr., Vol. 3, pp. 1227-1236.
Saran, S., G. Ranjan, and A.S. Nene (1986). Soil Anchorsand Constitutjve Laws, ASCE J. Geotech. Enqi., Vol.112, No. 12, Dec., pp. 1084-1100.
Seed, H.B. and K.L. Lee (1966). Liquifaction of SaturatedSands During Cyclic Loading, ASCE J. Soil Mech.Found. Div., Vol. 92, No. SM6, Proc. Paper 4972,Nov., pp. 105-134.
Seed, H.B. and K.L. Lee (1967). Undrained StrengthCharacteristics of Cohesionless Soils, ASCE J. SoilMech. Found. Div, Vol. 93, No. SM6, Proc. Paper5618, Nov., pp. 333-360.
Seergeev, I.T., and F.M. Savchenko (1972). ExperimentalInvestigations of Soil Pressure on the Surface of anAnchor Plate, Soil Mech. Found. Eng., Vol. 9, No. 5,Sep.-Oct., pp. 298-300.
Silver, M.L. and H.B. Seed (1971). DeformationCharacteristics of Sands Under Cyclic Loading, ASCEJ. Soil Mech. Found. Div., Vol. 97, No. SM8, Proc.Paper 8334, pp. 1081-1098.
Silver, N.L. and H.B. Seed (1971). Volume Changes inSands During Cyclic Loading, ASCE J. Soil Mech.Found. Div., Vol. 97, No. SM9, Proc. Paper 8354,pp. 1171-1182.
Tagaya, K., A. Tanaka and H. Aboshi (1983). Applicationof Finite Element Method to Pullout Resistance ofBuried Anchor, Soils Found., Vol. 23, No. 3, Sep.,pp. 91-104.
Taylor, R.J. (1976) "CEL 20K Propellant ActuatedAnchor," Tech Report R-837, NCEL, Port Hueneme,California, Mar., 47 pp.

159
Taylor, R.J. and H.J. Lee (1972). "Direct EmbedmentAnchor Holding Capacity," Tech Note N-1245, NCEL,Port Hueneme, California, Dec., 34 pp.
Taylor, R.J. and R.M. Beard (1973). "Propellant-ActuatedDeep Water Anchor: Interim Report," Tech NoteN-1282, NCEL, Port Hueneine, California, Aug., 42
pp.
Terzaghi, K. and R.B. Peck, Soil Mechanics In EngineeringPractice. New York: John Wiley & Sons, Inc., 1967.
Tiiaar, J.G., III and S.M. Bemben, "The Influence ofGeometry and Size on the Static Vertical PulloutCapacity of Marine Anchors Embedded in Very Loose,Saturated Sand", Report No. UM-73-3, NTIS, Mar., 82pp.
True, D.G. (1975). "Penetration of Projectiles intoSeafloor Soils," Tech Report R-822, NCEL, PortHueneine, California, Nay, 47 pp.
Valent, P.J. (1978). "Results of Some Uplift CapacityTests on Direct Embedment Anchors," Tech NoteN-1522, NCEL, Port Hueneine, California, Jun., 68
pp.
Vanzin, E.A. and M.I. Gorbunov-Posadov (1975).Calculating the Bases of Circular Anchor PlatesDuring the Elastic Working Stage of a Soil, SoilMech. and Found. Eng., Vol. 12, No. 6, Nov.-Dec.,pp. 389-396.
Walker, G.R. and R.J. Taylor (1984). Model Anchor Testsin Cohesionless Soil, J. Waterw. Port Coastal OceanEng., Vol. 110, No. 4, Nov., pp. 463-471.
Wang, M.C., K.R. Demars and V.A. Nacci (1978).Applications of Suction Anchors in OffshoreTechnology, Offshore Technol. Conf., paper 3203, pp.1311-1320.
Yen, B.C. (1975). "Deep Anchor Long-Term Model Tests",Civil Engineering Laboratory, Port Hueneme, Ca,
Contract Report CR-76.003, Dec., 115 pp.

APPENDICES

APPENDIX ALIST OF SYMBOLS
The following symbols are used in this paper:
A = Area of plate
B = Diameter of circular plateEffective diameter of square and rectangularplates
B0 = Shaft diameter
B1 = Anchor or footing radius
c = Cohesion
C = Uniformity coefficient
C = Coefficient of curvature
D = Depth
Di = Particle size characteristics
Dr = Relative density
G = Shear Modulus of the soil
H = Limiting depth of shallow anchor failure
i = Hydraulic gradient
cr = Critical hydraulic gradient
k = Coefficient of permeability
K = Coefficient of lateral earth pressure
K0 = Coefficient of earth pressure at rest
L = Length
N = Number of loading cycles
P = Plate uplift load
P0 = Overburden pressure
= Passive earth pressure

161
= Maximum static uplift capacity
p = Pressure
q = Volumetric flow rate
Su = Undrained shear strength
t = Anchor plate thickness
u = Pore water pressure
W = Anchor weight
W = Weight of pulled out soil
6 = Anchor displacement through the soil
r = Bulk unit weight
rw = Unit weight of water
= Effective (submerged) unit weight
= Relative depth of embedment (D/B)
Xi = Relative depth of embedment (D/B1)
a = Stress
a' = Effective stress
= Angle of shearing resistance
c/I = Angle of dilatency

162
APPENDIX BSOIL PROPERTIES
B.]. GRAIN SIZE ANALYSIS
A sieve analysis was conducted to determine sand
grain size distribution. The guidelines of ASTM D422-72
were used. Three representative sand samples were
obtained and each was subjected to a 15 minute shaker
test through a series of 8 inch sieves. Sieve numbers
30, 50, 100, 140 and 200 were used. The sand remaining
on each sieve was weighed and the percent passing was
computed. The results were plotted and compared with
manufacturer's data in Fig. B.1.
The coefficient of uniformity, C, was calculated to
give an indication of the sand sorting.
D60 0.23C== = 1.9D10 0.12
The coefficient of curvature (concavity, gradation)
was also determined as follows:
(D30)2 (0.16)2
Cc = 0.9D10D60 (0.12)(0.23)
The coefficients indicate that the soil is a uniform
poorly graded fine sand classified as SP in the Unified
Soil Classification System.

100
iLJ 75
zU-
F-z 50LU
0LUa 25
iO 10_2 io 1 10 102
GRAIN DIAMETER (mm)
Fig. B-i Grain Size Distribution Compared with Manufacturer'sData
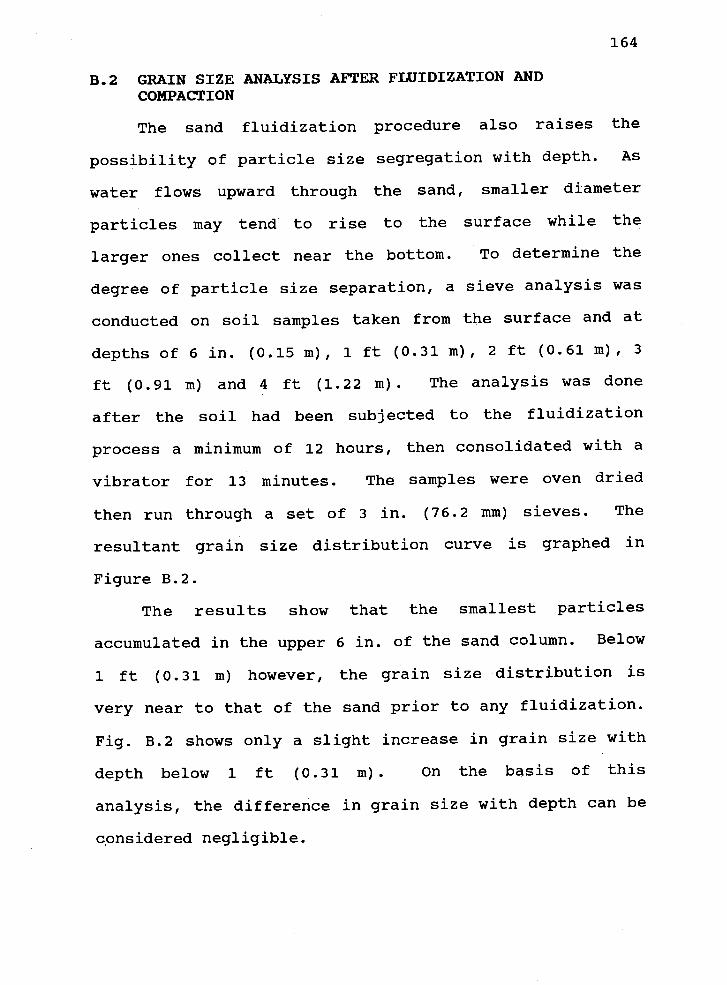
164
B.2 GRAIN SIZE ANALYSIS AFTER FLUIDIZATION ANDCOMPACTION
The sand fluidization procedure also raises the
possibility of particle size segregation with depth. As
water flows upward through the sand, smaller diameter
particles may tend to rise to the surface while the
larger ones collect near the bottom. To determine the
degree of particle size separation, a sieve analysis was
conducted on soil samples taken from the surface and at
depths of 6 in. (0.15 in), 1 ft (0.31 m), 2 ft (0.61 rn), 3
ft (0.91 in) and 4 ft (1.22 in). The analysis was done
after the soil had been subjected to the fluidization
process a minimum of 12 hours, then consolidated with a
vibrator for 13 minutes. The samples were oven dried
then run through a set of 3 in. (76.2 mm) sieves. The
resultant grain size distribution curve is graphed in
Figure B.2.
The results show that the smallest particles
accumulated in the upper 6 in. of the sand column. Below
1 ft (0.31 rn) however, the grain size distribution is
very near to that of the sand prior to any fluidization.
Fig. B.2 shows only a slight increase in grain size with
depth below 1 ft (0.31 in). On the basis of this
analysis, the difference in grain size with depth can be
cpnsidered negligible.

100
LU 75
zLL
F-50
LU0LUL 25
10 10 10_I 1 10 102
GRAIN DIAMETER (mm)
Fig. B-2 Grain Size Distribution after Fluidization andCompaction
C'I."
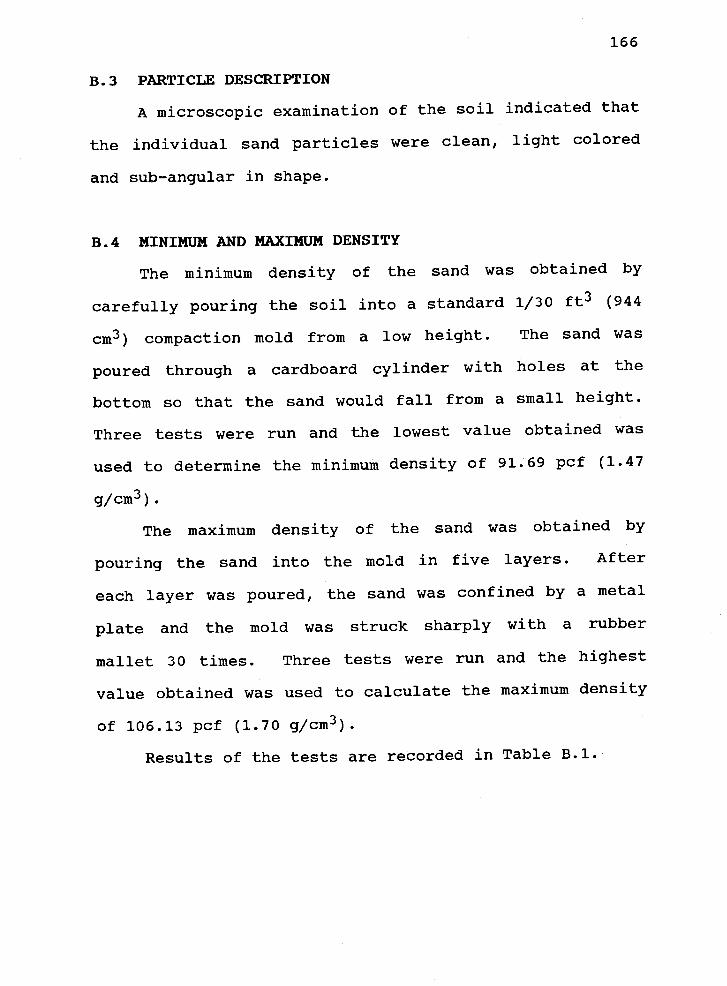
166
B. 3 PZRTICLE DESCRIPTION
A microscopic examination of the soil indicated that
the individual sand particles were clean, light colored
and sub-angular in shape.
B.4 MINIMUM AND MAXIMUM DENSITY
The minimum density of the sand was obtained by
carefully pouring the soil into a standard 1/30 ft3 (944
cm3) compaction mold from a low height. The sand was
poured through a cardboard cylinder with holes at the
bottom so that the sand would fall from a small height.
Three tests were run and the lowest value obtained was
used tO determine the minimum density of 91.69 pcf (1.47
g/cxa3).
The maximum density of the sand was obtained by
pouring the sand into the mold in five layers. After
each layer was poured, the sand was confined by a metal
plate and the mold was struck sharply with a rubber
mallet 30 times. Three tests were run and the highest
value obtained was used to calculate the maximum density
of 106.13 pcf (1.70 g/cin3).
Results of the tests are recorded in Table B.l.

167
TABLE B.1MINIMUM 2ND MAXIMUM DENSITIES
Minimum Density Maximum Densitypcf (g/cm3) pcf (g/cm3)
91.69 (1.47) 106.13 (1.70)
92.19 (1.48) 104.94 (1.68)
93.69 (1.50) 105.00 (1.68)
B.5 IN-SITU DENSITY
In order to determine whether or not the soil
properties resulting from the fluidization and
consolidation procedure could be duplicated, sand
densities were determined at the surface and at depths of
1 ft (0.31 in) and 2 ft (0.61 in) by the sand cone method
using ASTM D1556-82 guidelines. Ottawa sand passing the
#16 U.S. standard sieve but retained on the #30 sieve was
used as the control sand. This test was conducted after
the sand in the tank had undergone fluidization a minimum
of 12 hours.
After the sand had been fluidized and consolidated,
the water in the tank was slowly drained via the ½ inch
(12.7 nun) drain line. This process took approximately 3
hours. For each run, soil from three separate areas of
the surface was excavated, weighed wet, oven dried, then
weighed dry. Five runs were conducted. Soil was also
carefully excavated to depths of 1 ft (0.31 in) and 2 ft

168
(0.61 m) where additional sand cone tests were conducted.
Three runs were conducted at each of these depths with
only one sample being taken for each run. The average
values and standard deviations of the densities are given
in Table B.2.
TABLE B.2DENSITY GRADIENTS WITH DEPTH
Depth Average Density Standard Deviationpcf (g/cm3) pcf (g/ciu3)
Surface 103.25 (1.65) 2.19 (.035)
1 ft 102.88 (1.65) 1.88 (.030)
2 ft 102.25 (1.64) 1.25 (.020)
While it appears that there is a slight density
gradient with depth, the percent variation with depth was
less than 1%. This discrepancy can be considered small
enough to be ignored and the density was therefore
considered uniform. An average value of 102.81 pcf (1.65
g/cia3) was taken as the in-situ soil density.
A.6 RELATIVE DENSITY
Relative density is defined as:
emax - eDr
emax emin
where Dr = relative density
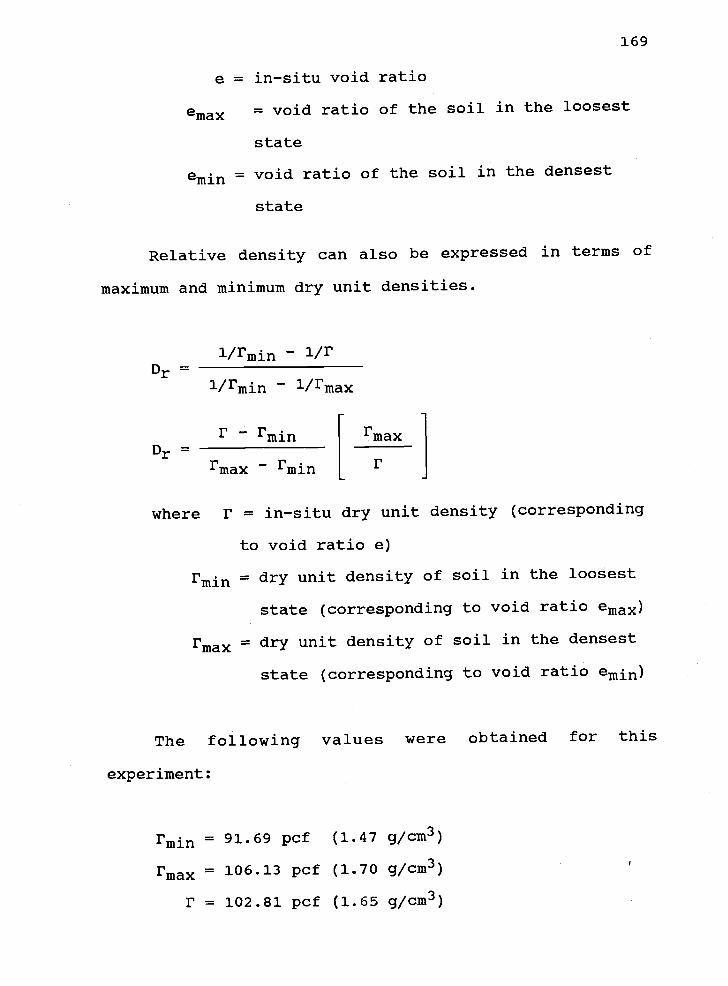
169
e = in-situ void ratio
emax = void ratio of the soil in the loosest
state
emin void ratio of the soil in the densest
state
Relative density can also be expressed in terms of
maximum and minimum dry unit densities.
Dr =
Dr =
- ir
l/rmjn
r-rmjn
rmin[
r
where r = in-situ dry unit density (corresponding
to void ratio e)
rmjn = dry unit density of soil in the loosest
state (corresponding to void ratio emax)
= dry unit density of soil in the densest
state (corresponding to void ratio emin)
The following values were obtained for this
experiment:
rmin = 91.69 pcf (1.47 g/cm3)
= 106.13 pcf (1.70 g/ciu3)
r = 102.81 pcf (1.65 g/cin3)

170
1.65 - 1.47 1.70
Dr1.70 - 1.47 1.65
Dr = 0.80
B.7 FRICTION JNGLE
In order to determine the friction angle of the soil
several vacuum triaxial tests were conducted following
the guidelines of ASTM D2850. A constant displacement
rate of 0.822 nun/mm. corresponding to a strain rate of
0.57%/mm. was used in all of the tests. The soil was
air dried and placed so that the density was 102.8 ± 0.6
pcf (1.65 ± 0.01 g/cm3). Confining stresses between 1
psi (6.9 kN/m2) and 4 psi (26.6 kN/ni2) were used. A plot
of confining stress vs. friction angle is shown in Figure
A.3. The resulting angle of friction was found to range
between 37.4° and 40.7°. In this paper, a friction angle
of 40° was used for calculations and comparisons.
B.8 SPECIFIC GRAVITY
The specific gravity, G5, of the sand was determined
by following ASTM D854-83 guidelines. An aspirator was
used to apply the vacuum necessary for air removal. The
specific gravity was found to be 2.65.
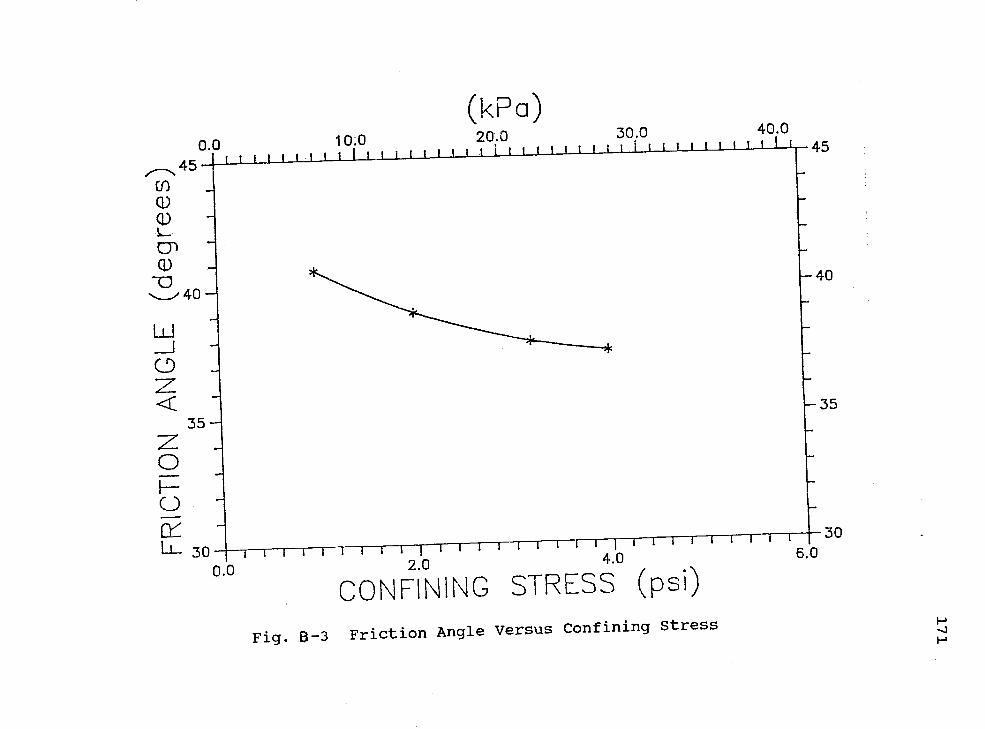
0.0
,.-.-,..' 45
rrj
00L
0'-.--_' 40
u-i
0z
35
z0F-0cLi_ 30
0.0
10o
(kFa)20.0 1sx.1 40.0
CONFINING STRESS (psi)
6.0
Fig. 8-3 Friction Angle Versus Confining Stress
45
40
35
30
-4

172
B.9 VOID RATIO
The void ratio was determined by observing the
following relationships for dry soil:
G5r=
1+ e
G5re= -1
r5 itu
(2.65) (62.4)-1
102.813
e = 0.6].
A. 10 EFFECTIVE UNIT WEIGHT
The saturated unit weight was first calculated from
the following relationship:
(G5 + e) rrsat = l+e
(2.65 + 0.61) (62.4)
rsat =1 + 0.61
rsat = 126.4 pcf (2.0 g/ciu3)
The effective unit weight was found by subtracting
the unit weight of water from the saturated weight of the
soil.

173
r' = Tsat -
= 64.0 pcf (1.0 g/cin3)
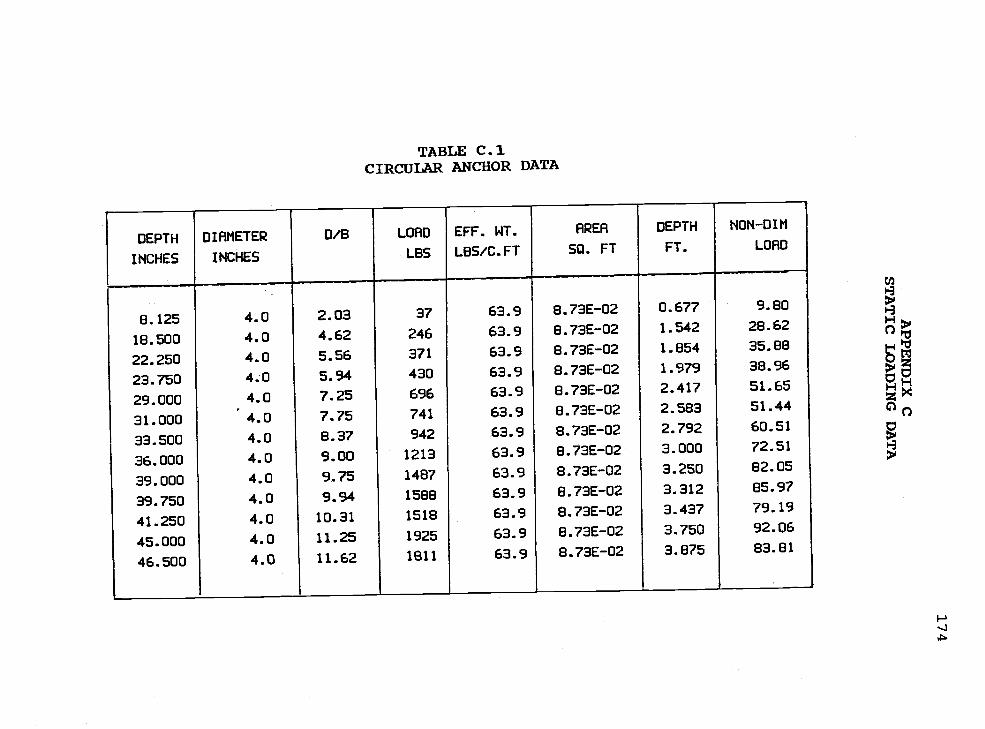
TABLE C.1CIRCULAR l%NCHOR DATA
DEPTH
INCHES
DIAMETER
INCHES
0/B LOAD
LBS
EFF. NT.
LBS/C. FT
AREA
SQ. FT
DEPTH
FT.
NON-DIM
LORO
8.125 4.0 2.03 37 63.9 8.73E-02 0.677 9.80
18.500 4.0 4.62 246 63.9 8.73E-02 1.542 28.62
22.250 4.0 5.56 371 63.9 8.73E-02 1.854 35.88
23.750 4.0 5.94 430 63.9 8.73E-02 1.979 38.96
29.000 4.0 7.25 696 63.9 8.?3E-02 2.417 51.65
31.000 4.0 7.75 741 63.9 8.73E-02 2.583 51.44
33.500 4.0 8.37 942 63.9 8.?3E-02 2.792 60.51
36.000 4.0 9.00 1213 63.9 8.73E-02 3.000 72.51
39.000 4.0 9.75 1487 63.9 8.?SE-02 3.250 82.05
39. 750 4.0 9.94 1588 63.9 8.73E-02 3.312 85.97
41.250 4.0 10.31 1518 63.9 8.73E-02 3.437 79.19
45. 000 4.0 11.25 1925 63.9 B.73E-02 3.750 92.06
46.500 4.0 11.62 1811 63.9 8.?3E-02 3.875 83.81
H
zH
z
H-.1

TABLE C.2SQUARE ANCHOR DATA
DEPTH
INCHES
DIAMETER
INCHES
0/B LOAD
LBS
EFF. WI.
LBS/C. FT
AREA
SO. FT
DEPTH
FT.
NON-DIM
LOAD
10.125 4.0 2.53 59 63.9 8.73E-02 0.844 12.54
17.000 4.0 4.25 213 63.9 B.73E-02 1.417 26.96
20. 125 4.0 5.03 307 63.9 8.73E-02 1.677 32.83
24.000 4.0 6.00 430 63.9 9.73E-02 2.00O 38.56
26.375 4.0 6.59 518 63.9 8.73E-02 2.198 42.26
30.000 4.0 7.50 731 63.9 8.73E-02 2.500 52.44
33.375 4.0 8.34 924 63.9 8.73E-02 2.781 59.58
34.500 4.0 8.62 945 63.9 8.73E-02 2.875 58.95
39.375 4.0 984 1316 63.9 8.73E-02 3.281 71.92
41.250 4.0 10.31 1473 63.9 8.73E-02 3.437 76.85
45. 125 4.0 11.28 1530 63.9 8.73E-02 3.760 72.97
47.750 4.0 11.94 1541 63.9 8.73E-02 3.979 69.45
Ui
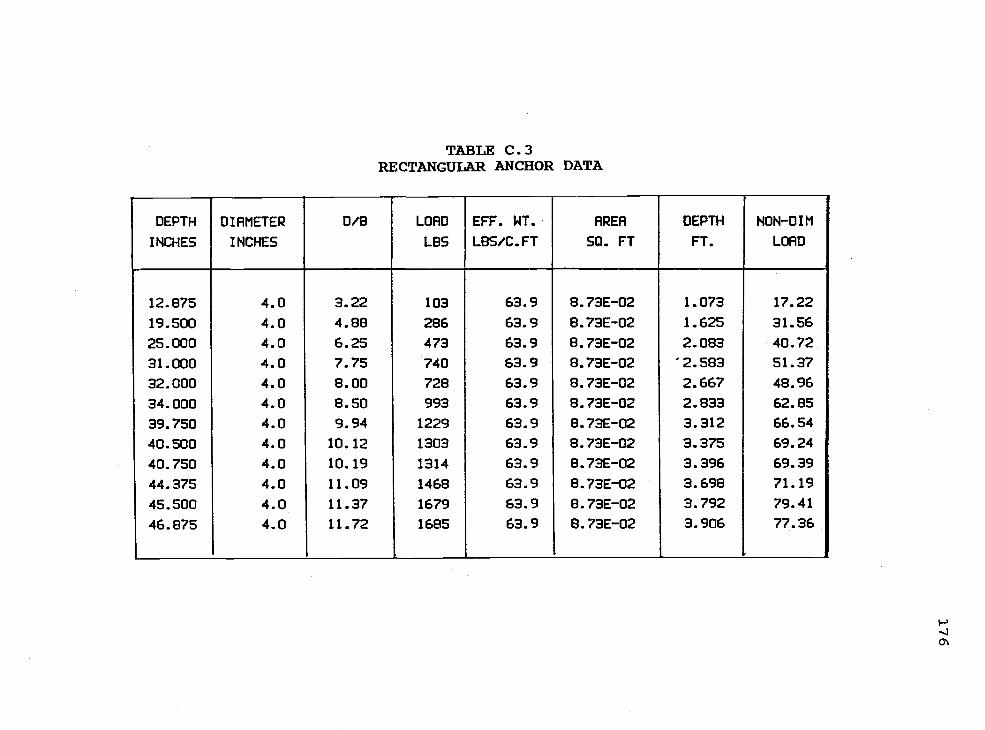
TABLE C.3RECTANGULAR ANCHOR DATA
DEPTH
I NCHES
DIAMETER
I NCHES
0/B LOAD
LBS
EFF. WI.
LBS/C. FT
PRER
SQ. FT
DEPTH
FT.
NON-DIM
LORD
12. 875 4.0 3.22 103 63.9 8.73E-02 1.073 17.22
19.500 4.0 4.88 286 63.9 8.73E-02 1.625 31.56
25. 000 4.0 6.25 473 63.9 8.73E-02 2.083 40.72
31.000 4.0 7.75 740 63.9 8.?3E-02 2.583 51.37
32.000 4.0 8.00 728 63.9 8.73E-02 2.667 48.96
34.000 4.0 8.50 993 63.9 8.73E-02 2.833 62.85
39.750 4.0 9.94 1229 63.9 B.73E-02 3.312 66.54
40.500 4.0 10.12 1303 63.9 8.?3E-02 3.375 69.24
40.750 4.0 10.19 1314 63.9 8.73E-02 3.396 69.39
44.375 4.0 11.09 1468 63.9 8.73E-02 3.698 71.19
45.500 4.0 11.37 1679 63.9 8.73E-02 3.792 79.41
46. 875 4.0 11.72 1685 63.9 8.73E-02 3.906 77.36
C.'

2000
1500
9--o
1000
C0
500
(mm)LU .0 10.0 lb.0 20.0
JIll 11111111111 Iii iii
I I I I
CIRCULAR ANCHOR
11111111 I
0.6 IM 1.2
177
o - 45.0 in.
O - 46.5 in.
O - 39.75 in.o - 41.25 In.
0 - 39.0 In.
0 - 36.0 in.
D - 33.5 In.
DISPLACEMENT (in)
Fig. C-]. Load-Displacement Curves for Circular Plate
(Deep)
1000
750
4--D
500
a0J
250
(mm)citilil iii 1111111 I I
CIRCULAR ANCHOR
fl 111111
0.5
'
0 - 31.0 in.
0 - 29.0 In.
O - 23.75 In.
O - 22.25 In.
o - 18.5 in.
O - 8.125 in.
DISPLACEMENT (in.)
Fig. C-2 Load-Displacement Curves for Circular Plate
(Shallow)

2000
1500
4--a
100000-J
500
(mm)).0 2.5 5.0 7.3 10.0 12.5 15.0 11.3 ZU.0 12.3 £3.0iiiiIiiiiIiitiIiitiI,iiiliiiiliiitliitiIii&1It Lit
SQUARE ANCHOR
rrrm-i rrfl-rrrr rn-p mVTTTT0.4 0.8 0.8 1 .0
178
o - 47.75 In.o - 45.125 In.O - 41.25 In.o - 39.375 In.
O - 34.5 In.O - 33.375 In.
DISPLACEMENT (in)
Fig. C-3 Load-Displacement Curves for Square Plate(Deep)
1000
750
4--o
50000-J
250
0
(mm)i.0 L.3 3.0 1.3 10.0 11.3
1_TIllil it liii tiii Liii I LI liii ii
SQUARE ANCHOR
0 - 30.0 In.
O - 28.375 In.
0 - 24.0 In.
o - 20.125 In.
o - 17.0 In.
O 10.125 In.
D1SPLACEMENT (in.)
Fig. C-4 Load-Displacement Curves for Square Plate(Shallow)
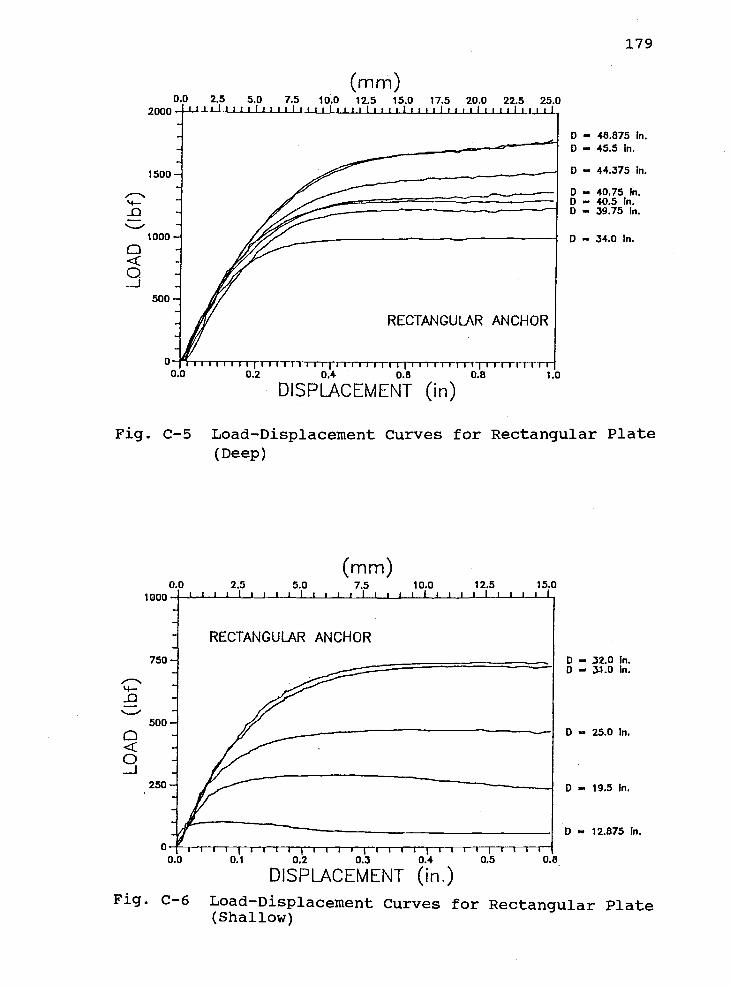
200C
1500
-o
1000
a0J
500
(mm)U.0 .3 3.0 1.5 UJ.0 2.5 15.0 17
i I i i i i Ii i i i I i t i Liii i I i i i i I i i i i
RECTANGULAR ANCHOR
II
I I I I I I IFji I I I I t TT1J I I I I ITT TTJTTr-rrT-r0.2 0.4 0.6 0.8 1.0
179
O - 48.875 In.
O - 45.5 In.
O 44.375 In.
O - 40.75 In.I) - 40.5 In.o - 39.75 In.
0 - 34.0 In.
DISPLACEMENT (in)
Fig. C-5 Load-Displacement Curves for Rectangular Plate(Deep)
1000
750
4--o
50000-J
250
r
(mm)5.0 7.5uI iii iii ii i I i i it
RECTANGULAR ANCHOR
1 3.TJ
iuiI
I II
I I I I
0.4 0.5
D - 32.0 In.O - 4.0 In.
D 25.0 In.
O - 19.5 In.
O 12.875 In.
DISPLACEMENT (in.)
Fig. C-6 Load-Displacement Curves for Rectangular Plate(Shallow)

3200
Lii
H-2700
2200
0
1700
>
APPENDIX DEQUIPMENT DATA
0 20 40 60 80
SUPPLY AIR PRESSURE (psi)
Fig. D-1 Pneumatic Vibrator Vibration Curve
_- 1009-
a<CLii
I50
0 I I I
I
)f) 1.0 1.5 2.0
3200
2700
2200
1700
1200
150
100
50
0
FLOW RATE (cf s)
Fig. D-2 Centrifugal Water Pump Output Curve
APPENDIX EPERMISSION TO REPRODUCE COPYRIGHT MATERIAL
AMERICAN SOCIETY OFCIVIL ENGINEERS
345 East 47th StreetNew York, NY 10017
(212) 7057496
T&ex: 422847 ASCE uL
July 13, 1987
Mr. Ralph Petereit1860 NW Locust StreetCorvallis, OR 97330
Dear Mr. Petereit:
181
Permission is hereby granted by ASCE for use of the following material which wasoriginally published by ASCE in ASCE Journals - Soil Mech./Geotechnical Engrg.
"Embedded Anchor Response to Uplift Loading",Fig. 5 & 12, Andredis, et al.GT1, 107, 1981.
"Anchor Behavior in Sand', Fig. 3, Hanna et al., SM11, 98 , Nov. 1972
Please give full credit to the ASCE stating the author, title, publication nameand date of publication.
Sincerely,
Ellie MarabelloStaff AssistantPermissions
Civil engineers make the differenceThey build the quality of life
Redacted for privacy