Embed Size (px)
DESCRIPTION
USER EQUILIBRIUM IN A DISRUPTED NETWORK WITH REAL-TIME INFORMATION AND HETEROGENEOUS RISK ATTITUDE
Citation preview
ENHANCING CONCRETE BARRIER REFLECTIVITY WITH A FOCUS ON RECYCLED GLASS AGGREGATE REPLACEMENT
A Thesis Presented
by
REGINA SHKLYAN
Submitted to the Graduate School of the University of Massachusetts Amherst in partial fulfillment
of the requirements for the degree of
MASTER OF SCIENCE IN CIVIL ENGINEERING
May 2009
Civil and Environmental Engineering
ENHANCING CONCRETE BARRIER REFLECTIVITY WITH A FOCUS ON RECYCLED GLASS AGGREGATE REPLACEMENT
A Thesis Presented
by
REGINA SHKLYAN
Approved as to style and content by: _______________________________________ Scott A. Civjan, Chair _______________________________________ Sergio F. Breña, Member
________________________________________ Richard N. Palmer, Department Head Civil and Environmental Engineering Department
iii
ACKNOWLEDGMENTS
This project would not have been possible without the continuous support and
guidance from my committee members, Dr. Civjan and Dr. Breña. Dr. Breña’s
meticulous editing and invaluable advice helped to shape the final product of this thesis.
Dr. Civjan, serving also as my academic advisor, has been an integral part of both my
graduate career and of this project. Much of the positive experience I have had during
my time in graduate school I owe to Dr. Civjan.
A large number of the materials employed for this project have been generously
donated. Sika Corporation donated all of the liquid admixtures used; Sika® AEA-15,
Sika ViscoCrete® 6100, and Sika® Control ASR. Type III white cement was provided
by the Lehigh Cement Company. Headwaters Incorporated contributed the pulverized
fuel ash and Springfield Materials Recycling Facility supplied the crushed recycled glass.
To all of the above, I owe a gracious thank you.
iv
ABSTRACT
ENHANCING CONCRETE BARRIER REFLECTIVITY WITH A FOCUS ON RECYCLED GLASS AGGREGATE REPLACEMENT
MAY 2009
REGINA SHKLYAN, B.S., JOHNS HOPKINS UNIVERSITY
M.S., UNIVERSITY OF MASSACHUSETTS AMHERST
Directed by: Professor Scott A. Civjan
Increased accident rates during the nighttime and wet weather conditions on the
United States highways necessitate the enhancement of highway concrete barrier
visibility. The visibility of these delineators is dependent on their reflectivity. Several
methods are proposed that stand to increase the reflectivity of these concrete barriers,
such as the use of white cement versus gray cement and the attachment of raised
pavement markers to the side of the barriers. The incorporation of recycled glass into the
concrete mixture is one of the proposed methods that was put through further laboratory
study. The aim of the laboratory testing was to identify proper mixing proportions that
mitigate the potential for the alkali-silica reaction (ASR) in recycled glass aggregate
concretes without producing any negative effects on the compressive strength of the
concrete. The retroreflectivity of these concrete mixtures was also evaluated and is
presented in this report.
v
TABLE OF CONTENTS
Page
ACKNOWLEDGMENTS ................................................................................................. iii
ABSTRACT ....................................................................................................................... iv
LIST OF TABLES ........................................................................................................... viii
LIST OF FIGURES ........................................................................................................... ix
LIST OF ABBREVIATIONS ........................................................................................... xii
CHAPTER
1. INTRODUCTION ..........................................................................................................1
1.1 Objective .........................................................................................................1 1.2 Project Significance ........................................................................................2 1.3 Crash Test Data ...............................................................................................3 1.4 New Jersey Barriers ........................................................................................4
2. BARRIER REFLECTIVITY LITERATURE REVIEW ................................................6
2.1 Testing Methods..............................................................................................6
2.1.1 Use of Human Test Subjects ............................................................8 2.1.2 Use of a Retroreflectometer ...........................................................10 2.1.3 Use of Retroreflectometers in Conjunction with Human
Test Subjects ..................................................................................15 2.1.4 Use of a Computer Model ..............................................................15
2.2 Types of Retroreflectors ...............................................................................16
2.2.1 Pavement Marking Tape ................................................................16 2.2.2 Glass Beads within Pavement Markings........................................19 2.2.3 Traffic Sign Sheeting .....................................................................21 2.2.4 Raised Pavement Markers..............................................................24
2.3 Prior Research on Reflectivity of Center Barriers ........................................26
2.4 Recommendations for Enhancing Reflectivity .............................................34
2.4.1 Pavement Marking Tape or Paint ..................................................34 2.4.2 Glass Beads within Pavement Markings........................................34
vi
2.4.3 Traffic Sign Sheeting .....................................................................35 2.4.4 Raised Pavement Markers..............................................................35 2.4.5 Changing Geometry .......................................................................35 2.4.6 Changing the Concrete Mixture .....................................................36
3. GLASS AGGREGATE LITERATURE REVIEW ......................................................38
3.1 Potential Adverse Reactions .........................................................................40
3.1.1 Alkali-Silica Reaction .......................................................................41 3.1.2 Sugar Contamination ........................................................................44
3.2 Prior Research ...............................................................................................45 3.2.1 Overview of Prior Research on RG Use in Concrete .......................45
3.3 Results of Prior Research ..............................................................................49 3.3.1 Effects of Percent Glass Used and Glass Size on Concrete
with RG ......................................................................................................50 3.3.2 Effect of Admixtures on Concrete with RG .....................................55 3.3.3 Effect of Glass Color on Concrete with RG .....................................58
3.4 Summary of Previous Research ....................................................................60
4. RESEARCH PLAN ......................................................................................................63
4.1 Materials .......................................................................................................63
4.1.1 Cement ..............................................................................................63 4.1.2 Admixtures ........................................................................................64 4.1.3 Aggregate ..........................................................................................66 4.1.4 Recycled Glass ..................................................................................68 4.2 Mixture Designs ............................................................................................73 4.2.1 Mixing Process..................................................................................79 4.3 Test Procedure ..............................................................................................82 4.3.1 Fresh Concrete Testing .....................................................................82 4.3.2 Hardened Concrete Testing...............................................................84 4.3.3 ASR Testing ......................................................................................84 4.3.4 Reflectivity Testing ...........................................................................86
5. RESULTS OF GLASS CULLET AGGREGATE TESTING ......................................87
vii
5.1 Fresh Concrete Results .................................................................................87
5.1.1 Effects of Using Fine-Size RG .........................................................91 5.1.2 Effects of Using Coarse-Size RG .....................................................94 5.2 Hardened Concrete Results ...........................................................................96 5.2.1 Effects of Using Fine-Size RG .........................................................97 5.2.2 Effects of Using Coarse-Size RG .....................................................98 5.3 ASR Results ................................................................................................100 5.4 Reflectivity Results .....................................................................................103
6. CONCLUSION ...........................................................................................................107
REFERENCES ................................................................................................................111
viii
LIST OF TABLES
Table Page
Table 4.1: Oldcastle Inc. Highway Barrier Mixture Design Based on 0.765 m3 (1 CY) ........................................................................................................74
Table 4.2: List of Mixture Designs ..............................................................................75
Table 4.3: MW-0000A and MW-0000B Based on 0.765 m3 (1 CY) ..........................75
Table 4.4: MW-3030 Based on 0.765 m3 (1 CY) ........................................................76
Table 4.5: MW-0010 Based on 0.765 m3 (1 CY) ........................................................76
Table 4.6: MW-3000 Based on 0.765 m3 (1 CY) ........................................................76
Table 4.7: MW-0030A and MW-0030B Based on 0.765 m3 (1 CY) ..........................76
Table 4.8: MG-0040 Based on 0.765 m3 (1 CY) .........................................................77
Table 4.9: MW-0040 Based on 0.765 m3 (1 CY) ........................................................77
Table 4.10: MG-0040X Based on 0.765 m3 (1 CY) ....................................................77
Table 4.11: MW-0030F Based on 0.765 m3 (1 CY) ....................................................77
Table 4.12: Time of Air Test for Each Mixture ...........................................................83
Table 5.1: Air Content Values .....................................................................................89
Table 5.2: Mixture Bubbling Level and Spread Diameter Values ...............................90
Table 5.3: Compression Strengths ...............................................................................96
Table 5.4: Retroreflectivity Values of Unpolished Surfaces .....................................104
Table 5.5: Retroreflectivity Values According to LTL 2000 ....................................104
ix
LIST OF FIGURES
Figure Page
Figure 1.1: New Jersey Concrete Safety Shape Barrier Profile .....................................5
Figure 2.1: Representation of the Function of a Retroreflective Marker .......................7
Figure 2.2: Observation and Entrance Angles Related to Roadway Markings (Attaway, 1989) .........................................................................................11
Figure 2.3: Delta Light & Optics LTL 2000 Retroreflectometer .................................11
Figure 2.4: Observation and Entrance Angles for a Handheld Retroreflectometer According to ASTM E1709-00 ..................................12
Figure 2.5: Advanced Retro Technology, Inc. Model 920 ..........................................12
Figure 2.6: External Devices to Enhance Retroreflectivity of Concrete Barriers (Mullowney, 1978) ....................................................................................27
Figure 2.7 NJ Barrier with Proposed RPM Placement (Mullowney, 1978) ................28
Figure 2.8 NJ Barrier with Proposed RPM Placement (Ullman and Dudek, 1988) ..........................................................................................................32
Figure 2.9: Median Barrier with Altered Geometry ....................................................36
Figure 2.10: Comparison Between Concrete Barriers Constructed with Gray and White Cement (Portland Cement Association, 2000) .........................37
Figure 4.1: Sieve Analysis of Fine Aggregate .............................................................67
Figure 4.2: Sieve Analysis of Coarse Aggregate .........................................................67
Figure 4.3: Unclean and Unsorted RG .........................................................................69
Figure 4.4: Coarse-Size Clean Glass ...........................................................................69
Figure 4.5: Fine-Size Clean Glass ...............................................................................70
Figure 4.6: Sieve Analysis of Fine-Size Glass.............................................................71
Figure 4.7: Sieve Analysis of Fine Aggregate of MW-3000 .......................................71
Figure 4.8: Sieve Analysis of Coarse-Size Glass.........................................................72
x
Figure 4.9: Sieve Analysis of Coarse Aggregate of MW-0040 ...................................73
Figure 4.10: Depiction of Addition of Aggregate to the Mixer ...................................79
Figure 4.11: Prism Mold ..............................................................................................80
Figure 4.12: Cylindrical Mold .....................................................................................81
Figure 4.13: Depiction of Removal of a Concrete Prism Specimen from its Mold ...........................................................................................................81
Figure 4.14: Example of a Container Used for ASR Testing ......................................85
Figure 4.15: Milwaukee 12.7 cm (5 in) Sander-Grinder 6141 ....................................86
Figure 5.1: Glass Indicator and Cup/Stopper (Forney Model LA-0340).....................88
Figure 5.2: Top View of the Bubbling Within the Prism Mold of MG-3030 ..............90
Figure 5.3: MW-3000 Spread Diameter ......................................................................91
Figure 5.4: Broken Concrete Prism of MW-3000 .......................................................92
Figure 5.5: Top View of a MG-0040X Prism ..............................................................95
Figure 5.6: Side View of a MG-0040X Prism .............................................................96
Figure 5.7: Compressive Strength of MW-0000A and MW-0000B............................97
Figure 5.8: Compressive Strength of MW-0000B, MG-3030, MW-3000 and MW-0030F .................................................................................................98
Figure 5.9: Compressive Strength of MW-0000B, MW-0010, MW-0030A, MW-0030B and MG-3030 .........................................................................99
Figure 5.10: Compressive Strength of MW-000B, MG-0040, MW-0040, MG-0040X and MG-3030 ...............................................................................100
Figure 5.11: Percent Expansion of MW-0000B, MG-3030, MW-3000 and MW-0030F ...............................................................................................101
Figure 5.12: Percent Expansion of MW-0000B, MW-0010, MW-0030A, MW-0030B and MG-3030 ...............................................................................102
Figure 5.13: Percent Expansion of MW-000B, MG-0040, MW-0040, MG-0040X and MG-3030 ...............................................................................102
xi
Figure 5.14: MW-0000A Photographs Taken Without a Camera’s Flash (Left) and With a Camera’s Flash (Right) .........................................................105
Figure 5.15: MG-3030 Photograph Taken Without a Camera’s Flash ......................106
Figure 5.16: MW-0030A Photograph Taken Without a Camera’s Flash ..................106
Figure 5.17: MW-3000 Photograph Taken Without a Camera’s Flash .....................106
xii
LIST OF ABBREVIATIONS
ASR Alkali-Silica Reaction
EVA Ethylene Vinyl Acetate
GGBS Ground Granulated Blast Furnace Slag
LRR Laser Retroreflectometer
MK Metakaolin
NJ barrier New Jersey Barrier
PFA Pulverized Fuel Ash
RG Recycled Glass
RPM Raised Pavement Marker
w/cm water to cementitious material
1
CHAPTER 1
INTRODUCTION
1.1 Objective
The impetus for this research was to pinpoint the prime methods for enhancing
visibility of concrete safety barriers. The changes proposed must improve the
effectiveness of these barriers during inclement weather and nighttime driving conditions.
It is also important that these barrier systems be cost effective and long lasting as well as
maintaining deterioration rates slower than the current systems in place.
The proposed methods should not affect the geometry or have any deleterious
effects on durability and strength of the concrete barriers; only enhance their reflectivity.
Any major change in geometry would require further crash testing to certify the safety
and performance of the barrier. The durability and strength of the concrete barrier are to
remain constant in order to ensure that the function of the barrier is unaltered. The
incorporation of crushed glass into the concrete mixture was selected for further study.
Of the options presented later in the report, the use of recycled glass required further
study to determine the viability as an effective and durable material. This choice would
have an advantage because of its positive environmental effects. The use of recycled
glass versus specially manufactured glass beads would lead to an outlet for reuse of
recycled glass.
2
There might be the potential for deleterious chemical reactions between the glass
and cement in the concrete mixture, specifically alkali-silica reaction (ASR). These
reactions are expounded upon in Chapter 3. The aim of the laboratory testing was to
identify proper mixing proportions that mitigate the potential for ASR in recycled glass
aggregate concretes.
1.2 Project Significance
Highway concrete barriers are critical in preventing head-on collisions. These
barriers are also important in maintaining safety in highway work zone areas. The
visibility of these barriers is critical to their function. They must provide a motorist with
two types of aid; one in foreseeing the road pathway immediately in front of them in
order to prevent lane weaving, and secondly to illuminate the road pattern farther ahead
in order to allow ample time for decision making (Mullowney, 1978).
Barrier visibility is dependent on its reflectivity, which is diminished during wet
weather and nighttime conditions. When the reflectivity is reduced, the driver’s preview
of the upcoming road pattern is decreased resulting in unsafe driving conditions (Allen
and McRuer, 1977). The addition of white pigment to concrete mixtures, which is
intended to provide a clear delineation between the barrier and the road surface is
currently a popular way of enhancing barrier visibility. Unfortunately, this delineation
nearly vanishes during wet, nighttime conditions (Mullowney, 1978). Another obstacle
stems from the fact that the reflectivity of many current methods employed in enhancing
visibility, such as the addition of white pigment to concrete mixtures and use of reflective
tape, deteriorate at a fast rate due to dirt buildup.
3
As is discussed in Chapter 2, the application of glass beads onto the surface of a
concrete barrier is one effective method of enhancing reflectivity. The use of recycled
glass in lieu of specially manufactured glass beads could provide a greater array of
positive results. The incorporation of recycled glass into the concrete mixture not only
stands to enhance the barrier reflectivity but to also offer an avenue for glass recycling.
Currently, major obstacles to glass recycling are impurities of recycled glass and
the high cost of color sorting mixed color waste stream. The quantity of mixed waste
glass far exceeds the quantity of color sorted glass (Shi and Zheng, 2005). Color sorting
recycled glass into glass cullet suitable for glass bottle manufacturing can be a costly
practice due to the large size of the waste glass stream as well as particle size and
contamination of the glass. For this reason, many material recovery facilities are forced
to send recycled glass to landfills (Meyer et al., 2001). There is a strong need for the
development of an avenue through which mixed color waste glass may be recycled and
its incorporation into construction products presents one such option that was
investigated in this project.
1.3 Crash Test Data
Concrete barriers are often used to delineate highway work zones. Their
reflectivity is critical in properly illuminating new roadway patterns. The presence of
workers, construction machinery, and highway barriers leads to a high-hazard
environment. There are 40,000 people injured each year as a result of motor vehicle
crashes in work zones (Li and Bai, 2007). The National Work Zone Safety Information
Clearinghouse’s 2006 crash data reports 1,004 fatal car accidents having occurred in the
4
United States construction zones. Hall and Lorenz (1989) reported that 15 percent of
fatalities involve pedestrians, many of whom are construction workers. In addition to
these crashes there are 52,000 property damage only crashes in work zones each year
(Khattak et al. 2000).
More than half of these accidents occur in the nighttime and because traffic
volumes are lower at this time, this means that accident rate is greater during the night
(Hall and Lorenz, 1989). Li and Bai (2008) found that work zone accident severity is
greater in the nighttime. Improving upon the reflectivity of the barrier should greatly
reduce nighttime work zone traffic accidents resulting in safer traffic conditions.
1.4 New Jersey Barriers
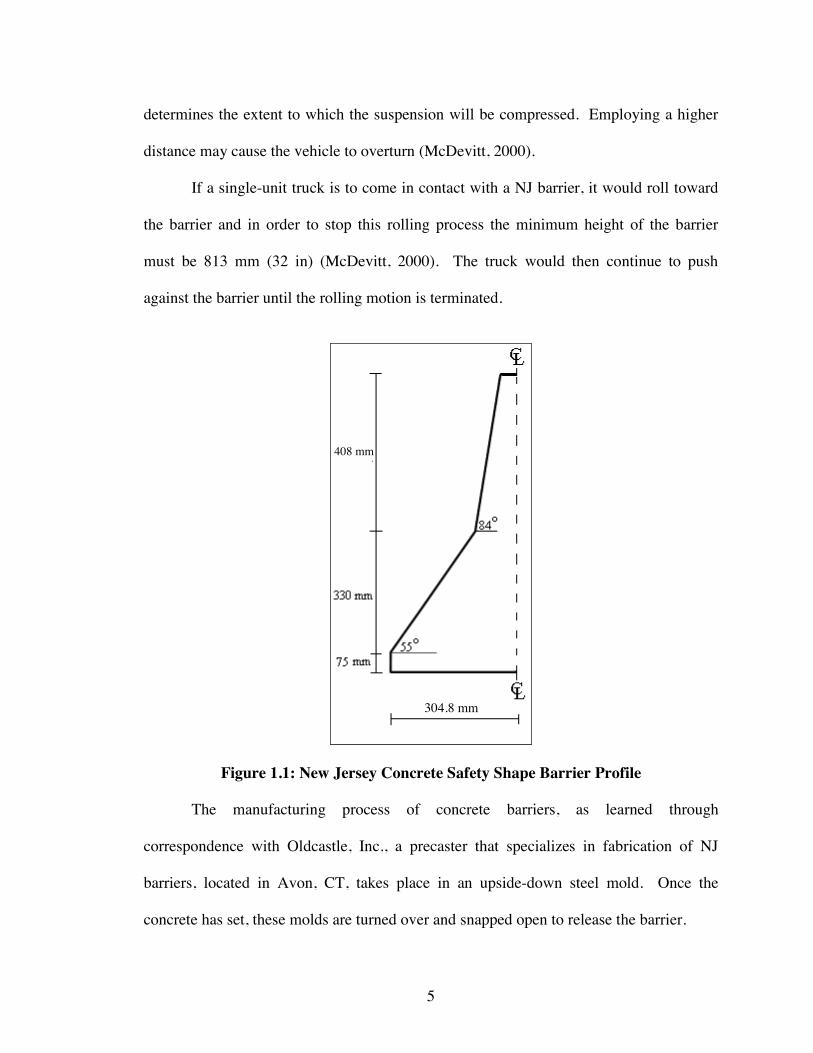
The type of concrete center barrier investigated is the New Jersey Concrete Safety
Shape Barrier (NJ barrier). NJ barrier is very prevalently used throughout the United
States. This barrier contains two sloped faces, an upper and a lower one (Figure 1.1).
Upon impact, the car’s bumper comes in contact with the upper sloped face. This causes
the vehicle to lift due to the bumper sliding upwards. At this point, the bumper should
theoretically begin to crush and this action should prevent the car from total uplift. The
wheel of the car will then come in contact with the lower sloped face. This action is
necessary in order to temporarily terminate the contact between the wheel and the paved
surface, which will serve in helping to bank and redirect the vehicle.
The key safety parameter of the barrier shape is the distance from the ground to
the slope break point. For the NJ barrier this distance is 405 mm (16 in). This
5
determines the extent to which the suspension will be compressed. Employing a higher
distance may cause the vehicle to overturn (McDevitt, 2000).
If a single-unit truck is to come in contact with a NJ barrier, it would roll toward
the barrier and in order to stop this rolling process the minimum height of the barrier
must be 813 mm (32 in) (McDevitt, 2000). The truck would then continue to push
against the barrier until the rolling motion is terminated.
Figure 1.1: New Jersey Concrete Safety Shape Barrier Profile
The manufacturing process of concrete barriers, as learned through
correspondence with Oldcastle, Inc., a precaster that specializes in fabrication of NJ
barriers, located in Avon, CT, takes place in an upside-down steel mold. Once the
concrete has set, these molds are turned over and snapped open to release the barrier.
304.8 mm
408 mm
6
CHAPTER 2
BARRIER REFLECTIVITY LITERATURE REVIEW
This chapter presents a full discussion pertaining to highway concrete barrier
reflectivity. Sections 2.1 to 2.3 provide the comprehensive literature review performed
on this topic. Section 2.4 provides the recommendations for modifying traditional NJ
barriers to achieve better visibility based on the aforementioned literature review.
2.1 Testing Methods
This section presents an overview of the methods of barrier reflectivity testing
noted in the literature.
During the daytime, the driver tends to depend on features in the distance rather
than the road surface for delineation and guidance, while in the nighttime the road signs
and markings are used for the aforementioned purpose (Attaway, 1989). Delineation
markings employed directly on roadways and road signs are retroreflective (Niu et al.,
2002). Retroreflective materials, unlike solely reflective materials that refract light,
redirect the incident light back to the light source (Black et al., 1992; Loetterle et al.,
2000; Paniati, 1989; Zwahlen and Schnell, 2000). The retroreflectorized material returns
the light in the shape of a narrow cone within which the head of the driver is situated,
Figure 2.1 (Zwahlen and Schnell, 2000). The visibility of the road marking or sign
during nighttime conditions is therefore dependent on the amount of reflected beam that
the retroreflective material returns (Mohan et al., 2004). Retroreflectivity is measured in
candelas per square meter per lux (cd/m2/lx) in the international system of units
(Attaway, 1989; Black et al., 1992; Kalchbrenner, 1989; Meydan and Senior, 1990; Niu
7
et al., 2002; Taori and McGee, 1998; Zwahlen and Schnell, 1996; Zwahlen and Schnell,
2000).
Figure 2.1: Representation of the Function of a Retroreflective Marker
There are two possible ways of measuring retroreflectivity: (1) through the use of
subjective means such as human test subjects or, (2) through the use of a
retroreflectometer. The use of test subjects provides subjective data while that of a
retroreflectometer yields objective results. A retroreflectometer “consists of a box that
eliminates ambient light, a source projected on a known area, a light sensor to measure
retroreflected light, and provisions for calibrating the instrument on a strong
retroreflector” (Attaway, 1989). Different instruments are used to measure the
retroreflectivity of roadway markings and roadway signs. Road signs employ
retroreflective sheeting, which has a much higher retroreflectivity value than epoxy road
markings as expounded upon in Sections 2.2.1 and 2.2.3. The minimum value for white
engineering grade retroreflective sheeting used on road signage is 70 cd/m2/lx, while that
of low-retroreflectivity white epoxy used for road striping is approximately a thousandth
of this value, 110 to 155 mcd/m2/lx (Mohan et al., 2004; Zwahlen and Schnell, 1996).
For this reason, machines employed in measuring retroreflectivity of roadway signs
Projected Light Retroreflected Light
8
output units of cd/m2/lx while retroreflectometers used for roadway markings handle
much smaller magnitudes of retroreflectivity, in the order of mcd/m2/lx.
2.1.1 Use of Human Test Subjects
This section presents an overview of previous research methods that subjectively
evaluated reflectivity using human test subjects. Only the testing procedure is discussed.
Further discussion on the types of markers studied and the results obtained from the
following studies will be discussed in Section 2.2.
Davis (1986) evaluated fourteen raised pavement markers out of which six were
selected for testing. Thirty-three of each of these six raised pavement markers were
installed on an unopened highway section at 1.8 m (6 ft) intervals. Eight test subjects
“independently judged the visibility of the markers from a car with the sun behind, the
sun in front, and at night and recorded their opinion on a questionnaire as to the distance
from which they could detect each marker” (Davis, 1986).
Dudek et al. (1986) evaluated temporary markers that were to be used to delineate
travel lanes in work zones. Ten temporary pavement marking treatments were selected
and tested during dry, daytime conditions. After this first phase, the top six were selected
as well as the control. These seven temporary pavement marking treatments were then
tested during dry, nighttime conditions. To perform these tests, 69 test subjects were split
into two sets: set A and set B. Set A compared the striping methods while set B
compared the raised pavement marker techniques. Effectiveness was evaluated through
the use of video recording of the driver’s maneuvering through the test track. Frequency
of erratic movements and curve misses were noted. Other factors evaluated were
9
maximum entry speed into the curve, minimum speed while in the curve and magnitude
of the speed change. Driver’s subjective ratings of the treatment’s effectiveness were
also taken into account.
Olson (1989) used test subjects to develop information that would aid in
recommending minimum retroreflectivity values for various types of retroreflective signs
in cluttered urban, sub-urban, and dark rural environments. The experiment was
performed at night. The test subjects drove the car through the test area that was situated
on public roads while the experimenter sat in the back seat. The road signs were
positioned by the experimenters. As soon as the test subject noted that there was a road
sign in the distance, the backseat experimenter started a “distance counter”. As soon as
the test subject identified the color, the experimenter recorded whether or not it was a
correct. If correct, a second counter was initiated, if incorrect the second counter was
initiated when the driver corrected himself. When the testing vehicle passed the road
sign, both of these counters were stopped. These values were then used to calculate the
distance at which a sign, with varying levels of retroreflectivity could be detected and
properly identified.
Zwahlen and Schnell (1996) chose ten college students as their test subjects. The
experiment was performed on an Ohio University airport runway during dry, nighttime
conditions. The end detection distance of retroreflectorized centerline pavement marking
tape, that was 0.1 m (4 in) wide was tested. The test subjects drove through the testing
lane and reported to the assistant the exact point at which they were sure that the last
stripe of the current dashed centerline treatment was detected. A distance measuring
device was used by the experimenters to measure the distance during each test.
10
O’Brien (1989) studied the application of glass bead onto a thermoplastic marking
material that would yield the proper retroreflectivity values for nighttime visibility. The
different glass spheres applications were studied subjectively by the experimenter in a
dark room using a flashlight. The beads were illuminated by a small flashlight at a
distance of 3 m (10 ft) to 7.6 m (25 ft). The beads were rated as providing minimal,
moderate, excellent or none retroreflective value. Photomicrographs (pictures taken
through the use of a microscope) were taken both perpendicularly and in cross-section.
This was intended to display the various bead distribution and embedment characteristics.
2.1.2 Use of a Retroreflectometer
This section presents the research that implemented retroreflectometers in
evaluating reflectivity. Only the testing procedure is discussed. Further discussion on
the types of markers studied and the results obtained from the following studies will be
discussed in Section 2.2.
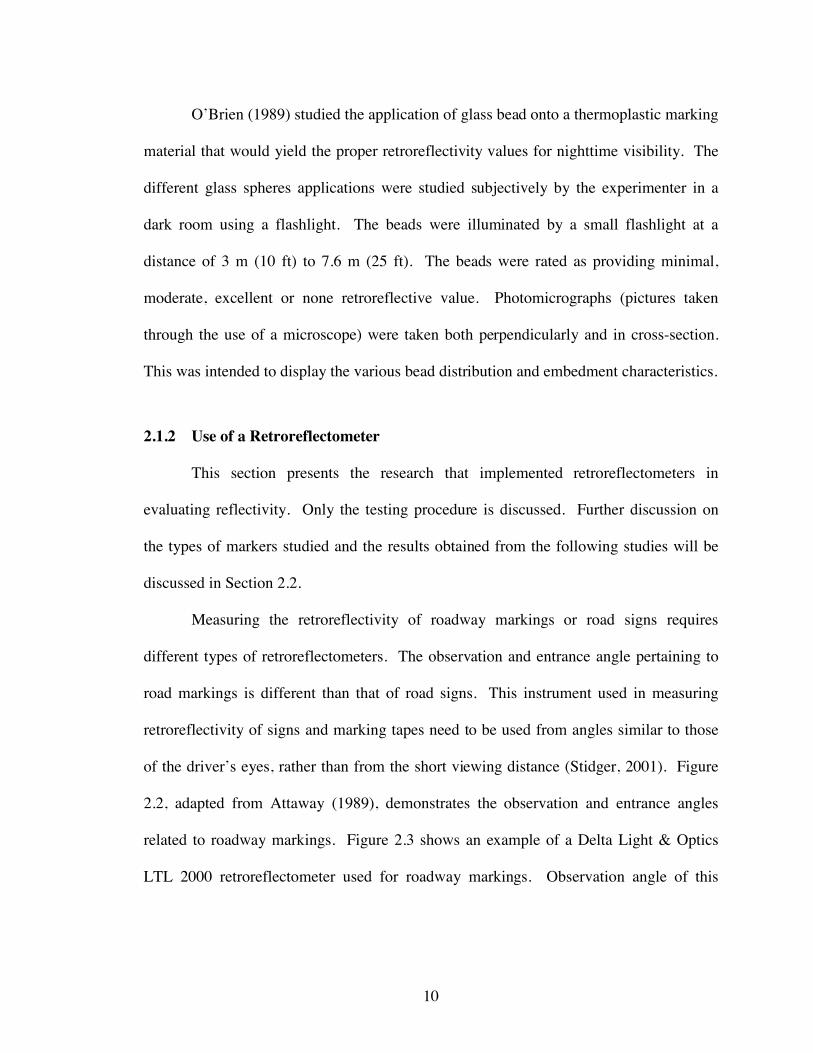
Measuring the retroreflectivity of roadway markings or road signs requires
different types of retroreflectometers. The observation and entrance angle pertaining to
road markings is different than that of road signs. This instrument used in measuring
retroreflectivity of signs and marking tapes need to be used from angles similar to those
of the driver’s eyes, rather than from the short viewing distance (Stidger, 2001). Figure
2.2, adapted from Attaway (1989), demonstrates the observation and entrance angles
related to roadway markings. Figure 2.3 shows an example of a Delta Light & Optics
LTL 2000 retroreflectometer used for roadway markings. Observation angle of this
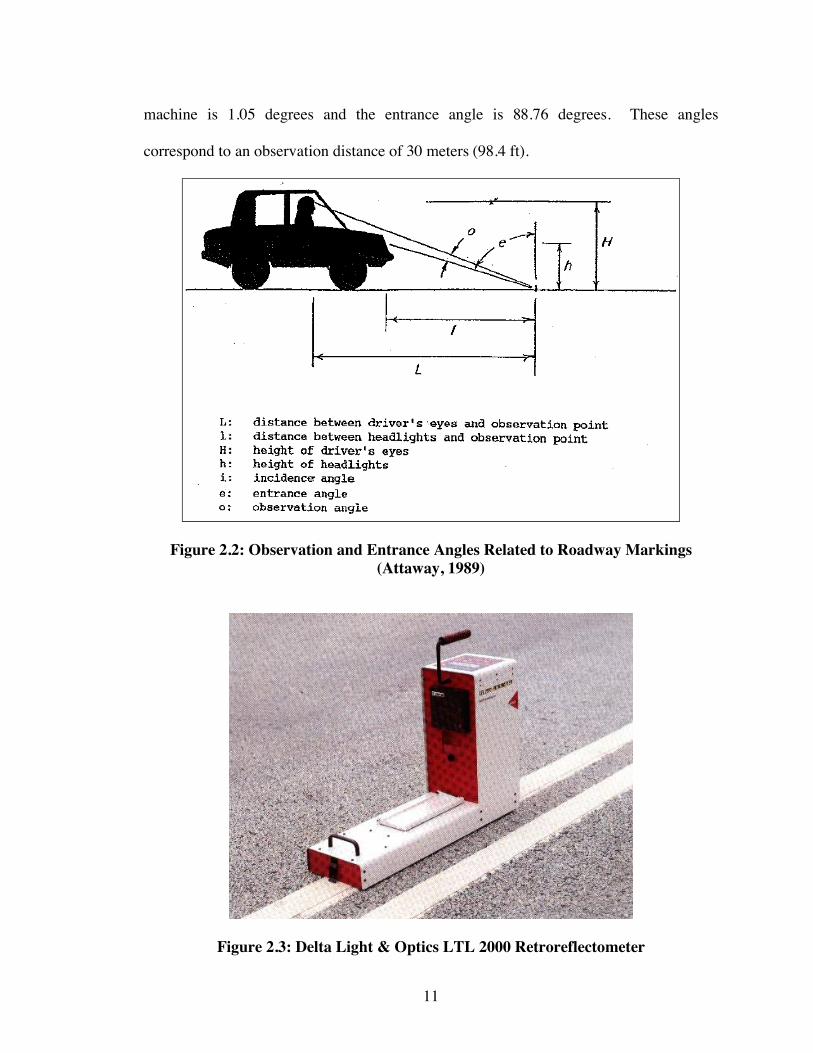
11
machine is 1.05 degrees and the entrance angle is 88.76 degrees. These angles
correspond to an observation distance of 30 meters (98.4 ft).
Figure 2.2: Observation and Entrance Angles Related to Roadway Markings (Attaway, 1989)
Figure 2.3: Delta Light & Optics LTL 2000 Retroreflectometer
12
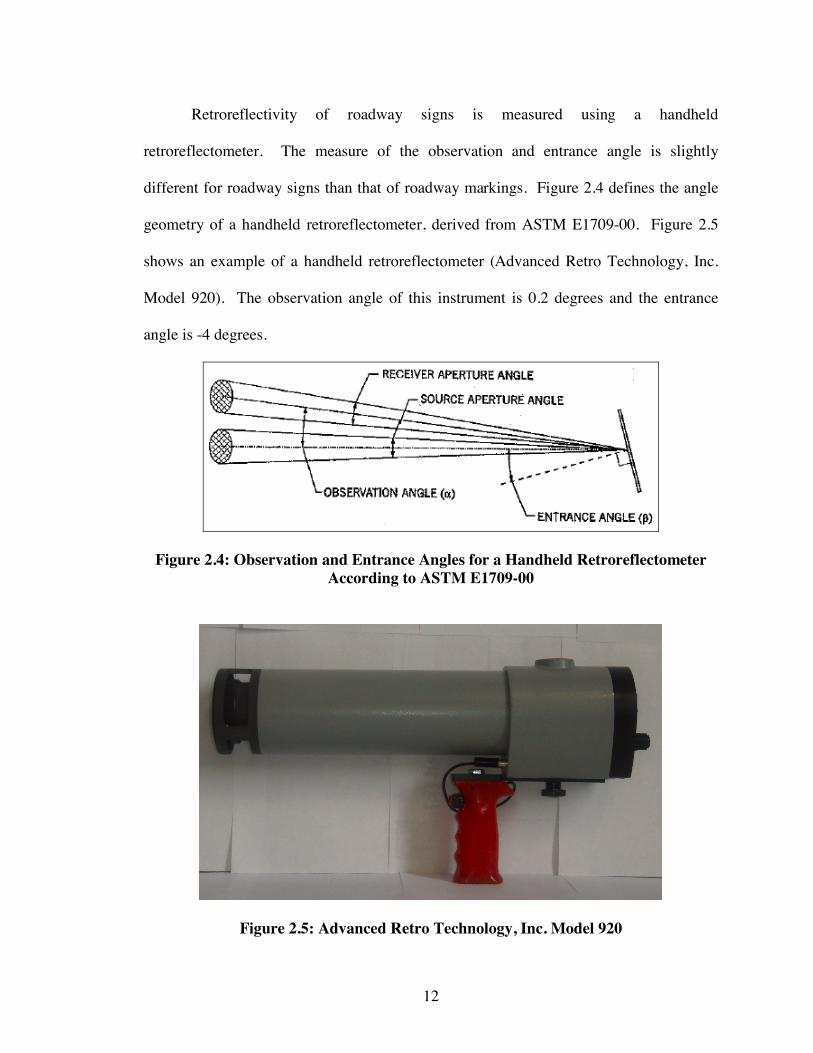
Retroreflectivity of roadway signs is measured using a handheld
retroreflectometer. The measure of the observation and entrance angle is slightly
different for roadway signs than that of roadway markings. Figure 2.4 defines the angle
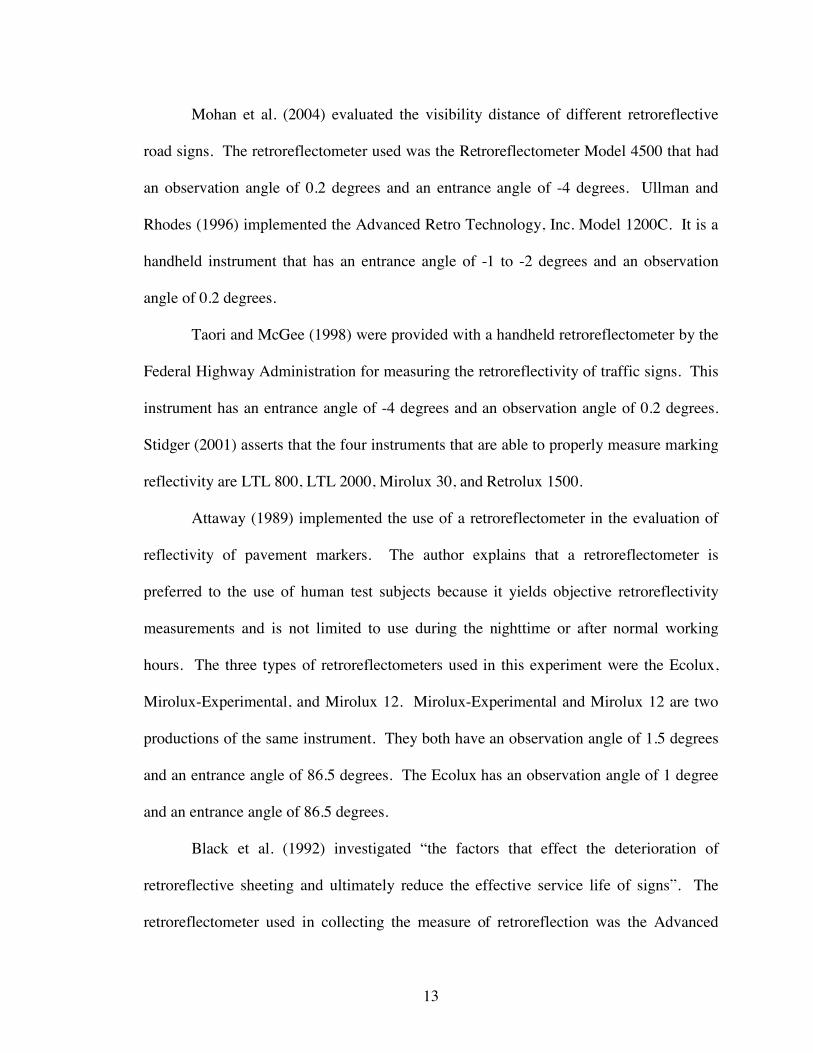
geometry of a handheld retroreflectometer, derived from ASTM E1709-00. Figure 2.5
shows an example of a handheld retroreflectometer (Advanced Retro Technology, Inc.
Model 920). The observation angle of this instrument is 0.2 degrees and the entrance
angle is -4 degrees.
Figure 2.4: Observation and Entrance Angles for a Handheld Retroreflectometer According to ASTM E1709-00
Figure 2.5: Advanced Retro Technology, Inc. Model 920
13
Mohan et al. (2004) evaluated the visibility distance of different retroreflective
road signs. The retroreflectometer used was the Retroreflectometer Model 4500 that had
an observation angle of 0.2 degrees and an entrance angle of -4 degrees. Ullman and
Rhodes (1996) implemented the Advanced Retro Technology, Inc. Model 1200C. It is a
handheld instrument that has an entrance angle of -1 to -2 degrees and an observation
angle of 0.2 degrees.
Taori and McGee (1998) were provided with a handheld retroreflectometer by the
Federal Highway Administration for measuring the retroreflectivity of traffic signs. This
instrument has an entrance angle of -4 degrees and an observation angle of 0.2 degrees.
Stidger (2001) asserts that the four instruments that are able to properly measure marking
reflectivity are LTL 800, LTL 2000, Mirolux 30, and Retrolux 1500.
Attaway (1989) implemented the use of a retroreflectometer in the evaluation of
reflectivity of pavement markers. The author explains that a retroreflectometer is
preferred to the use of human test subjects because it yields objective retroreflectivity
measurements and is not limited to use during the nighttime or after normal working
hours. The three types of retroreflectometers used in this experiment were the Ecolux,
Mirolux-Experimental, and Mirolux 12. Mirolux-Experimental and Mirolux 12 are two
productions of the same instrument. They both have an observation angle of 1.5 degrees
and an entrance angle of 86.5 degrees. The Ecolux has an observation angle of 1 degree
and an entrance angle of 86.5 degrees.
Black et al. (1992) investigated “the factors that effect the deterioration of
retroreflective sheeting and ultimately reduce the effective service life of signs”. The
retroreflectometer used in collecting the measure of retroreflection was the Advanced
14
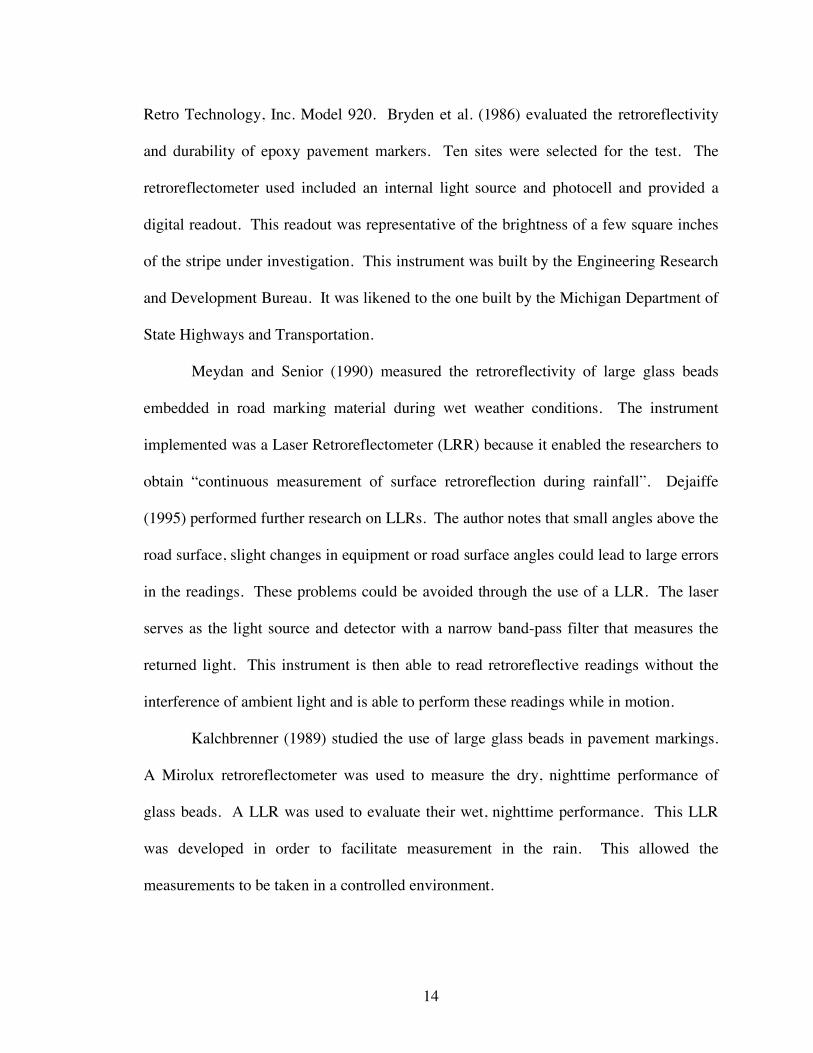
Retro Technology, Inc. Model 920. Bryden et al. (1986) evaluated the retroreflectivity
and durability of epoxy pavement markers. Ten sites were selected for the test. The
retroreflectometer used included an internal light source and photocell and provided a
digital readout. This readout was representative of the brightness of a few square inches
of the stripe under investigation. This instrument was built by the Engineering Research
and Development Bureau. It was likened to the one built by the Michigan Department of
State Highways and Transportation.
Meydan and Senior (1990) measured the retroreflectivity of large glass beads
embedded in road marking material during wet weather conditions. The instrument
implemented was a Laser Retroreflectometer (LRR) because it enabled the researchers to
obtain “continuous measurement of surface retroreflection during rainfall”. Dejaiffe
(1995) performed further research on LLRs. The author notes that small angles above the
road surface, slight changes in equipment or road surface angles could lead to large errors
in the readings. These problems could be avoided through the use of a LLR. The laser
serves as the light source and detector with a narrow band-pass filter that measures the
returned light. This instrument is then able to read retroreflective readings without the
interference of ambient light and is able to perform these readings while in motion.
Kalchbrenner (1989) studied the use of large glass beads in pavement markings.
A Mirolux retroreflectometer was used to measure the dry, nighttime performance of
glass beads. A LLR was used to evaluate their wet, nighttime performance. This LLR
was developed in order to facilitate measurement in the rain. This allowed the
measurements to be taken in a controlled environment.
15
2.1.3 Use of Retroreflectometers in Conjunction with Human Test Subjects
This section presents the research that implemented retroreflectometers in
conjunction with human observers in evaluating reflectivity. Only the testing procedure
is discussed. Further discussion on the types of markers studied and the results obtained
from the following study will be discussed in Section 2.2.
Loetterle et al. (2000) used both human observers and a LLR in their search for
the acceptable value of retroreflectivity of pavement markings. The drivers were first
used to determine the minimum level of adequate retroreflectivity. Once these markers
were flagged by the drivers, the retroreflectometer was then used to measure the
retroreflectivity values of those markings. The authors claim that through this process, an
objective evaluation of pavement markings could be pinpointed.
The tests were run during dry, nighttime conditions. Laserlux was the mobile
retroreflectometer used. It is a LLR that acts by projecting a laser beam that sweeps
across the pavement marking while in motion. This laser beam is then reflected from the
marking and “is sensed by the photo optic sensor located in the same housing as the
scanning laser” (Loetterle et al., 2000). The entrance angle of this instrument is 1 degree
and the observation angle is 88.76 degrees.
2.1.4 Use of a Computer Model
Two studies were found which did not implement a retroreflectometer or human
observers in their study. Within this section, computer models used in evaluating
retroreflectivity are discussed. Only the testing procedure is evaluated. For further
discussion regarding the results of the studies see Section 2.2.
16
Zwahlen and Schnell (2000) measured the retroreflectivity of pavement markers by
using Computer-Aided Road-Marking Visibility Evaluator computer model (CARVE).
CARVE is a PC based program that was developed by Ohio University. This program
“models the arrangement of the headlamps, the observer, and the reflectors (pavement
markings) accurately in 3D space” (Zwahlen and Schnell, 2000). CARVE was used to
measure the retroreflectivity of white and yellow pavement markings. For further
explanation on the program’s capabilities please refer to Zwahlen and Schnell, 2000).
Niu et al. (2002) had constructed an instrument that consisted of a color digital
camera, a laptop computer, and a digital connector that facilitated in bringing the images
from the camera to the computer in real time. This machine was used to test the
retroreflectivity of different sheeting colors but is limited when used during the
nighttime. For full explanation of the process undertaken in identifying brightness of
road signs, please refer to the Niu et al. (2002).
2.2 Types of Retroreflectors
The four types of retroreflective materials that are covered in prior research are
pavement marking tape, paint, glass beads, traffic sign sheeting, and raised pavement
markers. These will be further evaluated in the sections that follow.
2.2.1 Pavement Marking Tape
Bryden et al. (1986) selected 16 sites throughout New York that had epoxy
pavement markings. Edge lines, solid lane lines, skip lines, centerlines, and median lines
were studied. The durability and the retroreflective performance of different colors were
evaluated. The retroreflectivity was measured at 10 out of the 16 locations using a
17
retroreflectometer described previously (section 2.1.2). The most prevalent failure mode
encountered was abrasion failure due to traffic and snowplow wear. It was found that the
retroreflectivity of the markings was not as good as their overall durability. The painted
stripes degraded at a slower rate due to weathering and vehicular impact than the rate at
which retroreflectivity diminished. Of the two colors compared, white and yellow, white
was found to yield better retroreflectivity values.
Loetterle et al. (2000) investigated the threshold value of retroreflectivity of
pavement markings using the procedure described in section 2.1.3. The pavement
markings evaluated were edge lines, centerlines, and lane lines. The colors evaluated
were white and yellow. It was found that 90 percent of the participants found pavement
markings with a value of 128 mcd/m2/lx and above as acceptable. The same percentage
of participants found pavement markings with a retroreflectivity value 87 mcd/m2/lx and
below as unacceptable. The researchers concluded that when using the Laserlux
retroreflectometer the threshold value of acceptable level of retroreflectivity versus
unacceptable appears to be between 80 to 120 mcd/m2/lx. Color comparison was not
performed in this study.
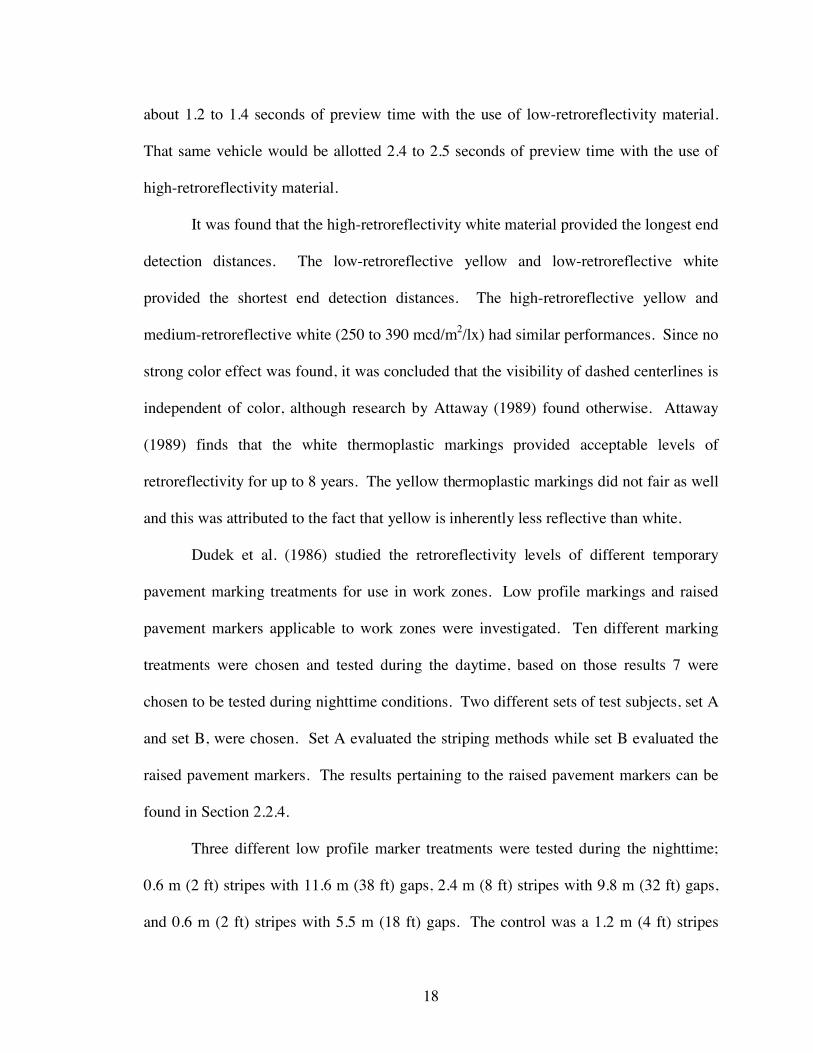
Zwahlen and Schnell (1996) evaluated the end detection distance of centerlines
made up of 0.1 m (3.94 in) wide pavement marking tape as a function of color during the
nighttime. High-retroreflectivity white (300 to 550 mcd/m2/lx), low-retroreflectivity
white (110 to 155 mcd/m2/lx), high-retroreflectivity yellow (200 to 450 mcd/m2/lx), and
low-retroreflectivity yellow (70 to 100 mcd/m2/lx) dashed centerlines were evaluated. It
was found that retroreflectivity plays an important part when dealing with end detection
distance. A vehicle traveling at a speed of 90 km/hr (56 mi/hr) would be provided with
18
about 1.2 to 1.4 seconds of preview time with the use of low-retroreflectivity material.
That same vehicle would be allotted 2.4 to 2.5 seconds of preview time with the use of
high-retroreflectivity material.
It was found that the high-retroreflectivity white material provided the longest end
detection distances. The low-retroreflective yellow and low-retroreflective white
provided the shortest end detection distances. The high-retroreflective yellow and
medium-retroreflective white (250 to 390 mcd/m2/lx) had similar performances. Since no
strong color effect was found, it was concluded that the visibility of dashed centerlines is
independent of color, although research by Attaway (1989) found otherwise. Attaway
(1989) finds that the white thermoplastic markings provided acceptable levels of
retroreflectivity for up to 8 years. The yellow thermoplastic markings did not fair as well
and this was attributed to the fact that yellow is inherently less reflective than white.
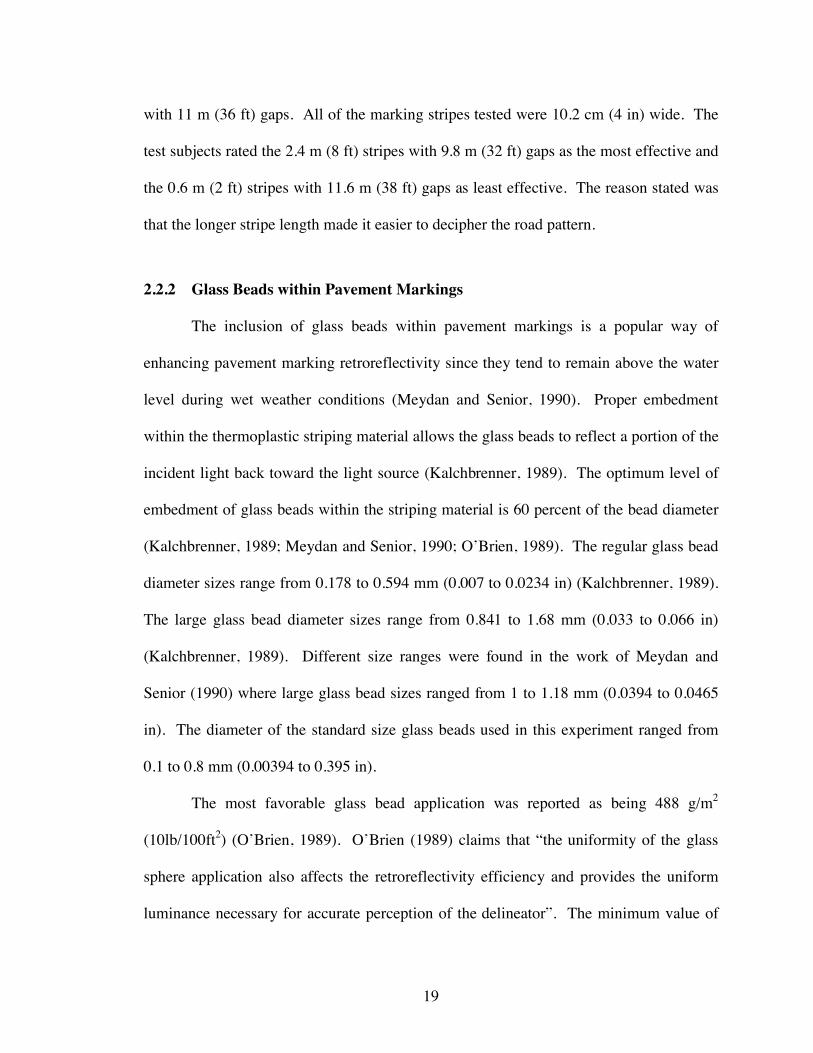
Dudek et al. (1986) studied the retroreflectivity levels of different temporary
pavement marking treatments for use in work zones. Low profile markings and raised
pavement markers applicable to work zones were investigated. Ten different marking
treatments were chosen and tested during the daytime, based on those results 7 were
chosen to be tested during nighttime conditions. Two different sets of test subjects, set A
and set B, were chosen. Set A evaluated the striping methods while set B evaluated the
raised pavement markers. The results pertaining to the raised pavement markers can be
found in Section 2.2.4.
Three different low profile marker treatments were tested during the nighttime;
0.6 m (2 ft) stripes with 11.6 m (38 ft) gaps, 2.4 m (8 ft) stripes with 9.8 m (32 ft) gaps,
and 0.6 m (2 ft) stripes with 5.5 m (18 ft) gaps. The control was a 1.2 m (4 ft) stripes
19
with 11 m (36 ft) gaps. All of the marking stripes tested were 10.2 cm (4 in) wide. The
test subjects rated the 2.4 m (8 ft) stripes with 9.8 m (32 ft) gaps as the most effective and
the 0.6 m (2 ft) stripes with 11.6 m (38 ft) gaps as least effective. The reason stated was
that the longer stripe length made it easier to decipher the road pattern.
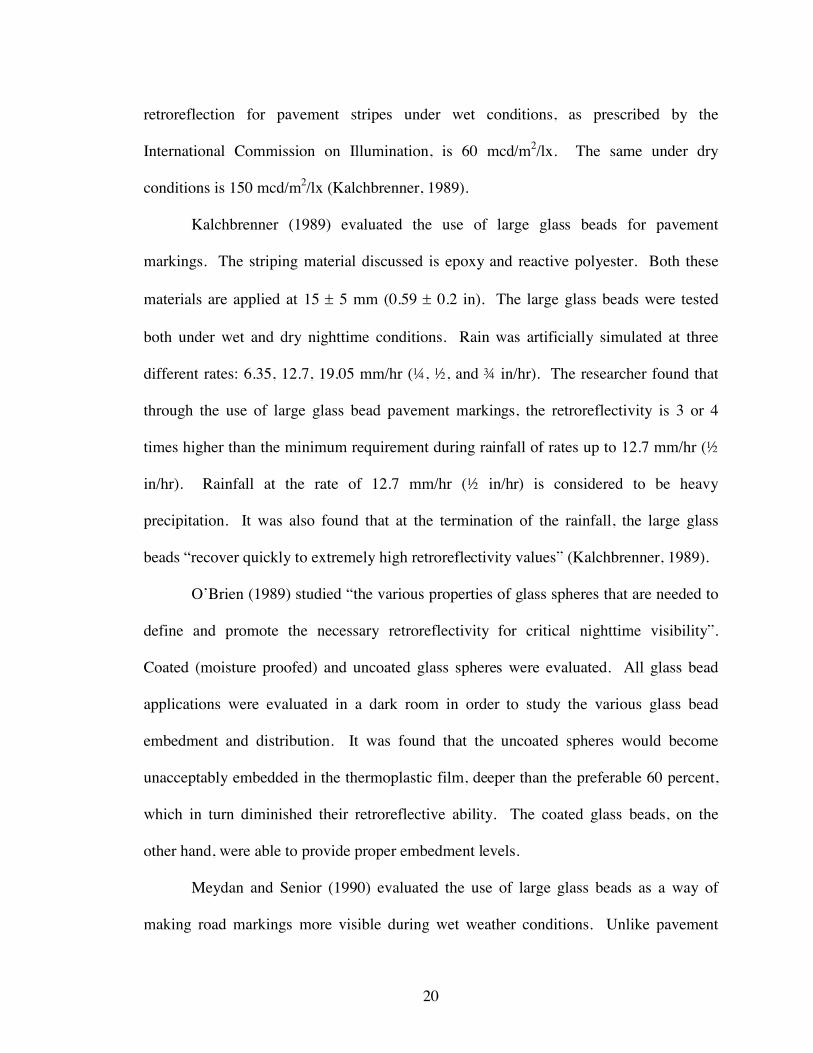
2.2.2 Glass Beads within Pavement Markings
The inclusion of glass beads within pavement markings is a popular way of
enhancing pavement marking retroreflectivity since they tend to remain above the water
level during wet weather conditions (Meydan and Senior, 1990). Proper embedment
within the thermoplastic striping material allows the glass beads to reflect a portion of the
incident light back toward the light source (Kalchbrenner, 1989). The optimum level of
embedment of glass beads within the striping material is 60 percent of the bead diameter
(Kalchbrenner, 1989; Meydan and Senior, 1990; O’Brien, 1989). The regular glass bead
diameter sizes range from 0.178 to 0.594 mm (0.007 to 0.0234 in) (Kalchbrenner, 1989).
The large glass bead diameter sizes range from 0.841 to 1.68 mm (0.033 to 0.066 in)
(Kalchbrenner, 1989). Different size ranges were found in the work of Meydan and
Senior (1990) where large glass bead sizes ranged from 1 to 1.18 mm (0.0394 to 0.0465
in). The diameter of the standard size glass beads used in this experiment ranged from
0.1 to 0.8 mm (0.00394 to 0.395 in).
The most favorable glass bead application was reported as being 488 g/m2
(10lb/100ft2) (O’Brien, 1989). O’Brien (1989) claims that “the uniformity of the glass
sphere application also affects the retroreflectivity efficiency and provides the uniform
luminance necessary for accurate perception of the delineator”. The minimum value of
20
retroreflection for pavement stripes under wet conditions, as prescribed by the
International Commission on Illumination, is 60 mcd/m2/lx. The same under dry
conditions is 150 mcd/m2/lx (Kalchbrenner, 1989).
Kalchbrenner (1989) evaluated the use of large glass beads for pavement
markings. The striping material discussed is epoxy and reactive polyester. Both these
materials are applied at 15 5 mm (0.59 0.2 in). The large glass beads were tested
both under wet and dry nighttime conditions. Rain was artificially simulated at three
different rates: 6.35, 12.7, 19.05 mm/hr (¼, ½, and ¾ in/hr). The researcher found that
through the use of large glass bead pavement markings, the retroreflectivity is 3 or 4
times higher than the minimum requirement during rainfall of rates up to 12.7 mm/hr (½
in/hr). Rainfall at the rate of 12.7 mm/hr (½ in/hr) is considered to be heavy
precipitation. It was also found that at the termination of the rainfall, the large glass
beads “recover quickly to extremely high retroreflectivity values” (Kalchbrenner, 1989).
O’Brien (1989) studied “the various properties of glass spheres that are needed to
define and promote the necessary retroreflectivity for critical nighttime visibility”.
Coated (moisture proofed) and uncoated glass spheres were evaluated. All glass bead
applications were evaluated in a dark room in order to study the various glass bead
embedment and distribution. It was found that the uncoated spheres would become
unacceptably embedded in the thermoplastic film, deeper than the preferable 60 percent,
which in turn diminished their retroreflective ability. The coated glass beads, on the
other hand, were able to provide proper embedment levels.
Meydan and Senior (1990) evaluated the use of large glass beads as a way of
making road markings more visible during wet weather conditions. Unlike pavement
21
marking tape, large glass beads protrude above the road surface and therefore are visible
during wet weather conditions. This was in line with the findings of Kalchbrenner (1989)
who found that as the beads were covered with a thin film of water, the retroreflectivity
level of the large glass beads was 200 mcd/m2/lx while that of the standard beads fell
below the acceptable value of 60 mcd/m2/lx.
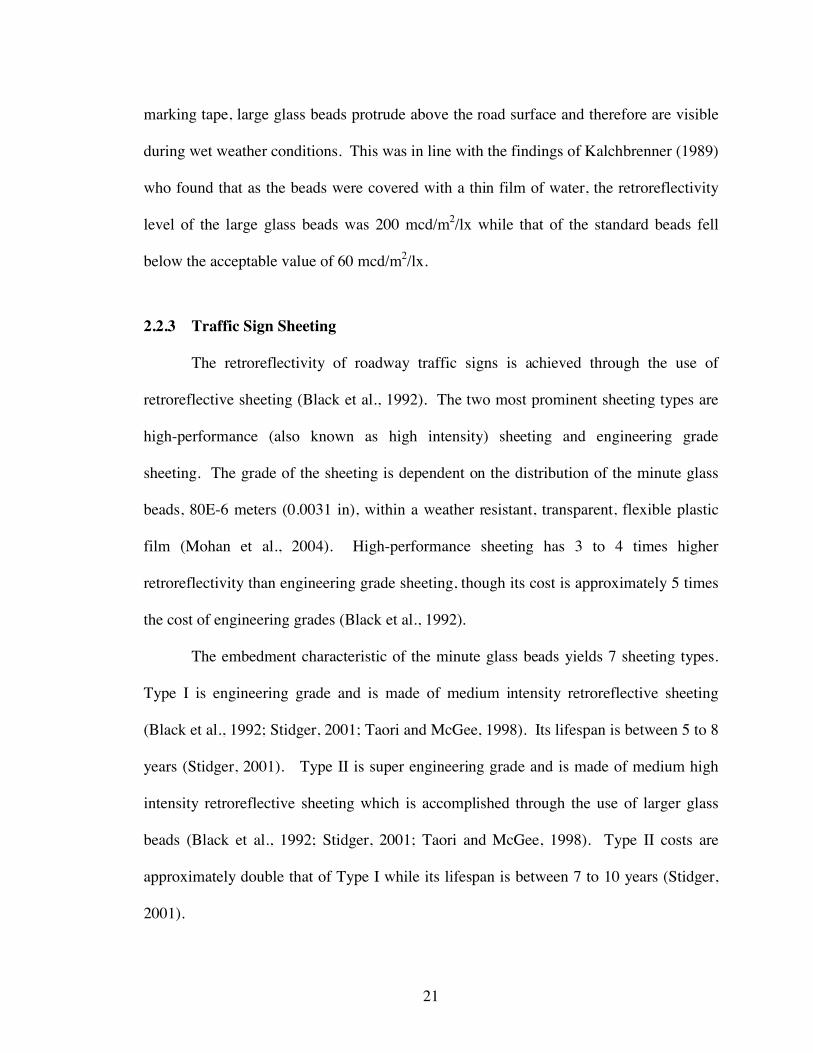
2.2.3 Traffic Sign Sheeting
The retroreflectivity of roadway traffic signs is achieved through the use of
retroreflective sheeting (Black et al., 1992). The two most prominent sheeting types are
high-performance (also known as high intensity) sheeting and engineering grade
sheeting. The grade of the sheeting is dependent on the distribution of the minute glass
beads, 80E-6 meters (0.0031 in), within a weather resistant, transparent, flexible plastic
film (Mohan et al., 2004). High-performance sheeting has 3 to 4 times higher
retroreflectivity than engineering grade sheeting, though its cost is approximately 5 times
the cost of engineering grades (Black et al., 1992).
The embedment characteristic of the minute glass beads yields 7 sheeting types.
Type I is engineering grade and is made of medium intensity retroreflective sheeting
(Black et al., 1992; Stidger, 2001; Taori and McGee, 1998). Its lifespan is between 5 to 8
years (Stidger, 2001). Type II is super engineering grade and is made of medium high
intensity retroreflective sheeting which is accomplished through the use of larger glass
beads (Black et al., 1992; Stidger, 2001; Taori and McGee, 1998). Type II costs are
approximately double that of Type I while its lifespan is between 7 to 10 years (Stidger,
2001).
22
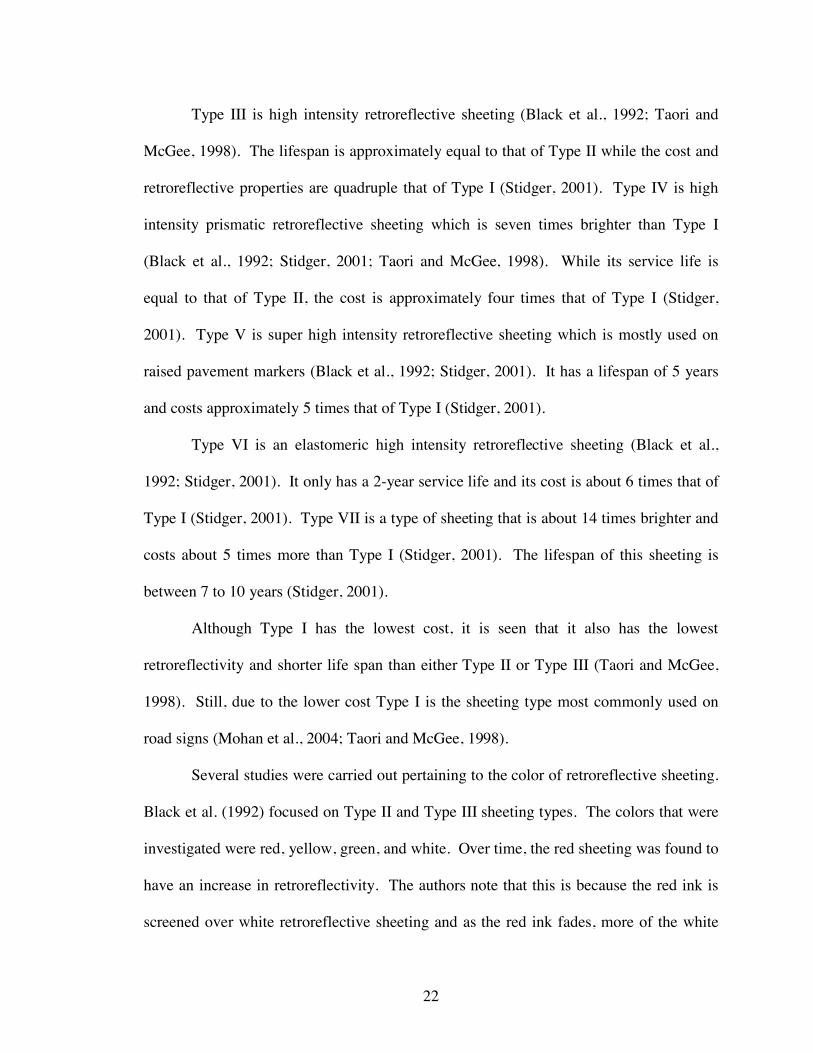
Type III is high intensity retroreflective sheeting (Black et al., 1992; Taori and
McGee, 1998). The lifespan is approximately equal to that of Type II while the cost and
retroreflective properties are quadruple that of Type I (Stidger, 2001). Type IV is high
intensity prismatic retroreflective sheeting which is seven times brighter than Type I
(Black et al., 1992; Stidger, 2001; Taori and McGee, 1998). While its service life is
equal to that of Type II, the cost is approximately four times that of Type I (Stidger,
2001). Type V is super high intensity retroreflective sheeting which is mostly used on
raised pavement markers (Black et al., 1992; Stidger, 2001). It has a lifespan of 5 years
and costs approximately 5 times that of Type I (Stidger, 2001).
Type VI is an elastomeric high intensity retroreflective sheeting (Black et al.,
1992; Stidger, 2001). It only has a 2-year service life and its cost is about 6 times that of
Type I (Stidger, 2001). Type VII is a type of sheeting that is about 14 times brighter and
costs about 5 times more than Type I (Stidger, 2001). The lifespan of this sheeting is
between 7 to 10 years (Stidger, 2001).
Although Type I has the lowest cost, it is seen that it also has the lowest
retroreflectivity and shorter life span than either Type II or Type III (Taori and McGee,
1998). Still, due to the lower cost Type I is the sheeting type most commonly used on
road signs (Mohan et al., 2004; Taori and McGee, 1998).
Several studies were carried out pertaining to the color of retroreflective sheeting.
Black et al. (1992) focused on Type II and Type III sheeting types. The colors that were
investigated were red, yellow, green, and white. Over time, the red sheeting was found to
have an increase in retroreflectivity. The authors note that this is because the red ink is
screened over white retroreflective sheeting and as the red ink fades, more of the white

23
background becomes visible. Both the yellow engineering grade and the white
engineering grade sheeting showed a decrease of retroreflectivity with time. The high-
performance white sheeting’s retroreflectivity decrease was less dramatic than that of the
engineering grade. The green high-performance grade and the engineering grade
exhibited the same behavior; the two types were able to retain their retroreflectivity for
up to 8 years of service life but fall below the minimum acceptable value after 12 years.
Mohan et al. (2004) studied the different visibility distances of retroreflective road
signs. The authors noted that the factors upon which road sign visibility is dependent are
the types of sheetings employed, the intensity of the primary light sources at the road,
height of the driver’s eye, and the “luminance caused by the headlight beam of the
vehicle on road sign and by reflected beam on driver’s eye” (Mohan et al., 2004). In-
service road signs were evaluated to test how much of the minimum required
retroreflectivity value was retained. According the specifications followed by the
researchers, engineering grade sheeting should retain 50 percent of its retroreflectance
after 5 years and high intensity grade sheeting must retain 75 percent of its original
retroreflectance after 7 years.
Blue, white, and red signs were inspected. The engineering grade blue sheeting
retained 25 to 50 percent of the minimum acceptable value, the engineering grade white
sheeting retained 28 to 55 percent, and the engineering grade red sheeting retained 33 to
90 percent. The minimum retroreflectivity values are 4 cd/m2/lx, 70 cd/m2/lx, and 14.5
cd/m2/lx for blue, white, and red respectively. It is seen that while the white engineering
grade sheeting did not have the highest percentage range of retained retroreflectivity, it
24
still had the highest retroreflectivity values since its required minimum was far above the
others.
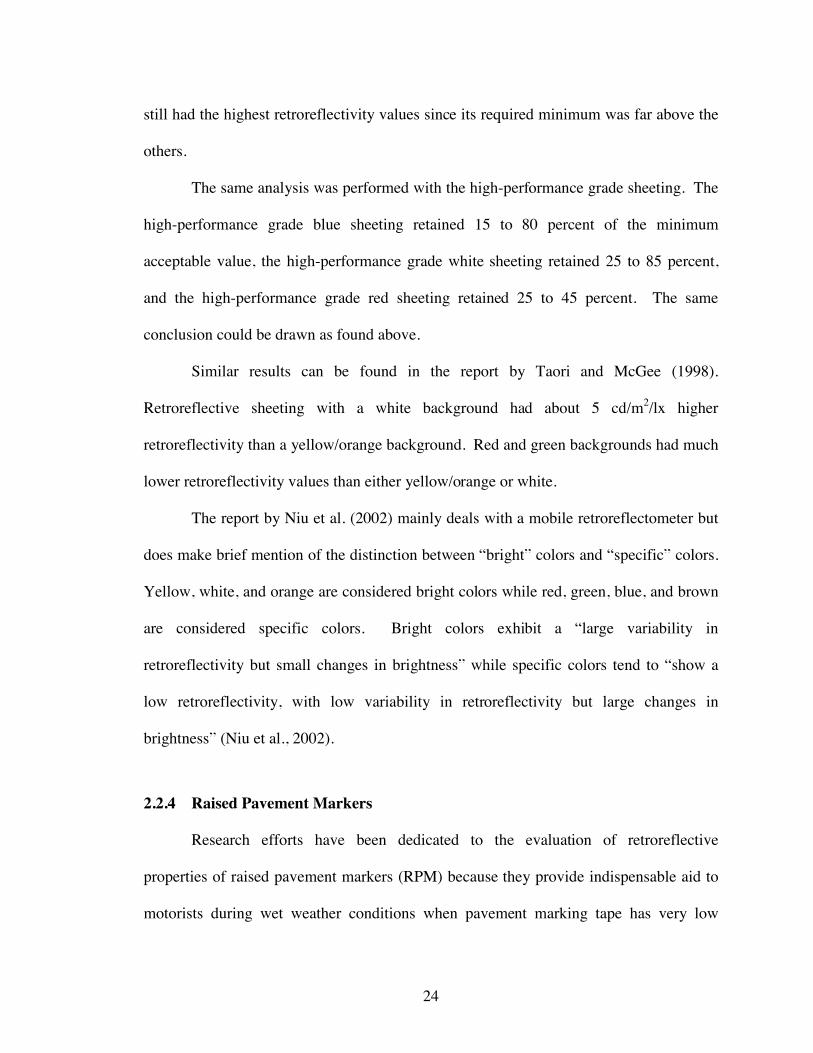
The same analysis was performed with the high-performance grade sheeting. The
high-performance grade blue sheeting retained 15 to 80 percent of the minimum
acceptable value, the high-performance grade white sheeting retained 25 to 85 percent,
and the high-performance grade red sheeting retained 25 to 45 percent. The same
conclusion could be drawn as found above.
Similar results can be found in the report by Taori and McGee (1998).
Retroreflective sheeting with a white background had about 5 cd/m2/lx higher
retroreflectivity than a yellow/orange background. Red and green backgrounds had much
lower retroreflectivity values than either yellow/orange or white.
The report by Niu et al. (2002) mainly deals with a mobile retroreflectometer but
does make brief mention of the distinction between “bright” colors and “specific” colors.
Yellow, white, and orange are considered bright colors while red, green, blue, and brown
are considered specific colors. Bright colors exhibit a “large variability in
retroreflectivity but small changes in brightness” while specific colors tend to “show a
low retroreflectivity, with low variability in retroreflectivity but large changes in
brightness” (Niu et al., 2002).
2.2.4 Raised Pavement Markers
Research efforts have been dedicated to the evaluation of retroreflective
properties of raised pavement markers (RPM) because they provide indispensable aid to
motorists during wet weather conditions when pavement marking tape has very low
25
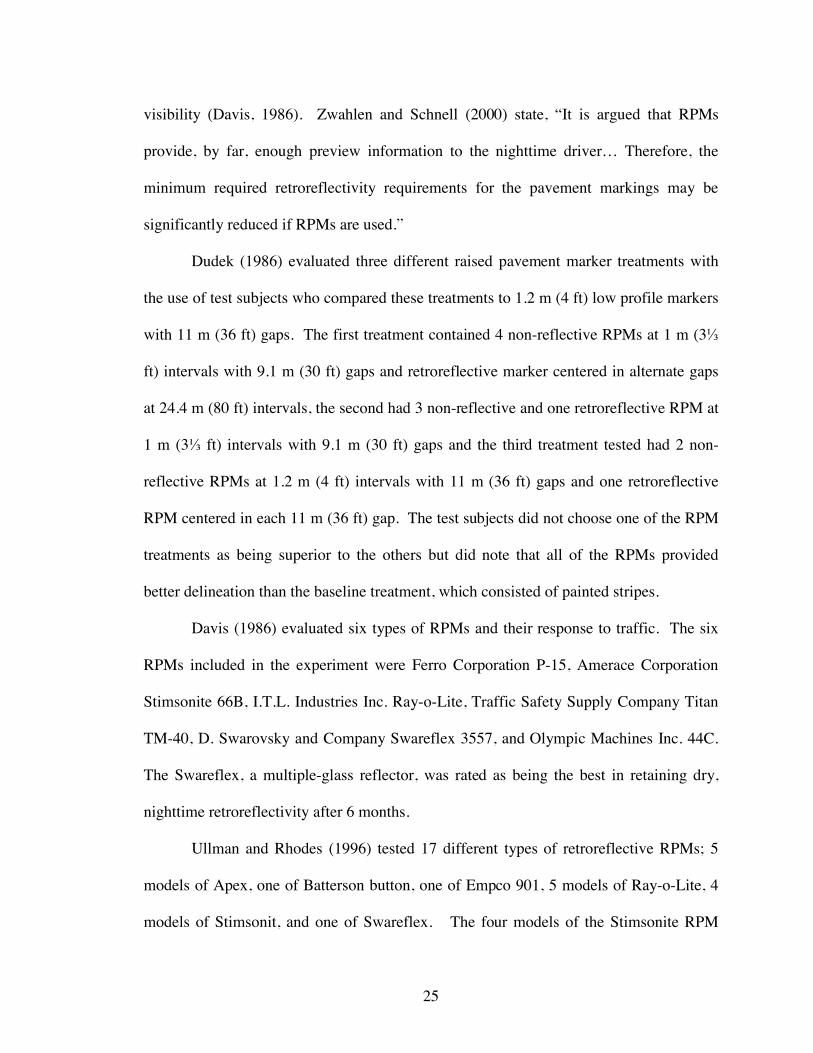
visibility (Davis, 1986). Zwahlen and Schnell (2000) state, “It is argued that RPMs
provide, by far, enough preview information to the nighttime driver… Therefore, the
minimum required retroreflectivity requirements for the pavement markings may be
significantly reduced if RPMs are used.”
Dudek (1986) evaluated three different raised pavement marker treatments with
the use of test subjects who compared these treatments to 1.2 m (4 ft) low profile markers
with 11 m (36 ft) gaps. The first treatment contained 4 non-reflective RPMs at 1 m (3
ft) intervals with 9.1 m (30 ft) gaps and retroreflective marker centered in alternate gaps
at 24.4 m (80 ft) intervals, the second had 3 non-reflective and one retroreflective RPM at
1 m (3 ft) intervals with 9.1 m (30 ft) gaps and the third treatment tested had 2 non-
reflective RPMs at 1.2 m (4 ft) intervals with 11 m (36 ft) gaps and one retroreflective
RPM centered in each 11 m (36 ft) gap. The test subjects did not choose one of the RPM
treatments as being superior to the others but did note that all of the RPMs provided
better delineation than the baseline treatment, which consisted of painted stripes.
Davis (1986) evaluated six types of RPMs and their response to traffic. The six
RPMs included in the experiment were Ferro Corporation P-15, Amerace Corporation
Stimsonite 66B, I.T.L. Industries Inc. Ray-o-Lite, Traffic Safety Supply Company Titan
TM-40, D. Swarovsky and Company Swareflex 3557, and Olympic Machines Inc. 44C.
The Swareflex, a multiple-glass reflector, was rated as being the best in retaining dry,
nighttime retroreflectivity after 6 months.
Ullman and Rhodes (1996) tested 17 different types of retroreflective RPMs; 5
models of Apex, one of Batterson button, one of Empco 901, 5 models of Ray-o-Lite, 4
models of Stimsonit, and one of Swareflex. The four models of the Stimsonite RPM
26
(Stimsonite 88, Stimsonite 911, Stimsonite 948, and Stimsonite 953) had the highest
retroreflective values followed by the 3 models of the Ray-o-Lite (Ray-o-Lite 2003, Ray-
o-Lite 9704, Ray-o-Lite 2002). The Swareflex retroreflective RPM produced the eighth
highest retroreflectivity value.
2.3 Prior Research on Reflectivity of Center Barriers
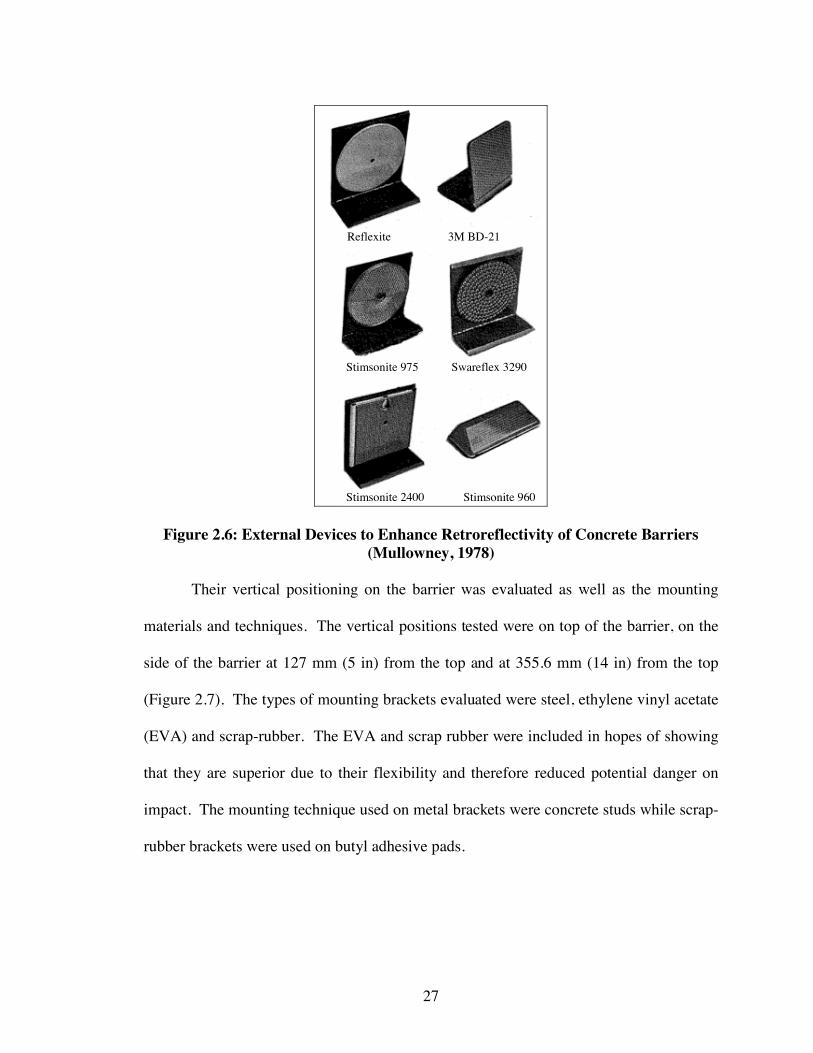
Mullowney (1978) evaluated different methods for enhancing barrier
retroreflectivity. The purpose of this study “was to develop and test a delineator system
that performs adequately on the median barrier after years of weathering. The
characteristics that would affect the adequacy of the system were the visibility of the total
system and the durability of its various parts” (Mullowney, 1978).
The types of retroreflective devices studied were vinyl microscopic cube corner,
acrylic encapsulated lens sheeting, acrylic cube corner, silvered convex glass lens, wide-
angle silvered acrylic cube corner, and low-profile acrylic cube corner (Figure 2.6).
27
Figure 2.6: External Devices to Enhance Retroreflectivity of Concrete Barriers (Mullowney, 1978)
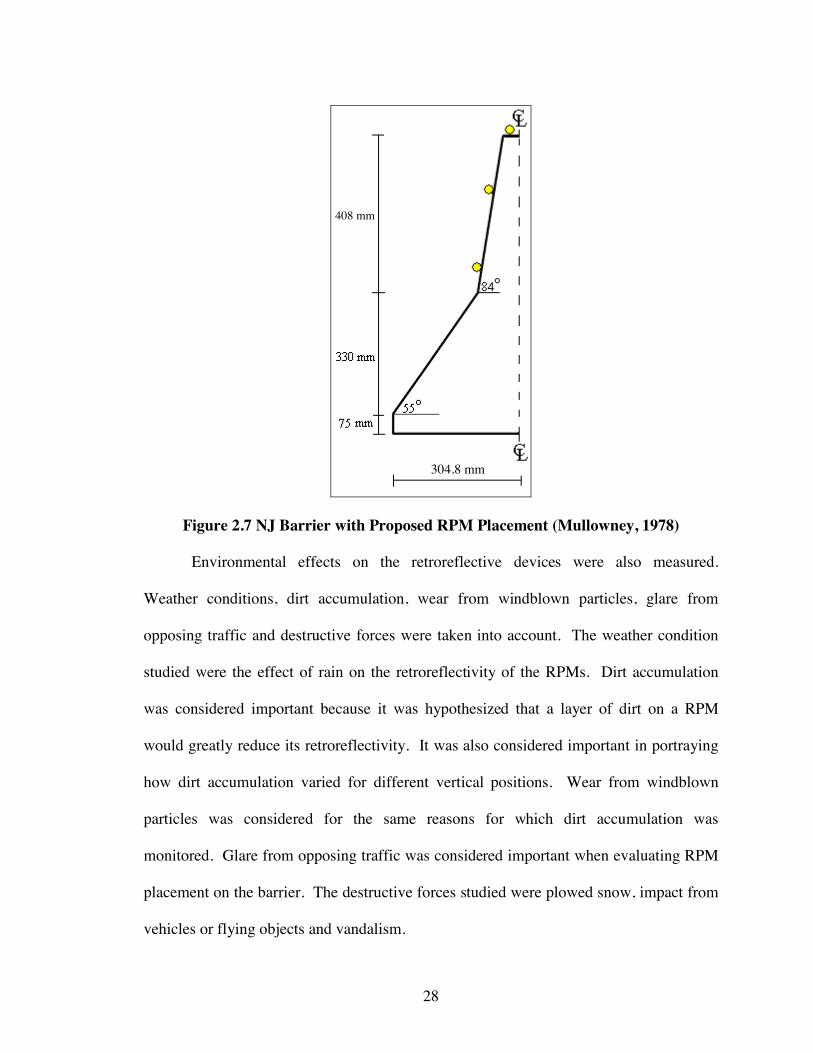
Their vertical positioning on the barrier was evaluated as well as the mounting
materials and techniques. The vertical positions tested were on top of the barrier, on the
side of the barrier at 127 mm (5 in) from the top and at 355.6 mm (14 in) from the top
(Figure 2.7). The types of mounting brackets evaluated were steel, ethylene vinyl acetate
(EVA) and scrap-rubber. The EVA and scrap rubber were included in hopes of showing
that they are superior due to their flexibility and therefore reduced potential danger on
impact. The mounting technique used on metal brackets were concrete studs while scrap-
rubber brackets were used on butyl adhesive pads.
Reflexite 3M BD-21
Stimsonite 975 Swareflex 3290
Stimsonite 2400 Stimsonite 960
28
Figure 2.7 NJ Barrier with Proposed RPM Placement (Mullowney, 1978)
Environmental effects on the retroreflective devices were also measured.
Weather conditions, dirt accumulation, wear from windblown particles, glare from
opposing traffic and destructive forces were taken into account. The weather condition
studied were the effect of rain on the retroreflectivity of the RPMs. Dirt accumulation
was considered important because it was hypothesized that a layer of dirt on a RPM
would greatly reduce its retroreflectivity. It was also considered important in portraying
how dirt accumulation varied for different vertical positions. Wear from windblown
particles was considered for the same reasons for which dirt accumulation was
monitored. Glare from opposing traffic was considered important when evaluating RPM
placement on the barrier. The destructive forces studied were plowed snow, impact from
vehicles or flying objects and vandalism.
304.8 mm
408 mm
29
The measures of performance that were included were dynamic visibility studies,
photometric measurements, observation of motion pictures, visual observations and
durability surveys for mounts and mounting techniques. In the dynamic visibility studies,
the six test retroreflectors were mounted at the three vertical positions on the center
barrier on US-1 in Trenton, New Jersey. A group of three to four raters were driven
through the area and were asked to fill out a questionnaire. This was performed when the
RPMs were new, after one winter of weathering and after two winters of weathering.
The photometric measurements were taken at three different times; when the
RPMs were new, two winters after they had been mounted with the dirt not cleaned off
and after two winters of weathering with the dirt cleaned off. Motion pictures and visual
observations were made of the installation process both during dry and wet nighttime
conditions. The purpose was to be able to allow the staff engineers “to review the
installation under both wet and dry conditions” (Mullowney, 1978). The last measure of
performance was the durability survey for mounts and mounting techniques. In this
analysis, solely through visual observation the different test locations were inspected for
damage.
When evaluating weather conditions it was found that the retroreflectivity was
improved during wet, nighttime conditions. The rain acted as a cleaning agent, thereby
increasing the retroreflectivity value of the RPMs. It should also be noted that during
wet, nighttime conditions the barriers and the road surface are less visible and this, in
turn, increases the visibility of the delineators.
It was also found that retroreflectivity of the convex glass lens RPM was
increased after exposure to the elements. In fact its retroreflectivity was enhanced to
30
such a high degree that after two winters of weathering, it was still the most preferred by
the raters. It was also noted that this RPM “had a considerably smaller percentage
reduction in specific intensity in all vertical positions when it was covered by dirt and
when it was cleaned” (Mullowney, 1978). Although the convex glass RPM was rated as
having the highest retroreflectivity during dry conditions, the acrylic cube corner device
received the highest ratings during wet conditions.
The top and top-side positions on the barrier were the positions that were
considered adequate for all the RPMs except the vinyl cube corner after two winters of
weathering. For the bottom-side of the barrier, again only the convex glass and acrylic
cube corner RPMs were rated as satisfactory.
RPMs rated in their unweathered state showed that the bottom side position on the
barrier was the most preferable. Following exposure to weathering, the top and top-side
positions were rated as most retroreflective. Upon further exposure to environmental
effects, the top position on the barrier was rated as being the most retroreflective of the
three. This is due mainly to the fact that the top position is less likely to be affected by
flying debris or dirt accumulation. The drawback to the top position is found when
testing the different positions against glare from opposing traffic. The top position was
the least favorable one because the headlights of the oncoming traffic washed it out.
When evaluating the different mounting techniques, butyl adhesive pad attached
to a low profile marker was found to be the most durable. As for the different mounts,
the flexible mounts attached with concrete studs fared better than the flexible mounts
attached with a butyl adhesive. The highest rate of loss was with the metal mounts
31
attached with concrete studs. It was thought that the metal mounts suffered such a high
rate of loss because they are not flexible and therefore break off easily upon impact.
Due to the fact that these metal brackets break off easily, they pose a threat to
motorists if they are kicked up into the air. Mullowney (1978) also points out that “the
flexible mounts that use concrete studs appear to be more durable than those that use a
butyl adhesive pad, but rotation of the bracket around the stud could be a problem. This
may result from loosening of the stud or nut when a flexible bracket bends under impact
and puts a stress on the attachments mechanism”. As for vandalism, it was reported that
only the butyl adhesive pads were stolen along a small section of the test site.
Ullman and Dudek (1988) dealt with similar issues. The three objectives of their
study were to “determine how different delineator types, spacing, and mounting positions
on the barrier affect nighttime traffic operating on the travel lane next to the barrier;
determine driver preference and perception of different delineator types, spacing, and
mounting positions; and determine how the visibility and brightness of different types of
delineators deteriorate over time because of dirt and road film” (Ullman and Dudek,
1988).
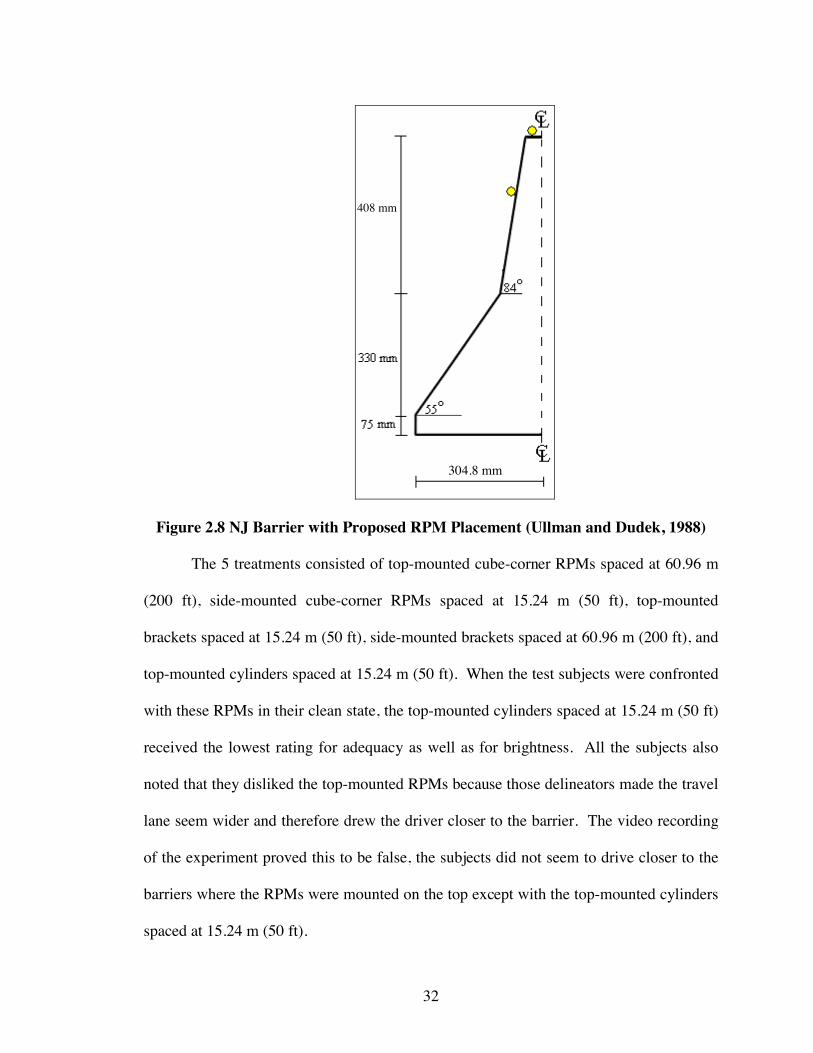
The three types of RPM delineators evaluated were a round acrylic cube-corner
reflector, a small plastic bracket covered with high-intensity sheeting, and a cylindrical
tube wrapped with high-intensity retroreflective sheeting. The mounting positions
studied were top and the side placements, 152 mm (6 in) from the top. The two spacings
considered were 15.24 m (50 ft) and 60.96 m (200 ft) (Figure 2.8).
32
Figure 2.8 NJ Barrier with Proposed RPM Placement (Ullman and Dudek, 1988)
The 5 treatments consisted of top-mounted cube-corner RPMs spaced at 60.96 m
(200 ft), side-mounted cube-corner RPMs spaced at 15.24 m (50 ft), top-mounted
brackets spaced at 15.24 m (50 ft), side-mounted brackets spaced at 60.96 m (200 ft), and
top-mounted cylinders spaced at 15.24 m (50 ft). When the test subjects were confronted
with these RPMs in their clean state, the top-mounted cylinders spaced at 15.24 m (50 ft)
received the lowest rating for adequacy as well as for brightness. All the subjects also
noted that they disliked the top-mounted RPMs because those delineators made the travel
lane seem wider and therefore drew the driver closer to the barrier. The video recording
of the experiment proved this to be false, the subjects did not seem to drive closer to the
barriers where the RPMs were mounted on the top except with the top-mounted cylinders
spaced at 15.24 m (50 ft).
304.8 mm
408 mm
33
The three standards by which the RPM effectiveness was evaluated were lane
distribution, lane straddling, and lateral distance. Lane distribution was measured from
two lanes closest to the barrier as it was assumed that these two lanes would be most
affected. Lane straddling measured the number of vehicles crossing the lane dividers in
the two lanes closest to the barrier. The lateral distance was measured as the distance
between the left rear tire and the bottom of the concrete safety shaped barrier.
When evaluating lane distribution it was found that different treatments had little
to no effect. The results of lane straddling data suggested that by spacing the RPMs at
short distances and mounting them on the side of the barrier makes the drivers more
aware of the barrier. In evaluation of the lateral distance, it was found that the distance
between the rear wheel and the barrier was larger for the top-mounted cube-corner lenses
spaced at 60.96 m (200 ft) than that of the side-mounted cube-corner lenses spaced at
15.24 m (50 ft) and the top-mounted cylinders spaced at 15.24 m (50 ft).
The test group was also confronted with the delineators in their dirty state, after
the RPMs had been in place for a few months. In this survey the subjects chose the side-
mounted cube-corner lenses spaced at 15.24 m (50 ft) to be the brightest and the top-
mounted cylinders spaced at 15.24 m (50 ft) as the least bright. When evaluating the
effectiveness of the RPMs in their dirty stage the side-mounted cube-corner lenses spaced
at 15.24 m (50 ft) were ranked as most effective while the top-mounted cylinders spaced
at 15.24 m (50 ft) were deemed as least effective.
Ullman and Dudek (1988) conclude their study by recommending the cube-corner
lenses for delineation. They also suggest that although all of the subjects preferred the
15.24 m (50 ft) spacing to the 60.96 m (200 ft) spacing, the 60.96 m (200 ft) spacing
34
should be considered the maximum allowable distance between RPMs. At sharp curves
in the road closer spacing may be necessary.
2.4 Recommendations for Enhancing Reflectivity
This section provides a compilation of all the aforementioned methods of
enhancing concrete barrier retroreflectivity. Certain methods that were not found through
literature review but may serve to be useful are also mentioned. The optimum method of
application, position on the barrier, gap distance and color preferences are stated where
applicable.
2.4.1 Pavement Marking Tape or Paint
The color offering highest retroreflective capabilities is white. The most effective
striping method is 2.4 m (8 ft) stripes with 9.8 m (32 ft) gaps. The least effective striping
method is 0.6 m (2 ft) stripes with 11.6 m (38 ft) gaps. This retroreflectivity
enhancement method would be applied after fabrication of the barrier.
2.4.2 Glass Beads within Pavement Markings
The most preferable glass bead size is 0.841 to 1.68 mm (0.033 to 0.066 in). The
most favorable glass bead application is 488 g/m2 (10lb/100ft2) with the optimum level of
embedment of 60 percent. The minimum acceptable value of retroreflection during wet
weather conditions is 60 mcd/m2/lx and during dry conditions it is 150 mcd/m2/lx.
Traditional glass bead markings may be applied either during or after production
of the concrete barrier. The formwork of the concrete barrier may be dusted with these
minute glass spheres causing them to attach to the surface of the concrete.
35
2.4.3 Traffic Sign Sheeting
Of the seven types of available sheetings, Type I would be most advantageous due
to cost. The white color sheeting offers the highest retroreflective properties. This
method could be applied either during production of the concrete barrier. The sheeting
may be applied to a plastic clip that may be placed in the form. When the concrete
mixture is poured into the form, the clip will set into the concrete. It is also possible to
attach the sheeting to the barrier postproduction.
2.4.4 Raised Pavement Markers
The middle and top positions were found to be better RPM delineator placement
locations over the bottom-side position due to dirt buildup. Between middle and top
positions, the middle was chosen as the better placement because it was not washed out in
the glare of the oncoming traffic. RPMs spaced at 60.96 m (200 ft) were most effective,
though a closer spacing may be employed at sharp curves. The RPMs may be applied
before or post fabrication of the concrete barrier in the same manner as described with
traffic sign sheeting.
2.4.5 Changing Geometry
It was mentioned previously that the shape of the barrier must not be altered so as
to not require further crash testing to ensure that the safety function of the barrier is
unaltered. The critical geometric property of the barrier is the distance from the ground
to the slope break point. This distance ensures that vehicle overturn does not occur
(Davis, 1986). Leaving this overall geometric property unaltered is important. However,
changing the surface texture geometry at the top of the barrier would not affect the
36
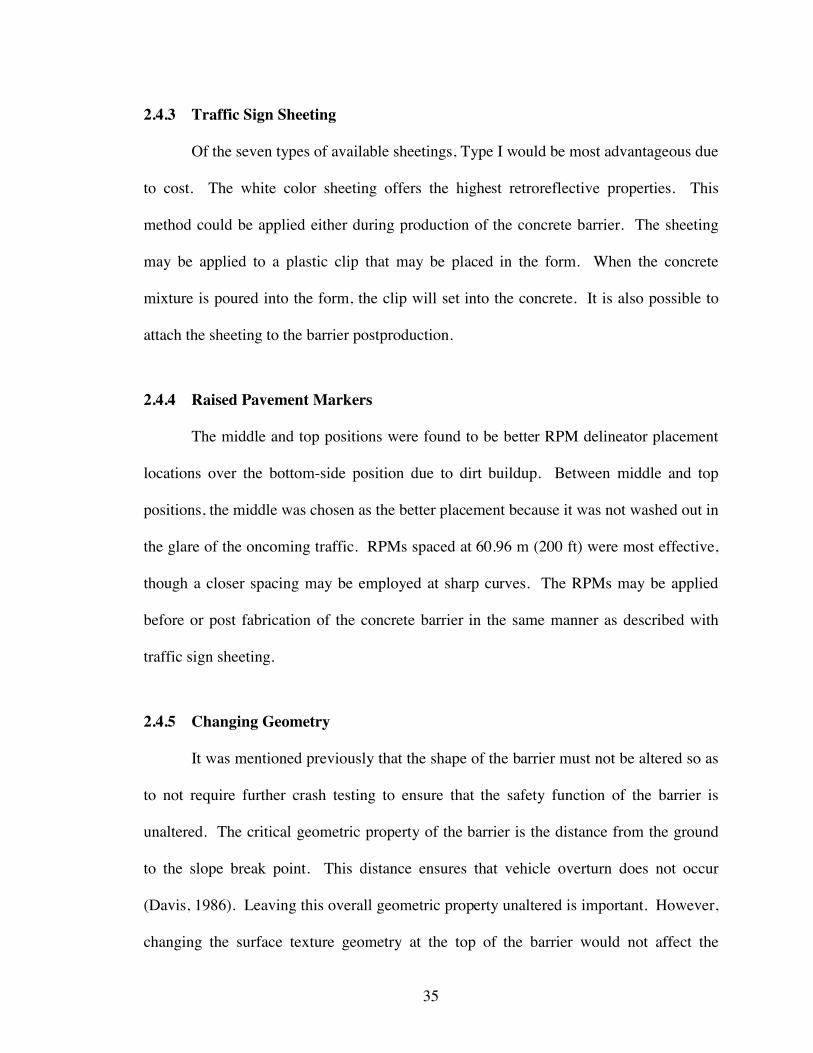
overall performance. Therefore, providing surface areas facing incident vehicular lights
might serve to enhance barrier reflectivity (Figure 2.9).
Figure 2.9: Median Barrier with Altered Geometry
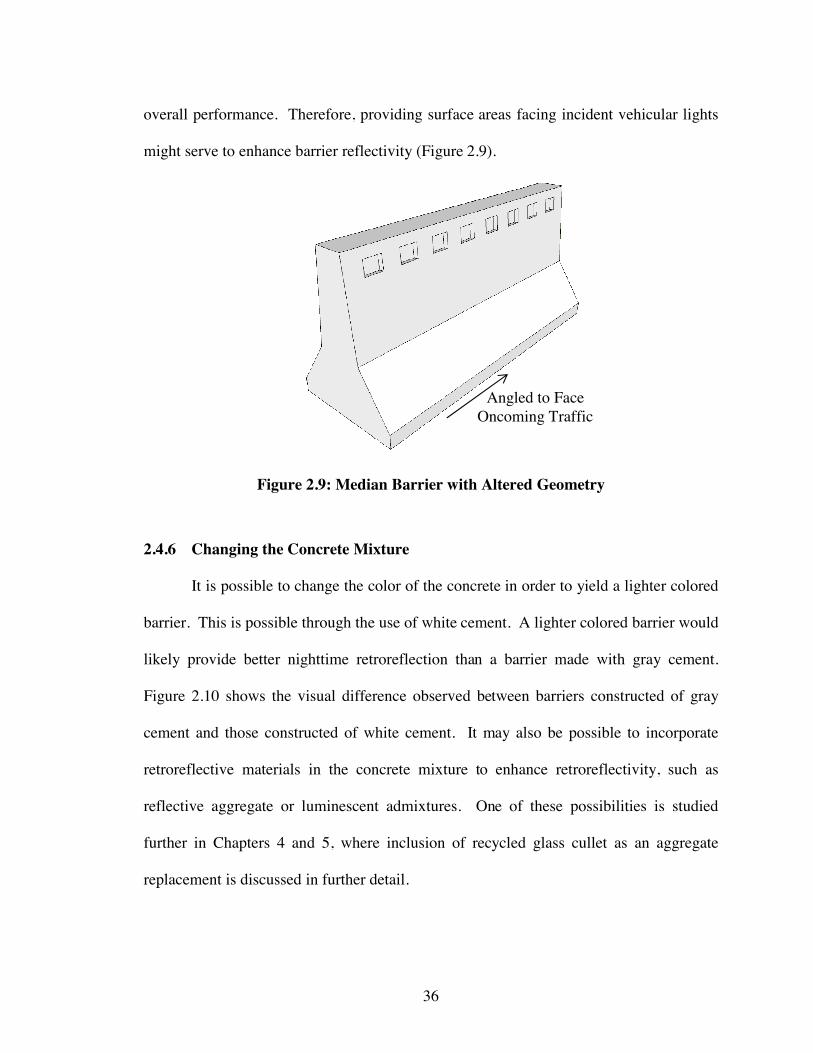
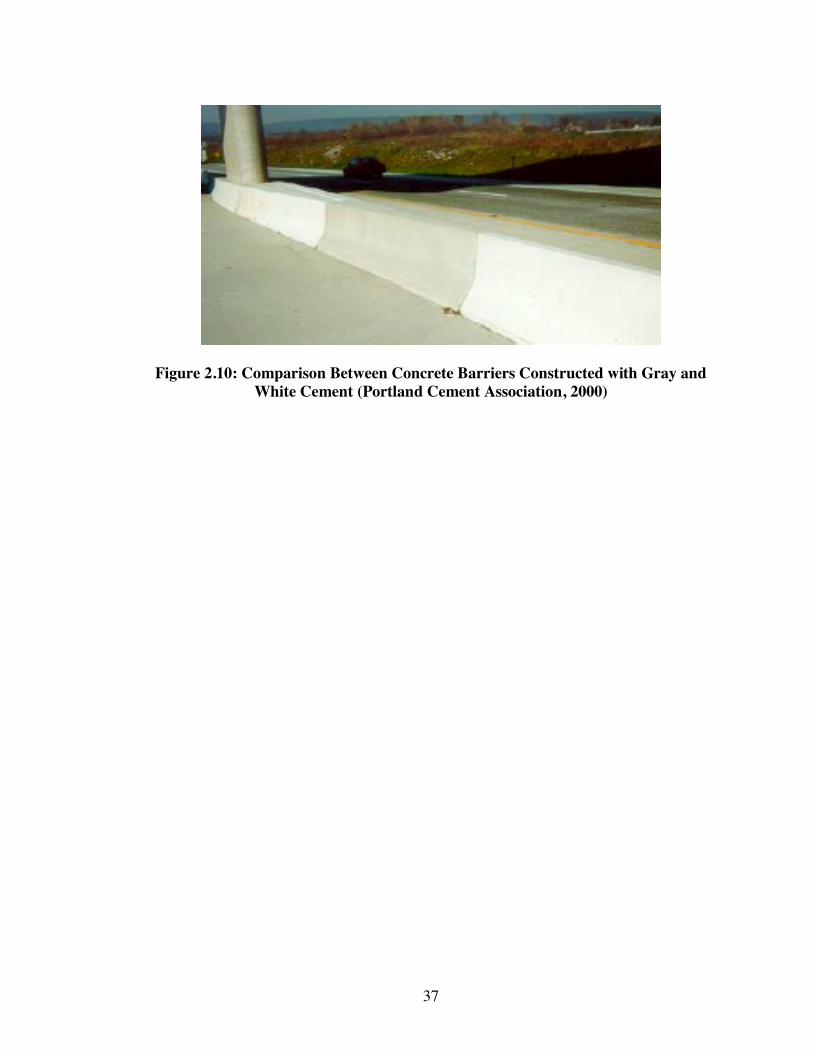
2.4.6 Changing the Concrete Mixture
It is possible to change the color of the concrete in order to yield a lighter colored
barrier. This is possible through the use of white cement. A lighter colored barrier would
likely provide better nighttime retroreflection than a barrier made with gray cement.
Figure 2.10 shows the visual difference observed between barriers constructed of gray
cement and those constructed of white cement. It may also be possible to incorporate
retroreflective materials in the concrete mixture to enhance retroreflectivity, such as
reflective aggregate or luminescent admixtures. One of these possibilities is studied
further in Chapters 4 and 5, where inclusion of recycled glass cullet as an aggregate
replacement is discussed in further detail.
Angled to Face Oncoming Traffic
37
Figure 2.10: Comparison Between Concrete Barriers Constructed with Gray and White Cement (Portland Cement Association, 2000)
38
CHAPTER 3
GLASS AGGREGATE LITERATURE REVIEW
Of the possible methods for enhancing highway concrete barrier retroreflectivity,
the application of glass beads onto the surface of concrete barriers was an option that
would require further study to determine feasibility. Due to the current need for a venue
for glass recycling, it was proposed to use recycled glass (RG) versus specially
manufactured glass beads. There is a possibility of the glass spalling off of the barrier
and becoming a road hazard. This was not evaluated but is important to be noted in
future work.
To further extend this method, RG was incorporated into the concrete mixture by
serving as an aggregate replacement. As will be noted in Chapters 4 and 5, this
application was evaluated for detrimental effects to concrete properties and performance
as well as advantages in retroreflective properties. These were critical aspects of the
option that were not addressed sufficiently in previous research.
The U.S. Environmental Protection Agency reported 222.9 million tons (245.7
million short tons) of municipal solid waste generated in the United States in 2005, out of
which 4.9 percent were glass containers. In that year, approximately 2.54 million tons
(2.8 million short tons) of glass containers were recovered for recycling (about 25.3
percent of total glass containers generated).
Glass conforms to a closed-loop recycling process meaning that it may be
recycled many times with 100 percent of generated glass being recycled into new glass
(Maben, 2003; Meyer et al., 2001). By producing glass from recycled materials,
39
reductions in the manufacturing process air pollution of 20 percent and water pollution of
50 percent can be realized (Ohio Department of Natural Resources, 1997).
In order to properly recycle glass for new production it must be color sorted in
order to ensure consistency of color in the new product. The quantity of mixed waste
glass is much greater than that of color sorted glass (Shi and Zheng, 2005). The size and
contamination of the RG causes color sorting to be a costly practice. Mixed and broken
container glass is virtually impossible to separate and this leads to limited options for its
recycling. For this reason many material recovery facilities are forced to send RG to
landfills (Meyer et al., 2001).
There is a strong need for the development of an avenue through which mixed
color waste glass may be recycled. The construction industry presents one viable option.
Use of RG in the concrete barrier mixture designs could provide such a venue. The
important aspects of concrete containing glass are the strength, workability and durability
of that concrete. As stated earlier (Section 1.1), the overall barrier geometry must not be
significantly altered to avoid the need for costly safety certification through crash testing.
The durability and strength of the concrete barrier must not be diminished, not only to
ensure that the function of the barrier is unaltered but to also provide basis for possible
use in general concrete construction.
To study this method further, a comprehensive literature review was performed on
the topic of the use of RG in concrete construction. Through the evaluation of prior work
a research plan was established and carried out to address some additional issues, as is
presented in Chapter 4.
40
Container glass comprises 65 to 70 percent of the total commingled container
stream that includes plastics and metals (Meyer et al., 2001). Eighty percent of waste
glass is made up of soda-lime glasses (Shi and Zheng, 2005). Windowpanes and glass
containers used for food and drink storage are made of soda-lime glass. This type of
glass is made from melting together soda, lime, silica, alumina and small amounts of
fining agent such as sodium sulfate or sodium chloride. The second most common type
of waste glass is high in lead content; examples include neon tubing and electronic parts.
These types of glasses are avoided in the recycling process due to fear of lead leaching
from the glass (Shi and Zheng, 2005).
The incorporation of non-toxic RG into concrete mixtures is a possible venue for
glass recycling. Aside from raising public awareness and extending the life of landfills,
there are other advantages found in using RG as aggregate replacement in concrete
mixtures. The near zero water absorption capability of glass makes it one of the most
durable materials and will therefore increase the durability of high-performance concrete.
Since the incorporation of glass into concrete mixture designs only requires slight
modifications, no major investment will be necessary. Also, the wide use of concrete in
the construction industry will continue to provide a venue for glass recycling (Meyer et
al., 2001; Shi and Zheng, 2005; Xie and Xi, 2002).
3.1 Potential Adverse Reactions
The proposition to include RG into concrete mixtures is not a new concept. It has
been the topic of several research projects outside of the United States, but is generally
avoided within the United States. Hesitation in its use has often been due to the fact that
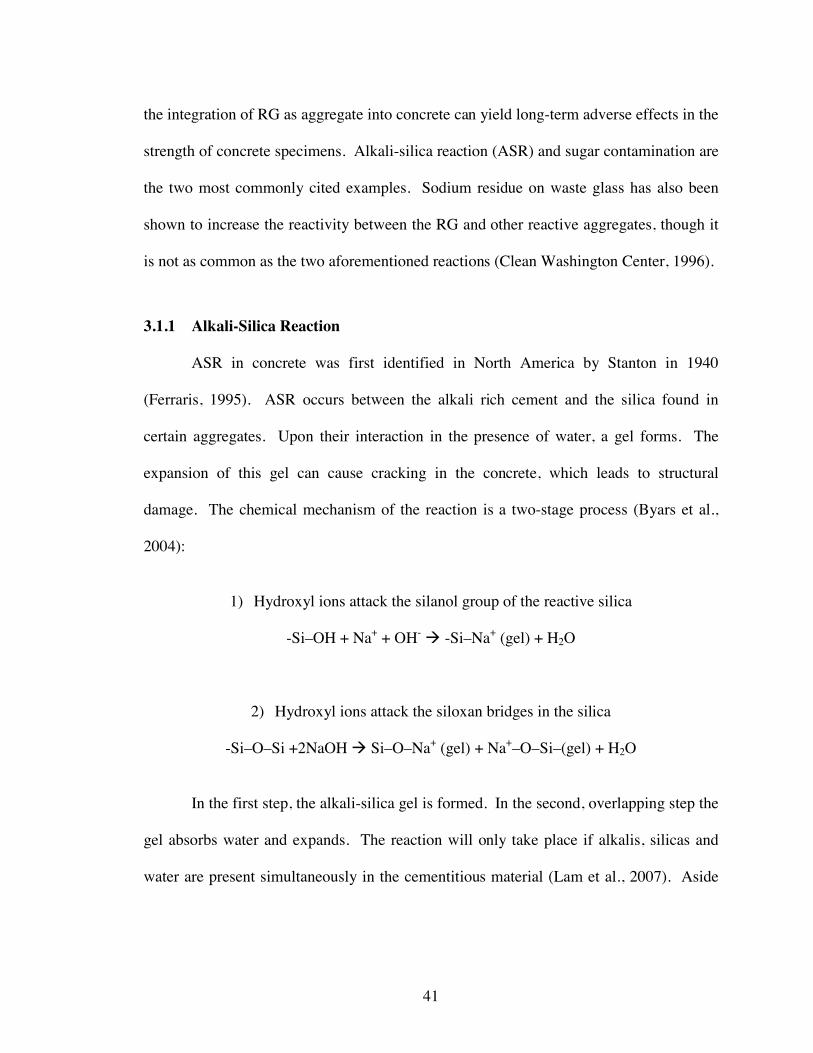
41
the integration of RG as aggregate into concrete can yield long-term adverse effects in the
strength of concrete specimens. Alkali-silica reaction (ASR) and sugar contamination are
the two most commonly cited examples. Sodium residue on waste glass has also been
shown to increase the reactivity between the RG and other reactive aggregates, though it
is not as common as the two aforementioned reactions (Clean Washington Center, 1996).
3.1.1 Alkali-Silica Reaction
ASR in concrete was first identified in North America by Stanton in 1940
(Ferraris, 1995). ASR occurs between the alkali rich cement and the silica found in
certain aggregates. Upon their interaction in the presence of water, a gel forms. The
expansion of this gel can cause cracking in the concrete, which leads to structural
damage. The chemical mechanism of the reaction is a two-stage process (Byars et al.,
2004):
1) Hydroxyl ions attack the silanol group of the reactive silica
-Si–OH + Na+ + OH- -Si–Na+ (gel) + H2O
2) Hydroxyl ions attack the siloxan bridges in the silica
-Si–O–Si +2NaOH Si–O–Na+ (gel) + Na+–O–Si–(gel) + H2O
In the first step, the alkali-silica gel is formed. In the second, overlapping step the
gel absorbs water and expands. The reaction will only take place if alkalis, silicas and
water are present simultaneously in the cementitious material (Lam et al., 2007). Aside
42
from needing a high moisture content, the reaction also requires many months and
temperatures in excess of 40C (104F) before being visually observed (Terro, 2006).
Glass contains high levels of silica compounds (SiO2) (Lam et al., 2007). Soda
lime bottles are made of approximately 73 percent SiO2 (Shi and Zheng, 2005). The
addition of extra silica content into concrete mixtures can worsen the deleterious effects
of ASR.
Certain measures may be employed to mitigate ASR. Pozzolanic materials may
be added to the aggregate. A typical pozzolanic material must have high silica content
and a large surface area (Metwally, 2007). These two properties will cause the gel to
form and expand before the concrete sets, thereby avoiding cracking in the hardened
concrete. Examples of pozzolanic materials include pulverized fuel ash (PFA), silica
fume, metakaolin (MK), ground clay brick, cement size glass cullet (Clean Washington
Center, 1996; Zhu and Byars, 2004). The effectiveness of using PFA to mitigate ASR
depends on the replacement level, CaO content, aggregate reactivity, concrete alkali
level, and fineness of the PFA (Zhu and Byars, 2004).
A set-retarder and an air entrainment system may also be effective. A set-retarder
will allow for ASR to take place prior to concrete hardening, which will result in less
internal stress in the hardened concrete. An air entrainment system introduces a well
distributed system of tiny air pockets into the hardened concrete in addition to the 3 to 4
percent of naturally entrapped air during concrete mixing. These air pockets provide
extra space for ASR gel expansion, which in turn results in less structural damage.
However, employing an excessive amount of air entrainment may weaken the concrete
due to the large number of air voids (Clean Washington Center, 1996).
43
Reducing the internal and external moisture content of the concrete and increasing
the surface area to volume ratio of the glass aggregate (standard mesh size #50) are also
possible ways of mitigating ASR (Clean Washington Center, 1996; Meyer et al., 2001).
Reducing the moisture content will reduce the gel volume, thereby decreasing the
damage caused by its expansion. Through the use of finer glass particles the ASR is
expedited which causes the gel to expand fully prior to concrete hardening (Clean
Washington Center, 1996). Bazant et al. (2000) note that as the glass particle size is
reduced, the ASR rate actually worsened until the glass size reached 1.5 mm (0.06 in).
Particles smaller than this size resulted in decreased expansion and increased strength.
The most common tests used in evaluating ASR are ASTM C227, ASTM C1260, ASTM
C1293 and BS 812-123.
The “Standard Test Method for Potential Alkali Reactivity of Cement-Aggregate
Combinations” (ASTM C227), consists of a mortar bar test with an aggregate to cement
ratio of 2.25. The mortar bar specimens are stored in high humidity containers at 38C
(100.4F). Excessive leaching of alkalis from the specimens was a reported problem
(Byars et al., 2004). According to this standard expansions greater than 0.1 percent after
26 weeks are unacceptable (Zhu and Byars, 2005).
ASTM C1260 is a “Standard Test Method for Potential Alkali Reactivity of
Aggregates”. This is a standard test method for mortar bars as well. The bars are soaked
in a 1N NaOH solution for 14 days. Byars et al. (2004) report that although this
accelerated test is suitable as a screening test for a given aggregate it should not be used
by itself due to severity of the test. This test has been shown to better evaluate
44
suppressants. According to this standard expansions greater than 0.1 percent after 14
days are unacceptable (Lam et al., 2007).
ASTM C1293 is a “Standard Test Method for Concrete Aggregates by
Determination of Length Change of Concrete Due to Alkali-Silica Reaction”. This is a
standard test for concrete prisms and is generally regarded as the best indicator of field
performance (Byars et al., 2004). It may be used for both fine and coarse aggregate
testing as well as in evaluating the effectiveness of different suppressants. Byars et al.
(2004) note that although this is a widely accepted method, the long duration of this test
(2 years) is a drawback. According to this standard expansions greater than 0.04 percent
after 2 years are unacceptable.
BS 812-123, “Testing Aggregate – Method for Determination of Alkali-Silica
Reactivity – Concrete Prism Test”, is a British Standard test closely resembling ASTM
C1293. This test is fitting for the analysis of coarse and fine aggregates.
Other possible testing standards are ASTM C289, ASTM C295, ASTM C856,
ASTM C441, though these were not implemented in any of the prior research
investigated and are not generally as commonly used. Byars et al. (2004) claim ASTM
C1260, ASTM C1293 and BS 812-123 as being the preferable ASR testing methods.
Although ASTM C1260 is found to be a better test for the study of suppressants, it is not
a suitable study of the reactivity of aggregates.
3.1.2 Sugar Contamination
Sugar contamination arises from sugar residue on the waste glass from previous
food content. The inclusion of sugar into the concrete mixture could cause an increase in
45
setting time and a decrease in the ultimate strength. A high temperature wash of RG to
ensure sugar removal should be performed as sugar residue may not be detected by pure
visual inspection. The glass should then be dried in order to prevent the inclusion of any
uncalculated moisture into the mixture (Clean Washington Center, 1996). During such a
washing process it is likely that fine glass particles would also be washed away.
3.2 Prior Research
A number of researchers have undertaken the task of evaluating the effect of the
inclusion of RG into concrete mixtures as either fine or coarse aggregate replacement.
Factors such as the mechanical properties of such concrete specimens and the effect of
ASR are assessed within these studies. Varying RG content, size, color, and pozzolanic
material content are examples of variables investigated. An overview of these studies is
provided in this section while the results are provided in the sections that follow.
3.2.1 Overview of Prior Research on RG Use in Concrete
This section provides an overview of prior research conducted on this topic. Only
the research plan is presented. The results are presented in the sections that follow.
Byars et al. (2004) performed an ASR study. Glass color, glass size, and different
ASR suppressants were some of the variables investigated. The glass colors included
were green, amber, flint, and blue. The glass grading varied from 35 m (0.00138 in) to
12 mm (0.472 in). The mitigators included were PFA, MK, ground granulated blast
furnace slag (GGBS), micro-silica, and green/amber/flint glass pozzolan. BS 812-123
standards were used to investigate the effect of glass color on ASR. In evaluating glass
46
particle size BS 812-123 mixing proportions were used with 30 percent of the normal
aggregate replaced with glass.
Moulinier et al. (2006) reported the long-term results (2 years) of the study
initiated by Byars et al. (2004). This report provides the final data for this project. The
concrete specimens were placed in an exposure site under accelerated conditions. The
ASR suppressing effects of various materials within low alkali and high alkali cement
were investigated. The compressive strength of specimens was also studied. The
materials studied were PFA, MK, GGBS, and powdered glass.
Testing consisted of a total of eleven concrete mixtures. Four of the mixtures did
not contain any cement replacement but differed in their alkali levels; a low alkali
mixture (2.68 kg/m3 [0.167 lb/ft3] Na2O equivalent), a below threshold (4.84 kg/m3
[0.302 lb/ft3] Na2O equivalent), on the threshold mixture (5.5 kg/m3 [0.343 lb/ft3] Na2O
equivalent) and a high alkali mixture (7.0 kg/m3 [0.437 lb/ft3] Na2O equivalent). Two of
the mixtures had 30 percent of the cement replaced with PFA and were a low alkali and a
high alkali mixture, respectively. Two other mixtures contained 15 percent of the cement
replaced with MK and were also a low alkali and a high alkali mixture, respectively.
Below threshold alkali level and high alkali level cement mixtures had 30 percent of the
cement replaced with powdered glass. Into one high alkali level cement mixture, GGBS
was incorporated as a 50 percent cement replacement.
Zhu and Byars (2005) evaluated the effect of different glass colors on ASR by
varying their size and in combination with different ASR suppressing admixtures. The
ASR was tested in accordance with ASTM C1260, up to an age of 189 days. The effect
of using cement of varying alkali levels was also investigated. The colors tested were
47
green, amber, flint and blue RG in accordance with ASTM C227 grading requirements.
Glass sizes ranged between 150 m to 4.75 mm (0.0059 to 0.187 in). Two types of PFA,
BS 3892 and BS EN 450, were examined as well as three types of cement: Portland
cement, high alkali Portland cement and white cement. Cement content ranged from 110
to 480 kg/m3 (6.87 to 29.97 lb/ft3), glass aggregate content was increased up 1720 kg/m3
(107.38 lb/ft3) and glass pozzolan content up to 240 kg/m3 (14.98 lb/ft3) was used within
the experimental mixture designs. Water to cement ratio ranged from 0.30 to 0.60.
Lam et al. (2007) aimed to develop a concrete mixture that consisted of more than
50 percent recycled crushed glass. The grading of the RG met the requirements for fine
aggregate in accordance with BS 882. The sieve sizes according to BS 882 is 5.00 mm,
3.35 mm, 2.00 mm, 1.18 mm, 0.85 mm, 0.60 mm, 0.425 mm, 0.30 mm, 0.15 mm and
0.075 mm (Abdullahi, 2005).
In part 1, seven series of mortar bars prepared with varying levels of RG, PFA,
and MK were explored. The intent was to determine the amount of mineral admixture
necessary to suppress ASR when high percentage of RG is utilized (>50 percent). ASR
was evaluated based on the requirements set forth by ASTM C1260. In the second part
the mechanical properties of the mixture deemed optimum in part 1, were explored.
The control mortar bars consisted of 100 percent river sand aggregate. The RG
used had a fineness modulus of 4.25 and satisfied the grading requirements for fine
aggregate in accordance with BS 882. The glass was comprised of three different colors;
30 percent colorless, 40 percent green, and 30 percent brown.
Terro (2006) studied the effect of fine-size RG, coarse-size RG, and a
combination of the two sizes as aggregate replacement at ambient and high temperatures.
48
Glass that passed sieve size #4 (4.75 mm, 0.187 in) and was retained by sieve #200
(0.075 mm, 0.0029 in) was considered to be fine-size RG and glass sizes between 19.05
mm (¾ in) and 9.525 mm (0.375 in) were considered to be coarse. The reference
concrete block was designed to have a compressive strength of 40 MPa (5.8 ksi).
Experimental concrete blocks with the dimensions of 100 x 100 x 100 mm3 (3.94 x 3.94 x
3.94 in3) with a water to cement ratio of 0.48 were tested at 20, 60, 150, 300, 500, and
700C (68, 140, 302, 572, 932, 1,292F). The replacement percentages for fine-size RG,
coarse-size RG, and fine and coarse-size RG were 10, 25, 50, and 100 percent. The
effects on the slump as well as on the initial and final setting times were evaluated.
Compressive strength was also studied to learn how varying temperature and inclusion of
RG may have an affect.
Tang et al. (2005) examined the engineering and durability properties of concrete
containing RG as either fine aggregate, filler, or as a cement compound. Effects on fresh
concrete properties such as the slump were investigated. Strength development and
durability of hardened concrete containing RG were studied. Durability variables
included freeze-thaw, sulfate and abrasion resistance. The effect on the relationship
between compressive strength, flexural strength, and modulus of elasticity was explored.
The grading of fine and filler aggregate adhered to BS EN 12620. Fine glass aggregate
was below the size of 8 mm (0.315 in) and filler glass aggregate was sized 2 mm (0.079
in) and smaller. Glass intended for the replacement of cement material was less than 63
m (0.00248 in). When either the sand or the filler material was being replaced with RG
the water to cement ratio was 0.61, and when the cement content was being substituted
the water to cementitious material ratio was 0.55. In testing the affect of the fine glass on
49
concrete properties, 50 percent by mass of the fine aggregate was replaced. Glass was
also tested as filler at a single fine aggregate replacement level of 5 percent by mass. In
testing the effect of RG used as cement compound, 15 percent by mass of total cement
was replaced.
Metwally (2007) inspected the pozzolanic reactivity of finely milled RG as well
as its potential use in concrete. The glass used in this experiment was from the
fluorescent lamps industry and was ground to a size smaller than 45 m (0.0018 in) in
order to satisfy the chemical and physical properties of pozzolanic material in accordance
with ASTM C681-2001. The cement used was Type I ordinary Portland cement. Five
mixture designs were prepared with varying level of finely milled RG. The control
mixture contained zero percent RG and the rest of the mixtures had 5, 10, 15, or 20
percent of the cement replaced with RG. The compressive and splitting tensile strength
was investigated. ASTM C1260-2001 was used to study ASR.
Dyer and Dhir (2001) also investigated the effect of using ground RG as a cement
replacement. The effects on the compressive strength of the mortar bars as well as the
resulting ASR were evaluated. White, green, and amber were the three glass colors used
with 61.5, 21, and 44 percent retained by a 45 m (0.0018 in) sieve, respectively. Mortar
bars intended for compression tests were mixed in accordance with BS EN 196 part 1.
ASR testing was carried out following ASTM C1260-1994.
3.3 Results of Prior Research
This section discusses the different factors that may affect concrete containing
glass as aggregate and/or cement replacement. The factors evaluated are percent of
50
aggregate replaced, glass size, admixtures, and glass color. Their affect on fresh and
hardened concrete properties such as slump and compression strength as well as the
results pertaining to ASR are presented where applicable.
3.3.1 Effects of Percent Glass Used and Glass Size on Concrete with RG
This section provides the results from the literature review regarding the use of
different size of RG as aggregate and/or cement replacement in concrete. The effect of
different quantities of glass used is also presented.
Byars et al. (2004) performed an ASR study. Only the results pertaining to glass
size are presented here, the other topics are covered in their respective sections. It was
found that the reactivity of glass particles increased with decreasing particle size. The
smaller particles of glass provided greater surface area upon which the reaction could
take place between the alkalis and silica. This continued to be the case until particle size
below 1 mm (0.0394 in) was evaluated and it was found that below this size, the
deleterious effects of ASR were reduced.
Zhu and Byars (2005) arrived at the same conclusion as Byars et al. (2004). It
was found that the ASR expansion rates increased with particle size above 1.00 mm
(0.0394 in), but decreased below this size. Concrete made with glass below this size
exhibited less expansion than the mixtures not containing any RG.
Lam et al. (2007) found that the mortar bars prepared with 100 percent RG
showed high levels of ASR expansion (approximately 0.5 percent at 14 days) and
developed cracks on their surfaces. Mortar bars prepared with 50 percent RG and 50
percent sand expanded less than 0.1 percent within 14 days but showed serious expansion
51
at 28 days (approximately 0.3 percent). The control mortar bars showed minimal
expansion throughout the length of the study. The researchers then went on to explore
the use of mineral admixtures presented in Section 3.3.2.
Terro (2006) found the slump of concrete mixtures containing RG was higher
than the control. The slump increased with increasing percentage of RG content
regardless of glass size, the slump of concrete made with fine-size RG exhibited lower
slump values than the concrete mixed with either the coarse-size RG or the mixture
containing a combination of fine and coarse glass. Concrete made with the combination
of the two glass sizes exhibited high slump values. For example, at the replacement
value of 50 percent the slump of the mixture containing fine and coarse RG equaled
approximately 185 mm (7.28 in), that of the mixture containing coarse-size glass was 120
mm (4.72 in) and that of mixture containing fine-size RG was 100 mm (3.94 in). The
increase in slump was due to the impermeable surfaces of the RG, which led to poor
cohesion between the glass and the cement paste.
The inclusion of RG increased the initial and final setting times of the concrete
blocks. When more than 50 percent of the aggregate was replaced, both the initial and
final setting times exceeded 25 hours. Terro (2006) notes that this behavior could be
attributed to the relative increase in the water to cement ratio due to the near zero water
absorption capacity of the RG. Sugar contamination may also have played a contributing
role. This trend is even more evident when the combination of fine and coarse RG was
employed.
The compressive strength of the control concrete block decreased as temperatures
exceeded 200C (392F). With 10 percent of the aggregate replaced with fine-size RG,
52
coarse-size RG, and a combination of the two sizes, the compressive strength was found
to be higher than that of the control at higher temperatures. At ambient temperatures the
control was found to have slightly higher compressive strength. It was noted that as
higher percentage of both the coarse and fine aggregate was replaced with the RG, the
compressive strength decreased due to the poor cohesion between fine and coarse
aggregates. Concrete mixtures containing a combination of the two sizes were found to
have the least strength, while specimens made with fine-size RG were found to provide
the highest strength. Terro (2006) concluded that concrete made with 10 percent of its
aggregate replaced with fine-size and/or coarse-size RG proved to have better properties
than the control specimens in the fresh and hardened states at both ambient and high
temperatures than higher replacement values.
Tang et al. (2005) found that waste glass, at all size levels, was found to increase
bleeding and segregation of the concrete due to the poorly shaped glass particles. The
unit weight of concrete containing RG was slightly reduced (by 2 percent) only when
large percentages of glass were incorporated into the mixture (i.e. 50 percent sand
replacement). This was due to the specific weight of glass being lower than that of
natural sand. Slump of fresh concrete was unchanged by the introduction of RG into the
concrete mixture.
In evaluating the compressive strength of concrete blocks containing RG, it was
found that they achieved comparable if not higher strength than the control mixture at 28
days. Concrete containing RG as a cement compound was found to have an increase in
its long-term (180-day) compressive strength due to the occurrence of pozzolanic
53
activity, which contributed to the strength development. This mixture experienced
almost 30 percent of relative gain in compressive strength at 180 days.
The effect on the usual relationship between compressive strength, flexural
strength, and modulus of elasticity was unaltered. The drying shrinkage of concrete
containing RG decreased for all specimens containing the tested RG sizes. When up to
50 percent of the fine and filler aggregate was replaced with RG, the shrinkage was
initially reduced up to 15 percent after 20 weeks of drying curing. Mixtures containing
RG as a cement compound exhibited a decrease in shrinkage after 10 weeks though they
initially exhibited higher shrinkage.
The freeze-thaw resistance decreased for concretes containing 50 percent by mass
of its fine glass aggregate replaced with RG, while it was found to increase in concretes
containing 5 percent by mass of the fine glass replaced with filler glass. This may be due
to the geometry difference between fine and filler glass particles. The ability of the filler
RG to improve the packing of the particles in the mixture caused the impermeability of
the concrete to improve, which led to better sulfate resistance. The pozzolanic reactivity
of RG acting as a cement compound also increased the sulfate resistance by reacting with
free alkalis in the cementitious compounds rendering them unavailable for sulfate
reaction.
In studying the impact on the abrasion resistance of the concrete, it was found that
RG acting as a sand replacement was found to decrease the abrasion resistance while the
concrete containing RG as filler aggregate was found to increase the resistance in
comparison to the reference mixture. The abrasion depth increased by 33.3 percent with
54
50 percent by volume of sand in concrete where as it was at least 3 times smaller than the
reference mixture when glass filler was used.
Metwally (2007) found slump to decrease with increasing levels of glass used.
This, in effect, caused a loss in workability of the concrete. The mixture containing 20
percent of finely milled glass had a slump loss of 45 percent as compared to the control.
The author states that the reduction in the slump is due to the presence of very fine
particles and the high specific area of the finely milled RG.
Concrete containing 10 percent of the cement replaced with glass showed
optimum levels of compressive strength. This optimum content of glass was sufficient to
react with all the liberated lime that was produced during the cement hydration process
thereby yielding a very dense and stable cementitious compound. Past this level, the
finely milled RG lowered the strength.
Optimal levels of 10 percent cement replacement by finely milled RG was also
found when evaluating splitting tensile and bond strength. The pozzolanic reaction
between glass and Ca(OH)2 during cement hydration yields a calcium silica hydrate gel.
This gel is adhesive and therefore increases the bond between cement and aggregate as
well as leading to improved steel-concrete bond strength.
In evaluating ASR it was found that with increasing levels of finely milled glass,
there was a decrease in mortar bar expansion compared to that of the control mixture.
The mixture containing 20 percent of its cement replaced with glass had a percent
expansion drop up to 71 percent at 14 days as compared with the control mixture. At 14
days the reference mixture expanded approximately 0.059 percent whereas the mixture
containing 20 percent of its cement replaced with glass expanded approximately 0.017
55
percent. All of the mixtures expanded less than the prescribed 0.1 percent at 14 days,
thereby properly mitigating deleterious effects of ASR per the standard used.
It was concluded that not only is the concrete containing finely milled waste glass
non-expansive, but it also had a reduction in the expansion as compared to the control
mixture. The reason for this was reported to be due to the direct reduction of available
alkalis because the liberated lime from the cement hydration process reacted completely
with the glass thereby decreasing the alkalinity of the system.
3.3.2 Effect of Admixtures on Concrete with RG
Byars et al. (2004) evaluated PFA, MK, GGBS, micro-silica, and
green/amber/flint glass pozzolan. The mixing proportions for this part of the study
involved 100 percent coarse glass aggregate sized 3-6 mm (0.118-0.236 in) and 6-12 mm
(0.236-0.472 in). It was concluded that 30 percent PFA, 40 percent GGBS or 20 percent
MK mitigated ASR for at least one year in accelerated conditions. It was also determined
that ready-mix concrete made with glass pozzolan and/or glass sand have an increased
strength development. Cement alkali content was found to be the most significant
influence on the ASR rate.
Moulinier et al. (2006) found that when 30 percent of the cement was replaced
with powdered glass, the 28-day compressive strength of the concrete was decreased.
The ASR expansion was delayed by about one month as compared to the control Portland
cement mixture of the same alkali level, after which the expansions exceeding the control
mixture occurred. Replacing 30 percent of the cement with PFA lowered the 28-day
compressive strength.
56
The ASR expansion, under accelerated conditions, was reduced for the low alkali
cement but was still significant for the high alkali cement. The high alkali mixture with
50 percent of its cement replaced with GGBS exhibited the same ASR expansion results
under accelerated conditions as to those mixtures containing PFA, but their compressive
strength was unaffected. When evaluating PFA and GGBS under non-accelerated
conditions, the materials proved to be effective suppressants of ASR expansion for at
least 27 months, even at high alkali levels. MK was the only material to completely
suppress ASR expansion in the highest alkali level mixture studied in both the laboratory
and exposure site specimens. The 28-day compressive strength of the concrete
containing MK increased.
Zhu and Byars (2005) investigated two types of PFA, one in accordance with BS
3892 and the other with BS EN 450. The mixing proportions and ASR testing was
performed in accordance with ASTM C1260, ASTM C227 and BS 812-123. Mixtures
prepared with RG, high alkali cement and 30 percent cement replaced with either of the
two ASR mitigators listed were tested according to ASTM C227. It was shown that the
mixtures prepared with no PFA far exceeded the allowable expansion of 0.1 percent at 26
weeks while those that included the 30 percent of either standard of PFA were within the
allowable expansion limit up to 56 weeks.
Lam et al. (2007) aimed at developing a mixture design that had a high percentage
of RG. Through the use of different admixtures, the authors were able to find the mixture
design that best suppressed ASR. This mixture was then evaluated through mechanical
testing. When evaluating the 50 percent fine aggregate replacement with RG mixture
design, it was found that the ASR suppressing capabilities of PFA were better than that of
57
MK. It was shown that 5 percent MK replacement of cement was needed to suppress 28-
day expansion due to ASR, whereas only 2.5 percent replacement value of PFA was
required. Mortar bars were prepared with 75, 50 and 25 percent of RG in order to find
the optimal dosage of PFA for varying levels of RG content. It was found that a mixture
design consisting of 10 percent PFA by weight of total aggregate in conjunction with 50
to 70 percent RG was considered as most effective in suppressing ASR expansion. It was
also found that mortar bars prepared with 25 percent or less of RG showed minimal
expansion, with or without PFA, after 28 days.
Concrete bars made with the optimum mixture design were then subjected to
mechanical tests to determine the compressive strength, tensile strength, skid resistance,
and abrasion resistance, all conducted in accordance with BS 6717. The compressive and
tensile strength were found to increase with increasing RG content at the 90-day
evaluation with constant PFA content. This could be attributed to the coarser particle
size of the glass used, which resulted in better packing of the blocks.
The skid resistance and the density were reduced while the water absorption and
abrasion resistance were unaffected with increasing PFA content. This may be due to the
more homogeneous mixture produced with the addition of PFA, which yielded a
smoother surface. As expected, the water absorption decreased as RG content increased.
The results of the mechanical results supported the earlier definition of the optimum
mixture design; consisting of 50 percent RG, 50 percent recycled fine aggregate with a
fineness modulus of 3.54 (i.e. crushed concrete rubbles), 10 percent by weight of total
aggregate of PFA and a water to cement ratio of 0.47.
58
3.3.3 Effect of Glass Color on Concrete with RG
This section provides the results regarding the effect of different colored glass
when used as aggregate and/or cement replacement in concrete.
Byars et al. (2004) studied green, amber, flint and blue RG. Mixing proportions
were according to BS 812-123 with 100 percent coarse glass aggregate, 3-6 mm (0.118-
0.236 in) and 6-12 mm (0.236-0.472 in), and normal sand. Blue glass was found to be
most reactive, followed by amber and flint glass. Green glass was found to be least
reactive. Still the authors note that the findings were found to be unclear and changed
with particle size. Given that ASR initiates at microcracks, the glass crushing technique
is therefore more significant than color since different glass colors are only affected by
small chemical changes.
Among the many factors studied by Zhu and Byars (2005), only the effect of glass
color is presented here. The authors evaluated a total of 98 mixtures. Glass colors
involved in this research were green, amber, flint and blue RG. It was found that
regardless of color, mixtures containing high alkali cement in addition to glass cullet
resulted in concrete expansions exceeding the limit of 0.1 percent at 26 weeks (ASTM
C227). When the same mixtures were tested using ordinary Portland cement, it was
found that the reactivity of the blue RG was much higher than that of amber, flint or
green glass. The concrete expansion of the mixtures containing blue glass cullet
exceeded the expansion limit at 52 weeks, while the mixtures containing the other colors
did not. In using white cement, the expansion of all of the concrete mixtures was below
the allowable limit at the age of 52 weeks. The final results showed green glass to be
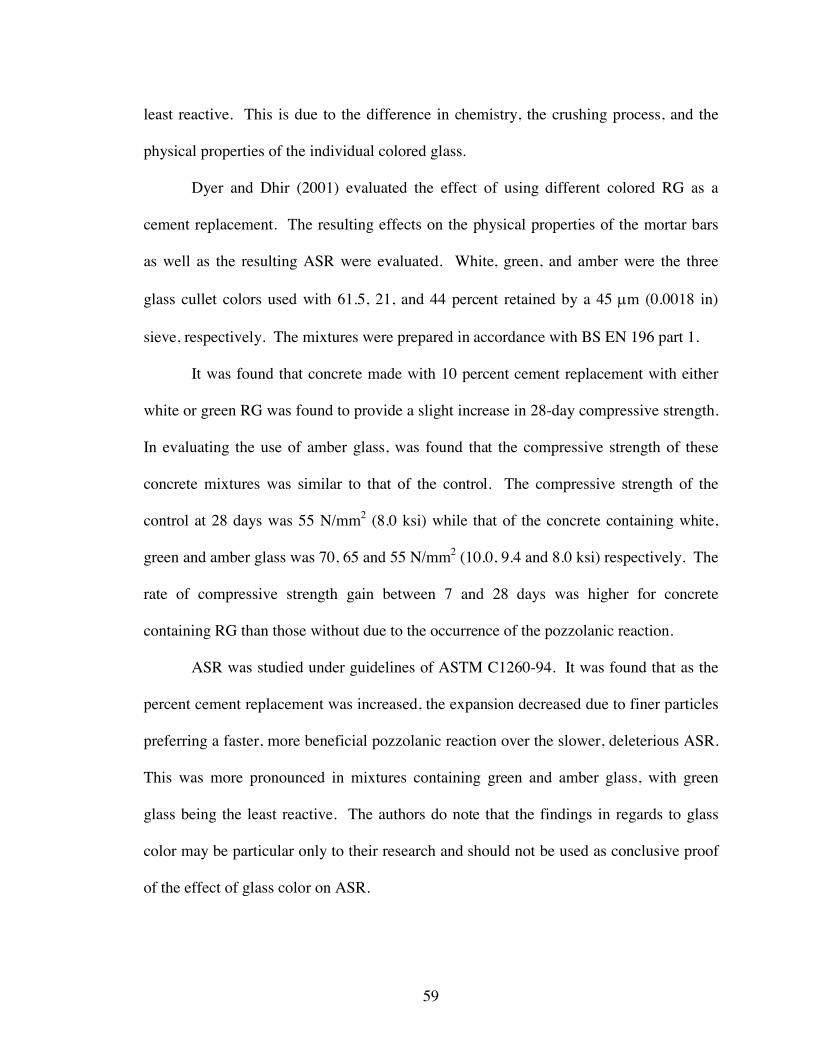
59
least reactive. This is due to the difference in chemistry, the crushing process, and the
physical properties of the individual colored glass.
Dyer and Dhir (2001) evaluated the effect of using different colored RG as a
cement replacement. The resulting effects on the physical properties of the mortar bars
as well as the resulting ASR were evaluated. White, green, and amber were the three
glass cullet colors used with 61.5, 21, and 44 percent retained by a 45 m (0.0018 in) sieve, respectively. The mixtures were prepared in accordance with BS EN 196 part 1.
It was found that concrete made with 10 percent cement replacement with either
white or green RG was found to provide a slight increase in 28-day compressive strength.
In evaluating the use of amber glass, was found that the compressive strength of these
concrete mixtures was similar to that of the control. The compressive strength of the
control at 28 days was 55 N/mm2 (8.0 ksi) while that of the concrete containing white,
green and amber glass was 70, 65 and 55 N/mm2 (10.0, 9.4 and 8.0 ksi) respectively. The
rate of compressive strength gain between 7 and 28 days was higher for concrete
containing RG than those without due to the occurrence of the pozzolanic reaction.
ASR was studied under guidelines of ASTM C1260-94. It was found that as the
percent cement replacement was increased, the expansion decreased due to finer particles
preferring a faster, more beneficial pozzolanic reaction over the slower, deleterious ASR.
This was more pronounced in mixtures containing green and amber glass, with green
glass being the least reactive. The authors do note that the findings in regards to glass
color may be particular only to their research and should not be used as conclusive proof
of the effect of glass color on ASR.
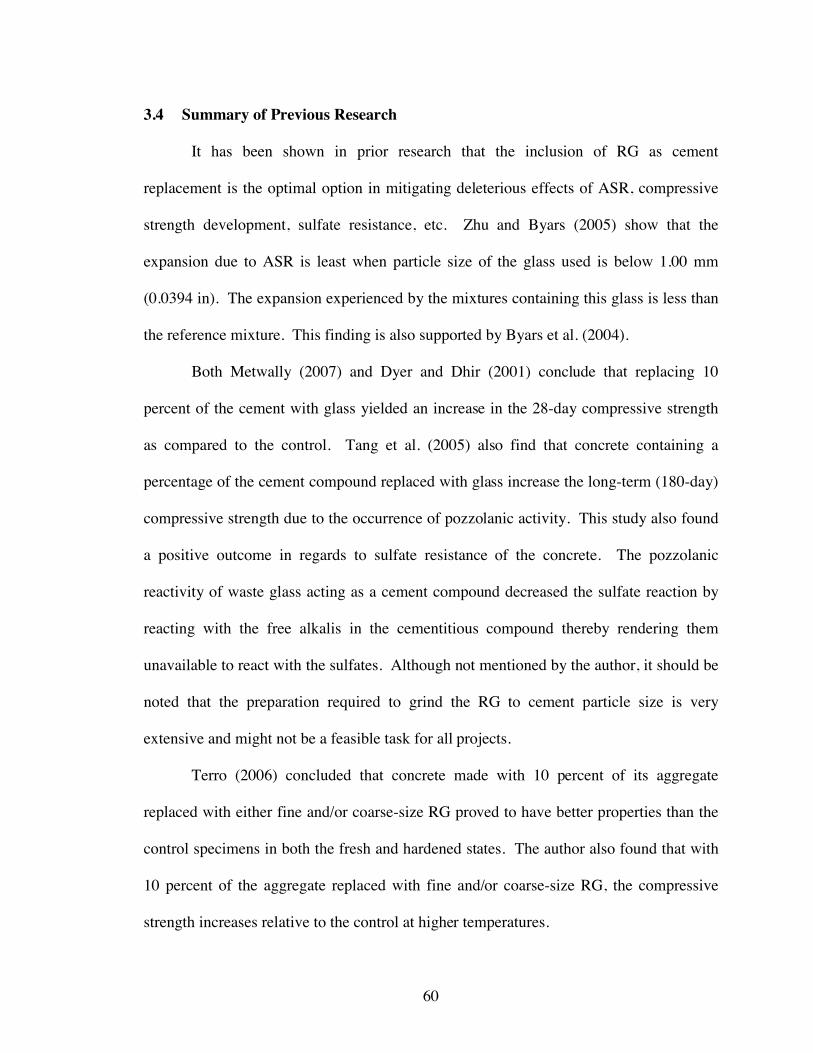
60
3.4 Summary of Previous Research
It has been shown in prior research that the inclusion of RG as cement
replacement is the optimal option in mitigating deleterious effects of ASR, compressive
strength development, sulfate resistance, etc. Zhu and Byars (2005) show that the
expansion due to ASR is least when particle size of the glass used is below 1.00 mm
(0.0394 in). The expansion experienced by the mixtures containing this glass is less than
the reference mixture. This finding is also supported by Byars et al. (2004).
Both Metwally (2007) and Dyer and Dhir (2001) conclude that replacing 10
percent of the cement with glass yielded an increase in the 28-day compressive strength
as compared to the control. Tang et al. (2005) also find that concrete containing a
percentage of the cement compound replaced with glass increase the long-term (180-day)
compressive strength due to the occurrence of pozzolanic activity. This study also found
a positive outcome in regards to sulfate resistance of the concrete. The pozzolanic
reactivity of waste glass acting as a cement compound decreased the sulfate reaction by
reacting with the free alkalis in the cementitious compound thereby rendering them
unavailable to react with the sulfates. Although not mentioned by the author, it should be
noted that the preparation required to grind the RG to cement particle size is very
extensive and might not be a feasible task for all projects.
Terro (2006) concluded that concrete made with 10 percent of its aggregate
replaced with either fine and/or coarse-size RG proved to have better properties than the
control specimens in both the fresh and hardened states. The author also found that with
10 percent of the aggregate replaced with fine and/or coarse-size RG, the compressive
strength increases relative to the control at higher temperatures.
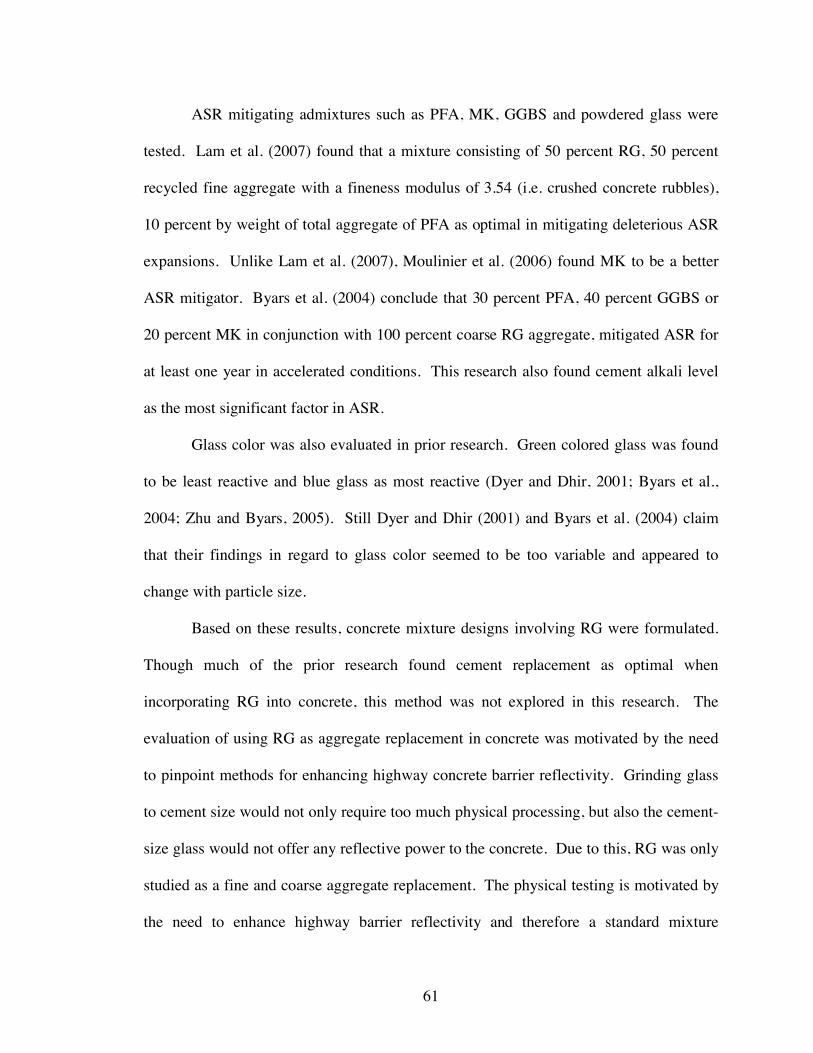
61
ASR mitigating admixtures such as PFA, MK, GGBS and powdered glass were
tested. Lam et al. (2007) found that a mixture consisting of 50 percent RG, 50 percent
recycled fine aggregate with a fineness modulus of 3.54 (i.e. crushed concrete rubbles),
10 percent by weight of total aggregate of PFA as optimal in mitigating deleterious ASR
expansions. Unlike Lam et al. (2007), Moulinier et al. (2006) found MK to be a better
ASR mitigator. Byars et al. (2004) conclude that 30 percent PFA, 40 percent GGBS or
20 percent MK in conjunction with 100 percent coarse RG aggregate, mitigated ASR for
at least one year in accelerated conditions. This research also found cement alkali level
as the most significant factor in ASR.
Glass color was also evaluated in prior research. Green colored glass was found
to be least reactive and blue glass as most reactive (Dyer and Dhir, 2001; Byars et al.,
2004; Zhu and Byars, 2005). Still Dyer and Dhir (2001) and Byars et al. (2004) claim
that their findings in regard to glass color seemed to be too variable and appeared to
change with particle size.
Based on these results, concrete mixture designs involving RG were formulated.
Though much of the prior research found cement replacement as optimal when
incorporating RG into concrete, this method was not explored in this research. The
evaluation of using RG as aggregate replacement in concrete was motivated by the need
to pinpoint methods for enhancing highway concrete barrier reflectivity. Grinding glass
to cement size would not only require too much physical processing, but also the cement-
size glass would not offer any reflective power to the concrete. Due to this, RG was only
studied as a fine and coarse aggregate replacement. The physical testing is motivated by
the need to enhance highway barrier reflectivity and therefore a standard mixture

62
employed for highway concrete barriers was employed. This mixture contains self-
consolidating concrete, a factor not previously explored in prior research. Full
explanation of the mixtures developed and the research plan is provided in Chapter 4.
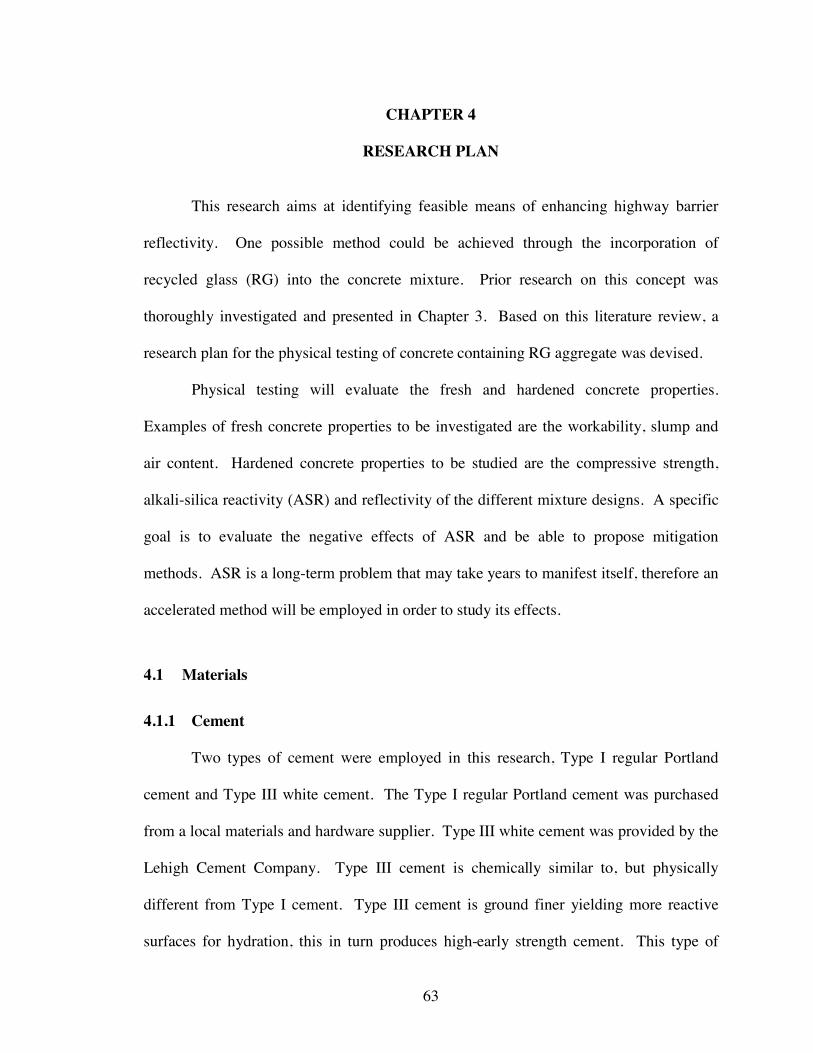
63
CHAPTER 4
RESEARCH PLAN
This research aims at identifying feasible means of enhancing highway barrier
reflectivity. One possible method could be achieved through the incorporation of
recycled glass (RG) into the concrete mixture. Prior research on this concept was
thoroughly investigated and presented in Chapter 3. Based on this literature review, a
research plan for the physical testing of concrete containing RG aggregate was devised.
Physical testing will evaluate the fresh and hardened concrete properties.
Examples of fresh concrete properties to be investigated are the workability, slump and
air content. Hardened concrete properties to be studied are the compressive strength,
alkali-silica reactivity (ASR) and reflectivity of the different mixture designs. A specific
goal is to evaluate the negative effects of ASR and be able to propose mitigation
methods. ASR is a long-term problem that may take years to manifest itself, therefore an
accelerated method will be employed in order to study its effects.
4.1 Materials
4.1.1 Cement
Two types of cement were employed in this research, Type I regular Portland
cement and Type III white cement. The Type I regular Portland cement was purchased
from a local materials and hardware supplier. Type III white cement was provided by the
Lehigh Cement Company. Type III cement is chemically similar to, but physically
different from Type I cement. Type III cement is ground finer yielding more reactive
surfaces for hydration, this in turn produces high-early strength cement. This type of
64
cement may be employed in the manufacturing of concrete blocks and precast and
prestressed structures. It is commonly used during the winter months when high early
strength is necessary such as in pre-cast operations (Lehigh Cement Company, 2009).
4.1.2 Admixtures
Three liquid admixtures are employed; an air entraining admixture (Sika® AEA-
15), a superplasticizer (Sika ViscoCrete® 6100) and an ASR controlling admixture
(Sika® Control ASR). The manufacturer, Sika Corporation, supplied all of these
products. Sika® AEA-15 meets the requirements for an air entraining admixture as set
forth by ASTM C260. The workability and place-ability are improved through the use of
this admixture by the lubricating action of the microscopic bubbles in the concrete. It
improves the flow of the concrete and reduces the bleeding and the shrinkage because
less water is required to reach the desired level of workability. The specified dosage rate
intended to entrain 4 to 6 percent air is between 16 to 65 ml per 100 kg (0.25 to 1 oz per
100 lbs) of cement. When adding this admixture to the concrete mixture, it is to be
mixed either into the water or the sand, but not into the dry cement. Since this admixture
is added in conjunction with another admixture (Sika ViscoCrete® 6100), care must be
taken to dispense each of these admixtures separately. All of the information regarding
Sika® AEA-15 was gathered from the Product Data Sheet of the admixture.
Sika ViscoCrete® 6100 is a high range water reducing and superplasticizing
admixture that meets the requirements of ASTM C494 Types A and F. The inclusion of
Sika ViscoCrete® 6100 renders this mixture a self-consolidating mixture. If used in
small amounts, this admixture causes a water reduction of 10 to 15 percent, but if used in
65
higher doses, a water reduction of up to 45 percent may be achieved. Its
superplasticizing action provides a high slump, flowing concrete that maintains excellent
workability. This admixture has been formulated to provide maximum water reduction,
increased early strength and improved finishing characteristics. The recommended
dosage is from 195 to 520 ml per 100 kg (3 to 8 oz per 100 lbs) of cementitious material.
For maximum water reduction, dosage of up to 780 ml per 100 kg (12 oz per 100 lbs) of
cementitious material may be used. This admixture is to be added directly to freshly
mixed concrete in the concrete mixer at the end of the batching cycle for optimum
superplasticizing results. All of the information regarding Sika ViscoCrete® 6100 was
gathered from the Product Data Sheet of the admixture.
Sika® Control ASR was only used in one mixture design with the intent of
studying the effect of this admixture. This admixture introduces lithium nitrate into the
mixture, which incorporates itself into the alkali-silica gel. These lithium ions prevent
the ASR gel from swelling upon interaction with water. Lacking the ability to swell
renders this gel nondestructive. The dosage of Sika® Control ASR is dependent on the
alkali level of the concrete mixture with approximately 4.6 liters added for every
kilogram (0.55 gallons for every pound) of sodium equivalent supplied by the cement.
This admixture alters the water to cementitious material (w/cm) ratio and in order to
rectify that 0.85 liters (0.23 gallons) of water must be subtracted for each liter (0.26 gallons) of the admixture added. This admixture is to be added either to the water or to
the mixture at the end of the batching cycle and should be added separately from other
admixtures being administered. All of the information regarding Sika® Control ASR
was gathered from the Product Data Sheet of the admixture.
66
Pulverized fly ash (PFA) is a powder admixture used as a cement replacement.
Headwaters Incorporated in Havana, IL donated this product. Class C PFA was used.
4.1.3 Aggregate
Delta Sand and Gravel, Inc. in Sunderland, MA supplied the fine and coarse
aggregates. Sieve analysis of the aggregates adhered to ASTM C136 and the aggregate
specification was in line with ASTM C33. Figures 4.1 and 4.2 provide the sieve analysis
for the fine and coarse aggregates, respectively. The graphs show that while the sieve
analysis of the coarse aggregate falls within the prescribed range, the fine aggregate sieve
analysis is slightly outside of the allowable range. The sand is of slightly lower gradation
than that prescribed by ASTM C33. In checking with the supply company, it was
reaffirmed that this sand is supplied for typical use as aggregate in concrete construction.
The fineness modulus of fine aggregate is 1.91.
Due to the small cross-sectional area and length of the prisms employed for ASR
study, maximum coarse aggregate size was decreased from 19.05 mm (3/4 in) to 12.5
mm (1/2 in).
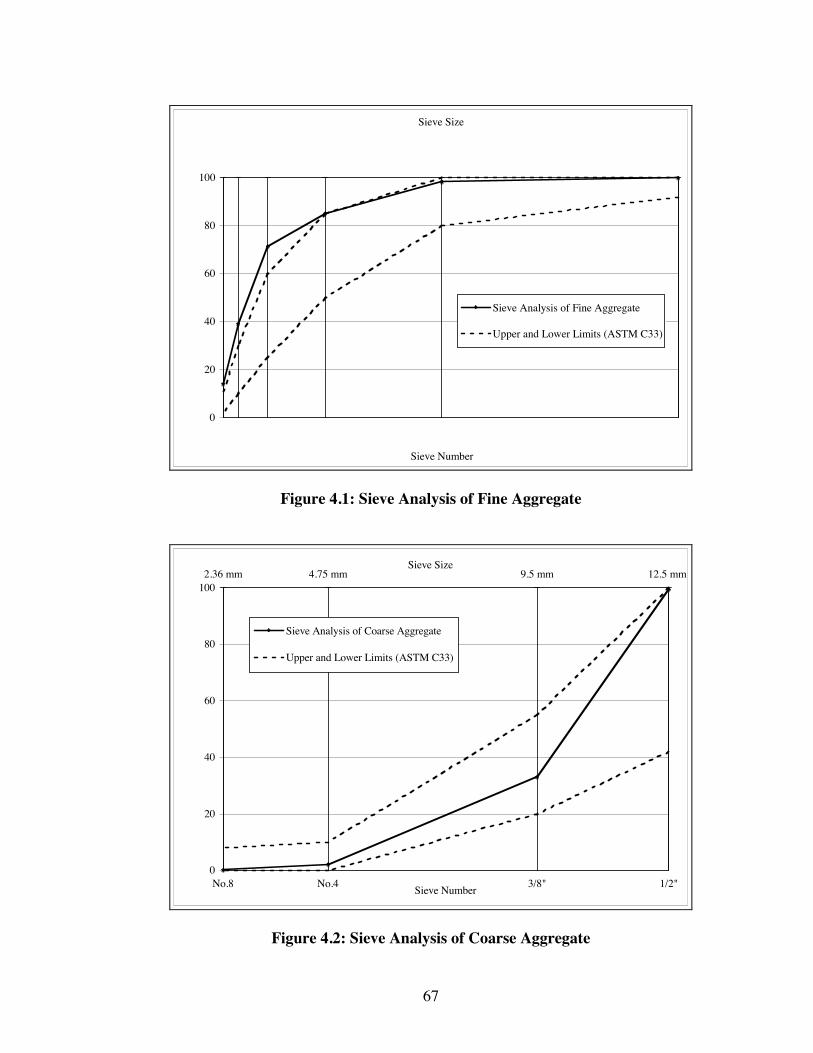
67
0
20
40
60
80
100
Sieve Number
Sieve Analysis of Fine Aggregate
Upper and Lower Limits (ASTM C33)
Sieve Size
Figure 4.1: Sieve Analysis of Fine Aggregate
Sieve Size
No.8 No.4 3/8" 1/2"
2.36 mm 4.75 mm 9.5 mm 12.5 mm
0
20
40
60
80
100
Sieve Number
Sieve Analysis of Coarse Aggregate
Upper and Lower Limits (ASTM C33)
Figure 4.2: Sieve Analysis of Coarse Aggregate
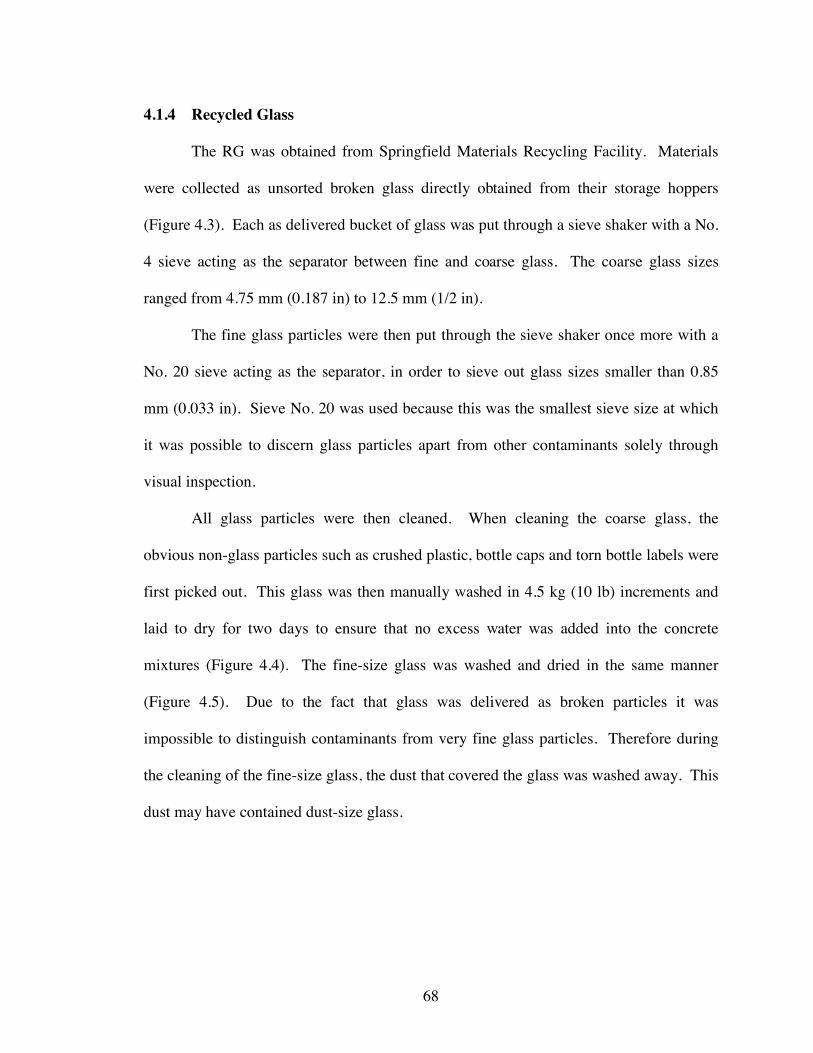
68
4.1.4 Recycled Glass
The RG was obtained from Springfield Materials Recycling Facility. Materials
were collected as unsorted broken glass directly obtained from their storage hoppers
(Figure 4.3). Each as delivered bucket of glass was put through a sieve shaker with a No.
4 sieve acting as the separator between fine and coarse glass. The coarse glass sizes
ranged from 4.75 mm (0.187 in) to 12.5 mm (1/2 in).
The fine glass particles were then put through the sieve shaker once more with a
No. 20 sieve acting as the separator, in order to sieve out glass sizes smaller than 0.85
mm (0.033 in). Sieve No. 20 was used because this was the smallest sieve size at which
it was possible to discern glass particles apart from other contaminants solely through
visual inspection.
All glass particles were then cleaned. When cleaning the coarse glass, the
obvious non-glass particles such as crushed plastic, bottle caps and torn bottle labels were
first picked out. This glass was then manually washed in 4.5 kg (10 lb) increments and
laid to dry for two days to ensure that no excess water was added into the concrete
mixtures (Figure 4.4). The fine-size glass was washed and dried in the same manner
(Figure 4.5). Due to the fact that glass was delivered as broken particles it was
impossible to distinguish contaminants from very fine glass particles. Therefore during
the cleaning of the fine-size glass, the dust that covered the glass was washed away. This
dust may have contained dust-size glass.
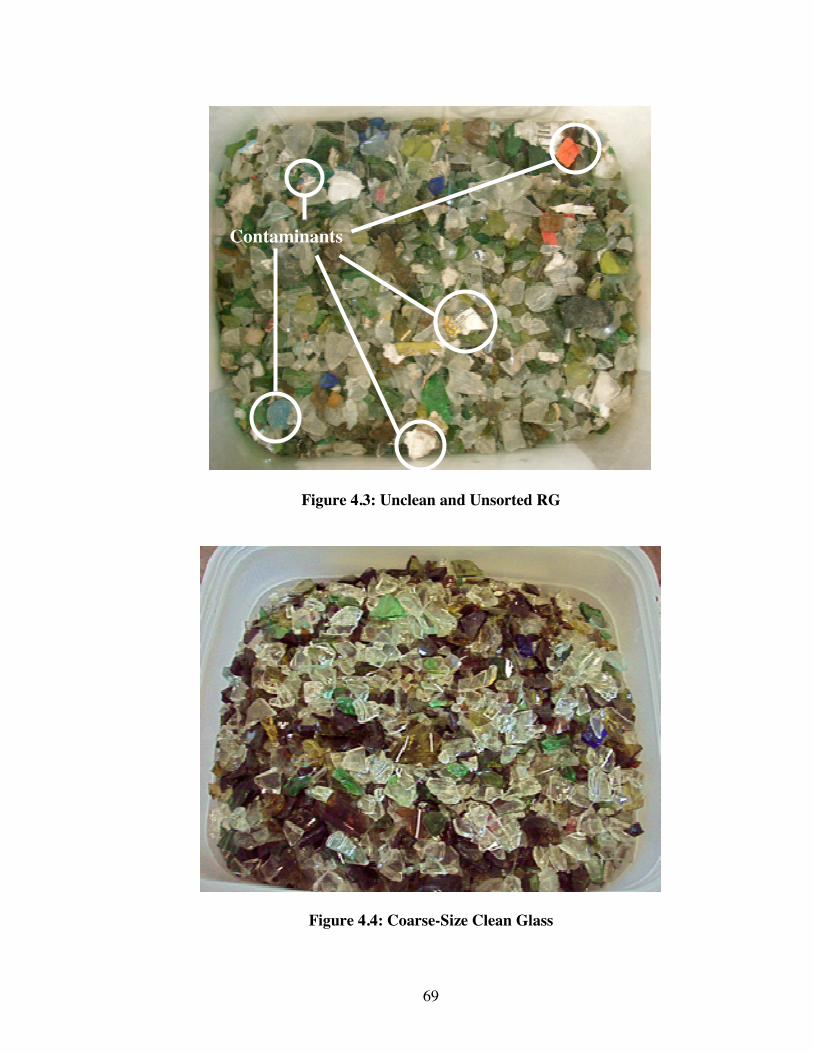
69
Figure 4.3: Unclean and Unsorted RG
Figure 4.4: Coarse-Size Clean Glass
Contaminants
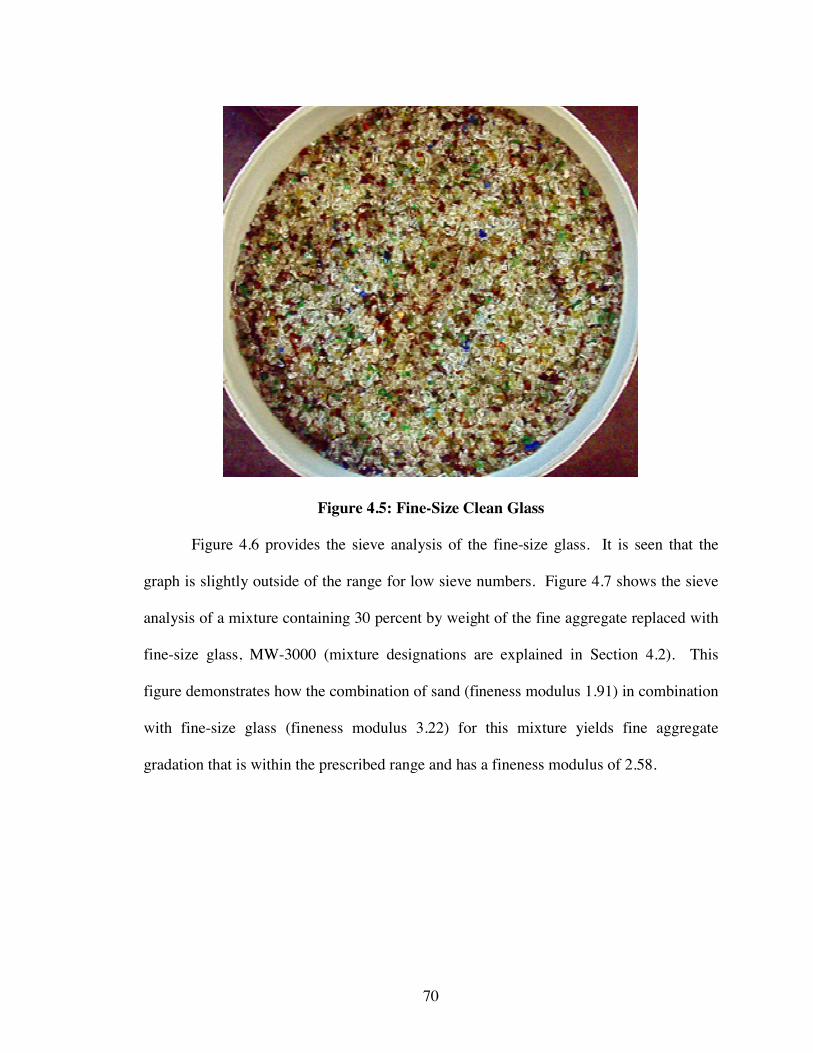
70
Figure 4.5: Fine-Size Clean Glass
Figure 4.6 provides the sieve analysis of the fine-size glass. It is seen that the
graph is slightly outside of the range for low sieve numbers. Figure 4.7 shows the sieve
analysis of a mixture containing 30 percent by weight of the fine aggregate replaced with
fine-size glass, MW-3000 (mixture designations are explained in Section 4.2). This
figure demonstrates how the combination of sand (fineness modulus 1.91) in combination
with fine-size glass (fineness modulus 3.22) for this mixture yields fine aggregate
gradation that is within the prescribed range and has a fineness modulus of 2.58.
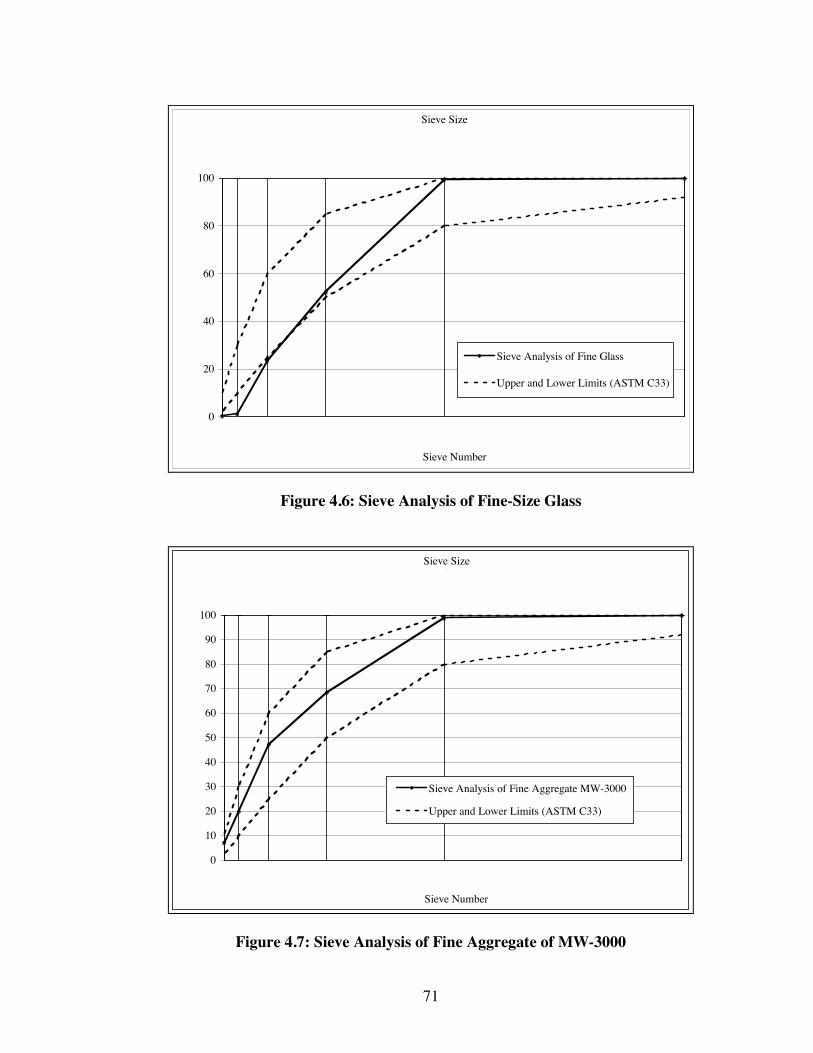
71
Sieve Size
0
20
40
60
80
100
Sieve Number
Sieve Analysis of Fine Glass
Upper and Lower Limits (ASTM C33)
Figure 4.6: Sieve Analysis of Fine-Size Glass
Sieve Size
2.36
mm
0
10
20
30
40
50
60
70
80
90
100
Sieve Number
Sieve Analysis of Fine Aggregate MW-3000
Upper and Lower Limits (ASTM C33)
Figure 4.7: Sieve Analysis of Fine Aggregate of MW-3000
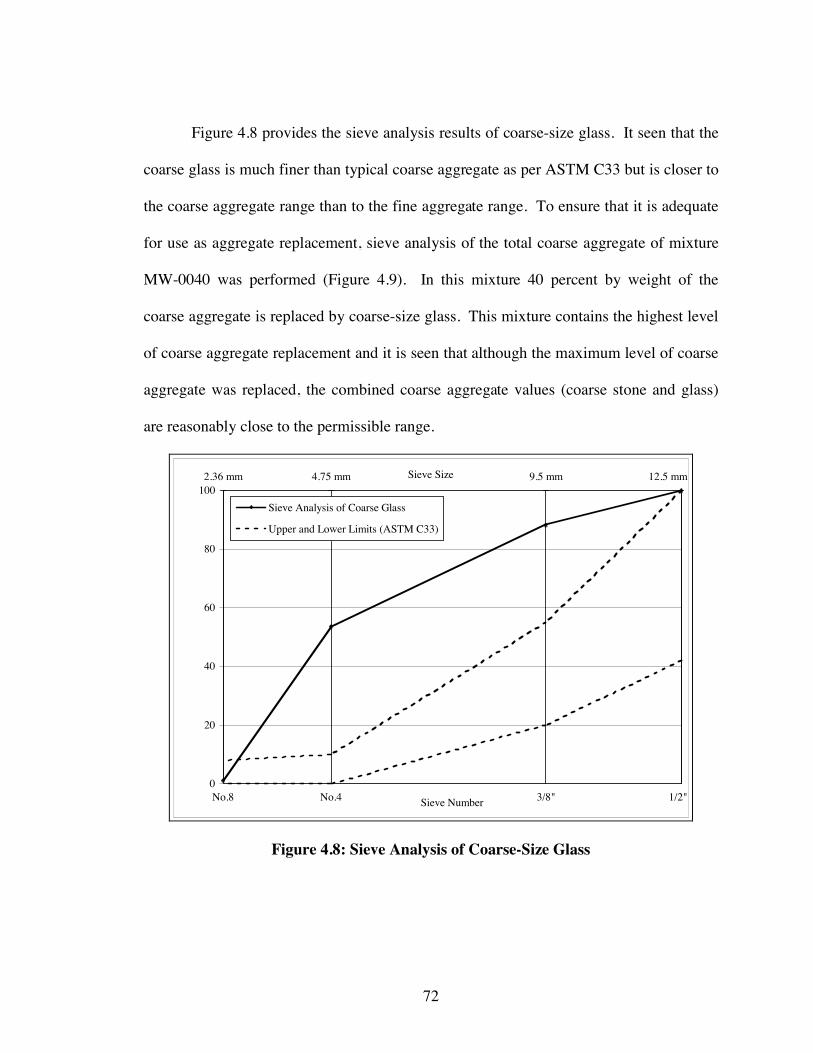
72
Figure 4.8 provides the sieve analysis results of coarse-size glass. It seen that the
coarse glass is much finer than typical coarse aggregate as per ASTM C33 but is closer to
the coarse aggregate range than to the fine aggregate range. To ensure that it is adequate
for use as aggregate replacement, sieve analysis of the total coarse aggregate of mixture
MW-0040 was performed (Figure 4.9). In this mixture 40 percent by weight of the
coarse aggregate is replaced by coarse-size glass. This mixture contains the highest level
of coarse aggregate replacement and it is seen that although the maximum level of coarse
aggregate was replaced, the combined coarse aggregate values (coarse stone and glass)
are reasonably close to the permissible range.
Sieve Size
No.8 No.4 3/8" 1/2"
2.36 mm 4.75 mm 9.5 mm 12.5 mm
0
20
40
60
80
100
Sieve Number
Sieve Analysis of Coarse Glass
Upper and Lower Limits (ASTM C33)
Figure 4.8: Sieve Analysis of Coarse-Size Glass
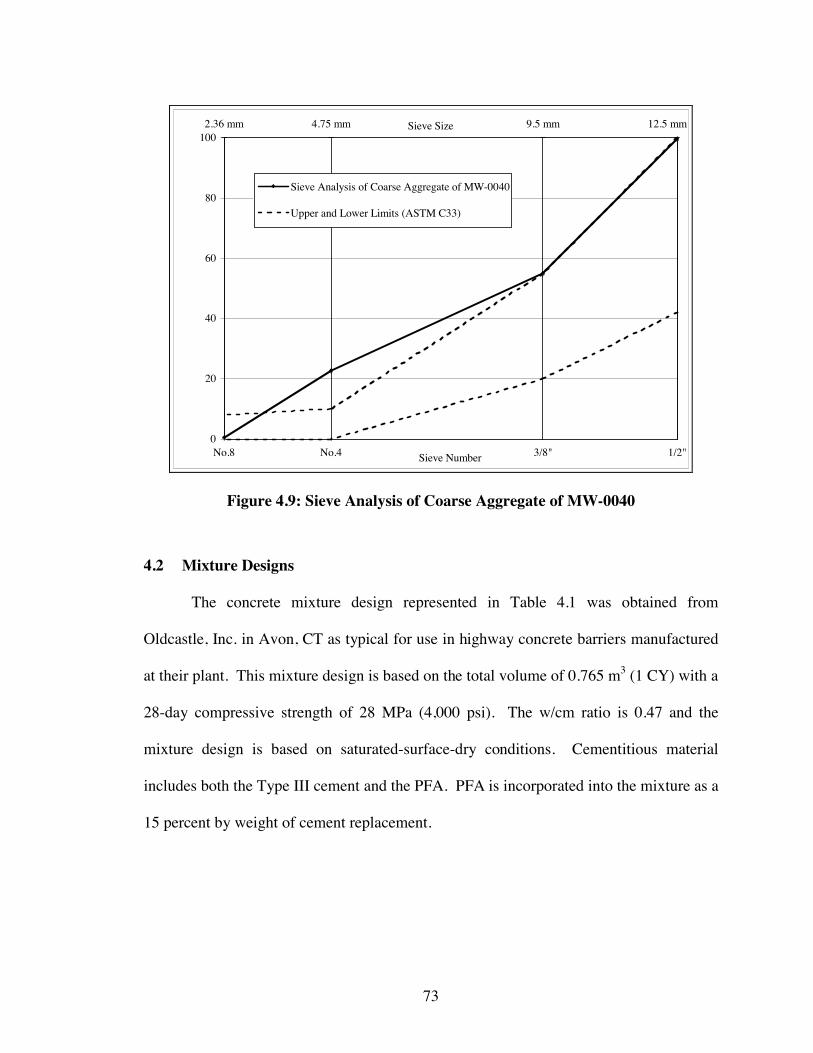
73
Sieve Size
No.8 No.4 3/8" 1/2"
2.36 mm 4.75 mm 9.5 mm 12.5 mm
0
20
40
60
80
100
Sieve Number
Sieve Analysis of Coarse Aggregate of MW-0040
Upper and Lower Limits (ASTM C33)
Figure 4.9: Sieve Analysis of Coarse Aggregate of MW-0040
4.2 Mixture Designs
The concrete mixture design represented in Table 4.1 was obtained from
Oldcastle, Inc. in Avon, CT as typical for use in highway concrete barriers manufactured
at their plant. This mixture design is based on the total volume of 0.765 m3 (1 CY) with a
28-day compressive strength of 28 MPa (4,000 psi). The w/cm ratio is 0.47 and the
mixture design is based on saturated-surface-dry conditions. Cementitious material
includes both the Type III cement and the PFA. PFA is incorporated into the mixture as a
15 percent by weight of cement replacement.
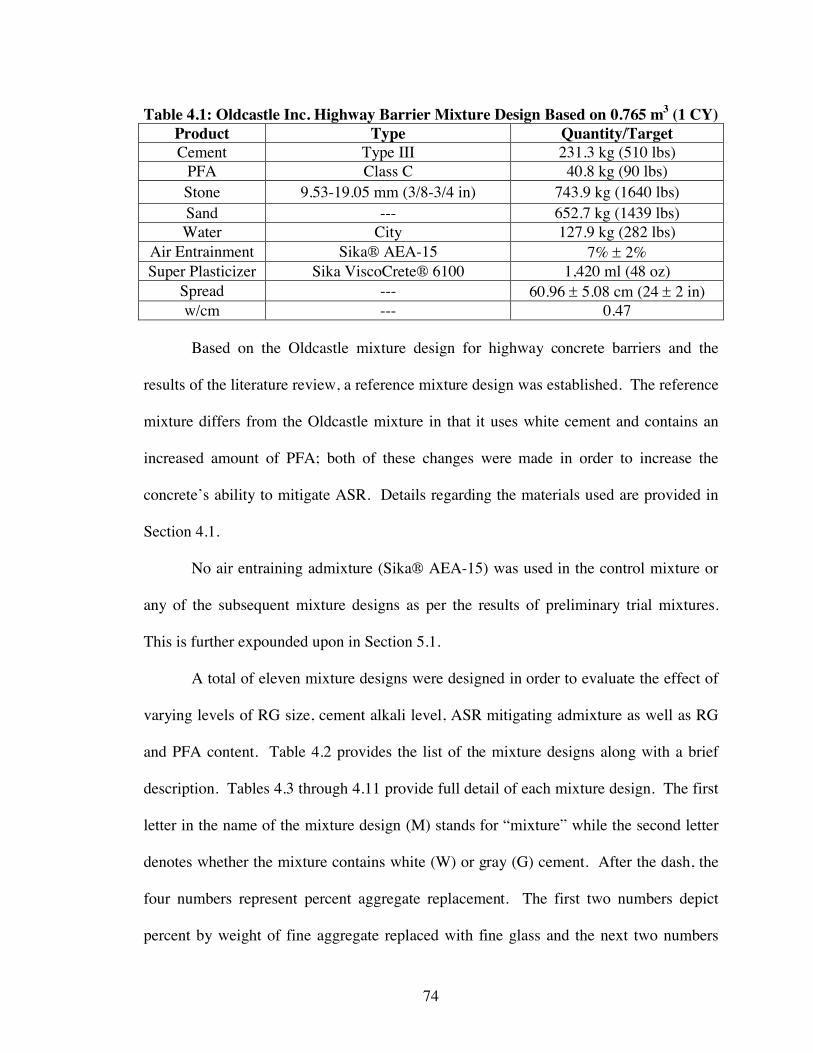
74
Table 4.1: Oldcastle Inc. Highway Barrier Mixture Design Based on 0.765 m3 (1 CY) Product Type Quantity/Target Cement Type III 231.3 kg (510 lbs)
PFA Class C 40.8 kg (90 lbs) Stone 9.53-19.05 mm (3/8-3/4 in) 743.9 kg (1640 lbs) Sand --- 652.7 kg (1439 lbs) Water City 127.9 kg (282 lbs)
Air Entrainment Sika® AEA-15 7% 2% Super Plasticizer Sika ViscoCrete® 6100 1,420 ml (48 oz)
Spread --- 60.96 5.08 cm (24 2 in) w/cm --- 0.47
Based on the Oldcastle mixture design for highway concrete barriers and the
results of the literature review, a reference mixture design was established. The reference
mixture differs from the Oldcastle mixture in that it uses white cement and contains an
increased amount of PFA; both of these changes were made in order to increase the
concrete’s ability to mitigate ASR. Details regarding the materials used are provided in
Section 4.1.
No air entraining admixture (Sika® AEA-15) was used in the control mixture or
any of the subsequent mixture designs as per the results of preliminary trial mixtures.
This is further expounded upon in Section 5.1.
A total of eleven mixture designs were designed in order to evaluate the effect of
varying levels of RG size, cement alkali level, ASR mitigating admixture as well as RG
and PFA content. Table 4.2 provides the list of the mixture designs along with a brief
description. Tables 4.3 through 4.11 provide full detail of each mixture design. The first
letter in the name of the mixture design (M) stands for “mixture” while the second letter
denotes whether the mixture contains white (W) or gray (G) cement. After the dash, the
four numbers represent percent aggregate replacement. The first two numbers depict
percent by weight of fine aggregate replaced with fine glass and the next two numbers
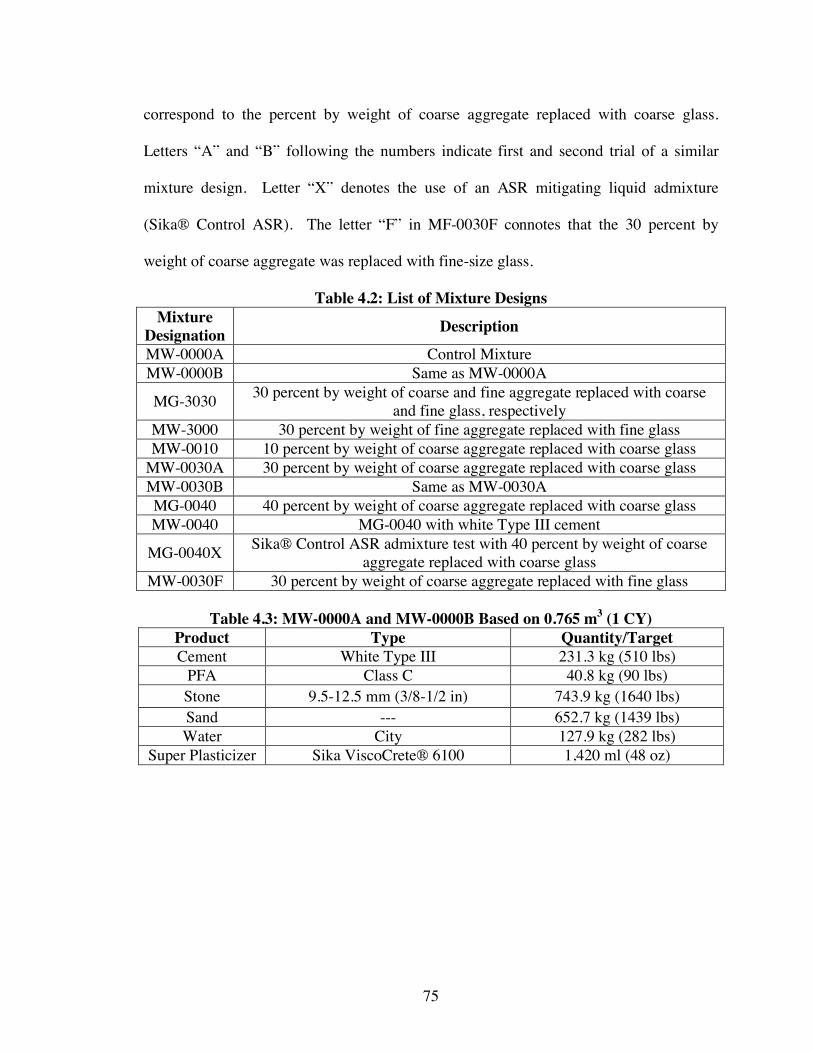
75
correspond to the percent by weight of coarse aggregate replaced with coarse glass.
Letters “A” and “B” following the numbers indicate first and second trial of a similar
mixture design. Letter “X” denotes the use of an ASR mitigating liquid admixture
(Sika® Control ASR). The letter “F” in MF-0030F connotes that the 30 percent by
weight of coarse aggregate was replaced with fine-size glass.
Table 4.2: List of Mixture Designs Mixture
Designation Description
MW-0000A Control Mixture MW-0000B Same as MW-0000A
MG-3030 30 percent by weight of coarse and fine aggregate replaced with coarse and fine glass, respectively
MW-3000 30 percent by weight of fine aggregate replaced with fine glass MW-0010 10 percent by weight of coarse aggregate replaced with coarse glass
MW-0030A 30 percent by weight of coarse aggregate replaced with coarse glass MW-0030B Same as MW-0030A MG-0040 40 percent by weight of coarse aggregate replaced with coarse glass MW-0040 MG-0040 with white Type III cement
MG-0040X Sika® Control ASR admixture test with 40 percent by weight of coarse aggregate replaced with coarse glass
MW-0030F 30 percent by weight of coarse aggregate replaced with fine glass
Table 4.3: MW-0000A and MW-0000B Based on 0.765 m3 (1 CY) Product Type Quantity/Target Cement White Type III 231.3 kg (510 lbs)
PFA Class C 40.8 kg (90 lbs) Stone 9.5-12.5 mm (3/8-1/2 in) 743.9 kg (1640 lbs) Sand --- 652.7 kg (1439 lbs) Water City 127.9 kg (282 lbs)
Super Plasticizer Sika ViscoCrete® 6100 1,420 ml (48 oz)
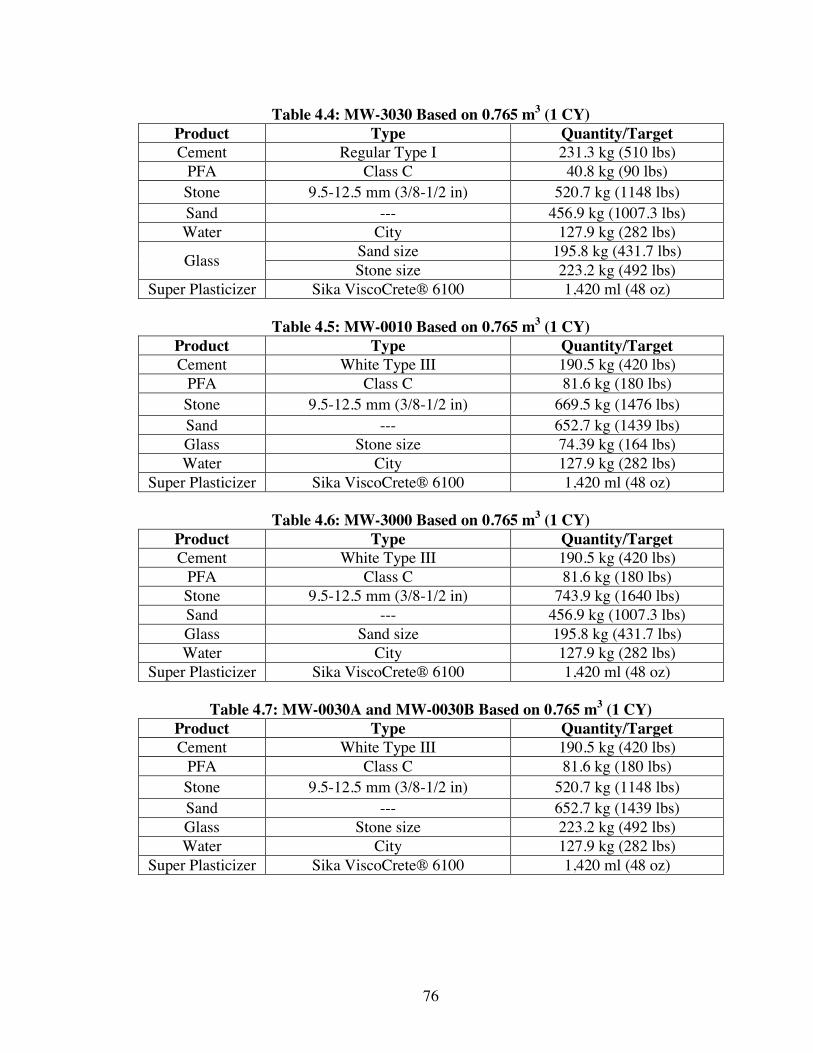
76
Table 4.4: MW-3030 Based on 0.765 m3 (1 CY) Product Type Quantity/Target Cement Regular Type I 231.3 kg (510 lbs)
PFA Class C 40.8 kg (90 lbs) Stone 9.5-12.5 mm (3/8-1/2 in) 520.7 kg (1148 lbs) Sand --- 456.9 kg (1007.3 lbs) Water City 127.9 kg (282 lbs)
Glass Sand size 195.8 kg (431.7 lbs) Stone size 223.2 kg (492 lbs)
Super Plasticizer Sika ViscoCrete® 6100 1,420 ml (48 oz)
Table 4.5: MW-0010 Based on 0.765 m3 (1 CY) Product Type Quantity/Target Cement White Type III 190.5 kg (420 lbs)
PFA Class C 81.6 kg (180 lbs) Stone 9.5-12.5 mm (3/8-1/2 in) 669.5 kg (1476 lbs) Sand --- 652.7 kg (1439 lbs) Glass Stone size 74.39 kg (164 lbs) Water City 127.9 kg (282 lbs)
Super Plasticizer Sika ViscoCrete® 6100 1,420 ml (48 oz)
Table 4.6: MW-3000 Based on 0.765 m3 (1 CY) Product Type Quantity/Target Cement White Type III 190.5 kg (420 lbs)
PFA Class C 81.6 kg (180 lbs) Stone 9.5-12.5 mm (3/8-1/2 in) 743.9 kg (1640 lbs) Sand --- 456.9 kg (1007.3 lbs) Glass Sand size 195.8 kg (431.7 lbs) Water City 127.9 kg (282 lbs)
Super Plasticizer Sika ViscoCrete® 6100 1,420 ml (48 oz)
Table 4.7: MW-0030A and MW-0030B Based on 0.765 m3 (1 CY) Product Type Quantity/Target Cement White Type III 190.5 kg (420 lbs)
PFA Class C 81.6 kg (180 lbs) Stone 9.5-12.5 mm (3/8-1/2 in) 520.7 kg (1148 lbs) Sand --- 652.7 kg (1439 lbs) Glass Stone size 223.2 kg (492 lbs) Water City 127.9 kg (282 lbs)
Super Plasticizer Sika ViscoCrete® 6100 1,420 ml (48 oz)
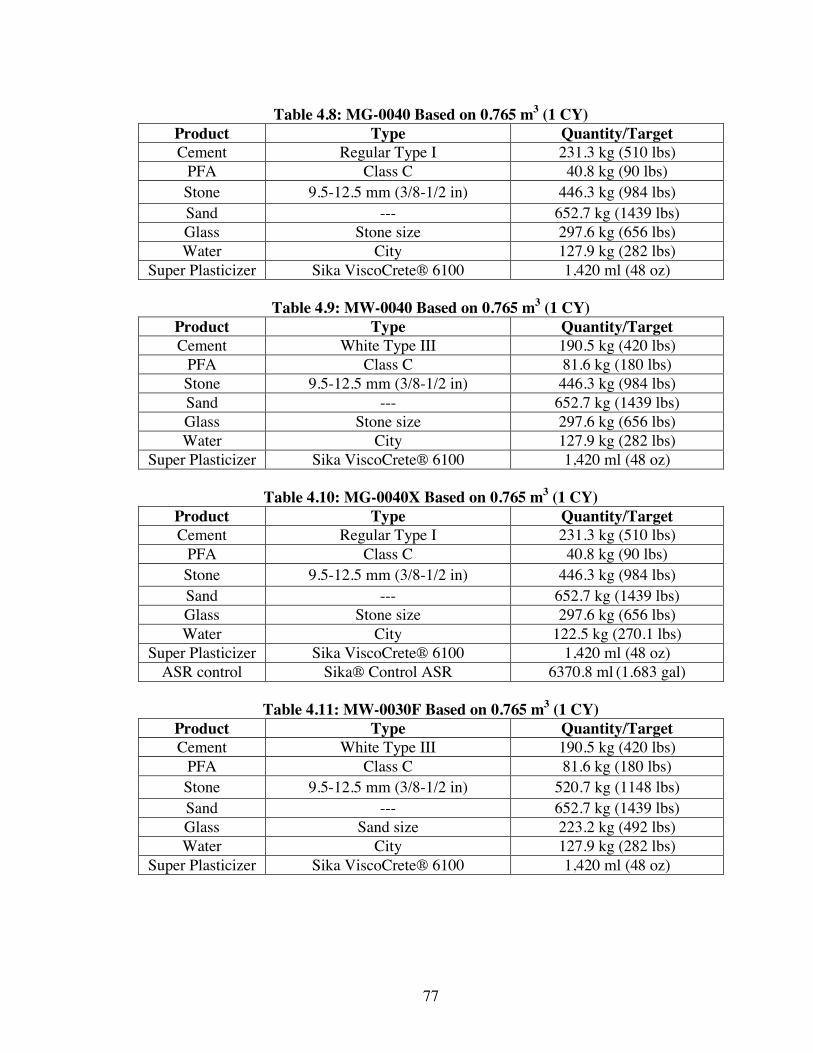
77
Table 4.8: MG-0040 Based on 0.765 m3 (1 CY) Product Type Quantity/Target Cement Regular Type I 231.3 kg (510 lbs)
PFA Class C 40.8 kg (90 lbs) Stone 9.5-12.5 mm (3/8-1/2 in) 446.3 kg (984 lbs) Sand --- 652.7 kg (1439 lbs) Glass Stone size 297.6 kg (656 lbs) Water City 127.9 kg (282 lbs)
Super Plasticizer Sika ViscoCrete® 6100 1,420 ml (48 oz)
Table 4.9: MW-0040 Based on 0.765 m3 (1 CY) Product Type Quantity/Target Cement White Type III 190.5 kg (420 lbs)
PFA Class C 81.6 kg (180 lbs) Stone 9.5-12.5 mm (3/8-1/2 in) 446.3 kg (984 lbs) Sand --- 652.7 kg (1439 lbs) Glass Stone size 297.6 kg (656 lbs) Water City 127.9 kg (282 lbs)
Super Plasticizer Sika ViscoCrete® 6100 1,420 ml (48 oz)
Table 4.10: MG-0040X Based on 0.765 m3 (1 CY) Product Type Quantity/Target Cement Regular Type I 231.3 kg (510 lbs)
PFA Class C 40.8 kg (90 lbs) Stone 9.5-12.5 mm (3/8-1/2 in) 446.3 kg (984 lbs) Sand --- 652.7 kg (1439 lbs) Glass Stone size 297.6 kg (656 lbs) Water City 122.5 kg (270.1 lbs)
Super Plasticizer Sika ViscoCrete® 6100 1,420 ml (48 oz) ASR control Sika® Control ASR 6370.8 ml (1.683 gal)
Table 4.11: MW-0030F Based on 0.765 m3 (1 CY)
Product Type Quantity/Target Cement White Type III 190.5 kg (420 lbs)
PFA Class C 81.6 kg (180 lbs) Stone 9.5-12.5 mm (3/8-1/2 in) 520.7 kg (1148 lbs) Sand --- 652.7 kg (1439 lbs) Glass Sand size 223.2 kg (492 lbs) Water City 127.9 kg (282 lbs)
Super Plasticizer Sika ViscoCrete® 6100 1,420 ml (48 oz)
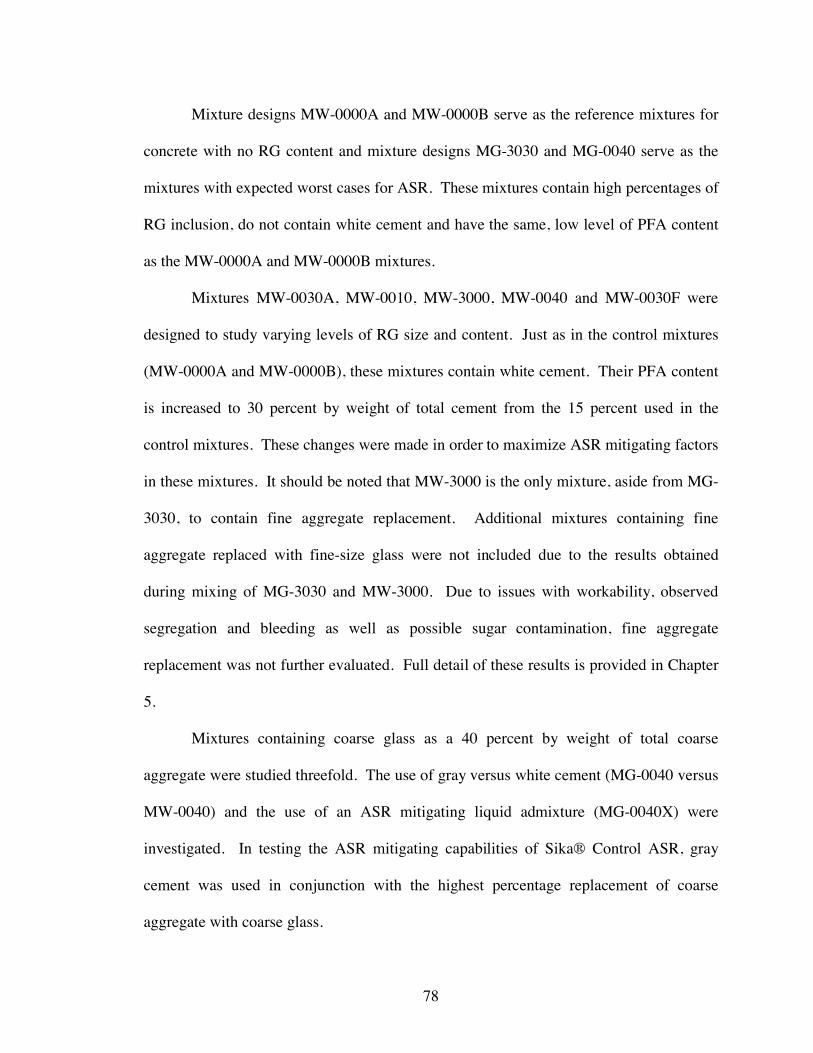
78
Mixture designs MW-0000A and MW-0000B serve as the reference mixtures for
concrete with no RG content and mixture designs MG-3030 and MG-0040 serve as the
mixtures with expected worst cases for ASR. These mixtures contain high percentages of
RG inclusion, do not contain white cement and have the same, low level of PFA content
as the MW-0000A and MW-0000B mixtures.
Mixtures MW-0030A, MW-0010, MW-3000, MW-0040 and MW-0030F were
designed to study varying levels of RG size and content. Just as in the control mixtures
(MW-0000A and MW-0000B), these mixtures contain white cement. Their PFA content
is increased to 30 percent by weight of total cement from the 15 percent used in the
control mixtures. These changes were made in order to maximize ASR mitigating factors
in these mixtures. It should be noted that MW-3000 is the only mixture, aside from MG-
3030, to contain fine aggregate replacement. Additional mixtures containing fine
aggregate replaced with fine-size glass were not included due to the results obtained
during mixing of MG-3030 and MW-3000. Due to issues with workability, observed
segregation and bleeding as well as possible sugar contamination, fine aggregate
replacement was not further evaluated. Full detail of these results is provided in Chapter
5.
Mixtures containing coarse glass as a 40 percent by weight of total coarse
aggregate were studied threefold. The use of gray versus white cement (MG-0040 versus
MW-0040) and the use of an ASR mitigating liquid admixture (MG-0040X) were
investigated. In testing the ASR mitigating capabilities of Sika® Control ASR, gray
cement was used in conjunction with the highest percentage replacement of coarse
aggregate with coarse glass.
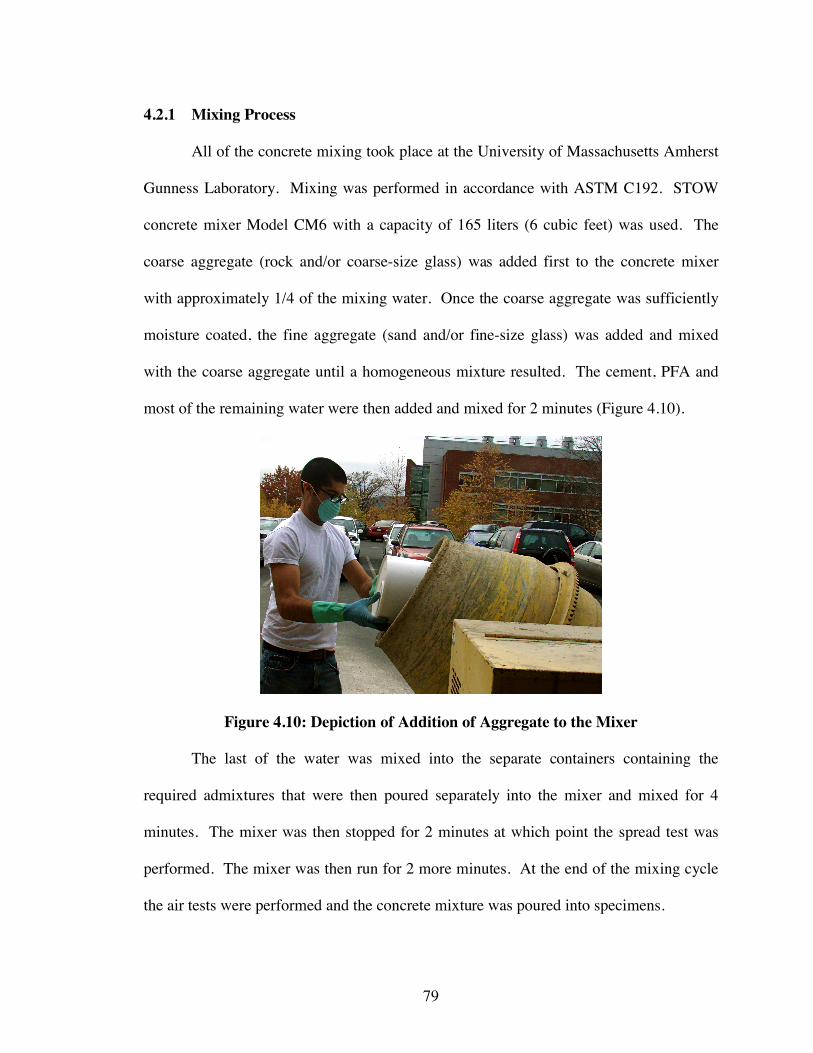
79
4.2.1 Mixing Process
All of the concrete mixing took place at the University of Massachusetts Amherst
Gunness Laboratory. Mixing was performed in accordance with ASTM C192. STOW
concrete mixer Model CM6 with a capacity of 165 liters (6 cubic feet) was used. The
coarse aggregate (rock and/or coarse-size glass) was added first to the concrete mixer
with approximately 1/4 of the mixing water. Once the coarse aggregate was sufficiently
moisture coated, the fine aggregate (sand and/or fine-size glass) was added and mixed
with the coarse aggregate until a homogeneous mixture resulted. The cement, PFA and
most of the remaining water were then added and mixed for 2 minutes (Figure 4.10).
Figure 4.10: Depiction of Addition of Aggregate to the Mixer
The last of the water was mixed into the separate containers containing the
required admixtures that were then poured separately into the mixer and mixed for 4
minutes. The mixer was then stopped for 2 minutes at which point the spread test was
performed. The mixer was then run for 2 more minutes. At the end of the mixing cycle
the air tests were performed and the concrete mixture was poured into specimens.
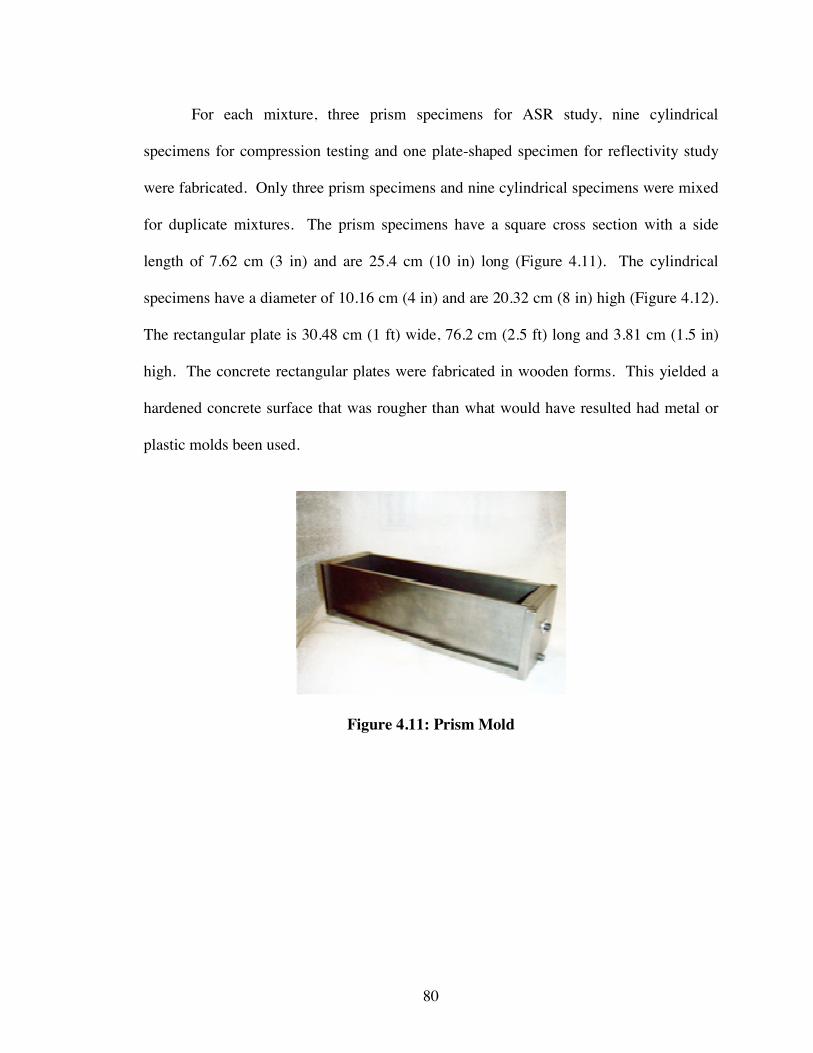
80
For each mixture, three prism specimens for ASR study, nine cylindrical
specimens for compression testing and one plate-shaped specimen for reflectivity study
were fabricated. Only three prism specimens and nine cylindrical specimens were mixed
for duplicate mixtures. The prism specimens have a square cross section with a side
length of 7.62 cm (3 in) and are 25.4 cm (10 in) long (Figure 4.11). The cylindrical
specimens have a diameter of 10.16 cm (4 in) and are 20.32 cm (8 in) high (Figure 4.12).
The rectangular plate is 30.48 cm (1 ft) wide, 76.2 cm (2.5 ft) long and 3.81 cm (1.5 in)
high. The concrete rectangular plates were fabricated in wooden forms. This yielded a
hardened concrete surface that was rougher than what would have resulted had metal or
plastic molds been used.
Figure 4.11: Prism Mold
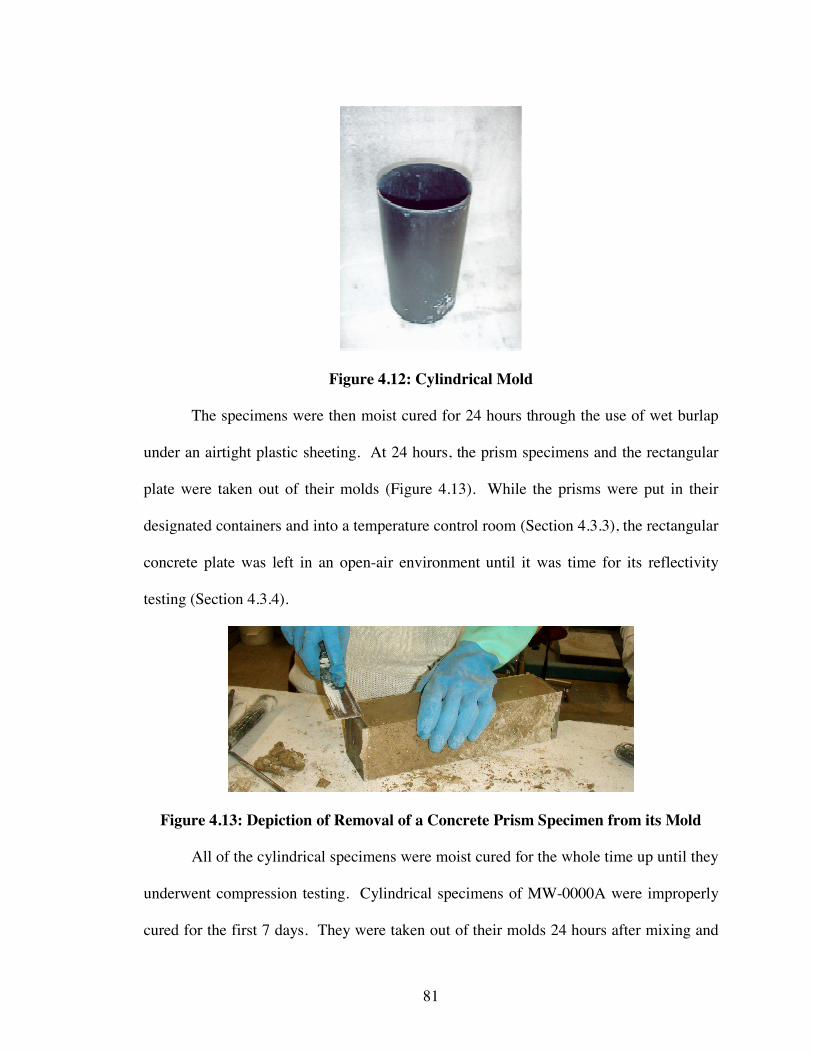
81
Figure 4.12: Cylindrical Mold
The specimens were then moist cured for 24 hours through the use of wet burlap
under an airtight plastic sheeting. At 24 hours, the prism specimens and the rectangular
plate were taken out of their molds (Figure 4.13). While the prisms were put in their
designated containers and into a temperature control room (Section 4.3.3), the rectangular
concrete plate was left in an open-air environment until it was time for its reflectivity
testing (Section 4.3.4).
Figure 4.13: Depiction of Removal of a Concrete Prism Specimen from its Mold
All of the cylindrical specimens were moist cured for the whole time up until they
underwent compression testing. Cylindrical specimens of MW-0000A were improperly
cured for the first 7 days. They were taken out of their molds 24 hours after mixing and
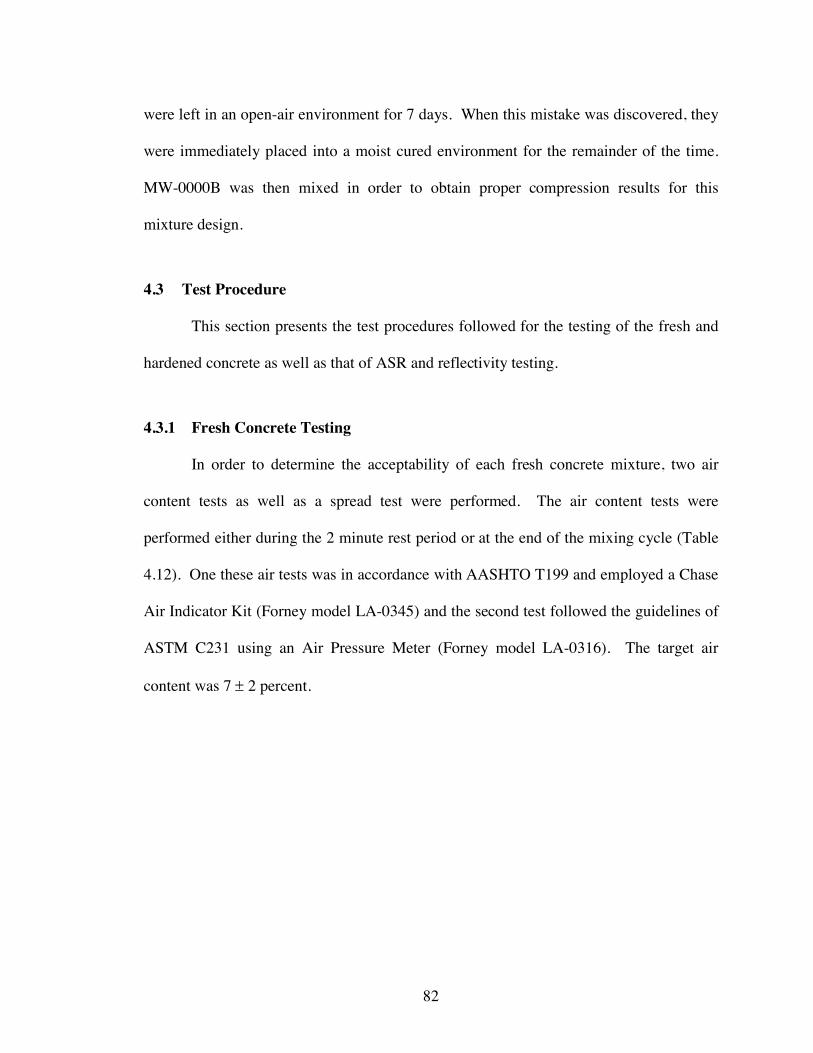
82
were left in an open-air environment for 7 days. When this mistake was discovered, they
were immediately placed into a moist cured environment for the remainder of the time.
MW-0000B was then mixed in order to obtain proper compression results for this
mixture design.
4.3 Test Procedure
This section presents the test procedures followed for the testing of the fresh and
hardened concrete as well as that of ASR and reflectivity testing.
4.3.1 Fresh Concrete Testing
In order to determine the acceptability of each fresh concrete mixture, two air
content tests as well as a spread test were performed. The air content tests were
performed either during the 2 minute rest period or at the end of the mixing cycle (Table
4.12). One these air tests was in accordance with AASHTO T199 and employed a Chase
Air Indicator Kit (Forney model LA-0345) and the second test followed the guidelines of
ASTM C231 using an Air Pressure Meter (Forney model LA-0316). The target air
content was 7 2 percent.

83
Table 4.12: Time of Air Test for Each Mixture
Mixture Time of Test Chase Air Indicator Kit Air Pressure Meter
MW-0000A @ 2min rest @ end of mixing MW-0000B @ 2min rest @ end of mixing MG-3030 @ 2min rest @ end of mixing MW-3000 @ 2min rest @ end of mixing MW-0010 @ 2min rest @ end of mixing
MW-0030A @ end of mixing @ end of mixing MW-0030B @ end of mixing @ end of mixing MG-0040 @ end of mixing @ end of mixing MW-0040 @ end of mixing @ end of mixing MG-0040X @ end of mixing @ end of mixing MW-0030F @ end of mixing @ end of mixing
The spread test for self-consolidating concrete followed the guidelines of ASTM
C1611. A slump cone (Forney model LA-0275) was employed for this test. To perform
this test, the slump cone was placed onto a smooth surface and a sample of the fresh
concrete was poured into the cone. No rodding or consolidation methods were required
with self-consolidating mixtures, as used in this project. The cone was then raised,
allowing the concrete to spread. The spread diameter aimed for was 60 5 cm (24 2
in).
84
4.3.2 Hardened Concrete Testing
The compression testing of the cylinders described in section 4.2.1 was carried
out in accordance with ASTM C39. The machine employed for this test was the
Compression Testing Machine (Forney model FX-500). Readings were taken at 7, 28
and 56 days. At each date a minimum of 3 cylinders were tested and the results were
averaged. Design strength of the mixtures was required to be 28 MPa (4,000 psi).
4.3.3 ASR Testing
ASR was studied in accordance with ASTM C1293. This test is used to evaluate
the resistance of the concrete to ASR with the expansion limit of 0.04 percent at 2 years
(Lane, 1999). Section 4.1.1 describes all of the possible test standards that may be
employed to study ASR. Of the available options, test standards ASTM C1293 and BS
812-123 are listed as optimum. For this reason, ASTM C1293 was chosen.
In accordance with this standard an initial length of the prism specimens was
recorded upon their removal from the molds using a length comparator (Forney model
LA-4449-50). These specimens were then placed into a 22 L (5.8 gal) container that was
then stored in a temperature control room at the University of Massachusetts Amherst
ElabII building. The temperature of the room was kept at 37C (98.6F). Subsequent
readings were taken at 7 days, 28 days, 56 days and 3 months. Follow up readings are
scheduled for 6, 12, 18 and 24 months.
These containers contain an airtight lid and a perforated base for the specimens
under which there is a pool of water (Figure 4.14). Burlap lines the inside walls of the
containers and extends into the water to ensure constant humidity within the containers.
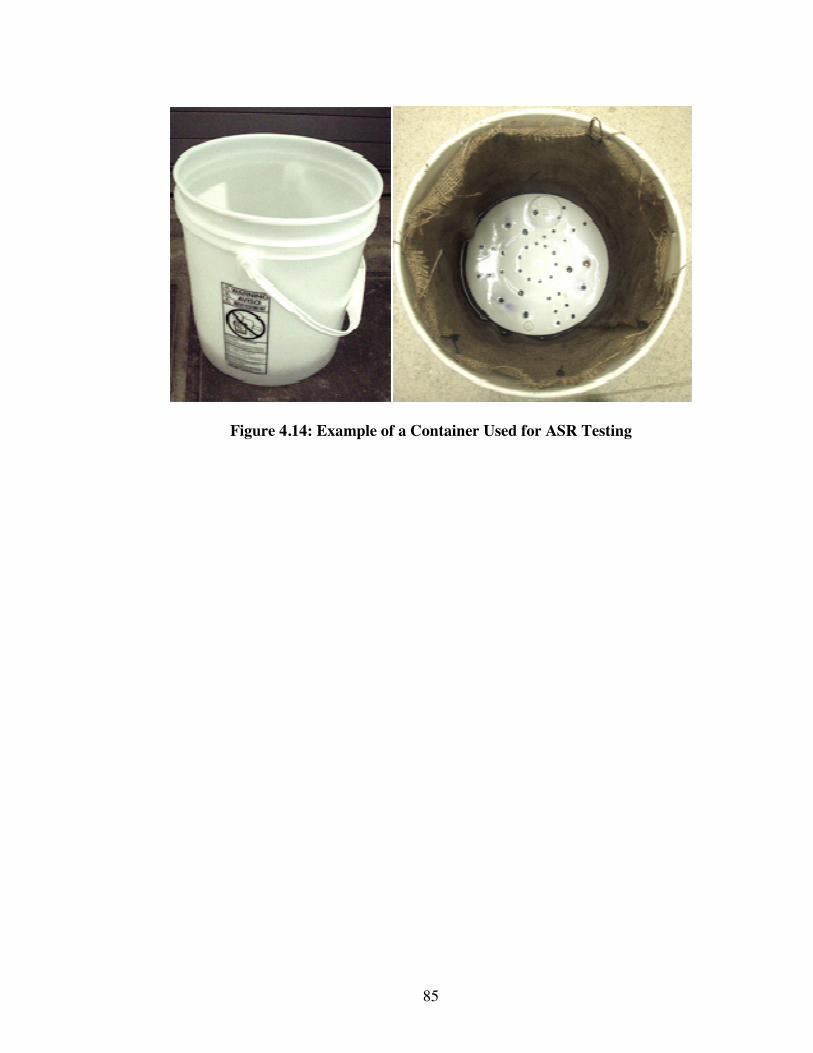
85
Figure 4.14: Example of a Container Used for ASR Testing
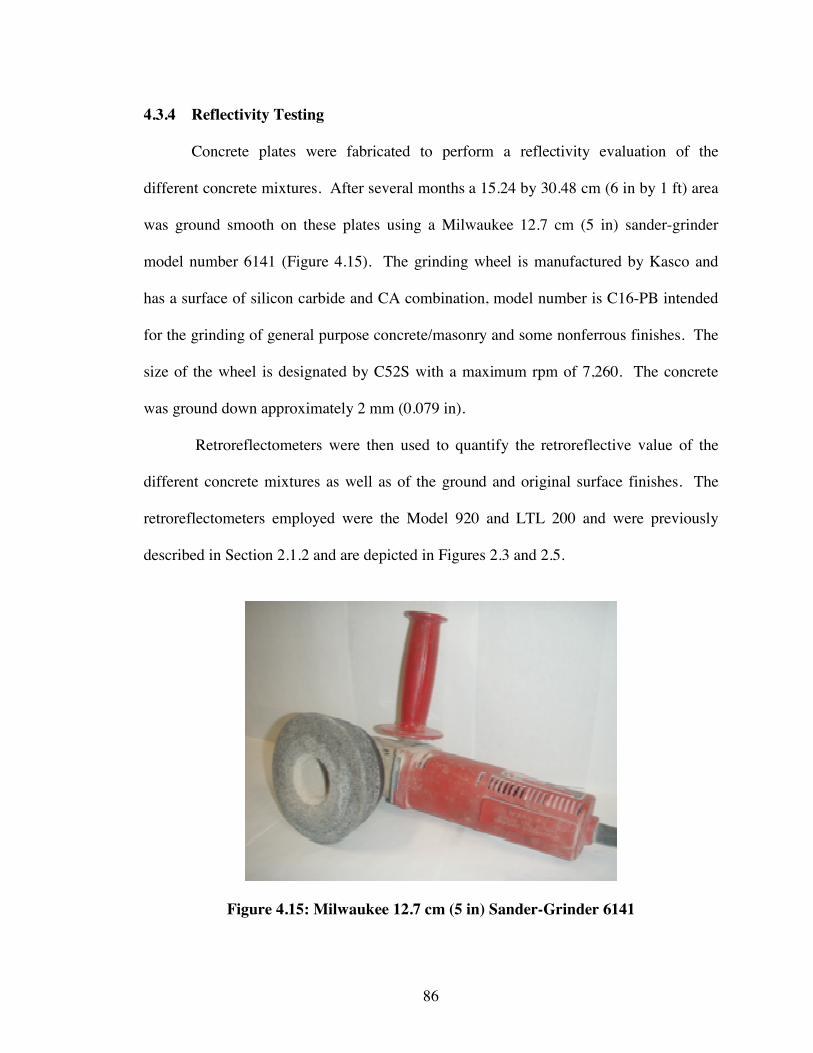
86
4.3.4 Reflectivity Testing
Concrete plates were fabricated to perform a reflectivity evaluation of the
different concrete mixtures. After several months a 15.24 by 30.48 cm (6 in by 1 ft) area
was ground smooth on these plates using a Milwaukee 12.7 cm (5 in) sander-grinder
model number 6141 (Figure 4.15). The grinding wheel is manufactured by Kasco and
has a surface of silicon carbide and CA combination, model number is C16-PB intended
for the grinding of general purpose concrete/masonry and some nonferrous finishes. The
size of the wheel is designated by C52S with a maximum rpm of 7,260. The concrete
was ground down approximately 2 mm (0.079 in).
Retroreflectometers were then used to quantify the retroreflective value of the
different concrete mixtures as well as of the ground and original surface finishes. The
retroreflectometers employed were the Model 920 and LTL 200 and were previously
described in Section 2.1.2 and are depicted in Figures 2.3 and 2.5.
Figure 4.15: Milwaukee 12.7 cm (5 in) Sander-Grinder 6141
87
CHAPTER 5
RESULTS OF GLASS CULLET AGGREGATE TESTING
This chapter presents the results from the laboratory testing of the concrete
mixtures described in Chapter 4. The results pertaining to the fresh and hardened
concrete testing as well as the ASR and reflectivity testing are evaluated.
5.1 Fresh Concrete Results
It was noted that due to the flowable nature of self-consolidating concrete
mixtures there was a tendency for the cement paste to flow into the petcocks of the Air
Pressure Meter, potentially resulting in erroneous air readings if topping off water
addition did not fully fill the chamber. Therefore caution is needed when interpreting air
readings for these mixture designs, as incomplete topping off could result in excessively
high apparent air content readings. For all Air Pressure Meter readings, it was noted that
due to the flowable nature of the paste, water flowing out of the petcocks contained high
paste content and often clogged the petcock. This led to either a new test being run or an
assumption if blockages could not be overcome. However, in all cases water flowing
from the petcock was of lower volume than would be typical and required significant
pressure from the bulb applying the input water.
Difficulties were also encountered in using the Chase Indicator Kit to obtain air
contents. The test called for the collection of a representative sample of mortar. To
properly execute this test, particles of sand that would be retrained in a No.10 sieve, 2
mm (0.079 in), needed to left out of the mortar sample. This proved to be a difficult task
causing some of the aggregate to get lodged in the narrow neck of the tube, requiring
tests to be re-done. In striking excess mortar sample from top of cup the flowable nature
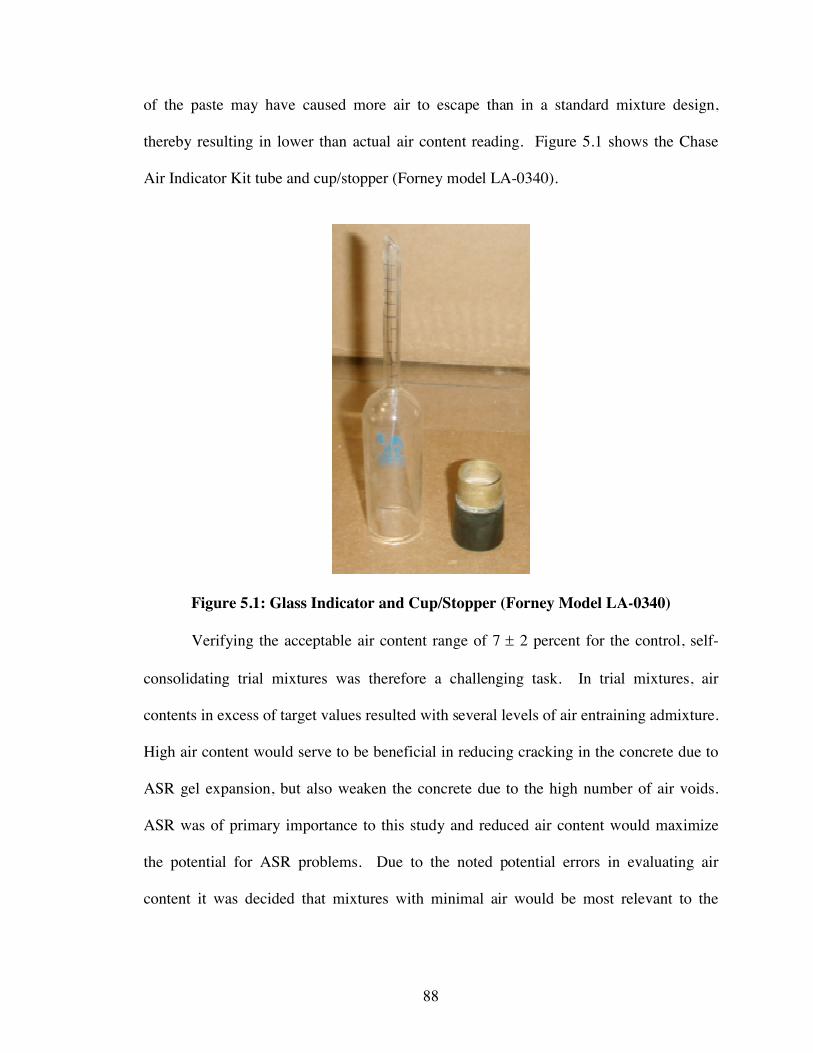
88
of the paste may have caused more air to escape than in a standard mixture design,
thereby resulting in lower than actual air content reading. Figure 5.1 shows the Chase
Air Indicator Kit tube and cup/stopper (Forney model LA-0340).
Figure 5.1: Glass Indicator and Cup/Stopper (Forney Model LA-0340)
Verifying the acceptable air content range of 7 2 percent for the control, self-
consolidating trial mixtures was therefore a challenging task. In trial mixtures, air
contents in excess of target values resulted with several levels of air entraining admixture.
High air content would serve to be beneficial in reducing cracking in the concrete due to
ASR gel expansion, but also weaken the concrete due to the high number of air voids.
ASR was of primary importance to this study and reduced air content would maximize
the potential for ASR problems. Due to the noted potential errors in evaluating air
content it was decided that mixtures with minimal air would be most relevant to the
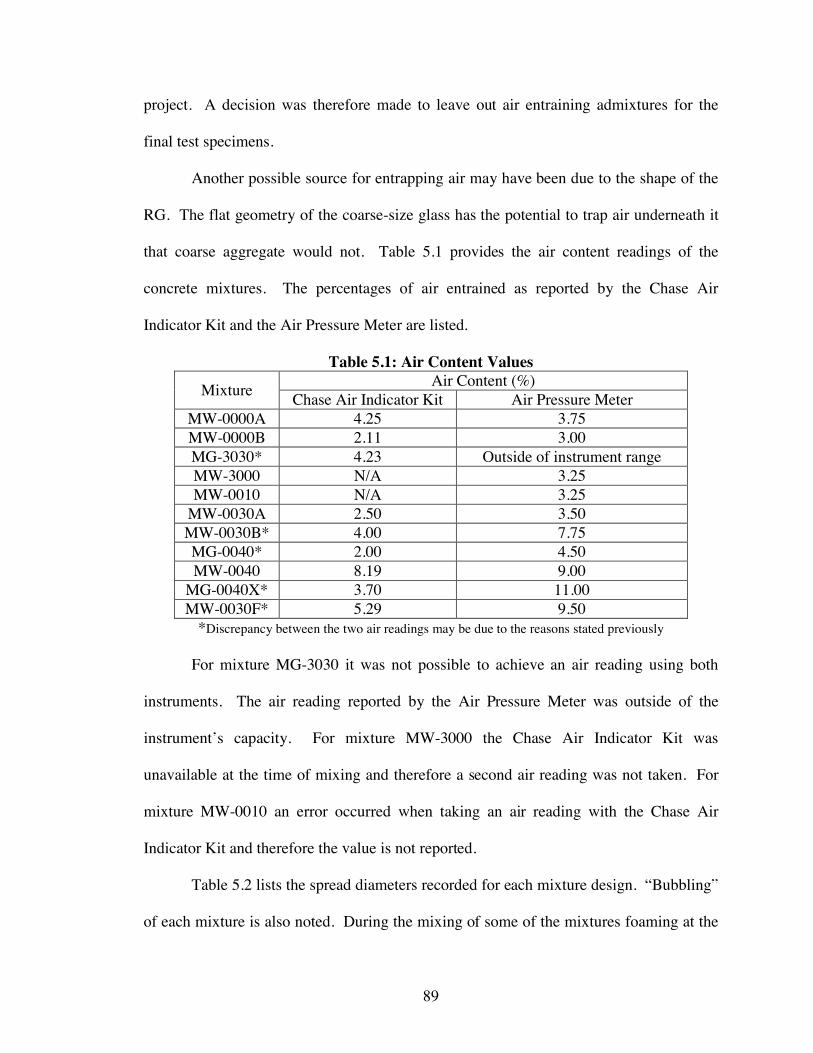
89
project. A decision was therefore made to leave out air entraining admixtures for the
final test specimens.
Another possible source for entrapping air may have been due to the shape of the
RG. The flat geometry of the coarse-size glass has the potential to trap air underneath it
that coarse aggregate would not. Table 5.1 provides the air content readings of the
concrete mixtures. The percentages of air entrained as reported by the Chase Air
Indicator Kit and the Air Pressure Meter are listed.
Table 5.1: Air Content Values
Mixture Air Content (%) Chase Air Indicator Kit Air Pressure Meter
MW-0000A 4.25 3.75 MW-0000B 2.11 3.00 MG-3030* 4.23 Outside of instrument range MW-3000 N/A 3.25 MW-0010 N/A 3.25
MW-0030A 2.50 3.50 MW-0030B* 4.00 7.75 MG-0040* 2.00 4.50 MW-0040 8.19 9.00
MG-0040X* 3.70 11.00 MW-0030F* 5.29 9.50
*Discrepancy between the two air readings may be due to the reasons stated previously
For mixture MG-3030 it was not possible to achieve an air reading using both
instruments. The air reading reported by the Air Pressure Meter was outside of the
instrument’s capacity. For mixture MW-3000 the Chase Air Indicator Kit was
unavailable at the time of mixing and therefore a second air reading was not taken. For
mixture MW-0010 an error occurred when taking an air reading with the Chase Air
Indicator Kit and therefore the value is not reported.
Table 5.2 lists the spread diameters recorded for each mixture design. “Bubbling”
of each mixture is also noted. During the mixing of some of the mixtures foaming at the
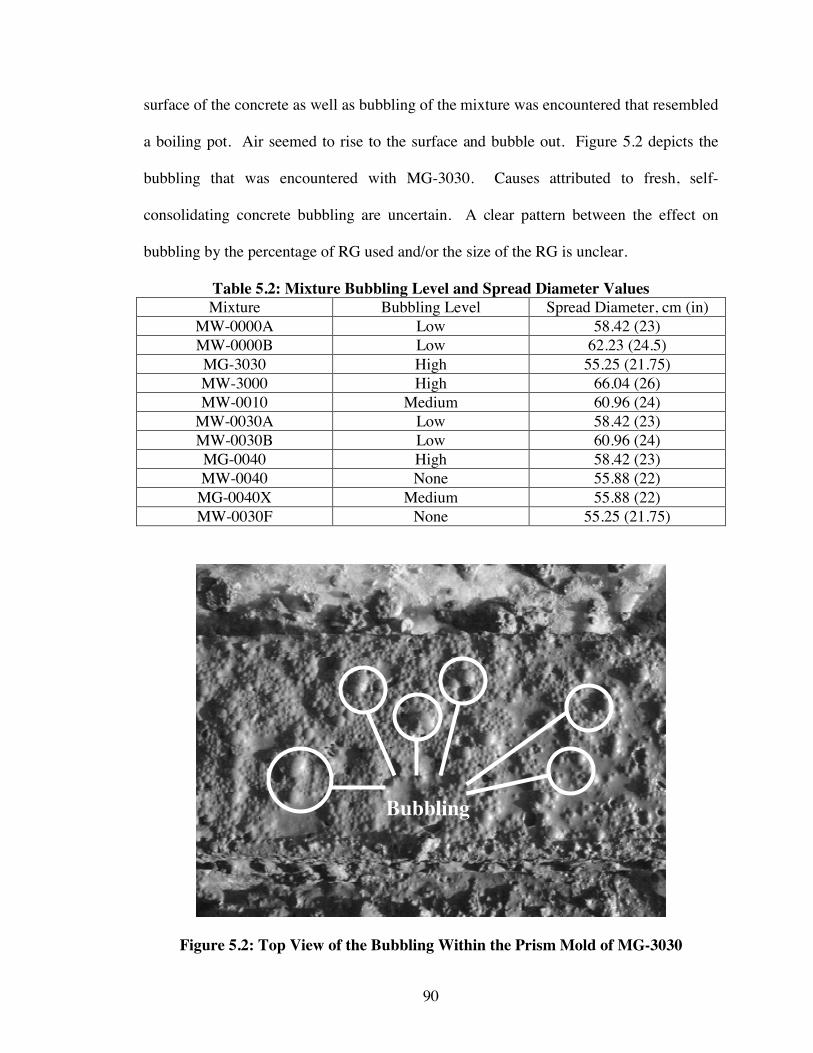
90
surface of the concrete as well as bubbling of the mixture was encountered that resembled
a boiling pot. Air seemed to rise to the surface and bubble out. Figure 5.2 depicts the
bubbling that was encountered with MG-3030. Causes attributed to fresh, self-
consolidating concrete bubbling are uncertain. A clear pattern between the effect on
bubbling by the percentage of RG used and/or the size of the RG is unclear.
Table 5.2: Mixture Bubbling Level and Spread Diameter Values Mixture Bubbling Level Spread Diameter, cm (in)
MW-0000A Low 58.42 (23) MW-0000B Low 62.23 (24.5) MG-3030 High 55.25 (21.75) MW-3000 High 66.04 (26) MW-0010 Medium 60.96 (24)
MW-0030A Low 58.42 (23) MW-0030B Low 60.96 (24) MG-0040 High 58.42 (23) MW-0040 None 55.88 (22) MG-0040X Medium 55.88 (22) MW-0030F None 55.25 (21.75)
Figure 5.2: Top View of the Bubbling Within the Prism Mold of MG-3030
Bubbling
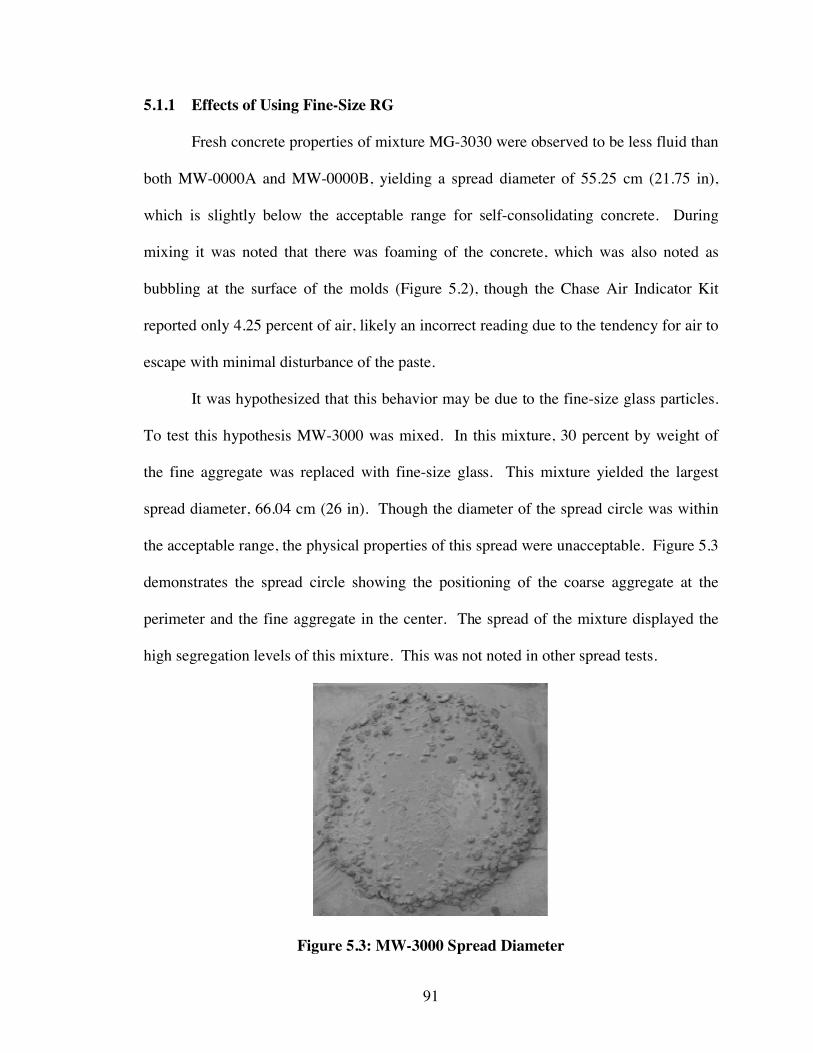
91
5.1.1 Effects of Using Fine-Size RG
Fresh concrete properties of mixture MG-3030 were observed to be less fluid than
both MW-0000A and MW-0000B, yielding a spread diameter of 55.25 cm (21.75 in),
which is slightly below the acceptable range for self-consolidating concrete. During
mixing it was noted that there was foaming of the concrete, which was also noted as
bubbling at the surface of the molds (Figure 5.2), though the Chase Air Indicator Kit
reported only 4.25 percent of air, likely an incorrect reading due to the tendency for air to
escape with minimal disturbance of the paste.
It was hypothesized that this behavior may be due to the fine-size glass particles.
To test this hypothesis MW-3000 was mixed. In this mixture, 30 percent by weight of
the fine aggregate was replaced with fine-size glass. This mixture yielded the largest
spread diameter, 66.04 cm (26 in). Though the diameter of the spread circle was within
the acceptable range, the physical properties of this spread were unacceptable. Figure 5.3
demonstrates the spread circle showing the positioning of the coarse aggregate at the
perimeter and the fine aggregate in the center. The spread of the mixture displayed the
high segregation levels of this mixture. This was not noted in other spread tests.
Figure 5.3: MW-3000 Spread Diameter
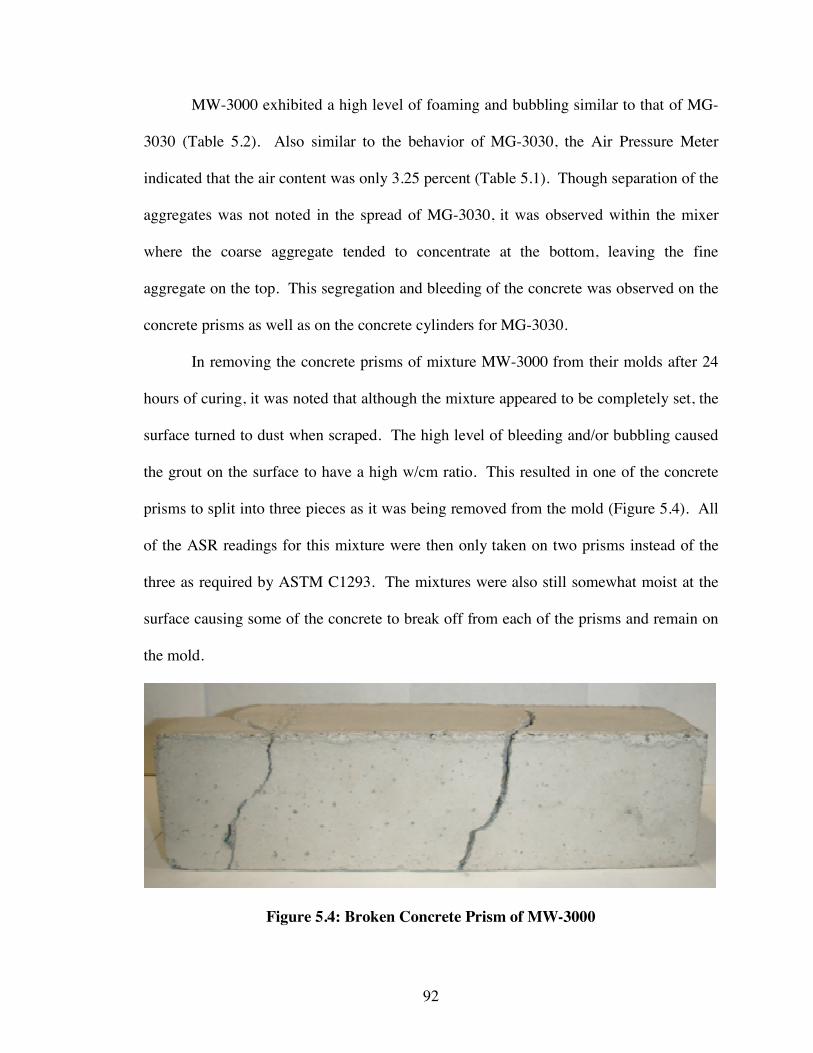
92
MW-3000 exhibited a high level of foaming and bubbling similar to that of MG-
3030 (Table 5.2). Also similar to the behavior of MG-3030, the Air Pressure Meter
indicated that the air content was only 3.25 percent (Table 5.1). Though separation of the
aggregates was not noted in the spread of MG-3030, it was observed within the mixer
where the coarse aggregate tended to concentrate at the bottom, leaving the fine
aggregate on the top. This segregation and bleeding of the concrete was observed on the
concrete prisms as well as on the concrete cylinders for MG-3030.
In removing the concrete prisms of mixture MW-3000 from their molds after 24
hours of curing, it was noted that although the mixture appeared to be completely set, the
surface turned to dust when scraped. The high level of bleeding and/or bubbling caused
the grout on the surface to have a high w/cm ratio. This resulted in one of the concrete
prisms to split into three pieces as it was being removed from the mold (Figure 5.4). All
of the ASR readings for this mixture were then only taken on two prisms instead of the
three as required by ASTM C1293. The mixtures were also still somewhat moist at the
surface causing some of the concrete to break off from each of the prisms and remain on
the mold.
Figure 5.4: Broken Concrete Prism of MW-3000
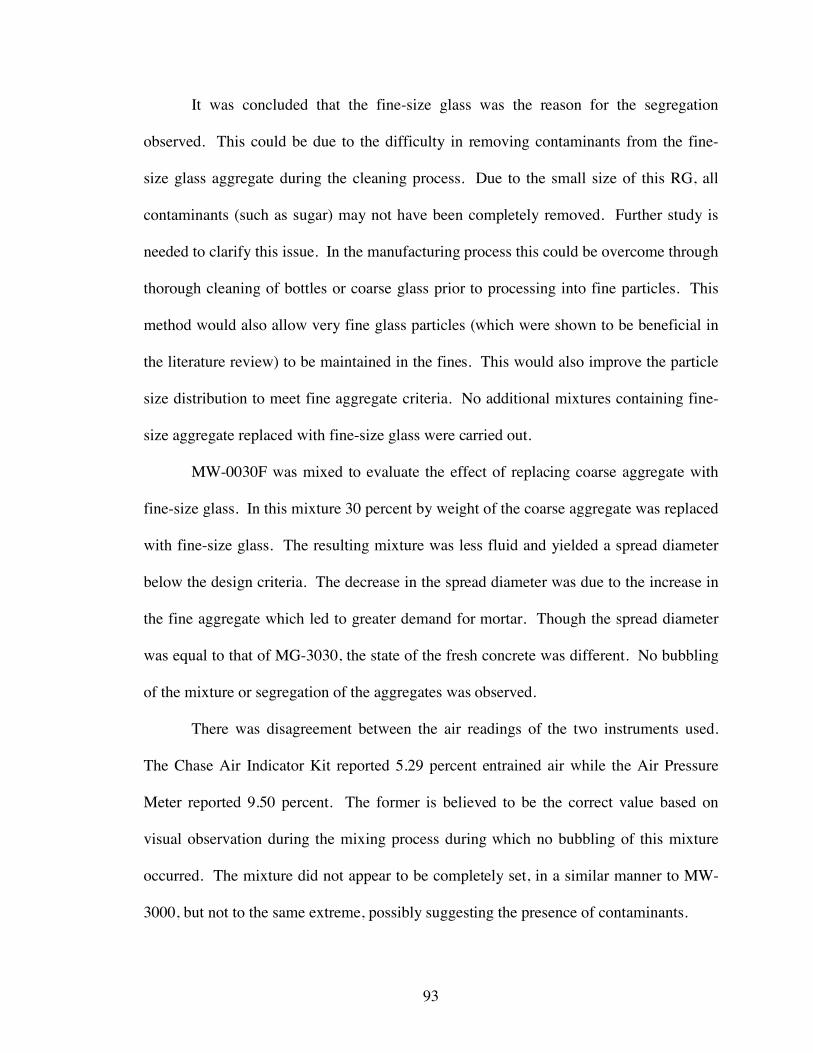
93
It was concluded that the fine-size glass was the reason for the segregation
observed. This could be due to the difficulty in removing contaminants from the fine-
size glass aggregate during the cleaning process. Due to the small size of this RG, all
contaminants (such as sugar) may not have been completely removed. Further study is
needed to clarify this issue. In the manufacturing process this could be overcome through
thorough cleaning of bottles or coarse glass prior to processing into fine particles. This
method would also allow very fine glass particles (which were shown to be beneficial in
the literature review) to be maintained in the fines. This would also improve the particle
size distribution to meet fine aggregate criteria. No additional mixtures containing fine-
size aggregate replaced with fine-size glass were carried out.
MW-0030F was mixed to evaluate the effect of replacing coarse aggregate with
fine-size glass. In this mixture 30 percent by weight of the coarse aggregate was replaced
with fine-size glass. The resulting mixture was less fluid and yielded a spread diameter
below the design criteria. The decrease in the spread diameter was due to the increase in
the fine aggregate which led to greater demand for mortar. Though the spread diameter
was equal to that of MG-3030, the state of the fresh concrete was different. No bubbling
of the mixture or segregation of the aggregates was observed.
There was disagreement between the air readings of the two instruments used.
The Chase Air Indicator Kit reported 5.29 percent entrained air while the Air Pressure
Meter reported 9.50 percent. The former is believed to be the correct value based on
visual observation during the mixing process during which no bubbling of this mixture
occurred. The mixture did not appear to be completely set, in a similar manner to MW-
3000, but not to the same extreme, possibly suggesting the presence of contaminants.
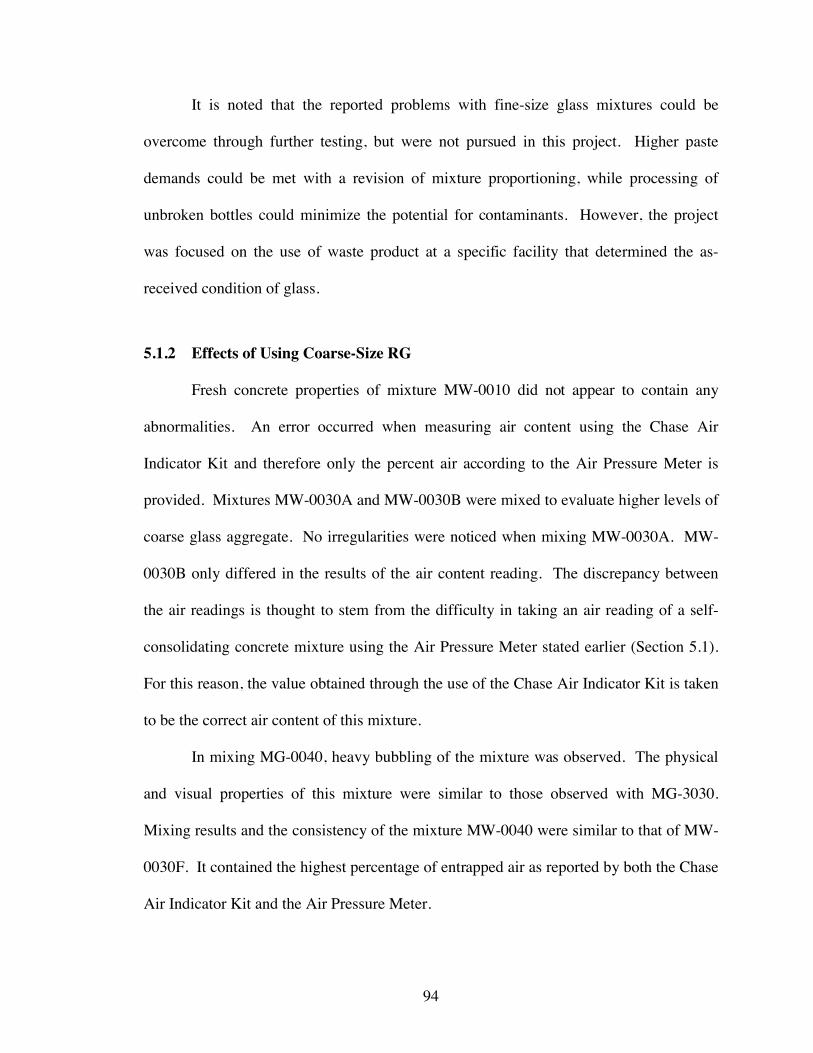
94
It is noted that the reported problems with fine-size glass mixtures could be
overcome through further testing, but were not pursued in this project. Higher paste
demands could be met with a revision of mixture proportioning, while processing of
unbroken bottles could minimize the potential for contaminants. However, the project
was focused on the use of waste product at a specific facility that determined the as-
received condition of glass.
5.1.2 Effects of Using Coarse-Size RG
Fresh concrete properties of mixture MW-0010 did not appear to contain any
abnormalities. An error occurred when measuring air content using the Chase Air
Indicator Kit and therefore only the percent air according to the Air Pressure Meter is
provided. Mixtures MW-0030A and MW-0030B were mixed to evaluate higher levels of
coarse glass aggregate. No irregularities were noticed when mixing MW-0030A. MW-
0030B only differed in the results of the air content reading. The discrepancy between
the air readings is thought to stem from the difficulty in taking an air reading of a self-
consolidating concrete mixture using the Air Pressure Meter stated earlier (Section 5.1).
For this reason, the value obtained through the use of the Chase Air Indicator Kit is taken
to be the correct air content of this mixture.
In mixing MG-0040, heavy bubbling of the mixture was observed. The physical
and visual properties of this mixture were similar to those observed with MG-3030.
Mixing results and the consistency of the mixture MW-0040 were similar to that of MW-
0030F. It contained the highest percentage of entrapped air as reported by both the Chase
Air Indicator Kit and the Air Pressure Meter.
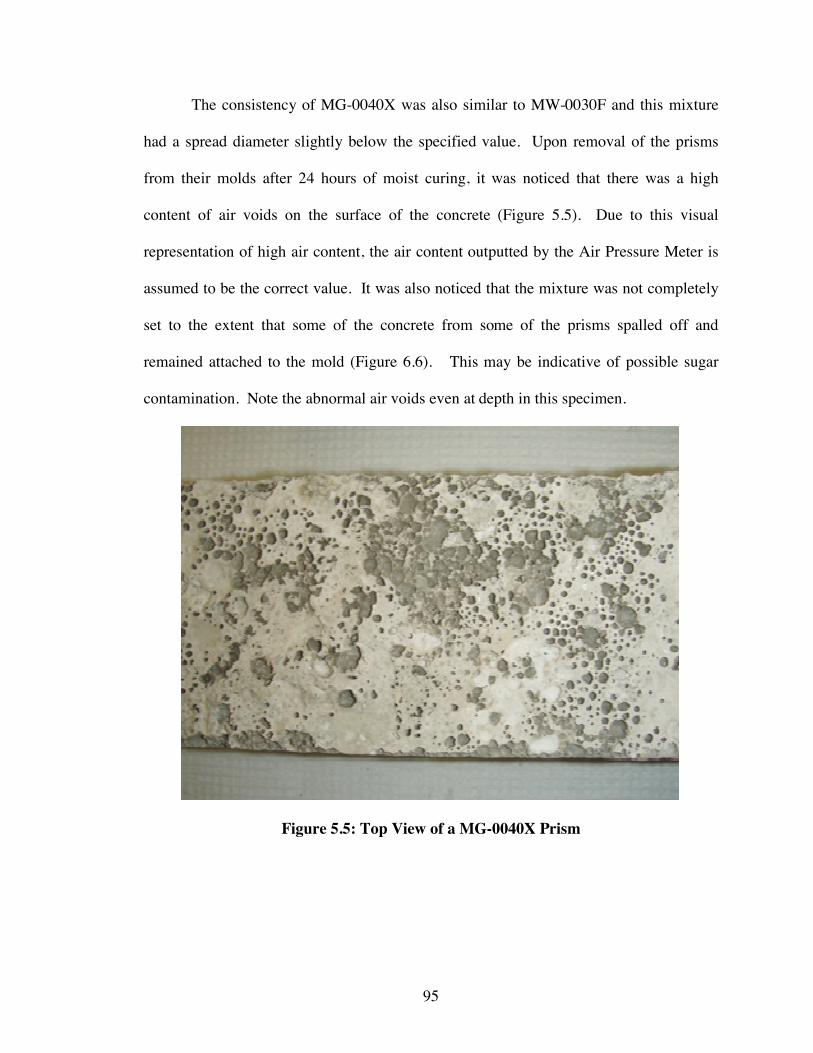
95
The consistency of MG-0040X was also similar to MW-0030F and this mixture
had a spread diameter slightly below the specified value. Upon removal of the prisms
from their molds after 24 hours of moist curing, it was noticed that there was a high
content of air voids on the surface of the concrete (Figure 5.5). Due to this visual
representation of high air content, the air content outputted by the Air Pressure Meter is
assumed to be the correct value. It was also noticed that the mixture was not completely
set to the extent that some of the concrete from some of the prisms spalled off and
remained attached to the mold (Figure 6.6). This may be indicative of possible sugar
contamination. Note the abnormal air voids even at depth in this specimen.
Figure 5.5: Top View of a MG-0040X Prism
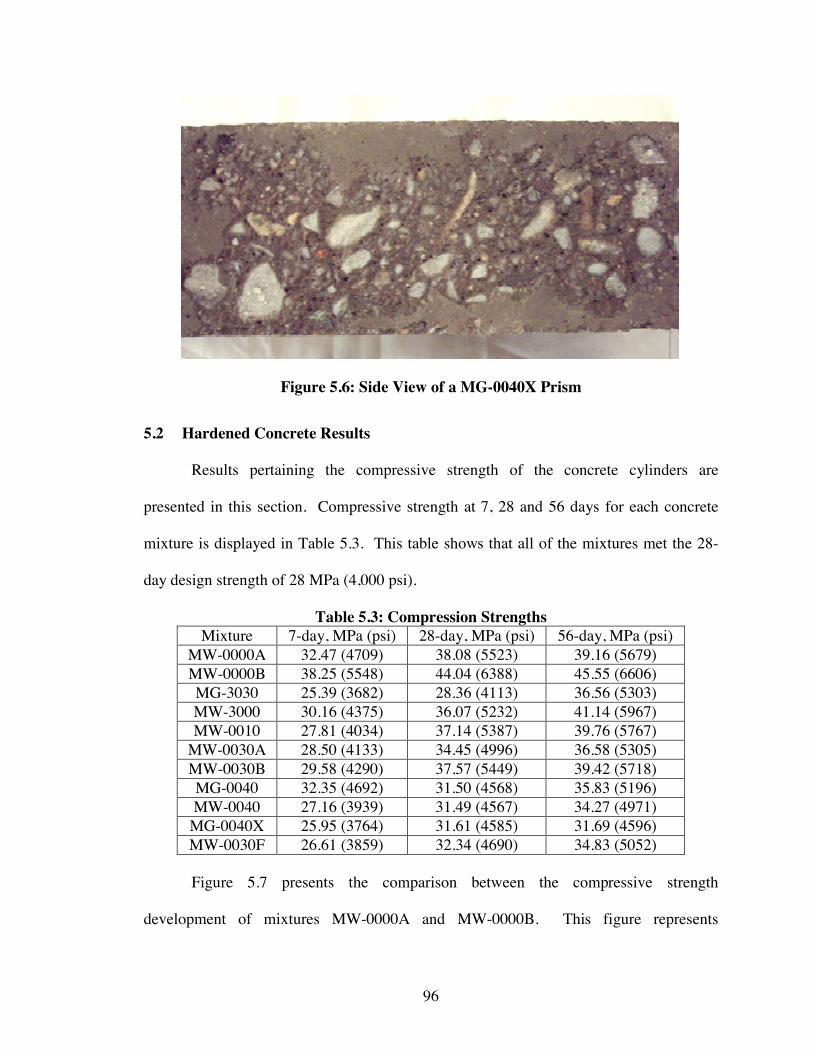
96
Figure 5.6: Side View of a MG-0040X Prism
5.2 Hardened Concrete Results
Results pertaining the compressive strength of the concrete cylinders are
presented in this section. Compressive strength at 7, 28 and 56 days for each concrete
mixture is displayed in Table 5.3. This table shows that all of the mixtures met the 28-
day design strength of 28 MPa (4,000 psi).
Table 5.3: Compression Strengths Mixture 7-day, MPa (psi) 28-day, MPa (psi) 56-day, MPa (psi)
MW-0000A 32.47 (4709) 38.08 (5523) 39.16 (5679) MW-0000B 38.25 (5548) 44.04 (6388) 45.55 (6606) MG-3030 25.39 (3682) 28.36 (4113) 36.56 (5303) MW-3000 30.16 (4375) 36.07 (5232) 41.14 (5967) MW-0010 27.81 (4034) 37.14 (5387) 39.76 (5767)
MW-0030A 28.50 (4133) 34.45 (4996) 36.58 (5305) MW-0030B 29.58 (4290) 37.57 (5449) 39.42 (5718) MG-0040 32.35 (4692) 31.50 (4568) 35.83 (5196) MW-0040 27.16 (3939) 31.49 (4567) 34.27 (4971) MG-0040X 25.95 (3764) 31.61 (4585) 31.69 (4596) MW-0030F 26.61 (3859) 32.34 (4690) 34.83 (5052) Figure 5.7 presents the comparison between the compressive strength
development of mixtures MW-0000A and MW-0000B. This figure represents
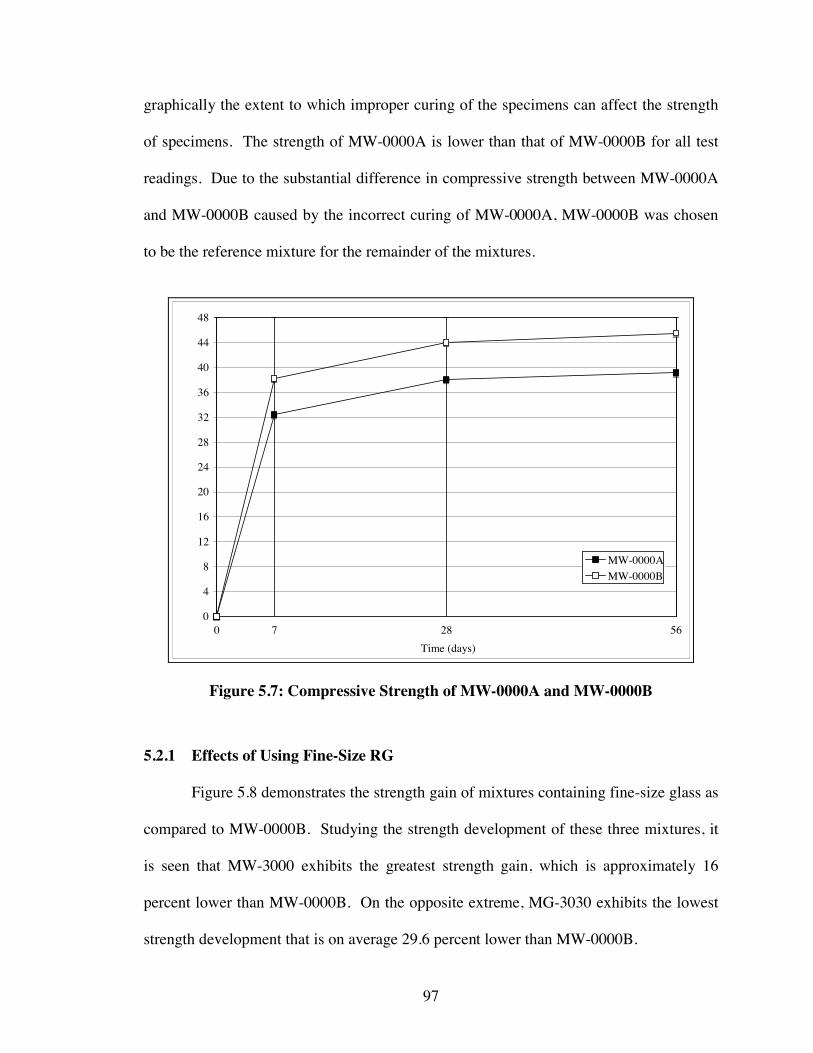
97
graphically the extent to which improper curing of the specimens can affect the strength
of specimens. The strength of MW-0000A is lower than that of MW-0000B for all test
readings. Due to the substantial difference in compressive strength between MW-0000A
and MW-0000B caused by the incorrect curing of MW-0000A, MW-0000B was chosen
to be the reference mixture for the remainder of the mixtures.
0 7 28 560
4
8
12
16
20
24
28
32
36
40
44
48
Time (days)
MW-0000AMW-0000B
Figure 5.7: Compressive Strength of MW-0000A and MW-0000B
5.2.1 Effects of Using Fine-Size RG
Figure 5.8 demonstrates the strength gain of mixtures containing fine-size glass as
compared to MW-0000B. Studying the strength development of these three mixtures, it
is seen that MW-3000 exhibits the greatest strength gain, which is approximately 16
percent lower than MW-0000B. On the opposite extreme, MG-3030 exhibits the lowest
strength development that is on average 29.6 percent lower than MW-0000B.
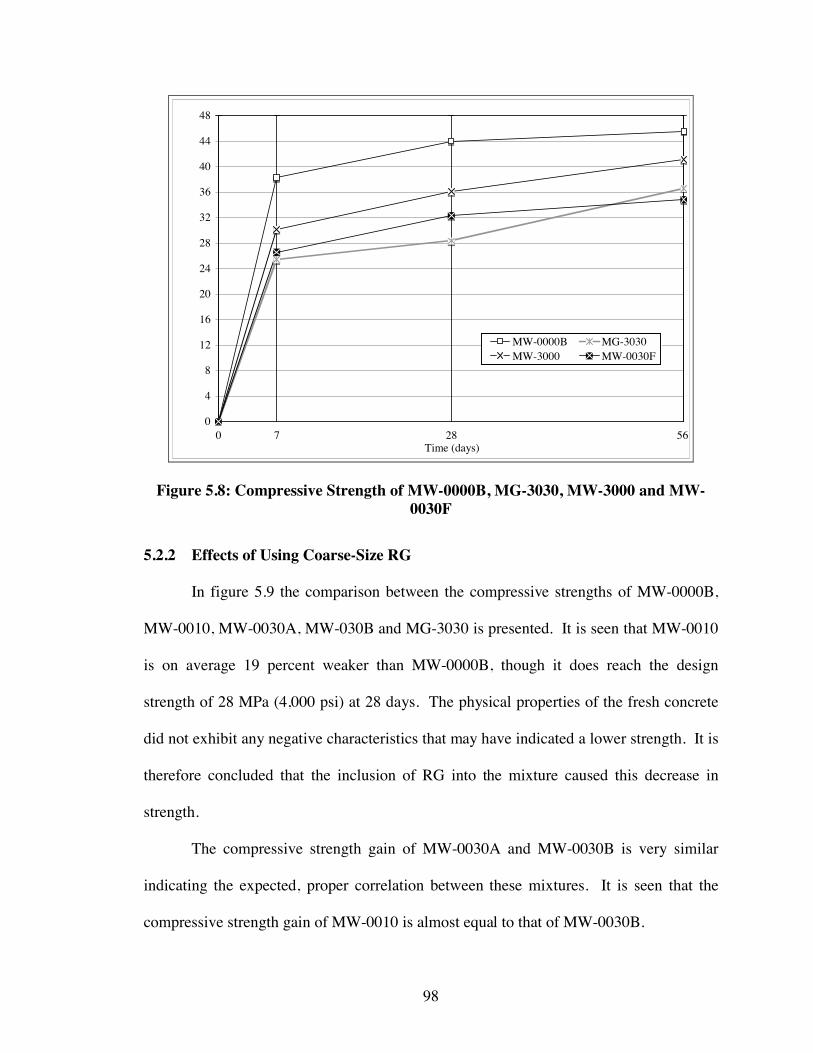
98
0 7 28 560
4
8
12
16
20
24
28
32
36
40
44
48
Time (days)
MW-0000B MG-3030MW-3000 MW-0030F
Figure 5.8: Compressive Strength of MW-0000B, MG-3030, MW-3000 and MW-0030F
5.2.2 Effects of Using Coarse-Size RG
In figure 5.9 the comparison between the compressive strengths of MW-0000B,
MW-0010, MW-0030A, MW-030B and MG-3030 is presented. It is seen that MW-0010
is on average 19 percent weaker than MW-0000B, though it does reach the design
strength of 28 MPa (4,000 psi) at 28 days. The physical properties of the fresh concrete
did not exhibit any negative characteristics that may have indicated a lower strength. It is
therefore concluded that the inclusion of RG into the mixture caused this decrease in
strength.
The compressive strength gain of MW-0030A and MW-0030B is very similar
indicating the expected, proper correlation between these mixtures. It is seen that the
compressive strength gain of MW-0010 is almost equal to that of MW-0030B.
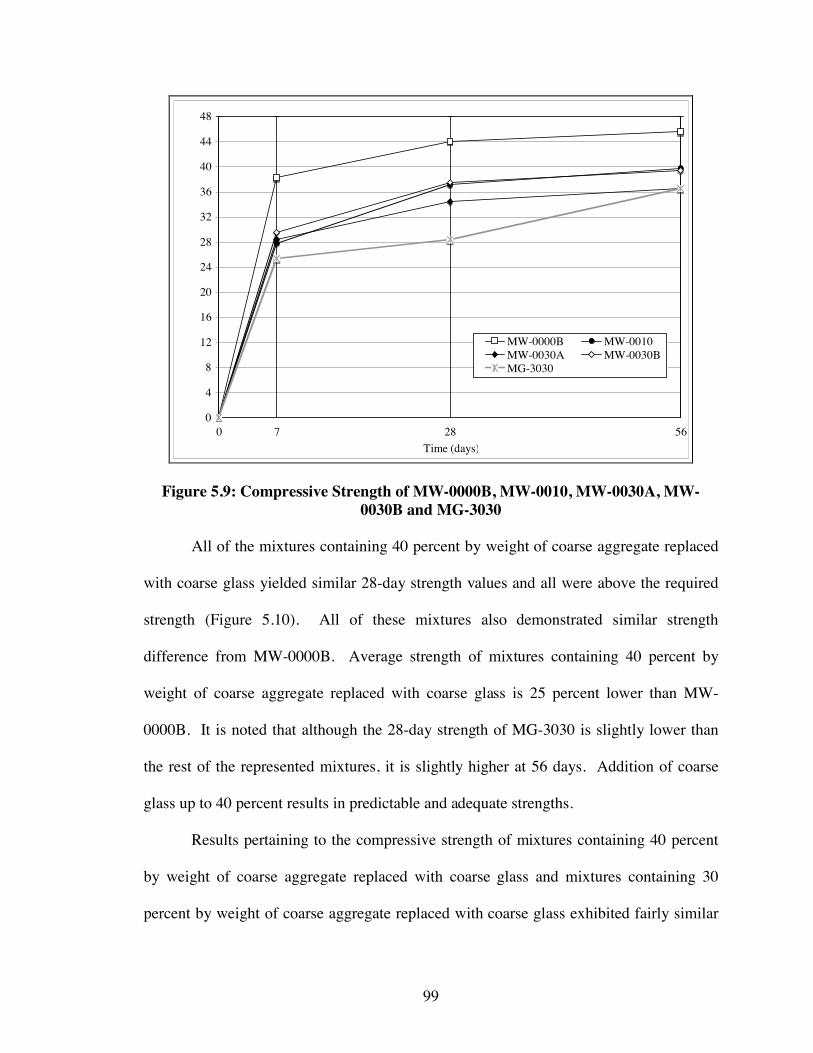
99
5628700
4
8
12
16
20
24
28
32
36
40
44
48
Time (days)
MW-0000B MW-0010MW-0030A MW-0030BMG-3030
Figure 5.9: Compressive Strength of MW-0000B, MW-0010, MW-0030A, MW-0030B and MG-3030
All of the mixtures containing 40 percent by weight of coarse aggregate replaced
with coarse glass yielded similar 28-day strength values and all were above the required
strength (Figure 5.10). All of these mixtures also demonstrated similar strength
difference from MW-0000B. Average strength of mixtures containing 40 percent by
weight of coarse aggregate replaced with coarse glass is 25 percent lower than MW-
0000B. It is noted that although the 28-day strength of MG-3030 is slightly lower than
the rest of the represented mixtures, it is slightly higher at 56 days. Addition of coarse
glass up to 40 percent results in predictable and adequate strengths.
Results pertaining to the compressive strength of mixtures containing 40 percent
by weight of coarse aggregate replaced with coarse glass and mixtures containing 30
percent by weight of coarse aggregate replaced with coarse glass exhibited fairly similar
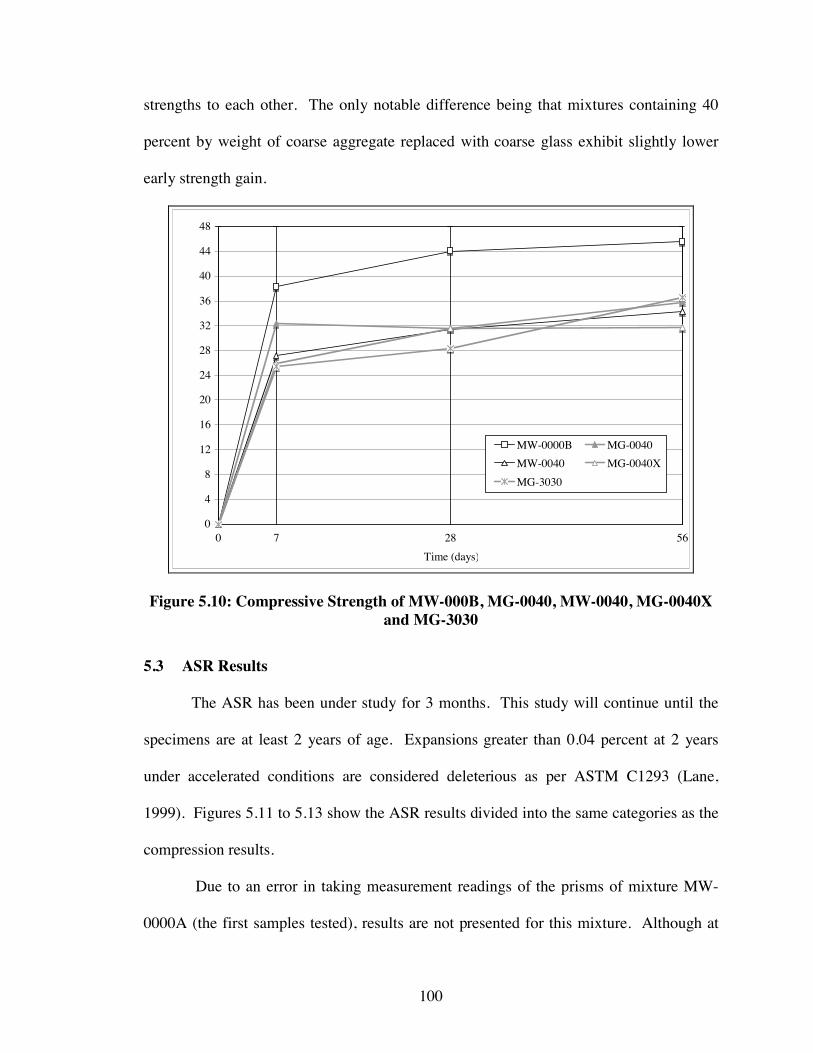
100
strengths to each other. The only notable difference being that mixtures containing 40
percent by weight of coarse aggregate replaced with coarse glass exhibit slightly lower
early strength gain.
5628700
4
8
12
16
20
24
28
32
36
40
44
48
Time (days)
MW-0000B MG-0040MW-0040 MG-0040XMG-3030
Figure 5.10: Compressive Strength of MW-000B, MG-0040, MW-0040, MG-0040X and MG-3030
5.3 ASR Results
The ASR has been under study for 3 months. This study will continue until the
specimens are at least 2 years of age. Expansions greater than 0.04 percent at 2 years
under accelerated conditions are considered deleterious as per ASTM C1293 (Lane,
1999). Figures 5.11 to 5.13 show the ASR results divided into the same categories as the
compression results.
Due to an error in taking measurement readings of the prisms of mixture MW-
0000A (the first samples tested), results are not presented for this mixture. Although at
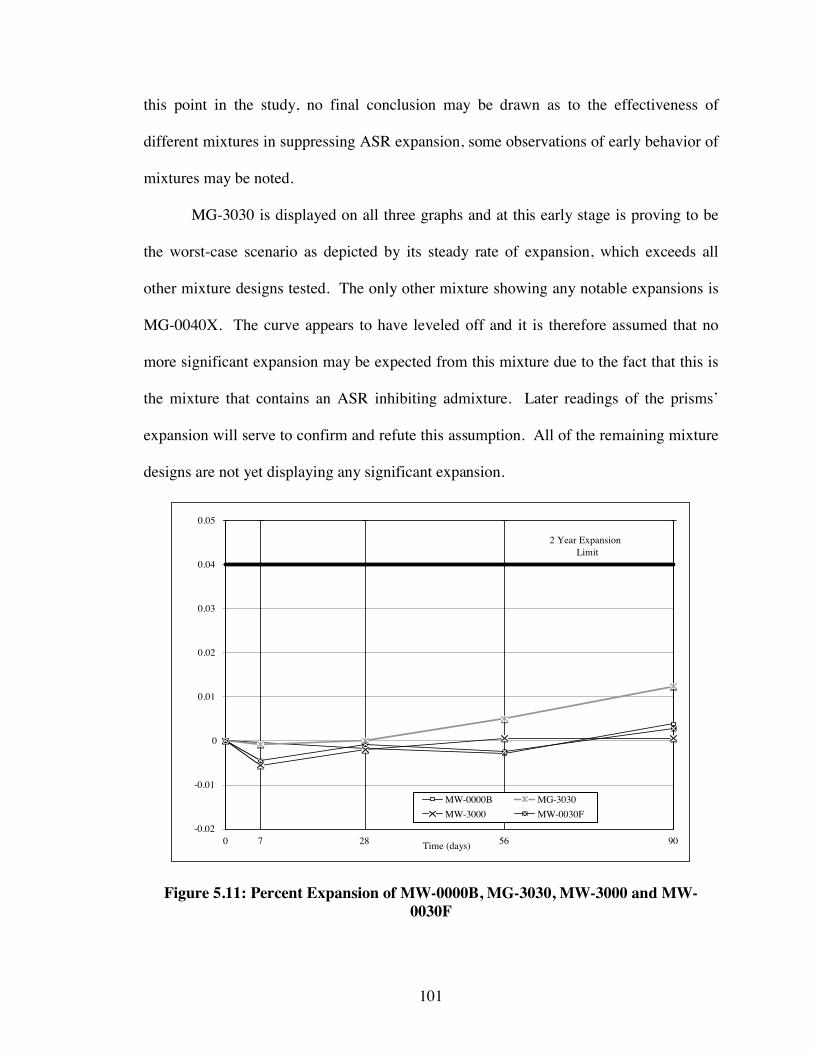
101
this point in the study, no final conclusion may be drawn as to the effectiveness of
different mixtures in suppressing ASR expansion, some observations of early behavior of
mixtures may be noted.
MG-3030 is displayed on all three graphs and at this early stage is proving to be
the worst-case scenario as depicted by its steady rate of expansion, which exceeds all
other mixture designs tested. The only other mixture showing any notable expansions is
MG-0040X. The curve appears to have leveled off and it is therefore assumed that no
more significant expansion may be expected from this mixture due to the fact that this is
the mixture that contains an ASR inhibiting admixture. Later readings of the prisms’
expansion will serve to confirm and refute this assumption. All of the remaining mixture
designs are not yet displaying any significant expansion.
90562870
2 Year Expansion Limit
-0.02
-0.01
0
0.01
0.02
0.03
0.04
0.05
Time (days)
MW-0000B MG-3030MW-3000 MW-0030F
Figure 5.11: Percent Expansion of MW-0000B, MG-3030, MW-3000 and MW-0030F
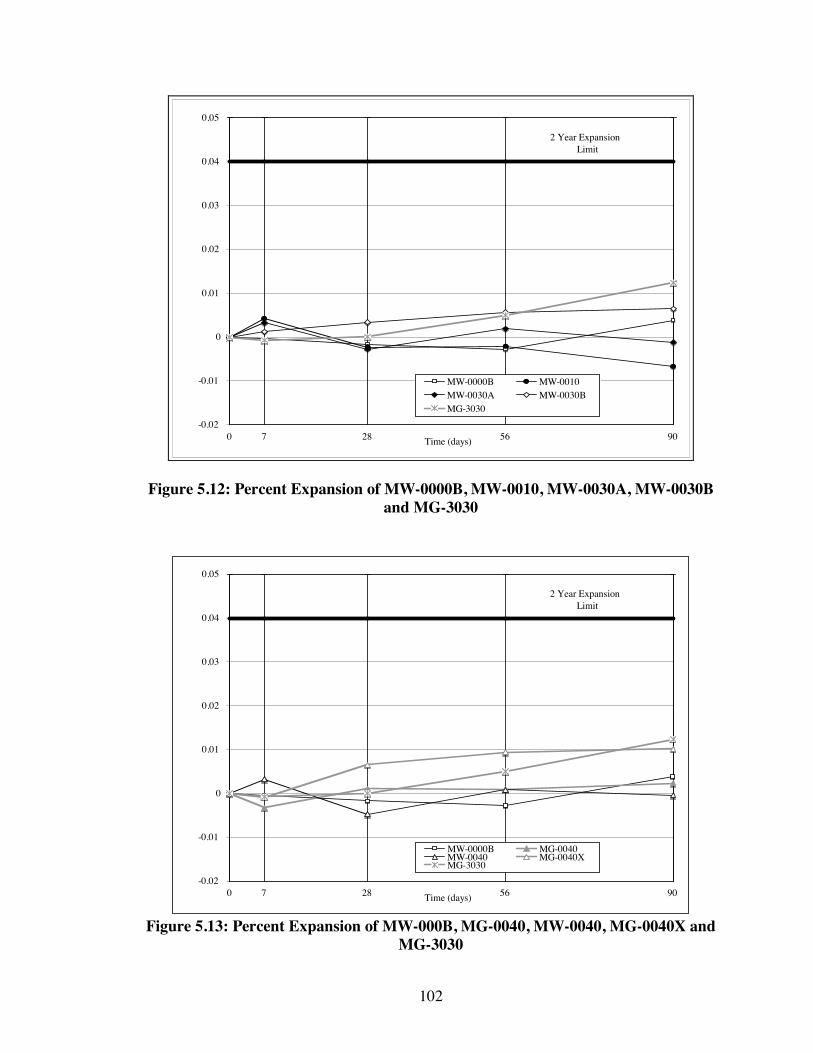
102
0 7 28 56 90
2 Year Expansion Limit
-0.02
-0.01
0
0.01
0.02
0.03
0.04
0.05
Time (days)
MW-0000B MW-0010MW-0030A MW-0030BMG-3030
Figure 5.12: Percent Expansion of MW-0000B, MW-0010, MW-0030A, MW-0030B and MG-3030
90562870
2 Year Expansion Limit
-0.02
-0.01
0
0.01
0.02
0.03
0.04
0.05
Time (days)
MW-0000B MG-0040MW-0040 MG-0040XMG-3030
Figure 5.13: Percent Expansion of MW-000B, MG-0040, MW-0040, MG-0040X and
MG-3030
103
5.4 Reflectivity Results
For objective evaluation of the retroreflectivity of the concrete mixtures
containing varying levels of RG content two instruments were employed; Advanced
Retro Technology, Inc. Model 920 and Delta Light & OpticsLTL 2000. The units
outputted by the Model 920 are cd/m2/lx, while those of LTL 2000 are mcd/m2/lx. Model
920 is a retroreflectometer employed in measuring retroreflectivity of road signage while
LTL 2000 is used for pavement markings.
Model 920 proved to be an improper instrument for the required task. The range
within which this instrument measures is much too high for the retroreflective value that
the concrete specimens are able to provide. However, it is ideally suited to determine
retroreflectivity of any retroreflective materials applied to the surface of a barrier (noted
as potential methods in Section 2.4). LTL 2000, which is used for the measure of
roadway markings, is better suited to properly determine the retroreflectivity of concrete.
After being calibrated, LTL 2000 was first tested against a surface painted with
white primer and a surface painted with high gloss white paint. It was also tested against
a surface covered by black plastic. Five readings were taken of each surface. It was then
used to test the retroreflective value of the chosen representative mixture designs. It was
assumed that retroreflectivity would not vary highly between MW-0000A and MW-0010
or MW-0030A and MW-0040. MG-3030, MW-0030A and MW-3000 were therefore
chosen to be the representative sample of concrete mixtures containing RG aggregate.
The reference mixture, MW-0000A, was also evaluated. Each section was tested both on
the original surface as well as after grinding. Table 5.4 provides the average
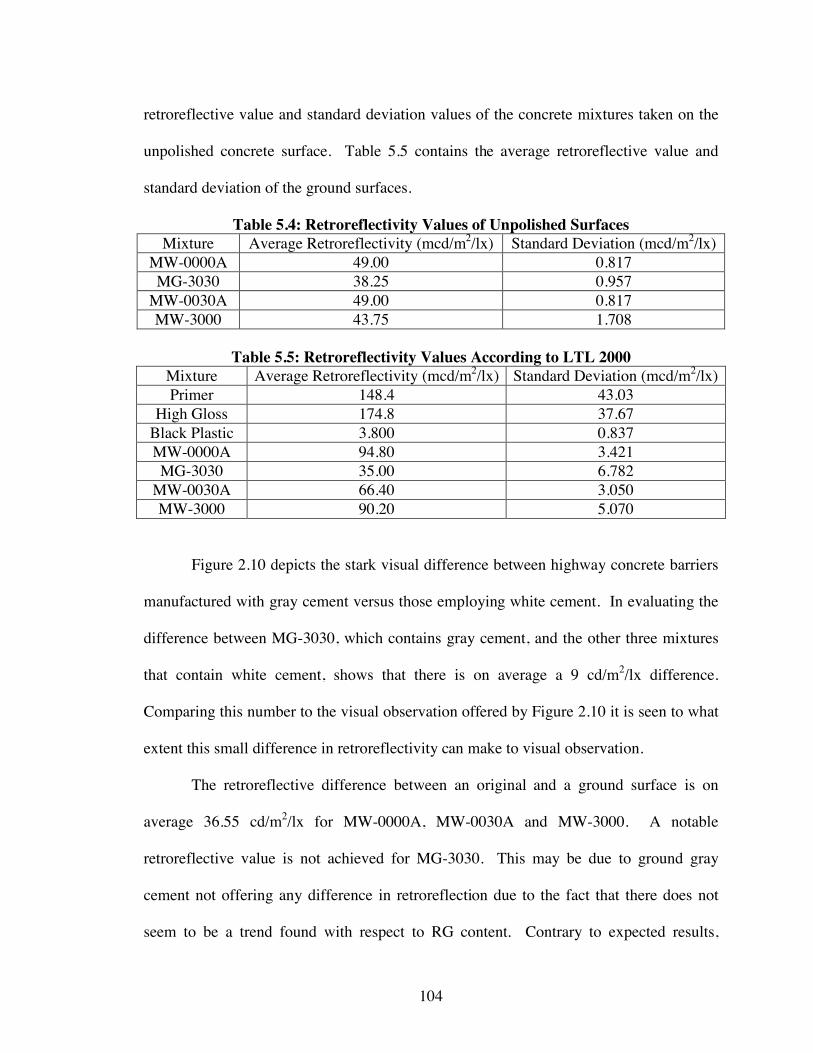
104
retroreflective value and standard deviation values of the concrete mixtures taken on the
unpolished concrete surface. Table 5.5 contains the average retroreflective value and
standard deviation of the ground surfaces.
Table 5.4: Retroreflectivity Values of Unpolished Surfaces Mixture Average Retroreflectivity (mcd/m2/lx) Standard Deviation (mcd/m2/lx)
MW-0000A 49.00 0.817 MG-3030 38.25 0.957
MW-0030A 49.00 0.817 MW-3000 43.75 1.708
Table 5.5: Retroreflectivity Values According to LTL 2000
Mixture Average Retroreflectivity (mcd/m2/lx) Standard Deviation (mcd/m2/lx) Primer 148.4 43.03
High Gloss 174.8 37.67 Black Plastic 3.800 0.837 MW-0000A 94.80 3.421 MG-3030 35.00 6.782
MW-0030A 66.40 3.050 MW-3000 90.20 5.070
Figure 2.10 depicts the stark visual difference between highway concrete barriers
manufactured with gray cement versus those employing white cement. In evaluating the
difference between MG-3030, which contains gray cement, and the other three mixtures
that contain white cement, shows that there is on average a 9 cd/m2/lx difference.
Comparing this number to the visual observation offered by Figure 2.10 it is seen to what
extent this small difference in retroreflectivity can make to visual observation.
The retroreflective difference between an original and a ground surface is on
average 36.55 cd/m2/lx for MW-0000A, MW-0030A and MW-3000. A notable
retroreflective value is not achieved for MG-3030. This may be due to ground gray
cement not offering any difference in retroreflection due to the fact that there does not
seem to be a trend found with respect to RG content. Contrary to expected results,
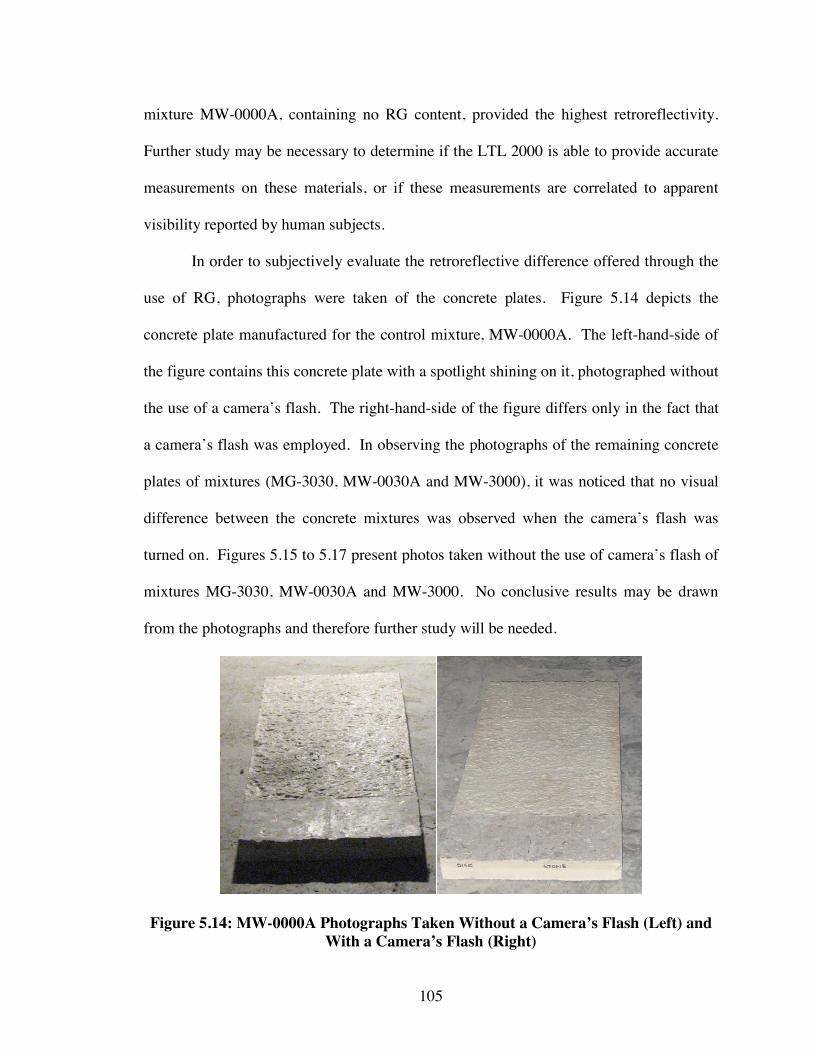
105
mixture MW-0000A, containing no RG content, provided the highest retroreflectivity.
Further study may be necessary to determine if the LTL 2000 is able to provide accurate
measurements on these materials, or if these measurements are correlated to apparent
visibility reported by human subjects.
In order to subjectively evaluate the retroreflective difference offered through the
use of RG, photographs were taken of the concrete plates. Figure 5.14 depicts the
concrete plate manufactured for the control mixture, MW-0000A. The left-hand-side of
the figure contains this concrete plate with a spotlight shining on it, photographed without
the use of a camera’s flash. The right-hand-side of the figure differs only in the fact that
a camera’s flash was employed. In observing the photographs of the remaining concrete
plates of mixtures (MG-3030, MW-0030A and MW-3000), it was noticed that no visual
difference between the concrete mixtures was observed when the camera’s flash was
turned on. Figures 5.15 to 5.17 present photos taken without the use of camera’s flash of
mixtures MG-3030, MW-0030A and MW-3000. No conclusive results may be drawn
from the photographs and therefore further study will be needed.
Figure 5.14: MW-0000A Photographs Taken Without a Camera’s Flash (Left) and With a Camera’s Flash (Right)
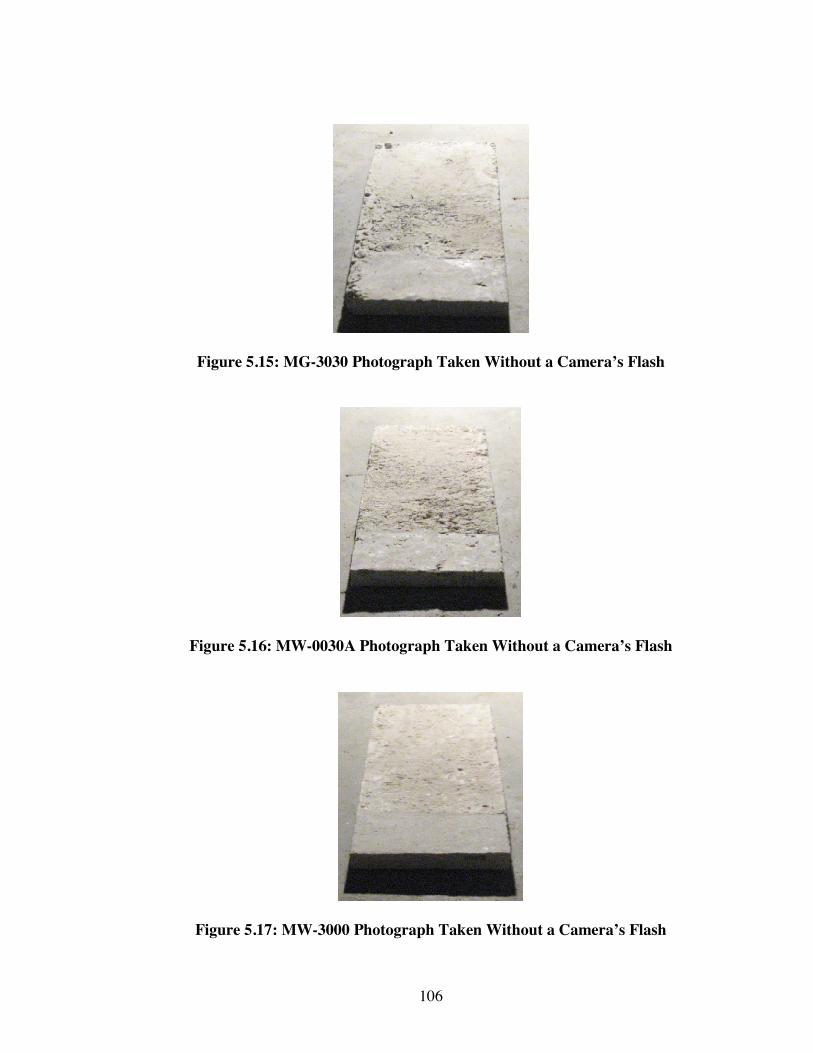
106
Figure 5.15: MG-3030 Photograph Taken Without a Camera’s Flash
Figure 5.16: MW-0030A Photograph Taken Without a Camera’s Flash
Figure 5.17: MW-3000 Photograph Taken Without a Camera’s Flash
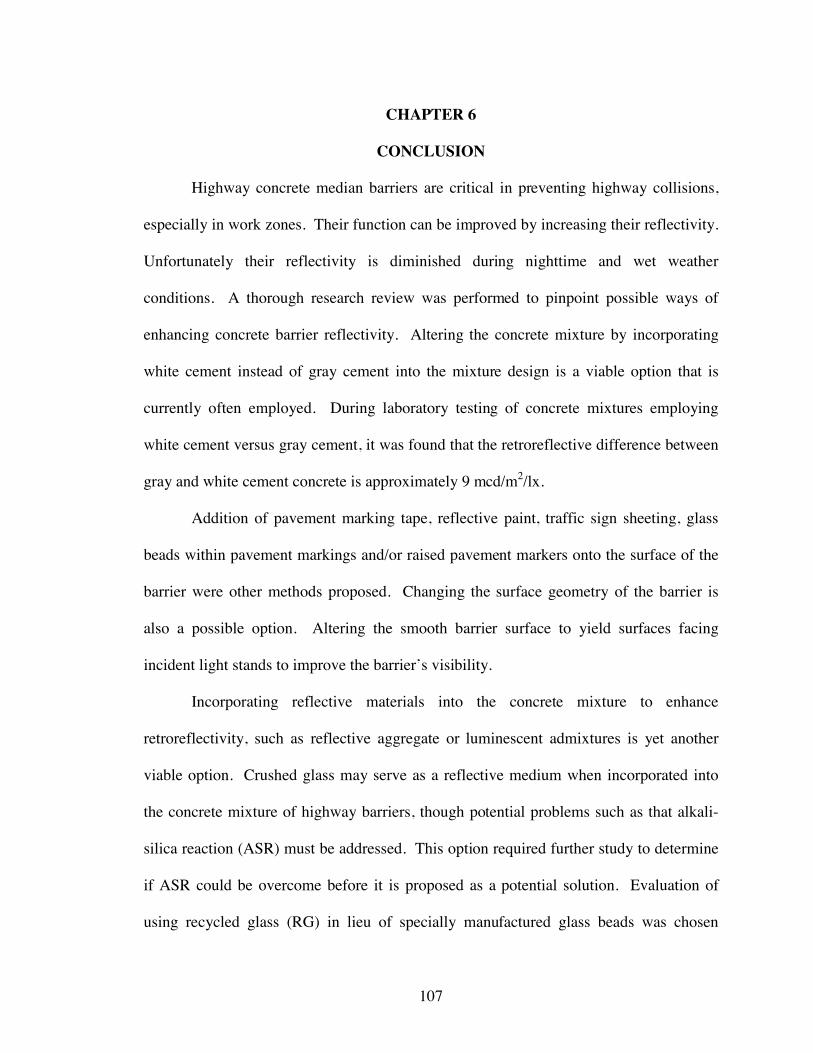
107
CHAPTER 6
CONCLUSION
Highway concrete median barriers are critical in preventing highway collisions,
especially in work zones. Their function can be improved by increasing their reflectivity.
Unfortunately their reflectivity is diminished during nighttime and wet weather
conditions. A thorough research review was performed to pinpoint possible ways of
enhancing concrete barrier reflectivity. Altering the concrete mixture by incorporating
white cement instead of gray cement into the mixture design is a viable option that is
currently often employed. During laboratory testing of concrete mixtures employing
white cement versus gray cement, it was found that the retroreflective difference between
gray and white cement concrete is approximately 9 mcd/m2/lx.
Addition of pavement marking tape, reflective paint, traffic sign sheeting, glass
beads within pavement markings and/or raised pavement markers onto the surface of the
barrier were other methods proposed. Changing the surface geometry of the barrier is
also a possible option. Altering the smooth barrier surface to yield surfaces facing
incident light stands to improve the barrier’s visibility.
Incorporating reflective materials into the concrete mixture to enhance
retroreflectivity, such as reflective aggregate or luminescent admixtures is yet another
viable option. Crushed glass may serve as a reflective medium when incorporated into
the concrete mixture of highway barriers, though potential problems such as that alkali-
silica reaction (ASR) must be addressed. This option required further study to determine
if ASR could be overcome before it is proposed as a potential solution. Evaluation of
using recycled glass (RG) in lieu of specially manufactured glass beads was chosen
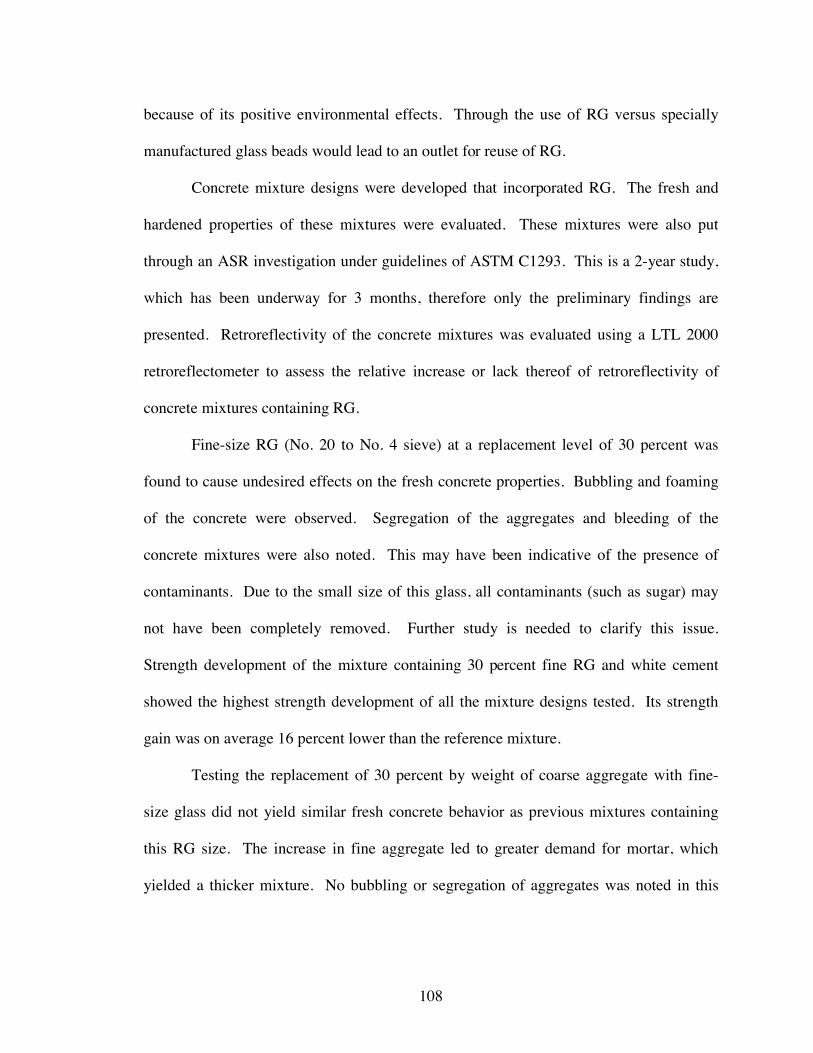
108
because of its positive environmental effects. Through the use of RG versus specially
manufactured glass beads would lead to an outlet for reuse of RG.
Concrete mixture designs were developed that incorporated RG. The fresh and
hardened properties of these mixtures were evaluated. These mixtures were also put
through an ASR investigation under guidelines of ASTM C1293. This is a 2-year study,
which has been underway for 3 months, therefore only the preliminary findings are
presented. Retroreflectivity of the concrete mixtures was evaluated using a LTL 2000
retroreflectometer to assess the relative increase or lack thereof of retroreflectivity of
concrete mixtures containing RG.
Fine-size RG (No. 20 to No. 4 sieve) at a replacement level of 30 percent was
found to cause undesired effects on the fresh concrete properties. Bubbling and foaming
of the concrete were observed. Segregation of the aggregates and bleeding of the
concrete mixtures were also noted. This may have been indicative of the presence of
contaminants. Due to the small size of this glass, all contaminants (such as sugar) may
not have been completely removed. Further study is needed to clarify this issue.
Strength development of the mixture containing 30 percent fine RG and white cement
showed the highest strength development of all the mixture designs tested. Its strength
gain was on average 16 percent lower than the reference mixture.
Testing the replacement of 30 percent by weight of coarse aggregate with fine-
size glass did not yield similar fresh concrete behavior as previous mixtures containing
this RG size. The increase in fine aggregate led to greater demand for mortar, which
yielded a thicker mixture. No bubbling or segregation of aggregates was noted in this
109
mixture. The compressive strength gain of this mixture was on average 26.8 percent less
than the control mixture.
The worst-case scenario mixture for ASR, which used gray cement and contained
30 percent by weight of fine aggregate replaced with fine RG and 30 percent by weight of
coarse aggregate replaced with coarse RG exhibited the highest level of bubbling in its
fresh state. The compressive strength gain of this mixture was also the lowest of all
mixture designs tested, on average 29.6 percent weaker than the control. At this point in
the ASR study, the expansion of this mixture is increasing at the steepest rate and its
expansion is the highest of all of the tested mixtures.
No irregular fresh concrete behavior was observed with the use of coarse-size RG
(No. 4 sieve to 12.7 mm [1/2 in]) at a replacement level of either 10 or 30 percent by
weight of coarse aggregate. These mixtures were on average 19 percent weaker than the
control. No significant ASR expansions have occurred in these mixtures.
Mixtures containing 40 percent content of coarse RG had high air contents. These
mixtures displayed predictable and adequate strengths, which were on average 25 percent
lower than the reference mixture. The difference in strength gain of mixtures containing
30 versus 40 percent coarse RG was the slightly lower early strength gain of the latter.
With the exclusion of one mixture design, the ASR expansions of the mixtures containing
40 percent coarse RG have not yet expanded to any notable lengths. A mixture
containing an ASR mitigating admixture, Sika® Control ASR, initially exhibited a
noticeable expansion rate, but it now appears to have leveled off.
The retroreflective difference between an original and a ground surface is on
average 35 cd/m2/lx for the control mixture as well as for a couple of other mixture
110
designs containing RG. The worst-case scenario mixture, which used gray cement, did
not achieve a notable retroreflective difference between its original and ground surfaces,
nor when it contained RG. Contrary to expected results, mixture MW-0000A, containing
no RG content, provided the highest retroreflectivity. Further study may be necessary to
determine if the LTL 2000 is able to provide accurate measurements on these concrete
mixtures, or if these measurements are correlated to apparent visibility reported by
human subjects.
In general it appears that RG as a concrete aggregate is possible providing that
mixture designs are altered appropriately. Ongoing ASR testing is hoped to corroborate
previous results in England which showed that ASR could be mitigated in RG concretes.
Preliminary results did not show any advantages of RG where retroreflectivity is
concerned, but methods of exposing the aggregate may be productive. For mixture
consistency the use of recycled whole bottles coupled with some processing may be more
effective than the use of waste glass as was obtained in this project. Further work should
include evaluation of other mixture designs and re-testing of fine glass mixtures subjected
to other processing methods.
Highway concrete barriers should be fabricated using several of the methods
proposed. These barriers may then be tested through the use of human test subjects and
these results could then be correlated with those obtained by the retroreflectometer.
Through this type of study a barrier design may be developed that not only meets the
retroreflective criteria as set forth by FHWA but also one that is in line with the
preference of a highway driver.
111
REFERENCES
Attaway, R. W. “In-Service Evaluation of Thermoplastic and Tape Pavement Markings Using a Portable Retroreflectometer”, Transportation Research Record, n 1230, p 45-55, 1989.
Bazant, Z. P.; Zi, G.; Meyer, C. “Fracture Mechanics of ASR in Concretes with Waste
Glass Particles of Different Sizes”, Journal of Engineering Mechanics, Vol. 126, No. 3, p 226-232, 2000.
Black, K. L.; Hussain, S. F.; Paniati, J. F. “Deterioration of Retroreflective Traffic
Signs”, Institute of Transportation Engineers Journal, v 62, n 7, p 16-22, 1992. Byars, E. A.; Zhu, H. Y.; Morales, B. “Conglasscrete I; Final Report”, The Waste &
Resources Action Programme, Project code: GLA2-006, 2004. Bryden, J. E.; Lorini, R. A.; Kelly, P. D. “Reflectivity and Durability of Epoxy Pavement
Markings”, Transportation Research Record, n 1086, p 1-7, 1986. Clean Washington Center, “Recycled Glass in Portland Cement Concrete”, Best
Practices in Glass Recycling, www.cwc.org/gl_bp/4-05-01.pdf, 1996. Davis, T. D. “Evaluation of Temporary Day-Night Visible Pavement Marker Adequacy”,
Transportation Research Record, n 1086, p 8-12, 1986. Dejaiffe, R. “Measuring Wet-Night Delineation Reflectivity”, Transportation Research
Record, n 1149, p 46-49, 1987. Dudek, C. L.; Huchingson, R. D.; Woods, D. L. “Evaluation of Temporary Pavement
Marking Patterns in Work Zones: Proving-Ground Studies”, Transportation Research Record, n 1086, p 12-20, 1986.
Dyer, T. D.; Dhir, R. K. “Chemical Reactions of Glass Cullet Used as Cement
Component”, Journal of Materials in Civil Engineering, Vol. 13, No. 6, p 412-417, 2001.
Ferraris, C. F. “Alkali-Silica Reaction and High Performance Concrete”, National
Institute of Standards and Technology, NISTIR 5742, 1995. Federal Highway Administration, “Roadway Delineation Practices Handbook”,
Publication No. FHWA-SA-93-001, 1994. Hall, J. W.; Lorenz, V. M. “Characteristics of Construction-Zone Accidents”,
Transportation Research Record, n 1230, p 20-27, 1989.
112
Kalchbrenner, J. “Large Glass Beads for Pavement Markings”, Transportation Research Record, n 1230, p 28-36, 1989.
Khattak, Asad J.; Khattak, Aemal J.; Council, F. M. “Effects of Work Zone Presence on
Injury and Non-Injury Crashes”, Accident Analysis and Prevention, 2000. Lam, C. S.; Poon, C. S.; Chan, D. “Enhancing the Performance of Pre-Cast Concrete
Blocks by Incorporating Waste Glass – ASR Consideration”, Cement and Concrete Composites, No. 29, p 616-625, 2007.
Lane, D. S. “Virginia’s Approach to Evaluation of Concrete Resistant to Alkali-Silica
Reaction”, Transportation Research Record, n 1668, p 42-47, 1999. Lehigh Cement Company, “Why are there different cement types? What's the
difference?” Frequently Asked Questions, www.lehighcement.com, Accessed: January 19, 2009.
Li, Y.; Bai, Y. “Determining the Effectiveness of Temporary Traffic Control Measures in
Highway Work Zones”, Proceedings of the 2007 Mid-Continent Transportation Research Symposium, p 1-12, 2007.
Li, Y.; Bai, Y. “Comparison of Characteristics Between Fatal and Injury Accidents in the
Highway Construction Zones”, Safety Science, Vol. 46, p 646-660, 2008. Loetterle, F. E.; Beck, R. A.; Carlson, J. “Public Perception of Pavement-Marking
Brightness”, Transportation Research Record, n 1715, p 51-59, 2000. Maben, S. “Glass Recycling Faces Fragile Financial Future”, The Register Guard, 2003. McDevitt, C. F. “Basics of Concrete Barriers”, Public Roads, Vol 63, No. 5, 2000. Metwally, I. M. “Investigation on the Performance of Concrete Made with Blended
Finely Milled Waste Glass”, Advances in Structural Engineering, Vol. 10, No. 1, p 47-53, 2007.
Meyer, C.; Egosi, N.; Andela, C. “Concrete with Waste Glass as Aggregate”,
Proceedings of the International Symposium Concrete Technology Unit of ASCE and University of Dundee, March 19-20, 2001.
Meydan, A.; Senior, D. C. “Large Glass Beads for Improved Wet Weather Road Marking
Visibility”, Proceedings – Conference of the Australian Road Research Board, n pt 5, Traffic Engineering and Planning, p 243-256, 1990.
Mohan, S.; Dutta, N.; Bajpai, R. K. “Evaluation of Visibility Level of Retroreflective
Road Signs”, Indian Highways, v 32, n 3, p 41-49, 2004.
113
Moulinier, F.; Lane, S.; Dunster, A. “The Use of Glass as Aggregate in Concrete Final Report”, The Waste & Resources Action Programme, Project Code: GLA0046, 2006.
Mullowney, W. “Evaluation of Delineation Systems for the New Jersey Barrier”,
Transportation Research Record, n 681, p 1-6, 1978. The National Work Zone Safety Information Clearinghouse, “Fatalities in Motor Vehicle
Traffic Crashes by State and Construction/Maintenance Zone (2006)”, Crash Data, www.workzonesafety.org, Accessed: February 13, 2009.
Niu, Q.; Ercal, F.; Maerz, N. H. “Automated Mobile Highway Sign Retroreflectivity
Measurement”, Proceedings of the Artificial Neural Networks in Engineering Conference, p 861-869, 2002.
O’Brien, J. “Embedment and Retroreflectivity of Drop-on Glass Spheres in
Thermoplastic Markings”, Transportation Research Record, n 1230, p 37-44, 1989.
Ohio Department of Natural Resources, “Glass Recycling”, Division of Recycling &
Litter Prevention, www.dnr.state.oh.us, 1997. Olson, P. L. “Minimum Photometric Properties of Retroreflective Signing Materials”,
Transportation Research Record, n 1247, p 56-68, 1989. Paniati, J. F. “Retroreflectivity Research to Enhance Driver Safety”, TR News, n 140, p
13-15, 32, 1989. “Sika® AEA-15 Air Entraining Admixture”, Product Data Sheet, Edition 10.2005,
Identification no.106. “Sika® Control ASR Admixture to Control Alkali-Silica Reaction in Concrete”, Product
Data Sheet, Edition 6.13.2008. “Sika ViscoCrete® 6100 High Range Water Reducing Admixture”, Product Data Sheet,
Edition 12.2005, Identification no. 171-54V. Shi, C.; Zheng, K. “A Review on the Use of Waste Glasses in the Production of Cement
and Concrete”, Conservation and Recycling, No. 52, p 234-247, 2007. Stidger, R. W. “A Look at Technology Today and Tomorrow”, Better Roads, v 71, n 11, p
39-41, 2001.
114
Tang, M. C.; Wang, L.; Dhir, R. K. “Engineering and Durability Properties of Concrete Containing Waste Glass”, Achieving Sustainability in Construction; Proceedings of the International Conference Held at the University of Dundee, p 219-228, 2005.
Taori, S.; McGee, H. W. “Impacts of Maintaining Traffic Signs Within Minimum
Retroreflectivity Guidelines”, Transportation Research Record, n 1650, p 19-27, 1998.
Terro, M. J. “Properties of Concrete Made with Recycled Crushed Glass at Elevated
Temperatures”, Building and Environment, No. 41, p 633-639, 2006. Ullman, G. L.; Rhodes, L. R. Jr. “Field Test of a Portable Retroreflectometer for a
Retroreflective Raised Pavement Markers”, Transportation Research Record, n 1529, p 71-75, 1996.
Xie, Z.; Xi, Y. “Use of recycled glass as a raw material in the manufacture of Portland
cement”, Materials and Structures, Vol 35, No. 252, p 510-515, 2002. Zhu, H., Byars, E. “Post-Consumer Glass in Concrete: Alkali-Silica Reaction and Case
Studies”, Sustainable Waste Management and Recycling; Glass Waste; Proceedings of the International Conference Organized by the Concrete and Masonry Research, p 99-108, 2004.
Zhu, H.; Byars, E. “Potential for Use of Waste Glass in Concrete”, Concrete, p 41-45,
2005. Zwahlen, H. T.; Schnell, T. “Minimum In-Service Retroreflectivity of Pavement
Markings”, Transportation Research Record, n 1715, p 60-70, 2000.