Embed Size (px)
Citation preview

&,7<�2)�%2:/,1*�*5((1��.(178&.<
&2035(+(16,9(�$118$/�
),1$1&,$/�5(3257For the Fiscal Year Ended June 30, 2020
Photo Credit:
City of Bowling Green
Comprehensive Annual Financial Report
For the Fiscal Year Ended June 30, 2020
Issued by theDepartment of Finance
City of Bowling Green, Kentucky

City of Bowling Green, KentuckyTable of ContentsYear Ended June 30, 2020
PAGE
INTRODUCTORY SECTION
Letter of Transmittal................................................................................................................................................................................................................................................................................................................................................................................................................................................................................................................................1 - 6
GFOA Certificate of Achievement for Excellence in Financial Reporting................................................................................................................................................................................................................................................................................................................................................................................................................................................................................................................................7
Organizational Chart................................................................................................................................................................................................................................................................................................................................................................................................................................................................................................................................8
Directory - Principal Officials................................................................................................................................................................................................................................................................................................................................................................................................................................................................................................................................9
FINANCIAL SECTION
Independent Auditor's Report................................................................................................................................................................................................................................................................................................................................................................................................................................................................................................................................10 - 12
MD&A................................................................................................................................................................................................................................................................................................................................................................................................................................................................................................................................13 - 22
Basic Financial Statements
Government Wide Financial Statements
Statement of Net Position................................................................................................................................................................................................................................................................................................................................................................................................................................................................................................................................23 - 24
Statement of Activities................................................................................................................................................................................................................................................................................................................................................................................................................................................................................................................................25
Fund Financial Statements
Governmental Fund Financial Statements
Balance Sheet - Governmental Funds................................................................................................................................................................................................................................................................................................................................................................................................................................................................................................................................26
Reconciliation of the Balance Sheet of Governmental Funds tothe Statement of Net Position................................................................................................................................................................................................................................................................................................................................................................................................................................................................................................................................27
Statement of Revenues, Expenditures and Changes in Fund Balances -Governmental Funds................................................................................................................................................................................................................................................................................................................................................................................................................................................................................................................................28
Reconciliation of the Statement of Revenues, Expenditures and Changesin Fund Balances of Governmental Funds to the Statement of Activities................................................................................................................................................................................................................................................................................................................................................................................................................................................................................................................................29
Proprietary Fund Financial Statements
Statement of Net Position - Proprietary Funds................................................................................................................................................................................................................................................................................................................................................................................................................................................................................................................................30
Statement of Revenues, Expenses and Changes in NetPosition - Proprietary Funds................................................................................................................................................................................................................................................................................................................................................................................................................................................................................................................................31
Statement of Cash Flows - Proprietary Funds................................................................................................................................................................................................................................................................................................................................................................................................................................................................................................................................32
Fiduciary Fund Financial Statements
Statement of Fiduciary Net Position................................................................................................................................................................................................................................................................................................................................................................................................................................................................................................................................33
Statement of Changes in Fiduciary Net Position................................................................................................................................................................................................................................................................................................................................................................................................................................................................................................................................34
Notes to the Financial Statements................................................................................................................................................................................................................................................................................................................................................................................................................................................................................................................................35 - 77
REQUIRED SUPPLEMENTARY INFORMATION
Budgetary Comparison Schedule
General Fund................................................................................................................................................................................................................................................................................................................................................................................................................................................................................................................................79
Notes to Required Supplementary Information on Budgetary Accounting and Control................................................................................................................................................................................................................................................................................................................................................................................................................................................................................................................................81
Pension Schedules
Schedule of Changes in Net Pension Liability - Police and Firefighter's Retirement................................................................................................................................................................................................................................................................................................................................................................................................................................................................................................................................82
Schedule of City Contributions - Police and Firefighters' Retirement Fund................................................................................................................................................................................................................................................................................................................................................................................................................................................................................................................................83
Schedule of Investment Returns - Police and Firefighters' Retirement Fund................................................................................................................................................................................................................................................................................................................................................................................................................................................................................................................................84
Schedule of Proportionate Share of Net Pension Liability - County EmployeesRetirement System of the Commonwealth of Kentucky................................................................................................................................................................................................................................................................................................................................................................................................................................................................................................................................85

City of Bowling Green, KentuckyTable of ContentsYear Ended June 30, 2020
PAGE
Schedule of City Pension Contributions - County Employees Retirement Systemof the Commonwealth of Kentucky................................................................................................................................................................................................................................................................................................................................................................................................................................................................................................................................86
Schedule of Proportionate Share of the Net OPEB Liability - County EmployeesRetirement System of the Commonwealth of Kentucky................................................................................................................................................................................................................................................................................................................................................................................................................................................................................................................................87
Schedule of City OPEB Contributions - County Employees Retirement Systemof the Commonwealth of Kentucky................................................................................................................................................................................................................................................................................................................................................................................................................................................................................................................................88
Modified Approach for City Streets Infrastructure Capital Assets................................................................................................................................................................................................................................................................................................................................................................................................................................................................................................................................89 - 92
COMBINING AND INDIVIDUAL FUND STATEMENTS AND SCHEDULES................................................................................................................................................................................................................................................................................................................................................................................................................................................................................................................................93
Nonmajor Governmental Funds
Combining Balance Sheet - Nonmajor Governmental Funds................................................................................................................................................................................................................................................................................................................................................................................................................................................................................................................................98
Combining Balance Sheet - Nonmajor Special Revenue Funds................................................................................................................................................................................................................................................................................................................................................................................................................................................................................................................................99
Combining Balance Sheet - Nonmajor Capital Projects Funds................................................................................................................................................................................................................................................................................................................................................................................................................................................................................................................................101
Combining Statement of Revenues, Expenditures, and Changes inFund Balances - Nonmajor Governmental Funds................................................................................................................................................................................................................................................................................................................................................................................................................................................................................................................................103
Combining Statement of Revenues, Expenditures, and Changes inFund Balances - Nonmajor Special Revenue Funds................................................................................................................................................................................................................................................................................................................................................................................................................................................................................................................................104
Combining Statement of Revenues, Expenditures, and Changes inFund Balances - Nonmajor Capital Projects Funds................................................................................................................................................................................................................................................................................................................................................................................................................................................................................................................................106
Budgetary Comparison Schedules
Debt Service Fund................................................................................................................................................................................................................................................................................................................................................................................................................................................................................................................................108
WKU Athletics Debt Service Fund................................................................................................................................................................................................................................................................................................................................................................................................................................................................................................................................109
ITA Bond Debt Service Fund................................................................................................................................................................................................................................................................................................................................................................................................................................................................................................................................110
TIF District Bond Debt Service Fund................................................................................................................................................................................................................................................................................................................................................................................................................................................................................................................................111
Community Development Special Revenue Fund................................................................................................................................................................................................................................................................................................................................................................................................................................................................................................................................112
Fire Improvement Special Revenue Fund................................................................................................................................................................................................................................................................................................................................................................................................................................................................................................................................113
Municipal Aid Special Revenue Fund................................................................................................................................................................................................................................................................................................................................................................................................................................................................................................................................114
Job Development Incentive Special Revenue Fund................................................................................................................................................................................................................................................................................................................................................................................................................................................................................................................................115
Parks Development Special Revenue Fund................................................................................................................................................................................................................................................................................................................................................................................................................................................................................................................................116
Landfill Closure Special Revenue Fund................................................................................................................................................................................................................................................................................................................................................................................................................................................................................................................................117
Local Law Enforcement Block Grant Special Revenue Fund................................................................................................................................................................................................................................................................................................................................................................................................................................................................................................................................118
Radio System Special Revenue Fund................................................................................................................................................................................................................................................................................................................................................................................................................................................................................................................................119
Police Improvement Special Revenue Fund................................................................................................................................................................................................................................................................................................................................................................................................................................................................................................................................120
Homeland Security Special Revenue Fund................................................................................................................................................................................................................................................................................................................................................................................................................................................................................................................................121
TIF Revenue Special Revenue Fund................................................................................................................................................................................................................................................................................................................................................................................................................................................................................................................................122
Lampkin Park Special Revenue Fund................................................................................................................................................................................................................................................................................................................................................................................................................................................................................................................................123
Riverfront Development Capital Projects Fund................................................................................................................................................................................................................................................................................................................................................................................................................................................................................................................................124
Equipment Replacement Capital Projects Fund................................................................................................................................................................................................................................................................................................................................................................................................................................................................................................................................125
Road Construction Capital Projects Fund................................................................................................................................................................................................................................................................................................................................................................................................................................................................................................................................126
Heritage Trail Construction Capital Projects Fund................................................................................................................................................................................................................................................................................................................................................................................................................................................................................................................................127
Sidewalk Improvement Capital Projects Fund................................................................................................................................................................................................................................................................................................................................................................................................................................................................................................................................128
Stormwater Infrastructure Improvement Capital Projects Fund................................................................................................................................................................................................................................................................................................................................................................................................................................................................................................................................129
Municipal Facilities Capital Projects Fund................................................................................................................................................................................................................................................................................................................................................................................................................................................................................................................................130
Downtown Development Capital Projects Fund................................................................................................................................................................................................................................................................................................................................................................................................................................................................................................................................131

City of Bowling Green, KentuckyTable of ContentsYear Ended June 30, 2020
PAGE
800 Trunking Radio Systems Improvements Capital Projects Fund................................................................................................................................................................................................................................................................................................................................................................................................................................................................................................................................132
Technology Capital Improvement Fund................................................................................................................................................................................................................................................................................................................................................................................................................................................................................................................................133
Smallhouse Road Construction Fund................................................................................................................................................................................................................................................................................................................................................................................................................................................................................................................................134
Parks Capital Improvements Fund................................................................................................................................................................................................................................................................................................................................................................................................................................................................................................................................135
Fire Capital Improvements Fund................................................................................................................................................................................................................................................................................................................................................................................................................................................................................................................................136
Southwest Parkway Capital Projects Fund................................................................................................................................................................................................................................................................................................................................................................................................................................................................................................................................137
Police Capital Improvements Fund................................................................................................................................................................................................................................................................................................................................................................................................................................................................................................................................138
Internal Service Funds
Combining Statement of Net Position................................................................................................................................................................................................................................................................................................................................................................................................................................................................................................................................140
Combining Statement of Revenues, Expenses, and Changes inNet Position................................................................................................................................................................................................................................................................................................................................................................................................................................................................................................................................141
Combining Statement of Cash Flows................................................................................................................................................................................................................................................................................................................................................................................................................................................................................................................................142
Fiduciary Funds
Combining Statement of Changes in Assets and Liabilities - Agency Funds................................................................................................................................................................................................................................................................................................................................................................................................................................................................................................................................144
Bowling Green Municipal Utilities
Combining Statement of Net Position................................................................................................................................................................................................................................................................................................................................................................................................................................................................................................................................146
Combining Statement of Activities.....................................................................................................147
Statistical Section
Narrative Introduction................................................................................................................................................................................................................................................................................................................................................................................................................................................................................................................................148
Net Position by Component................................................................................................................................................................................................................................................................................................................................................................................................................................................................................................................................149
Changes in Net Position................................................................................................................................................................................................................................................................................................................................................................................................................................................................................................................................150
Fund Balances, Governmental Funds................................................................................................................................................................................................................................................................................................................................................................................................................................................................................................................................152
Changes in Fund Balances, Governmental Funds................................................................................................................................................................................................................................................................................................................................................................................................................................................................................................................................153
Wages Withholding Fees & Direct Occupational License Fee Rate, General Fund................................................................................................................................................................................................................................................................................................................................................................................................................................................................................................................................155
Occupational License Receipts, General Fund................................................................................................................................................................................................................................................................................................................................................................................................................................................................................................................................156
Real Property Tax Estimated Values, Assessments, Levies and Collections................................................................................................................................................................................................................................................................................................................................................................................................................................................................................................................................157
Property Tax Rates, Direct and Overlapping Governmental Units................................................................................................................................................................................................................................................................................................................................................................................................................................................................................................................................158
Principal Occupational Withholdings Fee Payers................................................................................................................................................................................................................................................................................................................................................................................................................................................................................................................................159
Principal Property Taxpayers................................................................................................................................................................................................................................................................................................................................................................................................................................................................................................................................160
Ratios of Outstanding Debt by Type................................................................................................................................................................................................................................................................................................................................................................................................................................................................................................................................161
Indebtedness and Debt Ratios................................................................................................................................................................................................................................................................................................................................................................................................................................................................................................................................162
General Debt - Governmental Funds................................................................................................................................................................................................................................................................................................................................................................................................................................................................................................................................163
Inter-Modal Transportation Authority Debt................................................................................................................................................................................................................................................................................................................................................................................................................................................................................................................................164
Western Kentucky University Debt................................................................................................................................................................................................................................................................................................................................................................................................................................................................................................................................165
Ratios of General Bonded Debt Outstanding................................................................................................................................................................................................................................................................................................................................................................................................................................................................................................................................166
Direct and Overlapping Governmental Activities Debt................................................................................................................................................................................................................................................................................................................................................................................................................................................................................................................................167
Legal Debt Margin Information................................................................................................................................................................................................................................................................................................................................................................................................................................................................................................................................168
Pledged-Revenue Coverage................................................................................................................................................................................................................................................................................................................................................................................................................................................................................................................................169
Demographic and Economic Statistics................................................................................................................................................................................................................................................................................................................................................................................................................................................................................................................................170
Principal Employers................................................................................................................................................................................................................................................................................................................................................................................................................................................................................................................................171
Full-time City Government Employees by Function/Program................................................................................................................................................................................................................................................................................................................................................................................................................................................................................................................................172
Operating Indicators by Function/Program................................................................................................................................................................................................................................................................................................................................................................................................................................................................................................................................173

City of Bowling Green, KentuckyTable of ContentsYear Ended June 30, 2020
PAGE
Capital Asset Statistics by Function/Program................................................................................................................................................................................................................................................................................................................................................................................................................................................................................................................................174
Single Audit
Single Audit Report Cover Page................................................................................................................................................................................................................................................................................................................................................................................................................................................................................................................................175
Independent Auditor's Report on Compliance................................................................................................................................................................................................................................................................................................................................................................................................................................................................................................................................176
Independent Auditor's Report on Internal Controls................................................................................................................................................................................................................................................................................................................................................................................................................................................................................................................................178
Schedule of Expenditures of Federal Awards................................................................................................................................................................................................................................................................................................................................................................................................................................................................................................................................180
Notes to SEFA Schedule................................................................................................................................................................................................................................................................................................................................................................................................................................................................................................................................182
Schedule of Findings and Questioned Costs.......................................................................................183Schedule of Prior Year Audit Findings................................................................................................................................................................................................................................................................................................................................................................................................................................................................................................................................185

ERIN BALLOU, CMA, CPFOAssistant Chief Financial Officer
MARILYN PARRIGINProcurement Manager
SEAN WEEKS, CPFOAssistant Chief Financial Officer
DAVID L. LYNEOccupational License Manager
KATIE E. SCHALLER-WARDAssistant City Manager/Chief Financial Officer
F I N A N C E D E P A R T M E N T
1 0 1 7 C O L L E G E S T R E E TP O S T O F F I C E B O X 4 3 0 � B O W L I N G G R E E N � � K Y � � 4 2 1 0 2 ² 0 4 3 0
� � � � � � � � � � � � � � T T D P H O N E N U M B E R 1 . 8 0 0 . 5 4 5 . 1 8 3 3 E X T E N S I O N 3 3 0w w w . b g k y . o r g
November 9, 2020
Honorable Mayor Bruce WilkersonMembers of the Board of CommissionersResidents of Bowling Green
Dear Mayor, City Commissioners, and Residents of Bowling Green:
We are pleased to submit the Comprehensive Annual Financial Report (CAFR) of the City of %RZOLQJ�*UHHQ��³WKH�&LW\´�� for the fiscal year ended June 30, 2020. The CAFR was prepared in conformance with Generally Accepted Accounting Principles (GAAP) and the reporting standards of the Governmental Accounting Standards Board (GASB). The CAFR includes all funds of the City and the component units.
Management of the City is responsible for the accuracy of the data presented as well as the completeness and fairness of the presentation of this information. To provide a reasonable basis for making these representations, the City has established a comprehensive internal control framework WKDW�LV�GHVLJQHG�WR�SURWHFW�WKH�&LW\¶V�DVVHWV�IURP�ORVV��WKHIW��RU�PLVXVH�DQG�WR�FRPSLOH�VXIILFLHQW�UHOLDEOH�LQIRUPDWLRQ�IRU�WKH�SUHSDUDWLRQ�RI�WKH�&LW\¶s financial statements in conformity with GAAP. The internal control structure is designed to provide reasonable, but not absolute, assurance that these objectives are met. The concept of reasonable assurance recognizes that the cost of internal controls should not exceed the benefits likely to be derived from their use and that such cost-benefit evaluation requires estimates and judgment by management.
To the best of our knowledge and belief, this financial report is complete and reliable in all material respects and fairly presents the financial position and results of the operations of the City. All GLVFORVXUHV�QHFHVVDU\�WR�HQDEOH�WKH�UHDGHU�WR�JDLQ�DQ�XQGHUVWDQGLQJ�RI�WKH�&LW\¶V�ILQDQFLDO�DFWLYLWLHV�have been included in this report.
The independent accounting firm of MCM CPAs and Advisors LLP, Certified Public Accountants, KDV� DXGLWHG� WKH�&LW\¶V� ILQDQFLDO� VWDWHPHQWV��7KH�JRDO�RI� WKH� LQGHSHQGHQW�DXGLW� ZDV� WR�SURYLGH�reasonable assurance that the financial statements of the City for the fiscal year ended June 30,2020 are free of any material misstatement.
The independent audit involved examining, on a test basis, evidence supporting the amounts and disclosures in the financial statements; assessing the accounting principles used and significant estimates made by the City; and evaluating the overall financial statement presentation. The LQGHSHQGHQW�DXGLWRU�UHQGHUHG�DQ�XQPRGLILHG��³FOHDQ´��RSLQLRQ�WKDW�WKH�&LW\¶V�ILQDQFLDO�VWDWHPHQWV�IRU�the fiscal year ended June 30, 2020 are fairly presented in all material respects in conformity with GAAP. Their report is the first component in the Financial Section of this report.
1

Additionally, MCM CPAs and Advisors LLP included an audit of federal grants in order to meet therequirements of federal grantor agencies as outlined by the U.S. Office of Management and Budget's Uniform Administrative Requirements (2 CFR 200.501), Cost Principles, and Audit Requirements for Federal Awards, Uniform Guidance. These standards require the auditor to report not only on the fairness of the representation of the financial statements, but also on the internal controls and compliance with legal requirements of the federal awards. The Single Audit Report is included with this report.
PROFILE OF THE CITY
%RZOLQJ�*UHHQ��WKH�³3DUN�&LW\´�RI�.HQWXFN\��ZDV�HVWDEOLVKHG�LQ�������DQG�LV�ORFDWHG�LQ�WKH�VRXWK-central part of Kentucky. The City occupies a land area of 40.75 square miles, has an estimatedpopulation of 70,550, and serves as the retail, educational, medical, commercial, and social hub for south-central Kentucky and northern Tennessee. The broader workforce, which measures employable workers that are 18 years and older, is measured at approximately 750,000 for the area encompassing a hundred mile radius from the City.
The City operates under the City Manager form of government, one of the alternative forms of municipal government established under Kentucky Statutes. Under this form of government, a Mayor, who is elected for a term of four years, and four City Commissioners, who serve two years each, are all voted into office in non-partisan elections. The Mayor and the City Commissioners comprise the BoaUG�RI�&RPPLVVLRQHUV��³WKH�%RDUG´� in which all legislative and executive authority of the City is vested. As such, the Board is responsible, among other things, for passing ordinances, adopting the budget, appointing committees, and ratifying the hiring of most City staff. The Board appoints a City Manager, who serves as the Chief Administrative Officer of the City and enforces City ordinances and policy as well as carrying out day-to-day operations. 7KH�&LW\¶V�ZRUNIRUFH�Ds of June 30, 2020, was comprised of 488 authorized full-time positions and 481 of those positions wereoccupied, with 62% of the employees dedicated to public safety.
The City provides a full range of municipal services, including police and fire protection, engineering and inspection services, construction and maintenance of streets and other infrastructure,recreational activities and cultural events, and general administrative services. As required by GAAP, the financial statements of the City also include certain other agencies called component units. A component unit is generally a legally separate entity for which the City is financially accountable. The City is financially accountable for a legally separate organization if City officials appoint a voting majority of the board and it is either able to impose its will on that organization or there is potential for the organization to provide the City specific financial benefits, or impose specific financial burdens on the City.
In accordance with GASB Statement No. 61��³7KH�)LQDQFLDO�5HSRUWLQJ�(QWLW\´, and based on the foregoing criteria, the City has presented the Bowling Green Police and )LUHILJKWHUV¶�5HWLUHment Fund and TKH�&RQYHQWLRQ�&HQWHU�&RUSRUDWLRQ�DV�EOHQGHG�FRPSRQHQW�XQLWV�ZLWKLQ�WKH�&LW\¶V�EDVLF�financial statements because the component units¶ governing body is substantially the same as the governing body of the City, the component units are dependent upon the City financially and operationally. Bowling Green Municipal Utilities is included as a discretely presented component unit because the City is financially accountable and is able to impose its will on the organization, or the component unit provides specific financial benefits or imposes specific financial burdens on the City. The Bowling Green - Warren County Regional Airport, Bowling Green Independent School District, Housing Authority of Bowling Green, and other various related organizations providing services within the City do not meet the financial accountability criteria discussed above and, therefore, are excluded from this report.
2

7KH�DQQXDO�EXGJHW�VHUYHV�DV�WKH�IRXQGDWLRQ�IRU�WKH�&LW\¶V�ILQDQFLDO�SODQQLQJ�DQG�FRQWURO��7KH�&LW\�Manager submits a proposed budget to the Board in May or no later than June 1 of each year. Under State statute, this budget must be balanced for each fund and total available funds must equal or exceed total anticipated expenditures. The Board then conducts public meetings on the proposed budget. Prior to July 1, the budget is legally enacted through passage of an ordinance. During the year, the Assistant City Manager/Chief Financial Officer is authorized to transfer budgeted amounts between departments within any fund. However, the Board must approve any revisions that alter the total expenditures of any fund. During this fiscal year, there were five such budget amendments.
FACTORS AFFECTING FINANCIAL CONDITION
The following is a brief discussion of factors affecting the financial condition of the City. Additional GHWDLOHG�LQIRUPDWLRQ�FDQ�EH�IRXQG�LQ�WKH�0DQDJHPHQW¶V�'LVFXVVLRQ�DQG�$QDO\VLV��0'$���LQ�WKH�Financial Section of this report.
Local EconomyThe local economy is comprised of a well-balanced blend of service, manufacturing, retail and otherindustries that support WKH�&LW\¶V�PDLQ�UHYHQXH�VRXUFH, employee withholdings fees. Bowling Green is the home of Western Kentucky University (WKU), the CLW\¶V second largest employer with approximately 2,975 employees and a prime catalyst for the local economy. 7KH�8QLYHUVLW\¶V�WRtal enrollment for the Fall 2019 semester including undergraduate and graduate students was 18,183, a slight decrease from the previous year. WKU also houses one of the QDWLRQ¶V top-rated high schools, the Gatton Academy for Mathematics and Sciences, which according to Niche.com 2020 Best Schools, ranks as the 2nd best public high school in Kentucky and top 20% in the Nation. Other major employers include the General Motors Corvette assembly plant and two regional hospitals. In addition, countless local businesses prosper in the community proving that the entrepreneurial spirit is alive and well in the region.
Aggressive cooperative strategies are in place between the local governments, the Chamber of Commerce, and the Economic Development Authority that continue to attract business and jobs to the community. The City consistently scores high in national rankings of preferred business locations and favorable environments for the creation and development of businesses due to rich economic, social and cultural environments. During FY2020, the Bowling Green Area Chamber of Commerce announced capital investments totaling more than $376.6 million and the creation of nearly 971 new jobs. According to Site Selection Magazine, Bowling Green is ranked as one of the 20 top U.S. cities for manufacturers in 2020. Global Trade Magazine lists Bowling Green as the #2 City for manufacturing companies.
The most recent rankings published by Forbes for the City, has Bowling Green ranked 49th for Job Growth Rate for ³Best Small Places for Business and Careers´ out of 200 cities and 70th for Low Cost of Doing Business, with an overall ranking of 70th. According to Money Magazine Best Place to Live in America, Bowling Green, Kentucky was ranked 39th overall, and according to Southernliving.com Bowling Green, Kentucky ranks among the best places to buy due to a walkable downtown and good median household costs.
Bowling *UHHQ¶V�DYHUDJH�XQHPSOR\PHQW�UDWH�GXULQg the past fiscal year increased due to the effectsof the global pandemic and State imposed mandates on local businesses; ending the year slightlyabove the State average. Bowling Green began Fiscal Year 2020 with an unemployment rate of 4.7%, versus 4.8% for the State and 3.7% nationally. By the end of the fiscal twelve months, the &LW\¶V�XQHPSOR\PHQW�UDWH�ZDV�5.7%, versus 5.0% for the State and 11.1% for the Nation. Bowling *UHHQ¶V�XQHPSOR\PHQW�UDWH�GXULQJ�Fiscal Year 2020 averaged 6.2%, versus 5.9% statewide and 6.0% across the United States.
3

Bowling Green was able to grow revenue collections during Fiscal Year 2020 compared to prior year levels by 9.2% with an infusion of Coronavirus Relief Funds contributing to the increase. The payroll tax base posted a gain of approximately $61.6 million, which increased employee withholdings fee collections by $1,139,000, or +2.7%, over Fiscal Year 2019, and contributed to total withholding receipts of $42.9 million. Total employee withholding revenue increased by an average of 2.5% over the prior three years��7KH�&LW\¶V�VHFRQG�PRVW important revenue source, property tax revenues, outperformed the FY2019 actual collections by $747,000, or +5.6%, contributing to a total collection of $14,050,000. New business registrations issued during the fiscal year totaled 949.
Management believes the local economy remains fortified even with the impacts of the global pandemic as the City continues to see growth with new or expanding business announcements. The City is committed to aggressively competing for jobs and building a skilled workforce, attracting jobs to the area by offering incentives to new businesses locating in the area and encouraging the expansion of existing businesses to grow the job base. Western Kentucky University continues to be a stabilizing force for the local economy along with the health care and manufacturing sectors.
Long-term Financial Planning 7KH�&LW\¶V�EXGJHW�WHDP��ZKLFK� LV�FRPSRVHG�RI�WKH�&LW\�0DQDJHU��$VVLVWDQW�&LW\�0DQDJHU�&KLHI�Financial Officer, Human Resources Director, and Assistant Chief Financial Officers, is primarily responsible for the long-term financial planning for the City. Long-term fiscal sustainability is a top focus of the budget team. The Assistant City Manager/CFO prepares the revenue forecast for the budget each year and budgeted expenditures are matched to revenue projections. Great emphasis is placed on current year operating revenues equaling or exceeding current year operating expenditures. Conservatism is used when preparing the annual revenue projection in order to avert budget shortfalls and to help encourage fiscal responsibility on the expenditure side. The use of fundbalance is reserved for one-time capital expenditures. The City continues to make progress in reducing and eliminating debt and takes advantage of available debt refinancing opportunities.
Relevant Financial PoliciesThe City maintains an adopted Financial Policies and Procedures that addresses various areas of operations such as revenue collection, banking services, investments, debt management, budget management, and fund balance reserves. The Fund Balance policy is included in the Financial Policies and prescribes a 25% minimum reserve balance in the General Fund. The increase of 5% became effective on July 1, 2016, with the previous minimum reserve balance of 20% of the General Fund adopted revenue budget. Segregation of duties and internal controls are also a common theme to achieve sound financial operations in the sections covering accounting, accounts payable, revenue collections, payroll, cash management, investments, fixed assets, and procurement card guidelines.
Major Initiatives The City continues to emphasize delivery of focused public services in a manner that provides maximum efficiency, effectiveness, and value to the residents of Bowling Green. 7KH�&LW\¶V�PDMRU�initiatives during the year are discussed below.
The Public Works Department continues to be FRPPLWWHG�WR�LPSURYLQJ�WKH�&LW\¶V�VWUHHW��VLGHZDON�and stormwater infrastructure. The street overlay program was allocated an amended budget of $2.3million in FY2020 to resurface approximately 20.0 miles of roadway and make other intersection, curb and gutter improvements at selected locations. In FY2021, this budget was set at $1.5 million. The fourteenth year of participation in the sidewalk improvement program was completed in 2020and has resulted in over 16.3 miles of new sidewalk construction, and the FY2021 budget continues with the development of a new greenways expansion program and an initial amended budget of $275,000. The stormwater program is in its tenth year and over $5.45 million in local tax revenues have been dedicated since then to undertake large scale drainage improvements across the City,with the FY2021 budget contributing $200,000. Work was completed on Phase I of the streetscape and alley improvements in downtown Bowling Green during FY2020 and funding was included in the
4

FY2020 budget to begin design services on Phase II to extend the project further down College and State Streets toward the riverfront. Additional funding for Phase II construction was allocated in the FY2021 amended budget at $1.5 million. Smallhouse Road Improvements, Phase III received $500,000 in FY2020 for the extension of the multi-use path to continue to the intersection with Scottsville Road. Construction of the Shive Lane widening and roundabout project, Phase I, was completed and design on Phase II began during FY2020. More funding was also allocated in the FY2021 budget to progress Phase II and Phase III of the Shive Lane project from the new roundabout at Ken Bale Boulevard to a new roundabout at Middle Bridge Road and extending the roadway to Lovers Lane at Searcy Way.
The Parks and Recreation Department continued and completed several projects during Fiscal Year 2020. The replacement of 17 bunkers at the CrossWinds Golf Course was completed for a cost of $185,000, construction of new greenways and pathways at Pedigo Park and from WKU to Parks and Recreation were completed at a cost of $732,000, and reconfiguration of the Hobson GolfCourse and addition of a driving range rounded out the year with a total cost of $788,000. Projects underway during FY2021 include the second phase of improvements for the bunkers at CrossWinds Golf Course, development for a new riverfront park area, irrigation improvements at Hobson Golf Course and resurfacing and resealing of parking lots and tennis courts.
Several pieces of larger equipment were purchased during FY2020 for the Public Works Department, including: a vacuum truck, Ford dump truck, skid steer loader, several lifts, and a full size truck for a total cost of $712,000. Also, the Fire Department completed the purchase of two new fire trucks during the fiscal year at a cost of over $1.5 million. The trucks were EXLOW�WR�WKH�&LW\¶V�specifications and have now been delivered and are in-service.
AWARDS AND ACKNOWLEDGEMENTS
AwardsThe Government Finance Officers Association of the United States and Canada (GFOA) awarded a Certificate of Achievement for Excellence in Financial Reporting to the City of Bowling for its Comprehensive Annual Financial Report for the fiscal year ended June 30, 2019. In order to be awarded a Certificate of Achievement, a government must publish an easily readable and efficiently organized comprehensive annual financial report. This report must satisfy both generally accepted accounting principles and applicable legal requirements.
The GFOA has also given an Award for Outstanding Achievement in Financial Reporting to the City of Bowling Green for its Popular Annual Financial Report for the fiscal year ended June 30, 2019. The Award for Outstanding Achievement in Popular Annual Financial Reporting is a prestigious national award recognizing conformance with the highest standards for preparation of state and local government popular reports. In order to receive an Award for Outstanding Achievement in Popular Annual Financial Reporting, a government must publish a Popular Annual Financial Reportwhose contents conform to program standards of creativity, presentation, understandability and reader appeal.
A Certificate of Achievement for Excellence in Financial Reporting and an Award for Outstanding Achievement in Popular Financial Reporting are valid for a period of one year only. We believe our current reports continue to conform to the reporting requirements and we will be submitting both reports to the GFOA this year.
5

AcknowledgementsThe preparation of this report could not have been accomplished without the dedicated services of the entire staff in the Department of Finance. We wish to express our sincere appreciation to all members of the department for their assistance, with special thanks to Erin Ballou, Assistant Chief Financial Officer; Sean Weeks, Assistant Chief Financial Officer; and to the staff of MCM CPAs and Advisors LLP.
Respectfully submitted,
Katie Schaller-WardAssistant City Manager/Chief Financial Officer
6

G!vernment Finance Officers Ass!ciati!n
Certificate !f Achievementf!r Excellence
in Financial Rep!rting
Presented t!
C!ty of Bowl!ng Green Kentucky
F!r its C!mprehensive AnnualFinancial Rep!rt
F!r the Fiscal Year Ended
June 30, 2019
Executive Direct!r/CEO
7

8
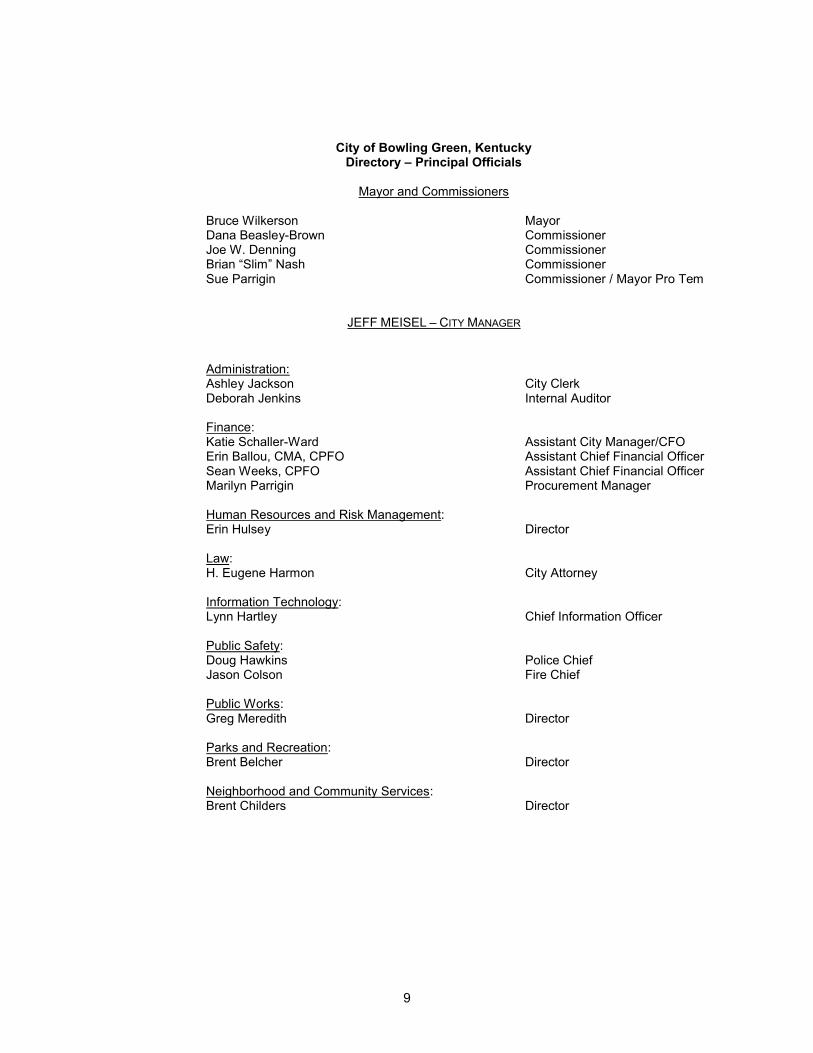
City of Bowling Green, KentuckyDirectory ± Principal Officials
Mayor and Commissioners
Bruce Wilkerson MayorDana Beasley-Brown CommissionerJoe W. Denning Commissioner%ULDQ�³6OLP´�1DVK CommissionerSue Parrigin Commissioner / Mayor Pro Tem
JEFF MEISEL ± CITY MANAGER
Administration:Ashley Jackson City ClerkDeborah Jenkins Internal Auditor
Finance:Katie Schaller-Ward Assistant City Manager/CFOErin Ballou, CMA, CPFO Assistant Chief Financial OfficerSean Weeks, CPFO Assistant Chief Financial OfficerMarilyn Parrigin Procurement Manager
Human Resources and Risk Management:Erin Hulsey Director
Law:H. Eugene Harmon City Attorney
Information Technology:Lynn Hartley Chief Information Officer
Public Safety:Doug Hawkins Police ChiefJason Colson Fire Chief
Public Works:Greg Meredith Director
Parks and Recreation:Brent Belcher Director
Neighborhood and Community Services:Brent Childers Director
9
�������������� ������� �
����� ��������� ������������������������������������ ��� ���
��� �� ����������������������
���!�"�����������!�������#����������� ���������������!����"����� �����"��������!������������#������"��������!������������������ ��#����������#������������!���$�����������!�����������������������������������!������������� ��� ����%�������&�!��'����'(��������������!�����������)���*���+�+�������!��� ��������������!�������� �������������!��!��� ����"� �����#�����!������,�������������� �������������� ���������!����� �����������-�
���������������� ���������� ����������������������
.!������,���������� ��� ��#���� �� ��� �!�� #�#������ ��� ���� #������������ �!���� ������ � ���������� ��������������!����������#���# ������� ������#�������!��/�����0���������1�����2��!����� ������!�����������# ������������������������� ���� ����� �� �"�������!��#�#�������������#������������������ ������������!�������������������� ���������������!��!������������������-
��� �������� ���������
3�� ��#����� ���� ��� ��� �4#�����#������� �!���� ������ ���������������������������-�������� ��� ������ �!�������� ���������������!��5� ���������6�����!���, 7��������6����!��!��� ��������� �����������89�+*:�*;< ������)���*���+�+���������� �������������8=���>*< �� �!�����������)���*���+�+�-����� �����������������!�������� ����������������� ��� ��������#� �/�� �������!��!��#������� �����!�������������!���"������������������!�����������)���*���+�+� ����!��������� ��#����������#�������-�.!���������� ����������������������������!�����������!�����#�����!����!�"����������!�����������������#������������������ ���������!����������� ���������!��5� ���������6�����!���, 7��������6��������� ��� ��������#� �/�� ����������������� � �����!���#��������!����!���������-������������������������������������!��������������������� ������#�������!��/�����0���������1����������!�����������## ���� ���� ������ ��������������������������� ���������������������������!�����#�� �� ��� �����!��/�����0�����-�.!�������������?�����!������# �����#������!����������������������� �����������������!��!���!�������� ���������������������������� ������������-�

����
�������������� ������� � �� ������
��� �������� ����������� ������
1��������"� "���#�������#������������������������"�������������!���������������� ���������!�������� ����������-� .!�� #�������� �� ������ ��#��� �� �!�� ������,�� $�������� �� ����� �!�� ���������� ��� �!�� ����� ��������� �����������������!�������� �������������!��!������������������-�@��������!���������������������!��������������������� ����� �� �"�������!������,� #�#�������������#�������������!�������� ��������������������������������#���������!�������##�#��������!��������������������������!��#�#��������4#���������#�������!���������"���������!������,� ���� ����� -�1������ �� ����4#���������!� #���-�1�������� ����� ������"� �������!���##�#��������������������#� ���������������!�������� ������������������������������������������������������������ �����"� �������!���"�� �#�������������!�������� ����������-�
����� ��"���!����!���������"���������!�"���������������������������##�#��������#�"�������������������������#����-
!���� ��
@�����#��������������������������!���#���������!������������!�������� �����������������������"��#�������� ��� �� � ������� � ��#������ �!�� ��#����"�� ������ � #������� ��� �!�� ��"����� � ����"������� �!�� ����������#������"��������!������������������ ��#����������#������������!���$���������� �!�����������������������������������!������������� ��� ���������)���*���+�+�������!����#����"���!������������� �#������������!����## ���� ��� ���!� � ���� �!����� ��� �!� ���� �!�� ����� ��������������!����������#���# ������� ������#�������!��/�����0���������1�����-
!����������
��� ������ ������������������
1��������#���# ������� ������#�������!��/�����0���������1�������?�����!����!����������,����������������� �������#������* �!���!�++��������������#����������������#�����<> �!���!�;���#��������35A����!��� �����#�����;+ �!���!�;; ����!�����������1##���!���������0������@������������#��� �1��������#�����;> �!���!�>+ ���#������������## ������!�������������� ����������-�0��!������������ �!���!������#�������!�������������� ����������������?���������!�� �"����� �1��������0��������������!���������������������������� �#������������ ��#��������# ������!�������������� ����������������##�#������#������ ������������� !������� � ����4�-���� !�"�� �## ���� ������ ������� #�������� ��� �!�� �?����� ��## ������� ��������� ��������������!��������������������� ������#��� ���!��/�����0���������1��������!��!��������������?�������������������������!�����!�������#�#�����!�����������������#�����!���������������������������!���������,����#������������?��������!�������������� �����������������!����� ����������������������������������!�������������� ����������-�����������4#�������#������#�"������������������!������������������� �!�� ������� #��������������#�"���� ������!� ���������� �"������ ��� �4#���� �� �#������ #�"���� ����������-

��+�
�������������� ������� ���� ������
!������������ ������
��������������
3�������������������������!��#�#��������������#��������!�������� ������������!����� ����"� �����#�����!������,�������������� ����������- .!���������������������#��������!���!�>��������� ������"���� ���������������������!��� �����#�����>; �!���!��=<���!������������ ����������#������=; �!���!��<= ����!��0�!��� �����A4#�����������6���� �1�������#�����;� ����;�������?���������!���������?�����������.�� ��+�/-0-��������� 6���� � 7��� ������ &'�67'(� 5��� +���� /����� 1���������"� 7�?��������� ����� 5���# ���� ��� 1�����7�?�����������6���� �1�����&/����� ������(� ���#����������#�#���������������� ��� �����������������?�����#�������!�������������� ����������-�
.!����������������"���� ��������������������!��� �������!��0�!��� �����A4#�����������6���� �1�������� �!����#����� ��������������������������"����������� ��������� �� ��� �!����� ������������������!����������������#�#����!� ����� ������ ����������-�0��!����������!����������$��������� �!����������#�������� �## ���� �� �!�� ������ ��� �!�� ������ ������ � ���������� ��� ������ �������� � #��������� �� ��������#������������ ������!��������������� ������!����� ������������������!����������������#�#����!�� ������ ������ � ���������� �� ��� �!�������� ������ � ���������� �!���� "���� �����!�� �������� �#�������� ����������� ���!� �������� �������� ���� �� ����#���� �� �!�� /����� 0������ ��� 1�����-� @� ��� �#����� �!����������������� ������������ ������� ���#�������� ���������!�������������� �����������������!� �-
.!�������������������������������� ���� ���!�"������������$����������!����������#���������## ��������������!����!�������������!������������!�������������� ���������������������� �������4#�������#������#�"������������������!��-
!������� �������"������������������ ��������������
@�������������!���������� �������������������!�"��� ��������������#���������B�"�����>� +�+� ��������������������!������,������ ����� ��"�������� ��#�����������������������������# ��������!�������#�"��������� �������� �������������������������������������!��������-�.!��#�#��������!����#������������������!�����#���������������������� ����� ��"�������� ��#�����������# ���������!����� �������!����������� ��� ��� ��� #�"���� �� �#���� �!�� �������"����� �� ���� � ���� � �"�� ������ � �#����� �� �����# ����-�.!����#������������� �#��������������#���������������������!���������� ��������������������������!������,������ ����� ��"�������� ��#�����������# ����-
C�4������%������B�"�����>��+�+�

MANAGEMENT'S DISCUSSION AND ANALYSIS
The Management Discussion and Analysis (MD&A) offers readers of the financial statements an overview andanalysis of the financial position and activities of the City of Bowling Green (“the City”) for the fiscal year endedJune 30, 2020. The information presented here should be read in conjunction with the Letter of Transmittal andthe financial statements immediately following this analysis.
Financial Highlights
The City’s assets exceeded liabilities at the close of the fiscal year by $203.6 million (net position). This
amount included $21.8 million of resources restricted to specific projects by laws, regulations or
contractual agreements. A deficit total of $35.6 million of resources was unrestricted principally due to
GASB 68 Accounting and Financial Reporting for Pensions, which was implemented during Fiscal Year
2015, and GASB 75 Accounting and Financial Reporting for Postemployment Benefits other than
Pensions (OPEB), which was implemented in Fiscal Year 2018.
The City’s total net position increased $8.4 million this year, net position of governmental activities
increased $7.9 million and net position of business-type activities increased by $0.5 million. The increase
is a result of the purchase of capital assets and the reduction of outstanding debt through scheduled
principal payments during FY2020.
As of June 30, 2020, the City’s governmental funds reported combined ending fund balances of $77.6
million, an increase of $4.0 million over the prior year. Of the total fund balances amount, $13.5 million in
the General Fund was unassigned and available for spending. The committed fund balance total of $18.1
million represents the minimum reserve balance set by the City’s reserve balance policy, which calculates
the reserve balance as 25% of the adopted revenue budget.
The City's governmental activities total assets increased by $17.4 million primarily as a result of current
year additions to capital assets for infrastructure and other improvement projects, while governmental
activities deferred outflows of resources did not change. Business-type activity assets increased by $0.7
million due to increased cash and investment holdings that resulted from a decrease in spending during
FY2020.
The City’s governmental activities total liabilities and deferred inflows of resources increased by $9.5
million due to increased liabilities for pensions and OPEB. Business-type activity debt increased by $0.3
million as a result of increased vouchers payable due to inception of a new construction project.
Overview of the Financial Statements
This report was published under the standards for governmental financial reporting prescribed by theGovernmental Accounting Standards Board in Statement No. 34 (GASB 34). This reporting format consists of aseries of financial statements that provide an overview of all services provided by or supported by the City (thegovernment-wide statements) and provides more detailed information about major programs of the City (the fundstatements).
The GASB 34 reporting model was designed to provide improved information to the reader. The statementspresent a financial picture of the City as a whole through the use of a consolidated statement of all funds,eliminating interfund transfers. In addition, the values of fixed assets of governmental-type operations arepresented. Under prior reporting standards, the infrastructure assets for governmental-type funds were notreported or depreciated.
Government-Wide Financial Statements
Government-wide financial statements include the Statement of Net Position and the Statement of Activities. Thestatements include all assets and liabilities using the accrual basis of accounting, which is similar to the accountingused by most private-sector companies. In accrual accounting, revenues earned and expenses incurred in thefiscal year are taken into account in the financial statements regardless of when cash is actually received or paid.
13

The Statement of Net Position presents information on all the City’s assets and liabilities as of June 30, 2020. Netposition is the difference between assets and liabilities. Over time, increases or decreases in net position are oneindicator of whether financial health is improving or deteriorating. Information on other factors, such as changes inthe revenue structure and the condition of the City’s assets, is also needed to assess the overall financial situationof the City.
The Statement of Activities presents the City's annual revenues and expenses, as well as other transactions thatincrease or reduce net position. Program revenues are offset by program expenses in order to provide betterinformation as to the net program costs that are financed by general government revenues.
The government-wide statements divide the various City functions into three kinds of activities:
Governmental activities - Most of the City's basic services are reported here, including police, fire, public
works, parks, golf, aquatics, community development and general administration. Occupational license
fees, property taxes and service charges finance most activities.
Business-type activities - Activities are primarily funded from the charges and fees to cover the cost of
services. This solely includes the operations of the Sloan Convention Center.
Component units - The City includes one separate legal entity as a component unit: Bowling Green
Municipal Utilities. Although legally separate, component units are important because the City is held
financially accountable.
Fund Financial Statements
Fund financial statements report the City's operations in more detail than the government-wide statements byproviding information about the City's most significant funds. Some funds are required to be established by locallaw or by bond covenants. However, many other funds are established to help control and manage money for aparticular purpose. Two types of funds are presented in the fund financial statements: governmental funds andproprietary funds.
Governmental funds - Most of the City's basic services are reported in governmental funds. The
statements provide a short-term view of general government operations and show how services are
financed as well as the balances left at year end that are available for future spending. Funds are reported
using the modified accrual basis of accounting, which measures cash and all other financial assets that
can be readily converted to cash. The relationship between the governmental activities (reported in the
Statement of Net Position and Statement of Activities) and the governmental funds is described in a
reconciliation, which is presented immediately following the fund financial statements. Under accounting
guidelines, the City considers the General Fund, WKU Athletics Fund, Debt Service Fund, and ITA Bond
Fund to be major governmental funds.
Proprietary funds - When the City charges fees for services that are intended to cover the majority of the
cost of providing the services, whether to outside customers or to other units of the City, the services are
generally reported in proprietary funds. The subcategories of the funds include enterprise funds, which are
business-type activities, and internal service funds that report services provided to internal units of
government. The proprietary funds are reported in the same way that all activities are reported in the
government-wide statements, but the fund statements provide more detail. The City considers the
Convention Center Fund to be a major proprietary fund.
14

The City as Trustee
The City is trustee, or fiduciary, for the closed Police and Firefighters' Retirement Fund. The City is alsoresponsible for other assets that, due to a trust arrangement, can be used only for trust beneficiaries. All the City'sfiduciary activities are reported separately after the Proprietary Fund Statements. The activities are excluded fromthe other government-wide and fund statements since the City cannot use these assets to finance operations.
Government-wide Financial Analysis
Net Position
The following table summarizes the City’s financial position as of June 30, 2020. The City reported assets greaterthan liabilities by $203.6 million, an increase of $8.4 million over last year. The increase in net position is primarilya result of the reduction of outstanding debt due to scheduled principal payments alongside an increase in capitalassets. Business-type activities increased as a result of reductions in expenses, specifically facility repairs, withreduced revenues still outpacing expenditures. An $18.1 million increase in assets and deferred outflows ofresources is from the current year purchase of capital assets and a driver of the increase in net position over lastyear. Of the $203.6 million in net position, $217.3 million, or 106.7%, was the net investment in capital assets andunrestricted net position equaled a deficit balance of $35.6 million, or -17.5%. The net position of governmentalactivity funds totaled $187.3 million, which was comprised of the net investment in capital assets totaling $210.5million, or 112.4%, and a deficit balance of $45.0 million, or -24.0%, as unrestricted. The unrestricted net positionof governmental funds included fund balances of the General Fund and various special revenue funds.
Summary of Net PositionJune 30, 2020
(in millions)
Governmental Activities Business-type ActivitiesTotal
Primary Government
2020 2019 2020 2019 2020 2019
Current and other assets $ 132.2 $ 128.6 $ 9.7 $ 8.9 $ 141.9 $ 137.5Capital assets 230.8 217.0 6.8 6.9 237.6 223.9
Total assets 363.0 345.6 16.5 15.8 379.5 361.4
Deferred outflows of resources 37.4 37.4 - - 37.4 37.4
Long-term liabilities 186.2 177.3 - - 186.2 177.3Other liabilities 15.0 14.2 0.3 - 15.3 14.2
Total liabilities 201.2 191.5 0.3 - 201.5 191.5
Deferred inflows of resources 11.8 12.0 - - 11.8 12.0
Net position:Net investment in capital assets 210.5 195.0 6.8 6.9 217.3 201.9Restricted for:
Debt service 5.7 5.5 - - 5.7 5.5Capital projects 12.8 24.5 - - 12.8 24.5Community development 2.1 1.8 - - 2.1 1.8Perpetual care 1.2 1.2 - - 1.2 1.2
Unrestricted (45.0) (48.6) 9.4 8.9 (35.6) (39.7)
Total net position $ 187.3 $ 179.4 $ 16.2 $ 15.8 $ 203.6 $ 195.2
*Numbers may not total due to rounding
The net position of the City's business-type activities totaled $16.2 million. Of the net position total, $6.8 million(42%) was net investment in capital assets and $9.4 million (58%) was unrestricted.
15

Analysis of City Operations
The following table summarizes City operations for the fiscal year ended June 30, 2020. Governmental activitiesincreased the City of Bowling Green’s net position by $7.9 million, accounting for 94% of the total increase. Theincrease in net position is a result of increased capital asset and infrastructure acquisitions and the scheduledpaydown of outstanding debt. Business-type activities increased the City’s net position by $0.5 million, which was6% of the total increase. The increase in Business-type net position is due to the purchase of capital assets andcompletion of capital improvements during Fiscal Year 2020 at the Convention Center.
Statement of ActivitiesJune 30, 2020
(in millions)
Governmental Activities Business-type ActivitiesTotal
Primary Government
2020 2019 2020 2019 2020 2019
RevenuesProgram revenues:
Charges for services $ 2.4 $ 4.5 $ 0.1 $ 0.2 $ 2.5 $ 4.7Operating grants and
contributions 17.0 11.4 - - 17.0 11.4Capital grants and
contributions 6.1 4.6 - - 6.1 4.6General revenues
Property taxes 15.8 15.0 - - 15.8 15.0Insurance premium taxes 4.7 4.5 - - 4.7 4.5Transient room taxes - - 0.5 0.5 0.5 0.5Wage taxes and net profit
fees 54.6 53.6 - - 54.6 53.6Other general revenues 1.4 2.7 0.2 0.3 1.6 3.0
Total revenues 102.0 96.3 0.8 1.0 102.8 97.3
Program ExpensesGeneral government 33.2 28.3 - - 33.2 28.3Public safety 27.4 26.3 - - 27.4 26.3Public works 14.8 12.7 - - 14.8 12.7Parks and recreation 4.9 6.8 - - 4.9 6.8Neighborhood and comm.
services 6.4 5.3 - - 6.4 5.3Agency services 2.7 2.5 - - 2.7 2.5Interest expense 4.6 5.1 - - 4.6 5.1Convention Center - - 0.4 0.8 0.4 0.8
Total program expenses 94.0 87.0 0.4 0.8 94.4 87.8
Increase/decrease in netposition before transfers 8.0 9.3 0.4 0.2 8.4 9.5
Transfers (0.1) (0.9) 0.1 0.9 - -
Change in net position 7.9 8.4 0.5 1.1 8.4 9.5
Net position, beginning of year 179.4 171.0 15.7 14.6 195.1 185.6
Net position, end of year $ 187.3 $ 179.4 $ 16.2 $ 15.8 $ 203.6 $ 195.1
*Numbers may not total due to rounding
16

Revenues for the City’s governmental activities totaled $102.0 million at June 30, 2020, compared to $96.3 million in the prior year. The increase is due to additional operating and capital grants to help offset the effect of COVID-19 as well as positive wage growth prior to COVID-19 related closures. The increase in property taxes is due to new home and multi-family construction and property value assessment increases. The City’s largest source of revenue, wage taxes and net profit fees, totaled $54.6 million, or 53.5%, of governmental revenue during FY2020. The second largest category of revenues, operating and capital grants, accounted for $23.1 million, or 22.6%, of total revenue. Other revenue sources included property taxes ($15.8 million), charges for services ($2.4 million) and insurance premium taxes ($4.7 million).
Current year expenses of the City’s governmental activities totaled $94.0 million, compared to $87.0 million in theprior year. The primary increase in expenses was due to the purchase of two new fire apparatus in the PublicSafety program and various on-going contruction projects, including a new fire station, evidence storage facility,downtown development, and multiple road projects. The City’s largest expense category, General Government,ended the fiscal year with expenses totaling $33.2 million, or 35.2%, of total expenses during FY2020. The secondlargest category of expenses was Public Safety, with a total of $27.4 million, or about 29.1%, of total expenses.Other expense categories include Public Works ($14.8 million), Parks and Recreation ($4.9 million), andNeighborhood and Community Services ($6.4 million) and interest expense ($4.6 million).
17

Business-type Activities
Revenues for business-type activities totaled $0.8 million during Fiscal Year 2020, compared to $1.0 million lastyear. Of the $0.8 million of revenues, $0.1 million, or 12.5%, was collected as charges for services fees. Non-service fee revenue included a 3% transient room tax and interest income. Expenses for business-type activitiestotaled $0.4 million during FY2020, which is a decrease of $0.4 million reported last year due to the completion ofseveral non-capital repairs at the Sloan Convention Center in FY2019.
Funds of the City of Bowling Green
The City's governmental funds for the year ended June 30, 2020, reflected a combined ending total fund balanceof $77.6 million, an increase of $4.0 million over the prior year. The increase in fund balance was a result of wagegrowth prior to COVID-19 closures and unantipicated grant awards related to COVID-19. Of the $77.6 million totalfund balance, $13.5 million was unassigned in the General Fund and available for spending at the City's discretion.The remaining balance was comprised of non-spendable, assigned, committed, and restricted amounts; indicatingthat the funds were not available for spending, or that spending was otherwise restricted by State statute or by Cityordinance, or have been dedicated to pay outstanding contracts or purchase orders, or to fund future debt servicepayments, or intended to be used for specific purposes.
The total fund balance in the General Fund at June 30, 2020, was $33.6 million, which represents an increase of$5.6 million from the prior year. The increase in fund balance was mainly a result of an increase in grant fundingfrom other governments to aid in the City's response to COVID-19. Of the $33.6 million total fund balance,unassigned fund balance was $13.5 million and reflected 17.2% of General Fund revenues, representing residualnet resources that have not been restricted, committed or assigned to specific purposes. Committed fund balancewas $18.1 million and was the General Fund’s minimum reserve balance equal to 25% of budgeted revenues,which was increased from 20% in FY2016. Assigned fund balance totaled $1.7 million, or 2.2%, of General Fundrevenues; non-spendable fund balance was $298,345; and restricted was $67,000. The fund balances for thesecategories represented prepaid items, inventories, spending restricted to specific purposes, and funds reserved topay contracts and purchase orders outstanding as of June 30, 2020.
The Debt Service Fund is used to account for the accumulation of resources and payments made for principal andinterest on long-term general obligation debt in the governmental funds. The City transfers funding from theGeneral Fund, Fire Improvement Fund, and Job Development Incentive Fund to fully cover annual governmentaldebt service expenditures posted in the Debt Service Fund.
18
The WKU Athletics Fund is used to account for the revenues and expenditures associated with the City’s$29,580,000 Special Revenue Refunding Bonds, Series 2010 and Series 2011. The original bond issuance wasutilized to improve and increase public use of athletic and parking facilities belonging to Western KentuckyUniversity. The University reimburses the City for the total annual debt service of the bonds each year throughstudent athletic fees and luxury suite rentals.
The final major governmental fund, the Inter-Modal Transportation Authority, Inc. (ITA) Bond Fund, was used toaccount for the revenues and expenditures related to the refunding of ITA mortgage-backed bond issues thatfunded the acquisition and construction of the Kentucky Transpark. Total fund balance of the ITA Bond Fund was$1.8 million as of June 30, 2020. Of the $1.8 million total fund balance, all was assigned fund balance.
The City's proprietary fund statements provide the same type of information found in the government-widefinancial statements, but in more detail. Total net position in the proprietary fund, which consists solely of theConvention Center, equaled $16.2 million as of June 30, 2020, compared to $15.8 million last year. The gain in theConvention Center Fund net position was due to a reduction in repair costs, which outpaced the reduction inrevenue due to COVID-19. Of the total net position, $6.8 million represented the net investment in capital assetsand $9.4 million was unrestricted.
General Fund Budgetary Highlights
Over the course of the Fiscal Year, the Board of Commissioners approved revisions of the General Fund’s budgetfive times in order to make adjustments for additional revenues collected for grants and donations not known whenthe budget was initially adopted. In all, the revenue budget was increased by $6,384,100 or +8.9%. The changesare briefly summarized below.
Original revenue estimates were changed by the following:
Grants $ 6,350,850Contributions & donations 32,750Parks & Recreation 500
The comparison of actual revenue to the final amended revenue budget yielded significant budgetary variances foremployee withholdings ($2.1 million), grants ($-0.6 million), and net profits ($-0.7 million). Employee withholdingsbounced back in Fiscal Year 2020 with a 2.7% increase over FY2019 actual collections due to continued growth inthe population and economic base resutling from numerous expansions and new projects within the region. Realestate taxes outpaced budget by $0.3 million with the continued new construction of both commercial andresidential property and additions to the tax roll. Net profit collections for the year missed the budgetaryexpectation by $0.7 million and as a result the FY2021 budget was reduced by 13.1%.
The total expenditure budget was increased by $3,953,070 or +6.4%, during the Fiscal Year. Theincrease was primarily due to the acceptance and appropriation of federal grant funds for the City's COVID-19response. Other major changes are due to the following:
General Government $ (158,000)Fire 2,493,600Police 1,795,560Parks and Recreation (8,690,060)Neighborhood & Community Services 575,900Agency Services (323,670)Public Works 438,730
The comparison of actual expenditures to the final amended expenditure budget resulted in significant budgetaryvariances in the following activities: Public Works ($831,000), Parks and Recreation ($958,000), Police($2,695,000) and Fire ($2,604,000). The positive variances are a result of unspent budgeted projects anddisciplined under-spending.
19

Capital Assets
The City's investment in capital assets totaled $237.0 million as of June 30, 2020, which was an increase of $13.1million from the prior year. This investment includes land, buildings, infrastructure, improvements, vehicles,equipment, and intangible assets. For governmental activities, investments totaled $230.2 million. Comparably,FY2019 had a capital asset investment total of $216.7 million.
This year's major capital additions are shown below:
Downtown capital improvements phase I $ 4,209,874Street infrastructure improvements/additions 3,969,769Public Safety apparatus and vehicle replacements 2,310,007Sidewalk infrastructure improvements/additions 1,339,829Public Works vehicle and heavy equipment replacement 589,752Hobson Golf driving range construction and netting 563,284Stormwater infrastructure improvements/additions 538,855WKU to Downtown Bikeway/Greenway 526,981Public Safety property acquisition 275,938Butler County landfill leachate management system 290,274Pedigo Park greenway construction 205,185
The following table summarizes the changes in net capital assets:
(Net of Depreciation, stated in millions)
GovernmentalActivities
Business-typeActivities
TotalPrimary Government
2020 2019 2020 2019 2020 2019
Land $ 17.5 $ 18.2 $ 2.3 $ 2.3 $ 19.8 $ 20.5Infrastructure 135.2 130.3 - - 135.2 130.3Building 29.1 30.7 4.0 4.3 33.1 35.0Improvements other than buildings 27.9 22.7 - - 27.9 22.7Vehicles, equipment and furniture 12.1 9.6 0.1 0.1 12.2 9.7Construction in progress 7.3 3.8 0.3 0.1 7.6 3.9Intangibles 1.0 1.2 - - 1.0 1.2Property held under capital lease 0.1 0.1 - - 0.1 0.1
Total * $ 230.2 $ 216.7 $ 6.8 $ 6.8 $ 237.0 $ 223.9
*Numbers may not total due to rounding
The City has elected to apply the Modified Approach to accounting for street and sidewalk infrastructure systemsas set forth in GASB 34. With this approach, the City uses an overall condition index (OCI) to assess the surfacecondition of individual pavement segments. The City’s policy is to consider streets and sidewalks in need when theOCI rating falls below minimum functional classification values. The City’s most recent assessment in 2020 foundthat 74% of streets and 89% of sidewalks met or exceeded this goal. The estimated amount needed to maintainCity streets and sidewalks at the specified levels for FY2021 was $1,500,000 and $100,000 respectively, whichwas included in the FY2021 budget. Additional information on the City's capital assets activity can be found in note3C.
20

Debt Administration
Bowling Green was the first city in the State to begin issuing general obligation (GO) bonds in Fiscal Year 1999 asa result of changes in State law that had previously precluded this type of financing. Since GO bonds are backedby the full faith and credit of the City, the bonds carry a higher credit rating than other forms of debt and have lowerinterest rates. Consequently, the majority of any future issuance of bonded debt by the City will be GO debt.
Prior to the issuance of GO bonds, mortgage revenue bonds were issued through various public corporations inorder to finance public projects. For mortgage revenue bonds, the City entered into automatically annuallyrenewable lease agreements with the corporations whereby lease payments from the City, combined withrevenues generated by the operation of the facilities, were sufficient to meet debt service obligations. Theunderlying security for the bonds was the annually renewable lease agreements and the underlying mortgages onthe property. Revenue bonds, where only the revenues from the operation of the facilities are pledged as securityfor the bonds, are now issued primarily to finance improvements to the sanitary water and sewer system. Foradditional detail on the City’s debt transactions, please refer to note 3E of this report.
At the end of the Fiscal Year, the City had $65.7 million in bonds and notes outstanding, net of discounts andpremiums.
The following table is a summary of the changes in the City’s outstanding long-term obligations, which are furtherexplained in Note 3E.
Outstanding Debt at Year EndJune 30, 2020
(in millions)
Governmental Activities Business-type ActivitiesTotal
Primary Government
2020 2019 2020 2019 2020 2019
General obligation & revenue bonds $ 58.8 $ 67.2 $ - $ - $ 58.8 $ 67.2Notes & lease purchase agreements 4.6 3.5 - - 4.6 3.5Compensated absences 2.1 1.9 - - 2.1 1.9Landfill post-closure costs 2.2 2.3 - - 2.2 2.3Bond premiums, discounts, refunding loss 2.3 2.5 - - 2.3 2.5
Total $ 70.0 $ 77.4 $ - $ - $ 70.0 $ 77.4
*Numbers may not total due to rounding
The City maintains bond ratings of “Aa2” from Moody's and “AA” from Standard & Poor's. Despite the provisionsfor the issuance of GO debt already discussed, legal limits remain on the total amount of GO indebtedness thatmay be incurred. The Kentucky Constitution provides that the total principal amount of city net indebtedness,which excludes self-supporting obligations, revenue bonds, special assessment debt, and non-tax supported debt(net debt applicable to limit), cannot exceed 10% of the value of taxable property in the city ($660,362,747).Therefore, the current debt margin of the City is $594.7 million (See Statistical Schedule 18).
Next Year's Budget
During the budget planning for FY2021, revenue growth projections were impacted by the future effects of thecoronavirus pandemic on the local economy. Using a combination of analysis techniques from the pastrecession’s impacts on net profits and the influences on employee withholdings, a conservative forecasting modelwas developed identifying a 9.7% decline in revenues across all funds compared to the FY2020 adopted budget.Fortunately, preliminary growth estimates for property taxes offset a portion of the projected regression. TheFY2021 adopted General Fund budget is balanced without utilization of fund balance nor an increase in taxes.
21

The FY2021 adopted expenditure budget for all funds decreased by 8.4% from the FY2020 original budget andincludes a 2.3% cost of living adjustment (COLA) for employees. The Capital Improvement Project (CIP) budget is$20.6 million, which includes debt service, and is a 21.7% decrease compared to the $25.8 million FY2020 CIPbudget. The FY2021 budget continued funding the committed fund balance at 25% of the adopted General Fundrevenue budget or $16.7 million. The committed fund balance acts as the City’s ‘rainy day’ account and can beaccessed by a majority vote of the Board of Commissioners.
Improvements in community livability, traffic and roads, parks facilities, and technology enhancements are some ofthe highlights of the FY2021 capital budget. Improving traffic flow is a top priority and is addressed in the budgetwith $3,985,000 allocated for Phase II and Phase III construction of the Shive Lane widening and expansionproject. The City also continues investing in the BG Reinvestment/Local Strategy Area by leveraging 80% of theannual CDBG allocation and $200,000 of local tax revenues to implement improvements in the third target area,which encompasses Census Tracts 103.3 and 103.4 (Old Morgantown Road to Morgantown Road). Otherintersection spot improvements in the amount of $200,000 at Main Avenue and Kentucky/Adams Streets andEighth Avenue are also included in the FY2021 budget.
The City continues to fund street overlay ($1.5 million), stormwater mitigation ($200,000), downtownimprovements ($500,000), and a new greenways expansion program ($150,000) in the FY2021 budget.Additionally, the City continues to invest in parks and recreation capital improvements and purchases ($2.2 million)as part of the Parks Master Plan implementation.
New initiatives in the FY2021 budget include funding to enhance public and employee safety with expansion of theCity’s Employee Assistance Program (EAP) services, establishment of a first responder peer support team,construction of a safe haven baby box at the new fire station on Lovers Lane, and replacement of public safetyequipment which has reached its end of useful life. The FY2021 budget furthers the City's efforts to meet thedemands of a growing community.
Request for Information
This financial report was designed to provide a general overview of the City of Bowling Green's finances for allthose interested. Questions concerning any of the information provided in this report or requests for additionalinformation should be addressed to Katie Schaller-Ward, Assistant City Manager/Chief Financial Officer, PO Box430, Bowling Green, Kentucky, 42102-0430 or can be e-mailed to [email protected].
22

City of Bowling Green, KentuckyStatement of Net PositionJune 30, 2020
Primary Government Governmental
ActivitiesBusiness-Type
Activities Total Component Unit
ASSETSPooled cash and cash equivalents $ 41,735,328 $ - $ 41,735,328 $ -Non-pooled cash and cash equivalents 2,945,434 3,388,921 6,334,355 34,862,909Investments 35,511,975 6,315,837 41,827,812 -Receivables (net):
Accounts 1,756,838 308 1,757,146 11,086,833Other 150,116 - 150,116 2,755,167Accrued interest 6,133 2,561 8,694 -
Due from other governmental units 6,524,819 - 6,524,819 -Due from Western Kentucky University 15,340,000 - 15,340,000 -Prepaid items 1,051,651 - 1,051,651 353,788Prepaid rent 26,870,164 - 26,870,164 -Inventories 342,634 - 342,634 1,460,448Other assets - - - 1,983,545Restricted assets:
Restricted cash - TVA - - - 1,785,481Investments - - - 51,639,792
Capital assets, net of accumulated depreciation: Non-depreciable 149,471,501 2,614,552 152,086,053 27,696,300Depreciable 80,735,164 4,192,544 84,927,708 193,428,888
Net pension asset 608,379 - 608,379 -
Total assets 363,050,136 16,514,723 379,564,859 327,053,151
DEFERRED OUTFLOWS OF RESOURCESOutflows for pensions 23,243,952 - 23,243,952 7,105,128Outflows for OPEB 10,265,418 - 10,265,418 3,188,347Deferred amounts from refunding debt 3,844,475 - 3,844,475 441,614
Total deferred outflows of resources 37,353,845 - 37,353,845 10,735,089
LIABILITIESVouchers and accounts payable 3,281,598 270,477 3,552,075 10,796,795Accrued payroll 1,140,055 - 1,140,055 -Accrued interest payable 240,818 - 240,818 1,020,465Insurance claims payable 607,964 - 607,964 -Other current liabilities - - - 2,670,723Unearned revenue 65,109 - 65,109 -Deposits 794,721 - 794,721 6,535,690Non-current liabilities
Due within one yearCompensated absences 1,164,139 - 1,164,139 982,506Bonds payable 7,040,000 - 7,040,000 5,589,804Notes capital lease obligations 613,681 - 613,681 758,313Landfill closure and post closure costs 71,420 - 71,420 -
Due in more than one yearCompensated absences 957,109 - 957,109 451,894Bonds payable 54,086,049 - 54,086,049 124,294,657Notes and capital lease obligations 3,971,629 - 3,971,629 1,038,731Landfill closure and post closure costs 2,164,356 - 2,164,356 -Advances from customers and TVA - - - 99,786Net pension liability 99,305,777 - 99,305,777 35,505,693Net OPEB liability 25,735,785 - 25,735,785 8,488,994
Total liabilities 201,240,210 270,477 201,510,687 198,234,051
DEFERRED INFLOWS OF RESOURCESInflows for pensions 4,171,709 - 4,171,709 882,291Inflows for OPEB 7,674,385 - 7,674,385 3,088,158
Total deferred inflows of resources 11,846,094 - 11,846,094 3,970,449
See accompanying notes.23

City of Bowling Green, KentuckyStatement of Net PositionJune 30, 2020
Primary Government Governmental
ActivitiesBusiness-Type
Activities Total Component Unit
Continued from previous page
NET POSITIONNet investment in capital assets 210,484,781 6,807,096 217,291,877 129,653,697Restricted for
Debt service 5,732,817 - 5,732,817 11,002,273Capital projects 12,766,106 - 12,766,106 -Community development 2,087,886 - 2,087,886 -Perpetual care 1,235,636 - 1,235,636 -
Unrestricted (44,989,549) 9,437,150 (35,552,399) (5,072,230)
Total net position $ 187,317,677 $ 16,244,246 $ 203,561,923 $ 135,583,740
See accompanying notes.24

City of Bowling Green, KentuckyStatement of ActivitiesFor the Year Ended June 30, 2020
Program Revenues Changes in Net Position
Primary Government
Function/Programs ExpensesCharges for
Services
OperatingGrants and
Contributions
Capital Grantsand
ContributionsGovernmental
ActivitiesBusiness-type
Activities TotalComponent
Units
PRIMARY GOVERNMENTGovernmental activities:
General government $ 33,240,486 $ 745,125 $ 4,429,221 $ 4,048,234 $ (24,017,906) $ - $ (24,017,906) $ -Public safety 27,383,455 219,791 7,451,445 598,788 (19,113,431) - (19,113,431) -Public works 14,839,341 - 1,108,548 1,389,896 (12,340,897) - (12,340,897) -Parks and recreation 4,889,698 1,451,062 - 10,424 (3,428,212) - (3,428,212) -Neighborhood and comm. services 6,382,391 - 3,976,679 95,621 (2,310,091) - (2,310,091) -Agency services 2,673,446 - - - (2,673,446) - (2,673,446) -Interest expense 4,616,856 - - - (4,616,856) - (4,616,856) -
Total governmental activities 94,025,673 2,415,978 16,965,893 6,142,963 (68,500,839) - (68,500,839) -
Business-type activities: Convention Center 371,054 102,041 - - - (269,013) (269,013) -
Total business-type activities 371,054 102,041 - - - (269,013) (269,013) -
Total primary government $ 94,396,727 $ 2,518,019 $ 16,965,893 $ 6,142,963 $ (68,500,839) $ (269,013) $ (68,769,852) $ -
COMPONENT UNITSBowling Green Municipal Utilities 115,572,501 121,795,189 - 797,498 - - - 7,020,186
Total component units $ 115,572,501 $ 121,795,189 $ - $ 797,498 $ - $ - $ - $ 7,020,186
GENERAL REVENUES: Property taxes 15,811,675 - 15,811,675 -Insurance premium taxes 4,667,114 - 4,667,114 -Transient room taxes - 475,577 475,577 -Wages and net profits 54,608,120 - 54,608,120 -Investment income 851,895 197,464 1,049,359 1,335,882Gain (loss) on disposal of capital assets (1,879,514) (45,575) (1,925,089) 8,579Merchandising revenues - - - 120,436Miscellaneous 2,450,476 7,733 2,458,209 -
Total general revenues 76,509,766 635,199 77,144,965 1,464,897Transfers (100,000) 100,000 - -
76,409,766 735,199 77,144,965 1,464,897
Change in net position 7,908,927 466,186 8,375,113 8,485,083
Net position, beginning of year 179,408,750 15,778,060 195,186,810 127,098,657
Net position, end of year $ 187,317,677 $ 16,244,246 $ 203,561,923 $ 135,583,740
See accompanying notes.25

City of Bowling Green, KentuckyBalance Sheet - Governmental FundsJune 30, 2020
General FundWKU
Athletics Debt Service ITA Bond
NonmajorGovernmental
Funds
TotalGovernmental
Funds
ASSETSPooled cash and cash equivalents $ 13,177,146 $ - $ - $ 1,360,845 $ 23,746,845 $ 38,284,836Non-pooled cash and cash equivalents 1,649,278 - - - 1,296,156 2,945,434Investments 14,047,063 - - 199,941 18,423,745 32,670,749Receivables (net of allowances for uncollectibles):
Accounts receivable 1,602,853 - - - 147,986 1,750,839Western Kentucky University - 15,340,000 - - - 15,340,000Interest receivable 436 - - - 5,522 5,958
Due from other governmental units 5,080,001 - - 194,143 1,250,675 6,524,819Prepaid items 223,934 - - - 268,119 492,053Inventories 74,411 - - - - 74,411
Total assets $ 35,855,122 $ 15,340,000 $ - $ 1,754,929 $ 45,139,048 $ 98,089,099
LIABILITIES AND FUND BALANCESLiabilities
Vouchers and accounts payable 316,071 - - - 2,834,907 3,150,978Accrued payroll 1,102,805 - - - 14,872 1,117,677Unearned revenue - 15,340,000 - - 65,109 15,405,109Security deposits 794,721 - - - - 794,721
Total liabilities 2,213,597 15,340,000 - - 2,914,888 20,468,485
Fund balancesNon-spendable:
Prepaid Items 223,934 - - - - 223,934Inventories 74,411 - - - - 74,411
Restricted for:Cemetery perpetual - - - - 1,107,519 1,107,519Community services - - - - 1,619,859 1,619,859Streets and sidewalks - - - - 134,803 134,803Public safety grants 67,000 - - - 1,432,931 1,499,931Lampkin park - - - - 20,753 20,753
Committed to:Economic stabilization 18,063,000 - - - - 18,063,000Economic development - - - - 5,277,378 5,277,378Police and fire improvements - - - - 1,536,073 1,536,073Landfill - - - - 1,319,770 1,319,770Sidewalks - - - - 687,633 687,633
Assigned to:Debt Service - - - 1,754,929 3,977,888 5,732,817General government services 172,238 - - - 1,489,763 1,662,001Police and fire services 134,696 - - - 5,329,830 5,464,526Public works services 416,304 - - - 13,972,729 14,389,033Neighborhood and community services 215,203 - - - 1,341,418 1,556,621Parks and recreation 235,831 - - - 2,975,813 3,211,644Other purposes 571,669 - - - - 571,669
Unassigned 13,467,238 - - - - 13,467,238
Total fund balances 33,641,524 - - 1,754,929 42,224,160 77,620,613
Total liabilities and fund balances $ 35,855,121 $ 15,340,000 $ - $ 1,754,929 $ 45,139,048 $ 98,089,098
See accompanying notes.26

City of Bowling Green, KentuckyReconciliation of the Balance Sheet of Governmental FundsTo the Statement of Net PositionJune 30, 2020
Fund balances - total governmental funds $ 77,620,613
Amounts reported for governmental activities in the Statement of Net Positionare different because:
Capital assets used in governmental activities are not financial resources and,therefore, are not reported in the funds.
Governmental capital assets 295,859,725Less accumulated depreciation (66,152,816) 229,706,909
Internal service funds are used by management to charge the cost of certainactivities, such as insurance and fleet maintenance, to individual funds.The assets and liabilities of the internal service funds are included ingovernmental activities in the statement of net position. 6,826,165
Other long term assets, including the City's receivables from a formeremployee and WKU, are not available to pay for current periodexpenditures and, therefore, are deferred in the funds. 15,490,116
Prepaid rent, which represents amounts due from the Inter-ModalTransportation Authority (ITA), is a noncurrent asset which is not availableto pay current period expenditures. 26,870,164
Long-term liabilities, including bonds payable and accrued interest payable,are not due and payable in the current period and, therefore, are notreported in the funds.
Net pension liability (98,697,398)Net OPEB liability (25,735,785)Net deferred inflows and outflows associated with pension 19,072,243Net deferred inflows and outflows associated with OPEB 2,591,033General obligation bonds (58,785,000)Premiums, deferred charges and discounts on bond obligations 1,503,426Notes and lease purchase agreements (4,585,310)Accrued interest payable (240,818)Accrued compensated absences (2,082,905)Landfill postclosure care (2,235,776) (169,196,290)
Net position of governmental activities $ 187,317,677
See accompanying notes.27

City of Bowling Green, KentuckyStatement of Revenues, Expenditures, and Changes in Fund Balances - Governmental Funds Year Ended June 30, 2020
General FundWKU
Athletics Debt Service ITA Bond
NonmajorGovernmental
Funds
TotalGovernmental
Funds
REVENUESProperty taxes $ 15,041,104 $ - $ - $ 14,702 $ 755,868 $ 15,811,674Insurance premium taxes 2,306,962 - - - 2,360,151 4,667,113Wages and net profits 51,328,167 - - - 2,631,210 53,959,377License and permits 1,472,401 - - - 284,060 1,756,461Intergovernmental 5,766,540 2,979,508 - - 9,074,200 17,820,248Investment income 422,064 - - 3,056 348,409 773,529Charges for services 677,591 - - - 86,558 764,149Parks and recreation 1,419,098 - - - - 1,419,098Rent income - - - 93,485 - 93,485Miscellaneous 282,193 - - 1,165,109 175,782 1,623,084Judgements and settlements - - - - 30,983 30,983Contributions and donations - - - - 1,271,161 1,271,161
Total revenues 78,716,120 2,979,508 - 1,276,352 17,018,382 99,990,362
EXPENDITURESCurrent:
General government 6,825,694 - - - 852,996 7,678,690Public safety 30,002,931 - - - 3,737,249 33,740,180Public works 7,725,874 - - - 4,217,772 11,943,646Parks and recreation 7,243,669 - - - 242,410 7,486,079Neighborhood and community services 2,375,524 - - - 3,601,630 5,977,154Agency services 2,632,446 - - - - 2,632,446
Capital outlay - - - - 16,052,642 16,052,642Debt service:
Principal - 2,340,000 3,865,594 1,925,000 740,000 8,870,594Interest - 639,508 719,809 201,662 715,087 2,276,066
Total expenditures 56,806,138 2,979,508 4,585,403 2,126,662 30,159,786 96,657,497
Excess (deficiency) of revenues over (under)expenditures 21,909,982 - (4,585,403) (850,310) (13,141,404) 3,332,865
Other financing sources (uses): Transfers in 614,399 - 4,585,403 1,017,500 16,103,302 22,320,604Transfers out (16,940,916) - - - (6,281,190) (23,222,106)Issuance of debt - - - - 1,531,518 1,531,518Proceeds from sale of capital assets 59,874 - - - - 59,874
Total other financing sources (uses) (16,266,643) - 4,585,403 1,017,500 11,353,630 689,890
Net change in fund balances 5,643,339 - - 167,190 (1,787,774) 4,022,755
Fund balances, beginning 27,998,185 - - 1,587,739 44,011,934 73,597,858
Fund balances, ending $ 33,641,524 $ - $ - $ 1,754,929 $ 42,224,160 $ 77,620,613
See accompanying notes.28

City of Bowling Green, KentuckyReconciliation of the Statement of Revenues, Expenditures and Changes in Fund Balancesof the Governmental Funds to the Statement of ActivitiesYear Ended June 30, 2020
Net change in fund balances - total governmental funds $ 4,022,755
Amounts reported for governmental activities in the statement of activities are differentbecause:
Governmental funds report capital outlays as expenditures; however, in the statement ofactivities, the cost of those assets is allocated over their estimated useful lives asdepreciation expense. Governmental funds also report only the proceeds from sales offixed assets while the net gain or loss is reported in the statement of activities. Inaddition, infrastructure assets donated to the City are not recorded on the governmentalfunds but are donated capital on the statement of activities:
Capital asset additions 20,858,298Governmental depreciation expense (5,387,604)Net sales and disposals of capital assets (1,939,410) 13,531,284
Certain long-term receivables are not available for the payment of current expendituresand therefore are not reported in the governmental funds. Payments on thesereceivables are recorded as revenue in the governmental funds and reduction of thereceivable in the statement of net position. (2,363,052)
The issuance of long-term debt provides current financial resources to governmental fundswhile the repayment of the principal long-term debt consumes the current financialresources of government funds. Neither transaction, however, has any effect on netposition. Also governmental funds report the effect of issuance costs, premiums,discounts and similar items when debt is first issued, whereas these amounts aredeferred and amortized in the statement of activities. This amount is the net effect ofthese differences in the treatment of long-term and related items. 6,975,435
Principal and interest payments made in relation to refunded ITA debt are currentexpenditures in the governmental funds. These items are recorded as prepaids in thestatement of activities as they represent a long-term lease agreement. 46,045
Accrued interest expense on long-term debt is reported in the statement of activities, butdoes not require the use of current financial resources; therefore, accrued interestexpense is not reported as expenditures in governmental funds. 30,958
Some expenses reported in the statement of activities do not require the use of currentfinancial resources and, therefore are not reported as expenditures in governmentalfunds:
Compensated absences payable (199,195)Landfill postclosure care 45,374
The net pension expense is an actuarial calculation and does not require the use of currentfinancial resources and it is excluded as an expenditure in governmental funds.Additionally, since the current year contributions to the pension plan will be included inthe subsequent year's pension expense calculation, those contributions should not beconsidered in the government-wide statements. (14,199,563)
The internal service funds used by management to charge the costs of insurance and fleetmaintenance to individual funds are not reported in the entity-wide statement of activities.Governmental fund expenditures and related internal fund revenues are eliminated. 18,886
Net change in net position - governmental activities $ 7,908,927
See accompanying notes.29

City of Bowling Green, KentuckyStatement of Net Position - Proprietary FundsJune 30, 2020
Business-Type ActivitiesEnterprise Fund
GovernmentalActivities
Convention CenterInternal Service
Funds
ASSETSCurrent assets
Pooled cash and cash equivalents $ - $ 3,450,493Non-pooled cash and cash equivalents 3,388,921 -Investments 6,315,837 2,841,227Accounts receivable 308 6,000Interest receivable 2,561 175Prepaid items - 559,598Inventories - 268,223
Total current assets 9,707,627 7,125,716
Capital assetsLand 2,290,764 -Construction in progress 323,788 -Buildings 10,724,543 440,576Machinery and equipment 1,035,627 553,026Improvements other than buildings 74,550 -
14,449,272 993,602Less: accumulated depreciation (7,642,176) (493,846)
Capital assets, net 6,807,096 499,756
Total noncurrent assets 6,807,096 499,756
Total assets 16,514,723 7,625,472
LIABILITIESCurrent liabilities
Vouchers and accounts payable 270,477 130,622Accrued payroll - 22,378Insurance claims payable - 607,964Current portion of compensated absences - 21,042
270,477 782,006
Noncurrent liabilitiesNoncurrent portion of compensated absences - 17,301
Total noncurrent liabilities - 17,301
Total liabilities 270,477 799,307
NET POSITIONNet invested in capital assets 6,807,096 499,756Unrestricted 9,437,150 6,326,409
Total net position $ 16,244,246 $ 6,826,165
See accompanying notes.30

City of Bowling Green, KentuckyStatement of Revenues, Expenses, and Changes in Net Position - Proprietary FundsYear Ended June 30, 2020
Business-TypeActivities
Enterprise FundGovernmental
Activities
Convention CenterInternal Service
Funds
OPERATING REVENUESTransient room taxes $ 475,577 $ -Charges for services 102,041 1,969,975Insurance premium taxes - 8,143,827Judgements and settlements 7,733 115,952Contributions and donations - 6,000Miscellaneous - 1,736
Total operating revenues 585,351 10,237,490
OPERATING EXPENSESPersonnel services 9,652 887,731Contractual services - 1,005,072Supplies - 1,090,645Utilities - 29,064Repairs and maintenance 19,693 111,855Insurance premiums and claims 36,725 7,913,066Depreciation 304,970 55,528Miscellaneous 15 5,508
Total operating expenses 371,055 11,098,469
Operating income (loss) 214,296 (860,979)
NONOPERATING REVENUES (EXPENSES)Interest income 197,464 78,366Gain (loss) on disposital of capital assets (45,574) -
Total nonoperating income 151,890 78,366
Income (loss) before transfers 366,186 (782,613)
Transfers in 100,000 1,025,500Transfers out - (224,000)
Total transfers 100,000 801,500
Net income 466,186 18,887
Net position, beginning of year 15,778,060 6,807,278
Net position, end of year $ 16,244,246 $ 6,826,165
See accompanying notes.31

City of Bowling Green, KentuckyStatement of Cash Flows - Proprietary FundsYear Ended June 30, 2020
Business-TypeActivities -
Enterprise FundsGovernmental
Activities
Convention CenterInternal Service
Funds
CASH FROM OPERATING ACTIVITIESCash received from customers $ 123,231 $ 10,535,619Other cash receipts 475,577 -Payments to employees (9,834) (878,427)Cash payments to suppliers 214,044 (2,044,424)Claims paid - (8,060,795)
Net cash provided by (used in) operating activities 803,018 (448,027)
CASH FROM NONCAPITAL FINANCING ACTIVITIESTransfers in 100,000 1,025,500Transfers out - (224,000)
Net cash provided by noncapital financing activities 100,000 801,500
CASH FROM CAPITAL AND RELATED FINANCING ACTIVITIESPurchase of capital assets (272,588) (50,243)
CASH FROM INVESTING ACTIVITIESInterest received 199,569 78,706Purchase of investments (153,726) (243,390)
Net cash provided by (used in) investing activities 45,843 (164,684)
Net increase (decrease) in cash and cash equivalents 676,273 138,546
Cash and cash equivalents at beginning of period 2,712,648 3,311,947
Cash and cash equivalents at end of period $ 3,388,921 $ 3,450,493
Reconciliation of operating loss to net cash provided by (used in) operatingactivitiesOperating loss $ 214,296 $ (860,979)
Adjustments to reconcile operating loss to net cash provided by (used in)operating activities
Depreciation 304,970 55,528Changes in assets and liabilities:
Inventories - (18,418)Accounts receivable 13,457 298,129Accounts payable 270,477 9,610Prepaid items - 206,528Compensated absences - 2,522Accrued payroll (182) 6,782Insurance claims payable - (147,729)
Net cash provided (used) by operating activities: $ 803,018 $ (448,027)
See accompanying notes.32

City of Bowling Green, KentuckyStatement of Fiduciary Net PositionJune 30, 2020
Pension Trust-Police &
Firefighters'Retirement Agency Funds
ASSETSPooled cash and cash equivalents $ - $ 269,381Non-pooled cash and cash equivalents 174,774 1,529,135Receivable from other government - 344,558Accrued interest receivable 23,939 -Investments
Corporate securities 1,957,272 -Mutual funds 3,347,356 -United States government securities 102,973 -Kentucky local municipal bonds 629,073 -Certificate of deposit - 91,046
Total investments 6,036,674 91,046
Total assets $ 6,235,387 $ 2,234,120
LIABILITIESDue to other governmental units - 695,213Other liabilities - 1,529,136Due to other taxing units - School Board - 9,771
Total liabilities $ - $ 2,234,120
NET POSITIONRestricted for pensions $ 6,235,387
See accompanying notes.33

City of Bowling Green, KentuckyStatement of Changes in Fiduciary Net PositionYear Ended June 30, 2020
Pension Trust-Police &
Firefighters'Retirement
ADDITIONSInvestment income $ 410,937
Total additions 410,937
DEDUCTIONSBenefit payments 725,077
Total deductions 725,077
Change in net position (314,140)
Net position, beginning of year 6,549,527
Net position, end of year, restricted forpensions $ 6,235,387
See accompanying notes.34

City of Bowling Green, Kentucky
NOTES TO FINANCIAL STATEMENTS PAGE
NOTE 1. SUMMARY OF SIGNIFICANT ACCOUNTING POLICIES................................................................................................................................................................................................................................................................................................................................................................................................................................................................................................................................36A. Reporting Entity................................................................................................................................................................................................................................................................................................................................................................................................................................................................................................................................36B. Related Organization................................................................................................................................................................................................................................................................................................................................................................................................................................................................................................................................37C. Joint Venture................................................................................................................................................................................................................................................................................................................................................................................................................................................................................................................................37D. Basic Financial Statements................................................................................................................................................................................................................................................................................................................................................................................................................................................................................................................................38E. Basis of Presentation................................................................................................................................................................................................................................................................................................................................................................................................................................................................................................................................39F. Assets, Liabilities and Fund Equity................................................................................................................................................................................................................................................................................................................................................................................................................................................................................................................................40G. Revenues, Expenditures and Expenses................................................................................................................................................................................................................................................................................................................................................................................................................................................................................................................................44H. Estimates................................................................................................................................................................................................................................................................................................................................................................................................................................................................................................................................44
NOTE 2. STEWARDSHIP, COMPLIANCE AND ACCOUNTABILITY................................................................................................................................................................................................................................................................................................................................................................................................................................................................................................................................44A. Compliance with Finance Related Legal and Contractual Provisions................................................................................................................................................................................................................................................................................................................................................................................................................................................................................................................................44
NOTE 3. DETAIL NOTES ON ALL FUNDS................................................................................................................................................................................................................................................................................................................................................................................................................................................................................................................................44A. Cash and Investments................................................................................................................................................................................................................................................................................................................................................................................................................................................................................................................................44B. Unrestricted Assets................................................................................................................................................................................................................................................................................................................................................................................................................................................................................................................................49C. Capital Assets................................................................................................................................................................................................................................................................................................................................................................................................................................................................................................................................49D. Interfund Transfers................................................................................................................................................................................................................................................................................................................................................................................................................................................................................................................................51E. Long-term Debt................................................................................................................................................................................................................................................................................................................................................................................................................................................................................................................................52F. Net Position................................................................................................................................................................................................................................................................................................................................................................................................................................................................................................................................60
NOTE 4. RISK MANAGEMENT................................................................................................................................................................................................................................................................................................................................................................................................................................................................................................................................60
NOTE 5. COMMITMENTS AND CONTINGENCIES................................................................................................................................................................................................................................................................................................................................................................................................................................................................................................................................61A. Litigation................................................................................................................................................................................................................................................................................................................................................................................................................................................................................................................................61B. Bowling Green Municipal Utilities................................................................................................................................................................................................................................................................................................................................................................................................................................................................................................................................61C. Construction Commitments................................................................................................................................................................................................................................................................................................................................................................................................................................................................................................................................62D. Contingencies................................................................................................................................................................................................................................................................................................................................................................................................................................................................................................................................62E. Liens and Encumbrances................................................................................................................................................................................................................................................................................................................................................................................................................................................................................................................................63F. Conduit Debt................................................................................................................................................................................................................................................................................................................................................................................................................................................................................................................................63G. Lease Commitments................................................................................................................................................................................................................................................................................................................................................................................................................................................................................................................................63
NOTE 6. THE SINGLE AUDIT ACT................................................................................................................................................................................................................................................................................................................................................................................................................................................................................................................................63
NOTE 7. DEFINED BENEFIT PENSION PLANS................................................................................................................................................................................................................................................................................................................................................................................................................................................................................................................................63A. The Police and Firefighters' Retirement Fund (PFRF)................................................................................................................................................................................................................................................................................................................................................................................................................................................................................................................................63B. The County Employees Retirement System (CERS)................................................................................................................................................................................................................................................................................................................................................................................................................................................................................................................................67
NOTE 8. POSTEMPLOYMENT BENEFITS OTHER THAN PENSIONS (OPEB)................................................................................................................................................................................................................................................................................................................................................................................................................................................................................................................................70
NOTE 9.
NOTE 10.
DEFINED CONTRIBUTION PLANS................................................................................................................................................................................................................................................................................................................................................................................................................................................................................................................................74
TAX ABATEMENTS................................................................................................................................................................................................................................................................................................................................................................................................................................................................................................................................75
NOTE 11. SUBSEQUENT EVENTS................................................................................................................................................................................................................................................................................................................................................................................................................................................................................................................................76
NOTE 12. IMPLEMENTATION OF GASB 89................................................................................................................................................................................................................................................................................................................................................................................................................................................................................................................................77
NOTE 13. RECENT PRONOUNCEMENTS................................................................................................................................................................................................................................................................................................................................................................................................................................................................................................................................77

City of Bowling Green, KentuckyNotes to the Financial StatementsFor the Year Ended June 30, 2020
NOTE 1. SUMMARY OF SIGNIFICANT ACCOUNTING POLICIES
The financial statements of the City of Bowling Green (the City) have been prepared in accordance with generallyaccepted accounting principles (GAAP) as applied to governmental units. The Governmental AccountingStandards Board (GASB) is the standard-setting body for government accounting and financial reporting. TheGASB periodically updates its codification of the existing Governmental Accounting and Financial ReportingStandards which, along with subsequent GASB pronouncements (Statements and Interpretations), constitutesGAAP for governmental units. The more significant of these accounting policies are described below and, whereappropriate, subsequent pronouncements will be referenced.
A. Reporting Entity
The accompanying financial statements present the City and its component units (traditionally separate reportingentities), for which the City is considered to be financially accountable. The City (the primary government) isfinancially accountable if it appoints a voting majority of the organization’s governing board and (1) is able toimpose its will on the organization, or (2) there is a potential for the organization to provide specific financial benefitto or impose specific financial burden on the City. Additionally, the City is required to consider other organizationsfor which the nature and significance of their relationship with the City are such that exclusion would cause theCity’s financial statements to be misleading or incomplete. The financial statements are formatted to allow the userto clearly distinguish between the primary government and its component units.
1. Blended Component Units
The agencies and organizations listed below are, in substance, the same as the City, despite being legallyseparate from the City. Therefore, they are reported as part of the primary government. They have a governingbody that is substantially the same as the governing body of the City; provide services entirely, or almost entirely,to the City; or otherwise exclusively, or almost exclusively, benefit the City even though they do not provideservices directly to the City. The agencies and organizations listed below are also financially dependent upon theCity and the City does have operational responsibility.
Fiduciary Fund Type
City of Bowling Green Police and Firefighters' Retirement Fund. Retired or disabled City public safetyemployees participate in the Police and Firefighters' Retirement Fund. The Fund functions for the benefit ofthese employees and surviving spouses and is administered by a Board of Trustees consisting of the Mayor,City Chief Financial Officer and retiree representatives of the police and fire departments.
The City contributes amounts to fund current service costs and interest on unfunded past service costs basedupon actuarial valuations. Plan benefit levels are determined by Kentucky Revised Statues.
Proprietary Fund Type
The Convention Center Corporation. The non-profit corporation was organized as an agency,instrumentality and constituted authority of the City for the express purpose of planning, financing andconstructing a municipal convention center and trade show facility and CrossWinds golf course pro shopfacility. The Convention Center Corporation does not issue separate financial statements.
The Board of Directors consists of the Mayor, City Commissioners and Warren County Judge-Executive.Special taxing districts have been created by the City and County in the Hartland Planned Community forConvention Center Corporation operations. Bond issuance is approved by the Board of Commissioners. TheCorporation is reported as an enterprise fund and does not issue its own seperate financial statements.
36

City of Bowling Green, KentuckyNotes to the Financial StatementsFor the Year Ended June 30, 2020
NOTE 1. SUMMARY OF SIGNIFICANT ACCOUNTING POLICIES
A. Reporting Entity
2. Discretely Presented Component Units
The agency described below is included in the City's reporting entity because the City appoints the governing bodyand the agency is fiscally dependent on the City. The agency is reported as discretely presented component unitbecause the primary government is financially accountable and is able to impose its will on the organization or thecomponent unit provides specific financial benefits or imposes specific financial burdens on the primarygovernment. The component unit issues its own seperate financial statements.
Proprietary Fund Type
Bowling Green Municipal Utilities (BGMU). Board member appointments are made by the City's Board ofCommissioners. The Electric Division is a distributor of electrical power under the authority of the FederalEnergy Regulatory Commission and the Tennessee Valley Authority and provides service to customersprimarily in the City. The Electric Division has erected various street lighting systems for the City for whichmonthly rental amounts are paid to the utility by the City based on a percentage of total unamortizedinvestment.
The Water-Sewer Division operates the water treatment and the waste-water treatment facilities servingcustomers primarily in the City. The rates for user charges and bond issuance authorization are approved bythe Board of Commissioners.
The General Services Division operates the fiber optic network in the City.
B. Related Organization
City officials are also responsible for appointing the members to boards of other organizations, but the City'saccountability for these organizations does not extend beyond making the appointments.
C. Joint Venture
The Inter-Modal Transportation Authority, Inc. (ITA) is a non-profit corporation organized for the purpose ofacquiring and financing public projects and public facilities as an agent for the City and the County of Warren,Kentucky, jointly. In the year ended June 30, 2008, the City approved the issuance of General Obligation bonds(Series 2007 B & C) in the amount of $27,415,000 to refinance the ITA's mortgage-backed bonds that wereoutstanding. The City entered into a ground lease with the Authority, providing for the City’s acquisition of aleasehold estate in the project. The City, Warren County, and the Authority entered into a Contract, Lease &Option agreement in which the Authority and County shall lease back the project from the City in consideration ofrental payments to be utilized by the City in support of the payment of principal and interest on the generalobligation bonds. The City and Warren County have each pledged to evenly share any shortfalls towards paymentof debt service on the outstanding bonds. In 2013, there was a significant land sale to the State for right-of-wayuse on the I-65 connector road planned in the near future. It generated approximately $2.3 million that was usedfor a partial early redemption call on the 2007C bonds through 2018. Subsequently, during FY2016 theoutstanding debt of the 2007B and 2007C bonds were partially refunded by General Obligation Refunding Bonds,Series 2016A & B in the total amount of $15,300,000. During FY2020, the City and County made scheduled debtservice contributions in the amount of $2,126,662. The separately audited financial statements of the ITA can beobtained from the City Clerk's office.
37

City of Bowling Green, KentuckyNotes to the Financial StatementsFor the Year Ended June 30, 2020
NOTE 1. SUMMARY OF SIGNIFICANT ACCOUNTING POLICIES
D. Basic Financial Statements
Government-wide and Fund Financial Statements
The basic financial statements include both government-wide and fund financial statements. The reporting modelfocus is either on the City as a whole or on major individual funds. The government-wide financial statementsreport information on all of the non-fiduciary activities of the City and its component units. Both the government-wide and fund financial statements categorize primary activities as either governmental or business-type.
Governmental activities normally are supported by taxes and intergovernmental revenues. Business-type activitiesrely to a significant extent on fees and charges for support. In the Government-wide Statement of Net Position,both the governmental and business-type activities are presented on a consolidated basis by column.
The Government-wide Statement of Activities demonstrates the degree to which the direct expenses of a functionare offset by program revenues. Direct expenses (including depreciation) are those that are clearly identifiable witha specific function. Program revenues are directly associated with the function and include charges for servicesand grants and contributions that are restricted to meeting the operational or capital requirements of a particularfunction. Operating grants include operating-specific and discretionary (either operating or capital) grants whilecapital grants are capital-specific. Occupational license fees applied to gross wages and net profits, other licensefees and permits, taxes, interest income and other revenues not properly included in program revenues arereported as general revenues.
Separate financial statements are provided for governmental funds, proprietary funds, and fiduciary funds, eventhough fiduciary funds are excluded from the government-wide financial statements. Major individualgovernmental and enterprise funds are reported as separate columns in the fund financial statements. Non-majorfunds (by category) are summarized into a single column.
Basis of Accounting and Financial Statement Presentation
The government-wide financial statements are reported using the economic resources measurement focus andthe accrual basis of accounting as are the proprietary fund and fiduciary financial statements. With thismeasurement focus, all assets and all liabilities, including long-term assets, as well as long-term debt andobligations, are included in the Statement of Net Position. Revenues are recorded when earned, and expensesare recorded when a liability is incurred, regardless of the timing of related cash flows.
Governmental fund financial statements are reported using the current financial resources measurement focusand the modified accrual basis of accounting. Revenues are recognized when they are both measurable andavailable. "Available" means collectible within the current period or soon enough thereafter to be used to payliabilities of the current period. For the City, available means expected to be received within sixty days of year end.Major revenue sources not susceptible to accrual include charges for services, penalties and fines, andmiscellaneous revenues. Such revenues are recorded as revenues when received because they are generally notmeasurable or available until actually received. Intergovernmental revenues received for specific purposes orprojects are recognized when the applicable eligibility requirements are met. Revenues received before theeligibility requirements are met are reported as unearned revenue. Expenditures are recorded when the liability isincurred except: (1) principal and interest on long-term debt is recorded when due, and (2) compensatedabsences are accounted for as expenditures in the period used.
Since the Governmental fund statements are presented on a different measurement focus and basis ofaccounting than the Government-wide statements’ governmental column, a reconciliation is presented on thepage following each statement which briefly explains the adjustments necessary to transform the fund basedfinancial statements into the Governmental column of the Government-wide presentation.
38

City of Bowling Green, KentuckyNotes to the Financial StatementsFor the Year Ended June 30, 2020
NOTE 1. SUMMARY OF SIGNIFICANT ACCOUNTING POLICIES
D. Basic Financial Statements
Basis of Accounting and Financial Statement Presentation
Internal service funds provide services primarily to other funds of the City and are presented in summary form aspart of the proprietary fund statements. Since the principal users of the internal services are the City’sgovernmental activities, the internal service funds’ financial statements are consolidated into the Governmentalcolumn in the Government-wide statements. Governmental funds reimburse the Employee Health Care Fund,Workers' Compensation Fund, Fleet Maintenance Fund and Property and Casualty Fund for employer insuranceand fleet maintenance expenses; these revenues and expenses are eliminated upon consolidation. Directexpenses of the internal service funds are not eliminated.
The City’s fiduciary funds are presented in the fund financial statements by type (pension and agency). Sincethese assets are being held for the benefit of a third party (private parties, pension participants, etc.) and cannotbe used for activities or obligations of the City, these funds are not incorporated into the Government-widestatements.
E. Basis of Presentation
The financial statements of the City are recorded in individual funds. Each fund is accounted for by providing aseparate set of self-balancing accounts that is comprised of its assets, liabilities, reserves, fund equity, revenues,and expenditures or expenses, as appropriate. The various funds are reported by generic classification within thefinancial statements.
In accordance with GASB Statement No. 34, major funds are determined by the percentage of the assets,liabilities, revenues or expenditures/expenses of either fund category or the governmental and enterprisecombined. Any other governmental or enterprise funds that the City believes are particularly important to financialstatement users may also be reported as major. The non-major funds are combined in a column in the fundfinancial statements and detailed in the combining section.
The focus of governmental fund measurement (in the fund financial statements) is on the determination offinancial position and changes in financial position (sources, uses, and balances of financial resources) rather than
on net income. The balance sheets generally contain only current assets and liabilities. The reported fund balance(net current assets) is a measure of “available spendable resources”. The City reports the following majorgovernmental funds:
The General Fund is the primary operating unit of the City and accounts for the revenues and expendituresnot specifically provided for in other funds. Most of the essential governmental services such as police andfire protection, community services, parks and recreation, and general administration are reported in thisfund.
The WKU Athletics Debt Service Fund is used to account for revenues received from Western KentuckyUniversity (WKU) consisting of student athletic fees and suite rentals collected by WKU and remitted to theCity pursuant to the Memorandum of Agreement between the City, WKU and the Hilltopper AthleticFoundation. The student athletic fees and suite rentals are to be paid to the City each year in sufficientamounts to pay debt services on the City's $27,775,000 General Obligation and Special Revenue Bonds,Series 2010 and $1,805,000 General Obligation and Special Revenues Bonds, Series 2011.
The ITA Bond Debt Service Fund is used to account for revenues received from lease payments made bythe ITA and Warren County and expenditures related to the 2016A & 2016B bond issues that were used forrefinancing the Kentucky Transpark debt.
The Debt Service Fund is used to account for the accumulation of resources and payments made forprincipal and interest on long-term general obligation debt in the governmental funds.
39

City of Bowling Green, KentuckyNotes to the Financial StatementsFor the Year Ended June 30, 2020
NOTE 1. SUMMARY OF SIGNIFICANT ACCOUNTING POLICIES
E. Basis of Presentation
The focus of proprietary fund measurement is upon the determination of operating income, changes in netposition, financial position, and cash flows, which is similar to businesses. All assets and all liabilities associatedwith the operation of these funds are included on the balance sheet. The City reports the following majorproprietary fund:
The Convention Center Fund is used to account for the operations of the City's Sloan Convention Center.
Internal Service Funds are used to account for the financing of goods and services provided by one departmentor agency to other departments or agencies of the City on a user charge basis. Internal Service Funds include theFleet Maintenance Fund, Employee Health Care Fund, Workers Compensation Fund and Property and CasualtyFund.
Fiduciary Funds are used to account for assets held on behalf of outside parties, including other governments, oron behalf of other funds within the City. Trust funds account for assets held by the City under the terms of a formaltrust agreement. Fiduciary funds are as follows:
The City of Bowling Green Police and Firefighters' Retirement Fund, a pension trust fund, is used toaccount for the accumulation of resources to be used for retirement annuity payments for retired or disabledpublic safety employees.
Agency funds generally are used to account for assets that the City holds on behalf of others as their agent, arecustodial in nature (assets equal liabilities) and do not involve measurement of results of operations.
Claims Fund is an imprest paying agent for all government funds.
Payroll Fund is an imprest paying agent for City payroll.
Tourist and Convention Fund is used to account for the collection of 4% transient room tax and payment tothe Bowling Green Area Convention and Visitors Bureau and the Convention Center Corporation.
Tax Distribution Fund is used to account for property tax collections and disbursements to the GeneralFund and Bowling Green Independent School System for property taxes billed and collected by the City on itsbehalf.
Treasurer's Distribution Fund is used to account for collection of miscellaneous receipts requiringdisbursement to other outside agencies.
Evidence Storage Fund is used to account for cash collected as police evidence.
Bowling Green/Warren County Adjusted TIF Increment Fund is used to account for TIF revenues basedon an agreement with Warren County. The associated investment account is jointly shared with WarrenCounty with available cash pledged to the County cover debt shortfalls on the County’s 2016 IndustrialRevenue Bonds.
F. Assets, Liabilities and Fund Equity
Deposits and Investments - The City's cash and cash equivalents are considered to be cash on hand, demanddeposits, and short-term investments with original maturities of three months or less from the date of acquisition.Some of the cash resources of the individual funds are combined to form a pool of cash for cash managementpurposes. Interest income earned as a result of pooling is distributed to the appropriate funds based on the endingmonthly balance of pooled cash in each fund. Funds that incur a negative balance in pooled cash during the yearare not charged interest. No reclassification has been made at year end for negative balances of pooled cash.
Investments for the government, as well as its component units, are reported at fair value.
40

City of Bowling Green, KentuckyNotes to the Financial StatementsFor the Year Ended June 30, 2020
NOTE 1. SUMMARY OF SIGNIFICANT ACCOUNTING POLICIES
F. Assets, Liabilities and Fund Equity
Receivables - Receivables are amounts due representing revenues earned or accrued in the current period.
Property taxes attach as an enforceable lien on property as of January 1 each year. Property values are assessedon January 1 of each year, taxes are levied annually by ordinance, and are payable on December 31. The City billsand collects its own property taxes and also collects for the Bowling Green Independent School District.Collections of the City school taxes and remittance to the District are accounted for in the Tax Distribution Fund.City property tax revenues are recognized when levied to the extent that they are both measurable and available.
A receivable is reported for uncollected property taxes. Since these taxes are all at least six months delinquent atJune 30 an allowance for uncollectible accounts has been established for the entire amount.
Interfund Receivables - During the course of its operations, the City has numerous transactions between fundsto finance operations, provide services, construct assets, and service debt. To the extent that certain transactionsbetween funds had not been paid or received as of June 30, 2020, balances of interfund amounts receivable orpayable have been recorded as “due to/from other funds”. Any residual balances outstanding between thegovernmental activities and business-type activities are reported in the Government-wide financial statements as“internal balances.”
Inventories - Inventories are valued at cost, which approximate market, using the first-in/first-out (FIFO) method.The costs of inventory items are recognized as expenditures or expenses when used.
Prepaid Items - Certain payments to vendors reflect costs applicable to future accounting periods and arerecorded as prepaid items in both Government-wide and fund financial statements. Prepaid rent consists ofpayments made by the City in relation to a leasehold estate in the Inter-Modal Transportation Authority (ITA)project, net of current year amortization of rent expense.
Restricted Assets - Certain proceeds of bonds, as well as certain resources set aside for their payment, areclassified as restricted assets on the balance sheet since their use is limited by applicable bond indentures.Construction fund accounts are used to report proceeds of general obligation and revenue bonds and notes thatare restricted for use in construction and capital acquisitions. Depreciation and Maintenance accounts are theresources set aside to provide reasonable reserves for renewals, replacements, improvements, extensions,extraordinary major repairs and contingencies related to bond obligation projects. Sinking Fund accounts are theresources accumulated for debt service payments.
Capital Assets - Capital assets, which include property, plant, equipment and infrastructure assets (e.g. roads,bridges, traffic signals, and similar items), are reported in the applicable governmental or business-type activitiescolumns in the Government-wide financial statements. Land, building, and improvements expenditures for itemshaving a useful life greater than two years and having a cost greater than $25,000 are capitalized. Machinery andequipment expenditures for items having a useful life greater than two years and having a cost greater than$5,000 are capitalized. Such assets are recorded at historical cost or estimated historical cost if purchased orconstructed. Donated capital assets are recorded at acquisition value and recorded as donations at the datereceived. The costs of normal maintenance and repairs that do not add to the value of the asset or materiallyextend asset lives are not capitalized.
41
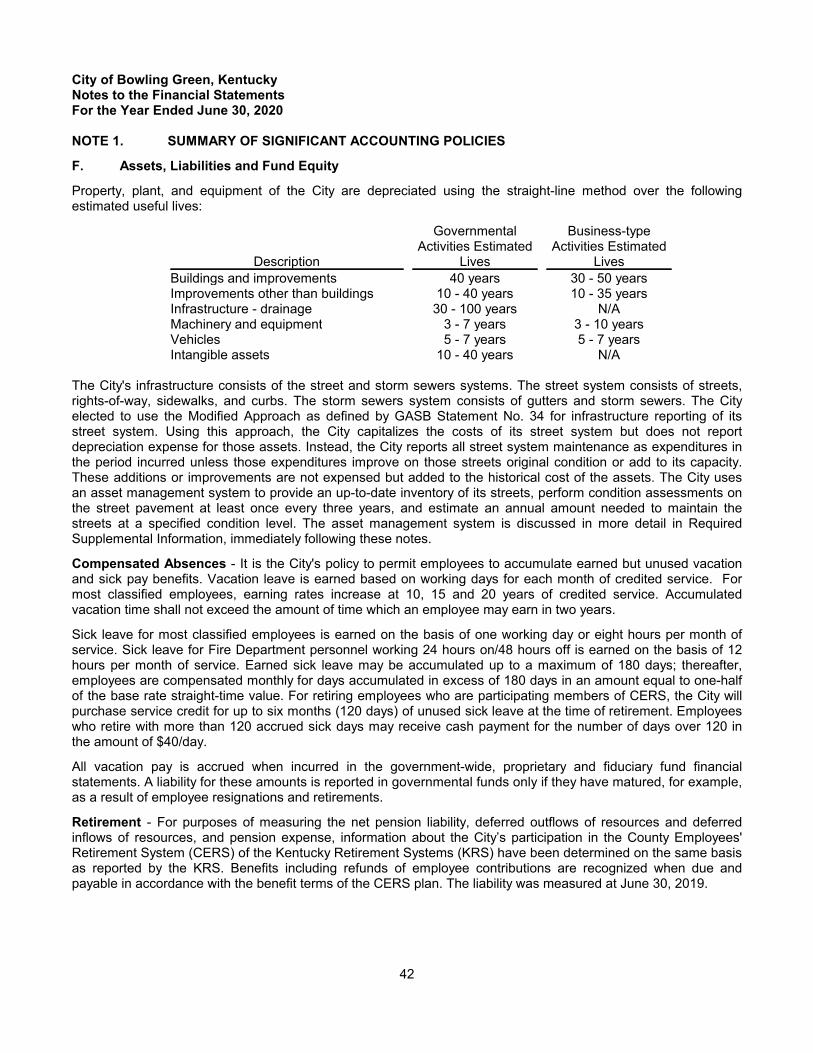
City of Bowling Green, KentuckyNotes to the Financial StatementsFor the Year Ended June 30, 2020
NOTE 1. SUMMARY OF SIGNIFICANT ACCOUNTING POLICIES
F. Assets, Liabilities and Fund Equity
Property, plant, and equipment of the City are depreciated using the straight-line method over the followingestimated useful lives:
Description
GovernmentalActivities Estimated
Lives
Business-typeActivities Estimated
Lives
Buildings and improvements 40 years 30 - 50 yearsImprovements other than buildings 10 - 40 years 10 - 35 yearsInfrastructure - drainage 30 - 100 years N/AMachinery and equipment 3 - 7 years 3 - 10 yearsVehicles 5 - 7 years 5 - 7 yearsIntangible assets 10 - 40 years N/A
The City's infrastructure consists of the street and storm sewers systems. The street system consists of streets,rights-of-way, sidewalks, and curbs. The storm sewers system consists of gutters and storm sewers. The Cityelected to use the Modified Approach as defined by GASB Statement No. 34 for infrastructure reporting of itsstreet system. Using this approach, the City capitalizes the costs of its street system but does not reportdepreciation expense for those assets. Instead, the City reports all street system maintenance as expenditures inthe period incurred unless those expenditures improve on those streets original condition or add to its capacity.These additions or improvements are not expensed but added to the historical cost of the assets. The City usesan asset management system to provide an up-to-date inventory of its streets, perform condition assessments onthe street pavement at least once every three years, and estimate an annual amount needed to maintain thestreets at a specified condition level. The asset management system is discussed in more detail in RequiredSupplemental Information, immediately following these notes.
Compensated Absences - It is the City's policy to permit employees to accumulate earned but unused vacationand sick pay benefits. Vacation leave is earned based on working days for each month of credited service. Formost classified employees, earning rates increase at 10, 15 and 20 years of credited service. Accumulatedvacation time shall not exceed the amount of time which an employee may earn in two years.
Sick leave for most classified employees is earned on the basis of one working day or eight hours per month ofservice. Sick leave for Fire Department personnel working 24 hours on/48 hours off is earned on the basis of 12hours per month of service. Earned sick leave may be accumulated up to a maximum of 180 days; thereafter,employees are compensated monthly for days accumulated in excess of 180 days in an amount equal to one-halfof the base rate straight-time value. For retiring employees who are participating members of CERS, the City willpurchase service credit for up to six months (120 days) of unused sick leave at the time of retirement. Employeeswho retire with more than 120 accrued sick days may receive cash payment for the number of days over 120 inthe amount of $40/day.
All vacation pay is accrued when incurred in the government-wide, proprietary and fiduciary fund financialstatements. A liability for these amounts is reported in governmental funds only if they have matured, for example,as a result of employee resignations and retirements.
Retirement - For purposes of measuring the net pension liability, deferred outflows of resources and deferredinflows of resources, and pension expense, information about the City’s participation in the County Employees'Retirement System (CERS) of the Kentucky Retirement Systems (KRS) have been determined on the same basisas reported by the KRS. Benefits including refunds of employee contributions are recognized when due andpayable in accordance with the benefit terms of the CERS plan. The liability was measured at June 30, 2019.
42

City of Bowling Green, KentuckyNotes to the Financial StatementsFor the Year Ended June 30, 2020
NOTE 1. SUMMARY OF SIGNIFICANT ACCOUNTING POLICIES
F. Assets, Liabilities and Fund Equity
Postemployment Benefits Other Than Pensions (OPEB) - For purposes of measuring the OPEB liability,deferred outflows of resources and deferred inflows of resources related to OPEB, and OPEB expense,information about the fiduciary net position of the CERS' Insurance Fund and additions to/deductions from theInsurance Fund's fiduciary net position have been determined on the same basis as reported by the InsuranceFund. The Insurance Fund recognizes benefit payments when due and payable in accordance with benefit terms.The liability was measured at June 30, 2019.
Long-Term Obligations - In the Government-wide, proprietary and fiduciary fund financial statements, long-termdebt and obligations are reported as liabilities in the applicable governmental activities, business-type activities, orproprietary fund Statement of Net Position. The discounts and premiums related to bonds and notes issued aredeferred and amortized over the life of the bond or note using the straight-line method. Bonds and notes payableare reported net of the applicable bond premium or discount. Issuance costs are reported as expenses.
In the fund financial statements, governmental fund types recognize bond premiums and discounts, as well asbond issuance costs, during the current period. The face amount of debt issued is reported as other financingsources. Premiums on debt issuances are reported as other financing sources while discounts are reported asother financing uses. Issuance costs are reported as debt service expenditures.
Extraordinary losses, the difference between the re-acquisition price and the net carrying value of the old debt onrefunded debt are amortized as a component of interest expense over the life of the old or new bonds, whicheveris shorter, using the straight-line method. The deferred amount is presented as a deferred inflow of resources.
Long-term liabilities include the following:
Principal outstanding on general obligation bonds, notes and capital lease obligations.
Landfill closure and postclosure care liability is the established total current cost to place a final cover on the
City's landfill sites and to perform certain maintenance and monitoring functions after closure.
Unearned Revenues - The City defers revenue recognition in connection with resources that have been receivedbut not yet earned. At the end of Fiscal Year 2020, grant funding from the 2004 Federal CARES Act in the amountof $65,109 have been deferred as these amounts have not yet been earned.
Fund Equity - The following classifications describe the relative strength of the spending constraints placed on thepurposes for which resources can be used:
Nonspendable fund balance - amounts that are not in a spendable form (such as inventory) or are
required to be maintained intact.
Restricted fund balance - amounts constrained to specific purposes by their providers (such as grantors,
bondholders and higher levels of government), through constitutional provisions, or enabling legislation.
Committed fund balance - amounts constrained to specific purposes by the City itself, by Ordinance
approved by the Board of Commissioners; to be reported as committed, amounts cannot be used for any
other purpose unless the City takes action to remove or change the constraint. Stabilizaton funds in the
General Fund are assessed each fiscal year and approved the Board of Commissioners through an
Ordinance and can only be appropriated through the same action; if stabilization funds are utilized, a plan
to replinish the balance to the established funding level must be approved by Ordinance.
Assigned fund balance - amounts the City intends to use for a specific purpose (such as encumbrances);
intent can be expressed by the City or the City Manager, Assistant City Manager/CFO, and/or Chief
Financial Officer or body to which the City delegates authority as established by the City’s Fund Balance
Policy included in the City’s Financial Policies approved by the Board of Commissioners.
43

City of Bowling Green, KentuckyNotes to the Financial StatementsFor the Year Ended June 30, 2020
NOTE 1. SUMMARY OF SIGNIFICANT ACCOUNTING POLICIES
F. Assets, Liabilities and Fund Equity
Unassigned fund balance - amounts that are available for any purpose; positive amounts are reported only
in the General Fund.
When both restricted and unrestricted funds are available for expenditure, restricted funds are spent first unlesslegal requirements disallow it. When committed, assigned and unassigned funds are available for expenditure,committed funds are spent first, assigned funds second, and unassigned funds last.
G. Revenues, Expenditures and Expenses
Operating revenues and expenses for proprietary funds are those that result from providing services andproducing and delivering goods and/or services. It also includes all revenue and expenses not related to capitaland related financing, non-capital financing or investing activities.
Interfund transactions that would be treated as revenues or expenditures/expenses if they involved organizationsexternal to the City are similarly treated when involving funds of the City. Transactions that constitutereimbursements to a fund for expenditures/expenses initially made from it that are properly applicable to anotherfund are recorded as expenditures/expenses in the reimbursing fund and as reductions of expenditures/expensesin the reimbursed fund. Transfers from funds receiving revenues to funds through which the resources are to beexpended and operating subsidies are classified as interfund transfers. Transfers between governmental andproprietary funds are netted as part of the reconciliation to the Government-wide columnar presentation.
H. Estimates
The preparation of financial statements in conformity with accounting principles generally accepted in the UnitedStates requires management to make estimates and assumptions that affect the reported amounts of assets andliabilities and disclosure of contingent assets and liabilities at the date of the financial statements and the reportedamounts of revenues and expenses during the reporting period. Actual results could differ from those estimates.
NOTE 2. STEWARDSHIP, COMPLIANCE AND ACCOUNTABILITY
A. Compliance with Finance Related Legal and Contractual Provisions
The City has no material violations of finance related legal and contractual provisions.
NOTE 3. DETAIL NOTES ON ALL FUNDS
A. Cash and Investments
Primary Government
The City's bank balances at June 30, 2020 are entirely insured or collateralized with securities held by the City'sagent in the City's name. In accordance with Kentucky Revised Statutes (KRS) 66.480 and the Government'sinvestment policy, the Government is allowed to invest in obligations of the U.S. Treasury and U.S. agencies andinstruments, repurchase agreements, bankers' acceptances, commercial paper, obligations of the Commonwealthof Kentucky and its agencies and instrumentalities, shares of mutual funds or interest bearing deposits of insurednational or state banks. In addition, the Fiduciary Funds are allowed to invest in equity securities, corporate bondsand international stocks listed as American Depository Receipts (ADR). Investments of the City as of June 30,2020 are summarized and categorized in the table on the following page.
44

City of Bowling Green, KentuckyNotes to the Financial StatementsFor the Year Ended June 30, 2020
NOTE 3. DETAIL NOTES ON ALL FUNDS
A. Cash and Investments
Primary Government
Primary Government (except Fiduciary Funds)
Investment Type Fair ValueWeighted Average
Maturity
Certificate of deposit $ 5,547,682 0.827Cash equivalents 10,432,951 N/ATax free mutual funds 1,766,285 N/AU.S. agencies CMO 68,736 0.054Taxable mutual funds 824,250 N/AU.S. equity 228,849 N/ATaxable bond funds 526,612 N/AU.S. agencies bonds 15,934,244 1.031Foreign real estate fund 4,666 N/AU.S. real estate 7,853 N/AMunicipal bonds 6,485,684 0.494
$ 41,827,812
Interest Rate Risk - The City has adopted an investment policy that recommends controlling interest rate riskthrough maturity diversification. To the extent possible, the City will attempt to match its investments withanticipated cash flow requirements.
Credit Risk - The City has no policy related to credit risk.
Concentration of Credit Risk - To limit concentration of credit risk, the City has adopted an investment policy tolimit investments held at one financial institution to no more than 25% of total investments, excluding moneymarket mutual funds, unless they are fully insured or fully collateralized or they are authorized investment pools.
Recurring Fair Value Measurement - The City categorizes its fair value measurements within the fair valuehierarchy established by the generally accepted accounting principles. The hierarchy is based on the valuationinputs used to measure the fair value of the asset. Level 1 inputs are quoted prices in active markets for identicalassets; Level 2 inputs are significant other observable inputs; Level 3 inputs are significant unobservable inputs.
The City has the following recurring fair value measurements as of June 30, 2020:
Certificates of deposit, cash equivalents, U.S. Agencies CMO, and U.S. Agencies Bonds total
$31,983,613 and are valued using quoted market prices (Level 1 inputs).
Municipal bonds, tax free mutual funds, taxable mutual funds, U.S. and foreign equity, and U.S. and
foreign real state funds total $9,844,199 using quoted prices for similar assets in active markets (Level 2
inputs).
Component Units
Bowling Green Municipal UtilitiesThe Bowling Green Municipal Utilities may legally invest in direct obligations of and other obligations guaranteedas to principal by the U.S. Treasury and U.S. Agencies and instrumentalities, Kentucky bonds and certificates ofindebtedness, highly-rated securities issued by a state or local government in the United States and certain otherinvestments more fully described in the Kentucky Revised Statutes. Investments of each division of the Utility as ofJune 30, 2020 are summarized and categorized in the tables on the following pages.
45
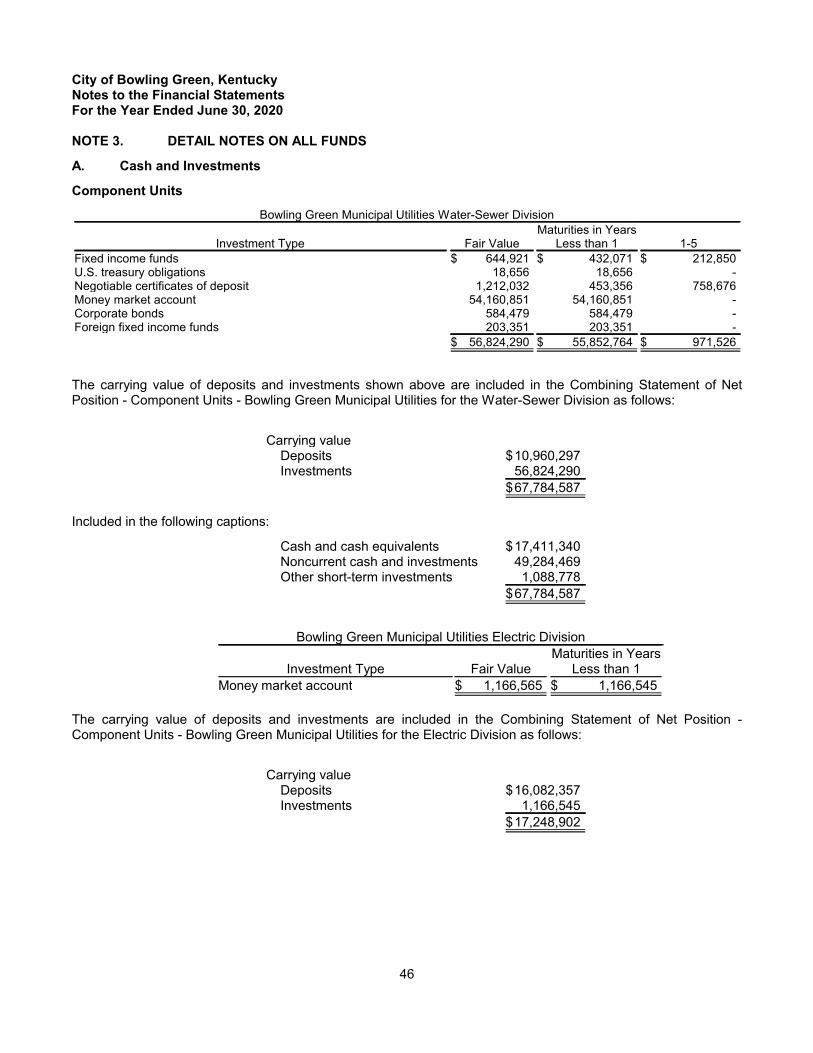
City of Bowling Green, KentuckyNotes to the Financial StatementsFor the Year Ended June 30, 2020
NOTE 3. DETAIL NOTES ON ALL FUNDS
A. Cash and Investments
Component Units
Bowling Green Municipal Utilities Water-Sewer Division
Investment Type Fair ValueMaturities in Years
Less than 1 1-5
Fixed income funds $ 644,921 $ 432,071 $ 212,850U.S. treasury obligations 18,656 18,656 -Negotiable certificates of deposit 1,212,032 453,356 758,676Money market account 54,160,851 54,160,851 -Corporate bonds 584,479 584,479 -Foreign fixed income funds 203,351 203,351 -
$ 56,824,290 $ 55,852,764 $ 971,526
The carrying value of deposits and investments shown above are included in the Combining Statement of NetPosition - Component Units - Bowling Green Municipal Utilities for the Water-Sewer Division as follows:
Carrying valueDeposits $10,960,297Investments 56,824,290
$67,784,587
Included in the following captions:
Cash and cash equivalents $17,411,340Noncurrent cash and investments 49,284,469Other short-term investments 1,088,778
$67,784,587
Bowling Green Municipal Utilities Electric Division
Investment Type Fair ValueMaturities in Years
Less than 1
Money market account $ 1,166,565 $ 1,166,545
The carrying value of deposits and investments are included in the Combining Statement of Net Position -Component Units - Bowling Green Municipal Utilities for the Electric Division as follows:
Carrying valueDeposits $16,082,357Investments 1,166,545
$17,248,902
46

City of Bowling Green, KentuckyNotes to the Financial StatementsFor the Year Ended June 30, 2020
NOTE 3. DETAIL NOTES ON ALL FUNDS
A. Cash and Investments
Component Units
Included in the following captions:
Cash and cash equivalents $15,982,357Investments and restricted funds 1,266,545
$17,248,902
Interest Rate Risk - Investment rate risk is the risk that changes in market interest rates and will adversely affectthe value of an investment. The Bowling Green Municipal Utilities does not have a formal investment policy thatlimits its interest rate risk.
Credit Risk - Credit risk is the risk that the issuer or other counterparty to an investment will not fulfill itsobligations. At June 30, 2020, the Utility's investments in U.S. agencies obligations not directly guaranteed by theU.S. government were rated by Standard & Poor's and by Moody's Investors Services as AAA.
Custodial Credit Risk - For an investment, custodial credit risk is the risk that, in the event of the failure of thecounterparty, the Utility will not be able to recover the value of its investment or collateral securities that are in thepossession of an outside party. As of June 30, 2020, Bowling Green Municipal Utilities was not exposed tocustodial credit risk.
Concentration of Credit Risk - The Utility places no limit on the amount that may be invested in any one issuer.At June 30, 2020, the Water-Sewer Division's investment in U.S. Treasury Note obligations constituted less than1% of its total investments.
Recurring Fair Value Measurements - The Utility categorizes its fair value measurements within the fair valuehierarchy established by the generally accepted accounting principles. The hierarchy is based on the valuationinputs used to measure the fair value of the asset. Level 1 inputs are quoted prices in active markets for identicalassets; Level 2 inputs are significant other observable inputs; Level 3 inputs are significant unobservable inputs.
The Water/Sewer Division had the following assets measured at fair value on a recurring basis as of June 30,2020.
Fair Value Measurements Using
Investments by Fair Value Level June 30, 2020
Quoted Prices inActive Markets
for IdenticalAssets (Level 1)
Significant OtherObservable
Inputs (Level 2)
U.S. treasury obligations $ 18,656 $ - $ 18,656Fixed income funds 644,921 644,921 -Negotiable certficates of deposit 1,212,032 - 1,212,032Foreign fixed income funds 203,351 203,351 -Corporate bonds 584,479 584,479 -
Total investment by fair value $ 2,663,439 $ 1,432,751 $ 1,230,688
Police and Firefighters’ Retirement FundPlan investments are presented at fair value, which is the amount that financial instruments could be exchanged ina current transaction between willing parties. Short-term investments are carried at cost, which approximates fairvalue. Securities traded on a national exchange are valued at the last reported sales price at current exchangerates. Other investments not having an established market are recorded at estimated fair value. All fair values aredetermined by external consultants. The City of Bowling Green Police and Firefighters' Retirement Fundinvestments are measured and reported at fair value and are classified according to the following hierarchy:
47
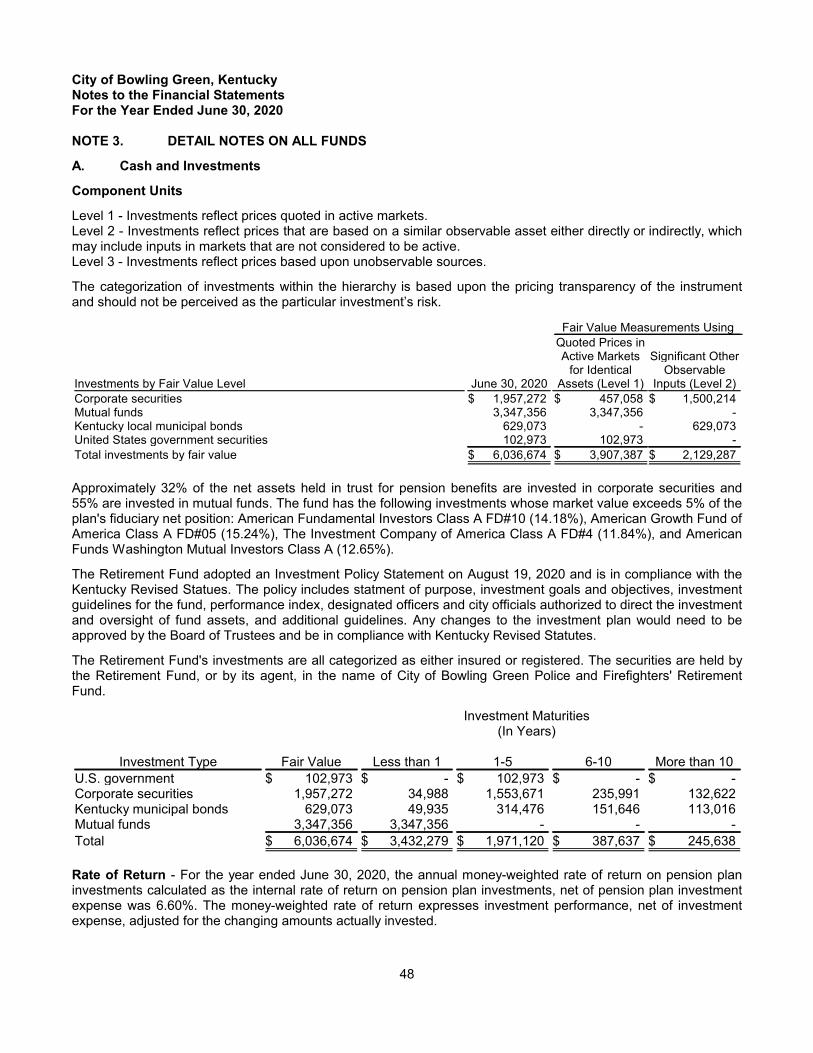
City of Bowling Green, KentuckyNotes to the Financial StatementsFor the Year Ended June 30, 2020
NOTE 3. DETAIL NOTES ON ALL FUNDS
A. Cash and Investments
Component Units
Level 1 - Investments reflect prices quoted in active markets.Level 2 - Investments reflect prices that are based on a similar observable asset either directly or indirectly, whichmay include inputs in markets that are not considered to be active.Level 3 - Investments reflect prices based upon unobservable sources.
The categorization of investments within the hierarchy is based upon the pricing transparency of the instrumentand should not be perceived as the particular investment’s risk.
Fair Value Measurements Using
Investments by Fair Value Level June 30, 2020
Quoted Prices inActive Markets
for IdenticalAssets (Level 1)
Significant OtherObservable
Inputs (Level 2)
Corporate securities $ 1,957,272 $ 457,058 $ 1,500,214Mutual funds 3,347,356 3,347,356 -Kentucky local municipal bonds 629,073 - 629,073United States government securities 102,973 102,973 -
Total investments by fair value $ 6,036,674 $ 3,907,387 $ 2,129,287
Approximately 32% of the net assets held in trust for pension benefits are invested in corporate securities and55% are invested in mutual funds. The fund has the following investments whose market value exceeds 5% of theplan's fiduciary net position: American Fundamental Investors Class A FD#10 (14.18%), American Growth Fund ofAmerica Class A FD#05 (15.24%), The Investment Company of America Class A FD#4 (11.84%), and AmericanFunds Washington Mutual Investors Class A (12.65%).
The Retirement Fund adopted an Investment Policy Statement on August 19, 2020 and is in compliance with theKentucky Revised Statues. The policy includes statment of purpose, investment goals and objectives, investmentguidelines for the fund, performance index, designated officers and city officials authorized to direct the investmentand oversight of fund assets, and additional guidelines. Any changes to the investment plan would need to beapproved by the Board of Trustees and be in compliance with Kentucky Revised Statutes.
The Retirement Fund's investments are all categorized as either insured or registered. The securities are held bythe Retirement Fund, or by its agent, in the name of City of Bowling Green Police and Firefighters' RetirementFund.
Investment Maturities(In Years)
Investment Type Fair Value Less than 1 1-5 6-10 More than 10
U.S. government $ 102,973 $ - $ 102,973 $ - $ -Corporate securities 1,957,272 34,988 1,553,671 235,991 132,622Kentucky municipal bonds 629,073 49,935 314,476 151,646 113,016Mutual funds 3,347,356 3,347,356 - - -
Total $ 6,036,674 $ 3,432,279 $ 1,971,120 $ 387,637 $ 245,638
Rate of Return - For the year ended June 30, 2020, the annual money-weighted rate of return on pension planinvestments calculated as the internal rate of return on pension plan investments, net of pension plan investmentexpense was 6.60%. The money-weighted rate of return expresses investment performance, net of investmentexpense, adjusted for the changing amounts actually invested.
48
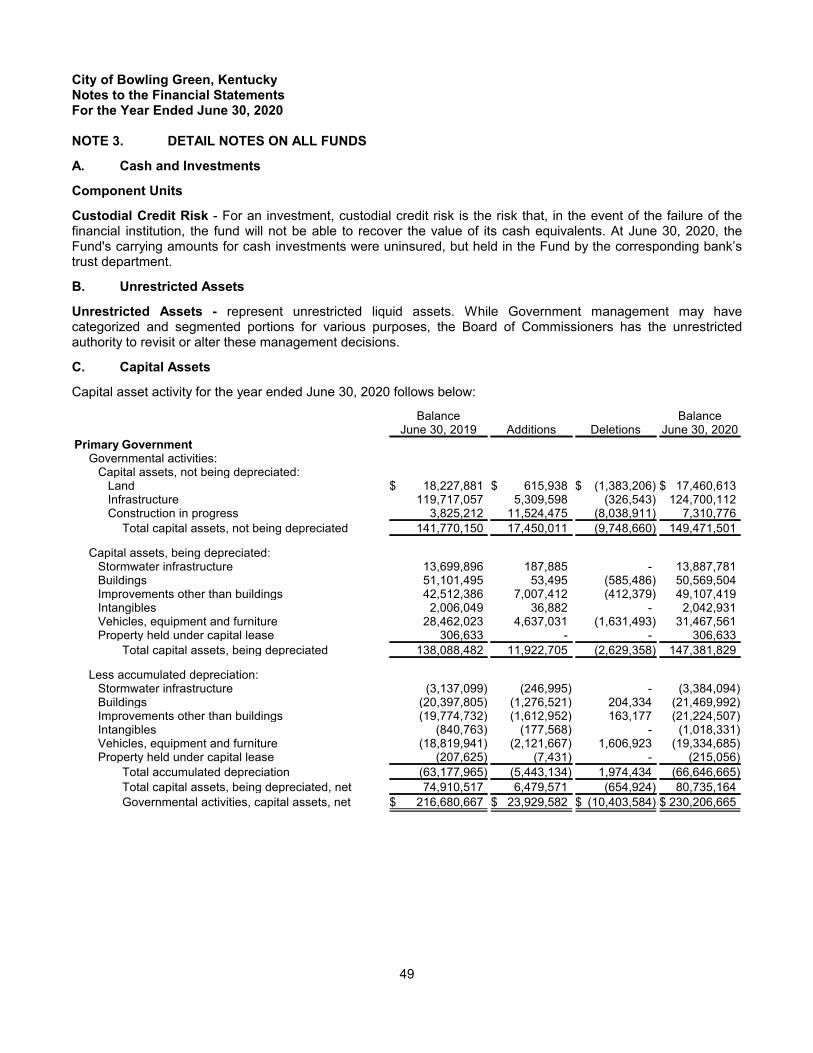
City of Bowling Green, KentuckyNotes to the Financial StatementsFor the Year Ended June 30, 2020
NOTE 3. DETAIL NOTES ON ALL FUNDS
A. Cash and Investments
Component Units
Custodial Credit Risk - For an investment, custodial credit risk is the risk that, in the event of the failure of thefinancial institution, the fund will not be able to recover the value of its cash equivalents. At June 30, 2020, theFund's carrying amounts for cash investments were uninsured, but held in the Fund by the corresponding bank’strust department.
B. Unrestricted Assets
Unrestricted Assets - represent unrestricted liquid assets. While Government management may havecategorized and segmented portions for various purposes, the Board of Commissioners has the unrestrictedauthority to revisit or alter these management decisions.
C. Capital Assets
Capital asset activity for the year ended June 30, 2020 follows below:
BalanceJune 30, 2019 Additions Deletions
BalanceJune 30, 2020
Primary GovernmentGovernmental activities:
Capital assets, not being depreciated:Land $ 18,227,881 $ 615,938 $ (1,383,206) $ 17,460,613Infrastructure 119,717,057 5,309,598 (326,543) 124,700,112Construction in progress 3,825,212 11,524,475 (8,038,911) 7,310,776
Total capital assets, not being depreciated 141,770,150 17,450,011 (9,748,660) 149,471,501
Capital assets, being depreciated:Stormwater infrastructure 13,699,896 187,885 - 13,887,781Buildings 51,101,495 53,495 (585,486) 50,569,504Improvements other than buildings 42,512,386 7,007,412 (412,379) 49,107,419Intangibles 2,006,049 36,882 - 2,042,931Vehicles, equipment and furniture 28,462,023 4,637,031 (1,631,493) 31,467,561Property held under capital lease 306,633 - - 306,633
Total capital assets, being depreciated 138,088,482 11,922,705 (2,629,358) 147,381,829
Less accumulated depreciation:Stormwater infrastructure (3,137,099) (246,995) - (3,384,094)Buildings (20,397,805) (1,276,521) 204,334 (21,469,992)Improvements other than buildings (19,774,732) (1,612,952) 163,177 (21,224,507)Intangibles (840,763) (177,568) - (1,018,331)Vehicles, equipment and furniture (18,819,941) (2,121,667) 1,606,923 (19,334,685)Property held under capital lease (207,625) (7,431) - (215,056)
Total accumulated depreciation (63,177,965) (5,443,134) 1,974,434 (66,646,665)
Total capital assets, being depreciated, net 74,910,517 6,479,571 (654,924) 80,735,164
Governmental activities, capital assets, net $ 216,680,667 $ 23,929,582 $ (10,403,584) $ 230,206,665
49

City of Bowling Green, KentuckyNotes to the Financial StatementsFor the Year Ended June 30, 2020
NOTE 3. DETAIL NOTES ON ALL FUNDS
C. Capital Assets
BalanceJune 30, 2019 Additions Deletions
BalanceJune 30, 2020
Business-type activities:Capital assets, not being depreciated:
Land $ 2,290,764 $ - $ - $ 2,290,764Construction in progress 51,200 272,588 - 323,788
Total capital assets, not being depreciated 2,341,964 272,588 - 2,614,552
Capital assets, being depreciated:Buildings 11,074,617 - (350,074) 10,724,543Improvements other than buildings 74,550 - - 74,550Vehicles, equipment and furniture 1,035,627 - - 1,035,627
Total capital assets, being depreciated 12,184,794 - (350,074) 11,834,720
Less accumulated depreciation:Buildings (6,738,964) (262,567) 304,499 (6,697,032)Improvements (12,425) (10,650) - (23,075)Vehicles, equipment and furniture (890,316) (31,753) - (922,069)
Total accumulated depreciation (7,641,705) (304,970) 304,499 (7,642,176)
Total capital assets, being depreciated, net 4,543,089 (304,970) (45,575) 4,192,544
Business-type activities, capital assets, net $ 6,885,053 $ (32,382) $ (45,575) $ 6,807,096
Depreciation expense was charged to functions/programs of the primary government as follows:
Governmental activitiesGeneral government $ 552,285Public safety 1,744,112Public works 983,674Parks and recreation 1,721,774Neighborhood and community
services 441,289
Total depreciation expense -governmental activities $ 5,443,134
Business-type activitiesConvention Center $ 304,970
50

City of Bowling Green, KentuckyNotes to the Financial StatementsFor the Year Ended June 30, 2020
NOTE 3. DETAIL NOTES ON ALL FUNDS
C. Capital Assets
BalanceJune 30, 2019 Additions Deletions
BalanceJune 30, 2020
Bowling Green Municipal UtilitiesCapital assets, not being depreciated:
Construction in progress $ 9,148,594 $ 21,040,493 $ (2,492,787) $ 27,696,300
Capital assets, being depreciated:Transmission plant 2,611,222 67,443 (5,923) 2,672,742Distribution plant 93,023,975 3,182,703 (1,473,164) 94,733,514Structures and improvements, nodes 314,098 136,190 - 450,288General plant 15,054,636 721,171 (600,446) 15,175,361Water plant 105,591,428 1,887,676 - 107,479,104Sewer plant 115,034,748 943,883 - 115,978,631Equipment 7,905,241 665,555 (52,621) 8,518,175Overhead conductors and devices 6,164,881 218,848 (42,028) 6,341,701Trucks and autos 2,972,337 218,766 (11,300) 3,179,803Office equipment 1,751,807 244,126 - 1,995,933Office additions 65,716 - - 65,716
Total capital assets, being depreciated 350,490,089 8,286,361 (2,185,482) 356,590,968
Less accumulated depreciation (154,762,840) (10,844,632) 2,645,392 (162,962,080)
Total capital assets, being depreciated, net 195,727,249 (2,558,271) 459,910 193,628,888
Bowling Green Municipal Utilities, capital assets,net $ 204,875,843 $ 18,482,222 $ (2,032,877) $ 221,325,188
D. Interfund Transfers
Transfers are used to (1) move revenues from the fund that statute or budget requires to collect them to the fundthat statutes or budget requires to expend them, (2) move receipts restricted to debt service from the fundscollecting the receipts to the Debt Service Fund as debt service payments become due, and (3) use unrestrictedrevenues collected in the General Fund to finance various programs accounted for in other funds in accordancewith budgetary authorizations.
The following schedule briefly summarizes the City’s transfer activity:
Transfers Out
GeneralNonmajor
Governmental Internal ServiceConvention
Center Total
General Fund $ - $ 614,399 $ - $ - $ 614,399ITA Bond 1,017,500 - - - 1,017,500Debt Service 2,528,203 2,057,200 - - 4,585,403Convention Center - 100,000 - - 100,000Internal Service Funds 825,500 - 200,000 - 1,025,500Nonmajor Governmental Funds 12,569,713 3,509,589 24,000 - 16,103,302
Totals $ 16,940,916 $ 6,281,190 $ 224,000 $ - $ 23,446,106
51

City of Bowling Green, KentuckyNotes to the Financial StatementsFor the Year Ended June 30, 2020
NOTE 3. DETAIL NOTES ON ALL FUNDS
E. Long-term Debt
Revenue bonds and other directly related long-term liabilities, which are intended to be paid from proprietaryfunds, are included in the accounts of such funds. All other long-term indebtedness is accounted for in theGovernmental column of the Government-wide Statement of Net Position. The table on the following page reportsall City long-term debt as of June 30, 2020.
Primary Government:
Purpose of IssueOriginalIssue Interest Rate Final Maturity
AmountOutstanding
Governmental ActivitiesGeneral obligation and revenue bonds
General Obligation Bond, Series 2007A
Lovers Lane, Utilities,Park CommunityCenter Expansion,Circus Square,DowntownSignalization, SkyPACland acquisition,various road projects,Southwest Parkwayproperty acquisition,Broadway CurveStraightening, FieldsDrive and Skate Park $14,905,000 4.0%-5.0% June 30, 2021 $ 540,000
General Obligation Bond, Series 2010/2011Refinance GO Series2002B and 2002C 29,580,000 0.5%-3.75% June 1, 2026 15,340,000
General Obligation Bond, Series 2012ARefinance GO Series2004A 6,320,000 2.0%-3.0% June 1, 2024 3,510,000
General Obligation Bond, Series 2012BRefinance GO Series2004B 1,400,000 1.0%-3.3% June 1, 2024 575,000
General Obligation Bond, Series 2015ARefinance portion ofGO Series 2007A 9,245,000 2.25%-3.0% December 1, 2032 8,915,000
General Obligation Bond, Series 2016ARefinance portion ofGO Series 2007B 12,040,000 2.05% September 1, 2023 6,370,000
General Obligation Bond, Series 2016BRefinance GO Series2007C 3,260,000 3.09% September 1, 2023 1,280,000
General Obligation Bond Series 2016CRefinance portion ofSeries 2008A & 2008B 24,545,000 3.0%-4.0% June 1, 2038 22,255,000
58,785,000Premiums, deferred charges and discounts
on bond obligations 2,341,049
Total general obligation bonds $ 61,126,049
Purpose of IssueOriginalIssue Interest Rate Final Maturity
AmountOutstanding
Notes and capital leases from directborrowings and placements
US Bank 2019 Fire Trucks $ 1,531,518 1.95% December 4, 2029 $ 1,531,518
Chase Bank2010 Fire Aerial &Pumper Trucks 1,309,391 2.66% October 1, 2020 146,942
First Bank 2018 Fire Trucks 3,531,163 2.99% March 29, 2028 2,906,850
Total notes payable from direct borrowingsand placements $ 4,585,310
Other Long-Term LiabilitiesCompensated absences 2,121,248Landfill 2,235,776
4,357,024
Total long-term governmental liabilities $ 70,068,383
52

City of Bowling Green, KentuckyNotes to the Financial StatementsFor the Year Ended June 30, 2020
NOTE 3. DETAIL NOTES ON ALL FUNDS
E. Long-term Debt
Changes in Long-term Liabilities
Long-term liability activity for the primary government for the year ended June 30, 2020, was as follows:
BalanceJune 30, 2019 Increases Decreases
BalanceJune 30, 2020
Amounts Duein One Year
Governmental Activities:General obligation and revenue bonds $ 67,195,000 $ - $ (8,410,000) $ 58,785,000 $ 7,040,000Notes and capital leases from direct
borrowings and placements 3,513,596 1,531,518 (459,804) 4,585,310 613,681Adjustments for deferred amounts:
Discount on bonds payable (74,207) 5,300 - (68,907) -Premium on bonds payable 2,611,182 - (201,226) 2,409,956 -
Total bonds, notes, leasespayable 73,245,571 1,536,818 (9,071,030) 65,711,359 7,653,681
Compensated absences 1,919,531 1,248,715 (1,046,998) 2,121,248 1,164,139Landfill postclosure care 2,281,150 - (45,374) 2,235,776 71,420
Total governmental activities $ 77,446,252 $ 2,785,533 $ (10,163,402) $ 70,068,383 $ 8,889,240
Internal Service funds predominately serve the governmental funds. Accordingly, long-term liabilities are includedas part of the above totals for governmental activities. At year end, $35,343 of internal service fund compensatedabsences is included in the above amounts. Landfill postclosure liabilities are liquidated by the Landfill Closurespecial revenue fund and governmental compensated absences are liquidated by the general fund.
The City’s outstanding capital lease from direct borrowings and placements totaling $146,942 contains anonappropriation provision where the equipment will be returned to the lessor in the event of non-appropriation.Additionally, a default provision is also in place where the City would be subject to one or all of the following ifdefault occurs: pay interest at 12% on due-payments, return equipment, and/or termination of lease agreement.
The City’s outstanding note from direct borrowings and placements totaling $4,437,578 contains a defaultprovision where the financing agreement would be terminated and all related indebtedness would be due andpayable. Collateral for this note includes: one 2018 Pierce Rescue Engine with equipment and machinery, one2018 Pierce 95' Mid-Mount Aerial Platform Engine with machinery and equipment, and four 2018 Pierce Engineswith equipment and machinery.
53

City of Bowling Green, KentuckyNotes to the Financial StatementsFor the Year Ended June 30, 2020
NOTE 3. DETAIL NOTES ON ALL FUNDS
E. Long-term Debt
Component Unit
Long-term liability activity for the component unit for the year ended June 30, 2020, was as follows:
BalanceJune 30, 2019 Increases Decreases
BalanceJune 30, 2020
Amounts Duein One Year
Component Unit:General obligation and revenue bonds
Water-Sewer DivisionRevenue bonds payable $ 122,900,602 $ 1,085,994 $ (5,118,089) $ 118,868,507 $ 5,084,804
Electric DivisionRevenue bonds payable 9,430,000 - (495,000) 8,935,000 505,000
General Services DivisionNotes payable 2,402,642 - (605,598) 1,797,044 758,313
Less: unamortized bond discount 2,160,438 - (79,484) 2,080,954 -
$ 136,893,682 $ 1,085,994 $ (6,298,171) $ 131,681,505 $ 6,348,117
Debt service requirements (principal and interest) to maturity for the Primary Government’s bonds and notes areas follows:
Governmental ActivitiesGeneral Obligation and
Revenue BondsNotes and Lease Purchase
AgreementsFiscal Year Interest Principal Interest Principal
2021 $ 1,905,479 $ 7,040,000 $ 121,896 $ 613,6812022 1,687,501 7,210,000 105,354 479,3742023 1,470,782 7,210,000 92,367 492,3602024 1,239,463 7,460,000 79,175 505,5532025 1,029,625 4,605,000 65,297 519,430
2026-2030 3,146,761 12,760,000 119,374 1,974,9122031-2035 1,467,715 8,425,000 - -2036-2040 277,789 4,075,000 - -
$ 12,225,115 $ 58,785,000 $ 583,463 $ 4,585,310
54

City of Bowling Green, KentuckyNotes to the Financial StatementsFor the Year Ended June 30, 2020
NOTE 3. DETAIL NOTES ON ALL FUNDS
E. Long-term Debt
Component Unit
Principal requirements for component unit debt is as follows:
Fiscal Year
Bowling GreenMunicipal Utilities
Water-SewerDivision
Bowling GreenMunicipal UtilitiesElectric Division Total
2021 $ 5,084,804 $ 505,000 $ 5,589,8042022 5,176,826 515,000 5,691,8262023 5,595,159 530,000 6,125,1592024 5,696,086 540,000 6,236,0862025 5,801,070 555,000 6,356,070
2026-2030 30,092,454 3,075,000 33,167,4542031-2035 25,332,802 2,840,000 28,172,8022036-2040 17,181,559 375,000 17,556,5592041-2045 8,170,000 - 8,170,0002036-2040 10,737,747 - 10,737,747
$ 118,868,507 $ 8,935,000 $ 127,803,507
General Description of the City's General Obligation and Revenue Bonds
General Obligation and Revenue Bonds - The City routinely issues general obligation and revenue bonds toprovide funds for the acquisition and construction of capital assets. The general obligation bonds are secured byan irrevocable pledge of the full faith, credit and taxing power of the City. The City has issued the following generalobligation and revenue bonds:
1. $14,905,000 General Obligation Bonds, Series 2007A, issued to finance costs for construction of public park improvements, construction of utilities, design and construction of a skate park, Circus Square acquisition and construction, land acquisition, construction of public roads, and installation of downtown signalization upgrades. In Fiscal Year 2015, this obligation was partially refunded in the amount of $9,245,000 by Series 2015A.
2. $29,580,000 General Obligation and Special Revenue Refunding Bonds, Series 2010 and Series 2011, issued for the purpose of refinancing the Series 2002B and Series 2002C General Obligation and Special Revenue Bonds for Western Kentucky University.
3. $6,320,000 General Obligation Bonds, Series 2012A, issued for the purpose of refinancing Series 2004A General Obligation Bonds.
4. $1,400,000 General Obligation Bonds, Series 2012B, issued for the purpose of refinancing Series 2004B General obligation Bonds.
5. $9,245,000 General Obligation Bonds, Series 2015A, issued for the purpose of refinancing a portion of Series 2007A General Obligation Bonds.
55

City of Bowling Green, KentuckyNotes to the Financial StatementsFor the Year Ended June 30, 2020
NOTE 3. DETAIL NOTES ON ALL FUNDS
E. Long-term Debt
General Description of the City's General Obligation and Revenue Bonds $15,300,000 General Obligation Bonds, Series 2016A & B, issued for the purpose of refinancing a portion of Series 2007B & C General Obligation Bonds. The refunding was undertaken in FY2016 and resulted a net present value savings or benefit of $1,216,517 or approximately 8.2%. Theaggregate difference between the refunding debt and the refunded debt was $470,000; with$14,830,000 as the refunded principal.
7. $24,545,000 General Obligation Bonds, Series 2016C, issued to refinance a portion of Series 2008A& 2008B General Obligation Bonds. The refunding was completed in FY2016 and resulted in a netpresent value savings or benefit of $3,072,159 or about 12.72%. The aggregate difference betweenthe refunding debt and the refunded debt was $395,000; with $24,150,000 as the refunded principal.
Memorandum of Agreement/WKU Project Financing
In June 2002 the City issued $30,115,000 General Obligation and Special Revenue Bonds, Series 2002B and$1,800,000 General Obligation and Special Revenue Bonds, Series 2002C to finance the renovation, improvement and equipping of certain WKU athletic and parking facilities, including the renovation and improvement of E. A. Diddle Arena. The Series 2002C Bonds were issued to finance costs allocated to certain private use facilities (luxury suites) in E. A. Diddle Arena, as renovated, not financed by the Series 2002B Bonds.
Pursuant to a Memorandum of Agreement dated April 15, 2002 and amended by Supplement No. 1 dated June 1, 2002, between the City, WKU and the Hilltopper Athletic Foundation (HAF), WKU and HAF, respectively, pledge to impose and charge student athletic fees and suite rentals during the term of the respective series of bonds sufficient, when transferred to the City, for the payment of principal and interest on the bonds. WKU pledges the student athletic fees to the City for the payment of principal and interest on the Series 2002B Bonds and, on a subordinated basis, the Series 2002C Bonds, and HAF and WKU pledge the suite rentals (defined as annual luxury suite rentals minus HAF contributions of $7,500 per suite) to the City for the payment of principal and interest on the Series 2002C Bonds. Payments from collected student athletic fees and suite rentals are to be made to the City on or before March 1 and September 1 of each year in amounts sufficient to pay debt service on the Series 2002B Bonds and Series 2002C Bonds, respectively, to the extent funds are not otherwise provided in the form of capitalized interest and interest earnings in the Series 2002B bond fund and the Series 2002C bond fund. No suite rentals shall be available or used for payment of debt service on the Series 2002B Bonds.
In Fiscal Year 2011, the City issued General Obligation and Special Revenue Refunding Bonds Series 2010 and Series 2011 for $29,580,000 for the purpose of refinancing $27,595,000 of the Series 2002B and Series 2002C Bonds.
56
6.

City of Bowling Green, KentuckyNotes to the Financial StatementsFor the Year Ended June 30, 2020
NOTE 3. DETAIL NOTES ON ALL FUNDS
E. Long-term Debt
Memorandum of Agreement/WKU Project Financing
The following is a schedule, by year, of future amounts to be provided by WKU pursuant to the Memorandum of Agreement for the retirement of general long-term debt of the City, applicable to the issuance of the $30,115,000 General Obligation and Special Revenue Bonds, Series 2002B, $1,800,000 General Obligation and Special Revenue Bonds, Series 2002C, and $29,580,000 General Obligation and Special Revenue Refunding Bonds, Series 2010 and Series 2011 for the WKU Project:
Year Ending June 30, Principal Interest Total
2021 $ 2,500,000 $ 568,205 $ 3,068,2052022 2,525,000 480,705 3,005,7052023 2,415,000 392,330 2,807,3302024 2,520,000 302,975 2,822,9752025 2,625,000 208,475 2,833,475
2026-2028 2,755,000 106,756 2,861,756
$ 15,340,000 $ 2,059,446 $ 17,399,446
As of June 30, 2020 the City has recorded a receivable from WKU in the amount of $15,340,000 in the WKUAthletics Special Revenue Fund applicable to future revenues to be received from WKU related to the aboveagreement.
Fund Depository and Administration Agreement/WKU Project Financing
On June 1, 2002, the City entered into a Fund Depository and Administration Agreement with the Finance andAdministration Cabinet of the Commonwealth of Kentucky (FAC) applicable to the WKU project. The WKU projectis and will be the property of the Commonwealth of Kentucky for the benefit of WKU and all contracts for theconstruction, acquisition and installation of the project are awarded, administered and carried out by the FACthrough its Department for Facilities Management and its Office of Financial Management as a State-administeredcapital construction project.
On June 28, 2002 (bond closing date) the City, pursuant to Fund Depository and Administration Agreement,transferred to the State Treasurer the net proceeds of the Series 2002B Bonds ($28,235,432) and 2002C Bonds($1,670,716) for deposit to FAC-administered capital construction accounts. The transfers to the State of Series2002B and 2002C Bonds net proceeds totaling $29,906,148 were accounted for as expenditures in the WKUAthletic Special Revenue Fund in Fiscal Year 2002.
In fiscal years subsequent to the transfer of bond net proceeds to the State, the City will not account forconstruction expenditures of the project and will not include State-administered construction accounts as assets ofthe City. The WKU project will be property of the Commonwealth of Kentucky for the benefit of WKU.
TIF District
In August 2007, the City approved the establishment of a downtown development area Tax Incremental Financing(TIF) District, which was later amended and expanded in October 2008. With the establishment of the District, theCity pledged 80% of new incremental growth in property tax, withholding tax, and net profit fee revenues producedwithin the boundaries of the district to the Warren County Downtown Economic Development Authority (theAuthority), a Chapter 58 agency designated to administer and oversee the project. These incremental revenuesare dedicated for debt service payments on various projects within the TIF District. The State also pledged 80% of
57

City of Bowling Green, KentuckyNotes to the Financial StatementsFor the Year Ended June 30, 2020
NOTE 3. DETAIL NOTES ON ALL FUNDS
E. Long-term Debt
TIF District
incremental revenues within the District under the condition that the project reach $200 million in eligible projects, which was later amended to $150 million by the State General Assembly in June 2009.
During 2009, the City issued $25 million in general obligation bonds to fund the construction of a ballpark for a Single A baseball team in Bowling Green located inside the TIF District. The bond proceeds included funding for infrastructure and capitalized interest and were placed into a construction fund account. The construction of the ballpark, including the bidding of the project and all construction oversight, was performed by the Authority. Draws totaling $23 million for construction were requested through the City from the bond construction account and distributed to the contractor monthly. The other $2 million was set aside for capitalized interest and cost of issuance.
Title to the ballpark is held by the Authority who sold the ballpark to a Single Purpose Entity that will provide new market tax credits in return for additional borrowings to fund other TIF construction. With the achievement of reaching the $150 million capital investment threshold, the State has begun distributing 80% of State withholdings, individual, corporate, sales and property taxes generated from within the TIF boundaries to the Authority for further distribution to various block developments for debt service.
Prior Year Defeasance of Debt
In a prior year, the City defeased certain general obligation bonds by placing the proceeds of new bonds in an irrevocable trust to provide for all future debt service payments on the old bonds. Accordingly, the trust account assets and the liability for the defeased bonds are not included in the City's financial statements. At June 30, 2020,$51,100,000 of bonds outstanding is considered defeased.
Landfill Closure and Postclosure Care Cost
Landfill closure and post-closure costs are accounted for in the Landfill Closure Special Revenue Fund. As of June 30, 2020, the cash, investments and funds receivables from other governments available totaled $1,319,838.
In Fiscal Year 2005, the Environmental and Environment Cabinet (EEC) announced a program under which the Commonwealth might assume responsibility for many aspects of landfill closure currently funded by local jurisdictions. However, under the provisions of the enabling legislation (HB 174 Kentucky Pride Fund, KRS 224.43-505) it appears that jurisdictions may well retain the bulk of costs to maintain landfill sites (e.g. sampling, pumping, transportation and disposal of leachate, erosion control, mowing, etc). Under current assumptions and projections the Landfill Closure Special Revenue Fund is sufficiently capitalized through 2033, beyond which the City will need an alternate source of funds to maintain landfill sites.
The estimate of present value of remaining closure and post-closure care liabilities for all three landfill sites as of June 30, 2020 is $2,235,776. The actual cost may differ due to inflation, changes in technology or applicable laws and regulations, the extent of any damage to landfill caps caused by weather and erosion, the magnitude of site improvements or corrections required by state inspectors to achieve closure, or other unforeseeable circumstances (e.g. acts of nature).
Glen Lily Road Landfill
The City's Glen Lily Road landfill was closed in 1981. On March 30, 1990, the City and Commonwealth of Kentucky Natural Resources and Environmental Protection Cabinet (the Cabinet) entered into an agreed order stipulating remedial measures to be taken by the City. To finance the Glen Lily Road landfill closure and post-
58

City of Bowling Green, KentuckyNotes to the Financial StatementsFor the Year Ended June 30, 2020
NOTE 3. DETAIL NOTES ON ALL FUNDS
E. Long-term Debt
Landfill Closure and Postclosure Care Cost
closure costs, the City issued $2,950,000 Bowling Green Municipal Project Corporation Lease Revenue Bonds, Series 1991, dated April 1, 1991. To date, landfill closure cap construction is complete and the City performs annual monitoring, testing and reporting. In 2010, the City entered into a Memorandum of Agreement with the Kentucky Division of Waste Management and HB174 funds were used for 6.1 acres of improvements at the landfill to decrease the production of leachate. Further, the groundwater monitoring program was deemed compliant and complete.
The City has submitted a closure application for Glen Lily which has not been approved to date, owing to the EEC backlog of active landfill oversight responsibilities. The City continues to monitor and care for the landfill, submit required reports, and assume the City will incur landfill maintenance costs at least through 2034. A two year post-closure care period will follow the date upon which the City receives acceptance of any closure application, if the application is processed in accordance with precedent. A thirty year closure period will commence once the two year post-closure period has been approved. Glen Lily is further categorized as a superfund site.
Butler County Landfill
The City submitted a closure plan for its Butler County landfill in May 1991. The site ceased receiving solid waste in June 1992. The closure plan was approved by the State in 1996. The facility met closure standards for a residential landfill rather than a contained landfill. Drawing upon funds from the Landfill Closure Special Revenue Fund, established from proceeds of the 1991 bond issue, the City added a leachate collection system and a passive methane gas venting system. Construction of the landfill cap was completed in Fiscal Year 1995 and the City received a permit for closure construction in 1996. A quality assurance/quality control report was submitted on November 15, 1996. The original closure permit expired in July 1997, and a new permit extending to 2002 was issued. The City submitted quarterly and annual inspections and reports to the cabinet. In 2004, consultants Kamp, Dresser and McKee were engaged to assist in development of a plan to effect final closure of the landfill. In 2005, the City completed the third year of a three-year closure care period. However, the State has not granted final closure to date. From 2012-2016, the Kentucky Division of Waste Management used HB174 funds to design and construct a leachate consolidation system as well as improve the cap to decrease leachate production rates. Beginning in 2017, the City is working with the HB174 program to design and implement a Phase II of landfill improvements to further decrease leachate production as well as provide for permanent low cost leachate disposal options. In 2019 Phase II of the landfill improvements were separated into smaller components for construction again. The City secured $450,000 in reimbursable costs for construction of only the force main sewer component of Phase II, the work was completed in June 2020 at an actual cost of around $290,000. The City continues to monitor and care for the landfill, submit required reports, and dispose of the leachate generated. It is assumed that the City will incur landfill maintenance costs at least through 2050.
Old Louisville Road
Landfill closure cap construction is complete and the City performs annual monitoring, testing and reporting. The Greenways Commission is considering a project for some compatible recreational use of the landfill area with which EEC agrees in principle, but for which they will not agree in particular without review of such development plans as Greenways may offer for consideration.
Responding to Cabinet directives, in September 2000, the City awarded a project to install a leachate collection system at the Old Louisville Road landfill. The project cost was $521,955 and was completed in December 2001. The City anticipated a decision from the Cabinet on the closure application in July 2002. However, the Cabinet
59

City of Bowling Green, KentuckyNotes to the Financial StatementsFor the Year Ended June 30, 2020
NOTE 3. DETAIL NOTES ON ALL FUNDS
E. Long-term Debt
Landfill Closure and Postclosure Care Cost
has not acted on the application. In 2010, the Cabinet, through HB174, deemed the groundwater monitoring program at the landfill compliant and complete and removed the groundwater monitoring wells at the site. In order to move the closure process forward, the City must restrict the deed for the property that remains with the Kentucky Transportation Cabinet. In 2016, the City delivered a new survey to the Kentucky Transportation Cabinet and a decision to either restrict the deed appropriately or transfer the property to the City was fulfilled in 2019. The City continues to monitor and care for the landfill, submit required reports, and assume that maintenance costs will be incurred at least through 2052. A two year post-closure and thirty year closure period will follow the date upon which the state should grant closure if the application is processed in accordance with precedent.
Hobson Grove
Hobson Grove is an inactive landfill operated as a municipal solid waste disposal beginning in 1960 and operated through 1974, serving residential and commercial solid waste haulers from Warren County incorporated and unincorporated areas. The site covers approximately 150 acres and is primarily bound by the Barren River to the north, Jennings Creek to the west, the Golf Course at Riverview to the south, and Church Avenue to the east. The western portion of the property is owned by the City of Bowling Green. The east/southeastern portion of the property, owned by Bowling Green Municipal Utilities (BMGU), has been redeveloped with a wastewater treatment facility on top of the historical disposal area. The landfill was an area fill type with only two feet of final cover applied.
When the landfill responsibilities were given over to the staff that is now the Environmental Compliance Division there were no paper records associated with the site and the oral records indicated that the site was a pre-regulatory town dump and was not associated with any permits. A Stage 1 Study was conducted in 2018 by Neel Schaffer Engineering for the Kentucky Division of Waste Management (KYDWM). That report determined that the site was permitted and is a closed pre-RCRA subtitle D site. The requirements for closure mirror those of the Butler County site. Currently the KYDWM has indicated to city staff to take no action regarding the site until further notice from their agency. It is unknown at this time what the City’s ongoing liabilities for this site are, if any.
F. Net Position
The Government-wide and business type fund financial statements utilize a net position presentation. Net position is categorized as investment in capital assets (net of related debt), restricted and unrestricted.
The Net Investment in Capital Assets is intended to reflect the portion of net position which are associated with non-liquid, capital assets less outstanding capital asset related debt. The net related debt is the debt less the unspent proceeds and any associated unamortized cost.
NOTE 4. RISK MANAGEMENT
The City is exposed to various risks of loss related to torts; theft of, damage to, and destruction of assets; errorsand omissions; injuries to employees; and natural disasters. During Fiscal Year 1995, the City established theEmployee Health Care Fund (EHCF) (an internal service fund) to account for and finance employee medical costsrelating to the City's employee self-insured medical benefit plan. The EHCF provides coverage for up to $250,000for each health insurance claim. The City purchases commercial insurance for claims in excess of coverageprovided.
In July 1996, the City established the Workers Compensation Fund (WCF) (an internal service fund) to account forand finance its participation in the Kentucky League of Cities Workers' Compensation Trust (The "Trust"), a public
60

City of Bowling Green, KentuckyNotes to the Financial StatementsFor the Year Ended June 30, 2020
NOTE 4. RISK MANAGEMENT
entity risk pool currently operating as a common risk management and insurance program for Kentucky cities,municipal boards, agencies and authorities. The City pays an annual premium to the Trust for its workers'compensation, general liability and auto insurance coverages. The Trust Participation Agreement provides that theTrust will be self-sustaining through member premiums. The Trust reinsures through commercial companies atvarious limits, depending on the type of coverage. The WCF provides coverage of up to $10,000 for each worker'scompensation occurrence.
Beginning Fiscal Year 2012, the City established the Property & Casualty (P&C) Fund to account for and financeparticipation in the Kentucky League of Cities Insurance Services (KLCIS) General Insurance Trust. The P&CFund provides payment for premiums for all insurance coverage types except workers’ compensation. The fundwas also established to make payment on any claim that falls within a City selected per occurrence deductible.KLCIS provides coverage for losses exceeding the chosen deductible level and reinsures through commercialcompanies at various higher limits. In FY2014, the City selected a $50,000 deductible for General Liability, a$1,000 deductible for Buildings and Contents Coverage, and a $0 deductible for Law Enforcement Liability, PublicOfficials Liability, and Auto Liability. Additionally, the City has chosen to self-insure a portion of its fleet for collisioncoverage.
All funds of the City participate in the program and make payments to the EHCF and WCF based on historical costinformation of the amounts needed to pay prior and current year claims. WCF claim liabilities are determinedbased on conserative claim estimates and EHCF liabilities are reported when it is probable that a loss hasoccurred and the amount of loss can be reasonably estimated. The P&C Fund primarily receives funding from theGeneral Fund annually, but has been subsidized from the WCF in the past.
Changes in the balances of claims liabilities during Fiscal Years 2020 and 2019 follows:
Health CareWorkers
CompensationProperty and
Casualty
Liability at June 30, 2018 $ 207,867 $ 17,376 $ 38,313Claims and changes in estimates FY2019 6,008,306 143,403 84,288Claims paid FY2019 (5,557,555) (106,804) (79,501)
Liability at June 30, 2019 658,618 53,975 43,100Claims and changes in estimates FY2020 5,671,618 3,322 163,200Claims paid FY2020 (5,793,384) (34,501) (157,984)
Liability at June 30, 2020 $ 536,852 $ 22,796 $ 48,316
NOTE 5. COMMITMENTS AND CONTINGENCIES
A. Litigation
The City of Bowling Green is party to numerous legal proceedings, many of which normally occur in governmentoperations and will not involve any potential liability to the City.
B. Bowling Green Municipal Utilities
Bowling Green Municipal Utilities has erected various street lighting systems for the City, which represents a totalunamortized investment by the Utility at June 30, 2020 of $4,967,574. For rental and maintenance of thesesystems, the City has agreed to pay Bowling Green Municipal Utilities eleven percent per annum on the total streetlight investments. The City must pay $546,433 per year on a recurring basis. One-twelfth of the annual charge isbilled to the City monthly along with the charge for electric service. Similar arrangements have been in effect inprior years.
61

City of Bowling Green, KentuckyNotes to the Financial StatementsFor the Year Ended June 30, 2020
NOTE 5. COMMITMENTS AND CONTINGENCIES
C. Construction Commitments
The City has active construction projects as of June 30, 2020. At year end, the City had the following commitmentson construction contracts:
ProjectRemaining
Committment
Southwest parkway construction project $ 3,179,380Fire station construction project 3,025,454Convention center improvements 571,914Shive lane road construction project 280,889Street resurfacing construction project 231,762Downtown improvement project 188,991Police department evidence building
construction 137,533Smallhouse road construction project 126,456Greenway construction projects 121,535
D. Contingencies
The City participates in numerous State and Federal grant programs, which are governed by various rules andregulations of the grantor agencies. Costs charged to the respective grant programs are subject to audit andadjustments by the grantor agencies; therefore, to the extent that the City complied with the rules and regulationsgoverning the grants, refunds of any money received may be required and the collectability of any relatedreceivable at June 30, 2020 may be impaired. In the opinion of the City, there are no significant contingentliabilities relating to compliance with the rules and regulations governing the respective grants; therefore, noprovision has been recorded in the accompanying financial statements for such contingencies.
On August 1, 2012, the City entered into a sublease agreement to provide a backstop revenue pledge for a mixed-use development. The pledge was designed to cover debt service shortfalls on $20,500,000 in variable ratetaxable industrial building revenue bonds (IRBs) (Series 2012) issued by Warren County for the benefit of a localsub-developer. The project supported by the pledged revenue is located in downtown Bowling Green and consistsof over 100,000 square feet of mixed-use development that connects to a parking structure, on College and 8thStreets, adjacent to the Bowling Green Ballpark. In August of 2013, the Board of Commissioners approved anamendment to the City’s parking sublease to cover an additional borrowing of $5,000,000 in variable rate debt inorder to complete construction of the development.
The City agreed to sublease parking facilities in the structure connected to the above-referenced project from thesub-developer, who in-turn subleases the parking garage from Warren County. In May 2012, an Agreement onSharing of Revenues was executed between the City, County, and the Warren County Downtown EconomicDevelopment Authority that outlined the revenue streams from the TIF district pledged to cover the IRB debt. TheCity’s parking sublease agreement is the final line of revenue pledged, following: (1) lease revenues from thebuilding, (2) 80% of State TIF revenues from Blocks 4A, 5, 8, and 10 in the TIF District, (3) 80% of TIF revenuesgenerated by the key tenant of the building, and (4) any debt service reserve funds available from the permanentfinancing issue scheduled each December.
In March 2015, the City agreed to assign all State TIF revenues to the County and to adjust City base revenues inspecific blocks within the TIF District. In exchange for the adjusted base revenues, the County will provide anannual, renewable lease to fund City debt service shortfalls. The City also agreed to convert the annual, renewableparking sublease to a General Obligation (G.O.) sublease as part of the permanent bond issue that closed inJanuary 2016. The City considers the previous risk of funding debt shortfalls eliminated with the reassignment ofthe City’s share of State TIF revenues to the County, and the County’s pledge to reimburse the City for anyshortfalls on debt service of the IRB financing. At the end of the bond term (30 years), the County will receive titleto the ballpark.
62

City of Bowling Green, KentuckyNotes to the Financial StatementsFor the Year Ended June 30, 2020
NOTE 5. COMMITMENTS AND CONTINGENCIES
E. Liens and Encumbrances
While the City does have satisfactory title to all owned assets, there may be some liens and encumbrances onsuch assets for matters other than related to bond issues. Only a complete accurate title search of all propertieswould disclose such liens and encumbrances.
F. Conduit Debt
The City has issued Industrial Revenue Bonds to provide financial assistance to private sector and nonprofitentities for the acquisition and construction of industrial and commercial facilities deemed to be in public interest.The bonds are secured by the property financed and are payable solely from payments received on the underlyingmortgage loans. Upon repayment of the bonds, ownership of the acquired facilities transfers to the private sectoror nonprofit entity served by the bond issue. The City is not obligated in any manner for repayment of the bonds.Accordingly, the bonds are not reported as liabilities in the accompanying financial statements.
The City has also issued special assessment bonds to finance various residential improvement projects. Thebonds are repaid from amounts levied against the property owners benefited by the improvements. Neither thefaith and credit nor the general taxing power of the City has been pledged to the payment of the bonds and theCity has no obligation for the payment of the bonds in the case of default. Accordingly, the bonds are not reportedas liabilities in the accompanying financial statements.
As of June 30, 2020, there is one industrial revenue bond series and six series of special assessment bondsoutstanding with an aggregate principal balance of $40,000,000 and $925,000, respectively.
G. Lease Commitments
The Golf program in the General Fund leases approximately 53 acres of real estate from the Bowling Green-Warren County Regional Airport Board. This lease provides for future minimum lease payments as follows:
Year Ending June 30,2021 $ 6,3282022 6,328
$ 12,656
NOTE 6. THE SINGLE AUDIT ACT
The U.S. Office of Management and Budget's Uniform Administrative Requirements (2 CFR 200.501), CostPrinciples, and Audit Requirements for Federal Awards, which replaced Circular No. A133 for Audits of States,Local Governments and Non-Profit Organizations, requires non-federal entities that expend $750,000 or more ayear in federal awards to have an audit performed in accordance with the provisions of the guidance. The SingleAudit report is issued in the Comprehensive Annual Finanical Report after the Statistical Section beginning onpage 175.
NOTE 7. DEFINED BENEFIT PENSION PLANS
A. The Police and Firefighters' Retirement Fund (PFRF)
Plan description. The PFRF is a single-employer defined benefit pension plan administered by a Board of Trusteesconsisting of the Mayor, City Chief Financial Officer, and two retirees from the Police and Fire Departments. PFRFwas established to provide retirement and disability benefits for retiring, disabled, or deceased personnel and theirsurviving spouse. Benefits are determined by Kentucky Revised Statutes Sections 95.851 to 95.884. On August1, 1988 the plan was closed to new entrants and current active duty police and firemen of the City were given thechoice of remaining in this plan or transferring into the County Employees Retirement System (CERS). The PFRFissues a publicly available financial report that includes financial statements and required supplementaryinformation. That report may be obtained from the City's Chief Financial Officer, Bowling Green, Kentucky.
63

City of Bowling Green, KentuckyNotes to the Financial StatementsFor the Year Ended June 30, 2020
NOTE 7. DEFINED BENEFIT PENSION PLANS
A. The Police and Firefighters' Retirement Fund (PFRF)
Plan membership. As of June 30, 2020, the plan consisted of the following:
Active employees 0Retirees and disabled participants 11Widow participants 18Terminated vested employees 0
Benefits provided. The fund was established to provide retirement and disability benefits for retiring, disabled, ordeceased personnel and their surviving spouses. Benefits are determined by Kentucky Revised Statutes Sections95.851 to 95.884. Members were eligible to retire after age fifty, provided that at least twenty years of service hadbeen completed, and compulsory retirement was required at age fifty-seven. (There are no longer any activeemployees.) Retirement income is figured at two and one-half percent of the highest average salary for any threeconsecutive years of service times the years of service, up to and including thirty years. The maximum benefit isseventy-five percent of the participant's average salary. Rights in a retirement annuity are vested upon completionof twenty years of service. Upon termination prior to vesting, a member was eligible to receive a refund ofaccumulated contributions without interest.
At the time of active employee participation, two types of disability coverage were provided. If a member becamedisabled due to occupation-related causes, he/she commenced receipt of an annuity equal to seventy percent ofthe final rate of pay. A member rendered disabled through other than occupation-related causes became entitledto an annuity based on his/her average salary and years of service, subject to a maximum payment of fifty percentof his/her average salary.
Widows/widowers of members retired under occupational disability are entitled to income equal to fifty percent ofthe member's last rate of pay regardless of the length of service, and an additional twenty-five percent for eachminor child, with a combined maximum of seventy-five percent of the member's final salary. If no widow/widowersurvives or if she/he remarries the following percentages of a member's final average salary will be paid: oneminor child- fifty percent; two minor children- sixty-five percent; and three or more minor children- seventy-fivepercent. A minor child is a child under the age of eighteen or twenty-three if a full-time student.
Widows/widowers of retired members not under occupational disability are entitled to payments of one and one-half percent of the member's average salary times the member's years of service, with a maximum of fifty percentand subject to the following provisions: the widow/widower and the member had been married for at least one yearprior to retirement; payments are deferred until the widow/widower reaches the age of forty-five unless she/hebecomes disabled or has minor children in her/his care; the payments cease if the widow/widower remarries; andthe payments are increased by fifty percent for the first minor child and twenty-five percent for each additionalchild, with a maximum of seventy-five percent of the member's average salary.
There is currently one participant receiving a retirement annuity, ten participants receiving disability annuities, andeighteen participants receiving widows' annuities.
Contributions. The Retirement Fund's funding policy provided for employee contributions of eight percent of theirannual salary. A member reserve was established for member contributions and earnings allocations. As there areno longer any active members, members made no contribution for the year ended June 30, 2020.
The City of Bowling Green (City) only contributes amounts required to fund current service costs and interest onunfunded past service costs as determined by actuarial valuations in compliance with Kentucky Revised Statutes.The City is not required to make an annual contribution. For Fiscal Year 2019/2020, the City made no contribution.For Fiscal Year 2020/2021, the Board of Trustees approved a cost-of-living adjustment (COLA) of 2.0%. The City'sGeneral Fund covers the administrative costs of the Plan, approximately $20,000 per year. There are no assetslegally reserved for purposes other than the payment of Plan member benefits.
64

City of Bowling Green, KentuckyNotes to the Financial StatementsFor the Year Ended June 30, 2020
NOTE 7. DEFINED BENEFIT PENSION PLANS
A. The Police and Firefighters' Retirement Fund (PFRF)
In future years, cost of living increases will be considered based upon the Plan’s Funding Policy, which wasadopted on September 7, 2016. The Policy states that when the funded ratio is maintained at 95% or above, asmeasured by the 0% cost of living actuarial calculation, the Board of Trustees will consider a cost of livingadjustment.
Net Pension Liability
The City’s net pension liability (asset) was measured as of July 1, 2020, and the total pension liability used tocalculate net pension liability (asset) was determined by an actuarial valuation as of that date.
Actuarial assumptions. The total pension liability as of July 1, 2020 actuarial valuation was determined using thefollowing actuarial assumptions, applied to all periods included in the measurement:
Actuarial cost method Entry age normal
Asset valuation methold Fair market value adjusted for accruals
Inflation None
COLAs Average of the cost-of-living adjustments made over the prior 5 years,rounded to the nearest 1.0%. For July 1, 2020 valuation, this result is1.0% per annum.
Investment rate of return 6.0% per annum
Mortality Non-Disabled Lives: IRS generational mortality tables (Post Commencement Rates only) with mortality improvements after year 2006under Project Scal MP-2018 (male and female scales).
Disabled Lives: Rates published in IRS Revenue Ruling 96-7 (Disablement prior to 1/1/1995).
The long-term expected rate of return on plan assets was determined using a method in which best-estimateranges of expected future real rates of return (expected return, net of investment expense and inflation) weredeveloped by the investment consultant for each major asset class. The target allocation and best estimates ofgeometric real rates of return for each major asset class are summarized in the following table:
Asset ClassLong Term ExpectedReal Rate of Return
Inflation (CPI) N/AUS equity 3.70%Non-US equity 3.90%Fixed income (0.60)%Cash (0.27)%
Discount rate. The discount rate used to measure the total pension liability was 6.0 percent.
65

City of Bowling Green, KentuckyNotes to the Financial StatementsFor the Year Ended June 30, 2020
NOTE 7. DEFINED BENEFIT PENSION PLANS
A. The Police and Firefighters' Retirement Fund (PFRF)
Net Pension Liability
Sensitivity of the net pension liability (asset) to changes in the discount rate. The following presents the netpension liability (asset) of the City calculated using the discount rate of 6.0 percent, as well as the net pensionliability (asset) if calculated using a discount rate that is 1-percentage-point lower (5.0 percent) or 1-percentage-point higher (7.0 percent) than the current rate:
1% Decrease (5.0%)Current Discount Rate
(6.0%) 1% Increase (7.0%)
City of Bowling Green's net pensionliability (asset) $ (236,041) $ (608,379) $ (939,544)
Pension Expense (Income) and Deferred Outflows of Resources and Deferred Inflows ofResources Related to Pensions
Pension income. For the year ended June 30, 2020, the City recognized pension income of $362,260.
Deferred outflows of resources and deferred inflows of resources. For the year ended June 30, 2020, the Cityreported deferred outflows of resources and deferred inflows of resources related to pensions from the followingsources:
DeferredOutflows ofResources
DeferredInflows of
Resources
Net difference between projected andactual earnings on pension planinvestments $ 10,788 $ (149,379)
Change of assumptions - -Experience losses (gains) - -
Total $ 10,788 $ (149,379)
Amounts reported as deferred outflows of resources and deferred inflows of resources related to pensions will berecognized in pension expense as follows:
Year Ended June 30th:2021 $ (85,010)2022 (40,564)2023 (4,710)2024 (8,307)2025 -
$ (138,591)
In the table shown above, positive amounts will increase pension expense while negative amounts will decreasepension expense.
66

City of Bowling Green, KentuckyNotes to the Financial StatementsFor the Year Ended June 30, 2020
NOTE 7. DEFINED BENEFIT PENSION PLANS
B. The County Employees Retirement System (CERS)
General Information about the Pension Plan
Plan description. Employees of the City of Bowling Green are provided a defined benefit pension plan through theCERS, a cost-sharing multiple-employer defined pension plan administered by the Kentucky Revised Statutes(KRS). The CERS pension plan has two categories: Non-Hazardous for general employees and Hazardous forsworn police and fire employees. The KRS was created by State statute under Kentucky Revised Statue Section61.645. The KRS Board of Trustees is responsible for the proper operation and administration of the KRS. TheKRS issues a publicly available financial report that can be obtained by writing to Kentucky Retirement System,Perimeter Park West, 1260 Louisville Road, Frankfort, Kentucky 40601, or by telephone at (502) 564-4646.
Benefits provided. Kentucky Revised Statue Section 61.645 establishes the benefit terms and can be amendedonly by the Kentucky General Assembly. The chief legislative body may adopt the benefit terms permitted bystatute, there are currently three benefit Tiers. Tier 1 members are those participating in the plan before 9/1/2008,Tier 2 are those that began participation 9/1/2008 through 12/31/2013, and Tier 3 are those members that beganparticipation on or after 1/1/2014.
Benefits provided – Non-Hazardous. Tier 1 Non-Hazardous members are eligible to retire with an unreducedbenefit at age 65 with four years of service credit or after 27 years of service credit regardless of age. Benefits aredetermined by a formula using the member’s highest five consecutive year average compensation, which mustcontain at least 48 months. Reduced benefits for early retirement are available at age 55 and vested or 25 years ofservice credit. Members vest with five years of service credit. Service related disability benefits are provided afterfive years of service. Tier 2 Non-Hazardous members are eligible to retire based on the rule of 87: the membermust be at least age 57 and age + earned service must equal 87 years at retirement or at age 65 with five years ofservice credit. Benefits are determined by a formula using the member’s highest five consecutive year averagecompensation, which must be 60 months. Reduced benefits for early retirement are available at age 60 with 10years of service. Tier 3 Non-Hazardous members are also eligible to retire based on the rule of 87. Benefits aredetermined by a life annuity calculated in accordance with actuarial assumptions and methods adopted by theKRS Board based on a members accumulated account balance. Tier 3 members are not eligible for reducedretirement benefits.
Benefits provided – Hazardous. Tier 1 Hazardous members are eligible to retire with an unreduced benefit at age55 with five years of service credit or after 20 years of service credit regardless of age. Benefits are determined bya formula using the member’s highest three consecutive year average compensation, which must have at least 24months. Reduced benefits for early retirement are available at age 50 with 15 years of service credit. Tier 2Hazardous members are eligible to retire at any age with 25 years of service or at age 60 with 5 years of servicecredit. Benefits are determined by a formula using the member’s highest three consecutive year averagecompensation, which must be 36 months. Reduced benefits for early retirement are available at age 50 with 15years of service. Tier 3 Hazardous members are also eligible to retire at any age with 25 years of service or at age60 with 5 years of service. Tier 3 members are not eligible for reduced retirement benefits.
Prior to July 1, 2009, cost-of-living adjustments (COLA) were provided annually equal to the percentage increasein the annual average of the consumer price index for all urban consumers for the most recent calendar year, notto exceed 5% in any plan year. Effective July 1, 2009, and on July 1 of each year thereafter, the COLA is limited to1.5% provided the recipient has been receiving a benefit for at least 12 months prior to the effective date of theCOLA. If the recipient has been receiving a benefit for less than 12 months prior to the effective date of the COLA,the increase shall be reduced on a pro-rata basis for each month the recipient has not been receiving benefits inthe 12 months preceding the effective date of the COLA. The Kentucky General Assembly reserves the right tosuspend or reduce cost-of-living adjustments if, in its judgment, the welfare of the Commonwealth so demands.No COLA has been granted since July 1, 2011.
67

City of Bowling Green, KentuckyNotes to the Financial StatementsFor the Year Ended June 30, 2020
NOTE 7. DEFINED BENEFIT PENSION PLANS
B. The County Employees Retirement System (CERS)
General Information about the Pension Plan
Contributions. Contributions for employees are established in the statutes governing the KRS and may only bechanged by the Kentucky General Assembly. Non-Hazardous employees contribute 5% and Hazardousemployees contribute 8% of salary if they were plan members prior to September 1, 2008. Non-Hazardous andHazardous employees that entered the plan after September 1, 2008, are required to contribute 6% and 9%,respectively, of their annual creditable compensation. The additional 1% is deposited to an account created for thepayment of health insurance benefits under 26 USC Section 401(h) in the Pension Fund (see KentuckyAdministrative Regulation 105 KAR 1:420E). The City makes employer contributions at the rate set by the Board ofTrustees as determined by an actuarial valuation. For the year ended June 30, 2020, total employer contributionsfor the City were $8,636,661 based on a rate of 24.06% for Non-Hazardous and 39.58% for Hazardous membersthrough covered payroll. The contribution rate of 24.06% for Non-Hazardous is comprised of amounts for pensionand insurance benefits, 19.30% or $2,148,839 was dedicated to pensions and 4.76% or $529,973 was allocated toinsurance. The total contribution rate of 39.58% for Hazardous consists of 30.06% or $4,524,834 toward pensionbenefits and 9.52% or $1,433,015 for insurance benefits. The total City contribution in FY2020 for the pensionbenefits portion was $6,673,673.
By law, employer contributions are required to be paid. The employer’s actuarially determined contribution (ADC)and member contributions are expected to finance the costs of benefits earned by members during the year, thecost of administration, as well as an amortized portion of any unfunded liability.
Net Pension Liability
For financial reporting, the actuarial valuation of as June 30, 2019, was performed by Gabriel Roeder Smith(GRS). The total pension liability, net pension liability, and sensitivity information as of June 30, 2019 were basedon an actuarial valuation date as of June 30, 2018. The total penson liability was rolled-forward from the valuationdate (June 30, 2018) to the plan's fiscal year ending June 30, 2019, using generally accepted accountingprinciples.
Actuarial assumptions. The Board of Trustees adopted new actuarial assumptions since Jun 30, 2018. Theseassumptions are documented in the report titled "Kentucky Retirement System 2018 Acturial Experience Study forthe Period Ending June 30, 2018". The total pension liability as of June 30, 2019, was detemined using theseupdated assumptions.
The assumptions are:
Inflation 2.30 percent
Salary increases3.30 percent to 10.30 percent for CERS non-hazardous; 3.55percent to 19.05 percent for CERS hazardous
Payroll Growth Rate 2.0 percent
Investment rate of return 6.25 percent
During the 2018 legislative session, House Bill 185 was recommended, which updated the benefit provisions foractive members who die in the line of duty. Benefits paid to the spouses of deceased members have beenincreased from 25% of the member’s final rate of pay to 75% of the member’s average pay. If the member doesnot have a surviving spouse, benefits paid to surviving dependent children have been increased from 10% of themember’s final pay rate to 50% of average pay for one child, 65% of average pay for two children, or 75% ofaverage pay for three children.
68
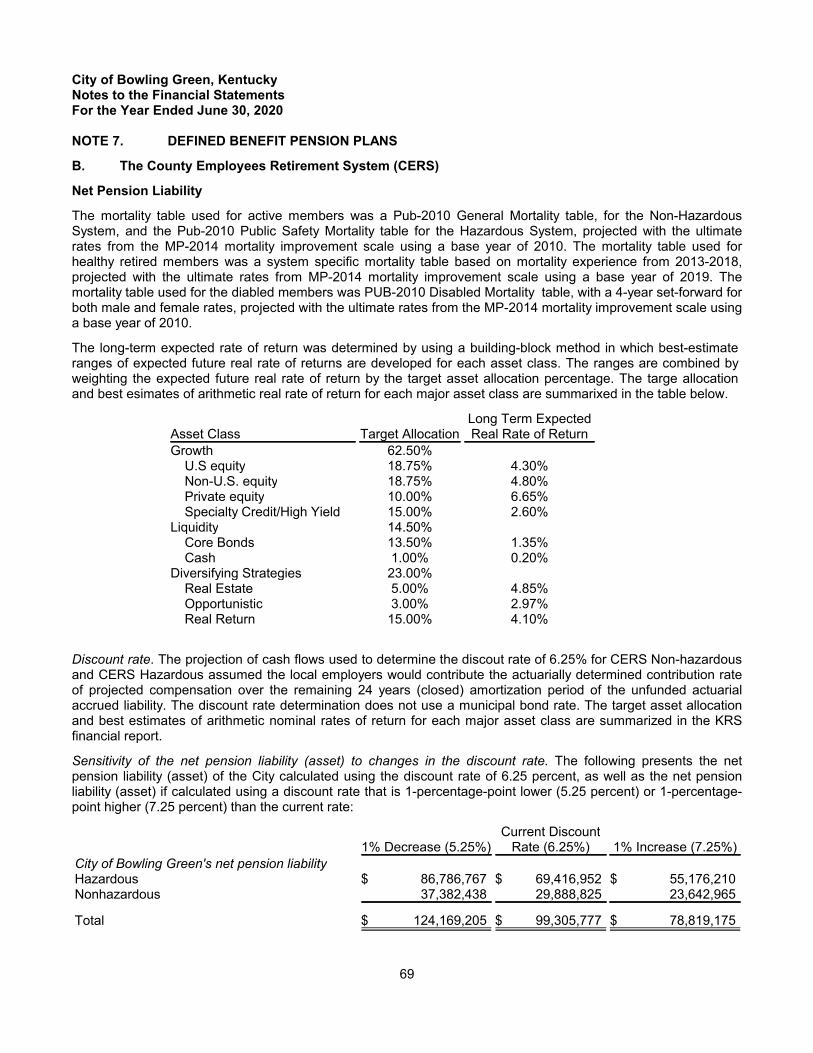
City of Bowling Green, KentuckyNotes to the Financial StatementsFor the Year Ended June 30, 2020
NOTE 7. DEFINED BENEFIT PENSION PLANS
B. The County Employees Retirement System (CERS)
Net Pension Liability
The mortality table used for active members was a Pub-2010 General Mortality table, for the Non-HazardousSystem, and the Pub-2010 Public Safety Mortality table for the Hazardous System, projected with the ultimaterates from the MP-2014 mortality improvement scale using a base year of 2010. The mortality table used forhealthy retired members was a system specific mortality table based on mortality experience from 2013-2018,projected with the ultimate rates from MP-2014 mortality improvement scale using a base year of 2019. Themortality table used for the diabled members was PUB-2010 Disabled Mortality table, with a 4-year set-forward forboth male and female rates, projected with the ultimate rates from the MP-2014 mortality improvement scale usinga base year of 2010.
The long-term expected rate of return was determined by using a building-block method in which best-estimateranges of expected future real rate of returns are developed for each asset class. The ranges are combined byweighting the expected future real rate of return by the target asset allocation percentage. The targe allocationand best esimates of arithmetic real rate of return for each major asset class are summarixed in the table below.
Asset Class Target AllocationLong Term ExpectedReal Rate of Return
Growth 62.50%U.S equity 18.75% 4.30%Non-U.S. equity 18.75% 4.80%Private equity 10.00% 6.65%Specialty Credit/High Yield 15.00% 2.60%
Liquidity 14.50%Core Bonds 13.50% 1.35%Cash 1.00% 0.20%
Diversifying Strategies 23.00%Real Estate 5.00% 4.85%Opportunistic 3.00% 2.97%Real Return 15.00% 4.10%
Discount rate. The projection of cash flows used to determine the discout rate of 6.25% for CERS Non-hazardousand CERS Hazardous assumed the local employers would contribute the actuarially determined contribution rateof projected compensation over the remaining 24 years (closed) amortization period of the unfunded actuarialaccrued liability. The discount rate determination does not use a municipal bond rate. The target asset allocationand best estimates of arithmetic nominal rates of return for each major asset class are summarized in the KRSfinancial report.
Sensitivity of the net pension liability (asset) to changes in the discount rate. The following presents the netpension liability (asset) of the City calculated using the discount rate of 6.25 percent, as well as the net pensionliability (asset) if calculated using a discount rate that is 1-percentage-point lower (5.25 percent) or 1-percentage-point higher (7.25 percent) than the current rate:
1% Decrease (5.25%)Current Discount
Rate (6.25%) 1% Increase (7.25%)
City of Bowling Green's net pension liabilityHazardous $ 86,786,767 $ 69,416,952 $ 55,176,210Nonhazardous 37,382,438 29,888,825 23,642,965
Total $ 124,169,205 $ 99,305,777 $ 78,819,175
69

City of Bowling Green, KentuckyNotes to the Financial StatementsFor the Year Ended June 30, 2020
NOTE 7. DEFINED BENEFIT PENSION PLANS
B. The County Employees Retirement System (CERS)
Pension Expense (Income) and Deferred Outflows of Resources and Deferred Inflows ofResources Related to Pensions
Pension expense. For the year ended June 30, 2020, the City recognized pension expense of $19,692,733.
Deferred outflows of resources and deferred inflows of resources. For the year ended June 30, 2020, the Cityreported deferred outflows of resources and deferred inflows of resources related to pensions from the sources onthe following table:
Deferred Outflowsof Resources
Deferred Inflowsof Resources
Net difference between projected and actualearnings on pension plan investments $ - $ (1,464,250)
Net difference between expected and actualexperience 3,712,515 (126,288)
Changes in proportion and differences betweenemployer contributions and proportionate share ofcontributions 1,442,032 (790,180)
Change of assumptions 9,763,334 -Contributions subsequent to the measurement date
of June 30, 2019 6,673,673 -
Total $ 21,591,554 $ (2,380,718)
The amount shown above for “Contributions subsequent to the measurement date of June 30, 2019, will berecognized as a reduction (increase) to net pension liability (asset) in the following measurement period.
Amounts reported as deferred inflows and outflows of resources related to pensions will be recognized in pensionexpense as follows:
Year Ended June 30th:2020 $ 8,168,8192021 3,061,4232022 1,210,1712023 96,7502024 -
$ 12,537,163
In the table shown above, positive amounts will increase pension expense while negative amounts will decreasepension expense.
NOTE 8. POSTEMPLOYMENT BENEFITS OTHER THAN PENSIONS (OPEB)
General Information about the OPEB Plan
Plan description. Employees of the City are provided hospital and medical insurance through the KentuckyRetirement Systems’ Insurance Fund (Insurance Fund), a cost-sharing multiple-employer defined benefit OPEBplan. The KRS was created by State statute under Kentucky Revised Statue Section 61.645. The KRS Board ofTrustees is responsible for the proper operation and administration of the KRS. The KRS issues a publiclyavailable financial report that can obtained by writing to Kentucky Retirement System, Perimeter Park West, 1260Louisville Road, Frankfort, Kentucky 40601, or by telephone at (502) 564-4646.
70
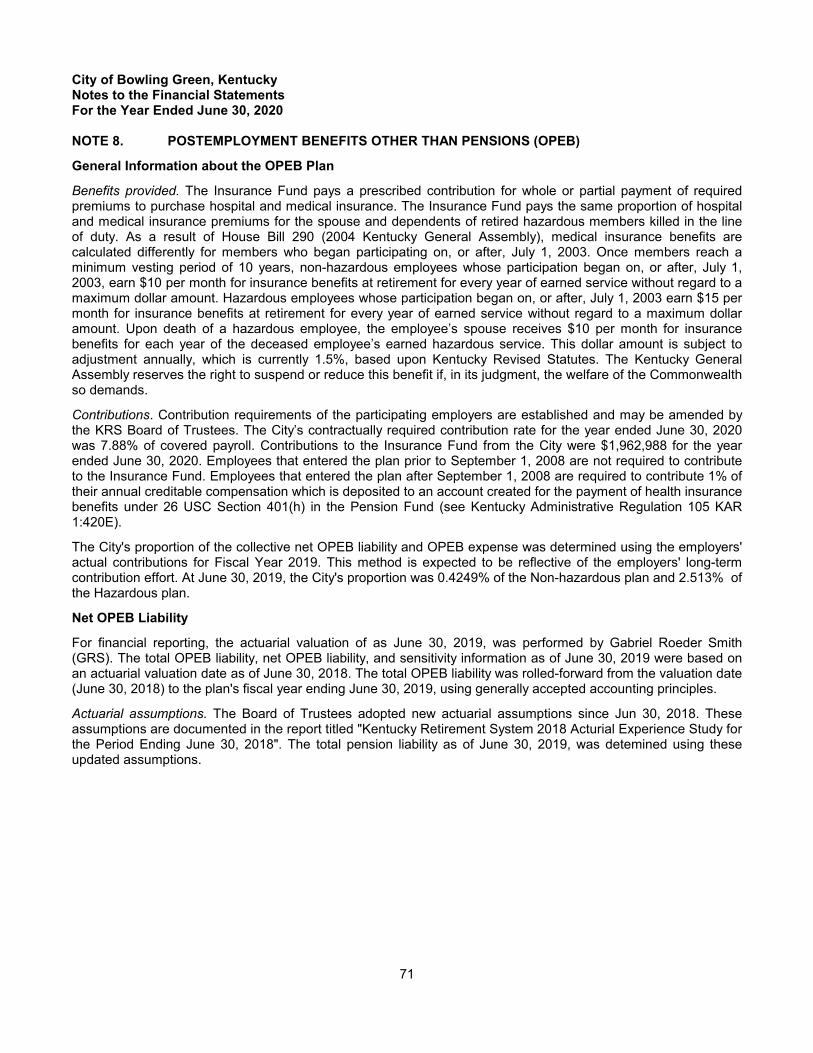
City of Bowling Green, KentuckyNotes to the Financial StatementsFor the Year Ended June 30, 2020
NOTE 8. POSTEMPLOYMENT BENEFITS OTHER THAN PENSIONS (OPEB)
General Information about the OPEB Plan
Benefits provided. The Insurance Fund pays a prescribed contribution for whole or partial payment of requiredpremiums to purchase hospital and medical insurance. The Insurance Fund pays the same proportion of hospitaland medical insurance premiums for the spouse and dependents of retired hazardous members killed in the lineof duty. As a result of House Bill 290 (2004 Kentucky General Assembly), medical insurance benefits arecalculated differently for members who began participating on, or after, July 1, 2003. Once members reach aminimum vesting period of 10 years, non-hazardous employees whose participation began on, or after, July 1,2003, earn $10 per month for insurance benefits at retirement for every year of earned service without regard to amaximum dollar amount. Hazardous employees whose participation began on, or after, July 1, 2003 earn $15 permonth for insurance benefits at retirement for every year of earned service without regard to a maximum dollaramount. Upon death of a hazardous employee, the employee’s spouse receives $10 per month for insurancebenefits for each year of the deceased employee’s earned hazardous service. This dollar amount is subject toadjustment annually, which is currently 1.5%, based upon Kentucky Revised Statutes. The Kentucky GeneralAssembly reserves the right to suspend or reduce this benefit if, in its judgment, the welfare of the Commonwealthso demands.
Contributions. Contribution requirements of the participating employers are established and may be amended bythe KRS Board of Trustees. The City’s contractually required contribution rate for the year ended June 30, 2020was 7.88% of covered payroll. Contributions to the Insurance Fund from the City were $1,962,988 for the yearended June 30, 2020. Employees that entered the plan prior to September 1, 2008 are not required to contributeto the Insurance Fund. Employees that entered the plan after September 1, 2008 are required to contribute 1% oftheir annual creditable compensation which is deposited to an account created for the payment of health insurancebenefits under 26 USC Section 401(h) in the Pension Fund (see Kentucky Administrative Regulation 105 KAR1:420E).
The City's proportion of the collective net OPEB liability and OPEB expense was determined using the employers'actual contributions for Fiscal Year 2019. This method is expected to be reflective of the employers' long-termcontribution effort. At June 30, 2019, the City's proportion was 0.4249% of the Non-hazardous plan and 2.513% ofthe Hazardous plan.
Net OPEB Liability
For financial reporting, the actuarial valuation of as June 30, 2019, was performed by Gabriel Roeder Smith(GRS). The total OPEB liability, net OPEB liability, and sensitivity information as of June 30, 2019 were based onan actuarial valuation date as of June 30, 2018. The total OPEB liability was rolled-forward from the valuation date(June 30, 2018) to the plan's fiscal year ending June 30, 2019, using generally accepted accounting principles.
Actuarial assumptions. The Board of Trustees adopted new actuarial assumptions since Jun 30, 2018. Theseassumptions are documented in the report titled "Kentucky Retirement System 2018 Acturial Experience Study forthe Period Ending June 30, 2018". The total pension liability as of June 30, 2019, was detemined using theseupdated assumptions.
71

City of Bowling Green, KentuckyNotes to the Financial StatementsFor the Year Ended June 30, 2020
NOTE 8. POSTEMPLOYMENT BENEFITS OTHER THAN PENSIONS (OPEB)
Net OPEB Liability
The assumptions are:
Inflation 2.30 percent
Payroll growth rate 2.00 percent
Salary increases
3.30 percent to 10.30 percent, varies by service for CERS non-hazardous; 3.05 percent to 19.05 percent, varies by service for CERShazardous
Investment rate of return 6.25 percent
Healthcare cost trend rates (Pre-65)Initial trend starting at 7.00% at January 1, 2020, and graduallydecreasing to ultimate trend rate of 4.05% over a period of 10 years.
Healthcare cost trend rates (Post-65)Initial trend starting at 5.00% at January 1, 2020, and graduallydecreasing to an ultimate trend rate of 4.05% over a period of 10 years.
The mortality table used for active members was a Pub-2010 General Mortality table, for the Non-HazardousSystem, and the Pub-2010 Public Safety Mortality table for the Hazardous System, projected with the ultimaterates from the MP-2014 mortality improvement scale using a base year of 2010. The mortality table used forhealthy retired members was a system specific mortality table based on mortality experience from 2013-2018,projected with the ultimate rates from MP-2014 mortality improvement scale using a base year of 2019. Themortality table used for the diabled members was PUB-2010 Disabled Mortality table, with a 4-year set-forward forboth male and female rates, projected with the ultimate rates from the MP-2014 mortality improvement scale usinga base year of 2010.
The long-term expected rate of return was determined by using a building-block method in which best-estimateranges of expected future real rate of returns are developed for each asset class. The ranges are combined byweighting the expected future real rate of return by the target asset allocation percentage. The target allocationand best estimates of arithmetic real rate of return for each major asset class summarized in the table below.
Asset ClassTarget
Allocation
Long-TermExpected RealRate of Return
Growth 62.50%U.S equity 18.75% 4.30%Non-U.S. equity 18.75% 4.80%Private equity 10.00% 6.65%Specialty credit/high yield 15.00% 2.60%
Liquidity 14.50%Core bonds 13.50% 1.35%Cash 1.00% 0.20%
Diversifying Strategies 23.00%Real estate 5.00% 4.85%Opportunistic 3.00% 2.97%Real return 15.00% 4.10%
72
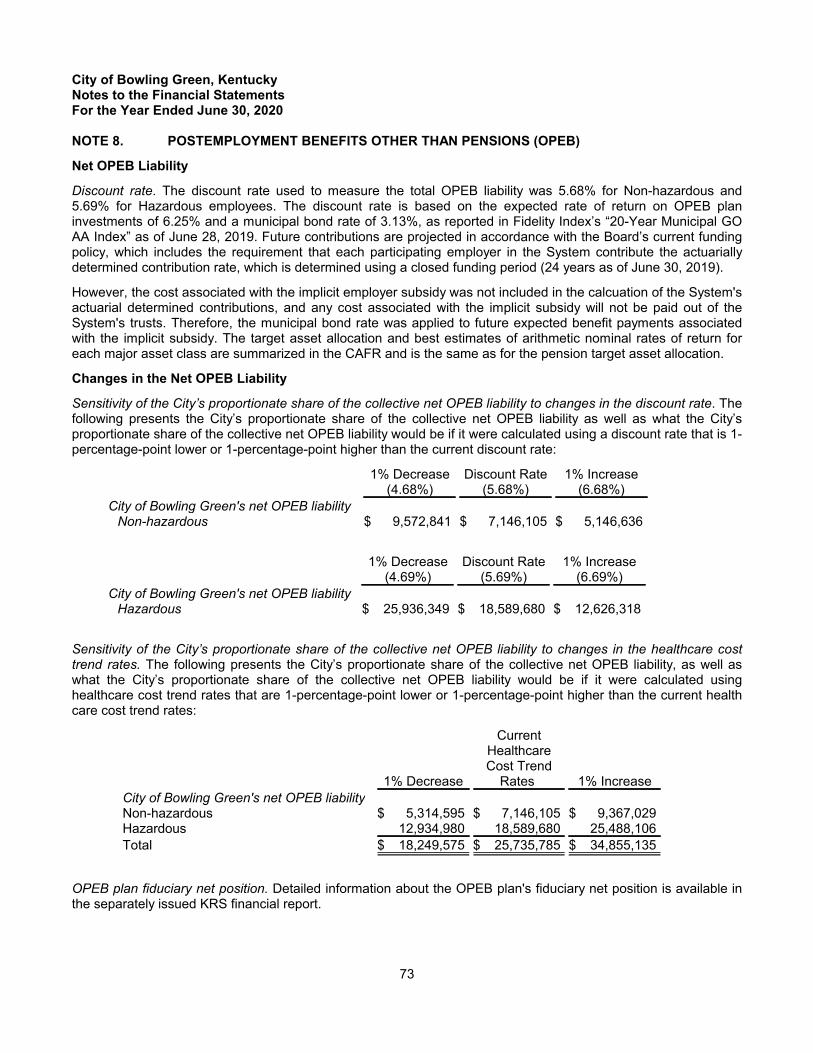
City of Bowling Green, KentuckyNotes to the Financial StatementsFor the Year Ended June 30, 2020
NOTE 8. POSTEMPLOYMENT BENEFITS OTHER THAN PENSIONS (OPEB)
Net OPEB Liability
Discount rate. The discount rate used to measure the total OPEB liability was 5.68% for Non-hazardous and5.69% for Hazardous employees. The discount rate is based on the expected rate of return on OPEB planinvestments of 6.25% and a municipal bond rate of 3.13%, as reported in Fidelity Index’s “20-Year Municipal GOAA Index” as of June 28, 2019. Future contributions are projected in accordance with the Board’s current fundingpolicy, which includes the requirement that each participating employer in the System contribute the actuariallydetermined contribution rate, which is determined using a closed funding period (24 years as of June 30, 2019).
However, the cost associated with the implicit employer subsidy was not included in the calcuation of the System'sactuarial determined contributions, and any cost associated with the implicit subsidy will not be paid out of theSystem's trusts. Therefore, the municipal bond rate was applied to future expected benefit payments associatedwith the implicit subsidy. The target asset allocation and best estimates of arithmetic nominal rates of return foreach major asset class are summarized in the CAFR and is the same as for the pension target asset allocation.
Changes in the Net OPEB Liability
Sensitivity of the City’s proportionate share of the collective net OPEB liability to changes in the discount rate. Thefollowing presents the City’s proportionate share of the collective net OPEB liability as well as what the City’sproportionate share of the collective net OPEB liability would be if it were calculated using a discount rate that is 1-percentage-point lower or 1-percentage-point higher than the current discount rate:
1% Decrease(4.68%)
Discount Rate(5.68%)
1% Increase(6.68%)
City of Bowling Green's net OPEB liabilityNon-hazardous $ 9,572,841 $ 7,146,105 $ 5,146,636
1% Decrease(4.69%)
Discount Rate(5.69%)
1% Increase(6.69%)
City of Bowling Green's net OPEB liabilityHazardous $ 25,936,349 $ 18,589,680 $ 12,626,318
Sensitivity of the City’s proportionate share of the collective net OPEB liability to changes in the healthcare costtrend rates. The following presents the City’s proportionate share of the collective net OPEB liability, as well aswhat the City’s proportionate share of the collective net OPEB liability would be if it were calculated usinghealthcare cost trend rates that are 1-percentage-point lower or 1-percentage-point higher than the current healthcare cost trend rates:
1% Decrease
CurrentHealthcareCost Trend
Rates 1% Increase
City of Bowling Green's net OPEB liabilityNon-hazardous $ 5,314,595 $ 7,146,105 $ 9,367,029Hazardous 12,934,980 18,589,680 25,488,106
Total $ 18,249,575 $ 25,735,785 $ 34,855,135
OPEB plan fiduciary net position. Detailed information about the OPEB plan's fiduciary net position is available inthe separately issued KRS financial report.
73

City of Bowling Green, KentuckyNotes to the Financial StatementsFor the Year Ended June 30, 2020
NOTE 8. POSTEMPLOYMENT BENEFITS OTHER THAN PENSIONS (OPEB)
OPEB Expense (Income) and Deferred Outflows of Resources and Deferred Inflows of Resources Relatedto OPEB
For the year ended June 30, 2020, the City recognized OPEB expense of $3,581,640. At June 30, 2020, the Cityreported deferred outflows of resources and deferred inflows of resources related to OPEB from the followingsources:
Deferred Outflowsof Resources
Deferred Inflowsof Resources
Net differences between expected and actualexperience $ - $ (5,614,432)
Changes of assumptions 7,732,317 (49,338)Net difference between projected and actual
earnings on OPEB plan investments - (1,386,184)Changes in proportion and difference between
employer contributions and proportionate share ofcontributions 317,657 (450,329)
Contributions subsequent to the measurement dateof June 30, 2019 2,041,342 -
Total $ 10,091,316 $ (7,500,283)
The amounts reported as deferred outflows of resources and deferred inflows of resources related to OPEB arerecognized in OPEB expenses as follows:
Year ended June 30th:2020 $ 1,043,0212021 54,2932022 (365,458)2023 (47,524)2024 (118,116)Thereafter (16,525)
$ 549,691
NOTE 9. DEFINED CONTRIBUTION PLANS
On December 5, 1995, the City's Board of Commissioner's adopted Municipal Order No. 1995-268 extendingparticipation in ICMA Retirement Corporation's Section 457 deferred compensation plan to all eligible Cityemployees as a voluntary retirement supplement. On May 7, 2019, the Board of Commissioner's adoptedMunicipal Order No. 2019-66 that executed a Joinder Agreement setting out terms of participation in the ICMA andlimiting use to only current account holders. The ICMA plan provides for retirement, disability and death benefitsbased upon the total value of each participant's contributions plus accrued investment returns. The ICMA planoffers a 457 option, 457 Roth option, and a 401(k) option.
Investments are managed by ICMA Retirement Corporation, plan administrator, with various investment options.The choice of the investment option(s) is made by the participants. Participating employees can contribute to thePlan based on either a percentage of compensation or a fixed dollar amount per pay period. The limits for the 457plan are up to $19,500 per year for regular contributions and $6,500 for catch-up contributions. The limits for theRoth plan are up to $6,000 per year for regular contributions and $1,000 for catch-up contributions. During thefiscal year ended June 30, 2020, employee contributions for both plans totaled $212,548.
74

City of Bowling Green, KentuckyNotes to the Financial StatementsFor the Year Ended June 30, 2020
NOTE 9. DEFINED CONTRIBUTION PLANS
On December 5, 1995, the City's Board of Commissioner's also adopted Municipal Order No. 95-269 authorizingparticipation in the Kentucky Public Employees 401(k) Deferred Compensation Plan. During the year ended June30, 2009, the City also began offering a Roth 401(k) option. On May 7, 2019, by Municipal Order 2019-66, the Citybegan offering 457 and Roth IRA options. The Plans are administered by the Kentucky Public Employees DeferredCompensation Authority and are offered to all eligible City employees as a voluntary retirement supplement. TheKentucky Deferred Compensation plan offers the following options: 401(k), 401(k) Roth IRA, Roth IRA, and a 457.
Participating employees can defer a maximum of $19,500 for regular contributions and $6,500 for catch-upcontributions for the 401(k) plan. The Roth plan has a maximum of $6,000 for regular contributions and $1,000dollars for the catchup conributions. Benefits are available upon termination of employment, retirement, death orfor hardship withdrawal. Employee contributions for both plans totaled $424,821 for the fiscal year ended June 30,2020.
NOTE 10. TAX ABATEMENTS
As of June 30, 2020, the City provides tax abatement through five programs: Job Development Incentive Program,Property Tax Annexation Program, TIF Occupational Tax Program, Historical Moratorium Property Tax Program,and Payments-in-Lieu-of-Taxes (PILOT) Program.
Job Development Incentive Program (JDIP) provides a credit of 1% of employee withholding fees from grosswages generated from new and/or expanded businesses for a period of 10 years. The credit is offered tobusinesses engaged in one or more of the following activities: manufacturing, agribusiness, regional and nationalheadquarters (regardless of the underlying business activity), or nonretail service or technology activities. Toqualify for the incentive, a business must create at least 10 new, full-time jobs for Kentucky residents, incur eligiblecosts of at least $100,000, pay minimum wages defined by county, and provide minimum employee benefits. Theabatement is equal to 1% of employee withholding fees and is reported on a monthly basis. Abated taxes ofparticipating companies can be recaptured for a number reasons, including: failure to report or pay employee taxwithholdings; failure to satisfy projected schedule of withholdings; failure to pay any tax, license fee, penalty orother charge or obligation to the City; failure to comply with any terms or conditions per Chapter 18 of City Code ofOrdinances and/or incentive program agreement; material misrepresentation of any statement or fact on incentiveapplication; abandoning or closing of business for a period of thirty (30) days; or default declared by the StateEconomic Development Cabinet on Kentucky Business Incentive (KBI) agreement.
Property Tax Annexation Program provides a rebate of City property taxes paid on annexed property for aperiod not to exceed five years to aid in covering development costs. The rebate period shall begin no later than10 years from the date of annexation. To be eligible for the property tax abatement program, the proposedproperty to be annexed must be: adjacent or contiguous to the City limits and is urban in character and suitable fordevelopment for urban purposes without unreasonable delay; adjacent to City limits, particularly in areas likely toresult in job creation; and in nine specific target areas to the current City limits or close to such area(s). Abatedtaxes may be recaptured if a participating company: fails to comply with City ordinances, rules, or regulations, orany terms of the Economic Development Annexation Incentive Agreement; or abandons or closes any businessesconstructed on the property being annexed for a period of thirty (30) consecutive days.
TIF Occupational Tax Program abates 80% of the incremental occupational revenues generated by theapproved entity. The Warren County Downtown Economic Development Authority, Inc. oversees this program anddetermines eligibility and approves abatements. The abatements consist of the paid occupational revenues beingreturned to the appropriate authority after calculations are finalized. The calculation is determined by comparingcurrent year revenues to a set base amount, 80% of the incremental revenue is then distributed to the appropriateoccupational taxpayer. This program does not contain a provision to recapture abated taxes.
75

City of Bowling Green, KentuckyNotes to the Financial StatementsFor the Year Ended June 30, 2020
NOTE 10. TAX ABATEMENTS
Historical Moratorium Property Tax Program provides abatement of City property taxes for a period of fiveyears. To be eligible, the following conditions must be met by the property: located in historic district, residential orcommercial building at least 50 years old within City limits, project must be completed within two years, andmoratorium must be filed 30 days prior to project start. The abatement amount is calculated as the difference offrozen City assessment values at project start to the current assessment of the property. Abatements arecompleted prior to the initiation of rehabilitation work on the property. After rehab is complete, City and CountyPlanning Commission staff conduct an inspection and issue the Moratorium Certificate to the City of BowlingGreen. The assessment is then frozen for five years. This program does not contain a provision to recaptureabated taxes.
Payments-in-Lieu-of-Taxes (PILOT) Program abates City property taxes for an agreed upon period of time.Eligible participants must be located within the geographic boundaries of the City, County, and school district(s)and the investment by the participant must generate new employment in the area. The abatement is in the form ofa suspension of payment (or portion thereof) for a specified period of time, which is tied to Industrial RevenueBond (IRB) issuance not to exceed the IRB payment period. The abated amount is equal to the annually assessedfair cash value of the project as determined by the Warren County Property Valuation Administrator (PVA). Theland is held by Warren County as part of the IRB issuance and is thereby removed from the City tax roll, but stillassessed for partial payments. Abated taxes may be recaptured on a sliding scale if agreed upon job creation andcapital investment thresholds are not met at a certain percentage.
A ten year summary of tax abatements is presented below:
Fiscal YearJDIP
withholdings
Annexedproperty
taxesTIF
occupationals Moratoriums
Payments-in-lieu-of-taxes
(PILOT)Amount of Taxes
Abated
2011 $ 1,181,115 $ - $ - $ 1,293 $ 132,291 $ 1,314,6992012 1,317,654 - - 1,387 115,360 1,434,4012013 1,236,267 - - 820 69,010 1,306,0972014 1,325,519 - 13,466 820 69,010 1,408,8152015 1,620,628 - 14,375 6,982 69,010 1,710,9952016 1,591,215 - 45,038 7,775 82,246 1,726,2742017 1,685,886 - 156,496 7,775 147,651 1,997,8082018 2,196,373 216 148,483 10,917 152,074 2,508,0632019 2,372,874 215 180,956 13,377 178,243 2,745,6652020 1,478,600 625 241,660 4,936 204,082 1,929,903
Total $ 16,006,131 $ 1,056 $ 800,474 $ 56,082 $ 1,218,977 $ 18,082,720
NOTE 11. SUBSEQUENT EVENTS
The City has committed to issue new General Obligation debt for the Inter-Modal Transportation Authority (ITA) inan amount not to exceed $44.8 million. The financing is anticipated to be finalized by the third quarter of FY2021.
On October 1, 2020, the City ended its contract with PNC Bank for the operation of the Police and Firefighters'Retirement Fund (PFRF). The City will process monthly retiree pension payments and annual IRS reporting in-house. This change is expected to result in administrative cost saving of approximately $6,000 annually for thepension plan.
76

City of Bowling Green, KentuckyNotes to the Financial StatementsFor the Year Ended June 30, 2020
NOTE 12. IMPLEMENTATION OF GASB 89
In June 2018, the GASB issued Statement No. 89, Accounting for Interest Cost Incurred Before the End of aConstruction Period. The provisions of this Statement are effective for fiscal years beginning after December 15,2019, but was postponed by one year as a result of GASB Statement No. 95, Postponement of the Effective Datesof Certain Authoritative Guidance. This Statement establishes accounting requirements for interest cost incurredbefore the end of a construction period.
This Statement requires that interest cost incurred before the end of a construction period be recognized as anexpense in the period in which the cost is incurred for financial statements prepared using the economic resourcesmeasurement focus. As a result, interest cost incurred before the end of a construction period will not be includedin historical cost of a capital asset reported in a business-type activity or enterprise fund.
This Statement also reiterates that in financial statements prepared using the current financial resourcesmeasurement focus, interest cost incurred before the end of a construction period should be recognized as anexpenditure on a basis consistent with governmental fund accounting principles.
The City has no current construction projects underway or planned that require the use of financing. Any futureconstruction projects meeting the criteria will be reported by the City as set forth in GASB Statement No. 89.
NOTE 13. RECENT PRONOUNCEMENTS
In January 2017, the GASB issued Statement No. 84, Fiduciary Activities. The provisions of this Statement wereinitially effective for fiscal years beginning after December 15, 2018, but was postponed by one year as a result ofGASB Statement No. 95, Postponement of the Effective Dates of Certain Authoritative Guidance. This Statementestablishes criteria for identifying fiduciary activities of all state and local governments. The focus of the criteriagenerally is on (1) whether a government is controlling the assets of the fiduciary activity, and (2) the beneficiarieswith whom a fiduciary relationship exists. Separate criteria are included to identify fiduciary component units andpostemployment benefit arrangements that are fiduciary activities. An activity meeting the criteria should bereported in a fiduciary fund in the basic financial statements. Governments with activities meeting the criteriashould present a statement of fiduciary net position and a statement of changes in fiduciary net position.
This Statement describes four fiduciary funds that should be reported, if applicable: (1) pension (and otheremployee benefit) trust funds, (2) investment trust funds, (3) private-purpose trust funds, and (4) custodial funds.Custodial funds generally should report fiduciary activities that are not held in a trust or equivalent arrangementthat meets specific criteria. This Statement also provides for recognition of a liability to the beneficiaries in afiduciary fund when an event has occurred that compels the government to disburse fiduciary resources.
In June 2017, the GASB issued Statement No. 87, Leases. The provisions of this Statement were effective forfiscal years beginning after December 15, 2019, but was postponed by eighteen months as a result of GASBStatement No. 95, Postponement of the Effective Dates of Certain Authoritative Guidance. This Statementrequires recognition of certain lease assets and liabilities for leases that previously were classified as operatingleases and recognized as inflows of resources or outflows of resources based on the payment provisions of thecontract. It establishes a single model for lease accounting based on the foundational principle that leases arefinancings of the right to use an underlying asset. Under this Statement, a lessee is required to recognize a leaseliability and an intangible right-to-use lease asset, and a lessor is required to recognize a lease receivable and adeferred inflow of resources, thereby enhancing the relevance and consistency of information about governments'leasing activities.
In May 2020, the GASB issued Statement No. 95, Postponement of the Effective Dates of Certain AuthoritativeGuidance. The provisions of this Statement are effective immediately. This extends the effective dates of certainaccounting and financial reporting provisions in Statements and Implementation Guides that were first effective forreporting periods beginning after June 15, 2018 and includes Statement No. 84 Fiduciary Activities, Statement No.87 Leases, which the City has elected to postpone implementation.
The City is evaluating the impact that will result from adopting the above GASB statements and is currently unableto disclose the impact of the adoption of these standards upon the financial position and results of operations.
77

REQUIRED SUPPLEMENTARY INFORMATION(Other than Management's Discussion and Analysis)

City of Bowling Green, KentuckyBudgetary Comparison ScheduleGeneral FundYear Ended June 30, 2020
Budgeted AmountsVariance withFinal Budget
Original Final ActualPositive
(Negative)
REVENUESTaxes
Real estate $ 10,200,000 $ 10,200,000 $ 10,462,260 $ 262,260Personal property 1,745,000 1,745,000 2,085,907 340,907Insurance premium 1,975,000 1,975,000 2,306,962 331,962Motor vehicle and boat 1,075,000 1,075,000 1,180,311 105,311Payment in lieu of taxes 160,000 160,000 164,906 4,906Franchise 1,120,000 1,120,000 1,037,457 (82,543)Other taxes 16,000 16,000 16,151 151Penalties and Interest 80,000 80,000 94,112 14,112
Total taxes 16,371,000 16,371,000 17,348,066 977,066
Licenses and permitsOccupational:
Employees' withholding 40,825,000 40,825,000 42,905,054 2,080,054Net profits 9,160,000 9,160,000 8,423,114 (736,886)Other fees 335,000 335,000 364,682 29,682
Special licenses 250,000 250,000 200,450 (49,550)Permits 1,237,000 1,237,000 907,268 (329,732)
Total licenses and permits 51,807,000 51,807,000 52,800,568 993,568
IntergovernmentalFederal grants - 6,283,337 5,680,727 (602,610)State grants - 67,000 67,595 595Local grants 17,750 18,250 18,218 (32)
Total intergovernmental 17,750 6,368,587 5,766,540 (602,047)
Charges for servicesSchool tax collection fees 270,000 270,000 275,926 5,926Other general government fees 7,000 7,000 3,142 (3,858)Public safety fees 75,000 75,000 76,236 1,236Cemetery lot sales 112,750 112,750 109,476 (3,274)Cemetery fees 158,200 158,200 155,291 (2,909)Other 71,500 71,500 57,520 (13,980)
Total charges for services 694,450 694,450 677,591 (16,859)
Parks and recreation 1,903,515 1,904,015 1,419,098 (484,917)
MiscellaneousInvestment income 375,202 375,202 422,064 46,862ABC and parking violations fees 10,000 10,000 5,650 (4,350)Contributions and donations 46,800 79,562 60,622 (18,940)Judgements and settlements 25,000 25,000 50,890 25,890Other 157,700 157,700 165,031 7,331
Total miscellaneous 614,702 647,464 704,257 56,793
Total revenues $ 71,408,417 $ 77,792,516 $ 78,716,120 $ 923,604
See accompanying independent auditor's report.79
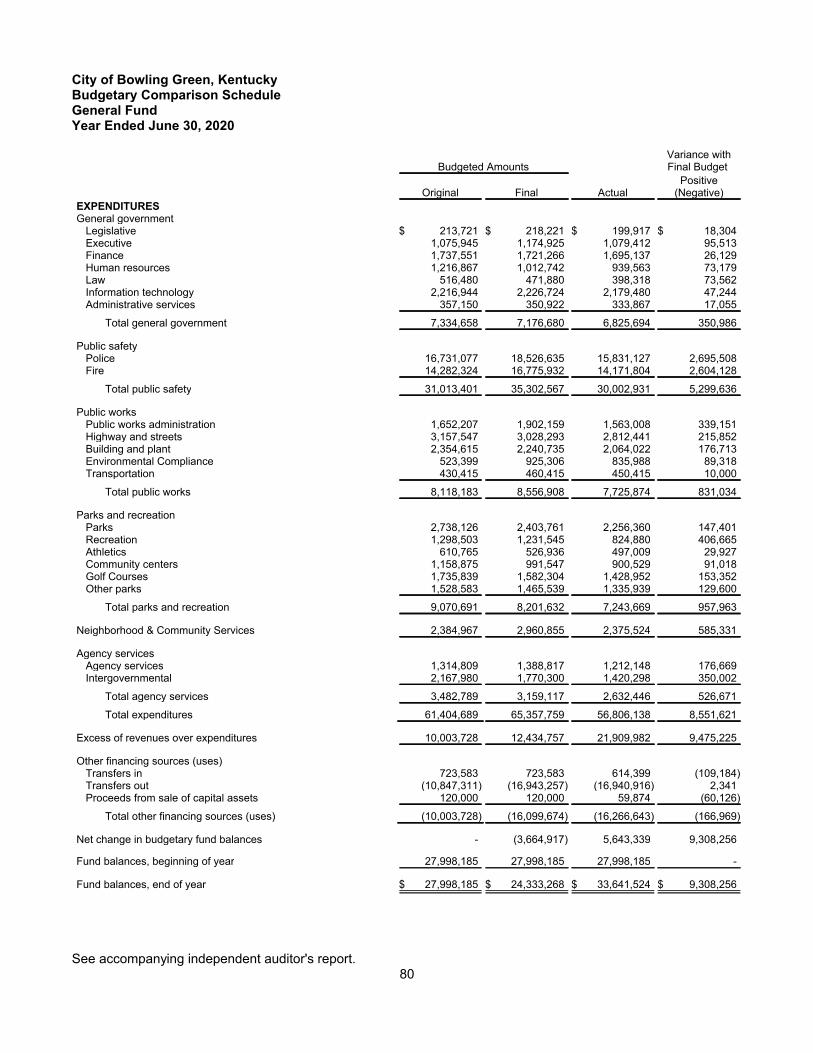
City of Bowling Green, KentuckyBudgetary Comparison ScheduleGeneral FundYear Ended June 30, 2020
Budgeted AmountsVariance withFinal Budget
Original Final ActualPositive
(Negative)
EXPENDITURESGeneral government
Legislative $ 213,721 $ 218,221 $ 199,917 $ 18,304Executive 1,075,945 1,174,925 1,079,412 95,513Finance 1,737,551 1,721,266 1,695,137 26,129Human resources 1,216,867 1,012,742 939,563 73,179Law 516,480 471,880 398,318 73,562Information technology 2,216,944 2,226,724 2,179,480 47,244Administrative services 357,150 350,922 333,867 17,055
Total general government 7,334,658 7,176,680 6,825,694 350,986
Public safetyPolice 16,731,077 18,526,635 15,831,127 2,695,508Fire 14,282,324 16,775,932 14,171,804 2,604,128
Total public safety 31,013,401 35,302,567 30,002,931 5,299,636
Public worksPublic works administration 1,652,207 1,902,159 1,563,008 339,151Highway and streets 3,157,547 3,028,293 2,812,441 215,852Building and plant 2,354,615 2,240,735 2,064,022 176,713Environmental Compliance 523,399 925,306 835,988 89,318Transportation 430,415 460,415 450,415 10,000
Total public works 8,118,183 8,556,908 7,725,874 831,034
Parks and recreationParks 2,738,126 2,403,761 2,256,360 147,401Recreation 1,298,503 1,231,545 824,880 406,665Athletics 610,765 526,936 497,009 29,927Community centers 1,158,875 991,547 900,529 91,018Golf Courses 1,735,839 1,582,304 1,428,952 153,352Other parks 1,528,583 1,465,539 1,335,939 129,600
Total parks and recreation 9,070,691 8,201,632 7,243,669 957,963
Neighborhood & Community Services 2,384,967 2,960,855 2,375,524 585,331
Agency servicesAgency services 1,314,809 1,388,817 1,212,148 176,669Intergovernmental 2,167,980 1,770,300 1,420,298 350,002
Total agency services 3,482,789 3,159,117 2,632,446 526,671
Total expenditures 61,404,689 65,357,759 56,806,138 8,551,621
Excess of revenues over expenditures 10,003,728 12,434,757 21,909,982 9,475,225
Other financing sources (uses)Transfers in 723,583 723,583 614,399 (109,184)Transfers out (10,847,311) (16,943,257) (16,940,916) 2,341Proceeds from sale of capital assets 120,000 120,000 59,874 (60,126)
Total other financing sources (uses) (10,003,728) (16,099,674) (16,266,643) (166,969)
Net change in budgetary fund balances - (3,664,917) 5,643,339 9,308,256
Fund balances, beginning of year 27,998,185 27,998,185 27,998,185 -
Fund balances, end of year $ 27,998,185 $ 24,333,268 $ 33,641,524 $ 9,308,256
See accompanying independent auditor's report.80

City of Bowling Green, KentuckyNotes to Required Supplementary Information on Budgetary Accounting and ControlYear Ended June 30, 2020
Budget Policy - Budgets are adopted on a basis consistent with generally accepted accounting principles. Annualappropriated budgets are adopted for the general, special revenue, debt service, and capital projects funds. TheCity adopts an annual appropriation budget for four Debt Service Funds covering all government debt serviceactivities. A budget is not prepared for the City's permanent fund.
Legal Compliance – All departments submit requests for the appropriations to the Budget Team. The BudgetTeam meets with each department head and reviews the new budget year requests. The budget is prepared byfund, function, and activity and includes information of the prior year, current year, and requested appropriationsfor the next fiscal year.
It is the City Manager’s responsibility to prepare a budget proposal and message, which must be submitted to theBoard of Commissioners at least 30 days prior to July 1st. The budget message explains revenue changes andexpenditure goals, any significant changes in program goals and appropriations, and any important budgetfeatures or major changes in financial policy. Following its submission to the Board, the City Manager presents therecommended budget at a public meeting. The budget is legally enacted through passage of an ordinance by June30th.
The Assistant City Manager/CFO is authorized to transfer budget amounts between departments within any fund.The Assistant Chief Financial Officer is authorized to prepare periodic budget amendments throughout the fiscalyear that are passed by an ordinance of the Board of Commissioners. The budget amendments providesupplementary appropriations as necessary to ensure expenditures do not exceed budget appropriations at theactivity level.
Encumbrances - Encumbrances represent commitments related to unperformed contracts for goods or services.Encumbrance accounting, under which purchase orders, contracts, and other commitments for the expendituresof resources are recorded to reserve that portion of the applicable appropriation, is utilized in the governmentalfunds. Encumbrances outstanding at year end are included within the appropriate fund balances in thegovernmental funds and are not reported separately on the financial statements. Encumbrances do not constituteexpenditures or liabilities because the commitments will be honored during the subsequent year. Encumbrancesare not recorded in the financial statements for proprietary, internal service, and fiduciary fund types.
The following funds had purchase orders outstanding at June 30, 2020 as follows:
General fund $ 756,571Convention center 578,987Nonmajor governmental 10,307,625Internal service 76,878
$ 11,720,061
See accompanying independent auditor's report.81
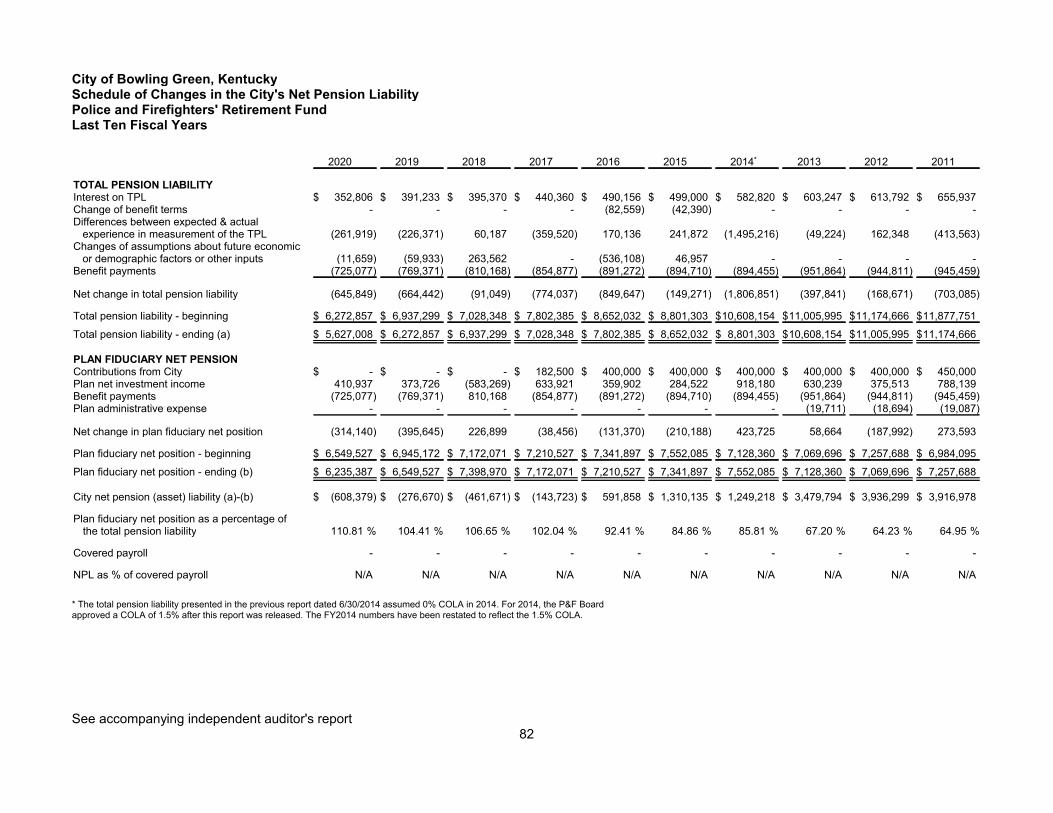
City of Bowling Green, KentuckySchedule of Changes in the City's Net Pension LiabilityPolice and Firefighters' Retirement FundLast Ten Fiscal Years
2020 2019 2018 2017 2016 2015 2014* 2013 2012 2011
TOTAL PENSION LIABILITYInterest on TPL $ 352,806 $ 391,233 $ 395,370 $ 440,360 $ 490,156 $ 499,000 $ 582,820 $ 603,247 $ 613,792 $ 655,937Change of benefit terms - - - - (82,559) (42,390) - - - -Differences between expected & actual
experience in measurement of the TPL (261,919) (226,371) 60,187 (359,520) 170,136 241,872 (1,495,216) (49,224) 162,348 (413,563)Changes of assumptions about future economic
or demographic factors or other inputs (11,659) (59,933) 263,562 - (536,108) 46,957 - - - -Benefit payments (725,077) (769,371) (810,168) (854,877) (891,272) (894,710) (894,455) (951,864) (944,811) (945,459)
Net change in total pension liability (645,849) (664,442) (91,049) (774,037) (849,647) (149,271) (1,806,851) (397,841) (168,671) (703,085)
Total pension liability - beginning $ 6,272,857 $ 6,937,299 $ 7,028,348 $ 7,802,385 $ 8,652,032 $ 8,801,303 $10,608,154 $11,005,995 $11,174,666 $11,877,751
Total pension liability - ending (a) $ 5,627,008 $ 6,272,857 $ 6,937,299 $ 7,028,348 $ 7,802,385 $ 8,652,032 $ 8,801,303 $10,608,154 $11,005,995 $11,174,666
PLAN FIDUCIARY NET PENSIONContributions from City $ - $ - $ - $ 182,500 $ 400,000 $ 400,000 $ 400,000 $ 400,000 $ 400,000 $ 450,000Plan net investment income 410,937 373,726 (583,269) 633,921 359,902 284,522 918,180 630,239 375,513 788,139Benefit payments (725,077) (769,371) 810,168 (854,877) (891,272) (894,710) (894,455) (951,864) (944,811) (945,459)Plan administrative expense - - - - - - - (19,711) (18,694) (19,087)
Net change in plan fiduciary net position (314,140) (395,645) 226,899 (38,456) (131,370) (210,188) 423,725 58,664 (187,992) 273,593
Plan fiduciary net position - beginning $ 6,549,527 $ 6,945,172 $ 7,172,071 $ 7,210,527 $ 7,341,897 $ 7,552,085 $ 7,128,360 $ 7,069,696 $ 7,257,688 $ 6,984,095
Plan fiduciary net position - ending (b) $ 6,235,387 $ 6,549,527 $ 7,398,970 $ 7,172,071 $ 7,210,527 $ 7,341,897 $ 7,552,085 $ 7,128,360 $ 7,069,696 $ 7,257,688
City net pension (asset) liability (a)-(b) $ (608,379) $ (276,670) $ (461,671) $ (143,723) $ 591,858 $ 1,310,135 $ 1,249,218 $ 3,479,794 $ 3,936,299 $ 3,916,978
Plan fiduciary net position as a percentage ofthe total pension liability %110.81 %104.41 %106.65 %102.04 %92.41 %84.86 %85.81 %67.20 %64.23 %64.95
Covered payroll - - - - - - - - - -
NPL as % of covered payroll N/A N/A N/A N/A N/A N/A N/A N/A N/A N/A
* The total pension liability presented in the previous report dated 6/30/2014 assumed 0% COLA in 2014. For 2014, the P&F Boardapproved a COLA of 1.5% after this report was released. The FY2014 numbers have been restated to reflect the 1.5% COLA.
See accompanying independent auditor's report82

City of Bowling Green, KentuckySchedule of City ContributionsPolice and Firefighters' Retirement FundLast Ten Fiscal Years
2020 2019 2018 2017 2016 2015
Actuarially determined contribution $ - $ - $ - $ 80,415 $ 311,021 $ 330,058
Contributions in relation to the actuariallydetermined contribution $ - $ - - $ 182,500 $ 400,000 $ 400,000
Contribution deficiency (excess) $ - $ - $ - $ (102,085) $ (88,979) $ (69,942)
City's covered payroll $ - $ - $ - $ - $ - $ -
Contributions as a percentage of coveredpayroll N/A N/A N/A N/A N/A N/A
Notes to Schedule
Valuation date: July 1, 2020
Methods and assumptions used to determine contribution rates:
Actuarial cost method Entry age normal
Asset valuation method Fair market value adjusted for accruals
Salary scale Not applicable
Disability, withdrawal, & retirement rates Not applicable
Rate of investment return 6.0% per annum
Cost of living adjustment Average cost of living adjustments made over the last five years,rounded to the nearest 1.00%
Eligible dependents It is assumed that there are no eligible dependent children or parents.
Mortality Non-disabled lives: IRS Generational Mortality tables (PostCommencement Rates only) with projected mortality improvementsafter year 2006 under Projection Scale MP-2018 (male & femalescales).Disabled Lives: Rates published in IRS Revenue Ruling 96-7(Disablement prior to 1/1/1995).
Note: This schedule intended to present a 10-year trend per GASB 67.
Additional years will be reported as incurred.
See accompanying independent auditor's report.83

City of Bowling Green, KentuckySchedule of Investment ReturnsPolice and Firefighters' Retirement FundLast Ten Fiscal Years
2020 2019 2018 2017 2016 2015 2014 2013 2012 2011
Annual money-weighted rate of return %6.60 %5.67 %8.57 %9.15 %5.02 %3.85 %12.70 %12.65 %9.64 %4.23
Starting with 2015, the investment returns reflect a fiscal year reporting basis.
See accompanying independent auditor's report84
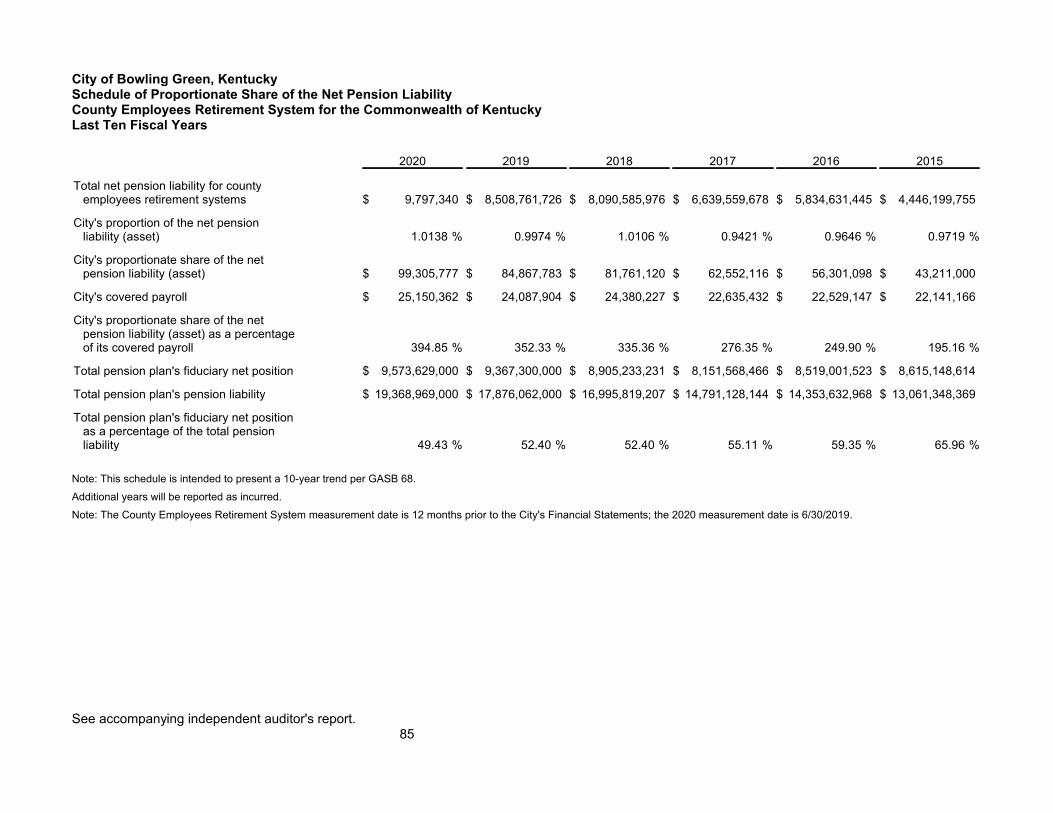
City of Bowling Green, KentuckySchedule of Proportionate Share of the Net Pension LiabilityCounty Employees Retirement System for the Commonwealth of KentuckyLast Ten Fiscal Years
2020 2019 2018 2017 2016 2015
Total net pension liability for countyemployees retirement systems $ 9,797,340 $ 8,508,761,726 $ 8,090,585,976 $ 6,639,559,678 $ 5,834,631,445 $ 4,446,199,755
City's proportion of the net pensionliability (asset) %1.0138 %0.9974 %1.0106 %0.9421 %0.9646 %0.9719
City's proportionate share of the netpension liability (asset) $ 99,305,777 $ 84,867,783 $ 81,761,120 $ 62,552,116 $ 56,301,098 $ 43,211,000
City's covered payroll $ 25,150,362 $ 24,087,904 $ 24,380,227 $ 22,635,432 $ 22,529,147 $ 22,141,166
City's proportionate share of the netpension liability (asset) as a percentageof its covered payroll %394.85 %352.33 %335.36 %276.35 %249.90 %195.16
Total pension plan's fiduciary net position $ 9,573,629,000 $ 9,367,300,000 $ 8,905,233,231 $ 8,151,568,466 $ 8,519,001,523 $ 8,615,148,614
Total pension plan's pension liability $ 19,368,969,000 $ 17,876,062,000 $ 16,995,819,207 $ 14,791,128,144 $ 14,353,632,968 $ 13,061,348,369
Total pension plan's fiduciary net positionas a percentage of the total pensionliability %49.43 %52.40 %52.40 %55.11 %59.35 %65.96
Note: This schedule is intended to present a 10-year trend per GASB 68.
Additional years will be reported as incurred.
Note: The County Employees Retirement System measurement date is 12 months prior to the City's Financial Statements; the 2020 measurement date is 6/30/2019.
See accompanying independent auditor's report.85

City of Bowling Green, KentuckySchedule of City Pension ContributionsCounty Employees Retirement System of the Commonwealth of KentuckyLast Ten Fiscal Years
2020 2019 2018 2017 2016 2015 2014
Actuarially determined pension contribution $ 6,673,673 $ 5,321,680 $ 4,555,520 $ 4,497,839 $ 3,837,246 $ 3,905,623 $ 4,021,011Contributions in relation to the actuarially
determined pension contribution 6,673,673 5,321,680 4,555,520 4,497,839 3,837,246 3,905,623 4,021,011
Pension contribution deficiency (excess) $ - $ - $ - $ - $ - $ - $ -
City's covered payroll $ 26,180,855 $ 25,150,362 $ 24,087,904 $ 24,380,227 $ 22,635,432 $ 22,529,147 $ 22,141,166
Pension Contributions as a percentage ofcovered payroll %25.49 %21.16 %18.91 %18.45 %16.95 %17.34 %18.16
Notes:
Valuation Date Actuarially determined contribution rates for 2020 were calculated based on the June 30, 2017 acturial valuation.
Actuarial Cost Method Entry Age Normal
Amortization Method Level Percent of Pay, Closed
Remaining amortization period 26 years, Closed
Payroll Growth Rate 2.00%
Asset Valuation Method 20% of the difference between the market value of assets and the expected actuarial value of assets is recognized
Inflation 2.30%
Salary Increase 3.05 to 18.55%, vaires by service
Investment Rate of Return 6.25%
Mortality RP-2000 Combined Mortality Table, projected to 2013 with Scale BB (set back 1 year for femals)
Note: This schedule is intended to present a 10-year trend per GASB 68.
Additional years will be reported as incurred.
See accompanying independent auditor's report.86

City of Bowling Green, KentuckySchedule of Proportionate Share of the Net OPEB LiabilityCounty Employees Retirement System of the Commonwealth of KentuckyLast Ten Fiscal Years
2020 2019 2018
Total net OPEB liability for countyemployees retirement systems $ 2,421,815,000 $ 2,488,439,571 $ 2,837,013,635
City's proportion of the net OPEBliability (asset) %1.062665 %1.002143 %1.042340
City's proportionate share of the netOPEB liability (asset) $ 25,735,785 $ 24,937,728 $ 29,571,323
City's covered payroll $ 25,150,361 $ 24,087,904 $ 24,380,227City's proportionate share of the net
OPEB liability (asset) as a percentage of its covered payroll %102.33 %103.53 %121.29
Total pension plan's fiduciary net position $ 3,910,225,000 $ 3,695,108,000 $ 3,401,537,049Total pension plan's OPEB liability $ 6,332,040,000 $ 6,183,547,000 $ 6,238,550,680Total pension plan's fiduciary net position
as a percentage of the total OPEB liability %61.75 %59.76 %54.52
Note: This schedule is intended to present a 10-year trend per GASB 75.
Additional years will be reported as incurred.
Note: The County Employer's Retirement System measurement date is 12 months prior to the City's Financial Statements; the 2020measurement date is 6/30/2019.
See accompanying independent auditor's report.87

City of Bowling Green, KentuckySchedule of City OPEB ContributionsCounty Employees Retirement System of the Commonwealth of KentuckyLast Ten Fiscal Years
2020 2019 2018 2017
Actuarially determined OPEB contribution $ 2,041,342 $ 2,119,645 $ 1,805,316 $ 1,664,002Contributions in relation to the actuarially determined OPEB
contribution 2,041,342 2,119,645 1,805,316 1,664,002
OPEB contribution deficiency (excess) $ - $ - $ - $ -
City's covered payroll $ 26,180,855 $ 25,150,362 $ 24,087,904 $ 24,380,227OPEB contributions as a percentage of covered payroll %7.80 %8.43 %7.49 %6.83
Notes:
Valuation Date Actuarially determined contribution rates for 2020 were calculated based on the June 30, 2017 actuarial valuation.
Actuarial Cost Method Entry Age Normal
Amortization Method Level Percent of Pay
Remaining Amortization Period 26 Years, Closed
Payroll Growth Rate 2.00%
Asset Valuation Method 20% of the difference between market value of assets and the expected acturial value ofassets is recognized.
Inflation 2.30%
Salary Increase 3.05% to 18.55%, varies by service
Investment Rate of Return 6.25%
Mortality RP-2000 Combined Mortality Table, projected to 2013 with Scale BB (set back 1 year forfemales)
Healthcare Rate Trends
Pre-65 Initial trend starting at 7.25% at January 1, 2019 and graudally decreasing to an ultimatetrend rate of 4.05% over a period of 13 years.
Post-65 Intial Trend starting at 5.10% at January 1, 2019 and gradually decreasing to an ultimatetrend rate of 4.05% over a period of 11 years.
Phase-In Provision Board certified rate is phased into the actuarially determined rate in accordance with HB362 enacted in 2018.
Note: This schedule is intended to present a 10-year trend per GASB 75.
Additional Years will be reported as incurred.
See accompanying independent auditor's report.88

City of Bowling Green, KentuckyModified Approach for City Streets Infrastructure Capital AssetsYear Ended June 30, 2020
Modified Approach for City Streets Infrastructure Capital Assets
As allowed by GASB Statement No. 34, Basic Financial Statements - and Management's Discussion and Analysis- for State and Local Governments, the City has adopted an alternative process for recording depreciationexpense on selected infrastructure assets. Under this alternative method, referred to as the modified approach,the City expenses certain maintenance and preservation costs and does not report depreciation expense.
In order to utilize the modified approach, the City is required to:
Maintain an asset management system that includes an up-to-date inventory of eligible infrastructure
assets.
Perform condition assessments of eligible assets and summarize the results using a measurement
scale.
Estimate each year the annual amount to maintain and preserve the assets at the condition level
established and disclosed by the City.
Document that the assets are being preserved approximately at, or above, the established condition
level.
Roads
The City began using its computerized pavement management system in 1997. Surface distress and ride comfortassessments are conducted on all segments. Street assessments are conducted annually, and all segments areassessed within a three-year cycle. The most recent assessment was conducted in the spring of 2020.
Upon completion of the assessment, an overall condition index (OCI) is calculated to assess individual pavementsegments. Streets are rated on a 0 to 100 scale. An OCI of 100 would correspond to a pavement with properengineering design and construction at the beginning of its life cycle.
The following pavement quality conditions have been defined:
Condition OCI Rating
Excellent 88.0 - 100.00Good 76.0 - 87.99Fair 64.0 - 75.99Poor 50.0 - 63.99Bad 0.0 - 49.99
Established Condition Level
The City's policy is to consider streets in need when the OCI rating falls below minimum values. These values areas follows:
Functional Classification Minimum OCI
Local 67.0Collector 69.0Arterial 72.0Alley 25.0
Segments considered to be in need are quantitatively prioritized for rehabilitation based on OCI, traffic, functionalclass, and other factors.
See accompanying independent auditor's report.89

City of Bowling Green, KentuckyModified Approach for City Streets Infrastructure Capital Assets (Continued)Year Ended June 30, 2020
Assessed Conditions
The following table reports the percentage of streets meeting the minimum acceptable conditions or above:
Year Percentage
2020 74%2019 72%2018 79%*2017 87%2016 97%2015 97%2014 98%2013 98%2012 97%2011 95%
*Note: In 2017 the City migrated its pavement management system from the Cartegraph Navigator platform toCartegraph Operations Management Systems (OMS). This move is important to note because the new OMSsystem uses a different calculation than the prior system did, which results in lower OCI scores. The City haschosen not to adjust the quality conditions or minimum standards as defined above since the new OCI calculationin combination with the existing defined standards provides a more conservative benchmark for assessment of theoverall condition of the pavement network. Additionally, in 2018 the City revised the street functional classificationin use to more closely align with the Kentucky Transportation Cabinet system. This also resulted in a negative netimpact to the overall network OCI scores.
Budgeted and Estimated Costs to Maintain
The following table presents the City's estimate of spending necessary to preserve and maintain the StreetInfrastructure at, or above, the "Established Condition Levels" cited above, and the actual amount spent in pastfiscal years:
Fiscal Year Estimated Spending Actual Spending
2020-2021 $ 1,500,000 $ -2019-2020 $ 2,000,000 $ 2,308,0492018-2019 $ 2,000,000 $ 1,969,6252017-2018 $ 2,350,000 $ 2,390,1742016-2017 $ 2,000,000 $ 2,696,9802015-2016 $ 1,300,000 $ 886,7962014-2015 $ 1,000,000 $ 1,826,0002013-2014 $ 900,000 $ 709,0002012-2013 $ 850,000 $ 572,0002011-2012 $ 850,000 $ 1,090,0002010-2011 $ 811,000 $ 431,000
The budgeting process utilized by the City results in spending in one fiscal year from amounts that were budgetedin a previous year(s). Therefore, this timing difference does not allow a true comparison of amounts budgeted andspent within a given year. The table demonstrates that over the past five years, the City spending has been in linewith the budgeted amounts and the other tables contained within this narrative demonstrate that the City has metits desired condition levels.
See accompanying independent auditor's report.90

City of Bowling Green, KentuckyModified Approach for City Streets Infrastructure Capital Assets (Continued)Year Ended June 30, 2020
Sidewalks
The City utilizes a computerized sidewalk management system. Condition assessments are visually performed onall sidewalks segments, ratings are based on the presence of cracking, heaving, holes, setting, and spalling.These assessments were currently conducted on the entire sidewalk network on a four-year cycle. The mostrecent assessment was completed in the Spring and early Summer of 2020.
In 2020, the City revised its sidewalk inspection and condition assessment approach due to the concretesidewalk's inherit longevity and ability to retain structural integrity in the presence of aesthetic defects. Thecondition calculation was revised to focus the assessment on the presence of potential trip hazards rather thanaesthetic defects. The purposed of this approach is to emphasize the detection and elimination of potentialpedestrian hazards based upon the annual inspection of a respresentive sample of city maintained sidewalks.
Upon completion of the assessment, an overall condition index (OCI) is calculated to assess individual pavementsegments. Segments are rated on a 0 to 100 scale. An OCI of 100 would correspond to a sidewalk with properengineering design and construction at the beginning of its life cycle.
The following overall condition index for sidewalks has been defined as follows:
Condition OCI Rating
Excellent 88.0 - 100.00Good 76.0 - 87.99Fair 64.0 - 75.99Poor 50.0 - 63.99Bad 0.0 - 49.99
Established Condition Level
The City's policy is to achieve a rating of 76.0 for all sidewalks, which is a good rating. This rating allows minorcracking and raveling of the sidewalk along with minor roughness that could be noticeable to pedestrians.
Assessed conditions
The sidewalk management system indicates that 89% of city-maintained sidewalks had an OCI value greater thanor equal to the minimum rating of 76.0 as of June 30, 2020.
Budgeted and Estimated Costs to Maintain
The following table presents the City's estimate of spending necessary to preserve and maintain the SidewalkInfrastructure at, or above, the "Established Condition Levels" cited above, and the actual amount spent in pastfiscal years:
Fiscal Year Estimated Spending Actual Spending
2020-2021 $ 100,000 $ -2019-2020 $ 100,000 $ 310,9032018-2019 $ 100,000 $ 28,2002017-2018 $ 100,000 $ 20,1302016-2017 $ 100,000 $ 94,4632015-2016 $ 100,000 $ 249,1762014-2015 $ 100,000 $ 215,0002013-2014 $ 100,000 $ 10,0002012-2013 $ 100,000 $ 41,0002011-2012 $ 100,000 $ 41,000
See accompanying independent auditor's report.91

City of Bowling Green, KentuckyModified Approach for City Streets Infrastructure Capital Assets (Continued)Year Ended June 30, 2020
The budgeting process utilized by the City results in spending in one fiscal year from amounts that were budgetedin a previous year(s). Therefore, this timing difference does not allow a true comparison of amounts budgeted andspent within a given year.
See accompanying independent auditor's report.92

COMBINING AND INDIVIDUAL FUND STATEMENTS AND SCHEDULES

NONMAJOR GOVERNMENTAL FUNDS
SPECIAL REVENUE FUNDSSpecial revenue funds are used to account for specific revenues that are legally restricted to expenditure forparticular purposes.
Community Development FundThis fund is used to account for revenues and expenditures of the federal community development programs.
Fire Improvement FundThis fund is used to account for maintenance and capital outlays of the Fire Department. Funding is provided byfire insurance premium license fees.
Municipal Aid FundsThese funds are used to account for revenues and expenditures of Kentucky public safety, public works andeconomic development grants, liquid fuel tax, mineral and coal severance tax receipts, and law enforcementspecial pay programs.
Job Development Incentive FundThis fund is used to account for job development incentive payments to business prospects within City boundariesto provide incentives for the creation of new jobs. Employee withholdings generated by new jobs are deposited tothe fund and reused for future job development incentives and projects.
Parks Development FundThis fund is used to collect property tax receipts and occupational fees from the Hartland Planned CommunityDevelopment area. All funding is disbursed to other funds for Parks and Recreation Department expenses.
Landfill Closure FundThis fund is used to account for revenues and expenditures applicable to government landfill closure andpostclosure care.
Local Law Enforcement Block Grant FundThis fund is used to account for a Serious Habitual Offender/Criminal Apprehension Program (SHOCAP) Grant,which targets habitual juvenile offenders for intense supervision with the assistance of the courts, social services,and the local schools. This fund also receives federal funding, such as the federal CARES Act, for public safetycosts.
Radio System FundThis fund is used to account for the joint operations of an 800 MHZ radio system by the City of Bowling Green,Warren County Government, the Medical Center at Bowling Green, and Western Kentucky University, amongothers.
Police Improvement FundThis fund is used to account for revenue received from citations. The citations revenue will be collected andappropriated for capital expenditures for the Police Department.
Lampkin Park Trust FundThis fund is used to account for the receipt of one-seventh of the net income from C.W. Lampkin Charitable Trust.The money shall be used for the maintenance, improvement, and development of Lampkin Park in Bowling Green,Kentucky, as long as the park bears the name Lampkin Park.
TIF District FundThis fund is used to account for revenue received from the City's annual Tax Increment District (TIF) distributionthat represents 20% of the calculated incremental revenues.
Homeland Security FundThis fund is used to account for expenditures funded indirectly through the U.S. Department of Homeland Security.
See accompanying independent auditor's report.94

NONMAJOR GOVERNMENTAL FUNDS
CAPITAL PROJECT FUNDSCapital projects funds are used to account for the acquisition and construction of major capital facilities other than those financed by proprietary funds and trust funds.
Greenways/Riverfront Development FundThis fund was created to account for the development of a riverfront park adjacent to the Barren River. This fund currently provides funds and expenditures for the construction of greenway trails throughout the City.
Equipment Replacement FundThis fund is used to account for the general government capital outlays for vehicles and equipment. Financing for this fund is primarily provided by the General Fund.
Road Construction FundThis fund is used to account for costs associated with the purchase of land and construction of city road projects. Funding for the new projects has been made available through the General Fund.
Heritage Trail Construction FundThis fund is used to account for the revenue and expenditures associated with the construction of the Heritage Trail. Funding has been provided by donations and subsidies from the General Fund.
Sidewalk Improvement FundThis fund is used to account for costs associated with the improvement of existing and construction of new sidewalks throughout the City. Funding has been provided by the General Fund.
Stormwater Infrastructure Improvement FundThis fund tracks expenditures related to the improvement of existing storm drainage pipes located throughout the City of Bowling Green. Funding has been provided through a General Fund subsidy.
Municipal Facilities FundThis fund is used to monitor costs associated with upgrades and renovation of City buildings. Funding for this project has been made available from General Fund subsidies.
Technology Capital Improvement FundThis fund is used to account for expenditures associated with the City’s information technology program. Funding is mainly provided by transfers from other funds.
Smallhouse Road Construction FundThis fund tracks revenues and expenditures associated with the design and construction of improvements to Smallhouse Road. Funding has been primarily supplied through the General Fund.
Parks Capital Improvement FundThis fund accounts for expenditures and revenues associated with the planning, design, and construction or procurement of capital parks projects, such as a new park or shelter. These projects are funded by General Fund subsidies and Parks Development Fund transfers from the Convention Center Corporation.
800 Trunking Radio Systems Improvement FundThis fund is used to account for the replacement and improvement of the existing 800 Trunking Radio System. Funding has been provided from the General Fund and other local governments, such as Warren County.
Downtown Development FundThis fund is used to account for the costs associated with the improvement of the Downtown Bowling Green area. Funding is made available through subsidies from the General Fund.
Fire Capital Improvements FundThis fund is used to account for expenditures and revenues associated with the planning, design, and construction or procurement of Fire Department capital projects and equipment. These projects are funded by the General Fund, Fire Improvement Fund, and through capital financing as necessary.
Southwest Parkway Capital Projects FundThis fund is used to account for construction of road projects for the Southwest Parkway corridor. Funding has been provided from the General Fund and other governments.
Police Capital Improvements FundThis fund is used to account for expenditures and revenues associated with the planning, design, and construction of Police Department capital projects and equipment. These projects are funded by the General Fund and Special Revenue Funds.
See accompanying independent auditor's report.95

NONMAJOR GOVERNMENTAL FUNDS
DEBT SERVICE FUNDS
TIF DistrictThis fund is used to account for debt service payments for the General Obligation Bond originally issued to provide funding for the construction of Bowling Green's Single A baseball park.
See accompanying independent auditor's report.96

NONMAJOR GOVERNMENTAL FUNDS
PERMANENT FUNDS
Permanent funds are used to report resources that are legally restricted to allow only the earnings and not the principal, to be used for the prescribed purposes.
Cemetery Perpetual Trust FundThis fund is used to account for monies provided by private donors and from the sale of cemetery lots. The principal amount is to be maintained intact and invested. Investment earnings are used for cemetery maintenance.
See accompanying independent auditor's report.97

City of Bowling Green, KentuckyCombining Balance Sheet - Nonmajor Governmental FundsJune 30, 2020
NonmajorSpecial
RevenueFunds
NonmajorCapital
Projects Funds
Nonmajor DebtService Fund -
TIF District
NonmajorPermanent
Fund-CemeteryPerpetual
Total NonmajorGovernmental
Funds
ASSETSPooled cash and cash equivalents $ 4,264,263 $ 17,925,949 $ 1,478,502 $ 78,131 $ 23,746,845Non-pooled cash and cash equivalents 1,296,156 - - - 1,296,156Investments 8,117,694 6,649,160 2,499,386 1,157,505 18,423,745Receivables (net of allowances for
uncollectibles):Accounts receivable 147,986 - - - 147,986Interest receivable 5,517 5 - - 5,522
Due from other governmental units 774,502 476,173 - - 1,250,675Prepaid items 268,119 - - - 268,119
Total assets $ 14,874,237 $ 25,051,287 $ 3,977,888 $ 1,235,636 $ 45,139,048
LIABILITIES AND FUND BALANCESLiabilities
Vouchers and accounts payable $ 1,185,872 $ 1,649,035 $ - $ - $ 2,834,907Accrued payroll 14,872 - - - 14,872Unearned revenue 65,109 - - - 65,109
Total liabilities 1,265,853 1,649,035 - - 2,914,888
Fund balancesRestricted 3,208,345 - - 1,107,519 4,315,864Committed 8,820,855 - - - 8,820,855Assigned 1,579,184 23,402,252 3,977,888 128,117 29,087,441
Total fund balances 13,608,384 23,402,252 3,977,888 1,235,636 42,224,160
Total liabilities and fund balances $ 14,874,237 $ 25,051,287 $ 3,977,888 $ 1,235,636 $ 45,139,048
See accompanying independent auditor's report.98

City of Bowling Green, KentuckyCombining Balance Sheet - Nonmajor Special Revenue FundsJune 30, 2020
CommunityDevelopment
FireImprovement Municipal Aid
JobDevelopment
IncentiveParks
Development Landfill Closure
ASSETSPooled cash and cash equivalents $ - $ 112,415 $ 2,562,021 $ 939,319 $ 52,341 $ 119,375Non-pooled cash and cash equivalents 1,078,099 217,790 - - 267 -Investments 531,274 787,878 1,682,843 4,050,115 - 965,602
Receivables (net of allowances for uncollectibles):Accounts receivable 13,458 - 120,878 - - -Interest receivable - 120 52 4,384 - 961
Due from other governmental units 15,721 - 426,177 - - 233,900Prepaid items 268,119 - - - - -
Total assets $ 1,906,671 $ 1,118,203 $ 4,791,971 $ 4,993,818 $ 52,608 $ 1,319,838
LIABILITIES AND FUND BALANCESLiabilities
Vouchers and accounts payable $ 20,650 $ 24,178 $ 1,080,063 $ 500 $ 52,608 $ 68Accrued payroll 8,690 - 6,182 - - -Unearned revenue 65,109 - - - - -
Total liabilities 94,449 24,178 1,086,245 500 52,608 68
Fund balancesRestricted 1,124,589 13,864 1,986,743 - - -Committed 687,633 1,080,161 139,799 4,993,318 - 1,319,770Assigned - - 1,579,184 - - -
Total fund balances 1,812,222 1,094,025 3,705,726 4,993,318 - 1,319,770
Total liabilities and fund balances $ 1,906,671 $ 1,118,203 $ 4,791,971 $ 4,993,818 $ 52,608 $ 1,319,838
See accompanying independent auditor's report99

City of Bowling Green, KentuckyCombining Balance Sheet - Nonmajor Special Revenue Funds (Continued)June 30, 2020
Local LawEnforcementBlock Grant Radio System
PoliceImprovement
Lampkin ParkTrust
HomelandSecurity TIF District
Total NonmajorSpecial Revenue
Funds
ASSETSPooled cash and cash equivalents $ (8,135) $ (18,360) $ 209,651 $ 20,753 $ (9,177) $ 284,060 $ 4,264,263Non-pooled cash and cash equivalents - - - - - - 1,296,156Investments - - 99,982 - - - 8,117,694Receivables (net of allowances for
uncollectibles):Accounts receivable - 13,650 - - - - 147,986Interest receivable - - - - - - 5,517
Due from other governmental units 15,668 67,378 6,481 - 9,177 - 774,502Prepaid items - - - - - - 268,119
Total assets $ 7,533 $ 62,668 $ 316,114 $ 20,753 $ - $ 284,060 $ 14,874,237
LIABILITIES AND FUND BALANCESLiabilities
Vouchers and accounts payable $ 7,533 $ 272 $ - $ - $ - $ - $ 1,185,872Accrued payroll - - - - - - 14,872Unearned revenue - - - - - - 65,109
Total liabilities 7,533 272 - - - - 1,265,853
Fund balancesRestricted - 62,396 - 20,753 - - 3,208,345Committed - - 316,114 - - 284,060 8,820,855Assigned - - - - - - 1,579,184
Total fund balances - 62,396 316,114 20,753 - 284,060 13,608,384
Total liabilities and fund balances $ 7,533 $ 62,668 $ 316,114 $ 20,753 $ - $ 284,060 $ 14,874,237
See accompanying independent auditor's report100

City of Bowling Green, KentuckyCombining Balance Sheet - Nonmajor Capital Projects FundsJune 30, 2020
Greenways/Riverfront
DevelopmentEquipment
ReplacementRoad
ConstructionFire Capital
ImprovementsHeritage TrailConstruction
SidewalkImprovement
StormwaterInfrastructureImprovement
MunicipalFacilities
ASSETSPooled cash and cash equivalents $ 1,360,174 $ 1,330,350 $ 2,350,070 $ 2,513,725 $ - $ 759,845 $ 635,464 $ 1,174,192Investments - 499,821 3,400,303 999,664 - 99,964 199,928 -Interest receivable - - 5 - - - - -Due from other governmental units 95,621 - - - - - - -
Total assets $ 1,455,795 $ 1,830,171 $ 5,750,378 $ 3,513,389 $ - $ 859,809 $ 835,392 $ 1,174,192
LIABILITIES AND FUND BALANCES
LIABILITIESVouchers and accounts payable $ 114,377 $ - $ 599,827 $ 269,489 $ - $ - $ 2,000 $ 151,644
Total liabilities 114,377 - 599,827 269,489 - - 2,000 151,644
FUND BALANCESAssigned 1,341,418 1,830,171 5,150,551 3,243,900 - 859,809 833,392 1,022,548
Total fund balances 1,341,418 1,830,171 5,150,551 3,243,900 - 859,809 833,392 1,022,548
Total liabilities and fund balances $ 1,455,795 $ 1,830,171 $ 5,750,378 $ 3,513,389 $ - $ 859,809 $ 835,392 $ 1,174,192
See accompanying independent auditor's report101

City of Bowling Green, KentuckyCombining Balance Sheet - Nonmajor Capital Projects Funds (Continued)June 30, 2020
TechnologyCapital
Improvement
SmallhouseRoad
ConstructionParks CapitalImprovements
800 TrunkingRadio SystemsImprovements
DowntownDevelopment
SouthwestParkway
Police CapitalImprovements
Total NonmajorCapital
Projects Funds
ASSETSPooled cash and cash equivalents $ 1,370,502 $ 751,714 $ 1,869,441 $ 963,836 $ 1,855,241 $ 14,737 $ 976,658 $ 17,925,949Investments 199,928 99,964 999,642 149,946 - - - 6,649,160Interest receivable - - - - - - - 5Due from other governmental units - - - - - 380,552 - 476,173
Total assets $ 1,570,430 $ 851,678 $ 2,869,083 $ 1,113,782 $ 1,855,241 $ 395,289 $ 976,658 $ 25,051,287
LIABILITIES AND FUND BALANCES
LIABILITIESVouchers and accounts payable $ 80,667 $ - $ 21,387 $ - $ 24,582 $ 380,552 $ 4,510 $ 1,649,035
Total liabilities 80,667 - 21,387 - 24,582 380,552 4,510 1,649,035
FUND BALANCESAssigned 1,489,763 851,678 2,847,696 1,113,782 1,830,659 14,737 972,148 23,402,252
Total fund balances 1,489,763 851,678 2,847,696 1,113,782 1,830,659 14,737 972,148 23,402,252
Total liabilities and fund balances $ 1,570,430 $ 851,678 $ 2,869,083 $ 1,113,782 $ 1,855,241 $ 395,289 $ 976,658 $ 25,051,287
See accompanying independent auditor's report102

City of Bowling Green, KentuckyCombining Statement of Revenues, Expenditures, and Changes in Fund BalancesNonmajor Governmental FundsYear Ended June 30, 2020
NonmajorSpecial
RevenueFunds
NonmajorCapital
Projects Funds
Nonmajor DebtService Fund -
TIF District
NonmajorPermanent
Fund-CemeteryPerpetual
Total NonmajorGovernmental
Funds
REVENUESProperty taxes $ 755,868 $ - $ - $ - $ 755,868Insurance premium taxes 2,360,151 - - - 2,360,151Wages and net profits 2,631,210 - - - 2,631,210Judgements and settlements 19,173 11,810 - - 30,983License and permits 284,060 - - - 284,060Intergovernmental 8,518,153 556,047 - - 9,074,200Investment income 185,022 106,856 33,610 22,921 348,409Charges for services 86,558 - - - 86,558Contributions and donations 434,741 836,420 - - 1,271,161Miscellaneous 148,944 - - 26,838 175,782
Total revenues 15,423,880 1,511,133 33,610 49,759 17,018,382
EXPENDITURESCurrent:
General government - 852,996 - - 852,996Public safety 2,932,252 804,997 - - 3,737,249Public works 3,937,553 280,219 - - 4,217,772Parks and recreation - 242,410 - - 242,410Neighborhood and community services 3,550,038 51,592 - - 3,601,630
Capital outlay 1,170,924 14,881,718 - - 16,052,642Debt service:
Principal - - 740,000 - 740,000Interest - - 715,087 - 715,087
Total expenditures 11,590,767 17,113,932 1,455,087 - 30,159,786
Excess (deficiency) of revenuesover (under) expenditures 3,833,113 (15,602,799) (1,421,477) 49,759 (13,141,404)
Other financing sources (uses): Transfers in 1,670,268 12,977,946 1,455,088 - 16,103,302Transfers out (6,281,189) (1) - - (6,281,190)Issuance of debt - 1,531,518 - - 1,531,518
Total other financing sources (uses) (4,610,921) 14,509,463 1,455,088 - 11,353,630
Net change in fund balances (777,808) (1,093,336) 33,611 49,759 (1,787,774)
Fund balances, beginning 14,386,192 24,495,588 3,944,277 1,185,877 44,011,934
Fund balances, ending $ 13,608,384 $ 23,402,252 $ 3,977,888 $ 1,235,636 $ 42,224,160
See accompanying independent auditor's report.103

City of Bowling Green, KentuckyCombining Statement of Revenues, Expenditures, and Changes in Fund Balances Nonmajor Special Revenue FundsYear Ended June 30, 2020
CommunityDevelopment
FireImprovement Municipal Aid
JobDevelopment
IncentiveParks
Development Landfill Closure
REVENUESProperty taxes $ - $ - $ 199,942 $ 84,037 $ 471,889 $ -Insurance premium taxes - 2,360,151 - - - -Wages and net profits - - - 1,256,810 1,374,400 -Judgements and settlements - 19,173 - - - -License and permits - - - - - -Intergovernmental 3,976,679 - 4,476,425 - - -Investment income 12,162 16,904 41,863 82,851 - 29,291Charges for services - - 21,093 - - -Contributions and donations - - - - - 233,900Miscellaneous 91,942 - 57,000 - - -
Total revenues 4,080,783 2,396,228 4,796,323 1,423,698 1,846,289 263,191
EXPENDITURESCurrent:
Public safety - 439,854 1,908,060 - - -Public works - - 3,874,630 - - 62,923Neighborhood and community services 3,509,038 - - 41,000 - -
Capital outlay 562,934 136,919 204,995 - - 242,430
Total expenditures 4,071,972 576,773 5,987,685 41,000 - 305,353
Excess (deficiency) of revenues over (under) expenditures 8,811 1,819,455 (1,191,362) 1,382,698 1,846,289 (42,162)
Other financing sources (uses): Transfers in - - 1,460,468 - - -Transfers out - (2,387,673) (1,327,700) (519,527) (1,846,289) -
Total other financing sources (uses) - (2,387,673) 132,768 (519,527) (1,846,289) -
Net change in fund balances 8,811 (568,218) (1,058,594) 863,171 - (42,162)
Fund balances, beginning 1,803,411 1,662,243 4,764,320 4,130,147 - 1,361,932
Fund balances, ending $ 1,812,222 $ 1,094,025 $ 3,705,726 $ 4,993,318 $ - $ 1,319,770
See accompanying independent auditor's report104
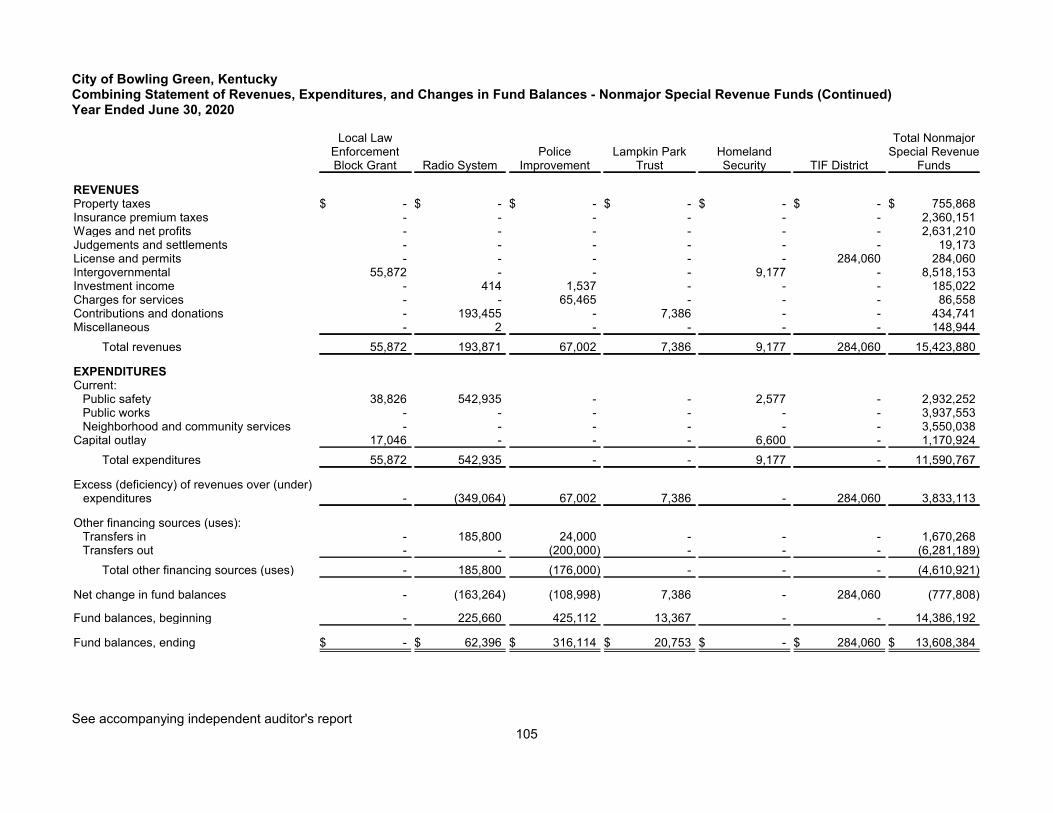
City of Bowling Green, KentuckyCombining Statement of Revenues, Expenditures, and Changes in Fund Balances - Nonmajor Special Revenue Funds (Continued)Year Ended June 30, 2020
Local LawEnforcementBlock Grant Radio System
PoliceImprovement
Lampkin ParkTrust
HomelandSecurity TIF District
Total NonmajorSpecial Revenue
Funds
REVENUESProperty taxes $ - $ - $ - $ - $ - $ - $ 755,868Insurance premium taxes - - - - - - 2,360,151Wages and net profits - - - - - - 2,631,210Judgements and settlements - - - - - - 19,173License and permits - - - - - 284,060 284,060Intergovernmental 55,872 - - - 9,177 - 8,518,153Investment income - 414 1,537 - - - 185,022Charges for services - - 65,465 - - - 86,558Contributions and donations - 193,455 - 7,386 - - 434,741Miscellaneous - 2 - - - - 148,944
Total revenues 55,872 193,871 67,002 7,386 9,177 284,060 15,423,880
EXPENDITURESCurrent:
Public safety 38,826 542,935 - - 2,577 - 2,932,252Public works - - - - - - 3,937,553Neighborhood and community services - - - - - - 3,550,038
Capital outlay 17,046 - - - 6,600 - 1,170,924
Total expenditures 55,872 542,935 - - 9,177 - 11,590,767
Excess (deficiency) of revenues over (under)expenditures - (349,064) 67,002 7,386 - 284,060 3,833,113
Other financing sources (uses): Transfers in - 185,800 24,000 - - - 1,670,268Transfers out - - (200,000) - - - (6,281,189)
Total other financing sources (uses) - 185,800 (176,000) - - - (4,610,921)
Net change in fund balances - (163,264) (108,998) 7,386 - 284,060 (777,808)
Fund balances, beginning - 225,660 425,112 13,367 - - 14,386,192
Fund balances, ending $ - $ 62,396 $ 316,114 $ 20,753 $ - $ 284,060 $ 13,608,384
See accompanying independent auditor's report105

City of Bowling Green, KentuckyCombining Statement of Revenues, Expenditures, and Changes in Fund Balances - Nonmajor Capital Projects FundsYear Ended June 30, 2020
Greenways/Riverfront
DevelopmentEquipment
ReplacementRoad
ConstructionFire Capital
ImprovementsHeritage TrailConstruction
SidewalkImprovement
StormwaterInfrastructureImprovement
MunicipalFacilities
REVENUESJudgements and settlements $ - $ 11,810 $ - $ - $ - $ - $ - $ -Intergovernmental 106,047 - - - - - - -Investment income - 7,609 50,327 15,217 - 1,522 3,043 4,716Contributions and donations - - - - - - - -
Total revenues 106,047 19,419 50,327 15,217 - 1,522 3,043 4,716
EXPENDITURESCurrent:
General government - - - - - - - -Public safety - 2,812 - 109,650 - - - -Public works - 11,833 132,441 - - - 10,134 8,400Parks and recreation - - - - - - - -Neighborhood and community services 21,143 - - - - - - -
Capital outlay 222,564 1,537,566 1,877,989 2,717,637 20,069 349,110 299,496 1,142,822
Total expenditures 243,707 1,552,211 2,010,430 2,827,287 20,069 349,110 309,630 1,151,222
Excess (deficiency) of revenues over (under)expenditures (137,660) (1,532,792) (1,960,103) (2,812,070) (20,069) (347,588) (306,587) (1,146,506)
Other financing sources (uses): Transfers in 417,556 1,560,000 2,500,000 850,000 - 625,000 500,000 500,000Transfers out - - - - (1) - - -Issuance of debt - - - 1,531,518 - - - -
Total other financing sources (uses) 417,556 1,560,000 2,500,000 2,381,518 (1) 625,000 500,000 500,000
Net change in fund balances 279,896 27,208 539,897 (430,552) (20,070) 277,412 193,413 (646,506)
Fund balances, beginning 1,061,522 1,802,963 4,610,654 3,674,452 20,070 582,397 639,979 1,669,054
Fund balances, ending $ 1,341,418 $ 1,830,171 $ 5,150,551 $ 3,243,900 $ - $ 859,809 $ 833,392 $ 1,022,548
See accompanying independent auditor's report106

City of Bowling Green, KentuckyCombining Statement of Revenues, Expenditures, and Changes in Fund Balances - Nonmajor Capital Projects Funds (Continued)Year Ended June 30, 2020
TechnologyCapital
Improvement
SmallhouseRoad
ConstructionParks CapitalImprovements
800 TrunkingRadio
SystemsImprovements
DowntownDevelopment
SouthwestParkway
Police CapitalImprovements
TotalNonmajor
CapitalProjectsFunds
REVENUESJudgements and settlements $ - $ - $ - $ - $ - $ - $ - $ 11,810Intergovernmental - - - - - - 450,000 556,047Investment income 3,043 1,522 15,217 2,282 2,358 - - 106,856Contributions and donations - - - - - 836,420 - 836,420
Total revenues 3,043 1,522 15,217 2,282 2,358 836,420 450,000 1,511,133
EXPENDITURESCurrent:
General government 852,996 - - - - - - 852,996Public safety - - - - - - 692,535 804,997Public works - - - - 81,221 36,190 - 280,219Parks and recreation - - 242,410 - - - - 242,410Neighborhood and community services - - - - 30,449 - - 51,592
Capital outlay 293,533 612,027 1,897,545 - 2,793,113 805,230 313,017 14,881,718
Total expenditures 1,146,529 612,027 2,139,955 - 2,904,783 841,420 1,005,552 17,113,932
Excess (deficiency) of revenues over (under)expenditures (1,143,486) (610,505) (2,124,738) 2,282 (2,902,425) (5,000) (555,552) (15,602,799)
Other financing sources (uses): Transfers in 1,000,000 500,000 1,346,889 150,800 1,500,001 - 1,527,700 12,977,946Transfers out - - - - - - - (1)Issuance of debt - - - - - - - 1,531,518
Total other financing sources (uses) 1,000,000 500,000 1,346,889 150,800 1,500,001 - 1,527,700 14,509,463
Net change in fund balances (143,486) (110,505) (777,849) 153,082 (1,402,424) (5,000) 972,148 (1,093,336)
Fund balances, beginning 1,633,249 962,183 3,625,545 960,700 3,233,083 19,737 - 24,495,588
Fund balances, ending $ 1,489,763 $ 851,678 $ 2,847,696 $ 1,113,782 $ 1,830,659 $ 14,737 $ 972,148 $ 23,402,252
See accompanying independent auditor's report107

City of Bowling Green, KentuckyBudgetary Comparison ScheduleDebt Service FundYear Ended June 30, 2020
Budgeted AmountsVariance withFinal Budget -
Original Final ActualPositive
(Negative)
EXPENDITURESCurrent:Debt service
Principal $ 3,865,500 $ 3,865,750 $ 3,865,594 $ 156Interest 741,000 740,750 719,809 20,941
Total expenditures 4,606,500 4,606,500 4,585,403 21,097
Excess (deficiency) of revenues over(under) expenditures (4,606,500) (4,606,500) (4,585,403) 21,097
Other financing sources (uses)Transfers in 4,606,500 4,606,500 4,585,403 (21,097)
Total other financing sources (uses) 4,606,500 4,606,500 4,585,403 (21,097)
Net change in fund balances - - - -
Fund balances, beginning - - - -
Fund balances, ending $ - $ - $ - $ -
See accompanying independent auditor's report.108

City of Bowling Green, KentuckyBudgetary Comparison ScheduleWKU Athletics Debt Service FundYear Ended June 30, 2020
Budgeted AmountsVariance withFinal Budget -
Original Final ActualPositive
(Negative)
REVENUESIntergovernmental $ 2,985,000 $ 2,985,000 $ 2,979,508 $ (5,492)
Total revenues 2,985,000 2,985,000 2,979,508 (5,492)
EXPENDITURESCurrent:Debt service
Principal 2,340,000 2,340,000 2,340,000 -Interest 645,000 645,000 639,508 5,492
Total expenditures 2,985,000 2,985,000 2,979,508 5,492
Excess (deficiency) of revenues over(under) expenses - - - -
Net change in fund balances - - - -
Fund balances, beginning - - - -
Fund balances, ending $ - $ - $ - $ -
See accompanying independent auditor's report.109

City of Bowling Green, KentuckyBudgetary Comparison ScheduleITA Bond Debt Service FundYear Ended June 30, 2020
Budgeted AmountsVariance withFinal Budget -
Original Final ActualPositive
(Negative)
REVENUESProperty taxes $ 11,500 $ 11,500 $ 14,702 $ 3,202Investment income - - 3,056 3,056Rent income - 93,485 93,485 -Miscellaneous 1,017,500 1,017,500 1,165,109 147,609
Total revenues 1,029,000 1,122,485 1,276,352 153,867
EXPENDITURESCurrent:Debt service
Principal 1,835,000 1,925,000 1,925,000 -Interest 200,000 203,485 201,662 1,823
Total expenditures 2,035,000 2,128,485 2,126,662 1,823
Excess (deficiency) of revenues over(under) expenses (1,006,000) (1,006,000) (850,310) 155,690
Other financing sources (uses)Transfers in 1,017,500 1,017,500 1,017,500 -
Total other financing sources (uses) 1,017,500 1,017,500 1,017,500 -
Net change in fund balances 11,500 11,500 167,190 155,690
Fund balances, beginning 1,587,739 1,587,739 1,587,739 -
Fund balances, ending $ 1,599,239 $ 1,599,239 $ 1,754,929 $ 155,690
See accompanying independent auditor's report.110

City of Bowling Green, KentuckyBudgetary Comparison ScheduleTIF District Debt Service FundYear Ended June 30, 2020
Budgeted AmountsVariance withFinal Budget -
Original Final ActualPositive
(Negative)
REVENUESInvestment income $ - $ - $ 33,609 $ 33,609Contributions and donations 285,000 285,000 - (285,000)
Total revenues 285,000 285,000 33,609 (251,391)
EXPENDITURESCurrent:Debt service
Principal 740,000 740,000 740,000 -Interest 716,000 716,000 715,087 913
Total expenditures 1,456,000 1,456,000 1,455,087 913
Excess (deficiency) of revenues over(under) expenses (1,171,000) (1,171,000) (1,421,478) (250,478)
Other financing sources (uses)Transfers in 1,456,000 1,456,000 1,455,088 (912)
Total other financing sources (uses) 1,456,000 1,456,000 1,455,088 (912)
Net change in fund balances 285,000 285,000 33,610 (251,390)
Fund balances, beginning 3,944,277 3,944,277 3,944,277 -
Fund balances, ending $ 4,229,277 $ 4,229,277 $ 3,977,887 $ (251,390)
See accompanying independent auditor's report.111

City of Bowling Green, KentuckyBudgetary Comparison ScheduleCommunity Development Special Revenue FundYear Ended June 30, 2020
Budgeted AmountsVariance withFinal Budget -
Original Final ActualPositive
(Negative)
REVENUESIntergovernmental $ 4,001,274 $ 5,179,970 $ 3,976,679 $ (1,203,291)Investment income - - 12,162 12,162Miscellaneous 71,500 89,836 91,942 2,106
Total revenues 4,072,774 5,269,806 4,080,783 (1,189,023)
EXPENDITURESCurrent:
Neighborhood and community services 3,543,750 4,251,697 3,509,038 742,659Capital outlay 529,024 1,144,970 562,934 582,036
Total expenditures 4,072,774 5,396,667 4,071,972 1,324,695
Excess (deficiency) of revenues over(under) expenses - (126,861) 8,811 135,672
Net change in fund balances - (126,861) 8,811 135,672
Fund balances, beginning 1,803,411 1,803,411 1,803,411 -
Fund balances, ending $ 1,803,411 $ 1,676,550 $ 1,812,222 $ 135,672
See accompanying independent auditor's report.112

City of Bowling Green, KentuckyBudgetary Comparison ScheduleFire Improvement Special Revenue FundYear Ended June 30, 2020
Budgeted AmountsVariance withFinal Budget -
Original Final ActualPositive
(Negative)
REVENUESInsurance premium taxes $ 2,254,500 $ 2,254,500 $ 2,360,151 $ 105,651Judgements and settlements 20,000 20,000 19,173 (827)Investment income 2,890 2,890 16,904 14,014
Total revenues 2,277,390 2,277,390 2,396,228 118,838
EXPENDITURESCurrent:
Public safety 505,390 617,996 439,854 178,142Capital outlay 76,000 182,695 136,919 45,776
Total expenditures 581,390 800,691 576,773 223,918
Excess (deficiency) of revenues over(under) expenses 1,696,000 1,476,699 1,819,455 342,756
Other financing sources (uses)Transfers out (1,696,000) (2,546,000) (2,387,673) 158,327
Total other financing sources (uses) (1,696,000) (2,546,000) (2,387,673) 158,327
Net change in fund balances - (1,069,301) (568,218) 501,083
Fund balances, beginning 1,662,243 1,662,243 1,662,243 -
Fund balances, ending $ 1,662,243 $ 592,942 $ 1,094,025 $ 501,083
See accompanying independent auditor's report.113

City of Bowling Green, KentuckyBudgetary Comparison ScheduleMunicipal Aid Special Revenue FundYear Ended June 30, 2020
Budgeted AmountsVariance withFinal Budget -
Original Final ActualPositive
(Negative)
REVENUESProperty taxes $ 200,000 $ 200,000 $ 199,942 $ (58)Intergovernmental 4,581,665 9,639,779 4,476,425 (5,163,354)Investment income 48,400 48,400 41,863 (6,537)Charges for services 10,000 10,000 21,093 11,093Miscellaneous 57,000 57,000 57,000 -
Total revenues 4,897,065 9,955,179 4,796,323 (5,158,856)
EXPENDITURESCurrent:
Public safety 2,053,065 2,154,714 1,908,060 246,654Public works 3,433,000 9,706,809 3,874,630 5,832,179
Capital outlay 260,000 635,370 204,995 430,375
Total expenditures 5,746,065 12,496,893 5,987,685 6,509,208
Excess (deficiency) of revenues over(under) expenses (849,000) (2,541,714) (1,191,362) 1,350,352
Other financing sources (uses)Transfers in 1,032,711 1,463,126 1,460,468 (2,658)Transfers out (1,327,700) (1,327,700) (1,327,700) -
Total other financing sources (uses) (294,989) 135,426 132,768 (2,658)
Net change in fund balances (1,143,989) (2,406,288) (1,058,594) 1,347,694
Fund balances, beginning 4,764,320 4,764,320 4,764,320 -
Fund balances, ending $ 3,620,331 $ 2,358,032 $ 3,705,726 $ 1,347,694
See accompanying independent auditor's report.114

City of Bowling Green, KentuckyBudgetary Comparison ScheduleJob Development Incentive Special Revenue FundYear Ended June 30, 2020
Budgeted AmountsVariance withFinal Budget -
Original Final ActualPositive
(Negative)
REVENUESProperty taxes $ 80,000 $ 80,000 $ 84,037 $ 4,037Wages and net profits 2,100,000 2,100,000 1,256,810 (843,190)Investment income 9,600 9,600 82,851 73,251
Total revenues 2,189,600 2,189,600 1,423,698 (765,902)
EXPENDITURESCurrent:
Neighborhood and community services 73,000 90,500 41,000 49,500
Total expenditures 73,000 90,500 41,000 49,500
Excess (deficiency) of revenues over(under) expenses 2,116,600 2,099,100 1,382,698 (716,402)
Other financing sources (uses)Transfers out (521,000) (521,000) (519,527) 1,473
Total other financing sources (uses) (521,000) (521,000) (519,527) 1,473
Net change in fund balances 1,595,600 1,578,100 863,171 (714,929)
Fund balances, beginning 4,130,147 4,130,147 4,130,147 -
Fund balances, ending $ 5,725,747 $ 5,708,247 $ 4,993,318 $ (714,929)
See accompanying independent auditor's report.115

City of Bowling Green, KentuckyBudgetary Comparison ScheduleParks Development Special Revenue FundYear Ended June 30, 2020
Budgeted AmountsVariance withFinal Budget -
Original Final ActualPositive
(Negative)
REVENUESProperty taxes $ 488,500 $ 488,500 $ 471,889 $ (16,611)Wages and net profits 1,405,000 1,405,000 1,374,400 (30,600)
Total revenues 1,893,500 1,893,500 1,846,289 (47,211)
Excess (deficiency) of revenues over(under) expenses 1,893,500 1,893,500 1,846,289 (47,211)
Other financing sources (uses)Transfers out (1,893,500) (1,893,500) (1,846,289) 47,211
Total other financing sources (uses) (1,893,500) (1,893,500) (1,846,289) 47,211
Net change in fund balances - - - -
Fund balances, beginning - - - -
Fund balances, ending $ - $ - $ - $ -
See accompanying independent auditor's report.116

City of Bowling Green, KentuckyBudgetary Comparison ScheduleLandfill Closure Special Revenue FundYear Ended June 30, 2020
Budgeted AmountsVariance withFinal Budget -
Original Final ActualPositive
(Negative)
REVENUESInvestment income $ 22,500 $ 22,500 $ 29,291 $ 6,791Contributions and donations - 270,000 233,900 (36,100)
Total revenues 22,500 292,500 263,191 (29,309)
EXPENDITURESCurrent:
Public works 149,805 77,805 62,923 14,882Capital outlay - 397,000 242,430 154,570
Total expenditures 149,805 474,805 305,353 169,452
Excess (deficiency) of revenues over(under) expenses (127,305) (182,305) (42,162) 140,143
Net change in fund balances (127,305) (182,305) (42,162) 140,143
Fund balances, beginning 1,361,932 1,361,932 1,361,932 -
Fund balances, ending $ 1,234,627 $ 1,179,627 $ 1,319,770 $ 140,143
See accompanying independent auditor's report.117

City of Bowling Green, KentuckyBudgetary Comparison ScheduleLocal Law Enforcement Block Grant Special Revenue FundYear Ended June 30, 2020
Budgeted AmountsVariance withFinal Budget -
Original Final ActualPositive
(Negative)
REVENUESIntergovernmental $ - $ 155,074 $ 55,872 $ (99,202)
Total revenues - 155,074 55,872 (99,202)
EXPENDITURESCurrent:
Public safety - 138,028 38,826 99,202Capital outlay - 17,046 17,046 -
Total expenditures - 155,074 55,872 99,202
Excess (deficiency) of revenues over(under) expenses - - - -
Net change in fund balances - - - -
Fund balances, beginning - - - -
Fund balances, ending $ - $ - $ - $ -
See accompanying independent auditor's report.118

City of Bowling Green, KentuckyBudgetary Comparison ScheduleRadio System Special Revenue FundYear Ended June 30, 2020
Budgeted AmountsVariance withFinal Budget -
Original Final ActualPositive
(Negative)
REVENUESInvestment income $ - $ - $ 414 $ 414Contributions and donations 317,200 345,584 193,455 (152,129)
Total revenues 317,200 345,584 193,869 (151,715)
EXPENDITURESCurrent:
Public safety 503,000 559,768 542,933 16,835
Total expenditures 503,000 559,768 542,933 16,835
Excess (deficiency) of revenues over (under)expenses (185,800) (214,184) (349,064) (134,880)
Other financing sources (uses)Transfers in 185,800 185,800 185,800 -
Total other financing sources (uses) 185,800 185,800 185,800 -
Net change in fund balances - (28,384) (163,264) (134,880)
Fund balances, beginning 225,660 225,660 225,660 -
Fund balances, ending $ 225,660 $ 197,276 $ 62,396 $ (134,880)
See accompanying independent auditor's report.119
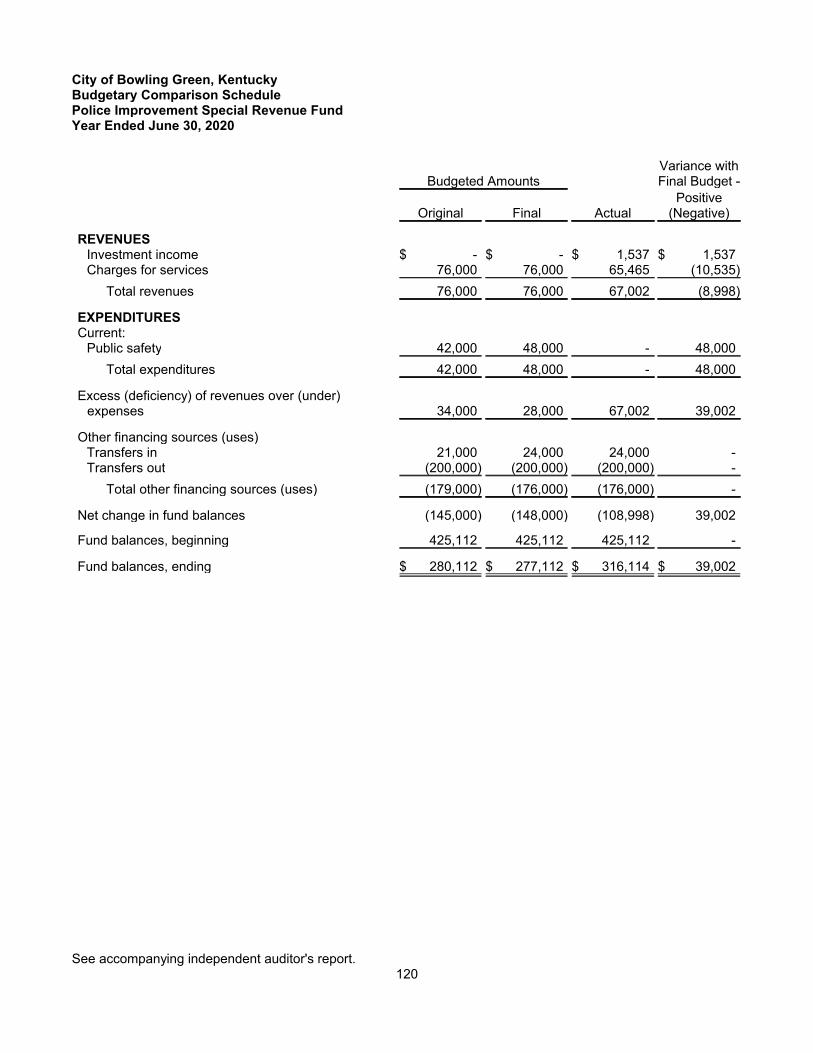
City of Bowling Green, KentuckyBudgetary Comparison SchedulePolice Improvement Special Revenue FundYear Ended June 30, 2020
Budgeted AmountsVariance withFinal Budget -
Original Final ActualPositive
(Negative)
REVENUESInvestment income $ - $ - $ 1,537 $ 1,537Charges for services 76,000 76,000 65,465 (10,535)
Total revenues 76,000 76,000 67,002 (8,998)
EXPENDITURESCurrent:
Public safety 42,000 48,000 - 48,000
Total expenditures 42,000 48,000 - 48,000
Excess (deficiency) of revenues over (under)expenses 34,000 28,000 67,002 39,002
Other financing sources (uses)Transfers in 21,000 24,000 24,000 -Transfers out (200,000) (200,000) (200,000) -
Total other financing sources (uses) (179,000) (176,000) (176,000) -
Net change in fund balances (145,000) (148,000) (108,998) 39,002
Fund balances, beginning 425,112 425,112 425,112 -
Fund balances, ending $ 280,112 $ 277,112 $ 316,114 $ 39,002
See accompanying independent auditor's report.120

City of Bowling Green, KentuckyBudgetary Comparison ScheduleHomeland Security Special Revenue FundYear Ended June 30, 2020
Budgeted AmountsVariance withFinal Budget
Original Final Actual Positive
(Negative)
REVENUESIntergovernmental $ - $ 270,600 $ 9,177 $ (261,423)
Total revenues - 270,600 9,177 (261,423)
EXPENDITURESCurrent:
Public safety - 7,800 2,577 (5,223)Capital outlay - 262,800 6,600 (256,200)
Total expenditures - 270,600 9,177 (261,423)
Excess (deficiency) of revenues over (under)expenses - - - -
Fund balances, beginning of year - - - -
Fund balances, end of year $ - $ - $ - $ -
See accompanying independent auditor's report.121

City of Bowling Green, KentuckyBudgetary Comparison ScheduleTIF District Special Revenue FundYear Ended June 30, 2020
Budgeted AmountsVariance withFinal Budget
Original Final Actual Positive
(Negative)
REVENUESLicense and permits $ - $ - $ 284,060 $ 284,060
Total revenues - - 284,060 284,060
Excess (deficiency) of revenues over (under)expenses - - 284,060 284,060
Net change in budgetary fund balances - - 284,060 284,060
Fund balances, beginning of year - - - -
Fund balances, end of year $ - $ - $ 284,060 $ 284,060
See accompanying independent auditor's report.122
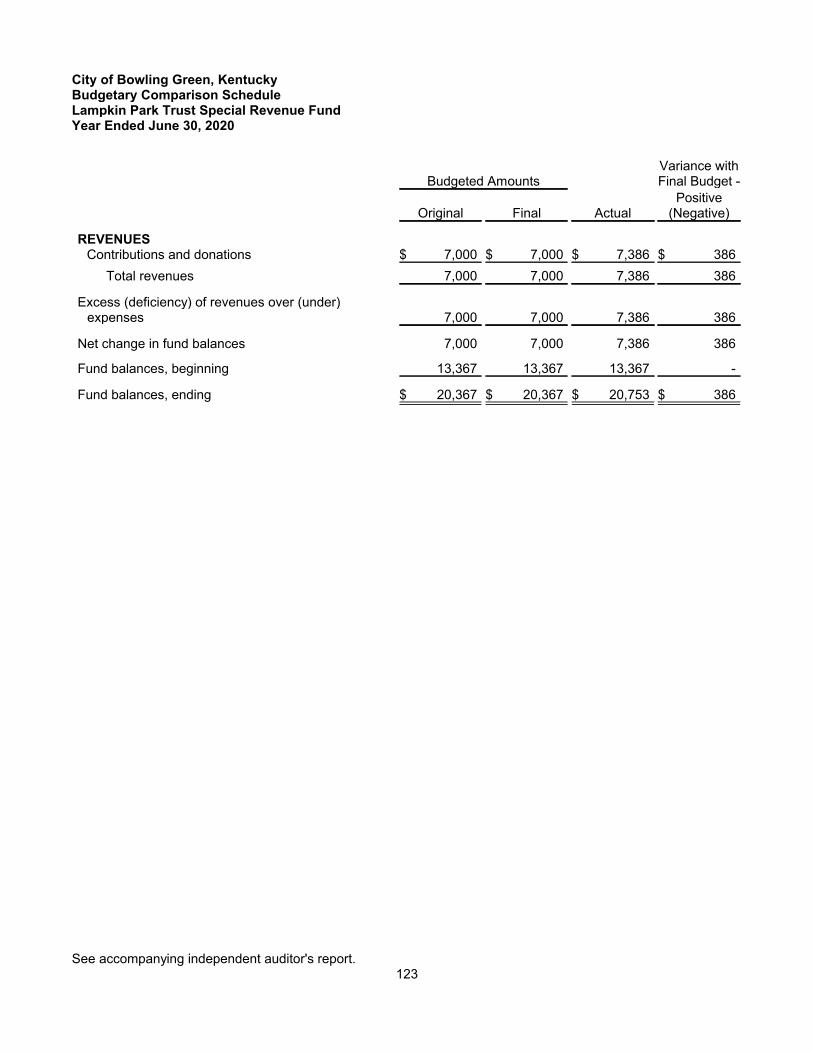
City of Bowling Green, KentuckyBudgetary Comparison ScheduleLampkin Park Trust Special Revenue FundYear Ended June 30, 2020
Budgeted AmountsVariance withFinal Budget -
Original Final ActualPositive
(Negative)
REVENUESContributions and donations $ 7,000 $ 7,000 $ 7,386 $ 386
Total revenues 7,000 7,000 7,386 386
Excess (deficiency) of revenues over (under)expenses 7,000 7,000 7,386 386
Net change in fund balances 7,000 7,000 7,386 386
Fund balances, beginning 13,367 13,367 13,367 -
Fund balances, ending $ 20,367 $ 20,367 $ 20,753 $ 386
See accompanying independent auditor's report.123

City of Bowling Green, KentuckyBudgetary Comparison ScheduleGreenways/ Riverfront Development Capital Projects FundYear Ended June 30, 2020
Budgeted AmountsVariance withFinal Budget -
Original Final ActualPositive
(Negative)
REVENUESIntergovernmental $ - $ 1,478,517 $ 106,047 $ (1,372,470)
Total revenues - 1,478,517 106,047 (1,372,470)
EXPENDITURESCurrent:
Neighborhood and community services - 875,386 21,143 854,243Capital outlay - 1,141,740 222,564 919,176
Total expenditures - 2,017,126 243,707 1,773,419
Excess (deficiency) of revenues over (under)expenses - (538,609) (137,660) 400,949
Other financing sources (uses)Transfers in - 417,556 417,556 -
Total other financing sources (uses) - 417,556 417,556 -
Net change in fund balances - (121,053) 279,896 400,949
Fund balances, beginning 1,061,522 1,061,522 1,061,522 -
Fund balances, ending $ 1,061,522 $ 940,469 $ 1,341,418 $ 400,949
See accompanying independent auditor's report.124

City of Bowling Green, KentuckyBudgetary Comparison ScheduleEquipment Replacement Capital Projects FundYear Ended June 30, 2020
Budgeted AmountsVariance withFinal Budget -
Original Final ActualPositive
(Negative)
REVENUESJudgements and settlements $ - $ 11,810 $ 11,810 $ -Investment income - - 7,609 7,609
Total revenues - 11,810 19,419 7,609
EXPENDITURESCurrent:
Public safety 74,000 12,812 2,812 10,000Public works - 11,834 11,833 1Parks and recreation - 135,516 - 135,516
Capital outlay 1,325,000 1,922,613 1,537,566 385,047
Total expenditures 1,399,000 2,082,775 1,552,211 530,564
Excess (deficiency) of revenues over (under)expenses (1,399,000) (2,070,965) (1,532,792) 538,173
Other financing sources (uses)Transfers in 1,060,000 1,560,000 1,560,000 -
Total other financing sources (uses) 1,060,000 1,560,000 1,560,000 -
Net change in fund balances (339,000) (510,965) 27,208 538,173
Fund balances, beginning 1,802,963 1,802,963 1,802,963 -
Fund balances, ending $ 1,463,963 $ 1,291,998 $ 1,830,171 $ 538,173
See accompanying independent auditor's report.125

City of Bowling Green, KentuckyBudgetary Comparison ScheduleRoad Construction Capital Projects FundYear Ended June 30, 2020
Budgeted AmountsVariance withFinal Budget -
Original Final ActualPositive
(Negative)
REVENUESInvestment income $ 39,000 $ 39,000 $ 50,327 $ 11,327
Total revenues 39,000 39,000 50,327 11,327
EXPENDITURESCurrent:
Public works 100,000 137,154 132,441 4,713Capital outlay 1,240,000 2,293,134 1,877,989 415,145
Total expenditures 1,340,000 2,430,288 2,010,430 419,858
Excess (deficiency) of revenues over (under)expenses (1,301,000) (2,391,288) (1,960,103) 431,185
Other financing sources (uses)Transfers in - 2,500,000 2,500,000 -
Total other financing sources (uses) - 2,500,000 2,500,000 -
Net change in fund balances (1,301,000) 108,712 539,897 431,185
Fund balances, beginning 4,610,654 4,610,654 4,610,654 -
Fund balances, ending $ 3,309,654 $ 4,719,366 $ 5,150,551 $ 431,185
See accompanying independent auditor's report.126

City of Bowling Green, KentuckyBudgetary Comparison ScheduleHeritage Trail Construction Capital Projects FundYear Ended June 30, 2020
Budgeted AmountsVariance withFinal Budget -
Original Final ActualPositive
(Negative)
EXPENDITURESCapital outlay $ - $ 20,069 $ 20,069 $ -
Total expenditures - 20,069 20,069 -
Excess (deficiency) of revenues over (under)expenses - (20,069) (20,069) -
Other financing sources (uses)Transfers out - (1) (1) -
Total other financing sources (uses) - (1) (1) -
Net change in fund balances - (20,070) (20,070) -
Fund balances, beginning 20,070 20,070 20,070 -
Fund balances, ending $ 20,070 $ - $ - $ -
See accompanying independent auditor's report.127

City of Bowling Green, KentuckyBudgetary Comparison ScheduleSidewalk Improvement Capital Projects FundYear Ended June 30, 2020
Budgeted AmountsVariance withFinal Budget -
Original Final ActualPositive
(Negative)
REVENUESInvestment income $ - $ - $ 1,522 $ 1,522
Total revenues - - 1,522 1,522
EXPENDITURESCurrent:
Public works - 3,223 - 3,223Capital outlay 500,000 1,204,231 349,110 855,121
Total expenditures 500,000 1,207,454 349,110 858,344
Excess (deficiency) of revenues over (under)expenses (500,000) (1,207,454) (347,588) 859,866
Other financing sources (uses)Transfers in 500,000 625,000 625,000 -
Total other financing sources (uses) 500,000 625,000 625,000 -
Net change in fund balances - (582,454) 277,412 859,866
Fund balances, beginning 582,397 582,397 582,397 -
Fund balances, ending $ 582,397 $ (57) $ 859,809 $ 859,866
See accompanying independent auditor's report.128

City of Bowling Green, KentuckyBudgetary Comparison ScheduleStormwater Infrastructure Improvement Capital Projects FundYear Ended June 30, 2020
Budgeted AmountsVariance withFinal Budget -
Original Final ActualPositive
(Negative)
REVENUESInvestment income $ - $ - $ 3,043 $ 3,043
Total revenues - - 3,043 3,043
EXPENDITURESCurrent:
Public works - 28,775 10,134 18,641Capital outlay 500,000 1,111,318 299,496 811,822
Total expenditures 500,000 1,140,093 309,630 830,463
Excess (deficiency) of revenues over (under)expenses (500,000) (1,140,093) (306,587) 833,506
Other financing sources (uses)Transfers in 500,000 500,000 500,000 -
Total other financing sources (uses) 500,000 500,000 500,000 -
Net change in fund balances - (640,093) 193,413 833,506
Fund balances, beginning 639,979 639,979 639,979 -
Fund balances, ending $ 639,979 $ (114) $ 833,392 $ 833,506
See accompanying independent auditor's report.129

City of Bowling Green, KentuckyBudgetary Comparison ScheduleMunicipal Facilities Capital Projects FundYear Ended June 30, 2020
Budgeted AmountsVariance withFinal Budget -
Original Final ActualPositive
(Negative)
REVENUESInvestment income $ - $ - $ 4,716 $ 4,716
Total revenues - - 4,716 4,716
EXPENDITURESCurrent:
Public works - 8,400 8,400 -Capital outlay - 1,286,500 1,142,822 143,678
Total expenditures - 1,294,900 1,151,222 143,678
Excess (deficiency) of revenues over (under)expenses - (1,294,900) (1,146,506) 148,394
Other financing sources (uses)Transfers in - 500,000 500,000 -
Total other financing sources (uses) - 500,000 500,000 -
Net change in fund balances - (794,900) (646,506) 148,394
Fund balances, beginning 1,669,054 1,669,054 1,669,054 -
Fund balances, ending $ 1,669,054 $ 874,154 $ 1,022,548 $ 148,394
See accompanying independent auditor's report.130

City of Bowling Green, KentuckyBudgetary Comparison ScheduleDowntown Development Capital Projects FundYear Ended June 30, 2020
Budgeted AmountsVariance withFinal Budget -
Original Final ActualPositive
(Negative)
REVENUESInvestment income $ - $ - $ 2,358 $ 2,358
Total revenues - - 2,358 2,358
EXPENDITURESCurrent:
Public works 100,000 275,293 81,220 194,073Neighborhood and community services - 73,997 30,449 43,548
Capital outlay 400,000 3,384,078 2,793,113 590,965
Total expenditures 500,000 3,733,368 2,904,782 828,586
Excess (deficiency) of revenues over (under)expenses (500,000) (3,733,368) (2,902,424) 830,944
Other financing sources (Uses)Transfers in 500,000 1,500,000 1,500,000 -
Total other financing sources (uses) 500,000 1,500,000 1,500,000 -
Net change in fund balances - (2,233,368) (1,402,424) 830,944
Fund balances, beginning 3,233,083 3,233,083 3,233,083 -
Fund balances, ending $ 3,233,083 $ 999,715 $ 1,830,659 $ 830,944
See accompanying independent auditor's report.131

City of Bowling Green, KentuckyBudgetary Comparison Schedule800 Trunking Radio Systems Improvements Capital Projects FundYear Ended June 30, 2020
Budgeted AmountsVariance withFinal Budget -
Original Final ActualPositive
(Negative)
REVENUESInvestment income $ - $ - $ 2,283 $ 2,283
Total revenues - - 2,283 2,283
Excess (deficiency) of revenues over (under)expenses - - 2,283 2,283
Other financing sources (uses)Transfers in 150,800 150,800 150,800 -
Total other financing sources (uses) 150,800 150,800 150,800 -
Net change in fund balances 150,800 150,800 153,083 2,283
Fund balances, beginning 960,700 960,700 960,700 -
Fund balances, ending $ 1,111,500 $ 1,111,500 $ 1,113,783 $ 2,283
See accompanying independent auditor's report.132

City of Bowling Green, KentuckyBudgetary Comparison ScheduleTechnology Capital Improvement FundYear Ended June 30, 2020
Budgeted AmountsVariance withFinal Budget -
Original Final ActualPositive
(Negative)
REVENUESInvestment income $ - $ - $ 3,043 $ 3,043
Total revenues - - 3,043 3,043
EXPENDITURESCurrent:
General government 595,500 1,401,877 852,996 548,881Capital outlay 305,000 293,600 293,533 67
Total expenditures 900,500 1,695,477 1,146,529 548,948
Excess (deficiency) of revenues over (under)expenses (900,500) (1,695,477) (1,143,486) 551,991
Other financing sources (uses)Transfers in 500,000 1,000,000 1,000,000 -
Total other financing sources (uses) 500,000 1,000,000 1,000,000 -
Net change in fund balances (400,500) (695,477) (143,486) 551,991
Fund balances, beginning 1,633,249 1,633,249 1,633,249 -
Fund balances, ending $ 1,232,749 $ 937,772 $ 1,489,763 $ 551,991
See accompanying independent auditor's report.133

City of Bowling Green, KentuckyBudgetary Comparison ScheduleSmallhouse Road Construction FundYear Ended June 30, 2020
Budgeted AmountsVariance withFinal Budget -
Original Final ActualPositive
(Negative)
REVENUESInvestment income $ - $ - $ 1,522 $ 1,522
Total revenues - - 1,522 1,522
EXPENDITURESCapital outlay 500,000 1,462,240 612,027 850,213
Total expenditures 500,000 1,462,240 612,027 850,213
Excess (deficiency) of revenues over (under)expenses (500,000) (1,462,240) (610,505) 851,735
Other financing sources (uses)Transfers in 500,000 500,000 500,000 -
Total other financing sources (uses) 500,000 500,000 500,000 -
Net change in fund balances - (962,240) (110,505) 851,735
Fund balances, beginning 962,183 962,183 962,183 -
Fund balances, ending $ 962,183 $ (57) $ 851,678 $ 851,735
See accompanying independent auditor's report.134

City of Bowling Green, KentuckyBudgetary Comparison ScheduleParks Capital Improvements FundYear Ended June 30, 2020
Budgeted AmountsVariance withFinal Budget -
Original Final ActualPositive
(Negative)
REVENUESInvestment income $ - $ - $ 15,217 $ 15,217
Total revenues - - 15,217 15,217
EXPENDITURESCurrent:
Parks and recreation 400,000 759,125 242,410 516,715Capital outlay 650,000 3,149,080 1,897,546 1,251,534
Total expenditures 1,050,000 3,908,205 2,139,956 1,768,249
Excess (deficiency) of revenues over(under) expenses (1,050,000) (3,908,205) (2,124,739) 1,783,466
Other financing sources (uses)Transfers in 1,069,917 1,284,917 1,346,889 61,972
Total other financing sources (uses) 1,069,917 1,284,917 1,346,889 61,972
Net change in fund balances 19,917 (2,623,288) (777,850) 1,845,438
Fund balances, beginning 3,625,545 3,625,545 3,625,545 -
Fund balances, ending $ 3,645,462 $ 1,002,257 $ 2,847,695 $ 1,845,438
See accompanying independent auditor's report.135
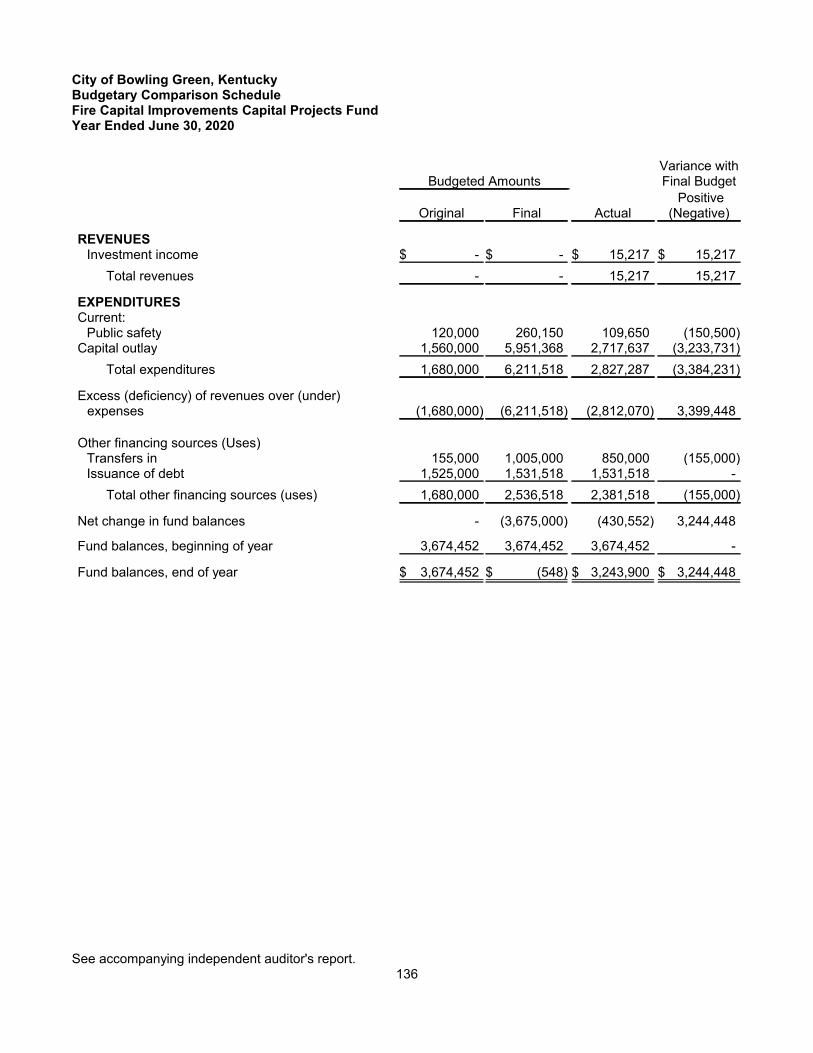
City of Bowling Green, KentuckyBudgetary Comparison ScheduleFire Capital Improvements Capital Projects FundYear Ended June 30, 2020
Budgeted AmountsVariance withFinal Budget
Original Final Actual Positive
(Negative)
REVENUESInvestment income $ - $ - $ 15,217 $ 15,217
Total revenues - - 15,217 15,217
EXPENDITURESCurrent:
Public safety 120,000 260,150 109,650 (150,500)Capital outlay 1,560,000 5,951,368 2,717,637 (3,233,731)
Total expenditures 1,680,000 6,211,518 2,827,287 (3,384,231)
Excess (deficiency) of revenues over (under)expenses (1,680,000) (6,211,518) (2,812,070) 3,399,448
Other financing sources (Uses)Transfers in 155,000 1,005,000 850,000 (155,000)Issuance of debt 1,525,000 1,531,518 1,531,518 -
Total other financing sources (uses) 1,680,000 2,536,518 2,381,518 (155,000)
Net change in fund balances - (3,675,000) (430,552) 3,244,448
Fund balances, beginning of year 3,674,452 3,674,452 3,674,452 -
Fund balances, end of year $ 3,674,452 $ (548) $ 3,243,900 $ 3,244,448
See accompanying independent auditor's report.136
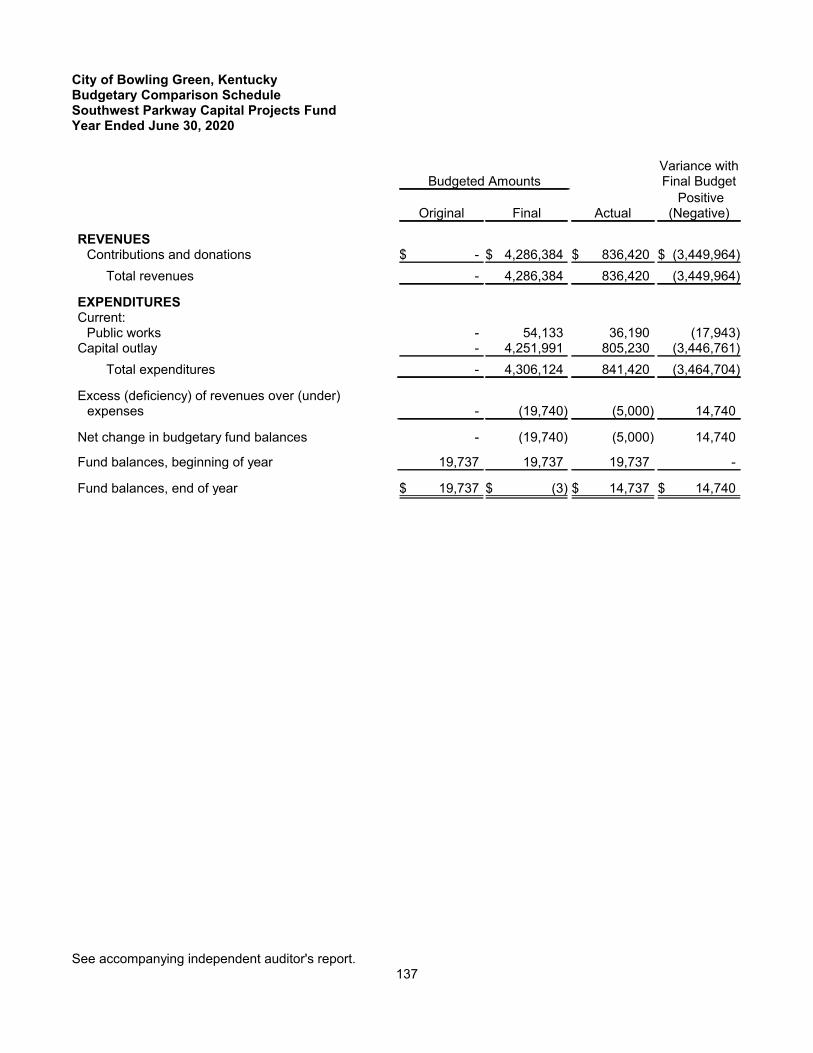
City of Bowling Green, KentuckyBudgetary Comparison ScheduleSouthwest Parkway Capital Projects FundYear Ended June 30, 2020
Budgeted AmountsVariance withFinal Budget
Original Final Actual Positive
(Negative)
REVENUESContributions and donations $ - $ 4,286,384 $ 836,420 $ (3,449,964)
Total revenues - 4,286,384 836,420 (3,449,964)
EXPENDITURESCurrent:
Public works - 54,133 36,190 (17,943)Capital outlay - 4,251,991 805,230 (3,446,761)
Total expenditures - 4,306,124 841,420 (3,464,704)
Excess (deficiency) of revenues over (under)expenses - (19,740) (5,000) 14,740
Net change in budgetary fund balances - (19,740) (5,000) 14,740
Fund balances, beginning of year 19,737 19,737 19,737 -
Fund balances, end of year $ 19,737 $ (3) $ 14,737 $ 14,740
See accompanying independent auditor's report.137

City of Bowling Green, KentuckyBudgetary Comparison SchedulePolice Capital Improvements FundYear Ended June 30, 2020
Budgeted AmountsVariance withFinal Budget
Original Final Actual Positive
(Negative)
REVENUESIntergovernmental $ - $ 450,000 $ 450,000 $ -
Total revenues - 450,000 450,000 -
EXPENDITURESCurrent:
Public safety 1,427,700 1,632,700 692,535 (940,165)Capital outlay 100,000 345,000 313,017 (31,983)
Total expenditures 1,527,700 1,977,700 1,005,552 (972,148)
Excess (deficiency) of revenues over (under)expenses (1,527,700) (1,527,700) (555,552) 972,148
Other financing sources (Uses)Transfers in 1,927,700 1,927,700 1,527,700 (400,000)
Total other financing sources (uses) 1,927,700 1,927,700 1,527,700 (400,000)
Net change in budgetary fund balances 400,000 400,000 972,148 572,148
Fund balances, end of year $ 400,000 $ 400,000 $ 972,148 $ 572,148
See accompanying independent auditor's report.138

NONMAJOR GOVERNMENTAL FUNDS
INTERNAL SERVICE FUNDSInternal service funds are used to account for the financing of goods or services provided by one department oragency to other departments or agencies of the City and to other governmental units, on a cost reimbursementbasis.
Fleet Maintenance FundThis fund is used to account for the operating costs of centralized maintenance of automotive equipment used byother City departments. Department billings are on cost reimbursement basis.
Employee Health Care FundThis fund is used to account for the accumulation of resources for the purpose of funding medical costs of Cityemployees and dependents.
Workers Compensation FundThis fund is used to account for the accumulation of resources for the purpose of funding workers compensationcosts of City employees.
Property and Casualty FundThis fund is used to account for the accumulation of resources for the purpose of funding property and casualtycosts of the City.
See accompanying independent auditor's report.139

City of Bowling Green, KentuckyCombining Statement of Net Position - Internal Service FundsJune 30, 2020
FleetMaintenance
EmployeeHealth Care
WorkersCompensation
Property andCasualty
Total InternalService Funds
ASSETSCurrent assets
Pooled cash and cash equivalents $ 608,950 $ 1,816,430 $ 351,024 $ 674,089 $ 3,450,493Investments 199,967 1,416,040 1,225,220 - 2,841,227Accounts receivable - 4,500 1,500 - 6,000Interest receivable - 150 25 - 175Prepaid items - 559,598 - - 559,598Inventories 268,223 - - - 268,223
Total current assets 1,077,140 3,796,718 1,577,769 674,089 7,125,716
Noncurrent assetsCapital assets
Buildings 241,875 198,701 - - 440,576Machinery and equipment 242,927 - 220,773 89,326 553,026
484,802 198,701 220,773 89,326 993,602Less: accumulated depreciation (342,014) (22,354) (112,235) (17,243) (493,846)
Total capital assets, net ofaccumulated depreciation 142,788 176,347 108,538 72,083 499,756
Total noncurrent assets 142,788 176,347 108,538 72,083 499,756
Total assets $ 1,219,928 $ 3,973,065 $ 1,686,307 $ 746,172 $ 7,625,472
LIABILITIESCurrent liabilities
Vouchers and accounts payable $ 30,409 $ 83,693 $ 3,121 $ 13,399 $ 130,622Accrued payroll 20,057 - 1,568 753 22,378Insurance claims payable - 536,852 22,796 48,316 607,964Current portion of compensated
absences 21,042 - - - 21,042
Total current liabilities 71,508 620,545 27,485 62,468 782,006
Noncurrent liabilitiesNoncurrent portion of compensated
absences 17,301 - - - 17,301
Total liabilities 88,809 620,545 27,485 62,468 799,307
NET POSITIONNet invested in capital assets 142,788 176,347 108,538 72,083 499,756Unrestricted 988,331 3,176,173 1,550,284 611,621 6,326,409
Total net position $ 1,131,119 $ 3,352,520 $ 1,658,822 $ 683,704 $ 6,826,165
See accompanying independent auditor's report.140

City of Bowling Green, KentuckyCombining Statement of Revenues, Expenses, and Changes in Net Position - Internal Service FundsYear Ended June 30, 2020
FleetMaintenance
EmployeeHealth Care
WorkersCompensation
Property andCasualty Total
OPERATING REVENUESCharges for services $ 1,969,975 $ - $ - $ - $ 1,969,975Insurance premiums - 7,475,972 667,855 - 8,143,827Judgements and settlements - 3,839 - 112,113 115,952Contributions and donations - - 3,000 3,000 6,000Miscellaneous 1,075 661 - - 1,736
Total operating revenues 1,971,050 7,480,472 670,855 115,113 10,237,490
OPERATING EXPENSESPersonnel services 799,533 - 59,270 28,928 887,731Contractual services 33,189 779,990 67,215 124,678 1,005,072Supplies 917,140 84,474 54,877 34,154 1,090,645Utilities 28,588 - 476 - 29,064Repairs and maintenance 111,855 - - - 111,855Insurance premiums and claims - 6,620,513 302,875 989,678 7,913,066Depreciation 14,695 4,968 27,216 8,649 55,528Miscellaneous 3,765 - 1,263 480 5,508
Total operating expenses 1,908,765 7,489,945 513,192 1,186,567 11,098,469
Operating income (loss) 62,285 (9,473) 157,663 (1,071,454) (860,979)
NONOPERATING REVENUES(EXPENSES)Investment income 2,139 37,556 38,671 - 78,366
Total nonoperating revenues(expenses) 2,139 37,556 38,671 - 78,366
Income (loss) before transfers 64,424 28,083 196,334 (1,071,454) (782,613)
Transfers in - 325,500 - 700,000 1,025,500
Transfers out - - (224,000) - (224,000)
Total transfers - 325,500 (224,000) 700,000 801,500
Change in net position 64,424 353,583 (27,666) (371,454) 18,887
Net position, beginning 1,066,695 2,998,937 1,686,488 1,055,158 6,807,278
Net position, ending $ 1,131,119 $ 3,352,520 $ 1,658,822 $ 683,704 $ 6,826,165
See accompanying independent auditor's report.141

City of Bowling Green, KentuckyCombining Statement of Cash Flows - Internal Service FundsYear Ended June 30, 2020
FleetMaintenance
WorkersCompensation
EmployeeHealth Care
Property andCasualty Total
CASH FROM OPERATING ACTIVITIESCash received from customers $ 1,974,046 $ 669,355 $ 7,777,105 $ 115,113 $10,535,619Payments to employees (790,904) (58,824) - (28,699) (878,427)Cash payments to suppliers (1,146,594) (144,411) (594,742) (158,677) (2,044,424)Claims paid - (334,054) (6,742,279) (984,462) (8,060,795)
Net cash provided (used in) provided byoperating activities 36,548 132,066 440,084 (1,056,725) (448,027)
CASH FROM NONCAPITAL FINANCINGACTIVITIESTransfers from other funds - - 325,500 700,000 1,025,500Transfers to other funds - (224,000) - - (224,000)
Net cash provided by (used in) noncapitalfinancing activities - (224,000) 325,500 700,000 801,500
CASH FROM CAPITAL AND RELATEDFINANCING ACTIVITIESPurchase of capital assets - - - (50,243) (50,243)
CASH FROM INVESTING ACTIVITIESInterest received 2,139 38,757 37,810 - 78,706Purchase of investments (199,968) (30,450) (12,972) - (243,390)
Net provided (used in) provided by investingactivities (197,829) 8,307 24,838 - (164,684)
Net cash increase (decreases) in cash andcash equivalents (161,281) (83,627) 790,422 (406,968) 138,546
Cash and cash equivalents at beginning of period 770,231 434,651 1,026,008 1,081,057 3,311,947
Cash and cash equivalents at end of period $ 608,950 $ 351,024 $ 1,816,430 $ 674,089 $ 3,450,493
Reconciliation of operating income to net cashused in operating activities
Operating income (loss) $ 62,285 $ 157,663 $ (9,473) $ (1,071,454) $ (860,979)Adjustments to reconcile operating income (loss)
to net cash provided by (used in) operatingactivities
Depreciation 14,695 27,216 4,968 8,649 55,528Changes in assets and liabilities:
Inventories (18,418) - - - (18,418)Accounts receivable 2,996 (1,500) 296,633 - 298,129Prepaid items - - 206,528 - 206,528Accounts payable (33,639) (20,580) 63,194 635 9,610Compensated absences 2,522 - - - 2,522Accrued payroll 6,107 446 - 229 6,782Insurance claims payable - (31,179) (121,766) 5,216 (147,729)
Net cash provided by (used in) operatingactivities $ 36,548 $ 132,066 $ 440,084 $ (1,056,725) $ (448,027)
See accompanying independent auditor's report.142

NONMAJOR GOVERNMENTAL FUNDS
AGENCY FUNDSAgency funds are used to account for assets held by the City as an agent for individuals, private organizations,other governments, and/or other funds.
Claims FundImprest vendor paying agent for all governmental funds.
Payroll FundImprest paying agent for City payroll.
Tourist & Convention FundThis fund is used to account for the collection of a 4% hotel, motel transient room tax and payment to the BowlingGreen Area Convention and Visitors Bureau and The Convention Center Corporation.
Tax Distribution FundThis fund is used to account for property tax collections and disbursement to the General Fund and the BowlingGreen Independent School System for property taxes billed and collected by the City on its behalf.
Treasurer's Distribution FundThis fund is used to account for collection of miscellaneous receipts requiring disbursement to other outsideagencies.
Evidence Storage FundThis fund is used to account for cash collected as police evidence.
Bowling Green/Warren County Adjusted TIF Incremental FundThis fund is used to account for TIF revenues based on an agreement with Warren County. The associatedinvestment account is jointly shared with Warren County with available cash pledged to the County to cover debtshortfalls on the 2016 Industrial Revenue Bonds.
See accompanying independent auditor's report.143

City of Bowling Green, KentuckyCombining Statement of Changes in Assets and Liabilities - Agency FundsYear Ended June 30, 2020
BalanceJuly 1, 2019 Additions Deductions
BalanceJune 30, 2020
CLAIMS FUNDAssets
Non-pooled cash and cash equivalents $ 1,683,841 $ 140,831,222 $ 141,008,952 $ 1,506,111
LiabilitiesOther liabilities $ 1,683,841 $ 140,831,222 $ 141,008,952 $ 1,506,111
PAYROLL FUNDAssets
Non-pooled cash and cash equivalents $ 16,603 $ 46,022,410 $ 46,015,989 $ 23,024
LiabilitiesOther liabilities $ 16,603 $ 46,022,410 $ 46,015,989 $ 23,024
TOURIST & CONVENTION FUNDAssets
Pooled cash and cash equivalents $ - $ 1,946,429 $ 1,946,429 $ -
LiabilitiesDue to Tourist Commission $ - $ 1,470,852 $ 1,470,852 $ -Due to Convention Center - 475,577 475,577 -
Total liabilities $ - $ 1,946,429 $ 1,946,429 $ -
TAX DISTRIBUTION FUNDAssets
Pooled cash and cash equivalents $ - $ 13,962,030 $ 13,952,259 $ 9,771
LiabilitiesDue to other taxing units - School Board - 13,796,323 13,786,552 9,771Other liabilities - 165,707 165,707 -
Total liabilities $ - $ 13,962,030 $ 13,952,259 $ 9,771
TREASURER'S DISTRIBUTION FUNDAssets
Receivable from other government $ - $ 344,558 $ - $ 344,558
LiabilitiesDue to other governmental units $ - $ 357,890 $ 13,332 $ 344,558
See accompanying independent auditor's report.144
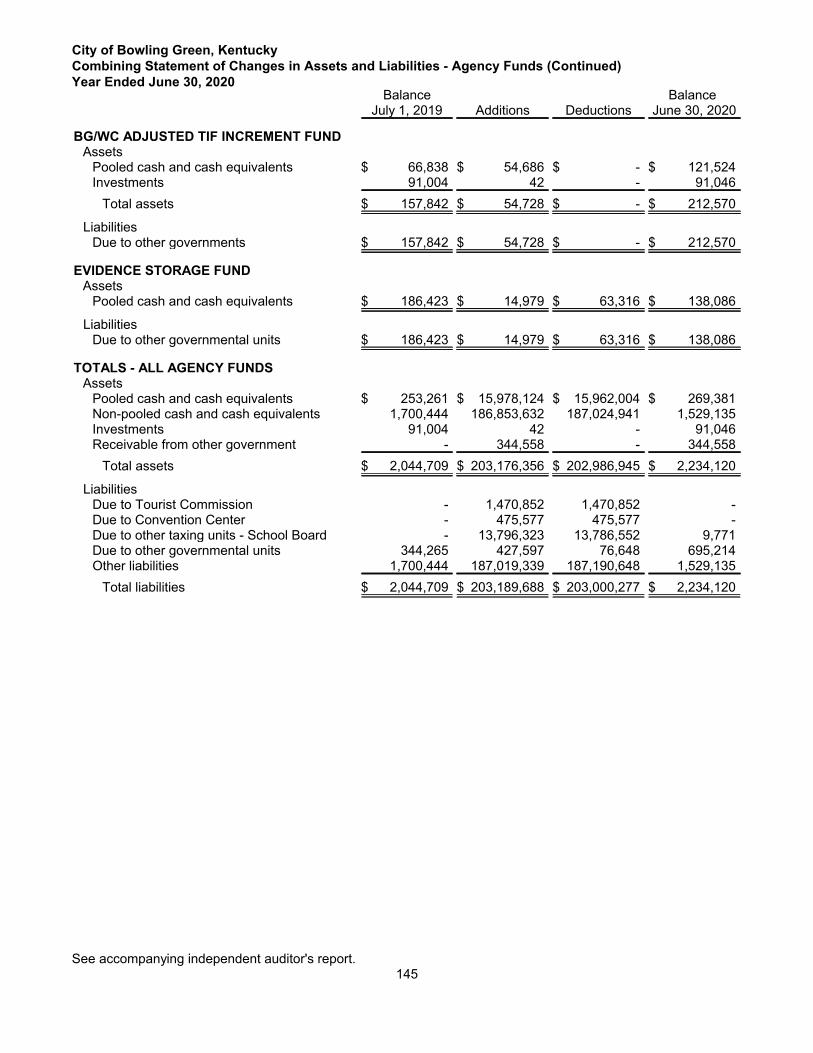
City of Bowling Green, KentuckyCombining Statement of Changes in Assets and Liabilities - Agency Funds (Continued)Year Ended June 30, 2020
BalanceJuly 1, 2019 Additions Deductions
BalanceJune 30, 2020
BG/WC ADJUSTED TIF INCREMENT FUNDAssets
Pooled cash and cash equivalents $ 66,838 $ 54,686 $ - $ 121,524Investments 91,004 42 - 91,046
Total assets $ 157,842 $ 54,728 $ - $ 212,570
LiabilitiesDue to other governments $ 157,842 $ 54,728 $ - $ 212,570
EVIDENCE STORAGE FUNDAssets
Pooled cash and cash equivalents $ 186,423 $ 14,979 $ 63,316 $ 138,086
LiabilitiesDue to other governmental units $ 186,423 $ 14,979 $ 63,316 $ 138,086
TOTALS - ALL AGENCY FUNDSAssets
Pooled cash and cash equivalents $ 253,261 $ 15,978,124 $ 15,962,004 $ 269,381Non-pooled cash and cash equivalents 1,700,444 186,853,632 187,024,941 1,529,135Investments 91,004 42 - 91,046Receivable from other government - 344,558 - 344,558
Total assets $ 2,044,709 $ 203,176,356 $ 202,986,945 $ 2,234,120
LiabilitiesDue to Tourist Commission - 1,470,852 1,470,852 -Due to Convention Center - 475,577 475,577 -Due to other taxing units - School Board - 13,796,323 13,786,552 9,771Due to other governmental units 344,265 427,597 76,648 695,214Other liabilities 1,700,444 187,019,339 187,190,648 1,529,135
Total liabilities $ 2,044,709 $ 203,189,688 $ 203,000,277 $ 2,234,120
See accompanying independent auditor's report.145

City of Bowling Green, KentuckyCombining Statement of Net Position - Component Unit - Bowling Green Municipal UtilitiesJune 30, 2020
Bowling Green Municipal Utilities
ElectricDivision
Water-SewerDivision
GeneralServicesDivision Total
ASSETSNon-pooled cash and cash equivalents $ 15,982,357 $ 17,411,340 $ 1,469,212 $ 34,862,909Receivables (net of allowances for uncollectibles):
Accounts 9,196,045 1,849,660 41,128 11,086,833Other receivables 112,094 163,662 - 275,756
Inventories 1,034,369 322,437 103,642 1,460,448Prepaid items 176,759 151,071 25,958 353,788Prepayment to TVA 1,785,481 - - 1,785,481Investments and restricted funds 1,266,545 50,373,247 - 51,639,792Other assets 78,264 1,708,561 196,720 1,983,545Due from component units 132,023 2,318,784 28,604 2,479,411Capital assets, net of accumulated depreciation
Non-depreciable 2,749,022 24,702,143 245,135 27,696,300Depreciable 57,581,671 131,527,121 4,320,096 193,428,888
Total assets $ 90,094,630 $ 230,528,026 $ 6,430,495 $ 327,053,151
DEFERRED OUTFLOWSOutflows for pensions 3,089,262 3,543,776 472,090 7,105,128Outflows for OPEB 1,435,131 1,529,297 223,919 3,188,347Deferred amounts from refunding debt 84,168 357,446 - 441,614
Total deferred outflows 4,608,561 5,430,519 696,009 10,735,089
Total assets and deferred outflows of resources 94,703,191 235,958,545 7,126,504 337,788,240
LIABILITIESVouchers and accounts payable 6,877,837 3,787,954 131,004 10,796,795Compensated absences payable 637,587 344,919 - 982,506Accrued interest payable 931,774 88,691 - 1,020,465Due to component units 544,121 132,023 - 676,144Customer deposits 6,535,090 600 - 6,535,690Other current liabilities 1,223,023 600,825 170,731 1,994,579Net pension liability 16,292,670 16,825,709 2,387,314 35,505,693Compensated absences payable, noncurrent 211,480 240,414 - 451,894Net OPEB liability 3,850,916 4,054,248 583,830 8,488,994Customer advances, noncurrent 99,786 - - 99,786Noncurrent liabilities
Due within one year 505,000 5,084,804 758,313 6,348,117Due in more than one year 8,590,074 115,704,583 1,038,731 125,333,388
Total liabilities 46,299,358 146,864,770 5,069,923 198,234,051
DEFERRED INFLOWS OF RESOURCESInflows for pension 387,294 426,998 67,999 882,291Inflows for OPEB 1,375,180 1,488,159 224,819 3,088,158
Total deferred inflows of resources 1,762,474 1,915,157 292,818 3,970,449
NET POSITIONNet investment in capital assets 51,235,619 75,649,891 2,768,187 129,653,697Restricted 1,266,545 9,735,728 - 11,002,273Unrestricted (5,860,805) 1,792,999 (1,004,424) (5,072,230)
Total net position $ 46,641,359 $ 87,178,618 $ 1,763,763 $ 135,583,740
See accompanying independent auditor's report146

City of Bowling Green, Kentucky Statement of Activities - Component Unit - Bowling Green Municipal Utilities June 30, 2020
Program Revenues Net (Expense) Revenue and Changes in Net Position
Function/Programs ExpensesCharges for
servicesOperating
ContributionsCapital
ContributionsElectricSystem
Water andSewerSystem
GeneralServices Totals
Electric Division $ 84,726,276 $ 87,541,139 $ - $ - $ 2,814,863 $ - $ - $ 2,814,863Water-Sewer Division 26,722,239 29,404,802 - 797,498 - 3,480,061 - 3,480,061General Services Division 4,123,986 4,849,248 - - - - 725,262 725,262
Total component units $ 115,572,501 $ 121,795,189 $ - 797,498 2,814,863 3,480,061 725,262 7,020,186
GENERAL REVENUESInvestment income 228,657 1,094,516 12,709 1,335,882Merchandising revenues 119,181 - 1,255 120,436Gain (loss) on sale of assets - 13,005 (4,426) 8,579
Total general revenues 347,838 1,107,521 9,538 1,464,897
Change in net position 3,162,701 4,587,582 734,800 8,485,083
Net position, beginning of year 43,478,658 82,591,036 1,028,963 127,098,657
Net position, end of year $ 46,641,359 $ 87,178,618 $ 1,763,763 $ 135,583,740
See accompanying independent auditor's report147

STATISTICAL SECTION
The Statistical Section of the City of Bowling Green's comprehensive annual financial report presents detailedinformation as a context for understanding what the information in the financial statements, note disclosures, andrequired supplementary information says about the government's overall financial health.
Financial Trends: Schedules 1 - 4
These schedules contain trend information to help the reader understand how the government's financialperformance and well-being have changed over time.
Revenue Capacity: Schedules 5 - 10
These schedules contain information to help the reader assess the government's most significant localrevenue sources.
Debt Capacity: Schedules 11 - 19
These schedules present information to help the reader assess the affordability of the government's currentlevels of outstanding debt and ability to issue additional debt in the future.
Demographic and Economic Information: Schedules 20 - 21
These schedules offer demographic and economic indicators to help the reader understand the environmentwithin which the government's financial activities take place.
Operating Information: Schedules 22 - 24
These schedules contain service and infrastructure data to help the reader understand how the information inthe government's financial report relates to the services the government provides and the activities itperforms.
148

Schedule 1City of Bowling Green, KentuckyNet Position by ComponentLast Ten Fiscal Years(accrual basis of accounting)
Fiscal Year
2020 2019 2018 2017 2016 2015 2014 2013 2012 2011
GOVERNMENTAL ACTIVITIES
Net investment in capital assets $ 210,484,781 $ 194,988,348 $ 190,037,852 $ 176,973,806 $ 164,964,407 $ 156,304,559 (a) $ 155,028,352 $ 137,092,802 $ 135,364,894 $ 124,378,964
Restricted 21,822,445 33,016,893 27,832,630 29,267,444 27,174,588 19,415,538 13,291,912 9,755,642 8,334,411 7,678,890
Unrestricted (44,989,549) (48,596,491) (46,835,736) (43,014,659)(c) (31,716,893) (28,174,114)(b) (29,848,657)(b) 22,355,235 14,779,013 11,861,503
Total governmental activities net position $ 187,317,677 $ 179,408,750 $ 171,034,746 $ 163,226,591 $ 160,422,102 $ 147,545,983 $ 138,471,607 $ 169,203,679 $ 158,478,318 $ 143,919,357
BUSINESS-TYPE ACTIVITIES
Net investment in capital assets $ 6,807,096 $ 6,885,053 $ 6,422,149 $ 5,103,874 $ 4,524,334 $ 4,061,947 (a) $ 1,797,454 $ 6,831,728 $ 6,697,127 $ 6,601,646
Unrestricted 9,437,150 8,893,007 8,172,717 8,202,715 7,840,586 6,715,057 8,057,826 6,966,658 5,855,494 5,109,640
Total business-type activities net position $ 16,244,246 $ 15,778,060 $ 14,594,866 $ 13,306,589 $ 12,364,920 $ 10,777,004 $ 9,855,280 $ 13,798,386 $ 12,552,621 $ 11,711,286
Primary government
Net investment in capital assets $ 217,291,877 $ 201,873,401 $ 196,460,001 $ 182,077,680 $ 169,488,741 $ 160,366,506 $ 156,825,806 $ 143,924,530 $ 142,062,021 $ 130,980,610
Restricted 21,822,445 33,016,893 27,832,630 29,267,444 27,174,588 19,415,538 13,291,912 9,755,642 8,334,411 7,678,890
Unrestricted (35,552,399) (39,703,484) (38,663,019) (34,811,944)(c) (23,876,307) (21,459,057) (21,790,831) 29,321,893 20,634,507 16,971,143
Total governmental activities program revenues $ 203,561,923 $ 195,186,810 $ 185,629,612 $ 176,533,180 $ 172,787,022 $ 158,322,987 $ 148,326,887 $ 183,002,065 $ 171,030,939 $ 155,630,643
Notes:(a) Golf and Aquatics enterprise funds were reclassified as governmental activities-effective July 1, 2014.(b) The City implemented GASB 68 effective for period ending June 30, 2015, which resulted in a restatement of FY2014 ending balances.(c) The City implemented GASB 75 effective for period ending June 30, 2018, which resulted in a restatement of the FY2017 ending balances.
See accompanying independent auditor's report.
149

Schedule 2City of Bowling Green, KentuckyChanges in Net PositionLast Ten Fiscal Years(accrual basis of accounting)
Fiscal Year
2020 2019 2018 2017 2016 2015 2014 2013 2012 2011
EXPENSESGovernmental activities:
General government $ 33,240,486 $ 28,296,834 $ 29,613,361 $ 36,558,180 (c) $ 19,038,235 $ 16,081,900 $ 14,940,954 $ 16,265,264 $ 15,273,247 $ 15,155,819Public safety 27,383,455 26,264,868 24,490,523 24,581,788 23,723,294 25,081,145 24,384,208 23,180,539 22,297,308 21,843,704Public works 14,839,341 12,669,001 12,284,494 10,619,939 9,547,794 15,513,082 8,781,909 6,207,967 7,576,164 6,700,923
Parks and recreation 4,889,698 6,808,361 7,256,246 7,623,720 7,751,367 7,434,798 (b) 4,899,266 5,280,474 5,011,216 5,478,404Neighborhood and comm. services 6,382,391 5,278,766 6,203,076 5,436,759 5,014,886 4,308,565 3,734,515 4,787,160 5,158,144 4,948,826
Agency services(d) 2,673,446 2,494,955 2,231,558 2,028,787 1,950,663 1,267,637 1,362,100 1,070,544 1,341,318 1,238,015Interest expense 4,616,856 5,100,598 3,206,275 2,828,885 3,999,109 5,931,620 6,869,043 7,568,802 6,498,659 5,670,703
Total governmental activities 94,025,673 86,913,383 85,285,533 89,678,058 71,025,348 75,618,747 64,971,995 64,360,750 63,156,056 61,036,394
Business-type activities:
Golf course - - - - - - (b) 1,750,045 2,066,604 2,759,341 2,366,430
Aquatics - - - - - - (b) 884,164 885,993 919,636 871,429Convention Center 371,054 759,492 522,084 975,317 471,616 715,458 984,699 673,102 904,908 607,015
Total business-type activities 371,054 759,492 522,084 975,317 471,616 715,458 3,618,908 3,625,699 4,583,885 3,844,874
Total primary government expenses $ 94,396,727 $ 87,672,875 $ 85,807,617 $ 90,653,375 $ 71,496,964 $ 76,334,205 $ 68,590,903 $ 67,986,449 $ 67,739,941 $ 64,881,268
PROGRAM REVENUESGovernmental activities:
Charges for services: General government $ 745,125 $ 2,321,805 $ 2,505,897 $ 2,529,394 $ 2,865,512 $ 2,084,612 $ 1,898,623 $ 4,650,906 $ 3,728,986 $ 3,415,888Public Safety 219,791 203,395 212,534 268,958 244,291 239,223 259,539 252,181 269,502 187,098Parks and recreation 1,451,062 1,984,074 2,064,862 2,013,933 2,257,783 1,942,755 381,975 380,360 389,486 398,333
Operating grants and contributions 16,965,893 11,337,808 11,533,016 11,268,936 10,084,318 9,338,213 9,387,792 9,538,468 7,308,403 8,425,923Capital grants and contributions 6,142,963 4,634,679 4,501,727 4,898,262 1,844,479 7,396,801 4,544,651 5,169,106 13,461,928 9,941,334
Total governmental activities program revenues 25,524,834 20,481,761 20,818,036 20,979,483 17,296,383 21,001,604 16,472,580 19,991,021 25,158,305 22,368,576
Business-type activities:Charges for services
Golf course - - - - - - 1,247,622 1,368,727 1,438,517 1,275,821Aquatics - - - - - - 449,284 477,508 649,347 578,532Convention center 102,041 173,447 162,997 160,600 201,378 183,961 210,800 212,823 205,503 216,665
Total business-type activities program revenues 102,041 173,447 162,997 160,600 201,378 183,961 1,907,706 2,059,058 2,293,367 2,071,018
Total primary government program revenues $ 25,626,875 $ 20,655,208 $ 20,981,033 $ 21,140,083 $ 17,497,761 $ 21,185,565 $ 18,380,286 $ 22,050,079 $ 27,451,672 $ 24,439,594
NET (EXPENSE)/REVENUEGovernmental activities $ (68,500,839) $ (66,431,622) $ (64,467,497) $ (68,698,575) $ (53,728,965) $ (54,617,143) $ (48,499,415) $ (44,369,729) $ (37,997,751) $ (38,667,818)Business-type activities (269,013) (586,045) (359,087) (814,717) (270,238) (531,497) (1,711,202) (1,566,641) (2,290,518) (1,773,856)
Total primary government net expense $ (68,769,852) $ (67,017,667) $ (64,826,584) $ (69,513,292) $ (53,999,203) $ (55,148,640) $ (50,210,617) $ (45,936,370) $ (40,288,269) $ (40,441,674)
See accompanying independent auditor's report.
150

Schedule 2City of Bowling Green, KentuckyChanges in Net PositionLast Ten Fiscal Years(accrual basis of accounting)
Fiscal Year
2020 2019 2018 2017 2016 2015 2014 2013 2012 2011
GENERAL REVENUES AND OTHER CHANGES IN NET POSITIONGovernmental activities: General revenues
Property taxes $ 15,811,675 $ 14,963,337 $ 14,289,761 $ 13,342,889 $ 12,988,729 $ 12,760,797 $ 12,253,118 $ 11,763,153 $ 11,377,484 $ 11,220,959Insurance premium taxes 4,667,114 4,477,026 4,239,887 4,096,944 3,839,322 3,660,165 3,545,527 3,342,087 3,156,411 3,087,621Wages and net profits 54,608,120 53,636,444 53,488,756 53,840,825 48,670,998 46,774,186 43,188,734 41,392,272 39,490,949 37,220,689Investment income 851,895 850,604 101,498 125,424 462,415 362,436 597,329 644,577 815,700 886,084Gain (loss) on disposal of capital assets (1,879,514) 539,129 (21,381) 165,492 368,040 223,557 (98,712) 53,678 - (1,839,170)Miscellaneous 2,450,476 1,282,594 1,135,708 941,112 1,262,660 724,169 562,905 251,083 262,868 270,561Transfers (100,000) (943,508) (958,577) (1,009,622) (987,080) (813,791) (2,044,823) (2,351,760) (2,546,700) (2,477,840)
Total governmental activities 76,409,766 74,805,626 72,275,652 71,503,064 66,605,084 63,691,519 58,004,078 55,095,090 52,556,712 48,368,904
Business-type activities:General revenues
Property tax(a) - - 112,987 111,542 114,542 96,848 100,322 - - -Transient room tax 475,577 544,642 564,518 590,019 559,040 450,592 405,516 460,640 432,158 420,300Gain (loss) on sale of capital assets (45,575) - - - - - - - - -Investment earnings 197,464 276,089 11,282 21,327 177,491 91,990 85,883 6 152,995 84,510Miscellaneous 7,733 5,000 - 23,877 20,000 - 35 - - 20,373Transfers 100,000 943,508 958,577 1,009,622 987,080 813,791 2,044,823 2,351,760 2,546,700 2,477,840
Total business-type activities 735,199 1,769,239 1,647,364 1,756,387 1,858,153 1,453,221 2,636,579 2,812,406 3,131,853 3,003,023
Total primary government $ 77,144,965 $ 76,574,865 $ 73,923,016 $ 73,259,451 $ 68,463,237 $ 65,144,740 $ 60,640,657 $ 57,907,496 $ 55,688,565 $ 51,371,927
CHANGES IN NET POSITIONGovernmental activities $ 7,908,927 $ 8,374,004 $ 7,808,155 $ 2,804,489 $ 12,876,119 $ 9,074,376 $ 9,504,663 $ 10,725,361 $ 14,558,961 $ 9,701,086Business-type activities 466,186 1,183,194 1,288,277 941,670 1,587,915 921,724 925,377 1,245,765 841,335 1,229,167
Total primary government $ 8,375,113 $ 9,557,198 $ 9,096,432 $ 3,746,159 $ 14,464,034 $ 9,996,100 $ 10,430,040 $ 11,971,126 $ 15,400,296 $ 10,930,253
Notes:(a) Property taxes for business-type activities were previously reported on transient room tax line.(b) Golf and Aquatics enterprise funds were reclassified as governmental activities-effective July 1, 2014.(c) Implementation of GASB 75 resulted in the restatement of FY2017 balances.(d) Agency services was previously listed as Community Services prior to FY2018.
See accompanying independent auditor's report.
151
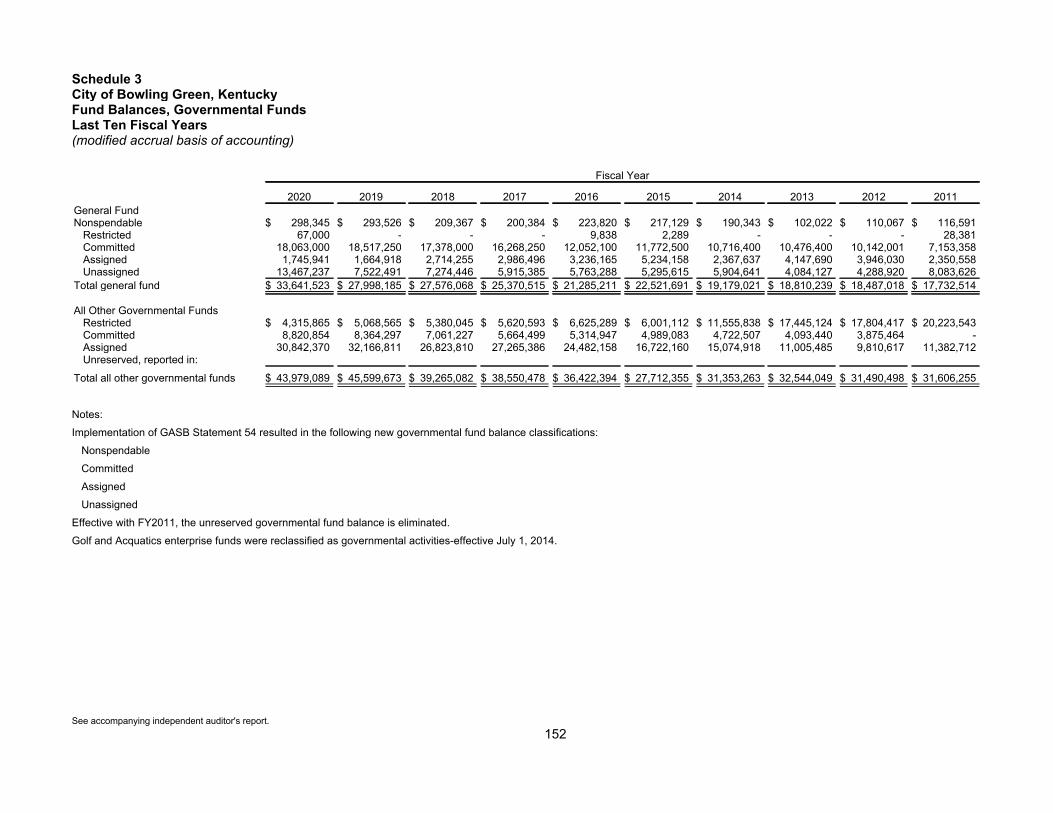
Schedule 3City of Bowling Green, KentuckyFund Balances, Governmental FundsLast Ten Fiscal Years(modified accrual basis of accounting)
Fiscal Year
2020 2019 2018 2017 2016 2015 2014 2013 2012 2011
General FundNonspendable $ 298,345 $ 293,526 $ 209,367 $ 200,384 $ 223,820 $ 217,129 $ 190,343 $ 102,022 $ 110,067 $ 116,591
Restricted 67,000 - - - 9,838 2,289 - - - 28,381Committed 18,063,000 18,517,250 17,378,000 16,268,250 12,052,100 11,772,500 10,716,400 10,476,400 10,142,001 7,153,358Assigned 1,745,941 1,664,918 2,714,255 2,986,496 3,236,165 5,234,158 2,367,637 4,147,690 3,946,030 2,350,558Unassigned 13,467,237 7,522,491 7,274,446 5,915,385 5,763,288 5,295,615 5,904,641 4,084,127 4,288,920 8,083,626
Total general fund $ 33,641,523 $ 27,998,185 $ 27,576,068 $ 25,370,515 $ 21,285,211 $ 22,521,691 $ 19,179,021 $ 18,810,239 $ 18,487,018 $ 17,732,514
All Other Governmental FundsRestricted $ 4,315,865 $ 5,068,565 $ 5,380,045 $ 5,620,593 $ 6,625,289 $ 6,001,112 $ 11,555,838 $ 17,445,124 $ 17,804,417 $ 20,223,543Committed 8,820,854 8,364,297 7,061,227 5,664,499 5,314,947 4,989,083 4,722,507 4,093,440 3,875,464 -Assigned 30,842,370 32,166,811 26,823,810 27,265,386 24,482,158 16,722,160 15,074,918 11,005,485 9,810,617 11,382,712Unreserved, reported in:
Total all other governmental funds $ 43,979,089 $ 45,599,673 $ 39,265,082 $ 38,550,478 $ 36,422,394 $ 27,712,355 $ 31,353,263 $ 32,544,049 $ 31,490,498 $ 31,606,255
Notes:
Implementation of GASB Statement 54 resulted in the following new governmental fund balance classifications:
Nonspendable
Committed
Assigned
Unassigned
Effective with FY2011, the unreserved governmental fund balance is eliminated.
Golf and Acquatics enterprise funds were reclassified as governmental activities-effective July 1, 2014.
See accompanying independent auditor's report.
152
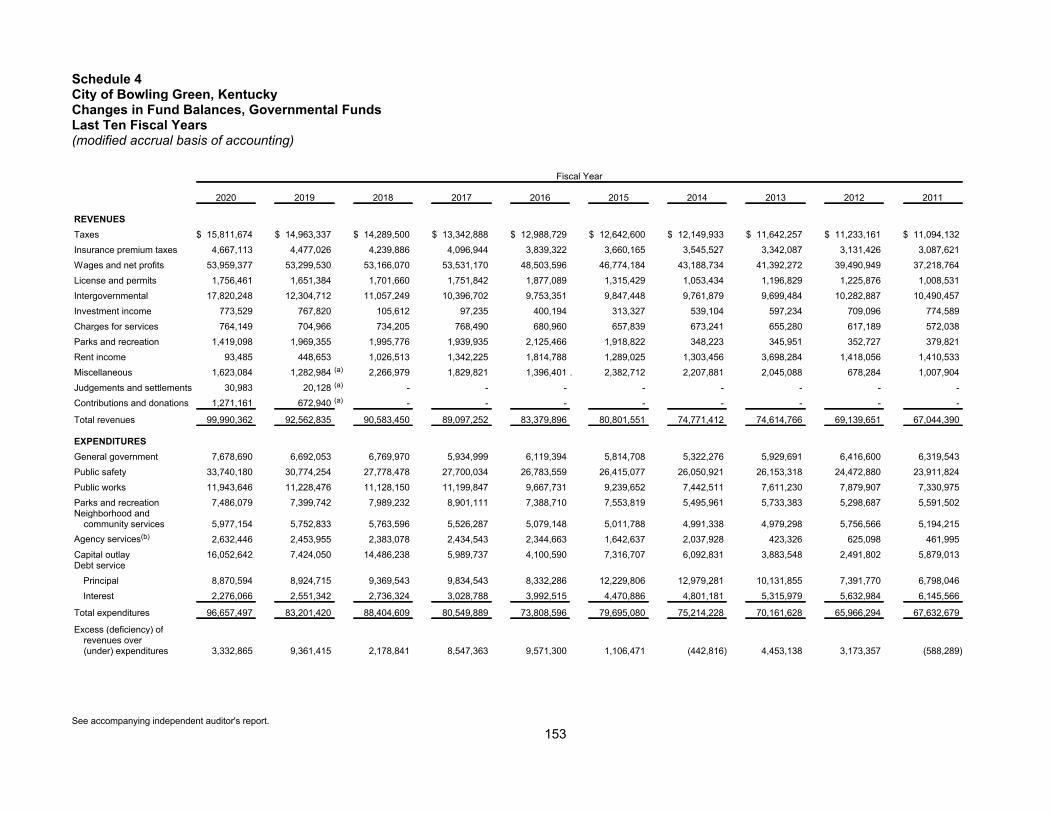
Schedule 4City of Bowling Green, KentuckyChanges in Fund Balances, Governmental FundsLast Ten Fiscal Years(modified accrual basis of accounting)
Fiscal Year
2020 2019 2018 2017 2016 2015 2014 2013 2012 2011
REVENUES
Taxes $ 15,811,674 $ 14,963,337 $ 14,289,500 $ 13,342,888 $ 12,988,729 $ 12,642,600 $ 12,149,933 $ 11,642,257 $ 11,233,161 $ 11,094,132
Insurance premium taxes 4,667,113 4,477,026 4,239,886 4,096,944 3,839,322 3,660,165 3,545,527 3,342,087 3,131,426 3,087,621
Wages and net profits 53,959,377 53,299,530 53,166,070 53,531,170 48,503,596 46,774,184 43,188,734 41,392,272 39,490,949 37,218,764
License and permits 1,756,461 1,651,384 1,701,660 1,751,842 1,877,089 1,315,429 1,053,434 1,196,829 1,225,876 1,008,531
Intergovernmental 17,820,248 12,304,712 11,057,249 10,396,702 9,753,351 9,847,448 9,761,879 9,699,484 10,282,887 10,490,457
Investment income 773,529 767,820 105,612 97,235 400,194 313,327 539,104 597,234 709,096 774,589
Charges for services 764,149 704,966 734,205 768,490 680,960 657,839 673,241 655,280 617,189 572,038
Parks and recreation 1,419,098 1,969,355 1,995,776 1,939,935 2,125,466 1,918,822 348,223 345,951 352,727 379,821
Rent income 93,485 448,653 1,026,513 1,342,225 1,814,788 1,289,025 1,303,456 3,698,284 1,418,056 1,410,533
Miscellaneous 1,623,084 1,282,984 (a) 2,266,979 1,829,821 1,396,401 . 2,382,712 2,207,881 2,045,088 678,284 1,007,904
Judgements and settlements 30,983 20,128 (a) - - - - - - - -
Contributions and donations 1,271,161 672,940 (a) - - - - - - - -
Total revenues 99,990,362 92,562,835 90,583,450 89,097,252 83,379,896 80,801,551 74,771,412 74,614,766 69,139,651 67,044,390
EXPENDITURES
General government 7,678,690 6,692,053 6,769,970 5,934,999 6,119,394 5,814,708 5,322,276 5,929,691 6,416,600 6,319,543
Public safety 33,740,180 30,774,254 27,778,478 27,700,034 26,783,559 26,415,077 26,050,921 26,153,318 24,472,880 23,911,824
Public works 11,943,646 11,228,476 11,128,150 11,199,847 9,667,731 9,239,652 7,442,511 7,611,230 7,879,907 7,330,975
Parks and recreation 7,486,079 7,399,742 7,989,232 8,901,111 7,388,710 7,553,819 5,495,961 5,733,383 5,298,687 5,591,502Neighborhood and
community services 5,977,154 5,752,833 5,763,596 5,526,287 5,079,148 5,011,788 4,991,338 4,979,298 5,756,566 5,194,215
Agency services(b) 2,632,446 2,453,955 2,383,078 2,434,543 2,344,663 1,642,637 2,037,928 423,326 625,098 461,995
Capital outlay 16,052,642 7,424,050 14,486,238 5,989,737 4,100,590 7,316,707 6,092,831 3,883,548 2,491,802 5,879,013Debt service
Principal 8,870,594 8,924,715 9,369,543 9,834,543 8,332,286 12,229,806 12,979,281 10,131,855 7,391,770 6,798,046
Interest 2,276,066 2,551,342 2,736,324 3,028,788 3,992,515 4,470,886 4,801,181 5,315,979 5,632,984 6,145,566
Total expenditures 96,657,497 83,201,420 88,404,609 80,549,889 73,808,596 79,695,080 75,214,228 70,161,628 65,966,294 67,632,679
Excess (deficiency) ofrevenues over(under) expenditures 3,332,865 9,361,415 2,178,841 8,547,363 9,571,300 1,106,471 (442,816) 4,453,138 3,173,357 (588,289)
See accompanying independent auditor's report.
153

Schedule 4City of Bowling Green, KentuckyChanges in Fund Balances, Governmental Funds Last Ten Fiscal Years(modified accrual basis of accounting)
Fiscal Year
2020 2019 2018 2017 2016 2015 2014 2013 2012 2011
OTHER FINANCINGSOURCES (USES)
Transfers in 22,320,604 21,845,937 19,007,257 19,092,756 21,421,164 16,008,355 17,052,527 12,547,232 13,721,906 10,727,493
Transfers out (23,222,106) (24,989,445) (21,915,834) (21,652,377) (23,630,744) (17,522,146) (19,747,350) (15,632,723) (16,452,014) (13,105,332)Premium on general
obligation bonds - - - - - 359,645 - - - -Discount on general
obligation bonds - - - - - (95,408) - - - -
Capital lease proceeds 1,531,518 - 3,531,021 - - - - - - 1,309,391Proceeds from bond
refunding - - - - 39,845,000 9,345,485 - 4,099,807 7,409,463 29,627,561Payment to refunded bonds
redeemed - - - - - - - 170,747 - -Payment to refunded debt
escrow agent - - - - (42,259,385) (9,605,241) - (4,281,161) (7,718,497) (29,627,561)Premium from bond
refunding - - - - 2,085,795 - - 19,731 319,639 -Proceeds from sale of capital
assets 59,874 538,801 118,872 225,645 440,429 104,601 267,853 - 184,893 15,604
Total other financing sources(uses) 689,890 (2,604,707) 741,316 (2,333,976) (2,097,741) (1,404,709) (2,426,970) (3,076,367) (2,534,610) (1,052,844)
Net change in fund balances $ 4,022,755 $ 6,756,708 $ 2,920,157 $ 6,213,387 $ 7,473,559 $ (298,238) $ (2,869,786) $ 1,376,771 $ 638,747 $ (1,641,133)
Debt service as a percentageof noncapital expenditures %14.71 %15.73 %17.01 %18.76 %17.59 %23.93 %26.14 %24.37 %24.37 %22.78
Note: Golf and Aquatics enterprise funds were reclassified as governmental activities-effective July 1, 2014.(a) Prior to FY2019, Judgements and settlements and Contributions and donations were previously listed as Micellaneous.(b) Agency services was previously listed as Community services prior to FY2018
See accompanying independent auditor's report.
154
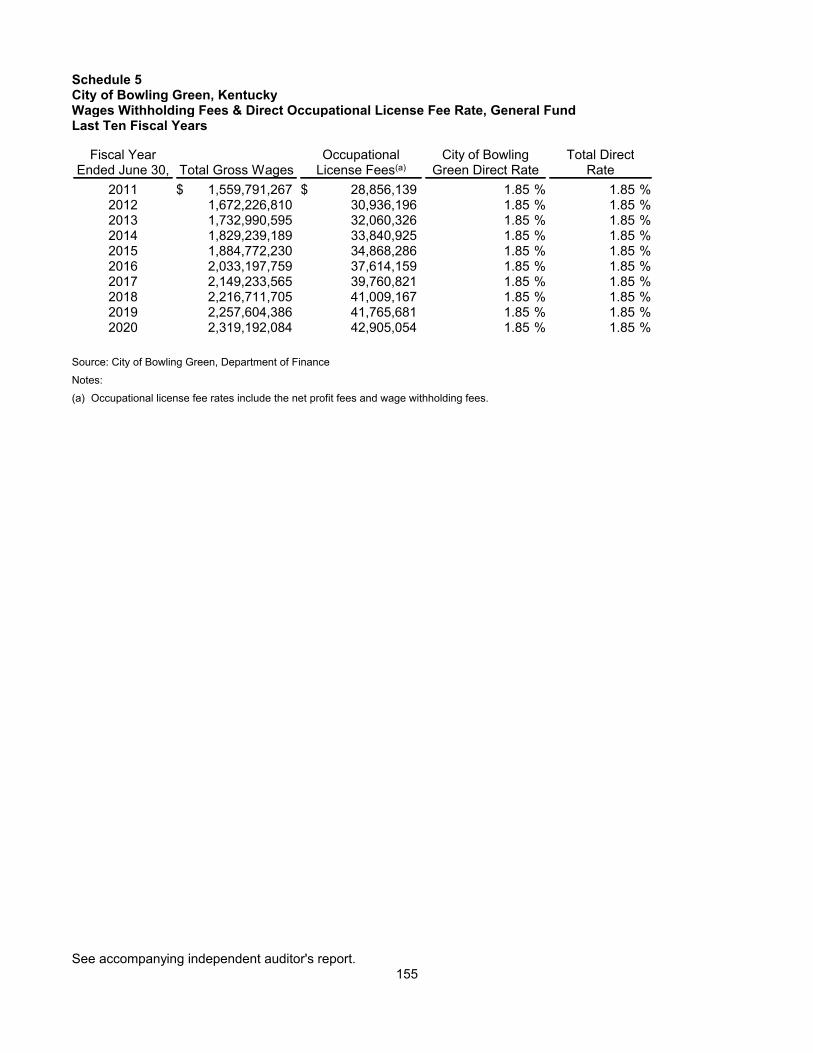
Schedule 5City of Bowling Green, KentuckyWages Withholding Fees & Direct Occupational License Fee Rate, General FundLast Ten Fiscal Years
Fiscal YearEnded June 30, Total Gross Wages
OccupationalLicense Fees(a)
City of BowlingGreen Direct Rate
Total DirectRate
2011 $ 1,559,791,267 $ 28,856,139 %1.85 %1.852012 1,672,226,810 30,936,196 %1.85 %1.852013 1,732,990,595 32,060,326 %1.85 %1.852014 1,829,239,189 33,840,925 %1.85 %1.852015 1,884,772,230 34,868,286 %1.85 %1.852016 2,033,197,759 37,614,159 %1.85 %1.852017 2,149,233,565 39,760,821 %1.85 %1.852018 2,216,711,705 41,009,167 %1.85 %1.852019 2,257,604,386 41,765,681 %1.85 %1.852020 2,319,192,084 42,905,054 %1.85 %1.85
Source: City of Bowling Green, Department of Finance
Notes:
(a) Occupational license fee rates include the net profit fees and wage withholding fees.
See accompanying independent auditor's report.155

Schedule 6City of Bowling Green, KentuckyOccupational License Receipts, General FundLast Ten Fiscal Years
Fiscal YearEnded June 30,
OccupationalWithholdings
FeesOccupational Net
Profit Fees
OtherOccupational
Fees(a) TotalPercentage
Growth
2011 $ 28,856,139 $ 6,329,845 $ 256,642 $ 35,442,626 %4.72012 30,936,196 6,220,162 265,902 37,422,260 %5.62013 32,060,326 7,031,910 286,827 39,379,063 %5.22014 33,840,925 6,989,859 244,705 41,075,489 %4.32015 34,868,286 9,280,035 261,163 44,409,484 %8.12016 37,614,159 8,112,119 320,002 46,046,280 %3.72017 39,760,821 10,866,714 371,052 50,998,587 %10.82018 41,009,167 8,915,833 322,947 50,247,947 %(1.5)2019 41,765,681 8,176,009 336,915 50,278,605 %0.12020 42,905,054 8,423,114 364,682 51,692,850 %2.8
Notes:
(a) Other occupational fees include minimum business registration fees which are $50 that applies only to new businesses. Existingbusinesses pay a minimum occupational net profit fee of $30 registration fee; itinerant businesses that pay a fee based on the amount oftime business will be conducted in the City and the number of employees working; and penalties (5% per month not to exceed 25% with aminimum of $25) and interest (1% per month) relate to all occupational receipts.
See accompanying independent auditor's report.156
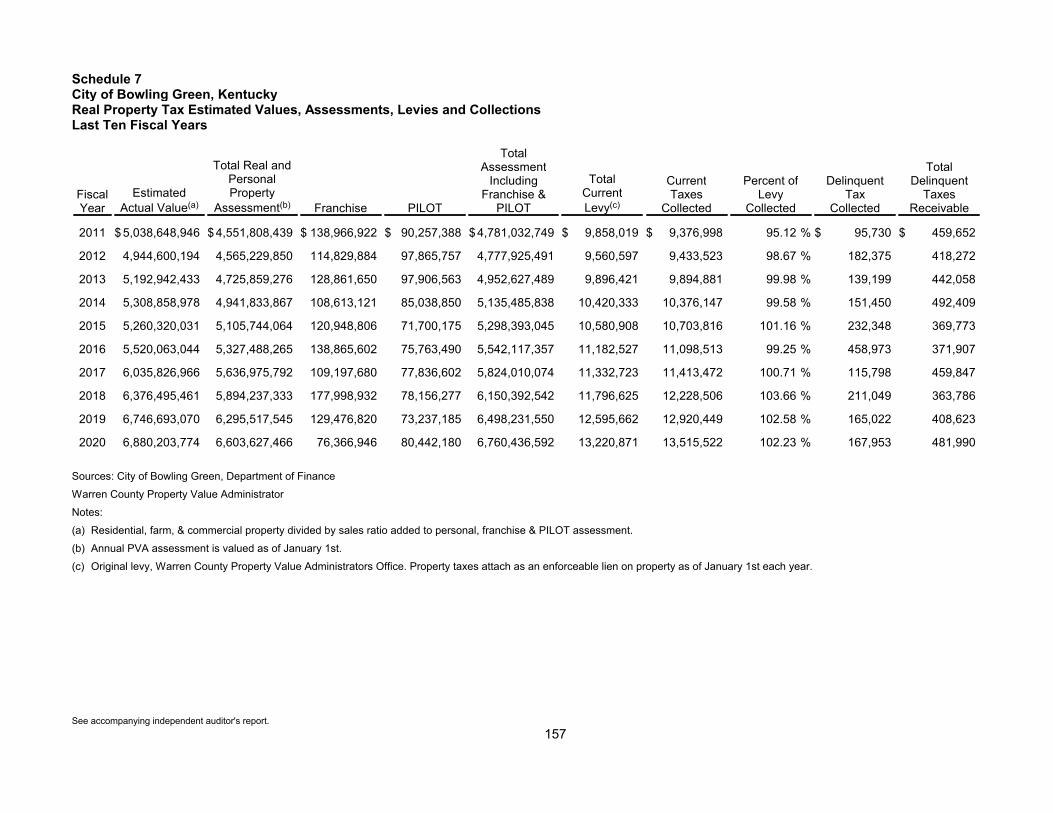
Schedule 7City of Bowling Green, KentuckyReal Property Tax Estimated Values, Assessments, Levies and CollectionsLast Ten Fiscal Years
FiscalYear
Estimated
Actual Value(a)
Total Real andPersonalProperty
Assessment(b) Franchise PILOT
TotalAssessment
IncludingFranchise &
PILOT
TotalCurrent
Levy(c)
CurrentTaxes
Collected
Percent ofLevy
Collected
DelinquentTax
Collected
TotalDelinquent
TaxesReceivable
2011 $5,038,648,946 $4,551,808,439 $ 138,966,922 $ 90,257,388 $4,781,032,749 $ 9,858,019 $ 9,376,998 %95.12 $ 95,730 $ 459,652
2012 4,944,600,194 4,565,229,850 114,829,884 97,865,757 4,777,925,491 9,560,597 9,433,523 %98.67 182,375 418,272
2013 5,192,942,433 4,725,859,276 128,861,650 97,906,563 4,952,627,489 9,896,421 9,894,881 %99.98 139,199 442,058
2014 5,308,858,978 4,941,833,867 108,613,121 85,038,850 5,135,485,838 10,420,333 10,376,147 %99.58 151,450 492,409
2015 5,260,320,031 5,105,744,064 120,948,806 71,700,175 5,298,393,045 10,580,908 10,703,816 %101.16 232,348 369,773
2016 5,520,063,044 5,327,488,265 138,865,602 75,763,490 5,542,117,357 11,182,527 11,098,513 %99.25 458,973 371,907
2017 6,035,826,966 5,636,975,792 109,197,680 77,836,602 5,824,010,074 11,332,723 11,413,472 %100.71 115,798 459,847
2018 6,376,495,461 5,894,237,333 177,998,932 78,156,277 6,150,392,542 11,796,625 12,228,506 %103.66 211,049 363,786
2019 6,746,693,070 6,295,517,545 129,476,820 73,237,185 6,498,231,550 12,595,662 12,920,449 %102.58 165,022 408,623
2020 6,880,203,774 6,603,627,466 76,366,946 80,442,180 6,760,436,592 13,220,871 13,515,522 %102.23 167,953 481,990
Sources: City of Bowling Green, Department of Finance
Warren County Property Value Administrator
Notes:
(a) Residential, farm, & commercial property divided by sales ratio added to personal, franchise & PILOT assessment.
(b) Annual PVA assessment is valued as of January 1st.
(c) Original levy, Warren County Property Value Administrators Office. Property taxes attach as an enforceable lien on property as of January 1st each year.
See accompanying independent auditor's report.
157

Schedule 8City of Bowling Green, KentuckyProperty Tax Rates, Direct and Overlapping Governmental Units(Per $100 of Assessed Value)Last Ten Fiscal Years
REAL ESTATE
City Proper City Annex
FiscalYear City County City School State Total City County
CountySchool State Total
2011 0.2060 0.2105 0.7070 0.1220 1.2455 0.2060 0.2105 0.3830 0.1220 0.92152012 0.2060 0.2170 0.7070 0.1220 1.2520 0.2060 0.2170 0.3950 0.1220 0.94002013 0.2060 0.2170 0.7310 0.1220 1.2760 0.2060 0.2170 0.4060 0.1220 0.95102014 0.2060 0.2170 0.7310 0.1220 1.2760 0.2060 0.2170 0.4200 0.1220 0.96502015 0.2060 0.2160 0.7560 0.1220 1.3000 0.2060 0.2160 0.4230 0.1220 0.96702016 0.2060 0.2160 0.7680 0.1220 1.3120 0.2060 0.2160 0.4350 0.1220 0.97902017 0.2060 0.2146 0.7810 0.1220 1.3236 0.2060 0.2146 0.4400 0.1220 0.98262018 0.2060 0.2146 0.8280 0.1220 1.3706 0.2060 0.2146 0.4490 0.1220 0.99162019 0.2050 0.2166 0.8280 0.1220 1.3716 0.2050 0.2166 0.4560 0.1220 0.99962020 0.2050 0.2155 0.8450 0.1220 1.3875 0.2050 0.2155 0.4610 0.1220 1.0035
PERSONAL PROPERTY
City Proper City Annex
FiscalYear City County City School State Total City County
CountySchool State Total
2011 0.2600 0.2858 0.7070 0.4500 1.7028 0.2600 0.2888 0.3830 0.4500 1.38182012 0.2600 0.2888 0.7310 0.4500 1.7298 0.2600 0.2689 0.3950 0.4500 1.37392013 0.2600 0.2689 0.7310 0.4500 1.7099 0.2600 0.2689 0.3950 0.4500 1.37392014 0.2600 0.2689 0.7560 0.4500 1.7349 0.2600 0.2689 0.4200 0.4500 1.39892015 0.2600 0.2716 0.7560 0.4500 1.7376 0.2600 0.2716 0.4230 0.4500 1.40462016 0.2600 0.2714 0.7680 0.4500 1.7494 0.2600 0.2714 0.4350 0.4500 1.41642017 0.2600 0.2587 0.7810 0.4500 1.7497 0.2600 0.2587 0.4400 0.4500 1.40872018 0.2600 0.2587 0.8280 0.4500 1.7967 0.2600 0.2587 0.4490 0.4500 1.41772019 0.2600 0.2673 0.8280 0.4500 1.8053 0.2600 0.2673 0.4560 0.4500 1.43332020 0.2600 0.2669 0.8450 0.4500 1.8219 0.2600 0.2669 0.4610 0.4500 1.4379
Source: City of Bowling Green, Department of Finance
Notes:
- City proper and City annex are terms used to designate in which school system the property is located. All City residents pay both the Cityand County taxes, but are required to pay tax to only the one appropriate school system.
- Tax rates relate to the Fiscal Year period of July 1 - June 30. For example, tax year 2019 rates are collected in Fiscal Year 2020.
See accompanying independent auditor's report.158

Schedule 9City of Bowling Green, KentuckyPrincipal Occupational Withholdings Fee PayersCurrent Year and Nine Years Ago
Taxpayer
2020 2011
Bowling Green Metalforming LLC Bowling Green Metalforming LLCCity of Bowling Green Board of
EducationCity of Bowling Green Board of
EducationCommonwealth Health Corporation Country Oven BakeryCountry Oven Bakery General Motors CorporationGeneral Motors Corporation Henkel CorporationGraves-Gilbert Clinic PSC Kentucky State TreasurerHenkel Corporation The Medical Center at BGUnion Underwear Co. LLC Union Underwear Co. LLCWarren County Board of Education Warren County Board of EducationWestern Kentucky University Western Kentucky University
Source: City of Bowling Green, Department of Finance
Notes:
- Taxpayer information is listed alphabetically.
- Commonwealth Health Corporation was previously listed as The Medical Center.
159
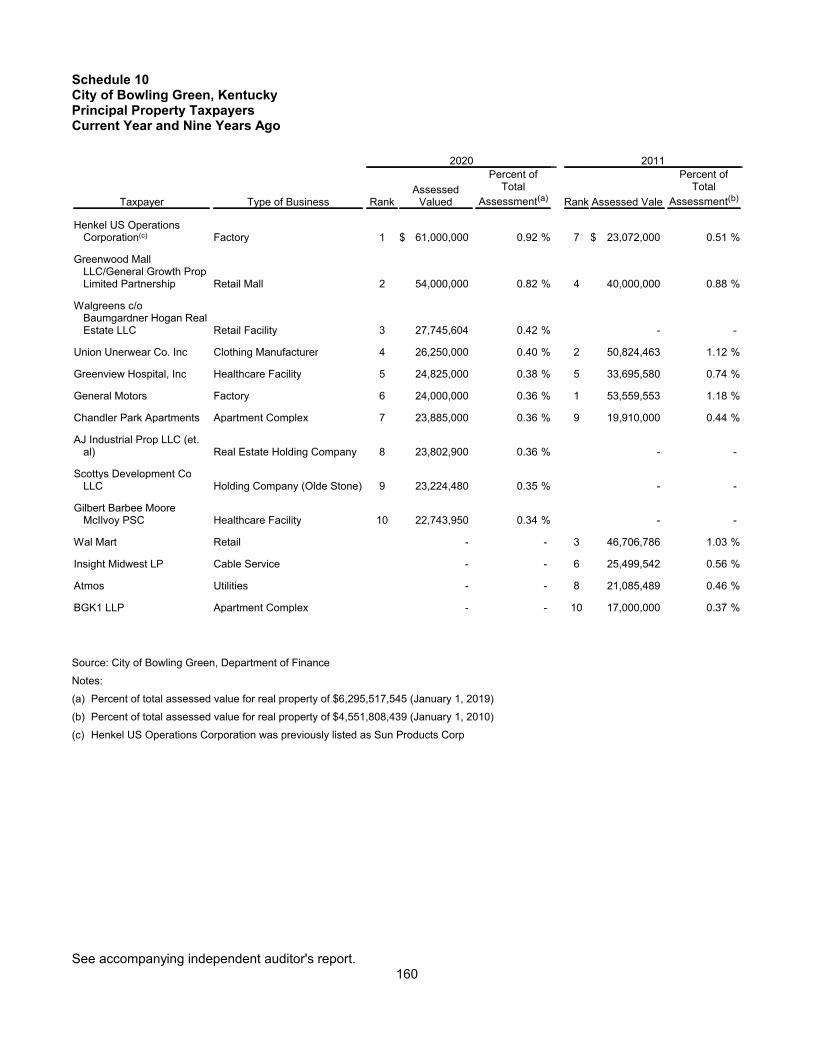
Schedule 10City of Bowling Green, KentuckyPrincipal Property TaxpayersCurrent Year and Nine Years Ago
2020 2011
Taxpayer Type of Business RankAssessed
Valued
Percent ofTotal
Assessment(a) Rank Assessed Vale
Percent ofTotal
Assessment(b)
Henkel US OperationsCorporation(c) Factory 1 $ 61,000,000 %0.92 7 $ 23,072,000 %0.51
Greenwood MallLLC/General Growth PropLimited Partnership Retail Mall 2 54,000,000 %0.82 4 40,000,000 %0.88
Walgreens c/oBaumgardner Hogan RealEstate LLC Retail Facility 3 27,745,604 %0.42 - -
Union Unerwear Co. Inc Clothing Manufacturer 4 26,250,000 %0.40 2 50,824,463 %1.12
Greenview Hospital, Inc Healthcare Facility 5 24,825,000 %0.38 5 33,695,580 %0.74
General Motors Factory 6 24,000,000 %0.36 1 53,559,553 %1.18
Chandler Park Apartments Apartment Complex 7 23,885,000 %0.36 9 19,910,000 %0.44
AJ Industrial Prop LLC (et.al) Real Estate Holding Company 8 23,802,900 %0.36 - -
Scottys Development CoLLC Holding Company (Olde Stone) 9 23,224,480 %0.35 - -
Gilbert Barbee MooreMcIlvoy PSC Healthcare Facility 10 22,743,950 %0.34 - -
Wal Mart Retail - - 3 46,706,786 %1.03
Insight Midwest LP Cable Service - - 6 25,499,542 %0.56
Atmos Utilities - - 8 21,085,489 %0.46
BGK1 LLP Apartment Complex - - 10 17,000,000 %0.37
Source: City of Bowling Green, Department of Finance
Notes:
(a) Percent of total assessed value for real property of $6,295,517,545 (January 1, 2019)
(b) Percent of total assessed value for real property of $4,551,808,439 (January 1, 2010)
(c) Henkel US Operations Corporation was previously listed as Sun Products Corp
See accompanying independent auditor's report.160

Schedule 11City of Bowling Green, KentuckyRatios of Outstanding Debt by TypeLast Ten Fiscal Years
Governmental Activities Business-Type Activities
Fiscal YearGeneral
Obligation Bonds
SpecialAssessment
Bonds(a)
Notes andCapital Leases
from DirectBorrowings
andPlacements
GeneralObligation
Bonds
Notes Payableand Capital
LeasesTotal PrimaryGovernment
Percentageof Personal
Income(b)Debt perCapita
2011 $ 124,964,655 $ 118,419 $ 3,944,088 $ 9,165,353 $ 28,925 $ 138,221,440 %4.02 $ 2,3832012 119,325,846 112,506 3,412,034 8,274,155 50,256 131,174,797 %3.90 2,2232013 108,501,710 - 2,871,504 6,752,559 34,390 118,160,163 %3.19 1,9502014 102,591,166 - 2,459,472 6,188,330 21,671 111,260,639 %2.84 1,8092015 101,557,970 - 2,119,501 2,936,494 - 106,613,965 %2.66 1,7062016 96,522,378 - 1,755,421 2,202,371 - 100,480,170 %2.43 1,5802017 87,575,068 - 794,217 1,498,248 - 89,867,533 %2.03 1,3772018 78,269,251 - 4,018,748 754,122 - 83,042,121 %1.81 1,2382019 69,731,975 - 3,513,596 - - 73,245,571 %1.54 1,0712020 61,126,049 - 4,585,310 - - 65,711,359 %1.32 931
Notes: Details regarding the City's outstanding debt can be found in the notes to the financial statements.
(a) Warren County Water District bonds.
(b) See Schedule 20 for personal income and population data. The ratios are calculated using personal income and population for the prior calenda year.
See accompanying independent auditor's report.
161

Schedule 12City of Bowling Green, KentuckyIndebtedness and Debt RatiosLast Ten Fiscal Years
Fiscal Year
2020 2019 2018 2017 2016 2015 2014 2013 2012 2011
TAX SUPPORTED
General bonds and notes(a) $ 48,030,569 $ 55,565,571 $ 62,422,999 $ 59,409,285 $ 66,095,299 $ 64,997,001 $ 70,380,628 $ 67,918,740 $ 69,978,938 $ 74,366,356
REVENUE SUPPORTED
Revenue supported debt & leases(b) 19,165,000 22,467,500 29,258,748 30,458,248 34,384,871 40,473,994 49,395,508 52,205,128 57,621,063 59,763,652
TOTAL DEBT 67,195,569 78,033,071 91,681,747 89,867,533 100,480,170 105,470,995 119,776,136 120,123,868 127,600,001 134,130,008
Less: revenue supported debt (19,165,000) (22,467,500) (29,258,748) (30,458,248) (34,384,871) (40,473,994) (46,395,508) (52,205,128) (57,621,063) (59,763,652)
NET DIRECT DEBT 48,030,569 55,565,571 62,422,999 59,409,285 66,095,299 64,997,001 73,380,628 67,918,740 69,978,938 74,366,356
Overlapping debt(c) 389,520,967 320,516,959 237,915,697 232,154,034 246,190,489 237,949,657 233,949,409 245,533,153 238,339,565 193,880,494
NET DIRECT & OVERLAPPING DEBT 437,551,536 376,082,530 300,338,696 291,563,319 312,285,788 302,946,658 307,330,037 313,451,893 308,318,503 268,246,850
PROPERTY TAX BASEEstimated actual value $ 6,603,627,466 $ 6,295,517,545 $ 5,894,237,333 $ 5,636,975,792 $ 5,327,488,265 $ 5,105,744,064 $ 4,941,833,867 $ 4,725,859,276 $ 4,565,229,650 $ 4,551,808,439
Source: City of Bowling Green, Department of Finance
Notes:(a) Does not include compensated absences, contingent liabilities, landfill post closure, bond premiums, deferred charges and discounts. Does not include debt service paid by WKU
(See footnote on preceeding page) or ITA debt obligations. See the Notes to the Financial Statements located in the Comprehensive Annual Financial Report (CAFR).(b) In addition to enterprise supported obligations (see the prior and following tables), includes that portion of the ITA debt which is the responsibility of the City (50%). Also includes debt issued for WKU that is completely
self-supporting.(c) Overlapping debt includes the City's portion of the debt of Bowling Green Independent Schools, Warren County, Warren County Schools, and Bowling Green Municipal Utilities.
See accompanying independent auditor's report.
162

Schedule 13City of Bowling Green, KentuckyGeneral Debt - Governmental FundsFuture Debt Services Requirements as of June 30th
Fiscal Year Principal Interest Total(a)
2021 $ 7,040,000 $ 1,905,479 $ 8,945,4792022 7,210,000 1,687,501 8,897,5012023 7,210,000 1,470,782 8,680,7822024 7,460,000 1,239,850 8,699,8502025 4,605,000 1,029,625 5,634,6252026 4,800,000 855,657 5,655,6572027 2,115,000 679,340 2,794,3402028 2,195,000 605,888 2,800,8882029 1,800,000 529,338 2,329,3382030 1,850,000 476,538 2,326,5382031 1,910,000 418,363 2,328,3632032 1,970,000 361,063 2,331,0632033 2,040,000 290,513 2,330,5132034 1,235,000 217,413 1,452,4132035 1,270,000 180,363 1,450,3632036 1,310,000 142,263 1,452,2632037 1,360,000 89,863 1,449,8632038 1,405,000 45,663 1,450,663
Source: City of Bowling Green, Department of Finance
Note:
(a) Does not include compensated absences, contingent liabilities, landfill post closure, bond premiums, deferred charges and discounts.Includes the ITA and WKU debt.
See accompanying independent auditor's report.163

Schedule 14City of Bowling Green, KentuckyInter-Modal Transportation Authority DebtFuture Debt Services Requirements as of June 30th
Principal(a) Interest
FiscalYear
2016ABonds
2016BBonds
TotalPrincipal(b)
2016ABonds
2016BBonds
TotalInterest
Total DebtService
2021 $ 1,545,000 $ 310,000 $ 1,855,000 $ 116,474 $ 26,632 $ 143,106 $ 1,998,1062022 1,580,000 315,000 1,895,000 84,001 25,106 109,107 2,004,1072023 1,600,000 325,000 1,925,000 50,955 15,218 66,173 1,991,1732024 1,645,000 330,000 1,975,000 17,236 5,099 22,335 1,997,335
Source: City of Bowling Green, Department of Finance
Notes:
(a) This debt is a general obligation of the City, but payable from revenues received from ITA transactions. The City is jointly responsible with Warren County, KY for debt service on the bondson a 50%-50% basis. The gross amount is displayed since the City is the issuer of the bonds.
(b) Does not include compensated absences, contingent liabilities, landfill post closure, bond premiums, deferred charges and discounts.
See accompanying independent auditor's report.
164
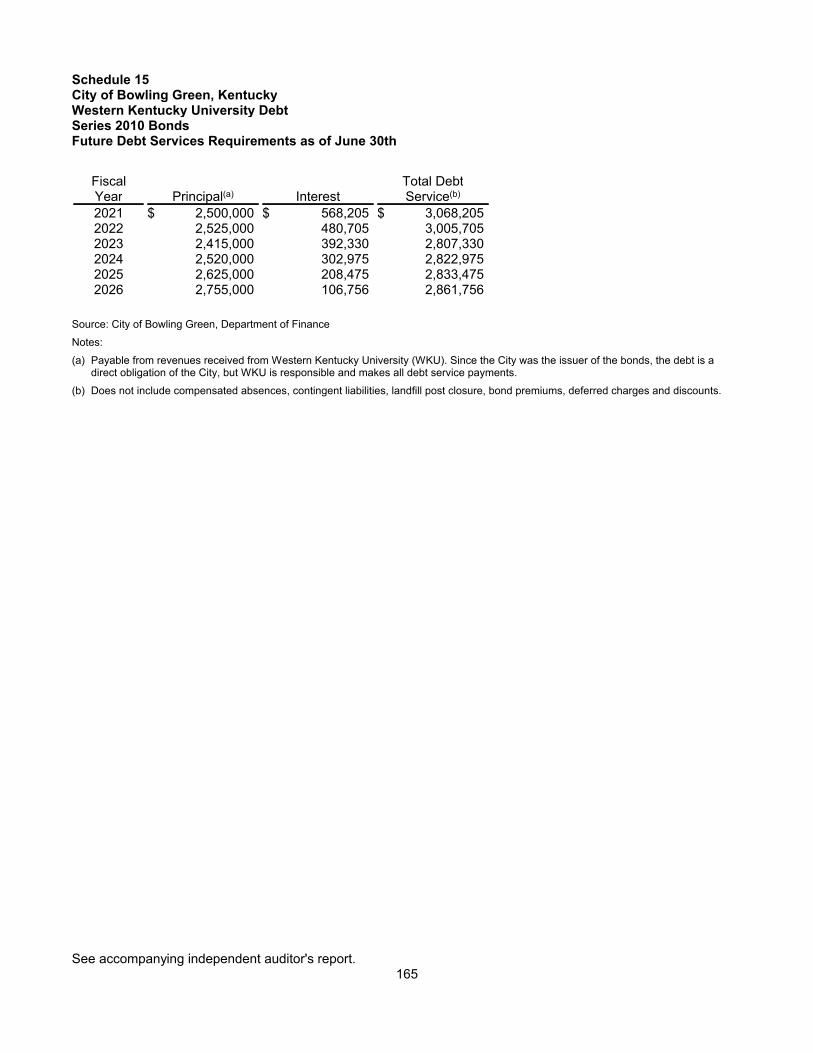
Schedule 15City of Bowling Green, KentuckyWestern Kentucky University DebtSeries 2010 BondsFuture Debt Services Requirements as of June 30th
FiscalYear Principal(a) Interest
Total DebtService(b)
2021 $ 2,500,000 $ 568,205 $ 3,068,2052022 2,525,000 480,705 3,005,7052023 2,415,000 392,330 2,807,3302024 2,520,000 302,975 2,822,9752025 2,625,000 208,475 2,833,4752026 2,755,000 106,756 2,861,756
Source: City of Bowling Green, Department of Finance
Notes:
(a) Payable from revenues received from Western Kentucky University (WKU). Since the City was the issuer of the bonds, the debt is adirect obligation of the City, but WKU is responsible and makes all debt service payments.
(b) Does not include compensated absences, contingent liabilities, landfill post closure, bond premiums, deferred charges and discounts.
See accompanying independent auditor's report.165

Schedule 16City of Bowling Green, KentuckyRatios of General Bonded Debt OutstandingLast Ten Fiscal Years
Fiscal Year
2020 2019 2018 2017 2016 2015 2014 2013 2012 2011
Governmental ActivitiesGeneral obligation bonds $ 65,710,569 $ 73,245,571 $ 78,269,251 $ 87,575,068 $ 96,522,378 $ 101,557,970 $ 102,591,166 $ 108,501,710 $ 119,325,846 $ 124,964,655Capital leases 4,585,310 3,513,596 4,018,748 794,217 1,755,421 2,119,501 2,459,472 2,871,504 3,412,034 3,944,088Special assessment bonds - - - - - - - - 112,506 118,419
Net general bonded debt $ 70,295,879 $ 76,759,167 $ 82,287,999 $ 88,369,285 $ 98,277,799 $ 103,677,471 $ 105,050,638 $ 111,373,214 $ 122,850,386 $ 129,027,162
Property values $ 6,603,627,466 $ 6,295,517,545 $ 5,894,237,333 $ 5,636,975,792 $ 5,327,488,265 $ 5,105,744,064 $ 4,941,833,867 $ 4,725,859,276 $ 4,565,229,850 $ 4,551,808,439
Percentage of estimatedactual taxable value of property %1.06 %1.16 %1.40 %1.57 %1.84 %2.03 %2.13 %2.33 %2.70 %2.94
Per capita(a) 996 1,071 1,226 1,354 1,545 1,672 1,769 1,902 2,165 2,194
Notes:
Details regarding the City's outstanding debt can be found in the Notes to the Financial Statements.
(a) Population data can be found in Schedule 20.
See accompanying independent auditor's report166

Schedule 17City of Bowling Green, KentuckyDirect and Overlapping Governmental Activities DebtAs of June 30, 2020
Governmental UnitDebt
Outstanding(a)
EstimatedPercentageApplicable(b)
Estimated Share ofOverlapping Debt
Bowling Green Independent Schools $ 46,335,000 %100.00 $ 46,335,000
Warren County 76,800,060 %57.19 43,921,955
Warren County Schools 240,160,583 %49.78 119,551,938
Bowling Green Municipal Utilities 131,681,505 %100.00 131,681,505
Subtotal, overlapping debt 341,490,398
City direct debt 65,711,359
Total direct and overlapping debt $ 407,201,757
Sources:
Bowling Green Municipal Utilities
Bowling Green Board of Education
Warren County Treasurer
Warren County Board of Education
Notes:
(a) Gross governmental debt, less revenues.
(b) Determined by ratio of assessed valuation of property subject to taxation in overlapping unit to valuation of property subject to taxation inthe City of Bowling Green. (Warren County ratio = City + Annex/All Districts; Warren County Schools = Annex/County + Annex)
See accompanying independent auditor's report.167

City of Bowling Green, KentuckySchedule 18Legal Debt Margin InformationLast Ten Fiscal Years
Legal Debt Margin Calculation for Fiscal Year 2019
Assessed value $6,603,627,466
Debt limit, 10% of assessed value(a) 660,362,747Debt applicable to limit:
General obligation bonds 61,126,049Notes and capital leases from direct borrowings
and placements 4,585,310
Total net debt applicable to limit 65,711,359
Legal debt margin $ 594,651,388
Fiscal Year
2020 2019 2018 2017 2016 2015 2014 2013 2012 2011
Debt limit $ 660,362,747 $ 629,551,755 $ 589,423,733 $ 563,697,579 $ 532,748,827 $ 510,574,406 $ 494,183,387 $ 472,585,928 $ 456,522,985 $ 455,180,844
Less: Total net debt applicable to limit 65,711,359 73,245,571 83,042,121 89,867,533 100,480,170 106,613,965 111,260,639 118,160,163 129,153,378 135,935,233
Legal debt margin $ 594,651,388 $ 556,306,184 $ 506,381,612 $ 473,830,046 $ 432,268,657 $ 403,960,441 $ 382,922,748 $ 354,425,765 $ 327,369,607 $ 319,245,611
Total net debt applicable to the limitas a percentage of debt limit %9.95 %11.63 %14.09 %(15.94) %18.86 %20.88 %22.51 %25.00 %28.29 %29.86
Note:
(a) Under Section 158 of the Constitution of Commonwealth of the Kentucky, the City's outstanding debt is not to exceed 10 percent of total assessed property value.
See accompanying independent auditor's report.
168

Schedule 19City of Bowling Green, KentuckyPledged-Revenue CoverageLast Ten Fiscal Years
Stonehenge Sections I-V(a) Cedar Grove Section IX(a) Lovers Lane(b)
SpecialAssessment Debt Service
SpecialAssessment Debt Service
SpecialAssessment Debt Service
Collections Principal Interest Coverage Collections Principal Interest Coverage Collections Principal Interest Coverage
2011 $ 107,345 $ 40,000 $ 82,560 0.88 $ 28,003 $ 10,000 $ 17,863 1.01 $ 15,385 $ 7,229 $ 8,921 0.952012 131,031 42,000 74,643 1.12 27,112 10,000 17,188 1.00 16,247 7,579 8,571 1.012013 122,336 42,000 77,580 1.02 26,210 10,000 16,513 0.99 15,387 7,946 8,204 0.952014 125,020 46,000 75,143 1.03 28,924 15,000 15,838 0.94 17,385 8,331 7,820 1.082015 116,210 47,000 71,396 0.98 34,039 15,000 14,825 1.14 16,206 8,735 7,416 1.002016 121,669 50,000 68,639 1.03 29,032 15,000 13,813 1.01 16,151 9,157 6,993 1.002017 117,646 51,000 66,675 1.00 29,288 15,000 12,800 1.05 16,151 9,601 6,550 1.002018 119,332 53,000 64,113 1.02 25,796 15,000 11,788 0.96 16,151 10,066 6,085 1.002019 121,852 61,000 60,893 1.00 31,216 20,000 10,775 1.01 16,151 10,553 5,598 1.002020 121,947 63,000 57,373 1.01 28,280 20,000 9,425 0.96 16,236 11,064 5,087 1.01
Notes:
(a) The Stonehenge Sections I-V and Cedar Grove Sections IX special assessment revenues are collected from property owners in each district to fund the development of the subdivisionsand to provide amenities such as sidewalk infrastructure.
(b) Lovers Lane special assessment revenues are collected from property owners to fund the development of underground utilities. This special assessment is new for fiscal year 2008.
See accompanying independent auditor's report.
169
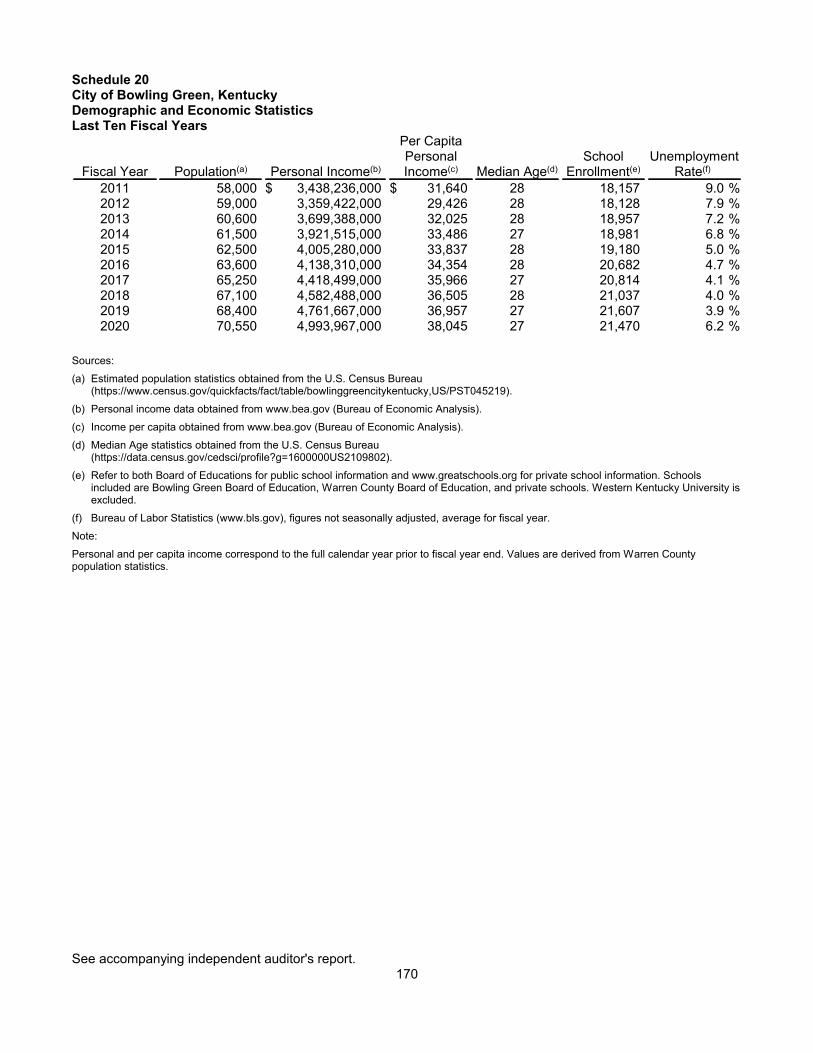
Schedule 20City of Bowling Green, KentuckyDemographic and Economic StatisticsLast Ten Fiscal Years
Fiscal Year Population(a) Personal Income(b)
Per CapitaPersonalIncome(c) Median Age(d)
SchoolEnrollment(e)
UnemploymentRate(f)
2011 58,000 $ 3,438,236,000 $ 31,640 28 18,157 %9.02012 59,000 3,359,422,000 29,426 28 18,128 %7.92013 60,600 3,699,388,000 32,025 28 18,957 %7.22014 61,500 3,921,515,000 33,486 27 18,981 %6.82015 62,500 4,005,280,000 33,837 28 19,180 %5.02016 63,600 4,138,310,000 34,354 28 20,682 %4.72017 65,250 4,418,499,000 35,966 27 20,814 %4.12018 67,100 4,582,488,000 36,505 28 21,037 %4.02019 68,400 4,761,667,000 36,957 27 21,607 %3.92020 70,550 4,993,967,000 38,045 27 21,470 %6.2
Sources:
(a) Estimated population statistics obtained from the U.S. Census Bureau(https://www.census.gov/quickfacts/fact/table/bowlinggreencitykentucky,US/PST045219).
(b) Personal income data obtained from www.bea.gov (Bureau of Economic Analysis).
(c) Income per capita obtained from www.bea.gov (Bureau of Economic Analysis).
(d) Median Age statistics obtained from the U.S. Census Bureau (https://data.census.gov/cedsci/profile?g=1600000US2109802).
(e) Refer to both Board of Educations for public school information and www.greatschools.org for private school information. Schoolsincluded are Bowling Green Board of Education, Warren County Board of Education, and private schools. Western Kentucky University isexcluded.
(f) Bureau of Labor Statistics (www.bls.gov), figures not seasonally adjusted, average for fiscal year.
Note:
Personal and per capita income correspond to the full calendar year prior to fiscal year end. Values are derived from Warren Countypopulation statistics.
See accompanying independent auditor's report.170

Schedule 21City of Bowling Green, KentuckyPrincipal EmployersCurrent Year and Nine Years Ago
2020 2011
Employer Employees Rank
Percentageof Total CityEmployment Employees Rank
Percentageof Total CityEmployment
Commonwealth Health Corporation 3,077 1 %4.70 1,914 2 %2.83Western Kentucky University 2,974 2 %4.55 4,626 1 %6.84BG Metalforming LLC 1,238 3 %1.89 655 8 %0.98General Motors Corporation 1,100 4 %1.68 - -Warren County Board of Education 1,068 5 %1.63 958 5 %1.42Houchens Food Group 1,055 6 %1.61 733 7 %1.08Graves-Gilbert Clinic PSC 982 7 %1.50 - -Henkel Corporation 930 8 %1.42 - -Kentucky State Treasurer 801 9 %1.22 - -Kobe Aluminum Automotive Products 696 10 %1.06 - -Union Underwear Co. LLC - - 1,632 3 %2.41Walmart Associates Inc - - 1,018 4 %1.51Express Services Inc - - 931 6 %1.38City of Bowling Green - - 633 9 %0.94Bowling Green Board of Education - - 613 10 %0.91
Total 13,921 %21.26 13,713 %20.30
Sources:
City Bowling Green, Department of Finance
Bowling Green Area Chamber of Commerce
Bureau of Labor and Statistics (www.bls.gov)
Notes:
- Commonwealth Health Corporation was previously listed as The Medical Center at BG
- Henkel Corporation was previously listed at Sun Products Corporation
See accompanying independent auditor's report.171

Schedule 22City of Bowling Green, KentuckyFull-time City Government Employees by Function/ProgramLast Ten Fiscal Years
Fiscal Year
2020 2019 2018 2017 2016 2015 2014 2013 2012 2011
FUNCTION/PROGRAM
General government 46 43 40 42 42 40 42 41 41 42Administration 8 8 8 9 8 8 8 7 7 7Finance 18 16 14 16 16 15 17 17 18 18Human Resources 7 7 6 6 7 6 6 6 5 6Legal(a) 3 2 2 2 2 2 2 2 2 2Information Technology 10 10 10 9 9 9 9 9 9 9
Public Safety 296 283 268 269 270 269 265 267 266 269Police
Officers 125 116 109 112 115 112 108 110 109 110Civilians 36 35 32 31 30 35 37 37 35 38
FireFirefighters and Officers 132 129 124 123 122 119 117 117 118 117Civilians 3 3 3 3 3 3 3 3 4 4
Public Works 60 59 55 56 55 54 53 53 52 50
Parks and Recreation 54 54 54 53 52 56 54 57 58 57
Neighborhood & Community Services 25 26 25 26 26 26 24 23 23 21
Total 481 465 442 446 445 445 438 441 440 439
Source: City of Bowling Green Department of Finance
Notes:
(a) Temporary overlapping of two full-time City Attorney positions as part of succession planning.
172

Schedule 23City of Bowling Green, KentuckyOperating Indicators by Function/ProgramLast Ten Fiscal Years
Fiscal Year
2020 2019 2018 2017 2016 2015 2014 2013 2012 2011
FUNCTION/PROGRAM
FinanceTax bills sent 22,691 22,587 22,487 22,356 22,352 22,220 21,864 21,703 21,495 21,405Business registrations received 949 1,105 915 848 829 883 1,025 923 801 835
Human ResourcesJob applicants 3,746 3,688 2,435 2,168 2,488 1,559 1,011 1,299 1,394 1,346Position filled 240 370 329 299 234 222 248 234 216 216
Police911 service calls 69,474 66,314 64,822 78,052 81,072 78,465 75,800 61,859 67,842 (a) 65,440Traffic stops 4,385 6,512 6,901 4,490 8,594 9,071 13,189 11,897 13,476 15,650
FireAccident runs 6,639 7,519 7,298 7,251 6,786 6,195 5,634 5,523 5,049 4,836Fire runs 207 218 221 262 236 282 212 278 300 285Fires investigated 37 41 34 30 36 63 17 61 71 (b) 2,845
Public WorksStreet resurfacing (miles) 25 18 18 15 8 7 4 7 12 5Potholes repaired 538 329 598 668 575 826 426 772 392 478
Parks and RecreationFitness & athletic participants 747,175 940,997 995,538 885,472 902,073 883,654 970,174 859,614 927,403 765,462Visits to Community Center 107,687 161,710 159,047 156,913 156,811 229,885 272,470 267,813 269,596 271,722
Neighborhood & CommunityServicesAnti-litter presentations/events - - - - - - - - 2 7Neighborhood meetings conducted 30 36 40 69 69 55 61 63 71 71Households receiving asst 738 743 762 698 695 743 719 725 726 723Bldg/electrical & code inspections 11,993 13,816 12,731 13,236 13,360 10,796 12,264 12,170 9,912 8,804Animal control calls 1,947 2,698 2,542 2,489 (c) 2,489 2,317 2,788 2,027 3,203 3,176
Source: Various City of Bowling Green departments.
Notes:(a) Beginning in 2012, Public Safety became the answering point for both landline and cell phone 911 calls in Warren County.(b) Effective 2012, the Fire Department began tracking fire investigations rather than fire inspections.(c) Effective 2017, Animal Control moved to the Neighborhood and Community Services Department from the Police Department.
See accompanying independent auditor's report.
173

Schedule 24City of Bowling Green, KentuckyCapital Asset Statistics by Function/ProgramLast Ten Fiscal Years
Fiscal Year
2020 2019 2018 2017 2016 2015 2014 2013 2012 2011
FUNCTION/PROGRAM
PolicePolice Stations 1 1 1 1 1 1 1 1 1 1
FireFire stations 6 6 6 6 6 6 6 6 6 6Training centers 1 1 1 1 1 1 1 1 1 1
Public WorksStreets (miles) 269 266 266 264 262 257 264 258 266 265Sidewalks (miles) 147 140 136 (c) 119 114 113 112 112 109 104Alleys (miles) 15 15 15 15 15 15 15 (b) 19 17 17
Parks and RecreationNumber of parks 21 21 22 22 22 21 20 20 25 25Number of facilities 7 7 7 7 7 7 7 7 (a) - -Acreage 970 970 970 970 970 974 972 972 972 970Playgrounds 22 22 22 22 22 22 21 22 22 22Baseball/softball diamonds 11 11 11 11 11 11 11 11 11 11Soccerfields 19 19 19 14 14 14 13 13 13 13Community centers 3 3 3 3 3 3 3 3 3 3
Neighborhood & CommunityServicesBuilding permits issued 2,060 2,284 2,155 2,296 2,193 2,003 1,824 1,868 1,609 1,515
Sources: Various City of Bowling Green departments.
Notes:
(a) Effective with FY2013, parks and facilities are categorized separately.
(b) In FY2014, the Public Works Department updated mapping, which decreased alley miles.
(c) The increase in sidewalk miles is due to the recalculation of miles reported.
See accompanying independent auditor's report.
174

175
City of Bowling Green, Kentucky
Single Audit Reports Under
Uniform Guidance
Year Ended June 30, 2020

176
Independent Auditor's Report on Internal Control Over Financial Reporting and on Compliance and Other Matters Based on an Audit of Financial Statements Performedin Accordance with Government Auditing Standards
Honorable Bruce Wilkerson, Mayorand Commissioners
City of Bowling Green
We have audited, in accordance with the auditing standards generally accepted in the United States of America and the standards applicable to financial audits contained in Government Auditing Standards, issued by the Comptroller General of the United States, the financial statements of the governmental activities, the business-type activities, the aggregate discretely presented component unit, each major fund, and the aggregate remaining fund information of the City of Bowling Green, Kentucky as of and for the year ended June 30, 2020, and the related notes to the financial statements, which collectively comprise the City of Bowling Green, Kentucky's basic financial statements, and have issued our report thereon dated November 9, 2020.
Internal Control over Financial Reporting
In planning and performing our audit of the financial statements, we considered the City of Bowling Green, Kentucky's internal control over financial reporting (internal control) to determine the audit procedures that are appropriate in the circumstances for the purpose of expressing our opinions on the financial statements, but not for the purpose of expressing an opinion on the effectiveness of the City of Bowling Green, Kentucky's internal control. Accordingly, we do not express an opinion on the effectiveness of the City of Bowling Green, Kentucky'sinternal control.
A deficiency in internal control exists when the design or operation of a control does not allow managementor employees, in the normal course of performing their assigned functions, to prevent, or detect and correct, misstatements on a timely basis. A material weakness is a deficiency, or a combination of deficiencies, in internal control, such that there is a reasonable possibility that a material misstatement of the entity's financial statements will not be prevented or detected and corrected on a timely basis. A significant deficiency is a deficiency,or a combination of deficiencies, in internal control that is less severe than a material weakness, yet important enough to merit attention by those charged with governance.
Our consideration of internal control over financial reporting was for the limited purpose described in the first paragraph of this section and was not designed to identify all deficiencies in internal control over financial reportingthat might be material weaknesses or, significant deficiencies. Given these limitations, during our audit we did not identify any deficiencies in internal control over financial reporting that we consider to be material weaknesses. However, material weaknesses may exist that have not been identified.

177
Independent Auditor's Report on Internal Control Over Financial Reporting and on Compliance and Other Matters Based on an Audit of Financial Statements Performed in Accordance with Government Auditing Standards (Continued)
Compliance and Other Matters
As part of obtaining reasonable assurance about whether the City of Bowling Green, Kentucky's financial statements are free from material misstatement, we performed tests of its compliance with certain provisions of laws, regulations, contracts, and grant agreements, noncompliance with which could have a direct and material effect on the determination of financial statement amounts. However, providing an opinion on compliance with those provisions was not an objective of our audit and, accordingly, we do not express such an opinion. The results of our tests disclosed no instances of noncompliance or other matters that are required to be reported under Government Auditing Standards.
Purpose of this Report
The purpose of this report is solely to describe the scope of our testing of internal control and compliance and the results of that testing, and not to provide an opinion on the effectiveness of the entity's internal control or on compliance. This report is an integral part of an audit performed in accordance with Government Auditing Standards in considering the entity's internal control and compliance. Accordingly, this communication is not suitable for any other purpose.
Lexington, KentuckyNovember 9, 2020
178
Independent Auditor's Report on Compliance for Each Major Federal Program and Report onInternal Control Over Compliance in Accordance with the Uniform Guidance
Honorable Bruce Wilkerson, Mayorand Commissioners
City of Bowling Green
Report on Compliance for Each Major Federal Program
We have audited the City of Bowling Green, Kentucky's compliance with the types of compliance requirements described in the OMB Compliance Supplement that could have a direct and material effect on each of the City of Bowling Green, Kentucky's major federal programs for the year ended June 30, 2020. The City of Bowling Green, Kentucky's major federal programs are identified in the summary of auditor's results section of the accompanying schedule of findings and questioned costs.
Management's Responsibility
Management is responsible for compliance with federal statutes, regulations, and the terms and conditions of its federal awards applicable to its federal programs.
Auditor's Responsibility
Our responsibility is to express an opinion on compliance for each of the City of Bowling Green, Kentucky's major federal programs based on our audit of the types of compliance requirements referred to above. We conducted our audit of compliance in accordance with auditing standards generally accepted in the United States of America; the standards applicable to financial audits contained in Government Auditing Standards, issued by the Comptroller General of the United States; and the audit requirements of Title 2 U.S. Code of Federal Regulations ("CFR") Part 200, Uniform Administrative Requirements, Cost Principles, and Audit Requirements for Federal Awards (Uniform Guidance). Those standards and the Uniform Guidance require that we plan and perform the audit to obtain reasonable assurance about whether noncompliance with the types of compliance requirements referred to above that could have a direct and material effect on a major federal program occurred. An audit includes examining, on a test basis, evidence about the City of Bowling Green, Kentucky's compliance with those requirements and performing such other procedures as we considered necessary in the circumstances.
We believe that our audit provides a reasonable basis for our opinion on compliance for each major federal program. However, our audit does not provide a legal determination of the City of Bowling Green, Kentucky'scompliance.

179
Independent Auditor's Report on Compliance for Each Major Federal Program and Report on Internal Control Over Compliance in Accordance with the Uniform Guidance (Continued)
Opinion on Each Major Federal Program
In our opinion, the City of Bowling Green, Kentucky complied, in all material respects, with the types of compliance requirements referred to above that could have a direct and material effect on each of its major federal programs for the year ended June 30, 2020.
Report on Internal Control over Compliance
Management of the City of Bowling Green, Kentucky is responsible for establishing and maintaining effective internal control over compliance with the types of compliance requirements referred to above. In planning and performing our audit of compliance, we considered the City of Bowling Green, Kentucky's internal control over compliance with the types of requirements that could have a direct and material effect on each major federal program as a basis for designing auditing procedures that are appropriate in the circumstances for the purpose of expressing an opinion on compliance for each major federal program and to test and report on internal control over compliance in accordance with the Uniform Guidance, but not for the purpose of expressing an opinion on the effectiveness of internal control over compliance. Accordingly, we do not express an opinion on the effectiveness of the City of Bowling Green, Kentucky's internal control over compliance.
A deficiency in internal control over compliance exists when the design or operation of a control over compliance does not allow management or employees, in the normal course of performing their assigned functions, to prevent, or detect and correct, noncompliance with a type of compliance requirement of a federal program on a timely basis. A material weakness in internal control over compliance is a deficiency, or combination of deficiencies, in internal control over compliance, such that there is a reasonable possibility that material noncompliance with a type of compliance requirement of a federal program will not be prevented, or detected and corrected, on a timely basis. A significant deficiency in internal control over compliance is a deficiency, or a combination of deficiencies, in internal control over compliance with a type of compliance requirement of a federal program that is less severe than a material weakness in internal control over compliance, yet important enough to merit attention by those charged with governance.
Our consideration of internal control over compliance was for the limited purpose described in the first paragraph of this section and was not designed to identify all deficiencies in internal control over compliance that might be material weaknesses or significant deficiencies. We did not identify any deficiencies in internal control over compliance that we consider to be material weaknesses. However, material weaknesses may exist that were not identified.
The purpose of this report on internal control over compliance is solely to describe the scope of our testing of internal control over compliance and the results of that testing based on the requirements of the Uniform Guidance. Accordingly, this report is not suitable for any other purpose.
Lexington, KentuckyNovember 9, 2020

City of Bowling Green, KentuckySchedule of Expenditures of Federal AwardsYear Ended June 30, 2020
See accompanying independent auditor's report and notesto the schedule of expenditures of federal awards.
180
Federal Pass-through Pass-through Total
CFDA Entity Identifying to Sub- Federal
Number Number recipients Expenditures
U.S. ENVIRONMENTAL PROTECTION AGENCY
Direct programs
Brownsfield Assessment and Cleanup Cooperative Agreements 66.818 N/A -$ 191,119$
U.S. DEPARTMENT OF TRANSPORTATION
Direct programs
Federal Transit Cluster
Federal Transit Formula Grants 20.507 N/A 1,043,266 1,043,266
Pass through Kentucky Transportation Cabinet
Federal Transit Cluster
Bus and Bus Facilities Formula Program 20.526 KY-34-002 198,595 198,595
Total Federal Transit Cluster 1,241,861 1,241,861
Direct programs
Transit Service Programs Cluster
Enhanced Mobility of Seniors and Individuals with Disabilities 20.513 N/A 302 302
Pass through Kentucky Transportation Cabinet
Highway and Planning Construction Cluster
Highway Planning and Construction 20.205 03-03206 - 106,045
Total U.S. Department of Transportation 1,242,163 1,348,208
U.S. DEPARTMENT OF HOUSING AND URBAN DEVELOPMENT
Direct programs
Housing Voucher Cluster
Section 8 Administrative 14.871 N/A - 445,368
Section 8 Housing Choice Vouchers 14.871 N/A - 2,945,782
Section 8 Mainstream Admin 14.879 N/A - 2,497
Section 8 Mainstream HAP 14.879 N/A - 10,997
Total Housing Voucher Cluster - 3,404,644
CDBG - Entitlement Cluster
Community Development Block Grants/Entitlement Grants 14.218 N/A 258,580 543,759
Total U.S. Department of Housing and Urban Development 258,580 3,948,403
Federal Grantor/Pass-through Grantor/Program or Cluster Title

City of Bowling Green, KentuckySchedule of Expenditures of Federal Awards (Continued)Year Ended June 30, 2020
See accompanying independent auditor's report and notesto the schedule of expenditures of federal awards.
1�1
Federal Pass-through Pass-through Total
CFDA Entity Identifying to Sub- Federal
Number Number recipients Expenditures
U.S. DEPARTMENT OF HOMELAND SECURITY
Direct programs
Staffing for Adequate Fire and Emergency Response 97.083 N/A - 542,794
Pass through Kentucky Office of Homeland Security
Homeland Security Grant Program 97.067 17-174 - 9,177
Total U.S. Department of Homeland Security - 551,971
U.S. DEPARTMENT OF JUSTICE
Direct programs
Bulletproof Vest Partnership Program 16.607 N/A - 6,893
Direct programs
2020 CESF 16.034 N/A - 9,210
Direct programs
Edward Byrne Memorial Justice Assistance Grant (JAG) Program 16.738 N/A - 46,663
Total U.S. Department of Justice - 62,765
OFFICE OF NATIONAL DRUG CONTROL POLICY
Pass through Appalachia HIDTA
High Intensity Drug Trafficking Areas Program 95.001 G12AP001A - 27,674
U.S. DEPARTMENT OF HEALTH AND HUMAN SERVICES
Pass through University of Kentucky Research Foundation
Paralysis Resource Center 93.325 3200001940-10-090 - 1,075
U.S. DEPARTMENT OF THE TREASURY
Pass through Department for Local Government
Covid-19 Relief Fund 21.019 C145 - 4,918,471
Total Expenditures of Federal Awards 1,500,743$ 11,049,687$
Federal Grantor/Pass-through Grantor/Program or Cluster Title

City of Bowling Green, KentuckyNotes to the Schedule of Expenditures of Federal AwardsYear Ended June 30, 2020
182
Note A - Basis of Presentation
The accompanying schedule of expenditures of federal awards includes the federal award activity of the City of Bowling Green, Kentucky, under programs of the federal government for the year ended June 30, 2020 in accordance with the requirements of Title 2 U. S. Code of Federal Regulations Part 200, Uniform Administrative Requirements, Cost Principles, and Audit Requirements for Federal awards ("Uniform Guidance"). Because the schedule presents only a selected portion of the operations of the City of Bowling Green, Kentucky, it is not intended to and does not present the financial position, changes in net assets, or cash flows of the City.
Note B - Summary of Significant Accounting Policies
Expenditures reported on the Schedule are reported on the modified accrual basis of accounting. Such expenditures are recognized following the cost principles contained in Title 2 U. S. Code of Federal Regulations Part 200, Uniform Administrative Requirements, Cost Principles and Audit Requirements for Federal Awards, wherein certain types of expenditures are not allowed or are limited as to reimbursement.
Note C - Indirect Cost Rate
The City of Bowling Green, Kentucky has not elected to use the 10-percent de minimis indirect cost rate allowed under the Uniform Guidance.
Note D - CARES Funding
The City of Bowling Green, Kentucky received CARES related funding for the year ending June 30, 2020 under the following programs:
CFDA 21.019 Covid-19 Relief Fund $ 4,918,471
CFDA 20.507 Federal Transit Formula Grants 229,906
CFDA 14.871 Section 8 Administrative 9,327
Total 5,157,704$

City of Bowling Green, KentuckySchedule of Findings & Questioned CostsYear Ended June 30, 2020
183
Section I - Summary of Auditor's Results
1. The auditor's report expresses unmodified opinions on the financial statements of the City of Bowling Green,Kentucky.
2. No significant deficiencies were disclosed during the audit of the financial statements.
3. No instances of noncompliance material to the financial statements of the City of Bowling Green, Kentucky,which would be required to be reported in accordance with Government Auditing Standards, were disclosedduring the audit.
4. No significant deficiencies in internal control over major federal award programs were disclosed during theaudit.
5. The auditor's report on compliance for the major federal award programs for the City of Bowling Green,Kentucky expresses an unmodified opinion on all major federal programs.
6. There were no audit findings that are required to be reported in accordance with Uniform Guidance 516(a).
7. The programs tested as major programs included:
CFDA Number(s) Name of Federal Program or Cluster
14.871 Housing Voucher Cluster21.019 Covid-19 Relief Fund
8. The threshold used for distinguishing between Type A and B programs was $750,000.
9. The City of Bowling Green, Kentucky did qualify as a low-risk auditee.

City of Bowling Green, KentuckySchedule of Findings and Questioned Costs (Continued)Year Ended June 30, 2020
1��
Section II - Financial Statement of Findings
No matters were reported.
Section III - Major Federal Award Findings and Questioned Costs
No matters were reported.

185
City of Bowling Green, KentuckySchedule of Prior Year Audit FindingsYear Ended June 30, 2020
No matters were reported.