Embed Size (px)
Citation preview


Document Control
Document ID: asset management _ asset management plan _ draft open space _ michelle watson
Rev No Date Revision Details Author Reviewer Approver
1.0 01/10/10 Initial draft TB NG/AP -
1.1 07/11/10 Second draft, feedback from Council Staff
TB NG -
1.2 13/11/10 Revision of prediction models TB NG -
1.5 19/5/14 Revision for Final Draft MW LM PM
1.8 18/5/15 Update to NAMS Plus 3 Format MW SL JFB
2.0 16/3/16 Update as a review of the LTFP and risks MW SL JFB
© Copyright 2012 – All rights reserved.
The Institute of Public Works Engineering Australia.
www.ipwea.org.au/namsplus

CESSNOCK CITY COUNCIL – OPEN SPACE and OTHER STRUCTURES ASSET MANAGEMENT PLAN DOC2013/005329
TABLE OF CONTENTS 1. EXECUTIVE SUMMARY ...................................................................................... 2
Context ..................................................................................................................... 2 What does it Cost? ................................................................................................... 2 What we will do ........................................................................................................ 3 What we cannot do ................................................................................................... 3 Managing the Risks .................................................................................................. 3 Confidence Levels .................................................................................................... 3 The Next Steps ......................................................................................................... 3
What can we do? ..................................................................................................... 5 2. INTRODUCTION .................................................................................................. 6
2.1 Background ................................................................................................... 6 2.2 Goals and Objectives of Asset Management ................................................ 8 2.3 Plan Framework ............................................................................................ 8 2.4 Core and Advanced Asset Management ..................................................... 10 2.5 Community Consultation ............................................................................. 10
3. LEVELS OF SERVICE ....................................................................................... 10 3.1 Customer Research and Expectations ........................................................ 10 3.2 Strategic and Corporate Goals .................................................................... 11 3.3 Legislative Requirements ............................................................................ 12 3.4 Current Levels of Service ............................................................................ 15 3.4.1 Community Levels of Service ...................................................................... 15 3.5 Technical Levels of Service ......................................................................... 17
4. FUTURE DEMAND ............................................................................................. 19 4.1 Demand Drivers ........................................................................................... 19 4.2 Demand Forecast ........................................................................................ 19 4.3 Demand Impact on Assets .......................................................................... 19 4.4 Demand Management Plan ......................................................................... 21 4.5 Asset Programs to meet Demand ............................................................... 21
5. LIFECYCLE MANAGEMENT PLAN ................................................................... 22 5.1 Background Data ......................................................................................... 22 5.2 Infrastructure Risk Management Plan ......................................................... 26 5.3 Routine Operations and Maintenance Plan ................................................. 29 5.4 Renewal/Replacement Plan ........................................................................ 33 5.5 Creation/Acquisition/Upgrade Plan .............................................................. 38 5.6 Disposal Plan ............................................................................................... 39 5.7 Service Consequences and Risks ............................................................... 39
6. FINANCIAL SUMMARY ...................................................................................... 40 6.1 Financial Statements and Projections ......................................................... 41 6.2 Funding Strategy ......................................................................................... 47 6.3 Valuation Forecasts ..................................................................................... 47 6.4 Key Assumptions made in Financial Forecasts ........................................... 49 6.5 Forecast Reliability and Confidence ............................................................ 49
7. PLAN IMPROVEMENT AND MONITORING ...................................................... 50 7.1 Status of Asset Management Practices ....................................................... 50 7.2 Improvement Program ................................................................................. 52 7.3 Monitoring and Review Procedures ............................................................. 53 7.4 Performance Measures ............................................................................... 53
8. REFERENCES ................................................................................................... 54 9. APPENDICES ..................................................................................................... 55 Appendix A Maintenance Response Levels of Service ........................................... 56 Appendix B 4 Year Program: Excerpt CCC Revised Delivery Program 2013-17 .... 56 Appendix C Budgeted Expenditures Accommodated in LTFP ($000) ..................... 57 Appendix D Abbreviations ........................................................................................ 58 Appendix E Glossary ............................................................................................... 59

‐ 2 ‐
CESSNOCK CITY COUNCIL – OPEN SPACE and OTHER STRUCTURES ASSET MANAGEMENT PLAN DOC2013/005329
1. EXECUTIVE SUMMARY Context Cessnock City Council provides open space and other structure assets to the community, which serve various functions, some of which include; recreation and sporting fields, play grounds and skate parks, passive space, swimming pools, cemeteries and airport assets. The Open Space Service The open space and other structures network comprises1: Assets Categories Quantity
(No or length)
Area m2
Passive Park Locations 59 1,043,172 Active Park Locations 39 977,965 Cemeteries 12 234,208.65Concrete Surfaces 11,149 Concrete Paths 4,807 Assets Categories Quantity (No or
length) Fencing 16,685 klm Irrigation 23 Each Shelters 25 Each BBQ’s 20 Each Picnic Tables 71 Each Seats/bench 72 Each Taps 41 Each Bins 53 Each Drinking Fountains 26 Each Signs 138 Each Cricket Wickets 10 Each Goal Posts/hoops 64 Each Pools 7 Each Sports Lighting (Poles) 174 Each Park Lighting (Poles) 23 Each Skate parks 3 Each Tennis Courts 28 Each Netball Courts 25 Each Basketball Courts 4 Each Playgrounds 41 Each Runway and Taxiways 3163m
1 50% of these assets (both in terms of Quantity and Condition) were verified on site in 2010. A full inventory investigation on site has been undertaken in the 15/16 financial year; however the results of this will be incorporated into the next iteration of this AMP.
These infrastructure assets have a replacement value of $17,474,482.99 What does it Cost? To determine the projected outlays necessary to provide the services covered by this Asset Management Plan (AM Plan/AMP) including; operations, maintenance, renewal and upgrade of existing assets over the 10 year planning period, Council has developed two funding scenarios. Scenario 2, based on feedback received from Community Consultation undertaken in 2015, is the funding required to keep the asset stock in condition 3 “average” or better. Scenario 3 is developed from the available funds outlined in Councils’ Long Term Financial Plan. The following tables highlight Councils’ financial position when considering the projected outlays of scenario 2 “S2” or scenario 3 “S3”:
Open Space_S2_V1
Executive Summary - What does it cost?
($000)
10 year total cost [10 yr Ops, Maint, Renewal & Upgrade Proj Exp]
$31,848
10 year average cost $3,185
10 year total LTFP budget [10 yr Ops, Maint, Renewal & Upgrade LTFP Budget]
$25,988
10 year average LTFP budget $2,599
10 year AM financial indicator 82%
10 year average funding shortfall $-586
Open Space_S3_V1
Executive Summary - What does it cost?
($000)
10 year total cost [10 yr Ops, Maint, Renewal & Upgrade Proj Exp]
$29,199
10 year average cost $2,920
10 year total LTFP budget [10 yr Ops, Maint, Renewal & Upgrade LTFP Budget]
$25,988
10 year average LTFP budget $2,599
10 year AM financial indicator 89%
10 year average funding shortfall $-321
‐ 3 ‐
CESSNOCK CITY COUNCIL – OPEN SPACE and OTHER STRUCTURES ASSET MANAGEMENT PLAN DOC2013/005329
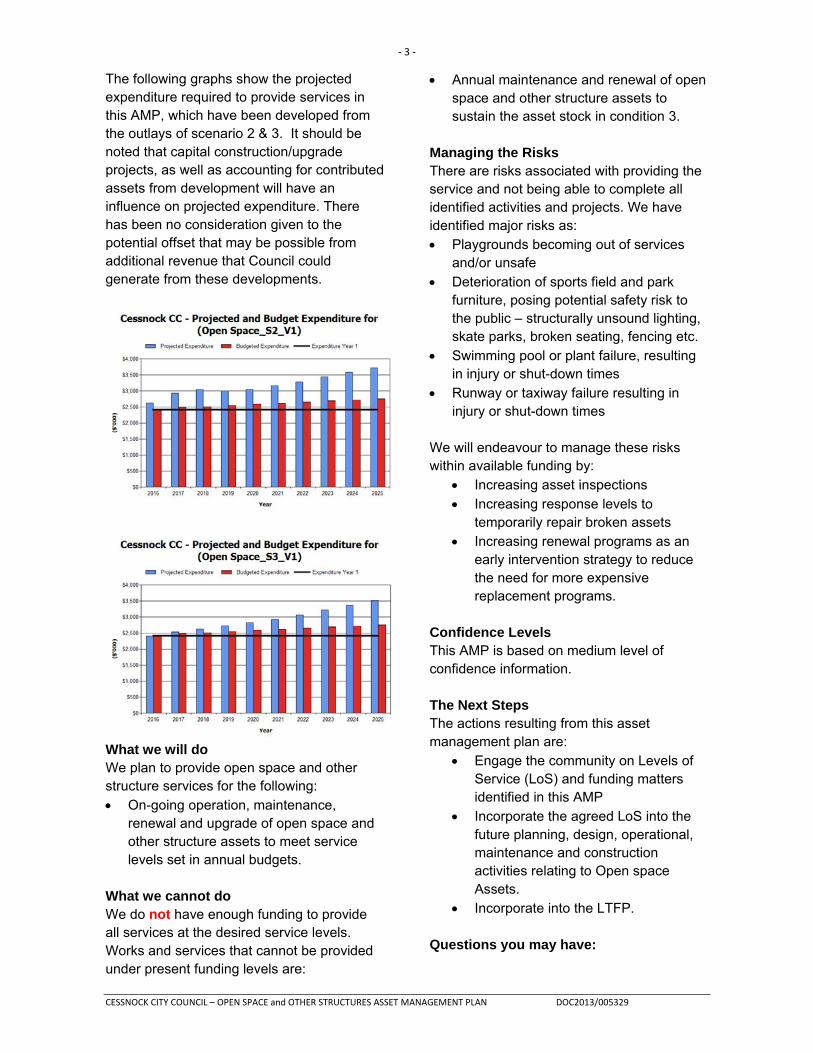
The following graphs show the projected expenditure required to provide services in this AMP, which have been developed from the outlays of scenario 2 & 3. It should be noted that capital construction/upgrade projects, as well as accounting for contributed assets from development will have an influence on projected expenditure. There has been no consideration given to the potential offset that may be possible from additional revenue that Council could generate from these developments.
What we will do We plan to provide open space and other structure services for the following: On-going operation, maintenance,
renewal and upgrade of open space and other structure assets to meet service levels set in annual budgets.
What we cannot do We do not have enough funding to provide all services at the desired service levels. Works and services that cannot be provided under present funding levels are:
Annual maintenance and renewal of open space and other structure assets to sustain the asset stock in condition 3.
Managing the Risks There are risks associated with providing the service and not being able to complete all identified activities and projects. We have identified major risks as: Playgrounds becoming out of services
and/or unsafe Deterioration of sports field and park
furniture, posing potential safety risk to the public – structurally unsound lighting, skate parks, broken seating, fencing etc.
Swimming pool or plant failure, resulting in injury or shut-down times
Runway or taxiway failure resulting in injury or shut-down times
We will endeavour to manage these risks within available funding by:
Increasing asset inspections Increasing response levels to
temporarily repair broken assets Increasing renewal programs as an
early intervention strategy to reduce the need for more expensive replacement programs.
Confidence Levels This AMP is based on medium level of confidence information. The Next Steps The actions resulting from this asset management plan are:
Engage the community on Levels of Service (LoS) and funding matters identified in this AMP
Incorporate the agreed LoS into the future planning, design, operational, maintenance and construction activities relating to Open space Assets.
Incorporate into the LTFP. Questions you may have:

‐ 4 ‐
CESSNOCK CITY COUNCIL – OPEN SPACE and OTHER STRUCTURES ASSET MANAGEMENT PLAN DOC2013/005329
What is this plan about? This asset management plan covers the infrastructure assets that serve the Cessnock City Council community’s open space and other structure needs. These assets include 103 open spaces, 9 cemeteries, 7 swimming pools and 3163 metres of runway/taxiway pavement, over a total area of about 225 hectares, categorised into passive space (recreational use), active space (sporting/play purposes), and cemeteries. Council also owns infrastructure that provides a service to those who frequent these locations (BBQ’s, Seats, Picnic Tables etc.). What is an Asset Management Plan? Asset management planning is a comprehensive process to ensure delivery of services from infrastructure is provided in a financially sustainable manner. An asset management plan details information about infrastructure assets including actions required to provide an agreed level of service in the most cost effective manner. The plan defines the services to be provided, how the services are provided and what funds are required to provide the services. Why is there a funding shortfall? In some instances Council’s open space assets have been constructed by developers and from government grants and are often provided and accepted without consideration of ongoing operations, maintenance and replacement needs. Many of these assets are approaching the later years of their life and require replacement. In addition, services from the assets are decreasing and maintenance costs are increasing. Our present funding levels are insufficient to continue to provide existing services at current levels in the medium term. What options do we have? Resolving the funding shortfall involves several steps: 1. Improving asset knowledge so that data
accurately records the asset inventory, how assets are performing and when
assets are not able to provide the required service levels
2. Improving our efficiency in operating, maintaining, renewing and replacing existing assets to optimise life cycle costs
3. Identifying and managing risks associated with providing services from infrastructure
4. Making trade-offs between service levels and costs to ensure that the community receives the best return from infrastructure
5. Identifying assets surplus to needs for disposal to make saving in future operations and maintenance costs
6. Consulting with the community to ensure that open space services and costs meet community needs and are affordable
7. Developing partnership with other bodies, where available to provide services
8. Seeking additional funding from governments and other bodies to better reflect a ‘whole of government’ funding approach to infrastructure services.
What happens if we don’t manage the shortfall? It is likely that we will have to reduce service levels in some areas, unless new sources of revenue are found. For open space and other structure assets, the service level reduction may include: • Reduction in asset maintenance. • Removal of existing assets. • Decrease in LoS for open space and
other structure assets, examples below.
Out of service park fittings

‐ 5 ‐
CESSNOCK CITY COUNCIL – OPEN SPACE and OTHER STRUCTURES ASSET MANAGEMENT PLAN DOC2013/005329
Aging park furniture
Unfit for use, functionally obsolete
What can we do?
We can develop options, costs and priorities for future open space and other structure services, consult with the community to plan future services to match the community service needs with ability to pay for services and maximise community benefits against costs.

‐ 6 ‐
CESSNOCK CITY COUNCIL – OPEN SPACE and OTHER STRUCTURES ASSET MANAGEMENT PLAN DOC2013/005329
2. INTRODUCTION 2.1 Background
This asset management plan is required to demonstrate responsive management of assets (and services provided from assets), compliance with regulatory requirements, and to communicate funding needed to provide the required levels of service over a 10 year planning period. The asset management plan follows the format for AMPs recommended in Section 4.2.6 of the International Infrastructure Management Manual. The asset management plan is to be read with the Council’s Asset Management Policy, Asset Management Strategy and the following associated planning documents:
Cessnock 2023 – Cessnock Community Strategic Plan Cessnock City Council Revised Delivery Plan 2013-2017 Cessnock City Council Draft Operational Plan 2016-2017 Cessnock City Council Annual Reports Cessnock City Council Community Research Survey 2014 2012-2013 Infrastructure Asset Revaluation Manual Cessnock City Council, Recreation and Open Space Strategic Plan 2009-2014 NSW OLG Integrated Planning Guidelines and manual 2013 Cessnock City Council 2014 Resident Satisfaction Survey Results Cessnock City Council 2015 Asset Management Research Satisfaction Survey Results
The infrastructure assets covered by this asset management plan are shown in Table 2.1. These assets are used to provide various community services, such as; sporting facilities, passive open space, and cemeteries.
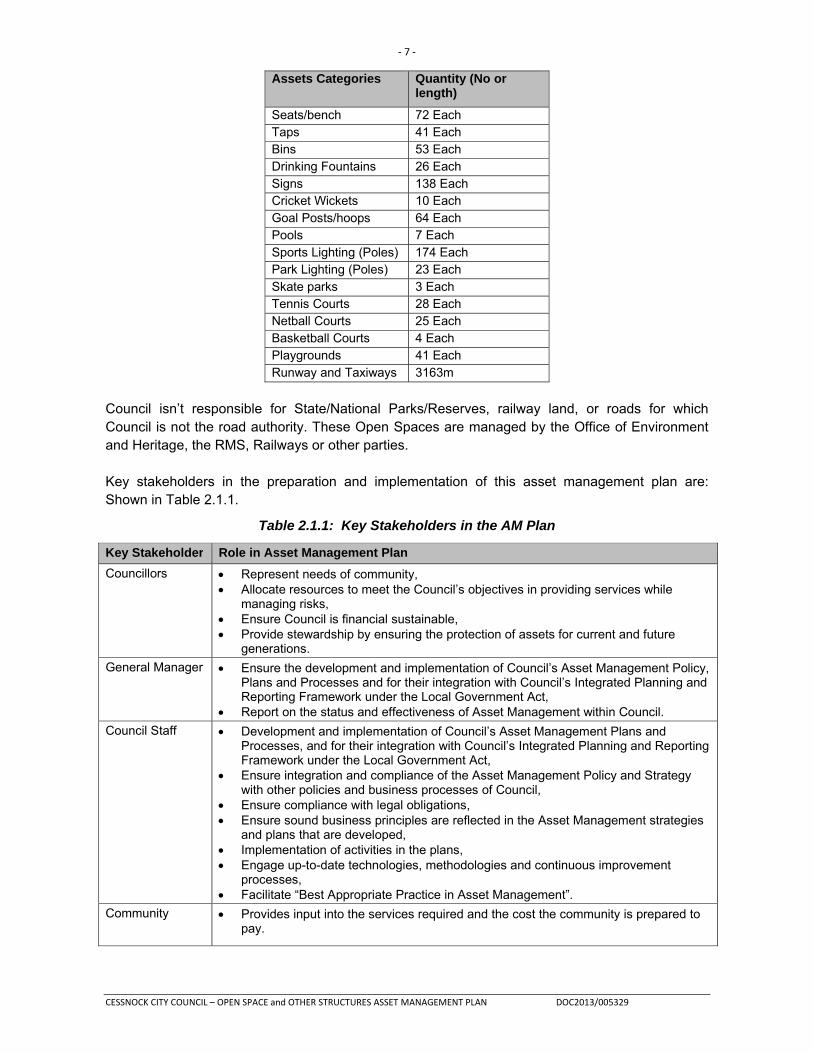
Table 2.1: Assets covered by this Plan2 Assets Categories Quantity
(No or length)
Area m2
Passive Park Locations 59 1,043,172 Active Park Locations 39 977,965 Cemeteries 12 234,208.65Concrete Surfaces 11,149 Concrete Paths 4,807 Assets Categories Quantity (No or
length)
Fencing 16,685 klm Irrigation 23 Each Shelters 25 Each BBQ’s 20 Each Picnic Tables 71 Each
2 50% of these assets (both in terms of Quantity and Condition) were verified on site in 2010. A full inventory investigation on site has been undertaken in the 15/16 financial year; however the results of this will be incorporated into the next iteration of this AMP.
‐ 7 ‐
CESSNOCK CITY COUNCIL – OPEN SPACE and OTHER STRUCTURES ASSET MANAGEMENT PLAN DOC2013/005329
Assets Categories Quantity (No or length)
Seats/bench 72 Each Taps 41 Each Bins 53 Each Drinking Fountains 26 Each Signs 138 Each Cricket Wickets 10 Each Goal Posts/hoops 64 Each Pools 7 Each Sports Lighting (Poles) 174 Each Park Lighting (Poles) 23 Each Skate parks 3 Each Tennis Courts 28 Each Netball Courts 25 Each Basketball Courts 4 Each Playgrounds 41 Each Runway and Taxiways 3163m
Council isn’t responsible for State/National Parks/Reserves, railway land, or roads for which Council is not the road authority. These Open Spaces are managed by the Office of Environment and Heritage, the RMS, Railways or other parties. Key stakeholders in the preparation and implementation of this asset management plan are: Shown in Table 2.1.1.
Table 2.1.1: Key Stakeholders in the AM Plan
Key Stakeholder Role in Asset Management Plan
Councillors Represent needs of community, Allocate resources to meet the Council’s objectives in providing services while
managing risks, Ensure Council is financial sustainable, Provide stewardship by ensuring the protection of assets for current and future
generations.
General Manager Ensure the development and implementation of Council’s Asset Management Policy, Plans and Processes and for their integration with Council’s Integrated Planning and Reporting Framework under the Local Government Act,
Report on the status and effectiveness of Asset Management within Council.
Council Staff Development and implementation of Council’s Asset Management Plans and Processes, and for their integration with Council’s Integrated Planning and Reporting Framework under the Local Government Act,
Ensure integration and compliance of the Asset Management Policy and Strategy with other policies and business processes of Council,
Ensure compliance with legal obligations, Ensure sound business principles are reflected in the Asset Management strategies
and plans that are developed, Implementation of activities in the plans, Engage up-to-date technologies, methodologies and continuous improvement
processes, Facilitate “Best Appropriate Practice in Asset Management”.
Community Provides input into the services required and the cost the community is prepared to pay.

‐ 8 ‐
CESSNOCK CITY COUNCIL – OPEN SPACE and OTHER STRUCTURES ASSET MANAGEMENT PLAN DOC2013/005329
2.2 Goals and Objectives of Asset Management The Council exists to provide services to its community. Some of these services are provided by infrastructure assets. We have acquired infrastructure assets by ‘purchase’, by contract, construction by our staff and by donation of assets constructed by developers and others to meet increased levels of service. Our goal in managing infrastructure assets is to meet the defined level of service (as amended from time to time) in the most cost effective manner for present and future consumers. The key elements of infrastructure asset management are: Providing a defined level of service and monitoring performance, Managing the impact of growth through demand management and infrastructure investment, Taking a lifecycle approach to developing cost-effective management strategies for the long-
term that meet the defined level of service, Identifying, assessing and appropriately controlling risks, and Having a long-term financial plan which identifies required, affordable expenditure and how it
will be financed. 2.3 Plan Framework Key elements of the plan are
Section 3 - Levels of service – specifies the services and levels of service to be provided by the Council,
Section 4 - Future demand – how this will impact on future service delivery and how this is to be met,
Section 5 - Life cycle management – how we will manage our existing and future assets to provide defined levels of service,
Section 6 - Financial summary – what funds are required to provide the defined services, Section 7 - Asset management practices, Section 8 - Monitoring – how the plan will be monitored to ensure it is meeting the Council’s
objectives, Section 9 - Asset management improvement plan.

‐ 9 ‐
CESSNOCK CITY COUNCIL – OPEN SPACE and OTHER STRUCTURES ASSET MANAGEMENT PLAN DOC2013/005329
A road map for preparing an asset management plan is shown below:
Figure 1: Road Map for preparing an Asset Management Plan Source: IPWEA, 2006, IIMM, Fig 1.5.1, p 1.11.
IS THE PLAN AFFORDABLE?
CORPORATE PLANNINGConfirm strategic objectives and establish AM policies, strategies & goals. Define responsibilities & ownership.Decide core or advanced AM Pan.Gain organisation commitment.
REVIEW/COLLATE ASSET INFORMATIONExisting information sourcesIdentify & describe assets.Data collectionCondition assessmentsPerformance monitoringValuation Data
ESTABLISH LEVELS OF SERVICEEstablish strategic linkagesDefine & adopt statementsEstablish measures & targetsConsultation
LIFECYCLE MANAGEMENT STRATEGIESDevelop lifecycle strategiesDescribe service delivery strategyRisk management strategiesDemand forecasting and managementOptimised decision making (renewals, new works, disposals)Optimise maintenance strategies
FINANCIAL FORECASTSLifecycle analysisFinancial forecast summaryValuation DepreciationFunding
IMPROVEMENT PLANAssess current/desired practicesDevelop improvement plan
ITERATIONReconsider service statementsOptions for fundingConsult with CouncilConsult with Community
DEFINE SCOPE & STRUCTURE OF PLAN
INF
OR
MA
TIO
N M
AN
AG
EM
EN
T, a
nd
DA
TA
IMP
RO
VE
ME
NT
AM PLAN REVIEW AND
AUDIT
IMPLEMENT IMPROVEMENT
STRATEGY
ANNUAL PLAN / BUSINESS PLAN
INF
OR
MA
TIO
N M
AN
AG
EM
EN
T, a
nd
DA
TA
IMP
RO
VE
ME
NT

‐ 10 ‐
CESSNOCK CITY COUNCIL – OPEN SPACE and OTHER STRUCTURES ASSET MANAGEMENT PLAN DOC2013/005329
2.4 Core and Advanced Asset Management This asset management plan is prepared as a ‘core’ asset management plan over a 10 year planning period in accordance with the International Infrastructure Management Manual3. It is prepared to meet minimum legislative and Council requirements for sustainable service delivery and long term financial planning and reporting. Core asset management is a ‘top down’ approach where analysis is applied at the ‘system’ or ‘network’ level. Future revisions of this asset management plan will move towards ‘advanced’ asset management using a ‘bottom up’ approach for gathering asset information for individual assets to support the optimisation of activities and programs to meet agreed service levels. 2.5 Community Consultation In preparing this ‘core’ asset management plan, community consultation may be received through initial feedback of the AMP’s once on public exhibition. Exhibition will occur prior to Council adoption of the plans. Future revisions of the asset management plan will incorporate community consultation on asset specific service levels and costs of providing the service. This will assist the Council and the community in matching the level of service needed by the community, service risks and consequences with the community’s ability and willingness to pay for the service. 3. LEVELS OF SERVICE 3.1 Customer Research and Expectations Cessnock Council has engaged Micromex Research to undertake community research. In 2014 a telephone survey poll sample of residents on their level of satisfaction with the Council’s services, and of the Building Services identified the following satisfaction levels were reported:
Table 3.1: Community Satisfaction Survey Levels
Performance Measure Satisfaction Level
Very Satisfied
Fairly Satisfied
Satisfied Somewhat satisfied
Not satisfied
Parks and Recreation Areas
Maintaining Open Space and Bushland
Sporting Fields and Buildings
Cemetery Management
Micromex conducted a similar survey to that above in 2009, which formed part of the input into the inaugural community strategic plan; Cessnock 2020. The priorities in Council’s Delivery Program have been based on the desired outcomes identified in the latest iteration of the community strategic plan. In addition, Council also engaged Micromex Research in March of 2015 to undertake further Community Consultation. This was to determine what the community finds as an acceptable condition state of the assets. The concluding evidence from this survey found: “The majority of residents indicated that ‘Condition 3 or better’ was the acceptable condition for all assets”. This has therefore been incorporated into “scenario 2” modelling within this AMP.
3 IPWEA, 2011, IIMM.

‐ 11 ‐
CESSNOCK CITY COUNCIL – OPEN SPACE and OTHER STRUCTURES ASSET MANAGEMENT PLAN DOC2013/005329
3.2 Strategic and Corporate Goals This asset management plan is prepared under the direction of the Council’s vision, mission, goals and objectives. Our vision is:
“Cessnock will be a cohesive and welcoming community living in an attractive and sustainable rural environment with diversity of business and employment opportunities supported by accessible infrastructure and services which effectively meet community needs”.
In summary, the vision is:
“Cessnock - thriving, attractive and welcoming”. The 2013-17 Delivery Program has five Desired Outcomes as identified in the Community Strategic Plan, Cessnock 2023. They are:
1. A connected, safe and creative community; 2. A sustainable and prosperous economy; 3. A sustainable and healthy environment; 4. Accessible infrastructure, services and facilities; 5. Civic leadership and effective governance.
Relevant Council desired outcomes and strategic directions, and how these are addressed in this asset management plan are:
Table 3.2: Council Desired Outcomes and how these are addressed in this Plan
Desired Outcome
Strategic Direction How Desired Outcomes and Strategic Directions are addressed in the Open Space Asset Management Plan
A Connected, Safe & Creative Community
Promoting Social Connections
Our Community is aware and has access to community services.
Promote better awareness of the available community facilities
We are connected to others in our neighbourhood and across the Local Government Area.
Promote footpath and cycleway links. Engage with other LGA for provision of Open Space Assets for use within Neighbouring LGA’s.
Our Community has opportunities to celebrate together.
Promote the utilisation of Open Space, with the provision of supporting infrastructure – shelters, BBQ’s, playgrounds etc.
Our communities are linked by walking and bike tracks.
Promote footpath and cycleway links. Promote bushwalking tracks, reuse of the railway corridor.

‐ 12 ‐
CESSNOCK CITY COUNCIL – OPEN SPACE and OTHER STRUCTURES ASSET MANAGEMENT PLAN DOC2013/005329
Desired Outcome
Strategic Direction How Desired Outcomes and Strategic Directions are addressed in the Open Space Asset Management Plan
A Sustainable & Healthy Environment
Better Utilisation of Existing Open Space
Our Open Spaces are distributed where people live.
In align with the Recreational Strategic Plan.
We have green corridors connecting our open space areas.
In align with the Recreational Strategic Plan and Master Plans, including Cessnock CBD Master Plan.
We have high quality, centralised multi-purpose sporting and recreation facilities
Ensure upgrades increase the quality of the facility & are designed & constructed for multipurpose use. Maintain sports & recreational facilities through renewal works & maintenance.
Our open spaces have suitable amenities and plenty of shade
Provide advice to project committees & design advice, costing, project management & construction services.
The Council will exercise its duty of care to ensure public safety in accordance with the infrastructure risk management plan prepared in conjunction with this AM Plan. Management of infrastructure risks is covered in Section 5.2. 3.3 Legislative Requirements We have to meet many legislative requirements including Australian and State legislation and State regulations. These include:
Table 3.3: Legislative Requirements
Legislation Requirement
NSW Local Government Act 1993
Sets out role, purpose, responsibilities and powers of local governments including the preparation of a long term financial plan supported by infrastructure asset management plans for sustainable service delivery. Council’s core functions and the manner in which it must conduct its functions are detailed in the LG Act. Section 8 includes principles which summarise all of these functions and guide Council activities. Examples of these functions include the provision, management or operation of: • community services and facilities • sporting, recreational and entertainment services and facilities • environment conservation, protection, and improvement services and facilities • waste removal, treatment, and disposal services and facilities • stormwater drainage and flood prevention, protection and mitigation services and facilities • fire prevention, protection and mitigation services and facilities
DLG Integrated Planning NSW – As part of the LG Act 1993 • Key requirement is integrated community plans with operational and delivery
plans.

‐ 13 ‐
CESSNOCK CITY COUNCIL – OPEN SPACE and OTHER STRUCTURES ASSET MANAGEMENT PLAN DOC2013/005329
Legislation Requirement
Work Health and Safety Regulations 2011
Implement the model Work Health & Safety Regulations & form part of a system of nationally harmonised occupational health & safety laws. They apply to the Commonwealth, public authorities and, for a period, non-Commonwealth licensees4. Some of the chapters covered include: Chapter 2 representation & participation. Chapter 3 general risks & workplace management. Chapter 4 hazardous work; including specific tasks such as manual handling, confined spaces, demolition, electrical work and diving. Chapter 5 plant and structures and Chapter 6 Construction work.
Work Health and Safety Act 2011
The main object of this Act is to provide for a balanced and nationally consistent framework to secure the health and safety of workers and workplaces5.
Disability Discrimination Act 1994
The objects of this Act are: (a) to eliminate discrimination against persons on the ground of disability in the areas of: (i) work, accommodation, education, access to premises, clubs and sport; (ii) the provision of goods, facilities, services and land; (iii) existing laws; and (iv) the administration of Commonwealth laws and programs; and (b) ensure persons with disabilities have the same rights before the law as all of the community; and (c) Promote recognition and acceptance within the community of the principle that persons with disabilities have the same fundamental rights as the rest of the community.
National Parks And Wildlife Act 1974
The objects of this Act are: (a) the conservation of nature, including, but not limited to, the conservation of: (i) habitat, ecosystems and ecosystem processes, and (ii) biological diversity at the community, species and genetic levels, and (iii) landforms of significance, including geological features and processes, and (iv) landscapes and natural features of significance including wilderness and wild rivers, (b) The conservation of objects, places or features of cultural value within the landscape.
National Parks & Wildlife Amendment Order 2009
The object of this Order is to substitute Schedule 13 to the National Parks and Wildlife Act 1974 (the Act) (the Schedule that classifies certain plants as protected native plants).
Environmentally Hazardous Chemicals Act 1985 & Regulations
An Act which provides a mechanism for regulating chemicals of environmental concern throughout their entire life cycle.
Community Land Development Act 1989 No 201
The object of this Act is to facilitate the subdivision of land into parcels for separate development or disposition, including Community Land.
Electricity Supply Act 1995 No 94
Section 48 refers to Interference with electricity works by trees. This section applies if a network operator has cause to believe that a tree situated on any premises is in
4 http://www.comlaw.gov.au/Details/F2011L02664/Html/Text
5 http://www.comlaw.gov.au/Details/C2011A00137/Html/Text#_Toc309986326

‐ 14 ‐
CESSNOCK CITY COUNCIL – OPEN SPACE and OTHER STRUCTURES ASSET MANAGEMENT PLAN DOC2013/005329
Legislation Requirement
interference. This section applies despite the existence of a tree preservation order or environmental planning instrument (other than a State environmental planning policy), but does not apply to any tree within a protected area or to any tree that is the subject of or is within an area that is the subject of (a) an interim conservation order / permanent conservation order under the Heritage Act 1977, or (b) an order in force under section 130 or 136 of the Heritage Act 1977, or (c) an interim protection order under the National Parks and Wildlife Act 1974, or (d) A protection conferred by any similar law.
Sporting Bodies Codes of Practice
Set out size, quality and other requirements for sporting field preparation for different sports and grades of competition.
In addition, where appropriate Council complies with the following specifications and Australian Standards:
Table 3.3.1: Specifications and Australian Standards
Standards / Specifications Purpose
AS 2560.1-2002 Sports lighting – General Principles
AS 2560.2.1-2002 Sports lighting – specific applications – lighting for outdoor tennis
AS 2560.2.3-2002 Sports lighting – specific applications – lighting for football (all codes)
AS 3541.1-1988 Synthetic sporting surfaces – general principles
Sports Dimensions for Playing Areas
Sets minimum standards on sports playing areas for outdoor/indoor sports fields, courts and playing areas. Applicable to government and non-government bodies
AS 2555-1982 Supervised adventure playgrounds - Guide to establishment and administration
AS/NZS 4486.1:1997 Playgrounds and playground equipment - development, installation, inspection, maintenance and operation
AS 4422-1996/Amdt 1-1999 Playground surfacing specifications, requirements and test method
AS/NZS 4422:1996 Playground surfacing specifications, requirements and test method
AS/NZS 4486.1:1997 Playgrounds and playground equipment - development, installation, inspection, maintenance and operation
AS 4685.6-2004 Playground equipment - particular safety requirements and test methods for rocking equipment
Australian Standard 4360 Risk Management
AS/NZS 1158.3.1:1999 Road lighting - Pedestrian area lighting - performance & installation design requirements. Sets requirements for electric lighting for roads and other outdoor public areas.
HB 227-2003 Standard for portable soccer goal posts, manufacture, use and storage
AS 1418.10 - 1987 Elevated Work Platforms
AS 4685.1-2004 Playground equipment - general safety requirements and test methods
AS 4685.2-2004 Playground equipment - particular safety requirements and test methods for swings

‐ 15 ‐
CESSNOCK CITY COUNCIL – OPEN SPACE and OTHER STRUCTURES ASSET MANAGEMENT PLAN DOC2013/005329
Standards / Specifications Purpose
AS 4685.3-2004 Playground equipment - particular safety requirements and test methods for slides
AS 4685.4-2004 Playground equipment - particular safety requirements and test methods for runways (flying foxes)
AS 4685.5-2004 Playground equipment - particular safety requirements and test methods for carousels
3.4 Current Levels of Service Service levels are currently defined as either; “Community Levels of Service” or “Technical Levels of Service”. 3.4.1 Community Levels of Service
Community levels of service measures used in the asset management plan are: • Quality How good is the service? • Function Does it meet users’ needs? • Capacity/Utilisation Is the service over or under used? The Council’s current and expected community service levels are detailed in Tables 3.4 and 3.5. Table 3.4 shows the agreed expected community levels of service, which has been based on; Cessnock City Council 2023 Community Strategic Plan, resource levels in the current long-term financial plan, and community consultation/engagement. A detailed community consultation is yet to be undertaken on community service levels specific to each asset class, this will form part of the improvement plan for the next iteration of the AMP’s.
Table 3.4.1: Community Levels of Service
Key Performance Measure
Level of Service Performance Measure Process
Current Performance Desired Performance
COMMUNITY LEVELS OF SERVICE - PARKS
Quality Well maintained and suitable Open Spaces
Customer Survey 3.5 (2014) Score >= 3
Function Do Council’s open spaces meet the community needs?
Recreational needs analysis
TBD on adoption of report
=>50%
COMMUNITY LEVELS OF SERVICE - PARKS
Capacity Percentage of Council’s open space network under utilised
Recreational needs analysis
TBD on adoption of report
Less than 20% of asset stock underutilised.

‐ 16 ‐
CESSNOCK CITY COUNCIL – OPEN SPACE and OTHER STRUCTURES ASSET MANAGEMENT PLAN DOC2013/005329
Key Performance Measure
Level of Service Performance Measure Process
Current Performance Desired Performance
COMMUNITY LEVELS OF SERVICE - CEMETERIES
Quality Well maintained & suitable layout
Customer Survey 3.6 (2014) Score >= 3
Quality Response time to customer requests
Time taken to close customer requests
To be reviewed in the next iteration of this AMP
> 80% responded to within target
Capacity Council’s cemetery assets under capacity
Cemetery Master Plans
TBD on development of a master plan for cemeteries
To be reviewed on development of the master plan and feedback from internal staff.
COMMUNITY LEVELS OF SERVICE - PLAYGROUNDS
Quality Provide playground equipment that is adventurous & entertaining.
Community Survey
3.2 (2014) Score >= 3
Function Do Council’s playgrounds meet the community needs?
Recreational needs analysis
TBD on adoption of report
=>50%
Capacity Percentage of Council’s playgrounds under utilised
Recreational needs analysis
TBD on adoption of report
Less than 20% of asset stock underutilised.
COMMUNITY LEVELS OF SERVICE – PARK FURNITURE
Quality Provide quality park furniture
Community Survey
3.2 (2014) Score >= 3
Quality Response time to customer requests
Time taken to close customer requests
To be reviewed in the next iteration of this AMP
> 80% of all requests adequately responded to within target
COMMUNITY LEVELS OF SERVICE – PARK FURNITURE
Function Does Council’s park furniture meet the community needs?
Recreational needs analysis
TBD on adoption of report
=>50%
COMMUNITY LEVELS OF SERVICE – SPORTS FIELD LIGHTING
Quality Provide quality lighting infrastructure
Community Survey
3.7 (2014) Score >= 3

‐ 17 ‐
CESSNOCK CITY COUNCIL – OPEN SPACE and OTHER STRUCTURES ASSET MANAGEMENT PLAN DOC2013/005329
Key Performance Measure
Level of Service Performance Measure Process
Current Performance Desired Performance
Quality Response time to customer requests
Time taken to close customer requests
To be reviewed in the next iteration of this AMP
> 80% of all requests adequately responded to within target
Function Does Council’s sport field lighting meet the community needs?
Recreational needs analysis
TBD on adoption of report
=>50%
Capacity Sports field lighting under capacity
Recreational needs analysis
TBD on adoption of report
Less than 20% of asset stock under capacity.
3.5 Technical Levels of Service Technical Levels of Service - Supporting the community service levels are operational or technical measures of performance. These technical measures relate to the allocation of resources to service activities that the Council undertakes to best achieve the desired community outcomes and demonstrate effective Council performance. Technical service measures are linked to annual budgets covering:
• Operations6 – the regular activities to provide services such as opening hours, cleaning frequency, mowing frequency, etc.
• Maintenance – the activities necessary to retain an asset as near as practicable to an appropriate service condition (e.g. Playground component/part replacement, filter replacement, patching of runways or taxiways),
• Renewal – the activities that return the service capability of an asset up to that which it had originally (e.g. Full playground replacement, replacing park furniture like-for-like, replacing the roof of a picnic shelter, replacing items of plant at the aquatic facilities, resealing the runway/taxiway),
• Upgrade – the activities to provide an higher level of service (e.g. Replacing a playground with more items of equipment than originally in place, replacing an item of plant with a model of greater capacity, widening or extending the length of the runway or taxiways) or a new service that did not exist previously (e.g. a playground, an additional item of plant).
Both the works delivery and asset management team aim to; implement and control technical service levels to influence the customer service levels.
6 It has been identified that some inaccuracies are reflected in Councils current make up of what is captured as planned or reactive maintenance, in comparison to operational maintenance across most asset classes. The process to better define and accurately report this will be incorporated into the improvement plan within this AMP.

‐ 18 ‐
CESSNOCK CITY COUNCIL – OPEN SPACE and OTHER STRUCTURES ASSET MANAGEMENT PLAN DOC2013/005329
Table 3.5 shows the technical level of service expected to be provided under this Asset Management Plan.
Table 3.5: Technical Level of Service7
Key Performance Measure
Level of Service Performance Measure Process
Current Performance
Desired Performance
TECHNICAL LEVELS OF SERVICE – OPEN SPACE AND OTHER STRUCTURES
Operations To ensure all components are operational
Defect inspections Customer Requests Cleaning contract service performance.
Monitoring of defects through Authority. Team leaders and coordinators assessment of contractors.
90 day response to customer requests. Desired service standards to be reviewed after further community consultation and on adoption of the Recreation Needs Analysis.
Maintenance To ensure all components achieve their expected useful life
Defect inspections Customer Requests
Monitoring of defects through Authority.
90 day response to customer requests. Desired service standards to be reviewed after further community consultation and on adoption of the Recreation Needs Analysis
Renewal To ensure assets are renewed at the agreed intervention point
Community consultation results find the community desire condition 3 “average” or better.
Total open space assets in worse than condition 3 = 13.32%
All Open Space and Other Structure Assets in <= condition 3
TECHNICAL LEVELS OF SERVICE – OPEN SPACE AND OTHER STRUCTURES
Upgrade Upgrade is addressed where a need is assessed through needs studies or master plans.
Recreational needs analysis (once adopted), aquatic needs analysis, master plans and strategic plans.
Implementing where funding allows, including S94 contributions and grant funding.
To be reviewed on adoption of the recreational needs analysis.
7 The quantity and condition of Open Space assets has been recently assessed as part of the 15/16 revaluation of the asset class, when the results of this information are available they will be incorporated into the next iteration of this AMP.

‐ 19 ‐
CESSNOCK CITY COUNCIL – OPEN SPACE and OTHER STRUCTURES ASSET MANAGEMENT PLAN DOC2013/005329
4. FUTURE DEMAND
4.1 Demand Drivers Drivers affecting demand include population change, changes in demographics, seasonal factors, vehicle ownership rates, consumer preferences and expectations, technological changes, economic factors, agricultural practices, environmental awareness, etc. 4.2 Demand Forecast The present position and projections for demand drivers that may impact future service delivery and utilisation of assets were identified and are documented in Table 4.3. 4.3 Demand Impact on Assets The impact of demand drivers that may affect future service delivery and utilisation of assets are shown in Table 4.3.
Table 4.3: Demand Drivers, Projections and Impact on Services
Demand drivers Present position Projection Impact on services
Population 50,840 as at the 2011 Census
The projected population for 2031 is 68,3648(low scenario) and 101,987 (high scenario)
Population growth will increase traffic volumes, and increase demand on transport infrastructure, such as bus & transport facilities, footpaths & Cycleways, improved road network, etc.
Demographics Approximately 9 % of the residents are from non-English speaking backgrounds
More migrants from non-English speaking Backgrounds are expected to settle in the Cessnock LGA
Better Traffic Management Devices are required and Clearer Signage both as transportation signage and park and facility signage.
Demographics Over 7 % of the population need assistance in their day-to-day lives
Expect to see an increase in demand for services due to the ageing population
Increase in demand for DDA compliant Infrastructure, Services and Equitable Access
Climate Change Scientific evidence supporting the notion of climate change.
Increase Severity of Weather events Temperature Rise Rise in Sea Level
Cessnock Infrastructure Assets will need to adapt to new climate risks to ensure appropriate infrastructure investment decisions are made to reduce long-term costs.
Residential Development
Increase in demand for residential land and infrastructure
Estimated Increase by 2031 in population of between 18,120 (low scenario) and 51,740 (high scenario)
Increase in demand for maintenance of all new infrastructure assets that become the property of Council.
8 Source: Cessnock City Council, Community Planning Unit (current as at August 2015).

‐ 20 ‐
CESSNOCK CITY COUNCIL – OPEN SPACE and OTHER STRUCTURES ASSET MANAGEMENT PLAN DOC2013/005329
Demand drivers Present position Projection Impact on services
Changes in Land use
Changes in land use will result from rezoning and higher density developments
As part of State Government policy higher density developments will be encouraged in the Hunter Valley Area. The current levels of growth (although small) are anticipated to continue
Increased loading on existing infrastructure from development works (construction works can cause significant damage to existing infrastructure)
Section 94 Plans (S94)
Residential S94 Contribution Plans
Unformed Roads Contribution Plans
Tourism S94 Contribution Plans
Car Parking in Cessnock CBD S94 Contribution Plan
Kitchener S94 Contributions Plan
Bellbird North S94 Contributions Plan
Government Rd Cessnock S94 Contributions Plan
Mount View Road Millfield S94 Contribution Plan
Avery’s Village Heddon Greta S94 Contributions Plan
Nulkaba S94 Contribution Plan
Bellbird North Local Park $527,000 Bellbird North District Park $636,250 Bellbird North Sportsground $4,854,000 (deduction $2,000,000 for grandstand amenities) Bellbird North Tennis/Netball Courts $657,000 Bellbird North Open Space $3,428,000 Mount View Road Millfield Local Park $387,500 Averys Village $900,000 local park Averys Village $1,700,000 Local Sporting Venue Kitchener Local Park $740,000 Local Sporting field $1,014,167 (deduction $1,000,000 amenities) Kitchener Open Space $662,500
Voluntary Planning Agreement’s (VPA)
Cliftleigh VPA Anvil Creek VPA Heddon Greta VPA Avery’s Village VPA Cessnock Civic VPA Rose Hill Millfield VPA DRAFT Huntlee VPA
Cliftleigh testers hollow open space $937,000 Cliftliegh Hilltop park $293,000 Cliftleigh Open Space $350,000 Anvil Creek Heritage Park $2,000,000 (deduct $1,280,000 for building) Huntlee Local Sporting Fields $3,444,600 Huntlee Riparian Zones $2,253,800 Huntlee 2 x District Parks $5,179,125 Huntlee 8 x Local Parks $3,482,900 (with deduction for buildings)

‐ 21 ‐
CESSNOCK CITY COUNCIL – OPEN SPACE and OTHER STRUCTURES ASSET MANAGEMENT PLAN DOC2013/005329
4.4 Demand Management Demand for new services will be managed through a combination of managing existing assets, upgrading of existing assets and considering the provision of new assets, in order to meet demand and demand management. Demand management practices also include non-asset solutions, insuring against risks and managing failures. Non-asset solutions focus on providing the required service without the need for the Council to own the assets and management actions including reducing demand for the service, reducing the level of service (allowing some assets to deteriorate beyond current service levels) or educating customers to accept appropriate asset failures9. Examples of non-asset solutions include providing services from existing infrastructure such as aquatic centres and libraries that may be in another LGA or public toilets provided in commercial premises. Opportunities identified to date for demand management are shown in Table 4.4. Further opportunities will be developed in future revisions of this asset management plan.
Table 4.4: Demand Management Summary
Demand Driver Impact on Services Demand Management Strategy
Community Engagement – Explore community demand for Open Space assets.
Community expectation may increase
Engage with the community to identify justifiable community needs from other expectations and consider only community needs consistent with Council’s charter.
Optimised Delivery Program
Decrease maintenance and reduce the need for more expensive rehabilitation
Study condition rating from this plan and prioritise a list of Open Space assets to be included in the annual renewal program.
New land Divisions Provision of new Open Space assets.
Implement enhanced quality control measures for donated assets. Promote multi-use/collocated facilities.
Planning Oversupply of unfit for purpose Open Space assets
Revise planning controls to decrease the provision of unfit Open Space assets from Developers.
Capital Works Potential decrease in maintenance
New projects will need to be assessed with a balance between competing demands for investment to renew existing assets, as well as providing expenditure for new/upgraded assets to meet growing demand. Design all new facilities to be multi-use in nature, collocate where possible.
4.5 Asset Programs to meet Demand The new assets required to meet growth will be acquired either free of cost from land developments and constructed/acquired by the Council OR as a percentage contribution through Section 94 funding. New assets to be constructed/acquired by the Council are discussed in Section 5.5. Acquiring these new assets will commit the Council to fund ongoing operations, maintenance and renewal costs for the period that the service provided from the assets is required. The cumulative value of constructed asset values are summarised in Figure 1, including growth from contributed assets gained through development:
9 IPWEA, 2011, IIMM, Table 3.4.1, p 3|58.

‐ 22 ‐
CESSNOCK CITY COUNCIL – OPEN SPACE and OTHER STRUCTURES ASSET MANAGEMENT PLAN DOC2013/005329
Figure 1: New Assets to meet Demand
5. LIFECYCLE MANAGEMENT PLAN The lifecycle management plan details how the Council plans to manage and operate the assets at the agreed levels of service (defined in Section 3) while optimising life cycle costs. 5.1 Background Data 5.1.1 Physical parameters Age profile information is often difficult to ascertain for open space assets, and is currently not available for all Open Space assets. An example of a profile for Councils Playgrounds is as follows:
Figure 2: Playgrounds Age Profile

‐ 23 ‐
CESSNOCK CITY COUNCIL – OPEN SPACE and OTHER STRUCTURES ASSET MANAGEMENT PLAN DOC2013/005329
5.1.2 Asset capacity and performance Council’s services are generally provided to meet design standards where these are available. Locations where deficiencies in service performance are known are detailed in the table 5.1.2.
Table 5.1.2: Known Service Performance Deficiencies
Location Service Deficiency
Playgrounds, City Wide
Dilapidated, unfit for purpose play equipment has contributed to reduced use of playgrounds.
Park Furniture, City Wide
Dilapidated, unfit for purpose furniture has contributed to reduced useful life of the furniture.
Irrigation, City Wide All manual systems should be converted to automated systems.
Sports fields Condition of grounds due to overuse, adverse weather, lack of turf renewal.
Aquatic Plant Undersized heating systems at indoor facility.
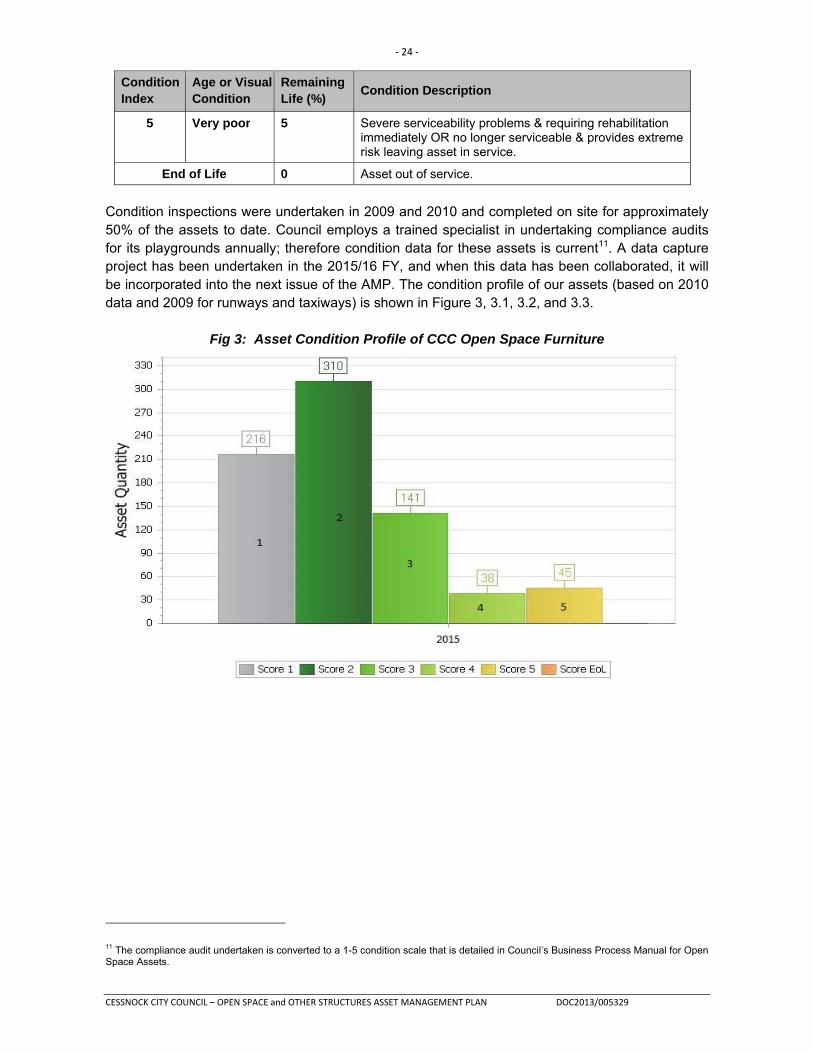
The above service deficiencies were identified from internal staff knowledge and site inspections. 5.1.3 Asset condition Council has a documented condition assessment manual to condition rate Open Space Assets. This manual assists staff and contractors to assess the condition of Council’s Open Space Assets. This gives a basis for consistent assessment of Open Space Assets. This enables Council to determine the overall condition of its Open Space network as well as identify those assets that require repair or renewal in future years. Condition is measured using a 1 – 5 grading system10 with the addition of condition state 0 to represent newly constructed assets, and end of life (EOL) for assets out of service/closed to the public, see table 5.1.3 below:
Table 5.1.3: Condition Rating Description
Condition Index
Age or Visual Condition
Remaining Life (%)
Condition Description
0
Constructed
100
Asset that is newly constructed and/or is less than 12 months in age.
1 As New 99 In an excellent condition with no visible signs of deterioration OR an asset that has been recently rehabilitated back to an “as new” condition
2 Good 75 In good condition with some early stages of deterioration evident. Functionality, performance and serviceability are minimally impaired, if at all.
3 Fair 50 Obvious condition deterioration. Functionality, performance, and serviceability would be affected and maintenance costs rising.
4 Poor 25 The condition deterioration would be severe and would be starting to limit serviceability. Maintenance costs would be high and pointing towards rehabilitation. Risk associated with deterioration would also be increasing.
10 IPWEA, 2011, IIMM, Sec 2.5.4, p 2|79.
‐ 24 ‐
CESSNOCK CITY COUNCIL – OPEN SPACE and OTHER STRUCTURES ASSET MANAGEMENT PLAN DOC2013/005329
Condition Index
Age or Visual Condition
Remaining Life (%)
Condition Description
5 Very poor 5 Severe serviceability problems & requiring rehabilitation immediately OR no longer serviceable & provides extreme risk leaving asset in service.
End of Life 0 Asset out of service.
Condition inspections were undertaken in 2009 and 2010 and completed on site for approximately 50% of the assets to date. Council employs a trained specialist in undertaking compliance audits for its playgrounds annually; therefore condition data for these assets is current11. A data capture project has been undertaken in the 2015/16 FY, and when this data has been collaborated, it will be incorporated into the next issue of the AMP. The condition profile of our assets (based on 2010 data and 2009 for runways and taxiways) is shown in Figure 3, 3.1, 3.2, and 3.3.
Fig 3: Asset Condition Profile of CCC Open Space Furniture
11 The compliance audit undertaken is converted to a 1-5 condition scale that is detailed in Council’s Business Process Manual for Open Space Assets.

‐ 25 ‐
CESSNOCK CITY COUNCIL – OPEN SPACE and OTHER STRUCTURES ASSET MANAGEMENT PLAN DOC2013/005329
Fig 3.1: Asset Condition Profile of CCC Open Space Playground Structures
Fig 3.2: Asset Condition Profile of CCC Open Space Playground Surfaces
Fig 3.3: Asset Condition Profile of CCC Runways and Taxiways

‐ 26 ‐
CESSNOCK CITY COUNCIL – OPEN SPACE and OTHER STRUCTURES ASSET MANAGEMENT PLAN DOC2013/005329
5.1.4 Asset valuations The revaluation of Councils Open Space and Other Structures is programmed for 2015/2016 FY. Assets are valued using replacement cost method (based on unit rates and quantity/dimensions). The replacement value of the assets as at 30th June 2015 was:
Current Replacement Cost $17,474,000 Depreciable Amount $17,474,000 Depreciated Replacement Cost12 $11,011,000 Annual Depreciation Expense $746,467
Useful lives were reviewed in 2010/11 as part of the revaluation using benchmark figures and Staff Knowledge. Key assumptions made in preparing the valuations were:
The current levels of service will remain constant over the life of this plan.
All predicted financial figures are based on 2010/11 rates and are not adjusted by the inflation rate for the particular year of works.
Various ratios of asset consumption and expenditure have been prepared to help guide and gauge asset management performance and trends over time.
Rate of Annual Asset Consumption 4.3% (Annual Depreciation Expense/Depreciable Amount) Rate of Annual Asset Renewal 1.1% (Capital renewal exp/Depreciable amount) Rate of Annual Asset Upgrade/New 2.7% (Capital upgrade exp/Depreciable amount)
In 2015 the Council plans to renew assets at 25.6% of the rate they are being consumed and will be increasing its asset stock by 2.7% in the year. 5.1.5 Historical Data
5.1.5.1: Expenditure for Open Space Assets Budget 2013 2014 2015
Operations $273,662 $247,509 $264,000 Maintenance $1,316,175 $1,591,778 $1,474,000
Capital Renewal $128,835 $551,550 $191,000 Capital Upgrade $486,510 $264,419 $475,000
5.2 Infrastructure Risk Management Plan An assessment of risks13 associated with service delivery from infrastructure assets has identified critical risks that will result in loss or reduction in service from infrastructure assets or a ‘financial shock’ to the Council. The risk assessment process identifies credible risks, the likelihood of the
12 Also reported as Written Down Current Replacement Cost (WDCRC).
13 CCC Infrastructure Risk Management Plan TRIM Reference DOC2015/012452
Residual Value
Depreciable Amount
Useful Life
Current Replacement
Cost
End of reporting period 1
Annual Depreciation
Expense
End of reporting period 2
Accumulated Depreciation
Depreciated Replacement
Cost

‐ 27 ‐
CESSNOCK CITY COUNCIL – OPEN SPACE and OTHER STRUCTURES ASSET MANAGEMENT PLAN DOC2013/005329
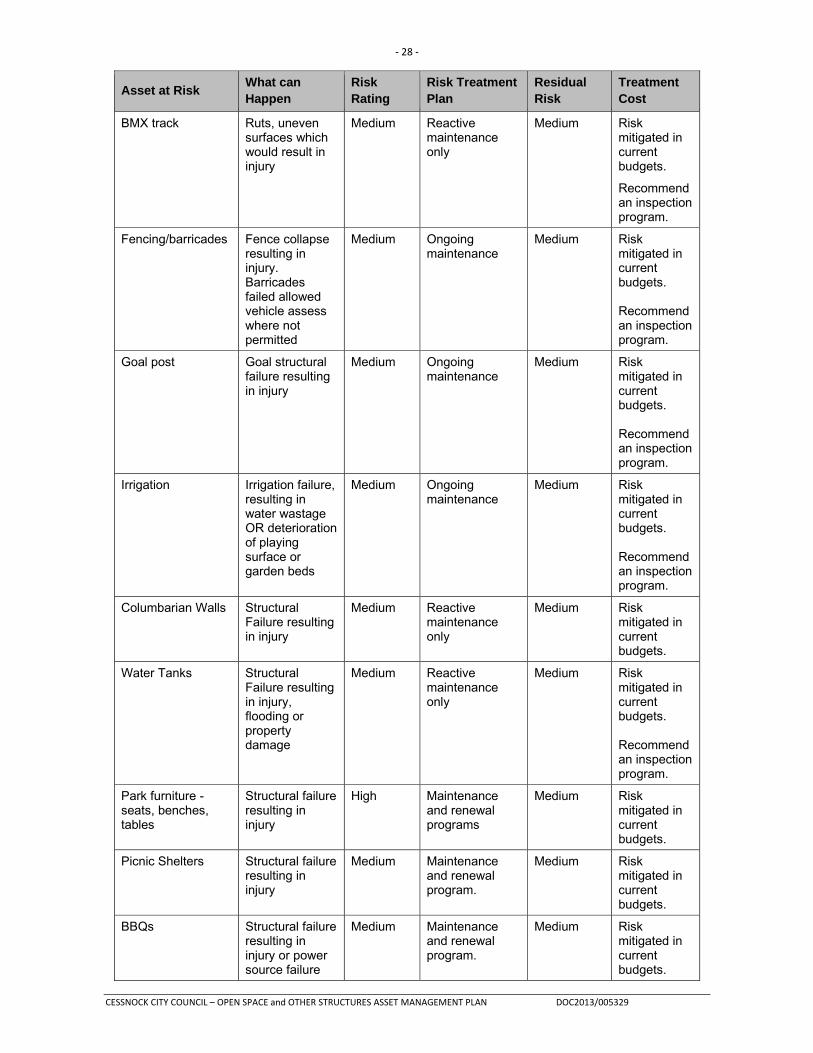
risk event occurring, the consequences should the event occur, develops a risk rating, evaluates the risk and develops a risk treatment plan for non-acceptable risks. Critical risks, being those assessed as ‘Very High’ - requiring immediate corrective action and ‘High’ – requiring prioritised corrective action identified in the Infrastructure Risk Management Plan, together with the estimated residual risk after the selected treatment plan is operational are summarised in Table 5.2. These risks are reported to management and Council. Table 5.2: Critical Risks and Treatment Plans
Asset at Risk What can Happen
Risk Rating
Risk Treatment Plan
Residual Risk
Treatment Cost
Open Space Lighting
Structural Failure resulting in injury
High Structural assessment required on deteriorated assets
Medium Estimated at $40,000
Play Field Surfaces Injury resulting from uneven/broken surface. Unfit for purpose.
Medium Feedback from maintenance staff and user groups
Medium Already in Budget
Playground Risk of future economic burden or closure of playgrounds
High Renewal budget required or closure of playgrounds.
High Replacement of current backlog approx. cost of $640,000
Playground
Soft-fall and/or equipment not complying with Australian Standard, potentially causing injury
High Routine inspections and maintenance work.
Medium Risk mitigated in current budgets.
Playground Structural Failure resulting in injury
Medium Regular Inspections in line with Australian Standards
Medium Risk mitigated in current budgets
Swimming Pool Fixed Plant
Plant failure closing aquatic facilities
High Regular Maintenance and Renewal Program
Medium Risk mitigated in current budgets
Swimming Pool Structural Failure
Structural elements of pool failing i.e. wall breaking up, water seepage
Medium Regular Maintenance and Renewal Program
Medium Risk mitigated in current budgets.
Skate Park Structural elements failing resulting in injury
High Reactive maintenance only
High
$15,000 estimated cost to undertake inspections for priority list.
‐ 28 ‐
CESSNOCK CITY COUNCIL – OPEN SPACE and OTHER STRUCTURES ASSET MANAGEMENT PLAN DOC2013/005329
Asset at Risk What can Happen
Risk Rating
Risk Treatment Plan
Residual Risk
Treatment Cost
BMX track Ruts, uneven surfaces which would result in injury
Medium Reactive maintenance only
Medium Risk mitigated in current budgets.
Recommend an inspection program.
Fencing/barricades Fence collapse resulting in injury. Barricades failed allowed vehicle assess where not permitted
Medium Ongoing maintenance
Medium Risk mitigated in current budgets. Recommend an inspection program.
Goal post Goal structural failure resulting in injury
Medium Ongoing maintenance
Medium Risk mitigated in current budgets. Recommend an inspection program.
Irrigation Irrigation failure, resulting in water wastage OR deterioration of playing surface or garden beds
Medium Ongoing maintenance
Medium Risk mitigated in current budgets. Recommend an inspection program.
Columbarian Walls Structural Failure resulting in injury
Medium Reactive maintenance only
Medium Risk mitigated in current budgets.
Water Tanks Structural Failure resulting in injury, flooding or property damage
Medium Reactive maintenance only
Medium Risk mitigated in current budgets. Recommend an inspection program.
Park furniture - seats, benches, tables
Structural failure resulting in injury
High Maintenance and renewal programs
Medium Risk mitigated in current budgets.
Picnic Shelters Structural failure resulting in injury
Medium Maintenance and renewal program.
Medium Risk mitigated in current budgets.
BBQs Structural failure resulting in injury or power source failure
Medium Maintenance and renewal program.
Medium Risk mitigated in current budgets.

‐ 29 ‐
CESSNOCK CITY COUNCIL – OPEN SPACE and OTHER STRUCTURES ASSET MANAGEMENT PLAN DOC2013/005329
Asset at Risk What can Happen
Risk Rating
Risk Treatment Plan
Residual Risk
Treatment Cost
Runway and Taxiways
Failure of surface
Medium Maintenance and renewal program.
Medium Risk mitigated in current budgets.
Runway and Taxiways
Failure of pavement
Medium Maintenance and renewal program.
Medium Risk mitigated in current budgets.
Runway and Taxiways
Failure of surface and potentially pavement as a result of not complying with CASA design standards
Medium Capital Programs
Medium Risk mitigated through in-house procedures, training and capital funding when required.
5.3 Routine Operations and Maintenance Plan Operations include regular activities to provide services such as public health, safety and amenity, e.g. street sweeping, grass mowing and street lighting. Routine maintenance is the regular on-going work that is necessary to keep assets operating, including instances where portions of the asset fail and need immediate repair to make the asset operational again. 5.3.1 Operations and Maintenance Plan Operational14 activities affect service levels including quality and function through frequency (e.g. street sweeping, cleaning of parks), intensity (e.g. spacing of sports field lighting) and opening hours (of building and other facilities). Maintenance includes all actions necessary for retaining an asset as near as practicable to an appropriate service condition including regular ongoing day-to-day work necessary to keep assets operating, e.g. staining of park benches and seats, but not renewing them. Maintenance may be classified into reactive, planned and specific maintenance work activities. Reactive Maintenance is unplanned repair work carried out in response to service requests and management/supervisory directions. Planned Maintenance is repair work that is identified and managed using the customer request system and/or a maintenance management system (MMS). MMS activities include inspection, assessing the condition against failure/breakdown experience, prioritising, scheduling, actioning the work and reporting what was done to develop a maintenance history and improve maintenance and service delivery performance. Actual past maintenance expenditure is shown in Table 5.3.1.
14 It has been identified that some inaccuracies are reflected in Councils current make up of what is captured as planned or reactive maintenance, in comparison to operational maintenance across most asset classes. The process to better define and accurately report this will be incorporated into the improvement plan within this AMP.
‐ 30 ‐
CESSNOCK CITY COUNCIL – OPEN SPACE and OTHER STRUCTURES ASSET MANAGEMENT PLAN DOC2013/005329
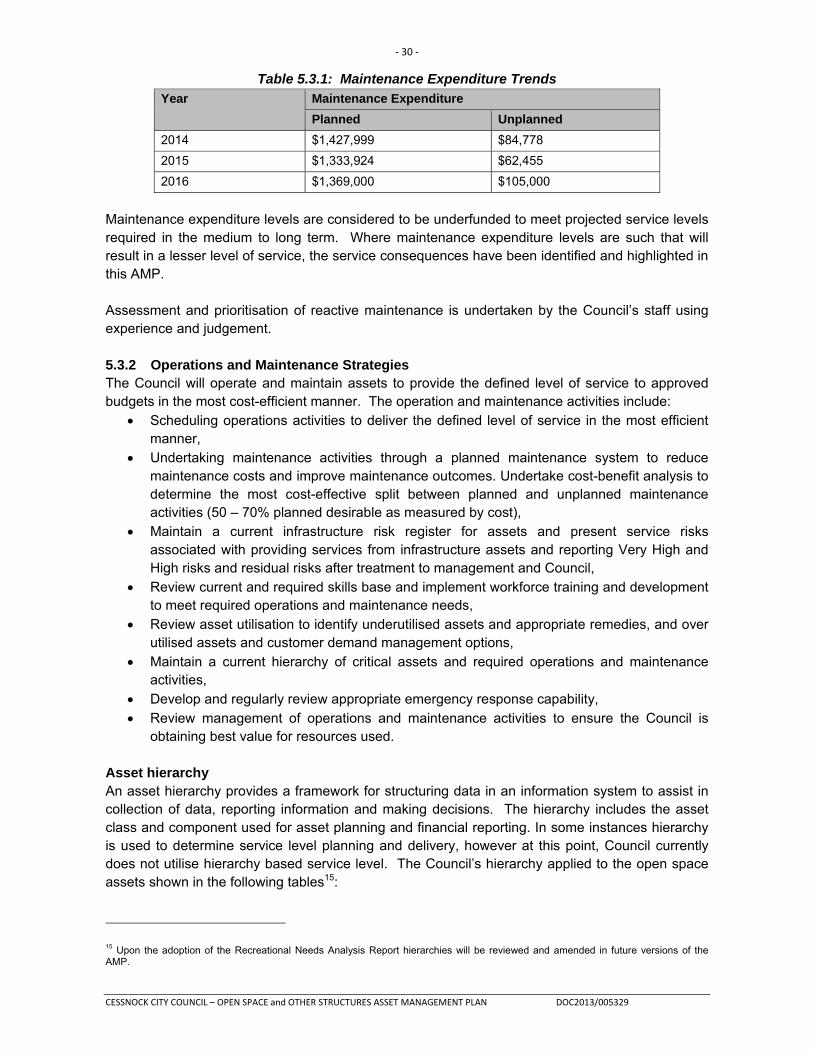
Table 5.3.1: Maintenance Expenditure Trends
Year Maintenance Expenditure
Planned Unplanned
2014 $1,427,999 $84,778
2015 $1,333,924 $62,455
2016 $1,369,000 $105,000
Maintenance expenditure levels are considered to be underfunded to meet projected service levels required in the medium to long term. Where maintenance expenditure levels are such that will result in a lesser level of service, the service consequences have been identified and highlighted in this AMP. Assessment and prioritisation of reactive maintenance is undertaken by the Council’s staff using experience and judgement. 5.3.2 Operations and Maintenance Strategies The Council will operate and maintain assets to provide the defined level of service to approved budgets in the most cost-efficient manner. The operation and maintenance activities include:
Scheduling operations activities to deliver the defined level of service in the most efficient manner,
Undertaking maintenance activities through a planned maintenance system to reduce maintenance costs and improve maintenance outcomes. Undertake cost-benefit analysis to determine the most cost-effective split between planned and unplanned maintenance activities (50 – 70% planned desirable as measured by cost),
Maintain a current infrastructure risk register for assets and present service risks associated with providing services from infrastructure assets and reporting Very High and High risks and residual risks after treatment to management and Council,
Review current and required skills base and implement workforce training and development to meet required operations and maintenance needs,
Review asset utilisation to identify underutilised assets and appropriate remedies, and over utilised assets and customer demand management options,
Maintain a current hierarchy of critical assets and required operations and maintenance activities,
Develop and regularly review appropriate emergency response capability, Review management of operations and maintenance activities to ensure the Council is
obtaining best value for resources used. Asset hierarchy An asset hierarchy provides a framework for structuring data in an information system to assist in collection of data, reporting information and making decisions. The hierarchy includes the asset class and component used for asset planning and financial reporting. In some instances hierarchy is used to determine service level planning and delivery, however at this point, Council currently does not utilise hierarchy based service level. The Council’s hierarchy applied to the open space assets shown in the following tables15:
15 Upon the adoption of the Recreational Needs Analysis Report hierarchies will be reviewed and amended in future versions of the AMP.
‐ 31 ‐
CESSNOCK CITY COUNCIL – OPEN SPACE and OTHER STRUCTURES ASSET MANAGEMENT PLAN DOC2013/005329
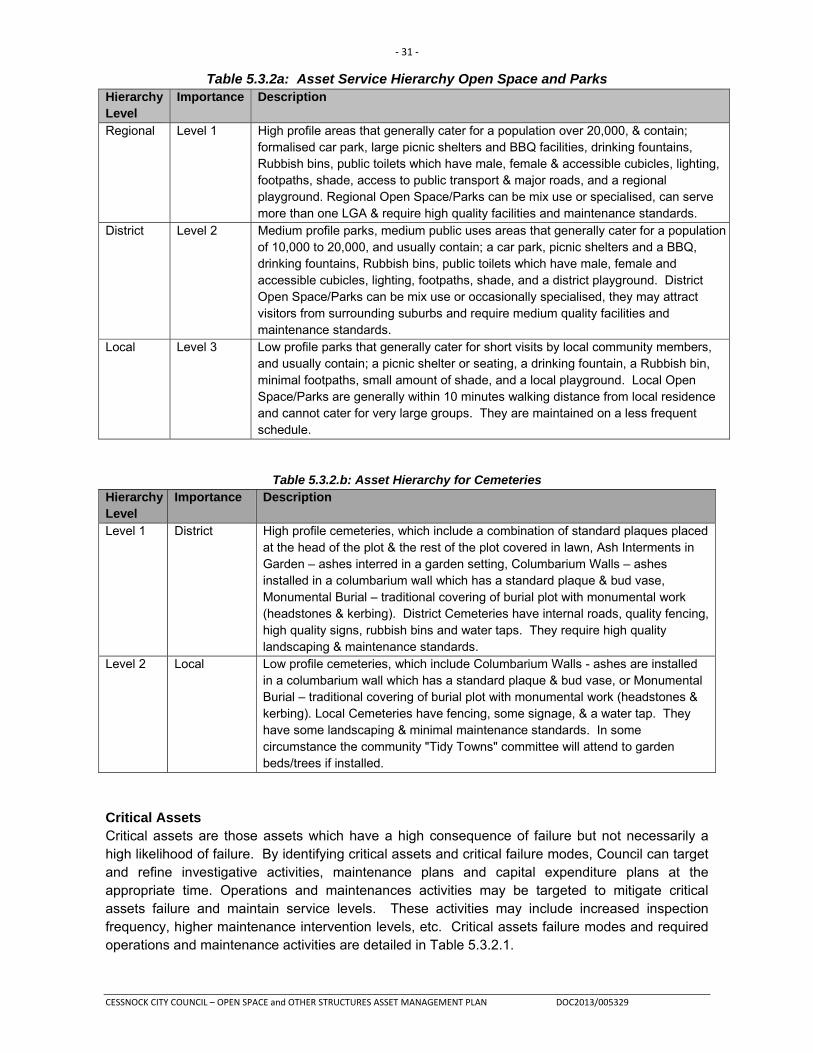
Table 5.3.2a: Asset Service Hierarchy Open Space and Parks Hierarchy Level
Importance Description
Regional Level 1 High profile areas that generally cater for a population over 20,000, & contain; formalised car park, large picnic shelters and BBQ facilities, drinking fountains, Rubbish bins, public toilets which have male, female & accessible cubicles, lighting, footpaths, shade, access to public transport & major roads, and a regional playground. Regional Open Space/Parks can be mix use or specialised, can serve more than one LGA & require high quality facilities and maintenance standards.
District Level 2 Medium profile parks, medium public uses areas that generally cater for a population of 10,000 to 20,000, and usually contain; a car park, picnic shelters and a BBQ, drinking fountains, Rubbish bins, public toilets which have male, female and accessible cubicles, lighting, footpaths, shade, and a district playground. District Open Space/Parks can be mix use or occasionally specialised, they may attract visitors from surrounding suburbs and require medium quality facilities and maintenance standards.
Local Level 3 Low profile parks that generally cater for short visits by local community members, and usually contain; a picnic shelter or seating, a drinking fountain, a Rubbish bin, minimal footpaths, small amount of shade, and a local playground. Local Open Space/Parks are generally within 10 minutes walking distance from local residence and cannot cater for very large groups. They are maintained on a less frequent schedule.
Table 5.3.2.b: Asset Hierarchy for Cemeteries Hierarchy Level
Importance Description
Level 1 District High profile cemeteries, which include a combination of standard plaques placed at the head of the plot & the rest of the plot covered in lawn, Ash Interments in Garden – ashes interred in a garden setting, Columbarium Walls – ashes installed in a columbarium wall which has a standard plaque & bud vase, Monumental Burial – traditional covering of burial plot with monumental work (headstones & kerbing). District Cemeteries have internal roads, quality fencing, high quality signs, rubbish bins and water taps. They require high quality landscaping & maintenance standards.
Level 2 Local Low profile cemeteries, which include Columbarium Walls - ashes are installed in a columbarium wall which has a standard plaque & bud vase, or Monumental Burial – traditional covering of burial plot with monumental work (headstones & kerbing). Local Cemeteries have fencing, some signage, & a water tap. They have some landscaping & minimal maintenance standards. In some circumstance the community "Tidy Towns" committee will attend to garden beds/trees if installed.
Critical Assets Critical assets are those assets which have a high consequence of failure but not necessarily a high likelihood of failure. By identifying critical assets and critical failure modes, Council can target and refine investigative activities, maintenance plans and capital expenditure plans at the appropriate time. Operations and maintenances activities may be targeted to mitigate critical assets failure and maintain service levels. These activities may include increased inspection frequency, higher maintenance intervention levels, etc. Critical assets failure modes and required operations and maintenance activities are detailed in Table 5.3.2.1.

‐ 32 ‐
CESSNOCK CITY COUNCIL – OPEN SPACE and OTHER STRUCTURES ASSET MANAGEMENT PLAN DOC2013/005329
Table 5.3.2.1: Critical Assets and Service Level Objectives
Critical Assets Critical Failure Mode Operations & Maintenance Activities
Peace Park/Chinaman Hollow Playground
Failure of any component affecting the safety/use/standard/capacity/function of the facility
A critical assets management plan to be drafted as part of a future improvement task of this AMP.
Baddeley Park Sports Stadium
Failure of any component affecting the safety/use/standard/capacity/function of the facility
A critical assets management plan to be drafted as part of a future improvement task of this AMP.
Kurri Kurri Aquatic Facility plant or pools
Failure of any component affecting the safety/use/standard/capacity/function of the facility
A critical assets management plan to be drafted as part of a future improvement task of this AMP.
Cessnock Airport Runway Failure of any component affecting the safety/use/standard/capacity/function of the facility
A critical assets management plan to be drafted as part of a future improvement task of this AMP.
Standards and specifications Maintenance work is carried out in accordance with the following Standards and Specifications: • CCC Engineering Guidelines for Design • BCA • Australian Standards 5.3.3 Summary of future operations and maintenance expenditures Future operations and maintenance expenditure generally trends in line with the value of the asset stock as shown in figure 4 Note that all costs are shown in current 2016 dollar values (i.e. real values).
Figure 4: Projected Operations and Maintenance Expenditure
‐ 33 ‐
CESSNOCK CITY COUNCIL – OPEN SPACE and OTHER STRUCTURES ASSET MANAGEMENT PLAN DOC2013/005329
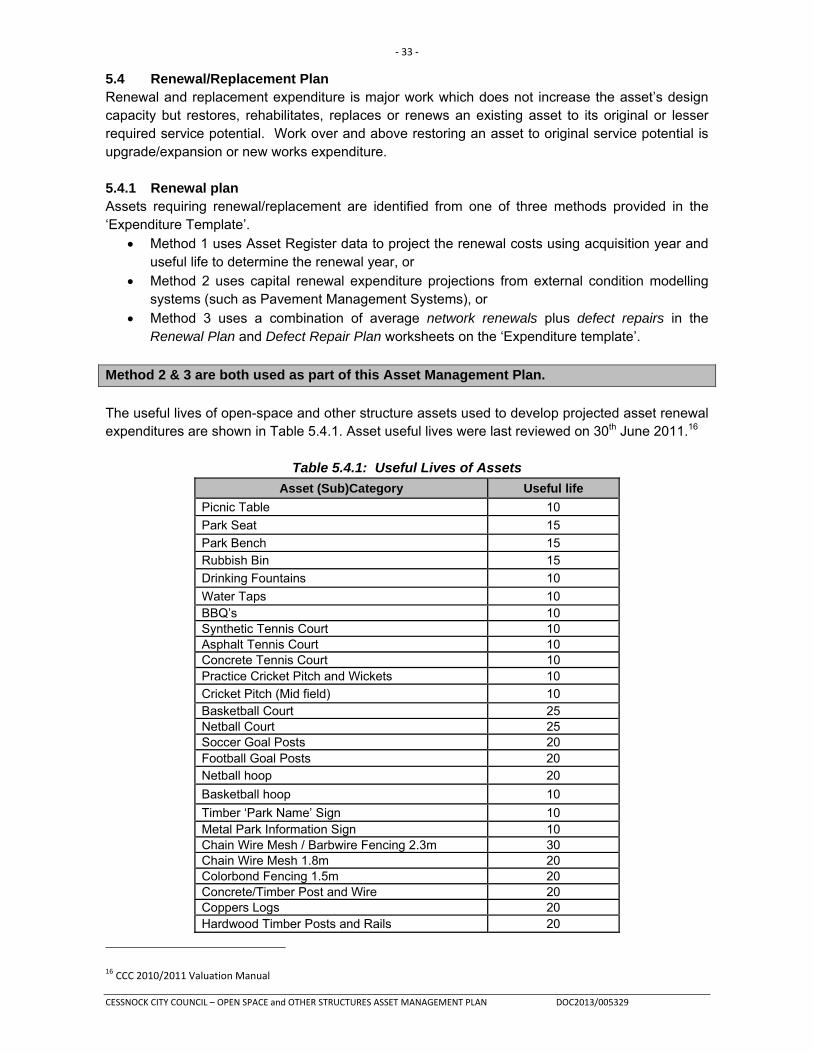
5.4 Renewal/Replacement Plan Renewal and replacement expenditure is major work which does not increase the asset’s design capacity but restores, rehabilitates, replaces or renews an existing asset to its original or lesser required service potential. Work over and above restoring an asset to original service potential is upgrade/expansion or new works expenditure. 5.4.1 Renewal plan Assets requiring renewal/replacement are identified from one of three methods provided in the ‘Expenditure Template’.
Method 1 uses Asset Register data to project the renewal costs using acquisition year and useful life to determine the renewal year, or
Method 2 uses capital renewal expenditure projections from external condition modelling systems (such as Pavement Management Systems), or
Method 3 uses a combination of average network renewals plus defect repairs in the Renewal Plan and Defect Repair Plan worksheets on the ‘Expenditure template’.
Method 2 & 3 are both used as part of this Asset Management Plan.
The useful lives of open-space and other structure assets used to develop projected asset renewal expenditures are shown in Table 5.4.1. Asset useful lives were last reviewed on 30th June 2011.16
Table 5.4.1: Useful Lives of Assets
Asset (Sub)Category Useful life
Picnic Table 10
Park Seat 15
Park Bench 15 Rubbish Bin 15
Drinking Fountains 10
Water Taps 10 BBQ’s 10 Synthetic Tennis Court 10 Asphalt Tennis Court 10 Concrete Tennis Court 10 Practice Cricket Pitch and Wickets 10
Cricket Pitch (Mid field) 10 Basketball Court 25 Netball Court 25 Soccer Goal Posts 20 Football Goal Posts 20 Netball hoop 20
Basketball hoop 10
Timber ‘Park Name’ Sign 10 Metal Park Information Sign 10 Chain Wire Mesh / Barbwire Fencing 2.3m 30Chain Wire Mesh 1.8m 20 Colorbond Fencing 1.5m 20 Concrete/Timber Post and Wire 20Coppers Logs 20 Hardwood Timber Posts and Rails 20
16 CCC 2010/2011 Valuation Manual

‐ 34 ‐
CESSNOCK CITY COUNCIL – OPEN SPACE and OTHER STRUCTURES ASSET MANAGEMENT PLAN DOC2013/005329
Asset (Sub)Category Useful life Metal Picket Fencing 1.5m 20
Metal Pole Fencing 1.0m 30
Pool (hooped) Fencing with CCC logo 1.5m 20
Steel Bollards 25
Steel Post and Cable 20
Tennis Court Fence (Black) 30 Timber Picket Fencing 1.5m 20 Timber Post/Wire Fencing 30 Tubular Panel Fencing (Security) 1.7m 20 Cemetery Entrance 700mm x 700mm - Kurri 50 Cemetery Entrance 600mm x 600mm - Cessnock 50
Cemetery Entrance 550mm x 550mm - Aberdare 50
Columbarium Standard Replacement 40
Concrete Plinths Standard Replacement 50 Rubbish Bins Standard Wizard Blue Square Bin 15 Seat Timber Seat with Metal Frame 15
Water Tap Standard Metal Water Tap 10 Metal Sign 10
Timber Church Name Sign 10
Timber Cemetery Name Sign 10 Metal Water Sign (Standard Street Blade Sign) 10
Swimming Pool 100 Swimming Pool Plant 10-25 Runways and Taxiways 24-80
Renewal Standards Renewal work is carried out in carried out in accordance with the following Standards and Specifications:
CCC Engineering Guidelines for Design BCA Australian Standards
In addition to these legislative standards and codes of practices, maintenance works and standards are intuitive to staff who have had a number of years undertaking this type of work. Council will however, endeavour to formally document these standards in future revisions of this Plan. 5.4.2 Renewal and Replacement Strategies The Council will plan capital renewal and replacement projects to meet level of service objectives and minimise infrastructure service risks by:
Planning and scheduling renewal projects to deliver the defined level of service in the most efficient manner,
Undertaking project scoping for all capital renewal and replacement projects to identify: o the service delivery ‘deficiency’, present risk and optimum time for
renewal/replacement, o the project objectives to rectify the deficiency, o the range of options, estimated capital and life cycle costs for each option that could
address the service deficiency, o and evaluate the options against evaluation criteria adopted by the Council, and o select the best option to be included in capital renewal programs,

‐ 35 ‐
CESSNOCK CITY COUNCIL – OPEN SPACE and OTHER STRUCTURES ASSET MANAGEMENT PLAN DOC2013/005329
Using ‘low cost’ renewal methods (cost of renewal is less than replacement) wherever possible,
Maintain a current infrastructure risk register for assets and service risks associated with providing services from infrastructure assets and reporting Very High and High risks and residual risks after treatment to management and the Council,
Review current and required skills base and implement workforce training and development to meet required construction and renewal needs,
Maintain a current hierarchy of critical assets and capital renewal treatments and timings required,
Review management of capital renewal and replacement activities to ensure the Council is obtaining best value for resources used.
Renewal ranking criteria Asset renewal and replacement is typically undertaken to either:
Ensure the reliability of the existing infrastructure to deliver the service it was constructed to facilitate (e.g. replacing a bridge that has a 5 t load limit), or
To ensure the infrastructure is of sufficient quality to meet the service requirements (e.g. roughness of a road).17
It is possible to get some indication of capital renewal and replacement priorities by identifying assets or asset groups that:
Have a high consequence of failure, Have a high utilisation and subsequent impact on users would be greatest, The total value represents the greatest net value to the Council, Have the highest average age relative to their expected lives, Are identified in the AM Plan as key cost factors, Have high operational or maintenance costs, and Where replacement with modern equivalent assets would yield material savings.18
The ranking criteria which will be used to determine the priority of identified future renewal and replacement proposals is detailed in Table 5.4.2. This will be utilised after the adoption of this plan.
Table 5.4.2: Renewal and Replacement Priority Ranking Criteria Criteria Weighting Comments/rationale
Perceived Risk Factor 35% ‐ Health & Safety ‐ Corporate ‐ Financial ‐ Political ‐ Compliance
Need/importance to the community
25% ‐ Demand demonstrated through quantitative needs assessments, community feedback, utilisation.
‐ Strategic alignment ‐ Facility hierarchy ‐ Utilisation
17 IPWEA, 2011, IIMM, Sec 3.4.4, p 3|60.
18 Based on IPWEA, 2011, IIMM, Sec 3.4.5, p 3|66.
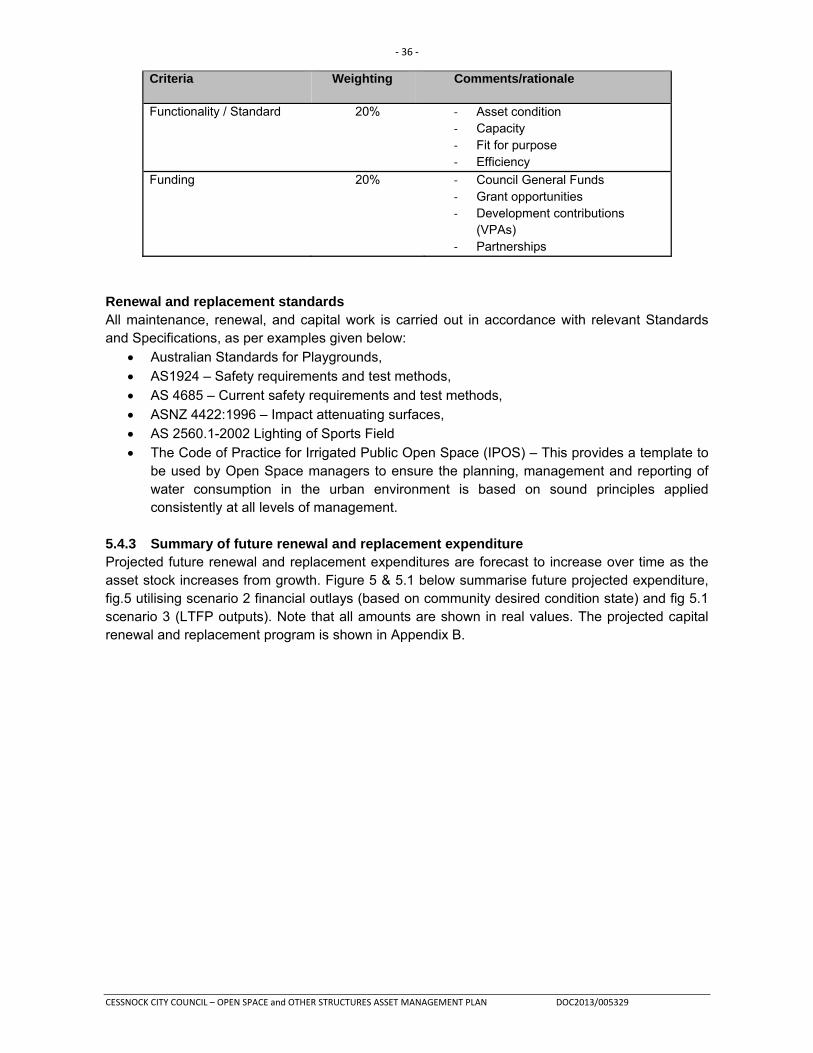
‐ 36 ‐
CESSNOCK CITY COUNCIL – OPEN SPACE and OTHER STRUCTURES ASSET MANAGEMENT PLAN DOC2013/005329
Criteria Weighting Comments/rationale
Functionality / Standard 20% ‐ Asset condition ‐ Capacity ‐ Fit for purpose ‐ Efficiency
Funding 20% ‐ Council General Funds ‐ Grant opportunities ‐ Development contributions
(VPAs) ‐ Partnerships
Renewal and replacement standards All maintenance, renewal, and capital work is carried out in accordance with relevant Standards and Specifications, as per examples given below:
Australian Standards for Playgrounds, AS1924 – Safety requirements and test methods, AS 4685 – Current safety requirements and test methods, ASNZ 4422:1996 – Impact attenuating surfaces, AS 2560.1-2002 Lighting of Sports Field The Code of Practice for Irrigated Public Open Space (IPOS) – This provides a template to
be used by Open Space managers to ensure the planning, management and reporting of water consumption in the urban environment is based on sound principles applied consistently at all levels of management.
5.4.3 Summary of future renewal and replacement expenditure Projected future renewal and replacement expenditures are forecast to increase over time as the asset stock increases from growth. Figure 5 & 5.1 below summarise future projected expenditure, fig.5 utilising scenario 2 financial outlays (based on community desired condition state) and fig 5.1 scenario 3 (LTFP outputs). Note that all amounts are shown in real values. The projected capital renewal and replacement program is shown in Appendix B.

‐ 37 ‐
CESSNOCK CITY COUNCIL – OPEN SPACE and OTHER STRUCTURES ASSET MANAGEMENT PLAN DOC2013/005329
Fig 5: Projected Capital Renewal and Replacement Expenditure Scenario 2
Fig 5.1: Projected Capital Renewal and Replacement Expenditure Scenario 3
Renewals and replacement expenditure in the Council’s capital works program will be accommodated in the long term financial plan. This is further discussed in Section 6.2.
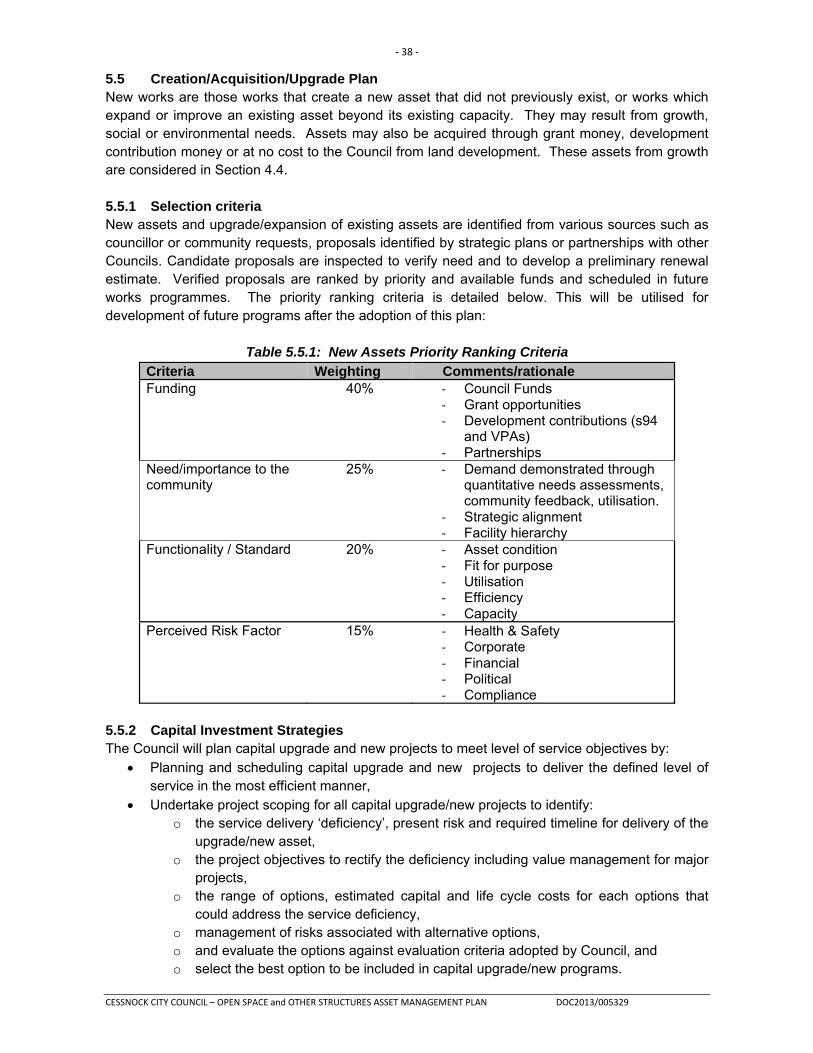
‐ 38 ‐
CESSNOCK CITY COUNCIL – OPEN SPACE and OTHER STRUCTURES ASSET MANAGEMENT PLAN DOC2013/005329
5.5 Creation/Acquisition/Upgrade Plan New works are those works that create a new asset that did not previously exist, or works which expand or improve an existing asset beyond its existing capacity. They may result from growth, social or environmental needs. Assets may also be acquired through grant money, development contribution money or at no cost to the Council from land development. These assets from growth are considered in Section 4.4. 5.5.1 Selection criteria New assets and upgrade/expansion of existing assets are identified from various sources such as councillor or community requests, proposals identified by strategic plans or partnerships with other Councils. Candidate proposals are inspected to verify need and to develop a preliminary renewal estimate. Verified proposals are ranked by priority and available funds and scheduled in future works programmes. The priority ranking criteria is detailed below. This will be utilised for development of future programs after the adoption of this plan:
Table 5.5.1: New Assets Priority Ranking Criteria
Criteria Weighting Comments/rationale Funding 40% ‐ Council Funds
‐ Grant opportunities ‐ Development contributions (s94
and VPAs) ‐ Partnerships
Need/importance to the community
25% ‐ Demand demonstrated through quantitative needs assessments, community feedback, utilisation.
‐ Strategic alignment ‐ Facility hierarchy
Functionality / Standard 20% ‐ Asset condition ‐ Fit for purpose ‐ Utilisation ‐ Efficiency ‐ Capacity
Perceived Risk Factor 15% ‐ Health & Safety ‐ Corporate ‐ Financial ‐ Political ‐ Compliance
5.5.2 Capital Investment Strategies The Council will plan capital upgrade and new projects to meet level of service objectives by:
Planning and scheduling capital upgrade and new projects to deliver the defined level of service in the most efficient manner,
Undertake project scoping for all capital upgrade/new projects to identify: o the service delivery ‘deficiency’, present risk and required timeline for delivery of the
upgrade/new asset, o the project objectives to rectify the deficiency including value management for major
projects, o the range of options, estimated capital and life cycle costs for each options that
could address the service deficiency, o management of risks associated with alternative options, o and evaluate the options against evaluation criteria adopted by Council, and o select the best option to be included in capital upgrade/new programs.

‐ 39 ‐
CESSNOCK CITY COUNCIL – OPEN SPACE and OTHER STRUCTURES ASSET MANAGEMENT PLAN DOC2013/005329
Review current and required skills base and implement training and development to meet required construction and project management needs,
Review management of capital project management activities to ensure the Council is obtaining best value for resources used.
Standards and specifications for new assets and for upgrade/expansion of existing assets are the same as those for renewal shown in Section 5.4.2. 5.5.3 Summary of future upgrade/new assets expenditure Projected upgrade/new asset expenditures are summarised in Fig 6. The projected upgrade/new capital works program is shown in Appendix C. All amounts are shown in real values.
Fig 6: Projected Capital Upgrade/New Asset Expenditure
Expenditure on new assets and services in the Council’s capital works program will be accommodated in the long term financial plan. This is further discussed in Section 6.2. 5.6 Disposal Plan Disposal includes any activity associated with disposal of a decommissioned asset including sale, demolition or relocation. At this stage there are no open space or other structure assets identified for disposal, however Council’s has developed a draft Service Property Review Plan (SPR) which will aim to determine the most appropriate use of open space assets and possible disposals. 5.7 Service Consequences and Risks The Council has prioritised decisions made in adopting this AMP to obtain the optimum benefits from its available resources. Decisions have been made based on the development of 2 of the 3 possible scenarios, which are: Scenario 1 - What we would like to do based on asset register data

‐ 40 ‐
CESSNOCK CITY COUNCIL – OPEN SPACE and OTHER STRUCTURES ASSET MANAGEMENT PLAN DOC2013/005329
Scenario 2 – What we should do with existing budgets and identifying level of service (including community service levels) and risk consequences (i.e. what are the operations, maintenance, and capital renewal projects we are unable to do, what is the service and risk consequences associated with this position). This may require several versions of the AMP. Scenario 3 – What we can do and be financially sustainable with AMPs matching long-term financial plans. The development of scenario 1 and scenario 2 AMPs provides the tools for discussion with the Council and community on trade-offs between what we would like to do (scenario 1) and what we should be doing with existing budgets (scenario 2) by balancing changes in services and service levels with affordability and acceptance of the service and risk consequences of the trade-off position (scenario 3). Scenarios 2 & 3 have been developed for this AMP. 5.7.1 What we cannot do There are some operations and maintenance activities and capital projects that are unable to be undertaken within the next 10 years. These include:
100% of the annual renewal required to keep assets in average/fair condition (3) or better Increase in the required maintenance for assets to achieve their useful life
5.7.2 Service consequences Operations and maintenance activities and capital projects that cannot be undertaken will maintain or create service consequences for users. These include: Potential for open space assets to become unfit for use: - i.e. park furniture dilapidating,
insufficient fixtures to cater for the surrounding population 5.7.3 Risk consequences The operations and maintenance activities and capital projects that cannot be undertaken may maintain or create risk consequences for the Council. These include:
Potential for increase in risk to the community through structural failure of playground components of, park furniture
Reduction in facilities available for sporting venues Negative public perception / political risk Increase in future funding required to renew/maintain Open Space assets as a result of
insufficient ongoing maintenance expenditure These risks have been included with the Infrastructure Risk Management Plan summarised in Section 5.2 and risk management plans actions and expenditures included within projected expenditures. 6. FINANCIAL SUMMARY This section contains the financial requirements resulting from all the information presented in the previous sections of this asset management plan. The financial projections will be improved as further information becomes available on desired levels of service and current and projected future asset performance.

‐ 41 ‐
CESSNOCK CITY COUNCIL – OPEN SPACE and OTHER STRUCTURES ASSET MANAGEMENT PLAN DOC2013/005329
6.1 Financial Statements and Projections The financial projections are shown in Fig 7 (scenario 2) and 7.1 (scenario 3) for projected operating, maintenance, and capital expenditure, including; renewal and upgrade/expansion/new assets. Note that all costs are shown in real values.
Fig 7: Projected Maintenance and Capital Expenditure Scenario 2
Fig 7.1: Projected Maintenance and Capital Expenditure Scenario 3

‐ 42 ‐
CESSNOCK CITY COUNCIL – OPEN SPACE and OTHER STRUCTURES ASSET MANAGEMENT PLAN DOC2013/005329
6.1.1 Sustainability of service delivery There are four key indicators for service delivery sustainability that have been considered in the analysis of the services provided by this asset category, these being the asset renewal funding ratio, long term life cycle costs/expenditures and medium term projected/budgeted expenditures over 5 and 10 years of the planning period. Asset Renewal Funding Ratio
Asset Renewal Funding Ratio 100% (Scenario 3 – LTFP) The Asset Renewal Funding Ratio, when considering the budget allocations set out in Councils’ Long Term Financial Plan (scenario 3) and the current level of service is 100%. When considering the outcome of Councils’ community consultation; all asset stock is to be in condition 3 ‘average’ or better (scenario 2), the Asset Renewal Funding Ratio is 45%. The Asset Renewal Funding Ratio is the most important indicator and reveals that over the next 10 years, the Council is forecasting that it will have 100% of the funds required to keep assets performing at the current level of service. However, should Council wish to improve the asset stock to meet the desired community expectation, an increase in 55% of the renewal funding will need to be achieved. Long term - Life Cycle Cost Life cycle costs (or whole of life costs) are the average costs that are required to sustain the service levels over the asset life cycle. Life cycle costs include operations and maintenance expenditure and asset consumption (depreciation expense). The life cycle cost for the services covered in this asset management plan is $2,901,000 per year (average operations and maintenance expenditure plus depreciation expense projected over 10 years). Life cycle costs can be compared to life cycle expenditure to give an initial indicator of affordability of projected service levels when considered with age profiles. Life cycle expenditure includes operations, maintenance and capital renewal expenditure. Life cycle expenditure will vary depending on the timing of asset renewals. The life cycle expenditure over the 10 year planning period is $2,054,000 per year (average operations and maintenance plus capital renewal budgeted expenditure in LTFP over 10 years). A shortfall between life cycle cost and life cycle expenditure is the life cycle gap. The life cycle gap for services covered by this asset management plan is -$847,000 per year (-ve = gap, +ve = surplus). Life cycle expenditure is 71% of life cycle costs. The life cycle costs and life cycle expenditure comparison highlights any difference between present outlays and the average cost of providing the service over the long term. If the life cycle expenditure is less than that life cycle cost, it is most likely that outlays will need to be increased or cuts in services made in the future. Knowing the extent and timing of any required increase in outlays and the service consequences if funding is not available will assist Council in providing services to their communities in a financially

‐ 43 ‐
CESSNOCK CITY COUNCIL – OPEN SPACE and OTHER STRUCTURES ASSET MANAGEMENT PLAN DOC2013/005329
sustainable manner. This is the purpose of the asset management plans and long term financial plan. Medium term – 10 year financial planning period This asset management plan identifies the projected operations, maintenance and capital renewal expenditures required to provide an agreed level of service to the community over a 10 year period. This provides input into 10 year financial and funding plans aimed at providing the required services in a sustainable manner. These projected expenditures may be compared to budgeted expenditures in the 10 year period to identify any funding shortfall. In a core asset management plan, a gap is generally due to increasing asset renewals for ageing assets. The projected operations, maintenance and capital renewal expenditure required over the 10 year planning period is $2,375,000 on average per year. Estimated (budget) operations, maintenance and capital renewal funding is $2,054,000 on average per year giving a 10 year funding shortfall of -$321,000 per year. This indicates that the Council expects to have 86% of the projected expenditures needed to provide the services documented in the asset management plan. Medium Term – 5 year financial planning period The projected operations, maintenance and capital renewal expenditure required over the first 5 years of the planning period is $2,110,000 on average per year. Estimated (budget) operations, maintenance and capital renewal funding is $1,994,000 on average per year giving a 5 year funding shortfall of -$116,000. This indicates that the Council expects to have 95% of projected expenditures required to provide the services shown in this asset management plan. Asset management financial indicators Figure 7A shows the asset management financial indicators over the 10 year planning period and for the long term life cycle.

‐ 44 ‐
CESSNOCK CITY COUNCIL – OPEN SPACE and OTHER STRUCTURES ASSET MANAGEMENT PLAN DOC2013/005329
Fig 7A: Asset Management Financial Indicators
Providing services from infrastructure in a sustainable manner requires the matching and managing of service levels, risks, projected expenditures and financing to achieve a financial indicator of approximately 1.0 for the first years of the asset management plan and ideally over the 10 year life of the Long Term Financial Plan. Figure 8 shows the projected asset renewal and replacement expenditure required from Scenario 2 over a 20 year planning period. The projected asset renewal and replacement expenditure is compared to planned renewal and replacement expenditure in the capital works program, which is accommodated in the long term financial plan.

‐ 45 ‐
CESSNOCK CITY COUNCIL – OPEN SPACE and OTHER STRUCTURES ASSET MANAGEMENT PLAN DOC2013/005329
Fig 8: Projected Renewal Expenditure Scenario 2 against LTFP Budget
Table 6.1.1 shows the shortfall between projected renewal and replacement expenditures required from scenario 2 and expenditure accommodated in long term financial plan. Budget expenditures accommodated in the long term financial plan are shown in Appendix D.
Table 6.1.1: Projected and LTFP Budgeted Renewals and Financing Shortfall – Scenario 2
Year End June 30 Projected Renewals LTFP Renewal
Budget
Renewal Financing Shortfall (- gap,
+ surplus)
Cumulative Shortfall (- gap, + surplus)
2016 $419 $191 $-228 $-228
2017 $603 $206 $-397 $-625
2018 $619 $210 $-409 $-1,034
2019 $488 $214 $-274 $-1,308
2020 $435 $219 $-216 $-1,524
2021 $464 $223 $-241 $-1,765
2022 $444 $227 $-217 $-1,982
2023 $468 $232 $-236 $-2,218
2024 $452 $236 $-216 $-2,434
2025 $457 $241 $-216 $-2,650
2026 $485 $220 $-265 $-2,915
2027 $485 $220 $-265 $-3,180
2028 $485 $220 $-265 $-3,445
2029 $485 $220 $-265 $-3,710

‐ 46 ‐
CESSNOCK CITY COUNCIL – OPEN SPACE and OTHER STRUCTURES ASSET MANAGEMENT PLAN DOC2013/005329
Year End June 30 Projected Renewal LTFP Renewal
Budget
Renewal Financing Shortfall (- gap,
+ surplus)
Cumulative Shortfall (- gap, + surplus)
2030 $485 $220 $-265 $-3,975
2031 $485 $220 $-265 $-4,240
2032 $485 $220 $-265 $-4,505
2033 $485 $220 $-265 $-4,770
2034 $485 $220 $-265 $-5,035
2035 $485 $220 $-265 $-5,300
All dollar values are in ($'000)'s Note: A negative shortfall indicates a financing gap, a positive shortfall indicates a surplus for that year. Should the Council wish to meet the community demand for assets to improve to a minimum of condition 3, in order to be sustainable in meeting this service level, there will be a requirement to match projected asset renewal and replacement expenditure with the corresponding capital works program accommodated in the long term financial plan. A gap between projected asset renewal/replacement expenditure and amounts accommodated in the LTFP indicates that further work is required on reviewing service levels in the AM Plan before finalising the asset management plan to manage required service levels and funding to eliminate any funding gap (including possibly revising the LTFP in future). We will manage the ‘gap’ by developing this asset management plan to provide guidance on future service levels and resources required to provide these services, and review future services, service levels and costs with the community. 6.1.2 Projected expenditures for long term financial plan Table 6.1.2 shows the projected expenditures for the 10 year long term financial plan. Expenditure projections are in real values.
Table 6.1.2: Projected Expenditures for Long Term Financial Plan (in $’000)
Year Operations Maintenance Projected Capital Renewal
Capital Upgrade/New Disposals
2016 $264 $1,474 $191 $475 $0
2017 $286 $1,535 $206 $510 $0
2018 $298 $1,603 $210 $520 $0
2019 $311 $1,673 $214 $532 $0
2020 $324 $1,743 $219 $541 $0
2021 $337 $1,814 $223 $552 $0
2022 $357 $1,920 $228 $563 $0
2023 $377 $2,028 $232 $575 $0
2024 $397 $2,138 $236 $586 $0
2025 $418 $2,251 $241 $598 $0
2026 $422 $2,277 $220 $545 $0
2027 $439 $2,372 $220 $545 $0
2028 $456 $2,459 $220 $545 $0

‐ 47 ‐
CESSNOCK CITY COUNCIL – OPEN SPACE and OTHER STRUCTURES ASSET MANAGEMENT PLAN DOC2013/005329
Year Operations Maintenance Projected Capital Renewal
Capital Upgrade/New Disposals
2029 $472 $2,547 $220 $545 $0
2030 $488 $2,636 $220 $545 $0
2031 $505 $2,725 $220 $545 $0
2032 $514 $2,773 $220 $545 $0
2033 $523 $2,822 $220 $545 $0
2034 $532 $2,870 $220 $545 $0
2035 $541 $2,918 $220 $545 $0
All dollar values are in ($'000)'s 6.2 Funding Strategy After reviewing service levels, as appropriate to ensure ongoing financial sustainability, the projected expenditures identified in Section 6.1.2 will be accommodated in the Council’s 10 year long term financial plan, and reviewed where necessary. 6.3 Valuation Forecasts Asset values are forecast to increase as additional assets are added to the asset stock from; construction and acquisition by the Council, from assets constructed by land developers and others, and assets donated to the Council. Figure 9 shows the projected replacement cost of asset values over the planning period in real values.
Figure 9: Projected Asset Values
Depreciation expense values are forecast in line with asset values as shown in Figure 10.

‐ 48 ‐
CESSNOCK CITY COUNCIL – OPEN SPACE and OTHER STRUCTURES ASSET MANAGEMENT PLAN DOC2013/005329
Figure 10: Projected Depreciation Expense
The depreciated replacement cost will vary over the forecast period depending on the rates of addition of new assets, disposal of old assets and consumption and renewal of existing assets. Forecast of the assets’ depreciated replacement cost is shown in Figure 11. The depreciated replacement cost of contributed and new assets is shown in the darker colour and in the lighter colour for existing assets.
Figure 11: Projected Depreciated Replacement Cost

‐ 49 ‐
CESSNOCK CITY COUNCIL – OPEN SPACE and OTHER STRUCTURES ASSET MANAGEMENT PLAN DOC2013/005329
6.4 Key Assumptions made in Financial Forecasts This section details the key assumptions made in presenting the information contained in this asset management plan and in preparing forecasts of required operating and capital renewal expenditure and asset values, depreciation expense and carrying amount estimates. It is presented to enable readers to gain an understanding of the levels of confidence in the data behind the financial forecasts. Key assumptions made in this asset management plan and risks that these may change are shown in Table 6.4.
Table 6.4: Key Assumptions made in AM Plan and Risks of Change
Key Assumptions Risks of Change to AssumptionsUse of existing inventory and condition data as at 30 June 2014.
Condition data was last compiled during the revaluation exercise undertaken in 2010/11.
Use of 2010/11 Asset Revaluation Manual. This asset management plan is based on asset revaluation undertaken in 2010/11 that would be subject to change by revaluation in 2015/16.
Planned expenditure values obtained from a combination of the current four year Delivery Program and prediction software.
The four year Delivery Program may change in the future. Any changes in planned capital and maintenance will be reflected in future asset management plans.
Contributed assets based on S94 and VPA’s. Potential for modification prior to commencement of development. Development contribution amount that is allocated for existing assets used for capital upgrade rather than renewal.
6.5 Forecast Reliability and Confidence The expenditure and valuations projections in this AMP are based on best available data. Currency and accuracy of data is critical to effective asset and financial management. Data confidence is classified on a 5 level scale19 in accordance with Table 6.5.
Table 6.5: Data Confidence Grading System
Confidence Grade
Description
A Highly reliable Data based on sound records, procedures, investigations and analysis, documented properly and recognised as the best method of assessment. Dataset is complete and estimated to be accurate ± 2%.
B Reliable Data based on sound records, procedures, investigations and analysis, documented properly but has minor shortcomings, for example some of the data is old, some documentation is missing and/or reliance is placed on unconfirmed reports or some extrapolation. Dataset is complete and estimated to be accurate ± 10%.
C Uncertain Data based on sound records, procedures, investigations and analysis which is incomplete or unsupported, or extrapolated from a limited sample for which grade A or B data are available. Dataset is substantially complete but up to 50% is extrapolated data and accuracy estimated ± 25%.
D Very Uncertain Data is based on unconfirmed verbal reports and/or cursory inspections and analysis. Dataset may not be fully complete and most data is estimated or extrapolated. Accuracy ± 40%.
E Unknown None or very little data held.
19 IPWEA, 2011, IIMM, Table 2.4.6, p 2|59.

‐ 50 ‐
CESSNOCK CITY COUNCIL – OPEN SPACE and OTHER STRUCTURES ASSET MANAGEMENT PLAN DOC2013/005329
The estimated confidence level for and reliability of data used in this AM Plan is shown in Table 6.5.1.
Table 6.5.1: Data Confidence Assessment for Data used in AM Plan Data Confidence Assessment CommentDemand drivers
B Based on demographic analysis undertaken in 2014 and State Government projections.
Growth projections B
Based on demographic analysis undertaken in 2014 and State Government projections.
Operations expenditures
C Council financial records, some inaccuracies identified to be reviewed.
Maintenance expenditures
C Council financial records, some inaccuraries identified to be reviewed.
Projected Renewal exps. - Asset values
C Assets revalued in 2010/2011.
- Asset residual values A Assets do not have residual values - Asset useful lives
B Useful lives based on industry standards at the time of 2010/2011 revaluation.
- Condition modelling C
Condition assessment based on 2010/2011 revaluation exercise.
- Network renewals C
To be based on Renewal and Replacement Priority Ranking Criteria Table 5.4.2.
- Defect repairs C
Developed from customer requests and officer inspections.
Upgrade/New expenditures
B
Based on hierarchy, customer requests, capacity/functionality performance, condition & where identified in strategic/master plans. To be based on selection ranking criteria by next version.
Disposal expenditures A No disposals currently identified.
Over all data sources, the data confidence is assessed as medium confidence level for data used in the preparation of this AM Plan. 7. PLAN IMPROVEMENT AND MONITORING 7.1 Status of Asset Management Practices 7.1.1 Accounting and financial systems
Council’s accounting and financial system is CIVICA/Authority. Accountabilities for financial systems The financial systems are primarily managed by Council’s Finance section within the Corporate and Community Services Directorate. Accounting standards and regulations In accounting for Cessnock City Council assets the following statutory requirements shall be adhered to:
Australian Accounting Standards AASB116. NSW Local Government Act 1993. NSW Code of Accounting Practice and Financial Reporting (updated annually). The Australian Infrastructure Financial Management Manual.

‐ 51 ‐
CESSNOCK CITY COUNCIL – OPEN SPACE and OTHER STRUCTURES ASSET MANAGEMENT PLAN DOC2013/005329
Capital renewal/maintenance threshold Operations Maintenance and
Repair Capital Renewal Capital New
Open Space Assets
Mowing
Rubbish removal Reactive
maintenance (broken seat, vandalised play equipment)
Component replace/renew ≤ $2,000.
Component renewal to original standard –benches of a picnic table etc.
Component replace/ renew >$2,000.
New assets
Upgrade
Required changes to accounting financial systems arising from this AM Plan In order to assist with future iterations of this AMP it is recommended that the accounting ledger be restructured to better reflect the different types of expenditure more accurately, i.e. operational, maintenance, capital renewal and capital upgrade. It is also recommended that the work order system is improved for more accurate job planning and control. 7.1.2 Asset management system Cessnock City Council Asset Management Implementation Project included the deployment of MyData (Assetic Software Package) Asset Management System. ASSETIC – MyData MyData, is an ‘Asset Management System’ (AMS) designed to assist with the management of all infrastructure assets as well as the potential to expand to non-infrastructure assets such as fleet, plant, computer, etc. The MyData register has the ability to:
Assign global formulae for remaining life based on age and/or condition. Use predictive modelling as basis for defendable valuations (written down value and
remaining life). Automatically update annual or monthly valuations. Add or remove assets but maintain an archived list. Perform audit trails for changes between two valuations. Import and export reports. Apply a range of unit replacement costs across asset categories. Classify each asset class into various sub-classes.
Asset registers The key information flows into this asset management plan are: • The asset register data on size, age, value, remaining life of the network; • The unit rates for categories of work/material; • The adopted service levels; • Projects of various factors affecting future demand for services; • Correlations between maintenance and renewal, including decay models; • Data on new assets acquired by Council. Linkage from asset management to financial system The key information flows from this Asset Management Plan are: • The assumed asset renewal profile and trends; • The resulting budget, valuation and depreciation projections;

‐ 52 ‐
CESSNOCK CITY COUNCIL – OPEN SPACE and OTHER STRUCTURES ASSET MANAGEMENT PLAN DOC2013/005329
• The useful life analysis. These will impact the long Term Financial Plan, Strategic Business Plan, annual budget and department business plans and budgets. Accountabilities for asset management system and data maintenance See Asset Management Strategy. Required changes to asset management system arising from this AM Plan Changes to the asset management system resulting from this Asset Management Plan may include: • Improving the quality of specific data; • Improving software systems and links to other systems (e.g. GIS) and; • Adopting a more frequent reconciliation cycle between the financial and technical asset
registers.
7.2 Improvement Program
The asset management improvement plan generated from this AMP is shown in the following table:
Table 7.2: Improvement Plan
Task No
Task Responsibility Resources Required
Timeline
1 Review assets covered by this Plan on validation of 15/16 data capture.
Works and Infrastructure/Assets In-house
Prior to the adoption of V3/iteration 2.
2 Undertake further community consultation and review and determine Community Agreed Level of Service for all Open Space and Other Structure Assets.
Works and Infrastructure/Assets
In-house Prior to the adoption of V3/iteration 2.
3 Review and refine technical levels of service
Works and Infrastructure/Assets
In-house Prior to the adoption of V3/iteration 2.
4 Review allocation of funding between maintenance types included in the LTFP.
Works and Infrastructure/Assets and Finance
In-house Prior to the adoption of V3/iteration 2.
5 Review of asset disposal in line with the SPR
Works and Infrastructure/Assets/Planning and Environment
In-house Prior to the adoption of V3/iteration 2.
6 Update the Asset Register with 15/16 data capture and revaluation data.
Works and Infrastructure/Assets In-house Jun-16
7 Develop prediction models once data collection is completed
Works and Infrastructure/Assets
In-house
Prior to the adoption of V3/iteration 2.
8 Implement criteria ranking for forward programs.
Works and Infrastructure/Assets In-house
Prior to the adoption of V3/iteration 2.

‐ 53 ‐
CESSNOCK CITY COUNCIL – OPEN SPACE and OTHER STRUCTURES ASSET MANAGEMENT PLAN DOC2013/005329
Task No
Task Responsibility Resources Required
Timeline
9 Develop a critical assets management plan
Works and Infrastructure/Assets
In-house Prior to the adoption of V3/iteration 2.
10 Obtain Council approval of this Plan
Works and Infrastructure/Assets
In-house Jun-16
NOTE: An independent assessment has been undertaken by an external consultant on Councils’ overall asset maturity. Future iterations of this plan will incorporate any outstanding actions from this report. 7.3 Monitoring and Review Procedures This asset management plan will be reviewed during annual budget planning processes and amended to recognise any material changes in service levels and/or resources available to provide those services as a result of budget decisions. The AMP will be updated annually to ensure it represents the current service level, asset values, projected operations, maintenance, capital renewal and replacement, capital upgrade/new and asset disposal expenditures and projected expenditure values incorporated into the Council’s long term financial plan. The AMP is to be reviewed annually in line with the budget, and a full revision undertaken during the year after the asset class is revalued. 7.4 Performance Measures The effectiveness of the asset management plan can be measured in the following ways:
The degree to which the required projected expenditures identified in this asset management plan are incorporated into Council’s long term financial plan;
The degree to which 1-5 year detailed works programs, budgets, business plans and organisational structures take into account the ‘global’ works program trends provided by the asset management plan;
The degree to which the existing and projected service levels and service consequences (what we cannot do), risks and residual risks are incorporated into the Council’s Strategic Plan and associated plans;
The Asset Renewal Funding Ratio achieving the target of 1.0

‐ 54 ‐
CESSNOCK CITY COUNCIL – OPEN SPACE and OTHER STRUCTURES ASSET MANAGEMENT PLAN DOC2013/005329
8. REFERENCES IPWEA, 2006, ‘International Infrastructure Management Manual’, Institute of Public Works
Engineering Australia, Sydney, www.ipwea.org.au/IIMM IPWEA, 2008, ‘NAMS.PLUS Asset Management’, Institute of Public Works Engineering Australia,
Sydney, www.ipwea.org.au/namsplus. IPWEA, 2009, ‘Australian Infrastructure Financial Management Guidelines’, Institute of Public
Works Engineering Australia, Sydney, www.ipwea.org.au/AIFMG. IPWEA, 2011, ‘International Infrastructure Management Manual’, Institute of Public Works
Engineering Australia, Sydney, www.ipwea.org.au/IIMM Cessnock City Council, Asset Management Policy, Cessnock City Council, Asset Management Strategy, Cessnock City Council, City Management Plan 2010 – 2013, Cessnock City Council, Recreation and Open Space Strategic Plan 2009 Cessnock Community Strategic Plan (Cessnock 2023) Cessnock City Council Community Research Report 2014 Cessnock City Council 2015 Asset Management Research Satisfaction Survey Results Cessnock City Council 2016 – 2017 Draft Operational Plan NAMS.Plus Maturity Assessment Report Cessnock City Council 2014
‐ 55 ‐
CESSNOCK CITY COUNCIL – OPEN SPACE and OTHER STRUCTURES ASSET MANAGEMENT PLAN DOC2013/005329
9. APPENDICES Appendix A Maintenance Response Levels of Service Appendix B 4 Year Capital Works Program Appendix C Budgeted Expenditures Accommodated in LTFP Appendix D Abbreviations Appendix E Glossary

‐ 56 ‐
CESSNOCK CITY COUNCIL – OPEN SPACE and OTHER STRUCTURES ASSET MANAGEMENT PLAN DOC2013/005329
Appendix A Maintenance Response Levels of Service To be developed. Appendix B 4 Year Program: Excerpt CCC Revised Delivery Program 2013-1720 Year 16/17 is under review in conjunction with this round of the IP&R requirements
20 All care is taken to ensure this reflects the most recent revision of the delivery/operation plan, however in some instances last minute changes may occur and may mean there are slight variations between this appendix and the document published on Councils website.

‐ 57 ‐
CESSNOCK CITY COUNCIL – OPEN SPACE and OTHER STRUCTURES ASSET MANAGEMENT PLAN DOC2013/005329
Appendix C Budgeted Expenditures Accommodated in LTFP ($000) Projected Expenditure
2016 2017 2018 2019 2020 2021 2022 2023 2024 2025
Capital Expenditure on Renewal/Replacement of existing assets
$191 $206 $210 $214 $219 $223 $228 $232 $236 $241
Capital Expenditure on Upgrade/New assets
$475 $510 $520 $532 $541 $552 $563 $575 $586 $598
Operational cost of existing assets
$264 $278 $280 $283 $286 $289 $292 $295 $298 $301
Maintenance cost of existing assets
$1,474 $1,493 $1,508 $1,524 $1,539 $1,555 $1,571 $1,587 $1,603 $1,619
Operational cost of New assets
$0 $8 $18 $28 $38 $48 $65 $82 $99 $117
Maintenance cost of New assets
$0 $42 $95 $149 $204 $259 $349 $441 $535 $632
Disposal of Surplus assets
$0 $0 $0 $0 $0 $0 $0 $0 $0 $0

‐ 58 ‐
CESSNOCK CITY COUNCIL – OPEN SPACE and OTHER STRUCTURES ASSET MANAGEMENT PLAN DOC2013/005329
Appendix D Abbreviations AAAC Average annual asset consumption AM Asset management AM Plan/AMP Asset management plan ARI Average recurrence interval ASC Annual service cost BOD Biochemical (biological) oxygen demand CRC Current replacement cost CWMS Community wastewater management systems DA Depreciable amount DRC Depreciated replacement cost EF Earthworks/formation IRMP Infrastructure risk management plan LCC Life Cycle cost LCE Life cycle expenditure LTFP Long term financial plan MMS Maintenance management system PCI Pavement condition index RV Residual value SoA State of the Assets SS Suspended solids vph Vehicles per hour WDCRD Written down current replacement cost
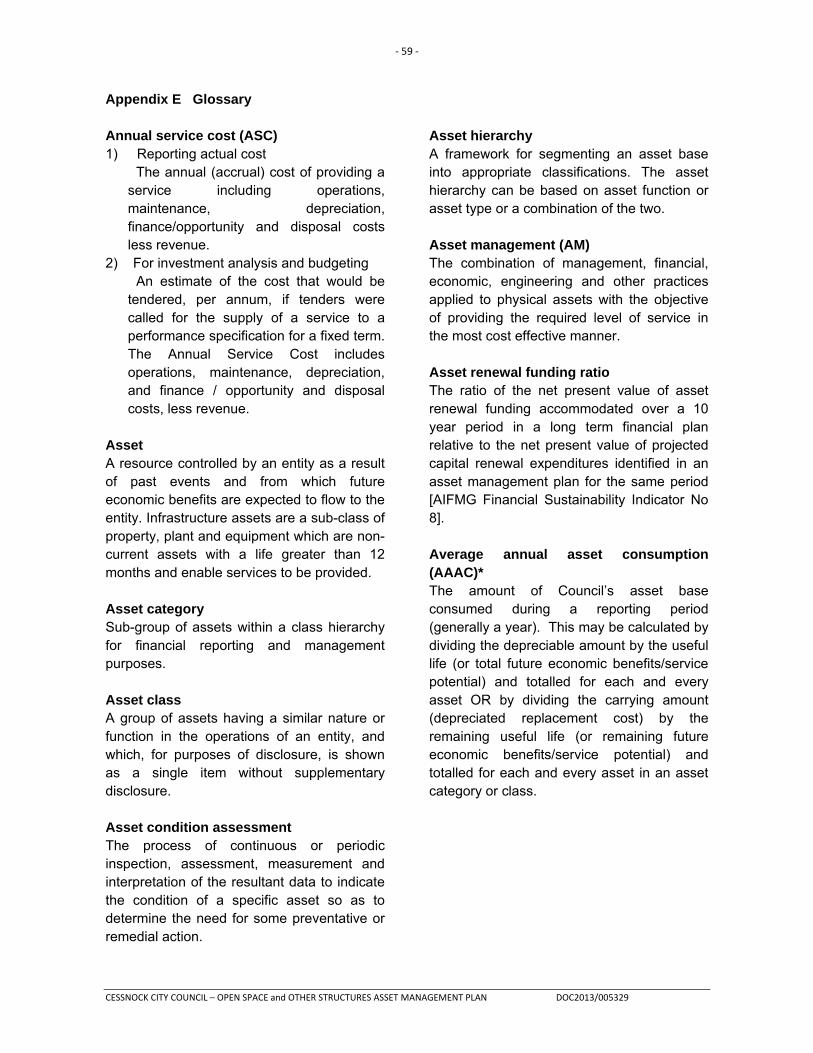
‐ 59 ‐
CESSNOCK CITY COUNCIL – OPEN SPACE and OTHER STRUCTURES ASSET MANAGEMENT PLAN DOC2013/005329
Appendix E Glossary Annual service cost (ASC) 1) Reporting actual cost The annual (accrual) cost of providing a
service including operations, maintenance, depreciation, finance/opportunity and disposal costs less revenue.
2) For investment analysis and budgeting An estimate of the cost that would be
tendered, per annum, if tenders were called for the supply of a service to a performance specification for a fixed term. The Annual Service Cost includes operations, maintenance, depreciation, and finance / opportunity and disposal costs, less revenue.
Asset A resource controlled by an entity as a result of past events and from which future economic benefits are expected to flow to the entity. Infrastructure assets are a sub-class of property, plant and equipment which are non-current assets with a life greater than 12 months and enable services to be provided. Asset category Sub-group of assets within a class hierarchy for financial reporting and management purposes. Asset class A group of assets having a similar nature or function in the operations of an entity, and which, for purposes of disclosure, is shown as a single item without supplementary disclosure. Asset condition assessment The process of continuous or periodic inspection, assessment, measurement and interpretation of the resultant data to indicate the condition of a specific asset so as to determine the need for some preventative or remedial action.
Asset hierarchy A framework for segmenting an asset base into appropriate classifications. The asset hierarchy can be based on asset function or asset type or a combination of the two. Asset management (AM) The combination of management, financial, economic, engineering and other practices applied to physical assets with the objective of providing the required level of service in the most cost effective manner. Asset renewal funding ratio The ratio of the net present value of asset renewal funding accommodated over a 10 year period in a long term financial plan relative to the net present value of projected capital renewal expenditures identified in an asset management plan for the same period [AIFMG Financial Sustainability Indicator No 8]. Average annual asset consumption (AAAC)* The amount of Council’s asset base consumed during a reporting period (generally a year). This may be calculated by dividing the depreciable amount by the useful life (or total future economic benefits/service potential) and totalled for each and every asset OR by dividing the carrying amount (depreciated replacement cost) by the remaining useful life (or remaining future economic benefits/service potential) and totalled for each and every asset in an asset category or class.

‐ 60 ‐
CESSNOCK CITY COUNCIL – OPEN SPACE and OTHER STRUCTURES ASSET MANAGEMENT PLAN DOC2013/005329
Borrowings A borrowing or loan is a contractual obligation of the borrowing entity to deliver cash or another financial asset to the lending entity over a specified period of time or at a specified point in time, to cover both the initial capital provided and the cost of the interest incurred for providing this capital. A borrowing or loan provides the means for the borrowing entity to finance outlays (typically physical assets) when it has insufficient funds of its own to do so, and for the lending entity to make a financial return, normally in the form of interest revenue, on the funding provided. Capital expenditure Relatively large (material) expenditure, which has benefits, expected to last for more than 12 months. Capital expenditure includes renewal, expansion and upgrade. Where capital projects involve a combination of renewal, expansion and/or upgrade expenditures, the total project cost needs to be allocated accordingly. Capital expenditure - expansion Expenditure that extends the capacity of an existing asset to provide benefits, at the same standard as is currently enjoyed by existing beneficiaries, to a new group of users. It is discretionary expenditure, which increases future operations and maintenance costs, because it increases the Council’s asset base, but may be associated with additional revenue from the new user group, e.g. extending a drainage or road network, the provision of an oval or park in a new suburb for new residents. Capital expenditure - new Expenditure which creates a new asset providing a new service/output that did not exist beforehand. As it increases service potential it may impact revenue and will increase future operations and maintenance expenditure.
Capital expenditure - renewal Expenditure on an existing asset or on replacing an existing asset, which returns the service capability of the asset up to that which it had originally. It is periodically required expenditure, relatively large (material) in value compared with the value of the components or sub-components of the asset being renewed. As it reinstates existing service potential, it generally has no impact on revenue, but may reduce future operations and maintenance expenditure if completed at the optimum time, e.g. resurfacing or resheeting a material part of a road network, replacing a material section of a drainage network with pipes of the same capacity, resurfacing an oval. Capital expenditure - upgrade Expenditure, which enhances an existing asset to provide a higher level of service or expenditure that will increase the life of the asset beyond that which it had originally. Upgrade expenditure is discretionary and often does not result in additional revenue unless direct user charges apply. It will increase operations and maintenance expenditure in the future because of the increase in the Council’s asset base, e.g. widening the sealed area of an existing road, replacing drainage pipes with pipes of a greater capacity, enlarging a grandstand at a sporting facility. Capital funding Funding to pay for capital expenditure. Capital grants Monies received generally tied to the specific projects for which they are granted, which are often upgrade and/or expansion or new investment proposals. Capital investment expenditure See capital expenditure definition.

‐ 61 ‐
CESSNOCK CITY COUNCIL – OPEN SPACE and OTHER STRUCTURES ASSET MANAGEMENT PLAN DOC2013/005329
Capitalisation threshold The value of expenditure on non-current assets above which the expenditure is recognised as capital expenditure and below which the expenditure is charged as an expense in the year of acquisition. Carrying amount The amount at which an asset is recognised after deducting any accumulated depreciation/amortisation and accumulated impairment losses thereon. Class of assets See asset class definition. Component Specific parts of an asset having independent physical or functional identity and having specific attributes such as different life expectancy, maintenance regimes, risk or criticality. Core asset management Asset management which relies primarily on the use of an asset register, maintenance management systems, job resource management, inventory control, condition assessment, simple risk assessment and defined levels of service, in order to establish alternative treatment options and long-term cashflow predictions. Priorities are usually established on the basis of financial return gained by carrying out the work (rather than detailed risk analysis and optimised decision- making). Cost of an asset The amount of cash or cash equivalents paid or the fair value of the consideration given to acquire an asset at the time of its acquisition or construction, including any costs necessary to place the asset into service. This includes one-off design and project management costs.
Critical assets Assets for which the financial, business or service level consequences of failure are sufficiently severe to justify proactive inspection and rehabilitation. Critical assets have a lower threshold for action than non-critical assets. Current replacement cost (CRC) The cost the entity would incur to acquire the asset on the reporting date. The cost is measured by reference to the lowest cost at which the gross future economic benefits could be obtained in the normal course of business or the minimum it would cost, to replace the existing asset with a technologically modern equivalent new asset (not a second hand one) with the same economic benefits (gross service potential) allowing for any differences in the quantity and quality of output and in operating costs. Deferred maintenance The shortfall in rehabilitation work undertaken relative to that required to maintain the service potential of an asset. Depreciable amount The cost of an asset, or other amount substituted for its cost, less its residual value. Depreciated replacement cost (DRC) The current replacement cost (CRC) of an asset less, where applicable, accumulated depreciation calculated on the basis of such cost to reflect the already consumed or expired future economic benefits of the asset. Depreciation / amortisation The systematic allocation of the depreciable amount (service potential) of an asset over its useful life. Economic life See useful life definition.

‐ 62 ‐
CESSNOCK CITY COUNCIL – OPEN SPACE and OTHER STRUCTURES ASSET MANAGEMENT PLAN DOC2013/005329
Expenditure The spending of money on goods and services. Expenditure includes recurrent and capital outlays. Expenses Decreases in economic benefits during the accounting period in the form of outflows or depletions of assets or increases in liabilities that result in decreases in equity, other than those relating to distributions to equity participants. Fair value The amount for which an asset could be exchanged, or a liability settled, between knowledgeable, willing parties, in an arm’s length transaction. Financing gap A financing gap exists whenever an entity has insufficient capacity to finance asset renewal and other expenditure necessary to be able to appropriately maintain the range and level of services its existing asset stock was originally designed and intended to deliver. The service capability of the existing asset stock should be determined assuming no additional operating revenue, productivity improvements, or net financial liabilities above levels currently planned or projected. A current financing gap means service levels have already or are currently falling. A projected financing gap if not addressed will result in a future diminution of existing service levels. Heritage asset An asset with historic, artistic, scientific, technological, geographical or environmental qualities that is held and maintained principally for its contribution to knowledge and culture and this purpose is central to the objectives of the entity holding it. Impairment Loss The amount by which the carrying amount of an asset exceeds its recoverable amount.
Infrastructure assets Physical assets that contribute to meeting the needs of Councils or the need for access to major economic and social facilities and services, e.g. roads, drainage, footpaths and cycleways. These are typically large, interconnected networks or portfolios of composite assets. The components of these assets may be separately maintained, renewed or replaced individually so that the required level and standard of service from the network of assets is continuously sustained. Generally the components and hence the assets have long lives. They are fixed in place and are often have no separate market value. Investment property Property held to earn rentals or for capital appreciation or both, rather than for: (a) Use in the production or supply of goods
or services or for administrative purposes; or
(b) Sale in the ordinary course of business. Key performance indicator A qualitative or quantitative measure of a service or activity used to compare actual performance against a standard or other target. Performance indicators commonly relate to statutory limits, safety, responsiveness, cost, comfort, asset performance, reliability, efficiency, environmental protection and customer satisfaction. Level of service The defined service quality for a particular service/activity against which service performance may be measured. Service levels usually relate to quality, quantity, reliability, responsiveness, environmental impact, acceptability and cost.

‐ 63 ‐
CESSNOCK CITY COUNCIL – OPEN SPACE and OTHER STRUCTURES ASSET MANAGEMENT PLAN DOC2013/005329
Life Cycle Cost * 1. Total LCC The total cost of an asset
throughout its life including planning, design, construction, acquisition, operation, maintenance, rehabilitation and disposal costs.
2. Average LCC The life cycle cost (LCC) is average cost to provide the service over the longest asset life cycle. It comprises average operations, maintenance expenditure plus asset consumption expense, represented by depreciation expense projected over 10 years. The Life Cycle Cost does not indicate the funds required to provide the service in a particular year.
Life Cycle Expenditure The Life Cycle Expenditure (LCE) is the average operations, maintenance and capital renewal expenditure accommodated in the long term financial plan over 10 years. Life Cycle Expenditure may be compared to average Life Cycle Cost to give an initial indicator of affordability of projected service levels when considered with asset age profiles. Loans / borrowings See borrowings. Maintenance All actions necessary for retaining an asset as near as practicable to an appropriate service condition, including regular ongoing day-to-day work necessary to keep assets operating, e.g. road patching but excluding rehabilitation or renewal. It is operating expenditure required to ensure that the asset reaches its expected useful life. • Planned maintenance
Repair work that is identified and managed through a maintenance management system (MMS). MMS activities include inspection, assessing the condition against failure/breakdown criteria/experience, prioritising scheduling, actioning the work and reporting what was done to develop a maintenance
history and improve maintenance and service delivery performance.
• Reactive maintenance Unplanned repair work that is carried out in response to service requests and management/ supervisory directions.
• Specific maintenance Maintenance work to repair components or replace sub-components that need to be identified as a specific maintenance item in the maintenance budget.
• Unplanned maintenance Corrective work required in the short-term to restore an asset to working condition so it can continue to deliver the required service or to maintain its level of security and integrity.
Maintenance expenditure * Recurrent expenditure, which is periodically or regularly required as part of the anticipated schedule of works required to ensure that the asset achieves its useful life and provides the required level of service. It is expenditure, which was anticipated in determining the asset’s useful life. Materiality The notion of materiality guides the margin of error acceptable, the degree of precision required and the extent of the disclosure required when preparing general purpose financial reports. Information is material if its omission, misstatement or non-disclosure has the potential, individually or collectively, to influence the economic decisions of users taken on the basis of the financial report or affect the discharge of accountability by the management or governing body of the entity. Modern equivalent asset Assets that replicate what is in existence with the most cost-effective asset performing the same level of service. It is the most cost efficient, currently available asset which will provide the same stream of services as the existing asset is capable of producing. It allows for technology changes and, improvements and efficiencies in production and installation techniques.

‐ 64 ‐
CESSNOCK CITY COUNCIL – OPEN SPACE and OTHER STRUCTURES ASSET MANAGEMENT PLAN DOC2013/005329
Net present value (NPV) The value to the Council of the cash flows associated with an asset, liability, activity or event calculated using a discount rate to reflect the time value of money. It is the net amount of discounted total cash inflows after deducting the value of the discounted total cash outflows arising from e.g. the continued use and subsequent disposal of the asset after deducting the value of the discounted total cash outflows. Non-revenue generating investments Investments for the provision of goods and services to sustain or improve services to the community that are not expected to generate any savings or revenue to the Council, e.g. parks and playgrounds, footpaths, roads and bridges, libraries, etc. Operations Regular activities to provide services such as public health, safety and amenity, e.g. street sweeping, grass mowing and street lighting. Operating expenditure Recurrent expenditure, which is continuously required to provide a service. In common use the term typically includes, e.g. power, fuel, staff, plant equipment, on-costs and overheads but excludes maintenance and depreciation. Maintenance and depreciation is on the other hand included in operating expenses. Operating expense The gross outflow of economic benefits, being cash and non-cash items, during the period arising in the course of ordinary activities of an entity when those outflows result in decreases in equity, other than decreases relating to distributions to equity participants.
Operating expenses Recurrent expenses continuously required to provide a service, including power, fuel, staff, plant equipment, maintenance, depreciation, on-costs and overheads.
Operations, maintenance and renewal financing ratio Ratio of estimated budget to projected expenditure for operations, maintenance and renewal of assets over a defined time (e.g. 5, 10 and 15 years). Operations, maintenance and renewal gap Difference between budgeted expenditures in a long term financial plan (or estimated future budgets in absence of a long term financial plan) and projected expenditures for operations, maintenance and renewal of assets to achieve/maintain specified service levels, totalled over a defined time (e.g. 5, 10 and 15 years). Pavement management system (PMS) A systematic process for measuring and predicting the condition of road pavements and wearing surfaces over time and recommending corrective actions. PMS Score A measure of condition of a road segment determined from a Pavement Management System. Rate of annual asset consumption * The ratio of annual asset consumption relative to the depreciable amount of the assets. It measures the amount of the consumable parts of assets that are consumed in a period (depreciation) expressed as a percentage of the depreciable amount.
Rate of annual asset renewal * The ratio of asset renewal and replacement expenditure relative to depreciable amount for a period. It measures whether assets are being replaced at the rate they are wearing out with capital renewal expenditure expressed as a percentage of depreciable amount (capital renewal expenditure/DA).

‐ 65 ‐
CESSNOCK CITY COUNCIL – OPEN SPACE and OTHER STRUCTURES ASSET MANAGEMENT PLAN DOC2013/005329
Rate of annual asset upgrade/new * A measure of the rate at which assets are being upgraded and expanded per annum with capital upgrade/new expenditure expressed as a percentage of depreciable amount (capital upgrade/expansion expenditure/DA). Recoverable amount The higher of an asset's fair value, less costs to sell and its value in use. Recurrent expenditure Relatively small (immaterial) expenditure or that which has benefits expected to last less than 12 months. Recurrent expenditure includes operations and maintenance expenditure. Recurrent funding Funding to pay for recurrent expenditure. Rehabilitation See capital renewal expenditure definition above. Remaining useful life The time remaining until an asset ceases to provide the required service level or economic usefulness. Age plus remaining useful life is useful life. Renewal See capital renewal expenditure definition above. Residual value The estimated amount that an entity would currently obtain from disposal of the asset, after deducting the estimated costs of disposal, if the asset were already of the age and in the condition expected at the end of its useful life. Revenue generating investments Investments for the provision of goods and services to sustain or improve services to the community that are expected to generate some savings or revenue to offset operating costs, e.g. public halls and theatres, childcare
centres, sporting and recreation facilities, tourist information centres, etc. Risk management The application of a formal process to the range of possible values relating to key factors associated with a risk in order to determine the resultant ranges of outcomes and their probability of occurrence. Section or segment A self-contained part or piece of an infrastructure asset. Service potential The total future service capacity of an asset. It is normally determined by reference to the operating capacity and economic life of an asset. A measure of service potential is used in the not-for-profit sector/public sector to value assets, particularly those not producing a cash flow. Service potential remaining A measure of the future economic benefits remaining in assets. It may be expressed in dollar values (Fair Value) or as a percentage of total anticipated future economic benefits. It is also a measure of the percentage of the asset’s potential to provide services that is still available for use in providing services (Depreciated Replacement Cost/Depreciable Amount).
Specific Maintenance Replacement of higher value components/sub-components of assets that is undertaken on a regular cycle including repainting, replacement of air conditioning equipment, etc. This work generally falls below the capital/maintenance threshold and needs to be identified in a specific maintenance budget allocation.

‐ 66 ‐
CESSNOCK CITY COUNCIL – OPEN SPACE and OTHER STRUCTURES ASSET MANAGEMENT PLAN DOC2013/005329
Strategic Longer-Term Plan A plan covering the term of office of councillors (4 years minimum) reflecting the needs of the community for the foreseeable future. It brings together the detailed requirements in the Council’s longer-term plans such as the asset management plan and the long-term financial plan. The plan is prepared in consultation with the community and details where the Council is at that point in time, where it wants to go, how it is going to get there, mechanisms for monitoring the achievement of the outcomes and how the plan will be resourced. Sub-component Smaller individual parts that make up a component part. Useful life Either: (a) The period over which an asset is
expected to be available for use by an entity, or
(b) The number of production or similar units expected to be obtained from the asset by the entity.
It is estimated or expected time between placing the asset into service and removing it from service, or the estimated period of time over which the future economic benefits embodied in a depreciable asset, are expected to be consumed by the Council.
Value in Use The present value of future cash flows expected to be derived from an asset or cash generating unit. It is deemed to be depreciated replacement cost (DRC) for those assets whose future economic benefits are not primarily dependent on the asset's ability to generate net cash inflows, where the entity would, if deprived of the asset, replace its remaining future economic benefits. Source: IPWEA, 2009, Glossary Additional and modified glossary items shown *