Embed Size (px)
Citation preview

Type of Distribution to Consolidate: Orig & Dest MODS/BPI OfficeFacility Name & Type:
Street Address:City: Mid Florida
State: FL5D Facility ZIP Code: 32799
District: SuncoastArea: Southwest
Finance Number: 115945Current 3D ZIP Code(s):
Miles to Gaining Facility: 30.5EXFC office: Yes
Plant Manager:Senior Plant Manager:
District Manager:Facility Type after AMP: CLOSED
Facility Name & Type:Street Address:
City:State: FL
5D Facility ZIP Code: 32862District: Suncoast
Area: SouthwestFinance Number: 116916
Current 3D ZIP Code(s):EXFC office: Yes
Plant Manager:Senior Plant Manager:
District Manager:
Start of Study: 9/15/2011Date Range of Data: Jul-01-2010 : Jun-30-2011
Processing Days per Year: 310Bargaining Unit Hours per Year: 1,745
EAS Hours per Year: 1,822
June 16, 2011
2/15/2012 8:54
Area Vice President:Vice President, Network Operations:
Area AMP Coordinator:HQ AMP Coordinator:
rev 10/10/2011
----- AMP Data Entry Page -----
Mid Florida P&DC800 Rinehart Rd.
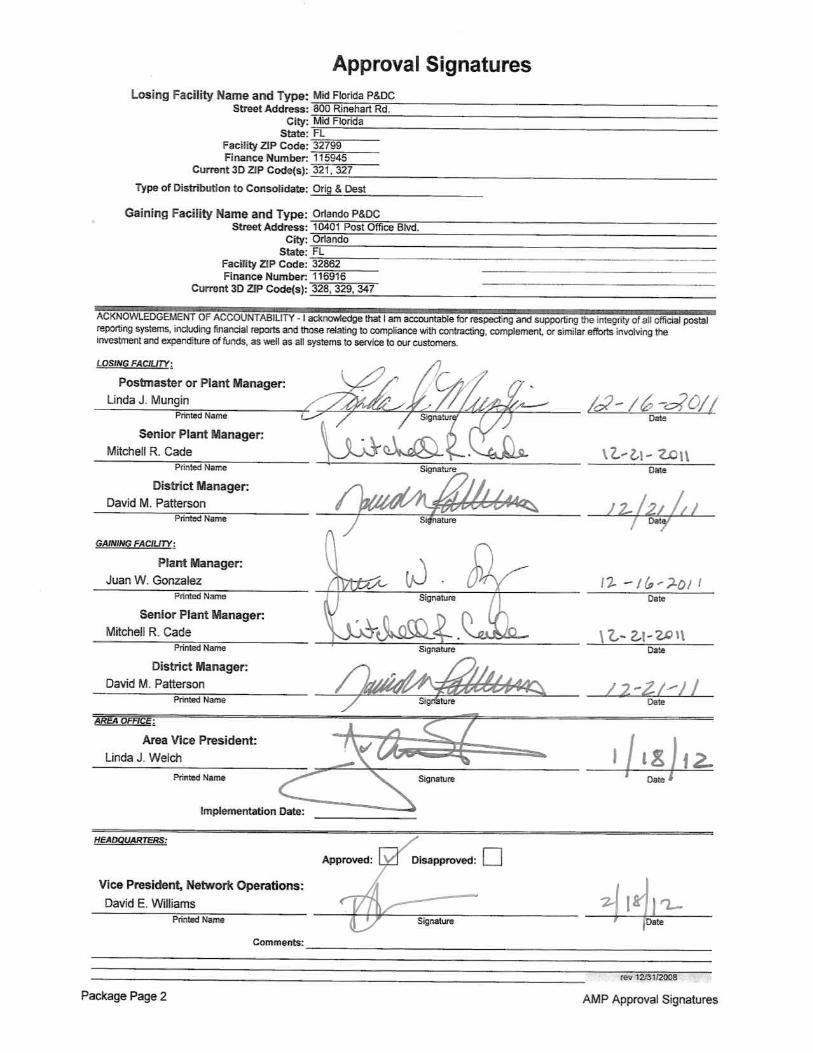
Linda J. Mungin
1. Losing Facility Information
Sarah Grover
321, 327
Mitchell R. CadeDavid M. Patterson
Jo Ann FeindtDavid E. Williams
David M. Patterson
Orlando P&DC10401 Post Office Blvd.
Juan W. Gonzalez
4. Other Information
Mitchell R. Cade
Orlando
328, 329, 347
2. Gaining Facility Information
Steve Jackson
Date & Time this workbook was last saved:
3. Background Information
Date of HQ memo, DAR Factors/Cost of Borrowing/ New Facility Start-up Costs Update
Package Page 1 AMP Data Entry Page

Losing Facility Name and Type:Street Address:
City, State:Current 3D ZIP Code(s):
Type of Distribution to Consolidate:
Gaining Facility Name and Type:Current 3D ZIP Code(s):
= $5,919,293
= $953,475
= $2,023,664= ($1,341,285) from Transportation (HCR and PVS)
= $6,338,749 from Maintenance
= $0 from Space Evaluation and Other Costs
= $13,893,895
= $171,502 from Space Evaluation and Other Costs
= $13,722,393
= 151 from Staffing - Craft
= 14 from Staffing - PCES/EAS
= 1,998,308 from Workhour Costs - Current
= 3,594,669 from Workhour Costs - Current
= 162,252
ADV ADV ADV %First-Class Mail® 0 0 0 #DIV/0!
Priority Mail® 0 0 0 #DIV/0!Package Services 0 0 0 #DIV/0!
Periodicals N/A* N/A* N/A* N/A*Standard Mail N/A* N/A* N/A* N/A*
Code to destination 3-digit ZIP Code volume is notavailable
Unchanged + Upgrades
Executive SummaryLast Saved: February 15, 2012
Mid Florida P&DC800 Rinehart Rd.Mid Florida, FL321, 327Orig & Dest Miles to Gaining Facility: 30.5
Orlando P&DC328, 329, 347
Summary of AMP WorksheetsSavings/Costs
Mail Processing Craft Workhour Savings from Workhour Costs - Proposed
Non-MP Craft/EAS + Shared LDCs Workhour Savings (less Maint/Trans) from Other Curr vs Prop
PCES/EAS Supervisory Workhour Savings from Other Curr vs Prop
Transportation SavingsMaintenance Savings
Space Savings
Total Annual Savings
Total One-Time Costs
Total First Year Savings
Staffing PositionsCraft Position Loss
PCES/EAS Position Loss
Volume
Service
rev 10/15/2009
Total FHP to be Transferred (Average Daily Volume)
Current FHP at Gaining Facility (Average Daily Volume)
Losing Facility Cancellation Volume (Average Daily Volume) (= Total TPH / Operating Days)
Service Standard Impacts by ADV
UPGRADED DOWNGRADED Unchanged + Upgrades
Package Page 3 AMP Executive Summary

Losing Facility Name and Type:Current 3D ZIP Code(s):
Type of Distribution to Consolidate:
Gaining Facility Name and Type:Current 3D ZIP Code(s):
rev 06/10/2009
February 15, 2012
328, 329, 347
Orig & Dest
Summary NarrativeLast Saved:
Mid Florida P&DC
Orlando P&DC
321, 327
BACKGROUND This is a summary of the feasibility study for the consolidation of Originating and Destinating and all remaining mail from the Mid-Florida P&DC (ZIP 321,327) to the Orlando P&DC (ZIP 328,329,347) with the intent of closing the Mid-Florida P&DC facility to all mail processing and Plant domiciled operations. The Mid-Florida P&DC is approximately 31 miles from Orlando P&DC. This AMP feasibility study is due to the significant decline in originating and destinating volumes and toincreased efficiencies. The current FHP to be transferred (Average Daily Volume) from the Mid-Florida P&DC is 2,083,043 pieces. The Mid-Florida P&DC currently processes cancellation volume for SCF 321 & 327 from Monday-Friday, with the Saturday collection volume processed at the Orlando P&DC. The Orlando Annex currently processes the Originating and Destinating Priority Mail, Primary Flats and FCM SPRS’s for SCF 321 & 327, and would maintain those mail type distribution responsibilities. The results of this feasibility study are based on the requirement of realigning current Service Standards within the ADC and AADC network. FINANCIAL SUMMARY The annual baseline data for this AMP feasibility study is taken from the period of July 1, 2010 – June 30, 2011. Financial savings proposed for this consolidation of an average daily volume of 2,083,043 FHP originating and destinating from the Mid-Florida P&DC into the Orlando FL P&DC are: Total First Year Savings $13,722,393 Total Annual Savings $13,893,895 A one-time cost of $171,502 will be incurred for facility construction and relocation of mail processing equipment transferred from the Mid-Florida P&DC to the Orlando P&DC. These savings do not include the cost of leasing the Orlando P&DC at $798K annually. CUSTOMER & SERVICE IMPACTS There are no Retail Windows or Box Sections located within the Mid-Florida P&DC. Local area collection box pick up times will remain unchanged and a local postmark will continue to be available at local offices. Specific service standard changes associated with this Area Mail Processing consolidation are contingent upon the resolution of both (a) the rulemaking in which current market dominant product service standards in 39 CFR Part 121 are being evaluated, and (b) all remaining AMP consolidation proposals that are part of the same network rationalization initiative. A complete file reflecting any new service standards will be published at www.usps.com once all of the related AMP decisions that provide the foundation for new service standards are made. Priority and Express Mail service standards will be based upon the capability of the network. The FSO Preliminary Node Study Recommendation is to dispose of the Mid-Florida P&DC facility if the AMP is approved. The BMEU operations will be moved to the Lake Mary Main Office, 1.12 miles away.The staffing and work hours for the BMEU are under the Finance # 115949 and were not modified in the AMP Study.
Package Page 4 AMP Summary Narrative
rev 06/10/2009
Summary Narrative (continued)Summary Narrative Page 2
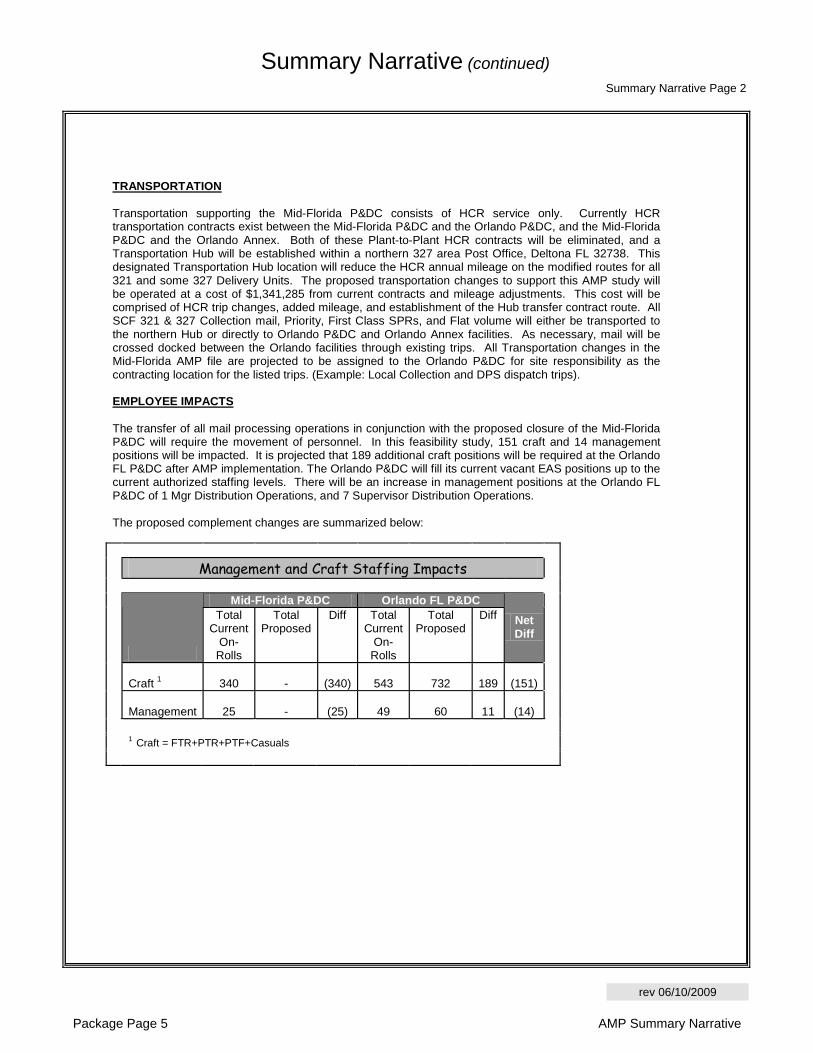
TRANSPORTATION Transportation supporting the Mid-Florida P&DC consists of HCR service only. Currently HCR transportation contracts exist between the Mid-Florida P&DC and the Orlando P&DC, and the Mid-Florida P&DC and the Orlando Annex. Both of these Plant-to-Plant HCR contracts will be eliminated, and a Transportation Hub will be established within a northern 327 area Post Office, Deltona FL 32738. This designated Transportation Hub location will reduce the HCR annual mileage on the modified routes for all 321 and some 327 Delivery Units. The proposed transportation changes to support this AMP study will be operated at a cost of $1,341,285 from current contracts and mileage adjustments. This cost will be comprised of HCR trip changes, added mileage, and establishment of the Hub transfer contract route. All SCF 321 & 327 Collection mail, Priority, First Class SPRs, and Flat volume will either be transported to the northern Hub or directly to Orlando P&DC and Orlando Annex facilities. As necessary, mail will be crossed docked between the Orlando facilities through existing trips. All Transportation changes in the Mid-Florida AMP file are projected to be assigned to the Orlando P&DC for site responsibility as the contracting location for the listed trips. (Example: Local Collection and DPS dispatch trips). EMPLOYEE IMPACTS The transfer of all mail processing operations in conjunction with the proposed closure of the Mid-Florida P&DC will require the movement of personnel. In this feasibility study, 151 craft and 14 management positions will be impacted. It is projected that 189 additional craft positions will be required at the Orlando FL P&DC after AMP implementation. The Orlando P&DC will fill its current vacant EAS positions up to the current authorized staffing levels. There will be an increase in management positions at the Orlando FL P&DC of 1 Mgr Distribution Operations, and 7 Supervisor Distribution Operations. The proposed complement changes are summarized below:
Management and Craft Staffing Impacts Mid-Florida P&DC Orlando FL P&DC
Total Current
On-Rolls
Total Proposed
Diff Total Current
On-Rolls
Total Proposed
Diff Net Diff
Craft 1
340 -
(340)
543
732
189
(151)
Management
25 -
(25)
49
60
11
(14)
1 Craft = FTR+PTR+PTF+Casuals
Package Page 5 AMP Summary Narrative

rev 06/10/2009
Summary Narrative Page 3Summary Narrative (continued)
Mail Processing Management to Craft Ratio Current Proposed
SDOs to Craft 1
MDOs+SDOs to Craft 1
SDOs to Craft 1
MDOs+SDOs to Craft 1
Management to Craft 2 Ratios
(1:25 target)
(1:22 target) (1:25 target)
(1:22 target)
Mid-Florida P&DC 1 : 17 1 : 16 #DIV/0! #DIV/0!
Orlando FL P&DC 1 : 25 1 : 22 1 : 23 1 : 20
1 Craft = FTR+PTR+PTF+Casuals 2 Craft = F1 + F4 at Losing; F1 only at Gaining
As a matter of policy, the Postal Service follows the Worker Adjustment and Retraining Notification Act's ("WARN") notification requirements when the number of employees experiencing an employment loss within the meaning of WARN would trigger WARN's requirements. Some or all of the impacted employees described above may not experience an employment loss within the meaning of WARN due to transfers or reassignments. EQUIPMENT RELOCATION AND MAINTENANCE IMPACTS The AMP feasibility study projects an annual Maintenance savings of $6,338,749. Equipment identified for relocation from the Mid-Florida P&DC to support operations at the Orlando FL P&DC include 1 DIOSS, 3 CIOSS and all existing powered industrial equipment. The additional DIOSS will be required to process the volumes from Mid-Florida and the other recently completed AMP (Daytona mail). A one-time cost of $96,502 will be required for the relocation of mail processing equipment. Remaining equipment at the Mid-Florida P&DC will be excessed to other sites with no costs incurred to the AMP study. FACILITY SHARED IMPACTS The Mid-Florida P&DC facility houses the Mid-Florida mail processing operations, a CFS Unit, a BMEU operation, and Suncoast District/SWA/HQ domicile administrative offices. The Mid-Florida property also contains a Vehicle Maintenance Facility. The Mid-Florida CFS Unit has 36 FFTs and 1 PARS/COA scanning workstation. The CFS operation’s workroom contains ~8,500 sq ft interior space and shares ~1,500 sq ft of MP workroom for equipment staging. The Mid-Florida BMEU operation has 3 Mail Acceptance workstations and 3 Merlin machines. The BMEU work area contains ~2,000 sq ft interior space and shares ~3,500 sq ft of Dock Platform space for equipment staging. The Mid-Florida facility houses several domicile administrative offices for Suncoast District, SWA, and HQ reporting personnel. For Suncoast, offices are utilized for District Finance, Labor, Safety, and MPOO-B. For SWA, offices are utilized for Equal Employment Opportunity case work. For HQ, offices are utilized for Finance, Diversity, and Sales. A Vehicle Maintenance Facility is located in the NW corner of the property. The Mid-Florida VMF has 14 vehicle repair work bays and a vehicle storage area.
Package Page 6 AMP Summary Narrative

rev 06/10/2009
Summary Narrative (continued)Summary Narrative Page 4
SPACE IMPACTS If the AMP feasibility study is approved, all of the Mail Processing 142,800 interior sq ft Mid-Florida P&DC facility and overall Total facility space of 340,989 sq ft will be gained from the AMP. All MP functions within the facility will be consolidated into available space at the Orlando FL P&DC, Orlando Annex or other local facilities. IMPLEMENTATION PLAN The volume and workhours will be transferred to Orlando by the study, but a local transfer will be needed if the AMP is implemented. This will include the MP machines of 1 DIOSS and 3 CIOSS that will be moved to the Orlando P&DC. The CFS Unit equipment currently being utilized at the Mid-Florida P&DCwill be consolidated into the Tampa CFS Unit. The implementation of the Mail Processing equipment and the mail movement would be accomplished in one phase. Due to the complexity of the required transportation changes, it will not be possible to make the mail transfer in stages. The CFS Unit and BMEU moves can be accomplished in separate transfer phases if necessary. OTHER CONCURRENT AND COMPLETED INITIATIVES In this feasibility study, volume and work hours for the Orlando P&DC and the Mid-Florida P&DC are included, as per the format of the Headquarters AMP package. The full AMP of the Daytona P&DC was recently completed on June 28, 2011 and was not included in the MODS volumes or workhour database. The Daytona P&DC AMP mail processing operations were split as follows: all Letter and secondary Flats processing to the Mid-Florida P&DC, and Priority, SPRs, Bundles, and Flats primary processing to the Orlando Annex. The one remaining AFSM at the Mid-Florida P&DC has been identified for relocation to the Orlando Annex to consolidate all AFSM and FSS machine processing into a single facility for SCF 321, 327 – 329, & 347. Workhours and volume for the remaining AFSM were removed from the data in Mid-Florida and will need to be transferred to the Orlando L&DC finance number when the transfer occurs. A CFS Operations consolidation review is being conducted involving the Suncoast District AMP team,P&DC Management staff, SWA AMP coordinators, and the SWA FSO. Implementation of a CFS Operations workload consolidation can proceed independently from this AMP plan. SUMMARY There is a First year savings of $13,722,393. The first year savings reflects only the mail processingoperations included in the AMP study. This figure does not account for the workload, cost, and savings from other concurrent initiatives being considered at these facilities. After all mail processing operations have been relocated, the Mid-Florida P&DC building will be vacant. The Mid-Florida property will retain a Vehicle Maintenance facility not associated with this mail processing AMP. This Area Mail Processing plan to consolidate all of the Mid-Florida P&DC operations into the OrlandoP&DC will result in a savings to the Postal Service of approximately $13,893,895 per year if approved. This consolidation of operations will increase processing efficiency, create substantial financial savings,and be accomplished with no inconvenience to our customers.
Package Page 7 AMP Summary Narrative

Losing Facility Name and Type:Current 3D ZIP Code(s):
Type of Distribution to Consolidate:
Gaining Facility Name and Type:Current 3D ZIP Code(s):
rev 04/2/2008
24 Hour ClockLast Saved:
Mid Florida P&DC
Orlando P&DC
321, 327
February 15, 2012
328, 329, 347
Orig & Dest
Wee
kly
Tren
dsBeg
inni
ng D
ay
Faci
lity
Can
celle
d by
200
0D
ata
Sour
ce =
ED
W M
CR
S
OG
P C
lear
ed b
y 23
00D
ata
Sour
ce =
ED
W E
OR
OG
S C
lear
ed b
y 24
00D
ata
Sour
ce =
ED
W E
OR
MM
P Cle
ared
by
2400
Dat
a So
urce
= E
DW
EO
R
MM
P Vol
ume
On
Han
d at
240
0D
ata
Sour
ce =
ED
W M
CR
S
Mai
l Ass
igne
d C
omm
erci
al /
FedE
x By
0230
Dat
a So
urce
= E
DW
SAS
S
DPS
2nd
Pas
s C
lear
ed b
y 07
00D
ata
Sour
ce =
ED
W E
OR
Trip
s O
n-Ti
me
0400
- 09
00Dat
a Sou
rce
= EDW
TIM
ES
%
2-Apr SAT 4/2 ORLANDO P&DC 63.4% 96.4% 97.9% 94.8% 1.6 85.1% 100.0% 90.6%9-Apr SAT 4/9 ORLANDO P&DC 66.8% 99.8% 98.8% 93.7% 1.3 85.8% 99.9% 91.4%
16-Apr SAT 4/16 ORLANDO P&DC 67.7% 98.0% 98.9% 92.6% 1.8 98.1% 100.0% 84.4%23-Apr SAT 4/23 ORLANDO P&DC 69.1% 100.0% 99.7% 95.0% 1.0 99.5% 100.0% 74.0%30-Apr SAT 4/30 ORLANDO P&DC 61.9% 99.0% 98.8% 94.9% 1.2 87.6% 100.0% 87.0%7-May SAT 5/7 ORLANDO P&DC 57.7% 98.1% 100.0% 96.1% 1.0 99.7% 100.0% 85.1%
14-May SAT 5/14 ORLANDO P&DC 60.5% 95.5% 95.5% 97.9% 1.0 92.2% 100.0% 95.0%21-May SAT 5/21 ORLANDO P&DC 66.4% 99.8% 97.4% 94.4% 0.9 99.0% 100.0% 91.8%28-May SAT 5/28 ORLANDO P&DC 59.8% 97.3% 96.8% 95.1% 0.9 94.6% 100.0% 87.9%
4-Jun SAT 6/4 ORLANDO P&DC 60.8% 98.4% 97.7% 96.8% 1.2 93.0% 100.0% 90.3%11-Jun SAT 6/11 ORLANDO P&DC 60.3% 97.2% 98.6% 97.7% 0.9 99.8% 100.0% 87.1%18-Jun SAT 6/18 ORLANDO P&DC 58.1% 94.7% 89.9% 97.1% 1.1 85.6% 100.0% 87.6%25-Jun SAT 6/25 ORLANDO P&DC 67.9% 94.3% 97.5% 98.0% 1.0 79.9% 99.9% 82.7%
2-Jul SAT 7/2 ORLANDO P&DC 66.1% 95.3% 96.8% 95.2% 1.1 65.8% 100.0% 79.1%9-Jul SAT 7/9 ORLANDO P&DC 63.8% 97.1% 98.6% 96.0% 1.4 87.1% 99.7% 81.0%
16-Jul SAT 7/16 ORLANDO P&DC 62.7% 95.2% 98.0% 99.3% 0.9 81.7% 100.0% 94.3%23-Jul SAT 7/23 ORLANDO P&DC 65.5% 96.9% 98.9% 95.8% 1.1 91.9% 100.0% 93.1%30-Jul SAT 7/30 ORLANDO P&DC 60.6% 94.7% 95.8% 95.6% 1.0 95.9% 99.9% 89.9%6-Aug SAT 8/6 ORLANDO P&DC 66.4% 98.3% 98.5% 95.2% 1.3 92.1% 99.9% 82.6%
13-Aug SAT 8/13 ORLANDO P&DC 57.0% 97.2% 97.9% 96.5% 1.1 97.6% 97.6% 87.0%20-Aug SAT 8/20 ORLANDO P&DC 63.6% 93.2% 98.0% 95.7% 1.1 97.9% 100.0% 89.2%27-Aug SAT 8/27 ORLANDO P&DC 57.3% 92.8% 98.6% 93.7% 0.7 94.4% 100.0% 74.6%3-Sep SAT 9/3 ORLANDO P&DC 57.6% 86.7% 94.6% 92.7% 0.6 96.3% 99.9% 72.4%
10-Sep SAT 9/10 ORLANDO P&DC 73.2% 90.5% 100.0% 94.8% 1.5 93.9% 99.9% 92.9%17-Sep SAT 9/17 ORLANDO P&DC 54.7% 90.0% 100.0% 95.5% 0.9 96.1% 100.0% 93.8%24-Sep SAT 9/24 ORLANDO P&DC 52.9% 92.4% 100.0% 95.9% 0.5 92.2% 100.0% 87.9%
80% 100% 100% 100% Millions 100% 100% 86.9%
Wee
kly
Tren
dsBe
ginn
ing
Day
Facility
Can
celle
d by
200
0Dat
a Sou
rce
= EDW
MCRS
OG
P Cle
ared
by
2300
Dat
a Sou
rce
= ED
W E
OR
OG
S Cle
ared
by
2400
Dat
a Sou
rce
= ED
W E
OR
MM
P C
lear
ed b
y 24
00Dat
a Sou
rce
= ED
W E
OR
MM
P V
olum
e O
n Han
d at
240
0Dat
a Sou
rce
= EDW
MCRS
Mai
l Ass
igne
d Com
mer
cial
/Fe
dEx
By 0
230
Dat
a Sou
rce
= EDW
SASS
DPS 2
nd P
ass
Cle
ared
by
0700
Dat
a Sou
rce
= ED
W E
OR
Trip
s O
n-Ti
me
0400
- 09
00Dat
a Sou
rce
= EDW
TIM
ES
%
2-Apr SAT 4/2 MID FLORIDA P&DC 69.8% 99.8% 66.8% #VALUE! 100.0% 100.0% 95.9%9-Apr SAT 4/9 MID FLORIDA P&DC 76.0% 99.5% 88.9% #VALUE! 100.0% 100.0% 99.0%
16-Apr SAT 4/16 MID FLORIDA P&DC 71.9% 98.2% 84.1% #VALUE! 100.0% 100.0% 97.4%23-Apr SAT 4/23 MID FLORIDA P&DC 77.7% 100.0% 81.3% #VALUE! 100.0% 99.8% 89.7%30-Apr SAT 4/30 MID FLORIDA P&DC 68.7% 98.1% 100.0% #VALUE! 100.0% 100.0% 94.4%7-May SAT 5/7 MID FLORIDA P&DC 69.8% 97.6% 73.8% #VALUE! 100.0% 100.0% 97.4%
14-May SAT 5/14 MID FLORIDA P&DC 81.4% 99.9% 100.0% #VALUE! 99.9% 100.0% 99.2%21-May SAT 5/21 MID FLORIDA P&DC 84.5% 98.6% 96.3% #VALUE! 100.0% 100.0% 97.9%28-May SAT 5/28 MID FLORIDA P&DC 55.2% 98.4% 100.0% #VALUE! 100.0% 100.0% 88.0%
4-Jun SAT 6/4 MID FLORIDA P&DC 79.8% 97.6% 93.8% 100.0% #VALUE! 100.0% 100.0% 97.9%11-Jun SAT 6/11 MID FLORIDA P&DC 73.5% 97.7% 70.2% #VALUE! 100.0% 100.0% 91.4%18-Jun SAT 6/18 MID FLORIDA P&DC 74.4% 98.2% 100.0% #VALUE! 100.0% 100.0% 97.6%25-Jun SAT 6/25 MID FLORIDA P&DC 69.0% 87.7% 52.3% #VALUE! 81.2% 98.7% 64.7%
2-Jul SAT 7/2 MID FLORIDA P&DC 65.0% 96.2% 81.4% #VALUE! 92.6% 99.5% 78.8%9-Jul SAT 7/9 MID FLORIDA P&DC 58.3% 91.6% 95.5% #VALUE! 95.7% 99.6% 70.8%
16-Jul SAT 7/16 MID FLORIDA P&DC 68.3% 91.8% 100.0% #VALUE! 97.1% 100.0% 89.3%23-Jul SAT 7/23 MID FLORIDA P&DC 61.8% 89.9% 46.3% #VALUE! 92.2% 100.0% 84.4%30-Jul SAT 7/30 MID FLORIDA P&DC 59.1% 89.6% 95.4% #VALUE! 93.1% 100.0% 86.2%6-Aug SAT 8/6 MID FLORIDA P&DC 60.0% 96.0% 99.1% #VALUE! 94.7% 100.0% 86.4%
13-Aug SAT 8/13 MID FLORIDA P&DC 68.8% 94.0% 98.4% #VALUE! 100.0% 100.0% 89.0%20-Aug SAT 8/20 MID FLORIDA P&DC 73.2% 95.4% 100.0% #VALUE! 99.9% 100.0% 94.6%27-Aug SAT 8/27 MID FLORIDA P&DC 62.8% 91.7% 93.5% #VALUE! 99.6% 100.0% 86.0%3-Sep SAT 9/3 MID FLORIDA P&DC 58.3% 92.6% 92.2% #VALUE! 97.0% 100.0% 80.9%
10-Sep SAT 9/10 MID FLORIDA P&DC 68.3% 93.4% 91.4% #VALUE! 96.9% 100.0% 85.8%
24 Hour Indicator Report
Package Page 8 AMP 24 Hour Clock


Overnight % Change All Others % Change Total % Change All % Change All % Change All % Change All % Change All % ChangeUPGRADE TBDDOWNGRADE TBDTOTAL TBDNET UP+NO CHNG TBD
VOLUME TOTAL TBD
* - Periodical and Standard mail origin 3-digit ZIP Code to destination 3-digit ZIP Code volume is not available
Overnight % Change All Others % Change Total % Change All % Change All % Change All % Change All % Change All % ChangeUPGRADE TBDDOWNGRADE TBDTOTAL TBDNET TBD
Mid Florida P&DC
321, 327328, 329, 347Gaining Facility 3D ZIP Code(s):
Service Standard Changes - PairsFCM PRI
PSVC
Service Standard Changes - Average Daily Volume (data obtained from ODIS is derived from sampling and may vary from actual volume)
PSVC ALL CLASSES
rev 10/16/2009
Losing Facility 3D ZIP Code(s):
mm/dd/yyyy
Selected summary fields are transferred to the Executive Summary
PER STD
February 15, 2012
Losing Facility:
Service Standard Impacts
PRI ALL CLASSESSTD *FCM PER *
Based on report prepared by Network Integration Support dated:
Last Saved:
Package Page 10 AMP Service Standard Impacts

Last Saved: Stakeholder Notification Page 1AMP Event: Start of Study
rev 07/16/2008
Stakeholders Notification Losing Facility:
February 15, 2012(WorkBook Tab Notification - 1)Mid Florida P&DC
Package Page 11 AMP Stakeholders Notification
Last Saved:
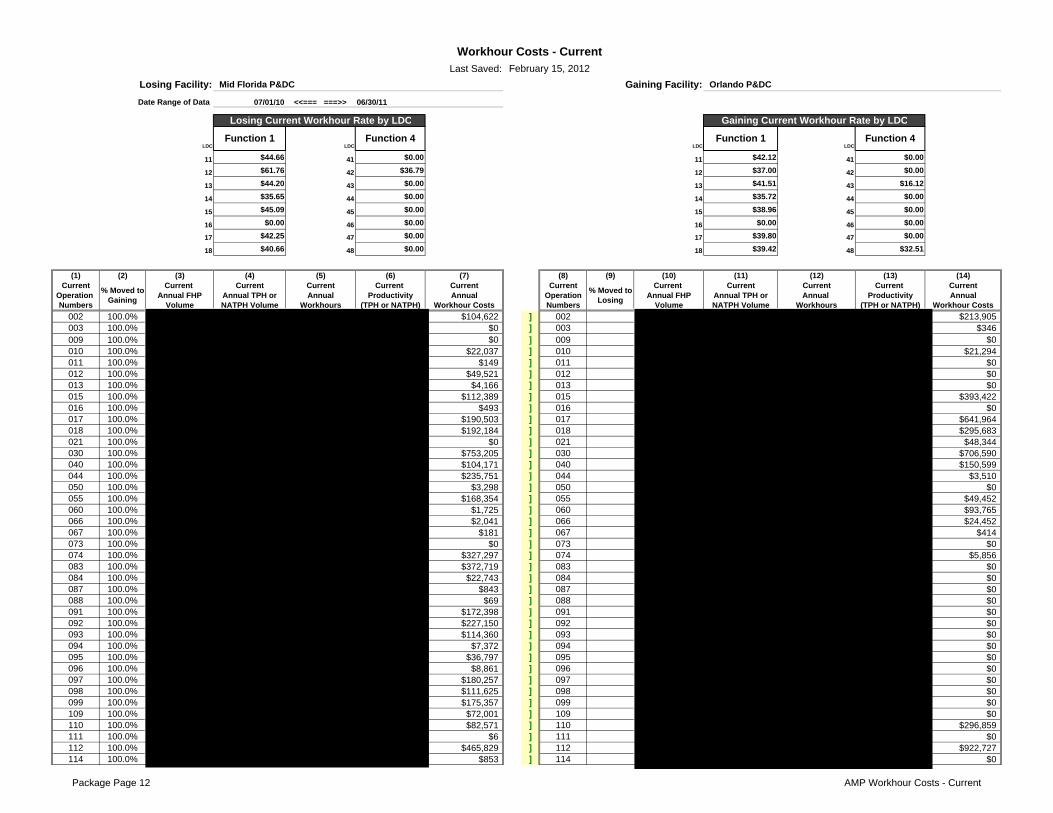
07/01/10 <<=== ===>> 06/30/11
LDC LDC LDC LDC
11 $44.66 41 $0.00 11 $42.12 41 $0.00
12 $61.76 42 $36.79 12 $37.00 42 $0.00
13 $44.20 43 $0.00 13 $41.51 43 $16.12
14 $35.65 44 $0.00 14 $35.72 44 $0.00
15 $45.09 45 $0.00 15 $38.96 45 $0.00
16 $0.00 46 $0.00 16 $0.00 46 $0.00
17 $42.25 47 $0.00 17 $39.80 47 $0.00
18 $40.66 48 $0.00 18 $39.42 48 $32.51
(1) (2) (3) (4) (5) (6) (7) (8) (9) (10) (11) (12) (13) (14)Current Current Current Current Current Current Current Current Current Current Current Current
Operation Annual FHP Annual TPH or Annual Productivity Annual Operation Annual FHP Annual TPH or Annual Productivity AnnualNumbers Volume NATPH Volume Workhours (TPH or NATPH) Workhour Costs Numbers Volume NATPH Volume Workhours (TPH or NATPH) Workhour Costs
002 100.0% $104,622 ] 002 $213,905003 100.0% $0 ] 003 $346009 100.0% $0 ] 009 $0010 100.0% $22,037 ] 010 $21,294011 100.0% $149 ] 011 $0012 100.0% $49,521 ] 012 $0013 100.0% $4,166 ] 013 $0015 100.0% $112,389 ] 015 $393,422016 100.0% $493 ] 016 $0017 100.0% $190,503 ] 017 $641,964018 100.0% $192,184 ] 018 $295,683021 100.0% $0 ] 021 $48,344030 100.0% $753,205 ] 030 $706,590040 100.0% $104,171 ] 040 $150,599044 100.0% $235,751 ] 044 $3,510050 100.0% $3,298 ] 050 $0055 100.0% $168,354 ] 055 $49,452060 100.0% $1,725 ] 060 $93,765066 100.0% $2,041 ] 066 $24,452067 100.0% $181 ] 067 $414073 100.0% $0 ] 073 $0074 100.0% $327,297 ] 074 $5,856083 100.0% $372,719 ] 083 $0084 100.0% $22,743 ] 084 $0087 100.0% $843 ] 087 $0088 100.0% $69 ] 088 $0091 100.0% $172,398 ] 091 $0092 100.0% $227,150 ] 092 $0093 100.0% $114,360 ] 093 $0094 100.0% $7,372 ] 094 $0095 100.0% $36,797 ] 095 $0096 100.0% $8,861 ] 096 $0097 100.0% $180,257 ] 097 $0098 100.0% $111,625 ] 098 $0099 100.0% $175,357 ] 099 $0109 100.0% $72,001 ] 109 $0110 100.0% $82,571 ] 110 $296,859111 100.0% $6 ] 111 $0112 100.0% $465,829 ] 112 $922,727114 100.0% $853 ] 114 $0
February 15, 2012Workhour Costs - Current
Mid Florida P&DC Orlando P&DC
Losing Current Workhour Rate by LDC
Function 4Function 1
% Moved to Losing
% Moved to Gaining
Losing Facility: Gaining Facility:Date Range of Data
Function 1
Gaining Current Workhour Rate by LDC
Function 4
Package Page 12 AMP Workhour Costs - Current
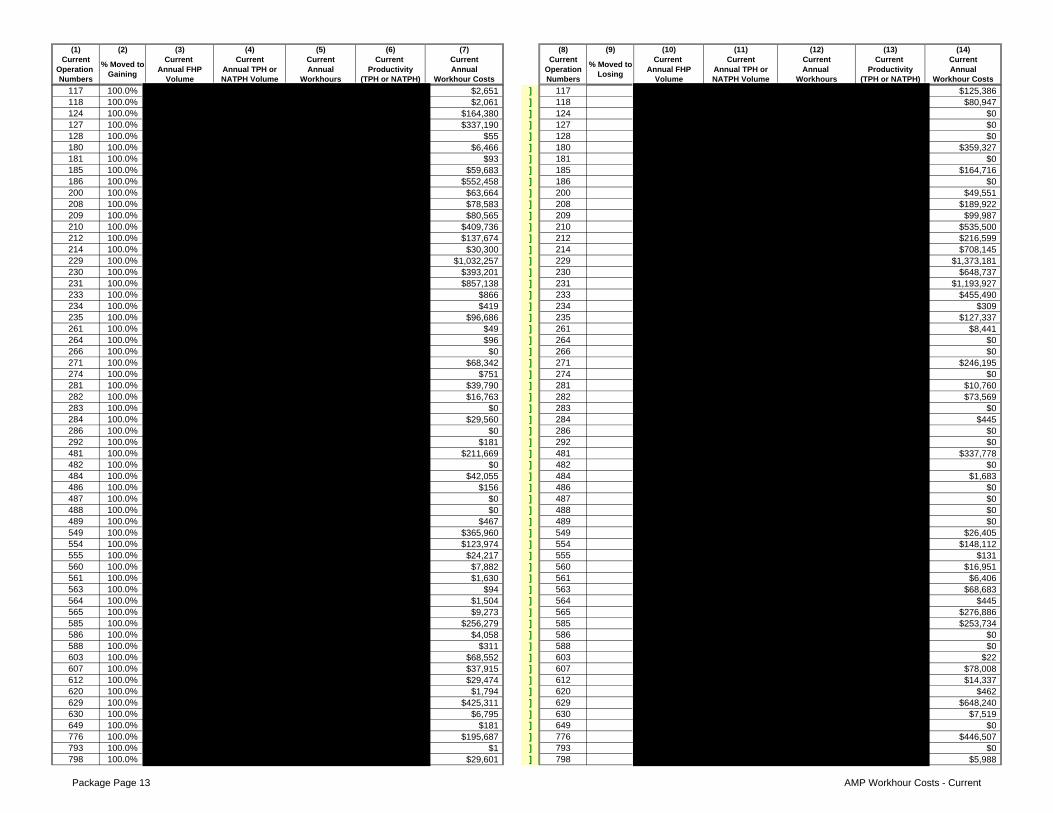
(1) (2) (3) (4) (5) (6) (7) (8) (9) (10) (11) (12) (13) (14)Current Current Current Current Current Current Current Current Current Current Current Current
Operation Annual FHP Annual TPH or Annual Productivity Annual Operation Annual FHP Annual TPH or Annual Productivity AnnualNumbers Volume NATPH Volume Workhours (TPH or NATPH) Workhour Costs Numbers Volume NATPH Volume Workhours (TPH or NATPH) Workhour Costs
% Moved to Losing
% Moved to Gaining
117 100.0% $2,651 ] 117 $125,386118 100.0% $2,061 ] 118 $80,947124 100.0% $164,380 ] 124 $0127 100.0% $337,190 ] 127 $0128 100.0% $55 ] 128 $0180 100.0% $6,466 ] 180 $359,327181 100.0% $93 ] 181 $0185 100.0% $59,683 ] 185 $164,716186 100.0% $552,458 ] 186 $0200 100.0% $63,664 ] 200 $49,551208 100.0% $78,583 ] 208 $189,922209 100.0% $80,565 ] 209 $99,987210 100.0% $409,736 ] 210 $535,500212 100.0% $137,674 ] 212 $216,599214 100.0% $30,300 ] 214 $708,145229 100.0% $1,032,257 ] 229 $1,373,181230 100.0% $393,201 ] 230 $648,737231 100.0% $857,138 ] 231 $1,193,927233 100.0% $866 ] 233 $455,490234 100.0% $419 ] 234 $309235 100.0% $96,686 ] 235 $127,337261 100.0% $49 ] 261 $8,441264 100.0% $96 ] 264 $0266 100.0% $0 ] 266 $0271 100.0% $68,342 ] 271 $246,195274 100.0% $751 ] 274 $0281 100.0% $39,790 ] 281 $10,760282 100.0% $16,763 ] 282 $73,569283 100.0% $0 ] 283 $0284 100.0% $29,560 ] 284 $445286 100.0% $0 ] 286 $0292 100.0% $181 ] 292 $0481 100.0% $211,669 ] 481 $337,778482 100.0% $0 ] 482 $0484 100.0% $42,055 ] 484 $1,683486 100.0% $156 ] 486 $0487 100.0% $0 ] 487 $0488 100.0% $0 ] 488 $0489 100.0% $467 ] 489 $0549 100.0% $365,960 ] 549 $26,405554 100.0% $123,974 ] 554 $148,112555 100.0% $24,217 ] 555 $131560 100.0% $7,882 ] 560 $16,951561 100.0% $1,630 ] 561 $6,406563 100.0% $94 ] 563 $68,683564 100.0% $1,504 ] 564 $445565 100.0% $9,273 ] 565 $276,886585 100.0% $256,279 ] 585 $253,734586 100.0% $4,058 ] 586 $0588 100.0% $311 ] 588 $0603 100.0% $68,552 ] 603 $22607 100.0% $37,915 ] 607 $78,008612 100.0% $29,474 ] 612 $14,337620 100.0% $1,794 ] 620 $462629 100.0% $425,311 ] 629 $648,240630 100.0% $6,795 ] 630 $7,519649 100.0% $181 ] 649 $0776 100.0% $195,687 ] 776 $446,507793 100.0% $1 ] 793 $0798 100.0% $29,601 ] 798 $5,988
Package Page 13 AMP Workhour Costs - Current


(1) (2) (3) (4) (5) (6) (7) (8) (9) (10) (11) (12) (13) (14)Current Current Current Current Current Current Current Current Current Current Current Current
Operation Annual FHP Annual TPH or Annual Productivity Annual Operation Annual FHP Annual TPH or Annual Productivity AnnualNumbers Volume NATPH Volume Workhours (TPH or NATPH) Workhour Costs Numbers Volume NATPH Volume Workhours (TPH or NATPH) Workhour Costs
% Moved to Losing
% Moved to Gaining
Package Page 15 AMP Workhour Costs - Current

(1) (2) (3) (4) (5) (6) (7) (8) (9) (10) (11) (12) (13) (14)Current Current Current Current Current Current Current Current Current Current Current Current
Operation Annual FHP Annual TPH or Annual Productivity Annual Operation Annual FHP Annual TPH or Annual Productivity AnnualNumbers Volume NATPH Volume Workhours (TPH or NATPH) Workhour Costs Numbers Volume NATPH Volume Workhours (TPH or NATPH) Workhour Costs
% Moved to Losing
% Moved to Gaining
Package Page 16 AMP Workhour Costs - Current

(1) (2) (3) (4) (5) (6) (7) (8) (9) (10) (11) (12) (13) (14)Current Current Current Current Current Current Current Current Current Current Current Current
Operation Annual FHP Annual TPH or Annual Productivity Annual Operation Annual FHP Annual TPH or Annual Productivity AnnualNumbers Volume NATPH Volume Workhours (TPH or NATPH) Workhour Costs Numbers Volume NATPH Volume Workhours (TPH or NATPH) Workhour Costs
% Moved to Losing
% Moved to Gaining
Moved to Gain 619,475,392 1,936,554,392 397,461 4,872 $16,877,097 Impact to Gain 1,046,162,158 3,112,772,186 572,803 5,434 $23,292,132Impact to Lose 0 0 0 No Calc $0 Moved to Lose 0 0 0 No Calc $0Total Impact 619,475,392 1,936,554,392 397,461 4,872 $16,877,097 Total Impact 1,046,162,158 3,112,772,186 572,803 5,434 $23,292,132Non-impacted 0 0 0 No Calc $0 Non-impacted 0 0 0 No Calc $0
Gain Only 68,185,136 203,584,515 98,767 2,061 $3,798,335All 619,475,392 1,936,554,392 397,461 4,872 $16,877,097 All 1,114,347,294 3,316,356,701 671,570 4,938 $27,090,467
Impact to Gain 1,665,637,550 5,049,326,578 970,264 5,204 $40,169,229Impact to Lose 0 0 0 No Calc $0Total Impact 1,665,637,550 5,049,326,578 970,264 5,204 $40,169,229Non-impacted 0 0 0 No Calc $0
Gain Only 68,185,136 203,584,515 98,767 2,061 $3,798,335All 1,733,822,686 5,252,911,093 1,069,031 4,914 $43,967,564
.
rev 06/11/2008
Comb Totals
Totals Totals
(This number is carried forward to AMP Worksheet Executive Summary )
Combined Current Workhour Annual Workhour Costs :
1,998,308 Total FHP to be Transferred (Average Daily Volume) :
(This number is carried forward to the bottom of AMP Worksheet Workhour Costs-Proposed )$43,967,564
Current FHP at Gaining Facility (Average Daily Volume) : 3,594,669 (This number is carried forward to AMP Worksheet Executive Summary )
Package Page 17 AMP Workhour Costs - Current

Last Saved:Losing Facility: Gaining Facility:
(1) (2) (3) (4) (5) (6) (7) (8) (9) (10) (11) (12)Proposed Proposed Proposed Proposed Proposed Proposed Proposed Proposed Proposed Proposed Proposed ProposedOperation Annual FHP Annual TPH or Annual Productivity Annual Operation Annual FHP Annual TPH or Annual Productivity AnnualNumbers Volume NATPH Volume Workhours (TPH or NATPH) Workhour Costs Numbers Volume NATPH Volume Workhours (TPH or NATPH) Workhour Costs
002 0 0 0 No Calc $0 002 $263,188003 0 0 0 No Calc $0 003 $347009 0 0 0 No Calc $0 009 $0010 0 0 0 No Calc $0 010 $31,675011 0 0 0 No Calc $0 011 $0012 0 0 0 No Calc $0 012 $23,327013 0 0 0 No Calc $0 013 $0015 0 0 0 No Calc $0 015 $505,907016 0 0 0 No Calc $0 016 $232017 0 0 0 No Calc $0 017 $731,703018 0 0 0 No Calc $0 018 $386,214021 0 0 0 No Calc $0 021 $48,344030 0 0 0 No Calc $0 030 $1,417,348040 0 0 0 No Calc $0 040 $247,312044 0 0 0 No Calc $0 044 $232,505050 0 0 0 No Calc $0 050 $3,205055 0 0 0 No Calc $0 055 $211,573060 0 0 0 No Calc $0 060 $92,629066 0 0 0 No Calc $0 066 $13,304067 0 0 0 No Calc $0 067 $5,882073 0 0 0 No Calc $0 073 $0074 0 0 0 No Calc $0 074 $323,744083 0 0 0 No Calc $0 083 $321,704084 0 0 0 No Calc $0 084 $10,713087 0 0 0 No Calc $0 087 $3,563088 0 0 0 No Calc $0 088 $2091 0 0 0 No Calc $0 091 $142,150092 0 0 0 No Calc $0 092 $198,310093 0 0 0 No Calc $0 093 $91,202094 0 0 0 No Calc $0 094 $8,733095 0 0 0 No Calc $0 095 $4,444096 0 0 0 No Calc $0 096 $9,951097 0 0 0 No Calc $0 097 $184,828098 0 0 0 No Calc $0 098 $94,577099 0 0 0 No Calc $0 099 $147,322109 0 0 0 No Calc $0 109 $47,890110 0 0 0 No Calc $0 110 $335,755111 0 0 0 No Calc $0 111 $4112 0 0 0 No Calc $0 112 $1,142,161114 0 0 0 No Calc $0 114 $402117 0 0 0 No Calc $0 117 $126,634118 0 0 0 No Calc $0 118 $81,918124 0 0 0 No Calc $0 124 $77,433127 0 0 0 No Calc $0 127 $158,837128 0 0 0 No Calc $0 128 $51180 0 0 0 No Calc $0 180 $362,373181 0 0 0 No Calc $0 181 $44185 0 0 0 No Calc $0 185 $192,830186 0 0 0 No Calc $0 186 $260,242
Workhour Costs - Proposed
Mid Florida P&DC
February 15, 2012Orlando P&DC
Package Page 18 AMP Workhour Costs - Proposed

(1) (2) (3) (4) (5) (6) (7) (8) (9) (10) (11) (12)Proposed Proposed Proposed Proposed Proposed Proposed Proposed Proposed Proposed Proposed Proposed ProposedOperation Annual FHP Annual TPH or Annual Productivity Annual Operation Annual FHP Annual TPH or Annual Productivity AnnualNumbers Volume NATPH Volume Workhours (TPH or NATPH) Workhour Costs Numbers Volume NATPH Volume Workhours (TPH or NATPH) Workhour Costs
200 0 0 0 No Calc $0 200 $109,932208 0 0 0 No Calc $0 208 $226,939209 0 0 0 No Calc $0 209 $137,938210 0 0 0 No Calc $0 210 $803,629212 0 0 0 No Calc $0 212 $310,473214 0 0 0 No Calc $0 214 $722,418229 0 0 0 No Calc $0 229 $1,859,439230 0 0 0 No Calc $0 230 $833,959231 0 0 0 No Calc $0 231 $1,762,433233 0 0 0 No Calc $0 233 $456,329234 0 0 0 No Calc $0 234 $588235 0 0 0 No Calc $0 235 $172,882261 0 0 0 No Calc $0 261 $4,645264 0 0 0 No Calc $0 264 $13,276266 0 0 0 No Calc $0 266 $0271 0 0 0 No Calc $0 271 $341,765274 0 0 0 No Calc $0 274 $57281 0 0 0 No Calc $0 281 $159,453282 0 0 0 No Calc $0 282 $0283 0 0 0 No Calc $0 283 $985284 0 0 0 No Calc $0 284 $40,610286 0 0 0 No Calc $0 286 $1292 0 0 0 No Calc $0 292 $0481 0 0 0 No Calc $0 481 $515,014482 0 0 0 No Calc $0 482 $3,361484 0 0 0 No Calc $0 484 $111,483486 0 0 0 No Calc $0 486 $31,100487 0 0 0 No Calc $0 487 $259,526488 0 0 0 No Calc $0 488 $1,193489 0 0 0 No Calc $0 489 $14,534549 0 0 0 No Calc $0 549 $269,818554 0 0 0 No Calc $0 554 $230,572555 0 0 0 No Calc $0 555 $16,238560 0 0 0 No Calc $0 560 $22,193561 0 0 0 No Calc $0 561 $7,490563 0 0 0 No Calc $0 563 $68,746564 0 0 0 No Calc $0 564 $1,445565 0 0 0 No Calc $0 565 $283,054585 0 0 0 No Calc $0 585 $424,193586 0 0 0 No Calc $0 586 $2,699588 0 0 0 No Calc $0 588 $207603 0 0 0 No Calc $0 603 $0607 0 0 0 No Calc $0 607 $103,226612 0 0 0 No Calc $0 612 $33,941620 0 0 0 No Calc $0 620 $1,656629 0 0 0 No Calc $0 629 $847,757630 0 0 0 No Calc $0 630 $12,039649 0 0 0 No Calc $0 649 $0776 0 0 0 No Calc $0 776 $347,680793 0 0 0 No Calc $0 793 $1798 0 0 0 No Calc $0 798 $25,677891 0 0 0 No Calc $0 891 $370,082892 0 0 0 No Calc $0 892 $137,751893 0 0 0 No Calc $0 893 $1,349,795894 0 0 0 No Calc $0 894 $1,623,307
Package Page 19 AMP Workhour Costs - Proposed


(1) (2) (3) (4) (5) (6) (7) (8) (9) (10) (11) (12)Proposed Proposed Proposed Proposed Proposed Proposed Proposed Proposed Proposed Proposed Proposed ProposedOperation Annual FHP Annual TPH or Annual Productivity Annual Operation Annual FHP Annual TPH or Annual Productivity AnnualNumbers Volume NATPH Volume Workhours (TPH or NATPH) Workhour Costs Numbers Volume NATPH Volume Workhours (TPH or NATPH) Workhour Costs
0 No Calc 0 No Calc0 No Calc 0 No Calc0 No Calc 0 No Calc0 No Calc 0 No Calc0 No Calc 0 No Calc0 No Calc 0 No Calc0 No Calc 0 No Calc0 No Calc 0 No Calc0 No Calc 0 No Calc0 No Calc 0 No Calc0 No Calc 0 No Calc0 No Calc 0 No Calc0 No Calc 0 No Calc0 No Calc 0 No Calc0 No Calc 0 No Calc0 No Calc 0 No Calc0 No Calc 0 No Calc0 No Calc 0 No Calc0 No Calc 0 No Calc0 No Calc 0 No Calc0 No Calc 0 No Calc0 No Calc 0 No Calc0 No Calc 0 No Calc0 No Calc 0 No Calc0 No Calc 0 No Calc0 No Calc 0 No Calc0 No Calc 0 No Calc0 No Calc 0 No Calc0 No Calc 0 No Calc0 No Calc 0 No Calc0 No Calc 0 No Calc0 No Calc 0 No Calc0 No Calc 0 No Calc0 No Calc 0 No Calc0 No Calc 0 No Calc0 No Calc 0 No Calc0 No Calc 0 No Calc0 No Calc 0 No Calc0 No Calc 0 No Calc0 No Calc 0 No Calc0 No Calc 0 No Calc0 No Calc 0 No Calc0 No Calc 0 No Calc0 No Calc 0 No Calc0 No Calc 0 No Calc0 No Calc 0 No Calc0 No Calc 0 No Calc0 No Calc 0 No Calc0 No Calc 0 No Calc0 No Calc 0 No Calc0 No Calc 0 No Calc0 No Calc 0 No Calc0 No Calc 0 No Calc0 No Calc 0 No Calc0 No Calc 0 No Calc
Package Page 21 AMP Workhour Costs - Proposed

(1) (2) (3) (4) (5) (6) (7) (8) (9) (10) (11) (12)Proposed Proposed Proposed Proposed Proposed Proposed Proposed Proposed Proposed Proposed Proposed ProposedOperation Annual FHP Annual TPH or Annual Productivity Annual Operation Annual FHP Annual TPH or Annual Productivity AnnualNumbers Volume NATPH Volume Workhours (TPH or NATPH) Workhour Costs Numbers Volume NATPH Volume Workhours (TPH or NATPH) Workhour Costs
0 No Calc 0 No Calc0 No Calc 0 No Calc0 No Calc 0 No Calc0 No Calc 0 No Calc0 No Calc 0 No Calc0 No Calc 0 No Calc0 No Calc 0 No Calc0 No Calc 0 No Calc0 No Calc 0 No Calc0 No Calc 0 No Calc0 No Calc 0 No Calc0 No Calc 0 No Calc0 No Calc 0 No Calc0 No Calc 0 No Calc0 No Calc 0 No Calc0 No Calc 0 No Calc0 No Calc 0 No Calc0 No Calc 0 No Calc0 No Calc 0 No Calc0 No Calc 0 No Calc0 No Calc 0 No Calc0 No Calc 0 No Calc0 No Calc 0 No Calc0 No Calc 0 No Calc0 No Calc 0 No Calc0 No Calc 0 No Calc0 No Calc 0 No Calc0 No Calc 0 No Calc0 No Calc 0 No Calc0 No Calc 0 No Calc0 No Calc 0 No Calc0 No Calc 0 No Calc0 No Calc 0 No Calc0 No Calc 0 No Calc0 No Calc 0 No Calc0 No Calc 0 No Calc0 No Calc 0 No Calc0 No Calc 0 No Calc0 No Calc 0 No Calc0 No Calc 0 No Calc0 No Calc 0 No Calc0 No Calc 0 No Calc0 No Calc 0 No Calc0 No Calc 0 No Calc0 No Calc 0 No Calc0 No Calc 0 No Calc0 No Calc 0 No Calc0 No Calc 0 No Calc0 No Calc 0 No Calc0 No Calc 0 No Calc0 No Calc 0 No Calc0 No Calc 0 No Calc0 No Calc 0 No Calc0 No Calc 0 No Calc0 No Calc 0 No Calc
Package Page 22 AMP Workhour Costs - Proposed

(1) (2) (3) (4) (5) (6) (7) (8) (9) (10) (11) (12)Proposed Proposed Proposed Proposed Proposed Proposed Proposed Proposed Proposed Proposed Proposed ProposedOperation Annual FHP Annual TPH or Annual Productivity Annual Operation Annual FHP Annual TPH or Annual Productivity AnnualNumbers Volume NATPH Volume Workhours (TPH or NATPH) Workhour Costs Numbers Volume NATPH Volume Workhours (TPH or NATPH) Workhour Costs
0 No Calc 0 No Calc0 No Calc 0 No Calc0 No Calc 0 No Calc0 No Calc 0 No Calc0 No Calc 0 No Calc0 No Calc 0 No Calc0 No Calc 0 No Calc0 No Calc 0 No Calc0 No Calc 0 No Calc0 No Calc 0 No Calc0 No Calc 0 No Calc0 No Calc 0 No Calc0 No Calc 0 No Calc0 No Calc 0 No Calc0 No Calc 0 No Calc0 No Calc 0 No Calc0 No Calc 0 No Calc0 No Calc 0 No Calc0 No Calc 0 No Calc0 No Calc 0 No Calc0 No Calc 0 No Calc0 No Calc 0 No Calc0 No Calc 0 No Calc0 No Calc 0 No Calc0 No Calc 0 No Calc0 No Calc 0 No Calc0 No Calc 0 No Calc0 No Calc 0 No Calc0 No Calc 0 No Calc0 No Calc 0 No Calc0 No Calc 0 No Calc0 No Calc 0 No Calc0 No Calc 0 No Calc0 No Calc 0 No Calc0 No Calc 0 No Calc0 No Calc 0 No Calc0 No Calc 0 No Calc0 No Calc 0 No Calc0 No Calc 0 No Calc0 No Calc 0 No Calc0 No Calc 0 No Calc
Moved to Gain 0 0 0 No Calc $0 Impact to Gain 1,665,637,550 5,049,326,578 847,990 5,954 $34,345,848Impact to Lose 0 0 0 No Calc $0 Moved to Lose 0 0 0 No Calc $0Total Impact 0 0 0 No Calc $0 Total Impact 1,665,637,550 5,049,326,578 847,990 5,954 $34,345,848Non Impacted 0 0 0 No Calc $0 Non Impacted 0 0 0 No Calc $0
Gain Only 68,185,136 203,584,515 96,182 2,117 $3,702,423All 0 0 0 No Calc $0 All 1,733,822,686 5,252,911,093 944,173 5,564 $38,048,271
Package Page 23 AMP Workhour Costs - Proposed

(1) (2) (3) (4) (5) (6) (7) (8) (9) (10) (11) (12)Proposed Proposed Proposed Proposed Proposed Proposed Proposed Proposed Proposed Proposed Proposed ProposedOperation Annual FHP Annual TPH or Annual Productivity Annual Operation Annual FHP Annual TPH or Annual Productivity AnnualNumbers Volume NATPH Volume Workhours (TPH or NATPH) Workhour Costs Numbers Volume NATPH Volume Workhours (TPH or NATPH) Workhour Costs
Op# FHP TPH/NATPH Workhours Productivity Workhour Cost Op# FHP TPH/NATPH Workhours Productivity Workhour Cost
Totals 0 0 0 No Calc $0 Totals 0 0 0 No Calc $0
Impact to Gain 1,665,637,550 5,049,326,578 847,990 5,954 $34,345,848Combined Current Annual Workhour Cost : Impact to Lose 0 0 0 No Calc $0
Total Impact 1,665,637,550 5,049,326,578 847,990 5,954 $34,345,848Non-impacted 0 0 0 No Calc $0
Gain Only 68,185,136 203,584,515 96,182 2,117 $3,702,423Tot Before Adj 1,733,822,686 5,252,911,093 944,173 5,564 $38,048,271
Lose Adj 0 0 0 No Calc $0Gain Adj 0 0 0 No Calc $0
All 1,733,822,686 5,252,911,093 944,173 5,564 $38,048,271
Comb Current 1,733,822,686 5,252,911,093 1,069,031 4,914 $43,967,564Proposed 1,733,822,686 5,252,911,093 944,173 5,564 $38,048,271Change 0 0 (124,859) ($5,919,293)
Change % 0.0% 0.0% -11.7% -13.5%
Com
b To
tals
Cost Impact(This number equals the difference in the current and proposed workhour costs
above and is carried forward to the Executive Summary )
(This number brought forward from Workhour Costs - Current )
Function 1 Workhour Savings : $5,919,293
Minimum Function 1 Workhour Savings : $848,690(This number represents proposed workhour savings with no productivity improvements
applied to operations at the gaining facility)
(13) New Flow Adjustments at Losing Facility
$43,967,564
Proposed Annual Workhour Cost :(Total of Columns 6 and 12 on this page)
$38,048,271
rev 04/02/2009
(14) New Flow Adjustments at Gaining Facility
Package Page 24 AMP Workhour Costs - Proposed


Package Page 26 AMP Other Curr vs Prop


Package Page 28 AMP Other Curr vs Prop


Last Saved:
Losing Facility:Data Extraction Date:
(2) (3) (4) (5) (6)
Level Current Auth Staffing
Current On-Rolls
Proposed Staffing Difference
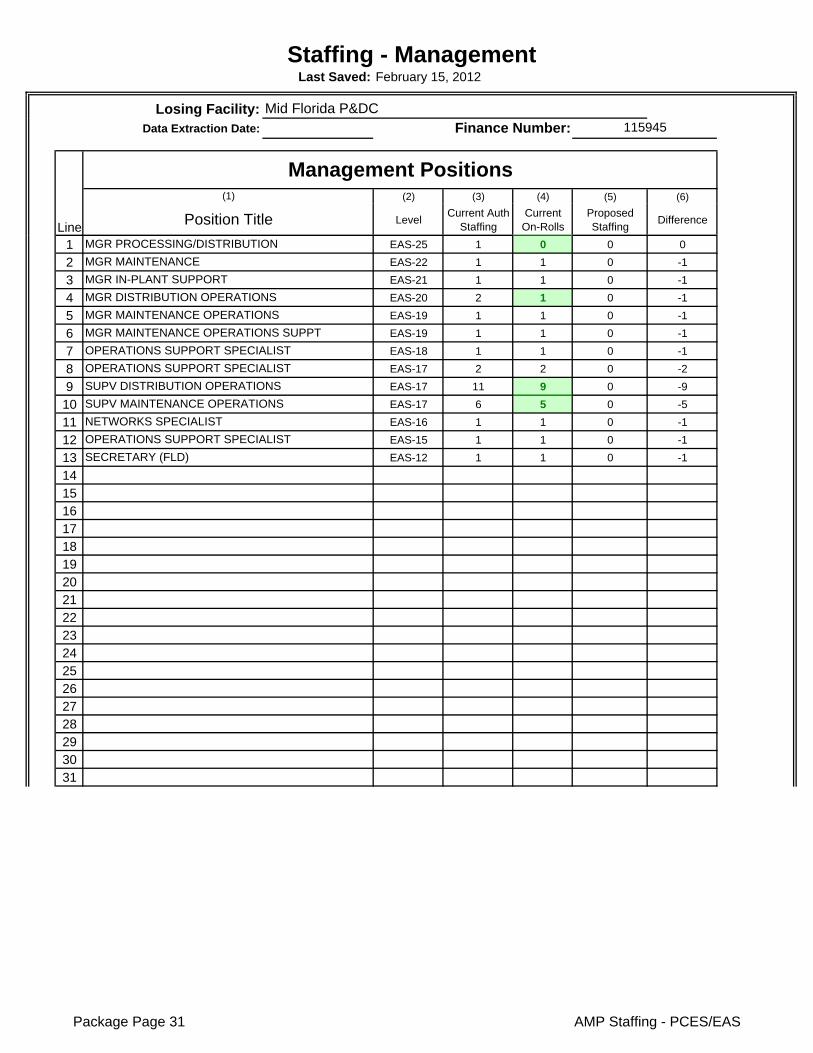
1 EAS-25 1 0 0 0
2 EAS-22 1 1 0 -1
3 EAS-21 1 1 0 -1
4 EAS-20 2 1 0 -1
5 EAS-19 1 1 0 -1
6 EAS-19 1 1 0 -1
7 EAS-18 1 1 0 -1
8 EAS-17 2 2 0 -2
9 EAS-17 11 9 0 -9
10 EAS-17 6 5 0 -5
11 EAS-16 1 1 0 -1
12 EAS-15 1 1 0 -1
13 EAS-12 1 1 0 -1
141516171819202122232425262728293031
Staffing - Management
115945
February 15, 2012
Mid Florida P&DC
OPERATIONS SUPPORT SPECIALISTSECRETARY (FLD)
Line
(1)
Position TitleMGR PROCESSING/DISTRIBUTION
Management Positions
OPERATIONS SUPPORT SPECIALISTSUPV DISTRIBUTION OPERATIONSSUPV MAINTENANCE OPERATIONSNETWORKS SPECIALIST
Finance Number:
MGR MAINTENANCEMGR IN-PLANT SUPPORTMGR DISTRIBUTION OPERATIONSMGR MAINTENANCE OPERATIONSMGR MAINTENANCE OPERATIONS SUPPTOPERATIONS SUPPORT SPECIALIST
Package Page 31 AMP Staffing - PCES/EAS

444546474849505152535455565758596061626364656667686970717273747576777879
30 25 0 (25)
Retirement Eligibles: 0 Position Loss: 25
Totals
Package Page 32 AMP Staffing - PCES/EAS

Gaining Facility:Data Extraction Date:
(13) (14) (15) (16) (17)
Level Current Auth Staffing
Current On-Rolls
Proposed Staffing Difference
1 PCES-01 1 1 1 0
2 EAS-24 1 0 1 1
3 EAS-23 1 1 1 0
4 EAS-22 1 1 1 0
5 EAS-22 1 1 1 0
6 EAS-21 3 3 3 0
7 EAS-21 1 1 1 0
8 EAS-20 1 1 2 1
9 EAS-20 1 1 1 0
10 EAS-20 1 1 1 0
11 EAS-19 1 1 1 0
12 EAS-18 1 1 1 0
13 EAS-18 1 1 1 0
14 EAS-17 3 3 3 0
15 EAS-17 15 14 22 8
16 EAS-17 12 11 12 1
17 EAS-17 3 3 3 0
18 EAS-16 2 2 2 0
19 EAS-15 1 1 1 0
20 EAS-12 1 1 1 0
2122232425262728293031323334
Finance Number: 116916Orlando P&DC
Line Position Title(12)
Management Positions
PLANT MANAGER (2)MGR MAINTENANCEMGR IN-PLANT SUPPORTMGR DISTRIBUTION OPERATIONSOPERATIONS INDUSTRIAL ENGINEER (FIMGR MAINTENANCE OPERATIONSOPERATIONS INDUSTRIAL ENGINEER (FIMGR DISTRIBUTION OPERATIONSMGR TRANSPORTATION/NETWORKSOPERATIONS SUPPORT SPECIALISTMGR MAINTENANCE OPERATIONS SUPPTNETWORKS SPECIALISTOPERATIONS SUPPORT SPECIALISTOPERATIONS SUPPORT SPECIALISTSUPV DISTRIBUTION OPERATIONSSUPV MAINTENANCE OPERATIONSSUPV TRANSPORTATION OPERATIONSNETWORKS SPECIALISTOPERATIONS SUPPORT SPECIALISTSECRETARY (FLD)
Package Page 33 AMP Staffing - PCES/EAS

474849505152535455565758596061626364656667686970717273747576777879
52 49 60 11
Retirement Eligibles: 0 Position Loss: (11)
14
Total
rev 11/05/2008
Total PCES/EAS Position Loss: (This number carried forward to the Executive Summary )
Package Page 34 AMP Staffing - PCES/EAS

Losing Facility: 115945
(1) (2) (3) (4) (5) (6)Craft Positions
Function 1 - Clerk 4 0 151 155 0 (155)Function 4 - Clerk 0 0 0Function 1 - Mail Handler 2 7 78 87 0 (87)Function 4 - Mail Handler 0 0 0
Function 1 & 4 Sub-Total 6 7 229 242 0 (242)Function 3A - Vehicle Service 0 0 0Function 3B - Maintenance 0 0 90 90 0 (90)Functions 67-69 - Lmtd/Rehab/WC 0 2 2 0 (2)Other Functions 0 0 6 6 0 (6)
Total 6 7 327 340 0 (340)
Retirement Eligibles: 107
Gaining Facility: 116916
(7) (8) (9) (10) (11) (12)Craft Positions
Function 1 - Clerk 20 0 227 247 356 109Function 1 - Mail Handler 7 14 85 106 153 47
Function 1 Sub-Total 27 14 312 353 509 156Function 3A - Vehicle Service 3 0 44 47 47 0Function 3B - Maintenance 0 0 136 136 169 33Functions 67-69 - Lmtd/Rehab/WC 0 0Other Functions 0 0 7 7 7 0
Total 30 14 499 543 732 189
Retirement Eligibles: 174
151
(13) Notes:
rev 11/05/2008
Finance Number:
Orlando P&DC Finance Number:
Total Craft Position Loss:
Total Proposed
Part Time On-Rolls
Full Time On-Rolls
Total On-Rolls
Staffing - Craft
Difference
Difference
Last Saved: February 15, 2012
Data Extraction Date: 09/19/11
Casuals/PSEs On-Rolls
Total Proposed
Data Extraction Date:
Mid Florida P&DC
Part Time On-Rolls
Full Time On-Rolls
Total On-Rolls
(This number carried forward to the Executive Summary )
Casuals/PSEs On-Rolls
Package Page 35 AMP Staffing - Craft
Losing Facility: Gaining Facility:
Date Range of Data: :
(1) (2) (3) (4) (5) (6)
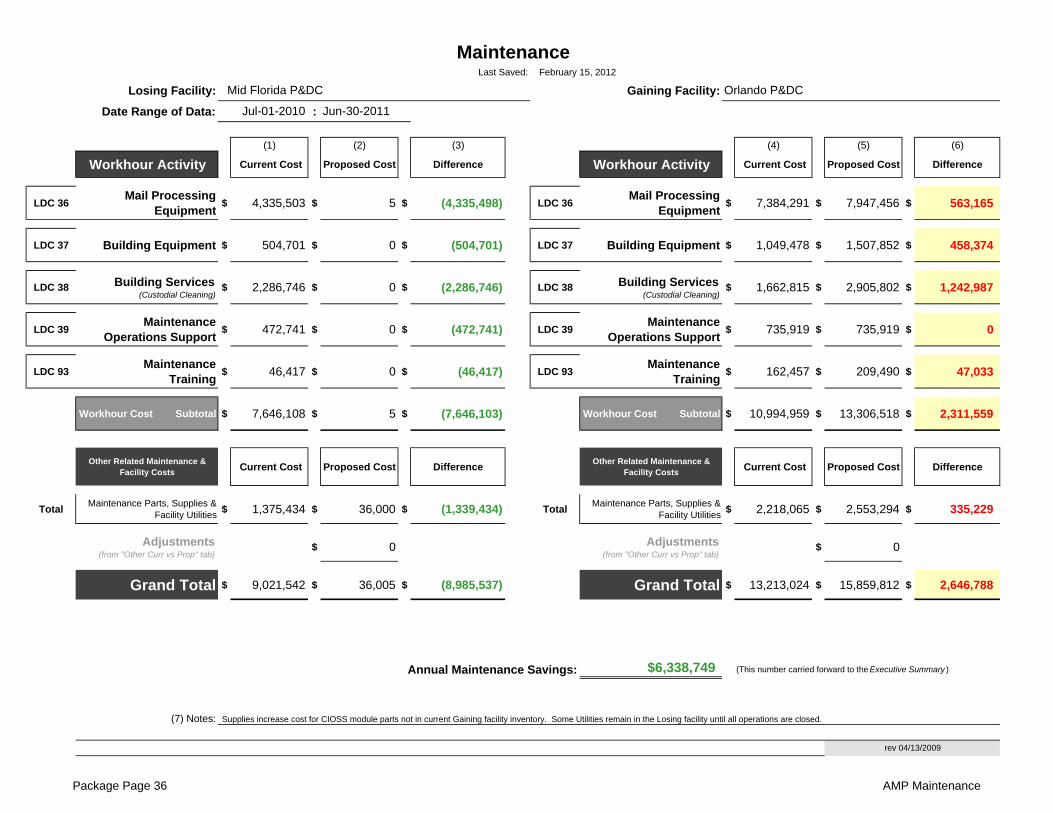
Workhour Activity Current Cost Proposed Cost Difference Workhour Activity Current Cost Proposed Cost Difference
LDC 36 Mail Processing Equipment $ 4,335,503 $ 5 $ (4,335,498) LDC 36 Mail Processing
Equipment $ 7,384,291 $ 7,947,456 $ 563,165
LDC 37 Building Equipment $ 504,701 $ 0 $ (504,701) LDC 37 Building Equipment $ 1,049,478 $ 1,507,852 $ 458,374
LDC 38 Building Services (Custodial Cleaning)
$ 2,286,746 $ 0 $ (2,286,746) LDC 38 Building Services (Custodial Cleaning)
$ 1,662,815 $ 2,905,802 $ 1,242,987
LDC 39 Maintenance Operations Support $ 472,741 $ 0 $ (472,741) LDC 39 Maintenance
Operations Support $ 735,919 $ 735,919 $ 0
LDC 93 Maintenance Training $ 46,417 $ 0 $ (46,417) LDC 93 Maintenance
Training $ 162,457 $ 209,490 $ 47,033
Workhour Cost Subtotal $ 7,646,108 $ 5 $ (7,646,103) Workhour Cost Subtotal $ 10,994,959 $ 13,306,518 $ 2,311,559
Other Related Maintenance & Facility Costs Current Cost Proposed Cost Difference Other Related Maintenance &
Facility Costs Current Cost Proposed Cost Difference
Total Maintenance Parts, Supplies & Facility Utilities $ 1,375,434 $ 36,000 $ (1,339,434) Total Maintenance Parts, Supplies &
Facility Utilities $ 2,218,065 $ 2,553,294 $ 335,229
Adjustments (from "Other Curr vs Prop" tab)
$ 0 Adjustments (from "Other Curr vs Prop" tab)
$ 0
Grand Total $ 9,021,542 $ 36,005 $ (8,985,537) Grand Total $ 13,213,024 $ 15,859,812 $ 2,646,788
$6,338,749 (This number carried forward to the Executive Summary )
(7) Notes:
Jul-01-2010 Jun-30-2011
Annual Maintenance Savings:
rev 04/13/2009
Maintenance
Supplies increase cost for CIOSS module parts not in current Gaining facility inventory. Some Utilities remain in the Losing facility until all operations are closed.
Last Saved:
Mid Florida P&DC Orlando P&DCFebruary 15, 2012
Package Page 36 AMP Maintenance

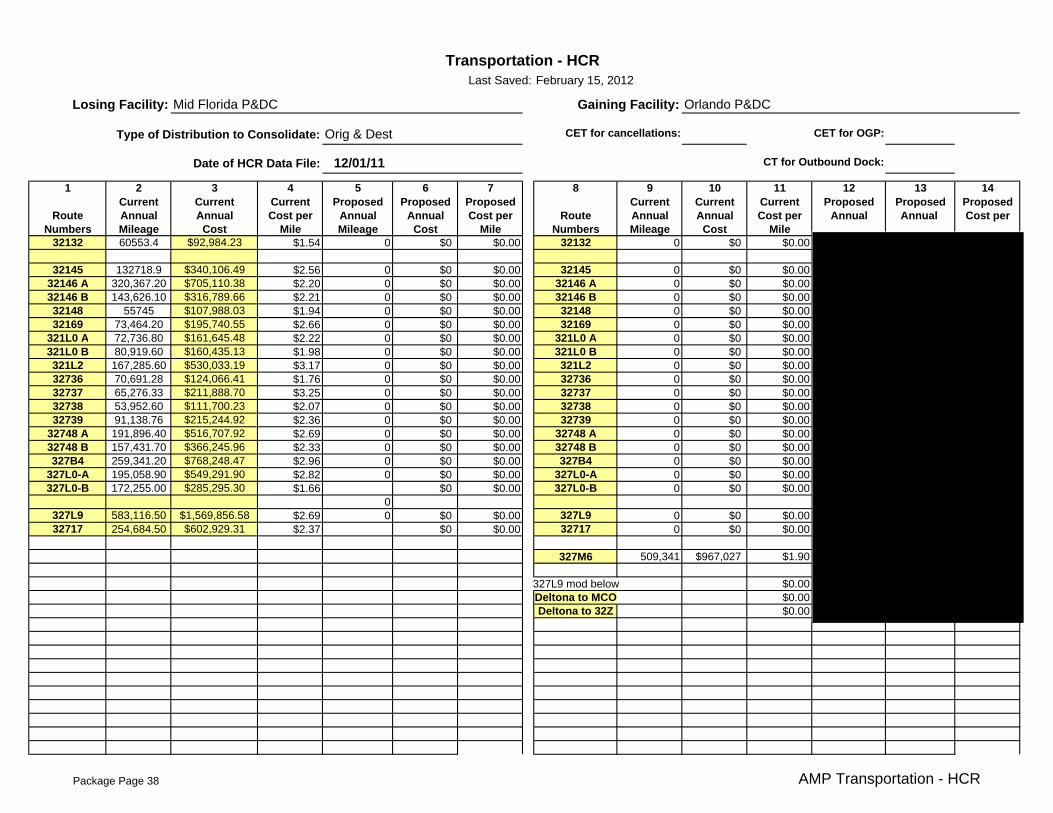
1 2 3 4 5 6 7 8 9 10 11 12 13 14Current Current Current Proposed Proposed Proposed Current Current Current Proposed Proposed Proposed
Route Annual Annual Cost per Annual Annual Cost per Route Annual Annual Cost per Annual Annual Cost perNumbers Mileage Cost Mile Mileage Cost Mile Numbers Mileage Cost Mile
32132 60553.4 $92,984.23 $1.54 0 $0 $0.00 32132 0 $0 $0.00
32145 132718.9 $340,106.49 $2.56 0 $0 $0.00 32145 0 $0 $0.0032146 A 320,367.20 $705,110.38 $2.20 0 $0 $0.00 32146 A 0 $0 $0.0032146 B 143,626.10 $316,789.66 $2.21 0 $0 $0.00 32146 B 0 $0 $0.0032148 55745 $107,988.03 $1.94 0 $0 $0.00 32148 0 $0 $0.0032169 73,464.20 $195,740.55 $2.66 0 $0 $0.00 32169 0 $0 $0.00
321L0 A 72,736.80 $161,645.48 $2.22 0 $0 $0.00 321L0 A 0 $0 $0.00321L0 B 80,919.60 $160,435.13 $1.98 0 $0 $0.00 321L0 B 0 $0 $0.00321L2 167,285.60 $530,033.19 $3.17 0 $0 $0.00 321L2 0 $0 $0.0032736 70,691.28 $124,066.41 $1.76 0 $0 $0.00 32736 0 $0 $0.0032737 65,276.33 $211,888.70 $3.25 0 $0 $0.00 32737 0 $0 $0.0032738 53,952.60 $111,700.23 $2.07 0 $0 $0.00 32738 0 $0 $0.0032739 91,138.76 $215,244.92 $2.36 0 $0 $0.00 32739 0 $0 $0.00
32748 A 191,896.40 $516,707.92 $2.69 0 $0 $0.00 32748 A 0 $0 $0.0032748 B 157,431.70 $366,245.96 $2.33 0 $0 $0.00 32748 B 0 $0 $0.00327B4 259,341.20 $768,248.47 $2.96 0 $0 $0.00 327B4 0 $0 $0.00
327L0-A 195,058.90 $549,291.90 $2.82 0 $0 $0.00 327L0-A 0 $0 $0.00327L0-B 172,255.00 $285,295.30 $1.66 $0 $0.00 327L0-B 0 $0 $0.00
0327L9 583,116.50 $1,569,856.58 $2.69 0 $0 $0.00 327L9 0 $0 $0.0032717 254,684.50 $602,929.31 $2.37 $0 $0.00 32717 0 $0 $0.00
327M6 509,341 $967,027 $1.90
327L9 mod below $0.00Deltona to MCO $0.00Deltona to 32Z $0.00
Type of Distribution to Consolidate:
Date of HCR Data File:
CET for cancellations:
Last Saved: February 15, 2012
Losing Facility: Mid Florida P&DC Orlando P&DCGaining Facility:
Orig & Dest
12/01/11
CET for OGP:
CT for Outbound Dock:
Transportation - HCR
Package Page 38 AMP Transportation - HCR

1 2 3 4 5 6 7 8 9 10 11 12 13 14Current Current Current Proposed Proposed Proposed Current Current Current Proposed Proposed Proposed
Route Annual Annual Cost per Annual Annual Cost per Route Annual Annual Cost per Annual Annual Cost perNumbers Mileage Cost Mile Mileage Cost Mile Numbers Mileage Cost Mile Mileage Cost Mile
Package Page 39 AMP Transportation - HCR

1 2 3 4 5 6 7 8 9 10 11 12 13 14Current Current Current Proposed Proposed Proposed Current Current Current Proposed Proposed Proposed
Route Annual Annual Cost per Annual Annual Cost per Route Annual Annual Cost per Annual Annual Cost perNumbers Mileage Cost Mile Mileage Cost Mile Numbers Mileage Cost Mile Mileage Cost Mile
Totals 3,202,260 0 Totals 509,341 4,317,639
$7,932,309 ($9,349,581)
Total HCR Transportation Savings:
Trips from Losing
Moving to Lose (-)
<<== (This number is summed with Total from 'Trans-PVS' and carried forward to the Executive Summary as Transportation Savings )
rev 11/05/2008
Current Gaining
($1,417,272)
Proposed Result
HCR Annual Savings (Losing Facility): HCR Annual Savings (Gaining Facility):
Proposed Trip Impacts
Other Changes
(+/-)
Moving to Gain (-)
Proposed Trip
Impacts
Current Losing Proposed ResultTrips from
Gaining
Other Changes
(+/-)
Package Page 40 AMP Transportation - HCR

Orig & Dest
(1) (2)
DMM L011 From:
x x DMM L201 Action Code* Column A - 3-Digit ZIP Code Prefix Group
DMM L601 D
x DMM L602
x DMM L603 To:
DMM L604 Action Code* Column A - 3-Digit ZIP Code Prefix Group
DMM L605 CTDMM L606
x DMM L607
x DMM L801
(3)
Action Code*
D
CT
Action Code*
Action Code*
Action Code*
(4)
Count % Count % Count % Count %
Oct-11 327343 81 23.62% 101 29.45% 1 0.29% 260 75.80% 14
Sep-11 327 355 88 25% 101 28% 0 0% 266 75% 12
Oct-11 MCO 369 87 24% 122 33% 0 0% 282 76% 23
Sep-11 MCO 362 83 23% 133 37% 0 0% 279 77% 13
(5) Notes
*Action Codes: A=add D=delete CF-change from CT=change to
Important Note: Section 2 & 3 illustrate possible changes to DMM labeling lists. Section 2 relates to consolidation of Destination Operations. Section 3 pertains to Originating Operations. The Area Distribution Network group will submit appropriate requests for DMM changes after AMP approval.
Column A - Entry ZIP Codes Column B - 3-Digit ZIP Code Destinations Column C - Label to
Column A - Entry ZIP Codes Column B - 3-Digit ZIP Code Destinations Column C - Label to
SCF ORLANDO FL 328
DMM L009
DMM L010
DMM L005
DMM L006
DMM L007
DMM L008
321, 327, 328, 329, 347
DMM L003
DMM L004
DMM L001
DMM L002
Distribution Changes
Indicate each DMM labeling list affected by placing an "X" to the left of the list.
Losing Facility:Type of Distribution to Consolidate
If revisions to DMM L005 or DMM L201 are needed, indicate proposed DMM label change below.
Last Saved: February 15, 2012
Mid Florida P&DC
DMM Labeling List L005 - 3-Digit ZIP Code Prefix Groups - SCF Sortation
321, 327
Column B - Label to
SCF MID-FLORIDA FL 327
*Action Codes: A=add D=delete CF-change from CT=change to
Column B - Label to
rev 5/14/2009
The Orlando P&DC 328 will only process Letters. All Flats, Parcels, and Bundles would be assigned to the Orlando Annex 328
Drop Shipments for Destination Entry Discounts - FAST Appointment Summary ReportMonth Losing/Gaining NASS
Code Facility Name Total Schd Appts
Unschd Count
Losing Facility Mid-Florida
Losing Facility Mid-Florida
No-Show Late Arrival Open Closed
Gaining Facility Orlando
Gaining Facility Orlando
DMM Labeling List L201 - Periodicals Origin Split
Column A - Entry ZIP Codes Column B - 3-Digit ZIP Code Destinations Column C - Label to
321, 327005, 060-069, 074-089, 100-119, 124-127, 140-212, 214-268, 270-339, 341, 342, 344, 346, 347, 349-352, 354-418, 420-427, 430-497, 500-516, 520-528, 530-532, 534, 549, 612-620, 622-631, 633-641, 644-658, 660-662, 664-668, 680, 681, 683-693, 700, 701, 703-708, 710-714, 716-731, 734-738, 740, 741, 743-764, 770-778
OMX MID-FLORIDA FL 327
Column C - Label to
321, 327, 328, 329, 347005, 068-089, 100-119, 124-127, 140-212, 214-268, 270-339, 341, 342, 344, 346, 347, 349-352, 354-418, 420-427, 430-497, 500-516, 520-528, 530-532, 534, 549, 600-620, 622-631, 633-641, 644-658, 660-662, 664-668, 680, 681, 683-693, 700, 701, 703-708, 710-714, 716-731, 734-738, 740, 741, 743-764, 770-778
OMX ORLANDO FL 328
Column A - Entry ZIP Codes Column B - 3-Digit ZIP Code Destinations Column C - Label to
Package Page 41 AMP Distr bution Changes

Losing Facility: Gaining Facility:
(1) (2) (3) (4) (5) (6) (7) (8)
Equipment EquipmentType TypeAFCS 4 0 (4) AFCS 7 7 0 (4)
AFCS200 0 0 0 AFCS200 0 0 0 0AFSM - ALL 1 0 (1) AFSM - ALL 0 0 0 (1)
APPS 0 0 0 APPS 0 0 0 0CIOSS 4 0 (4) CIOSS 0 3 3 (1) $20,679CSBCS 0 0 0 CSBCS 0 0 0 0DBCS 18 0 (18) DBCS 31 30 (1) (19) $68,930
DBCS-OSS 7 0 (7) DBCS-OSS 0 0 0 (7)DIOSS 3 0 (3) DIOSS 4 5 1 (2) $6,893
FSS 0 0 0 FSS 0 0 0 0SPBS 0 0 0 SPBS 0 0 0 0UFSM 0 0 0 UFSM 0 0 0 0
FC / MICRO MARK 0 0 0 FC / MICRO MARK 0 0 0 0ROBOT GANTRY 3 0 (3) ROBOT GANTRY 4 3 (1) (4)
HSTS / HSUS 0 0 0 HSTS / HSUS 0 0 0 0LCTS / LCUS 0 0 0 LCTS / LCUS 1 1 0 0
LIPS 0 0 0 LIPS 0 0 0 0MPBCS-OSS 0 0 0 MPBCS-OSS 0 0 0 0
TABBER 0 0 0 TABBER 0 0 0 0PIV 0 0 0 PIV 0 0 0 0
LCREM 2 0 (2) LCREM 1 2 1 (1)
(9) Notes:
rev 03/04/2008
Relocations costs will be 1 DIOSS and 3 CIOSS. (4*6,893) $ 27,572 + replacement of 10 Phase II DBCS' ($6893 each)
(This number is carried forward to Space Evaluation and Other Costs )
Proposed NumberDifference
Mail Processing Equipment Relocation Costs from Losing to Gaining Facility: $96,502
MPE Inventory
Actual automation MPE requirement totals will be 5 DIOSS, 3 CIOSS, and 30 DBCS.
Mid Florida P&DC Orlando P&DC
Current Number Difference Equipment
ChangeRelocation
Costs
Last Saved:
Current Number
Data Extraction Date:
Proposed Number
February 15, 2012
Package Page 42 AMP MPE Inventory

Last Saved:
3-Digit ZIP Code: 3-Digit ZIP Code:
1. Collection Points Mon. - Fri. Sat. Mon. - Fri. Sat. Mon. - Fri. Sat. Sat.
0 0 0 0 0 0 0
2. How many collection boxes are designated for "local delivery"? 0
3. How many "local delivery" boxes will be removed as a result of AMP? 0
4.Quarter/FY Percent
5. 6.
Start End Start End Start End Start End
Monday Monday 9:30 18:00 None NoneTuesday Tuesday 9:30 18:00 None None
Wednesday Wednesday 9:30 18:00 None NoneThursday Thursday 9:30 18:00 None None
Friday Friday 9:30 18:00 None NoneSaturday Saturday
7.
8. Notes:
9.
Line 1
Line 2
February 15, 2012
Mid Florida P&DC
Current CurrentCurrent
No Retail Window in Mid-FL PDC. The FSO Preliminary Node Study Recommendation is to dispose of the Mid-Florida P&DC facility
Current
Orlando FL 328
3-Digit ZIP Code:Current
rev 6/18/2008
32799
Can customers obtain a local postmark in accordance with applicable policies in the Postal Operations Manual?
Gaining Facility:
What postmark will be printed on collection mail?
Proposed
% Carriers returning before 5 p.m.
Mon. - Fri.
Customer Service Issues
Current Proposed
Number picked up after 5 p.m. Number picked up between 1-5 p.m.
Total Number of Collection Points
Delivery Performance Report
Retail Unit Inside Losing Facility (Window Service Times)
Losing Facility:5-Digit ZIP Code:
Data Extraction Date:
3-Digit ZIP Code:
Number picked up before 1 p.m.
Business (Bulk) Mail Acceptance Hours
if the AMP is approved. The BMEU operations will be moved to the Lake Mary Main Office, 1.12 miles away.
Orlando P&DC
0
Package Page 43 AMP Customer Service Issues

Last Saved:
1.
2. Lease Information. (If not leased skip to 3 below.)
3.
4. Planned use for acquired space from approved AMP
5. Facility Costs
(This number shown below under One-Time Costs section.
6. Savings Information
(This number carried forward to the Executive Summary )
7. Notes
(This number carried forward to Executive Summary )
$75,000
$171,502
800 Rinehart Rd.Mid Florida, FL 32799
N/A (Owned)
$0
$0
Facility Costs:
Mid Florida P&DC Orlando P&DC
Space Evaluation and Other Costs
Street Address:City, State ZIP:
Losing Facility:
Space Evaluation
Affected FacilityFacility Name:
February 15, 2012
Mid Florida P&DC
Mid Florida P&DC
Mail Processing Equipment Relocation Costs: (from MPE Inventory )
Space Savings ($):
One-Time Costs
Employee Relocation Costs:
$96,502
Gaining Facility:Losing Facility:
340989 sq ft.340989
$75,000
No planned use for P&DC facility.
Enter any projected one-time facility costs:
Enter annual lease cost:
Enter the total interior square footage of the facility:Enter gained square footage expected with the AMP:
Enter lease options/terms:
Current Square Footage
Enter lease expiration date:
(from above)
Total One-Time Costs:
Remote Encoding Center Cost per 1000
Package Page 44 AMP Space Evaluation and Other Costs