Embed Size (px)
Citation preview

A five-year longitudinal study of teacher survival among teacher-education graduates of Montana StateUniversityby Richard John Steadman
A thesis submitted in partial fulfillment of the requirements for the degree of Doctor of EducationMontana State University© Copyright by Richard John Steadman (1987)
Abstract:The primary focus of this study was on two aspects of teacher turnover. The study sought to find ifnineteen demographic and performance variables gathered prior to graduation could predict the careerdecisions of graduates of a teacher-education class five years following their graduation. Also, the rateat which beginning teachers among the study sample left teaching was compared with rates found inother comparable studies.
The study sample included all teacher-education graduates from Montana State University in 1979.Prior to graduation each subject completed a questionnaire and Allport-Vernon Study of Values.Measures of intelligence, achievement, and student teaching performance were gathered. Each year forfive years immediately following their graduation, subjects were contacted and asked to provideinformation about their present careers, geographic locations, and reasons for any career change. Afterthe fifth yearly contact, subjects were divided into employment categories based on whether they werecurrently teaching, had taught but were no longer teaching, or had never taught. Nineteen variableswere analyzed using One-Way Analysis of Variance and Chi Square Test of Independence. In addition,Chi Square Goodness of Fit was used to compare the turnover rates among teachers in this study and ineach of four other comparable teacher turnover studies.
Two of the nineteen pre-employment variables were found to be significant at the .05 level. There wasno significant difference in the rate at which beginning teachers in this study left teaching and the ratesat which beginning teachers in four other studies left teaching. The study concluded with narrativedescriptions of careers pursued by subjects outside of teaching, reasons given by subjects for leavingteaching, and the geographic distribution of graduates five years after graduation.
Two major conclusions can be drawn from this study. First, preemployment characteristics andexperiences by themselves cannot predict an individual's career pattern. Lifetime experiences play amajor role in the process and must be examined in conjunction with pre-employment variables tounderstand career decisions. Second, the rate at which teachers leave teaching is constant over time, jobmarket condition, and geographic location.

A FIVE-YEAR LONGITUDINAL STUDY OF TEACHER SURVIVAL AMONG TEACHER-EDUCATION GRADUATES
OF MONTANA STATE UNIVERSITY
byRichard John Steadman
A thesis submitted in partial fulfillment of the requirements for the degree
ofDoctor of Education
MONTANA STATE UNIVERSITY Bozeman, MontanaNovember I 987

ii
3) 3125*31
APPROVAL
of a thesis submitted by
Richard John Steadman
This thesis has been read by each member of the thesis committee and has been found to be satisfactory regarding content, English usage, format, citations, bibliographic style, and consistency, and is ready for submission to the College of Graduate Studies.
Approved for the Major Department
Date ' / lead, Major Department
Approved for the College of Graduate Studies
Date Graduate Dean

ill
STATEMENT OF PERMISSION TO USE
In presenting this thesis in partial fulfillment of the requirements for a doctoral degree at Montana State University, I agree that the Library shall make it available to borrowers under rules of the Library. I further agree that copying of this thesis is allowable only for scholarly purposes, consistent with "fair use" as prescribed in the U.S. Copyright Law. Requests for extensive copying or reproduction of this thesis should be referred to University Microfilms International, 300 North Zeeb Road, Ann Arbor, Michigan 48106, to whom I have granted "the exclusive right to reproduce and distribute copies of the dissertation in and from microfilm and the right to reproduce and distribute by abstract in any format."
SignatureDate ______ I I - I ~ £ ~T

iv
ACKNOWLEDGEMENTS
The author wishes to express his gratitude to the members of his doctoral committee, Drs. Don Robson, Dianne Peters, Douglas Herbster, Richard Horswill, Douglas McClelland, and Albert Suvak. Without their help and understanding, this project would never have reached a positive conclusion. The author particularly acknowledges Dr. Don Robson for his strong leadership and Dr. Al Suvak who so unselfishly
opened his office and himself. A special thanks also goes to Dr. John Kohl under whose direction the process was begun.
I must also express my deep appreciation to the women in my life.
Tomy mother, Faye, who gently nudged me forward into higher learning and in so doing opened the whole world to me. Also to my wife, Betty, and daughters, Staci and Lisa, who have always supported and loved me without qualification or question and who made me feel I could succeed. I can’t imagine accomplishing this dissertation or anything else of
value without them.

V
TABLE OF CONTENTS
PageAPPROVAL............... iiSTATEMENT OF PERMISSION TO USE.................................. iiiACKNOWLED CEMENTS................................................ i vTABLE OF CONTENTS.................................... '.......... VLIST OF TABLES.................................................. viiLIST OF FIGURES................................................. xiiABSTRACT......................................... xi'ii
CHAPTER:I . INTRODUCTION TO THE STUDY................................ I
Introduction.......................................... IStatement of the Problem....Need for the Study.........Questions to Be InvestigatedGeneral Procedures....... ............................ 11Limitations and Delimitations.................. ...... 13Definition of Terms............................... 14Summary.......................... 16
2. REVIEW OF RELATED LITERATURE AND RESEARCH................. 18Research Related to Predicting Teacher Success........ I 9
Studies Predicting Success.......................... 19Difficulties in Measuring.Successful Teaching...... 22Need to Study Teacher Survival..................... 24
Research Related to Teacher Survival.................. 26Research Related to Teacher Retention............ 34
Demographic Factors....... ......... *.............. 36Personal and Professional Factors................... 41School-Related Factors............................. 44
Research Related to the Reasons Teachers LeaveTeaching........................................... 46Intrinsic Reasons.................................. 48Extrinsic Reasons.................................. 51
Research Related to Careers Outside of Teaching....... 52
vo U
l 4r
yi
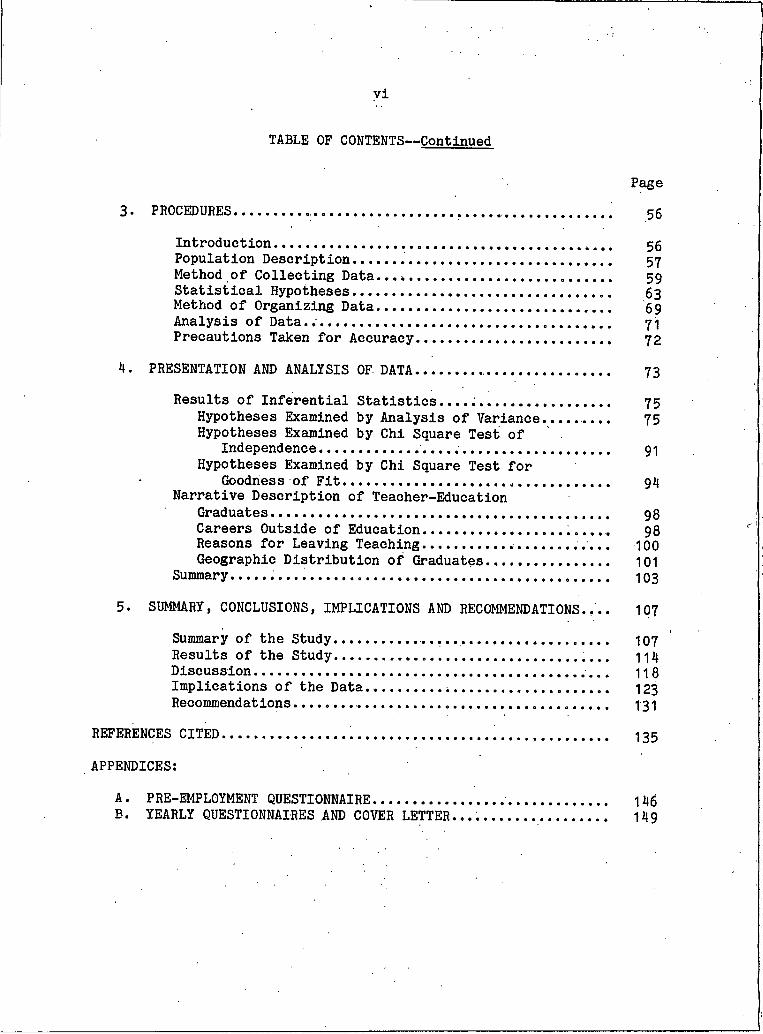
TABLE OF CONTENTS--Continued
Page3- PROCEDURES......... ....................... .............. 55
Introduction...................................... . ... 55Population Description......... ....................... 57Method of Collecting Data............................. 59Statistical Hypotheses................................. 63Method of Organizing Data............................. 69Analysis of Data.................................. 71Precautions Taken for Accuracy........................ 72
4. PRESENTATION AND ANALYSIS OF DATA........ 73
Results of Inferential Statistics..................... 75Hypotheses Examined by Analysis of Variance..... 75Hypotheses Examined by Chi Square Test of
Independence............ ........................ 91Hypotheses Examined by Chi Square Test for
Goodness of Fit.................... 94Narrative Description of Teacher-Education
Graduates.......................................... 98Careers Outside of Education.................. 98Reasons for Leaving Teaching.......... 100Geographic Distribution of Graduates............... 101
Summary............................................... 103
5. SUMMARY, CONCLUSIONS, IMPLICATIONS AND RECOMMENDATIONS.... 107Summary of the Study.......... ........................ 107Results of the Study............................... 114Discussion.......................... .............. . 11 8Implications of the Data.......... 123Recommendations....... 731
REFERENCES CITED............... ................. ............... 135
APPENDICES:
A. PRE-EMPLOYMENT QUESTIONNAIRE................ 146B. YEARLY QUESTIONNAIRES AND COVER LETTER................... 149

vii
LIST OF TABLES
Table Page1. Service table depicting information on teacher
survival found by Whitener (1965)....................... 292. Service table depicting information on teacher
survival found by Charters (1970)....................... 303• Service table depicting information on teacher
survival found by Shavelson and Trinchero (1973)...... , 314. Service table depicting information on teacher
survival found by Mark and Anderson (1985) ........ i. 325. Example of One-Way Analysis of Variance table
used to present information in Chapter 4................ 696. Example of Chi Square Test of Independence table
used to present information in Chapter 4................ 707* Example of Chi Square Goodness of Fit table used
to present information in Chapter 4...... ............... 71
8. Categorical breakdown of members in the studysample......................... 74
9. Table of means on the theoretical subscore ofthe Study of Values by employment category.............. 76
10. One-Way Analysis of Variance for the theoretical subscore of the Study of Values by employmentcategory................ 76
11. Table of means on the economic subscore of theStudy of Values by employment category.................. 77
12. One-Way Analysis of Variance for the economic subscore of the Study of Values by employmentcategory..... ........................ 77
13» Table of means on the aesthetic subscore of theStudy of Values by employment category.................. 78

viii
14. One-Way Analysis of Variance for the aesthetic subscore of the Study of Values by employmentcategory........... ..................................... 78
15. Table of means on the social subscore of theStudy of Values by employment category.............. . 79
16. One-Way Analysis of Variance for the social subscore of the Study of Values by employmentcategory..... ......................... 79
17. Table of means on the political subscore of theStudy of Values by employment category.............. 80
18. One-Way Analysis of Variance for the political subscore of the Study of Values by employmentcategory................................................ 80
19. Table of means on the religious subscore of theStudy of Values by employment category.............. 81
20. One-Way Analysis of Variance for the religious subscore of the Study of Values by employmentcategory.............................. 81
21. Table of means for undergraduate grade pointaverages by employment category......................... 82
22. One-Way Analysis of Variance for undergraduategrade point average by employment category............... 82
23. Table of means for grade point averages inteaching majors by employment category................... 83
24. One-Way Analysis of Variance for grade point averages in teaching majors by employmentcategory....... 83
25. Table of means for grade point averages in teacher-education core program by employmentcategory........................ 84
26. One-Way Analysis of Variance for grade point averages in teacher-education core program byemployment category.................. 84
LIST OF TABLES— Continued
Table Page

Table Pzige27. Table of means for student-teacher effective
ness ratings by employment category..................... 85
28. One-Way Analysis of Variance for student- teacher effectiveness ratings by employmentcategory................ 85; ■ ■ ■'
29. Table of means for stanine rankings on the verbal section of the Montana State UniversityPlacement Examination by employment category............. 86
30. One-Way Analysis of Variance for stanine rankings on the verbal section of the Montana State University Placement Examination byemployment category..................................... 86
31. Table of means for stanine rankings on the quantitative section of the Montana State University Placement Examination by employmentcategory......... ........ 87
32. One-Way Analysis of Variance for the stanine rankings on the quantitative section of the Montana State University Placement Examinationby employment category........... 87
33. Table of means of ages of teacher-educationgraduates by employment category..... ........... 88
34. One-Way Analysis of Variance of ages of teacher-education graduates by employmentcategory............... ................................ 88
35. Table of means of the size of community in which teacher-education graduates spent the first ten years of their lives by employmentcategory................... ........... ................. 89
36. One-Way Analysis of Variance of the size of community in which teacher-education graduates spent the first ten years of their lives byemployment category........ ........ .................... 89
37. Table of means of family incomes for teacher-education graduates by employment category............... 90
ix
LIST OF TABLES— Continued

Xz
38. One-Way Analysis of Variance of family incomes for teacher-education graduates by employmentcategory..................... .......................... 90
39. Chi Square Table: Gender by employment category........ 9140. Chi Square Table: Usual occupation of primary
breadwinner by employment category......... 92
41. Chi Square Table: Time of life when decisionwas made to prepare for teaching by employmentcategory............. .................................. 93
42. Chi Square Table: Attitude of graduates toteaching as a career by employment category.............. 94
43. Chi Square Table: Rates of survival for teacher-education graduates of Montana State Universityin 1979 and for Whitener (1965) by year................ . 95
44. Chi Square Table: Rates of survival for teacher-education graduates of Montana State Universityin 1979 and for Charters (1970) by year...... ........... 96
45. Chi Square Table: Rates of survival for teacher-education graduates of Montana State University in 1979 and for Shavelson and Trinchero (1974)by year. ............................................... 97
46. Chi Square Table: Rates of survival for teacher-education graduates of Montana State Universityin 1979 and for Mark and Anderson (1985) by year........ 98
47. Careers outside of classroom teaching pursued byteacher-education graduates in the fall of 1984......... 99
48. Reasons given by teacher-education graduates forleaving classroom teaching..... ......................... 101
49. Geographic distribution of 228 teacher-educationgraduates in the fall of 1984...... ..................... 102
50. Geographic distribution of 104 classroom teachersin the fall of 1984................. ..... .............. 102
LIST OF TABLES— Continued
Table Page

Table Page51. Table of hypotheses..................................... 10352. Service table depicting information on survival
found by Steadman................................... . 11653- Service table depicting information on survival
for males found by Steadman..... ....................... 12854. Service table depicting information on survival
for females found by Steadman..................... 12855. Chi Square Table: Rates of survival for female
teacher-education graduates of Montana State University in 1979 and for male teacher-educationgraduates in 1979 by year................ ............... 129
56. Reasons given most often by male and female teacher-education graduates for leaving teachingin order of frequency....................... 131
xi
LIST OF TABLES— Continued

xii
LIST OF FIGURES
Figure Page1. A modified figure of Chapman’s model of the
influences associated with teacher attrition............ 1252. Yearly percent of male and female teacher-
education graduates of Montana State University in 1979 surviving by year..... ..................... 130

xiii
ABSTRACT
The primary focus of this study was on two aspects of teacher turnover. The study sought to find if nineteen demographic and performance variables gathered prior to graduation could, predict the career decisions of graduates of a teacher-education class five years following their graduation. Also, the rate at which beginning teachers among the study sample left teaching was compared with rates found in other comparable studies.
The study sample included all teacher-education graduates from Montana State University in 1979• Prior to graduation each subject completed a questionnaire and Allport-Vernon Study of Values. Measures of intelligence, achievement, and student teaching performance were gathered. Each year for five years immediately following their graduation, subjects were contacted and asked to provide information about their present careers, geographic locations, and reasons for any career change. After the fifth yearly contact, subjects were divided into employment categories based on whether they were currently teaching, had taught but were no longer teaching, or had never taught. Nineteen variables were analyzed using One-Way Analysis of Variance and Chi Square Test of Independence. In addition, Chi Square Goodness of Fit was used to compare the turnover rates among teachers in this study and in each of four other comparable teacher.turnover studies.
Two of the nineteen pre-employment variables were found to be significant at the .05 level. There was no significant difference in the rate at which beginning teachers in this study left teaching and the rates at which beginning teachers in. four other studies left teaching. The study concluded with narrative descriptions of careers pursued by subjects outside of teaching, reasons given by subjects for leaving teaching, and the geographic distribution of graduates five years after graduation.
Two major conclusions can be drawn from this study. First, preemployment characteristics and experiences by themselves cannot predict an individual's career pattern. Lifetime experiences play a major role in the process and must be examined in conjunction with pre-employment variables to understand career decisions. Second, the rate at which teachers leave teaching is constant over time, job market condition, and geographic location.

T
CHAPTER I
INTRODUCTION TO THE STUDY
Introduction
Since the Colonial Period in American history, teaching has had the reputation of being a profession with a higher rate of turnover among its members than the other recognized professions (Lortie, 1975). Educators, sensitive to real or imagined criticisms, have devoted much time and effort to understand more fully the reasons behind this reputation. A wide variety of education-related questions have been
investigated, at least in part, because educators have needed to understand and explain the forces at work in teacher turnover.
Initially the research efforts centered on attempts to measure and
to predict successful teaching performance. Marsh and Wilder (1954), for example, reviewed many studies conducted in the first half of the Twentieth Century, and attempted to isolate predictive variables which
would distinguish successful teachers from unsuccessful teachers. These studies looked at:
. . . measured intelligence, education, scholarship, age and experience, knowledge of subject matter, professional information, extra-curricular activities, general culture, socioeconomic status, sex, marital status, teaching attitude, interest in teaching, voice and speech, the photograph and standardized personality tests (Marsh and Wilder, p. 2).Marsh and Wilder tried in various ways to discover relationships
between these variables and measured teaching success. The studies

2found no conclusive evidence to suggest any permanent, recognizable relationships existed between any of the variables and measured teaching success. In fact, the studies further confused the problem by showing a marked lack of agreement concerning exactly what was the best way of judging successful teaching. Robinson (1962), among others, has indicated that attempting to measure success is simply wasted effort, and Huling-Austin (1986) more recently concluded that successful teaching is too ”multifaceted and content specific" for one to be able to say that a particular method or practice is best in all or even most settings.
A more productive research avenue might be to gather preemployment variables and investigate what relationship might exist between these variables and the length of time an individual remains in the teaching profession. This concept Pratt (1977) referred to as
teacher survival and Chapman and Hutcheson (1982) called teacher retention.
Researchers are also increasingly interested in the sizeable group of teacher-education graduates who either begin to teach upon graduation or soon afterwards but leave the profession after a few years or never enter the profession at all. Charters (1956) noted in the mid- 1950s, a time of teacher shortage, that 40 percent of the graduates of
the University of Illinois teacher education program "never taught one
day" (p; 253)• The Career Placement and Planning Office at Montana State University found in the period 1972 through 1979, a time that the
National Education Association (1977) characterized as having had one of the greatest teacher surpluses in American history, approximately

3the same percentage of teacher education graduates did not enter the teaching profession, as had been true in Charters' studies in the mid-
1950s. This trend has held fairly steady across various fluctuations in teacher supply and demand. Even in the early 1980s, a time of near equilibrium between supply and demand for teachers, about the same percentage of teacher-education graduates did not enter the field. Benton (1985), Huling-Austin (1986), and Kerr (1983) found that by the end of the fifth year following graduation, approximately 60 percent of all teacher-education graduates were not involved in any way with teaching. Either the graduate had never taught or had left the field after a brief teaching career. In fact, the only times in which these percentages have significantly varied were during World War II and the
Korean Conflict when the percentage of teacher-education graduates that did not teach substantially increased because they were conscripted
into the armed services upon graduation (Charters, 1970).
At present, a great deal of interest is being expressed in the literature about teacher survival and retention. Studies of survival
and retention are similar yet different areas within the general area of teacher turnover research. Survival research, begun in the 1950s by W.W. Charters, has provided information both on the rates at which
teachers have left teaching and on the hazards individuals have encountered during their careers which have influenced turnover. The term "retention" has appeared in the literature only within the last
decade. Retention researchers have attempted to isolate personal and
environmental factors which have contributed to teacher turnover as well as to develop models that would predict which teacher-education

4graduates were most likely to remain in teaching over the years. The present study will add to the knowledge base concerning teacher survival and retention by following both teacher-education graduates who never entered the profession and those graduates who began to teach but left the profession before the end of the fifth year following graduation. The researcher also studied graduates who remained in teaching at the end of the fifth year and graduates who left teaching but remained in education-related positions such as school administration or school counselors. The fifth year was used as a critical point in this study since Whitener (1965) found it to be the year beyond which teachers who remained in the field tended to make teaching their permanent careers. While gathering data about these four groups, the study also quantified the rate of survival for teacher-education graduates of Montana State University. Further, it examined the
reasons dropouts gave for leaving the profession. Finally, it described the types of careers outside of the profession which teacher- education graduates pursued if they chose not to teach, and the
geographic distribution of teacher-education graduates five years following their graduation from Montana State University.
Statement of the Problem
The purpose of this study was to follow the 1979 class of teacher- education graduates from Montana State University for a five-year period following graduation in order to determine the predictive validity of selected variables collected prior to the class’s graduation. The investigation centered on whether the individuals: (I) did

5not enter teaching at any time, (2) entered teaching at some time between the fall of 1979 and the fall of 1983 but left teaching by the conclusion of the study in the fall of 1984, or (3) remained in the education profession either as a teacher or a related-educator in the fall of 1984. This study also quantified the rate at which members of
the class of 1979 left teaching during the study period as compared to rates of survival found in other studies. The investigation enumerated the reasons teachers who left the profession gave for dropping out of
teaching. Finally, it listed the career alternatives to teaching chosen by members of this group as well as the geographic location of the teacher-education graduates five years after graduation.
Need for the Study
The importance of this study lies in the fact that it provides insight into the career patterns and career decisions of an entire graduating class of teacher-education graduates. All too often
individuals attend an institution of higher education, graduate, and
enter the job market rarely to communicate with the institution again. This is the pattern for the College of Education at Montana State University, just as it is the pattern for every other academic unit of
the university or of any other post-secondary institution.
The initial career decision for each teacher-education graduate in the study population was found through the annual followup study of
teacher-education graduates conducted yearly by the Career Planning and Placement Office. However, in most cases the initial position was just the first step along the individual’s career path. Hoppock (1978) has

6
said each American worker who works outside the home makes 3.5 recognizable career changes in his/her lifetime; and Charters (1956), as was previously mentioned, indicated it was not until after the fifth year of teaching that the rate of teachers leaving the profession stabilized itself enough to predict who among a graduating class would most probably make teaching his/her career.
This study provides information about all teaching graduates of the 1979 graduating class of Montana State University five years after they completed their education. The study focused on finding discriminating variables that could be gathered prior to graduation which would predict whether individuals: (I) did not enter teaching,
(2) entered teaching and then dropped out, or (3) entered teaching and remained active in the profession beyond five years.
Such research efforts are needed for many reasons. Chapman and
Green (1986) maintained that due to the cyclical nature in the supply and demand for teachers, the profession’s leaders must have ways to identify, attract, and retain the people most likely to teach. Chapman (1984) asserted supply and demand information allowed both teacher- educators and employers of teachers to regulate admission and hiring depending on their needs at the time. Benton (1985) has shown education graduates do differ from other college graduates in the determinants of persistence and so it is unwise to assume that the training and selection of teachers is merely an extension of what we
know about the training and selection of engineers, accountants, nurses, and other college-trained professionals. Then, too, both hidden and apparent financial considerations are involved in teacher

7turnover. As the amount of money available to education at all levels shrinks, teacher-education institutions and school districts must look for ways to cut unnecessary financial expenditures. Owumanam (1984)maintained that by training only those students most likely to teach,
.
teacher-education institutions can save money. He also believed school systems could save money in the long run by hiring teachers who would remain in teaching rather than continuously having to recruit and hire new teachers.
The literature also suggested the structural nature of a study such as the present one had value in investigating survival andretention. The National Education Association (1967) at a national
symposium dealing with education's most pressing research needs concluded, among other things, that studies which had a longitudinal dimension were most likely to "show how the process [of teaching]affects the teacher over a period of years" (p. 62). Mobley et al.
(1979) agreed the best design to study teacher turnover was a longitudinal one, given the dynamic nature of the turnover process. Another aspect incorporated in this study which both Chapman and Hutcheson (1982) and Mobley et al. (1979) recommended was the use of data gathered prior to graduation rather than the after-the-fact ratings by teachers based on their recollections of their feelings which most research has used. In part, their recommendation was due to the
relative lack of research using pre-employment variables and, in part,the recommendation was due to the inroads the passage of time made on
■
the accuracy of data gathered after the fact.
8 iFinally, this study went beyond the common demographic variables
used in most studies to include variables that Bloland and Selby (1980) and Schwartz (1986) contended should be investigated such as family background, personality, and personal affect, in addition to the more typical variables of sex, age, intelligence, and achievement.
This information should be helpful in adding to information about those who do and those who do not teach. It may be possible that predictive data can be generated through this and other similar studies to reveal in advance which graduates are likely to teach and remain in
teaching. This line of inquiry can help smooth out the problems of shortages and surpluses experienced in teacher supply and demand during this century as well as aid in solving the problem of where resources might be better used based on the knowledge of who might teach.
The study did more than isolate pre-employment variables, however.
It described some of the characteristics of the class of 1979. It looked at the rate at which graduates left the profession after they
began teaching. Thus far, as Bloland and Selby (1980) have noted, most studies have counted teachers as dropouts if they left the district in which they initially began teaching, even though they may have simply moved to another district within that state or to another state; or these studies have followed students individually but have dealt with a very select group of individuals, such as Shavelson and Trinchero (1974) did with their students in Stanford University's intern program. The current study concerned itself with a more comprehensive group of teacher-education graduates (i.e., every student who graduated in teacher-education from Montana State University in 1979)• It followed

9
Information gained through the study also described the reasons given by teachers for leaving the profession for some other career field. . A part of this information involved a description of the jobs
that teacher-education graduates assumed if they did not teach. The geographic distribution of graduates of Montana State University at the end of five years following graduation was also studied. Through gathering all these data, a more complete picture of an entire graduating class was constructed. The study provided some information to the College of Education at Montana State University about which
graduates were most likely to teach, the rate at which graduates left
teaching once they began to teach, the occupations outside of teaching that teacher-education graduates entered, the reasons teacher-education
graduates gave for leaving teaching, and the geographic locations of teacher-education graduates five years following their graduation. The study may also help those persons called upon to advise teacher-educa
tion graduates about career and academic matters as well as for school hiring officials charged with filling their districts’ staffing needs.
Questions to Be Investigated
The following were questions which were investigated during the course of the study:
(I) Will any of the pre-graduation variables listed below predict whether a teacher-education graduate will remain in teaching five years following graduation?
them throughout the first five years of their careers regardless ofcareer choices or job mobility.

10(a) gender(b) age
(c) size of community in which s/he spent the first ten years of life
(d) family income(e) parents’ occupation(f) time of life when decision to enter teaching was
made
(g) attitude toward teaching as a career at the time of graduation from university
(h) value pattern exhibited on the Allport-Vernon Study
of Values(i) undergraduate grade point average(j) grade point average in teaching major
(k) grade point average in teacher-education core program
(l ) success in student teaching
(m) verbal stanine on the Montana State University
Placement Examination(n) quantitative stanine on the Montana State Univer
sity Placement Examination
(2) Will there be any differences between the survival rates found in previous National studies during the first five years following initial employment and the survival rate found for teacher-education graduates in the Montana

11State University class of 1979 during the first five years immediately following graduation?
(3) What reasons will teacher-education graduates who enter teaching but who leave the profession during the five- year study period give for dropping out of teaching and will these reasons differ from the reasons found in previous studies?
(4) What types of careers will graduates enter if they
either leave teaching after initially teaching or never enter teaching at all?
(5) What will be the geographic distribution of teacher- education graduates in the class of 1979 five years after their graduation from Montana State University?
General Procedures
The population of the study included all teacher-education graduates of Montana State University who graduated for the first time
with a university bachelor’s degree sometime between the conclusion of fall quarter 1978 and the end of summer quarter 1979, and who completed a teacher-education program.
All teacher-education graduates were followed over a five-year
period of time after graduation from Montana State University. At the
end of the fifth year, each individual was assigned to one of four
groups. Group one, henceforth referred to in this study as "survivors," comprised those individuals who were teaching at the end of five years. Group two, referred to as "related-educators," included
12
all individuals in education-related positions such as school administrators , school counselors, school psychologists, and full-time
graduate students who were enrolled in a post-baccalaureate course of study which had education as a major. Group three, referred to as "dropoutsconsisted of individuals who had entered the teaching profession at some time during the study period but who were not teaching at the end of the fifth year after graduation. Group four, referred to as "non-starters," encompassed all individuals who did not enter the teaching profession at any time during the five-year study period.
Prior to graduation each teacher-education candidate in the class of 1979 completed student teaching. In conjunction with the student teaching experience, candidates attended a weekly seminar. During the seminar each student was asked to complete the Allport-Vernon Study of
Values and a questionnaire which ascertained the individual's age,
gender, the size of community the individual lived in during the first ten years of his/her life, the family's socioeconomic background, age
when the candidate made the decision to become a teacher, and attitude toward teaching. In addition, information about each candidate was gathered from the Office of Career Planning and Placement, Office of
Student Teaching and Certification, and the Testing Center concerning student teaching success, undergraduate grade point averages, and intelligence.
At the end of each year following graduation between 1979 and 1984, each teacher-education graduate was contacted by the researcher and asked to complete and return a questionnaire requesting the

13individual’s current job status and the reason or reasons for any career change or changes made during that year. Each non-respondent to the initial inquiry was contacted by telephone at the end of one month and asked for the same information contained on the mailed questionnaire. This process was repeated at the end of each year until the conclusion of the five-year period of the study.
The data were analyzed after the fifth year. A One-Way Analysis of Variance was used to find the amount of difference in the means among 15 pre-employment variables and membership in the four, groups previously defined. A Chi Square Test of Independence statistic was used to establish whether differences existed between four pre
employment variables and membership in the four groups of teacher-i
education graduates. Finally, a Chi Square Goodness of Fit statistic was employed to look at the differences among the survival rates of
Montana State University teacher-education graduates in comparison to
other studies of teacher survival. Narrative descriptions detailed the reasons for leaving teaching, the career opportunities chosen outside
of teaching as reported by subjects, and the geographic distribution of teacher-education graduates.
Limitations and Delimitations
The major limitation of this study as the fact that it involved
only the 1979 teacher-education graduates of Montana State University.
The results are directly applicable only to a heterogeneous group of teacher-education graduates from a state university of a rural state in a time of teacher surplus.
14A second limitation was the researcher’s ability to locate the
subjects of the study during the five-year period of the study. .A third limitation was the use of recommendations concerning
student teaching performance and attitude which were submitted by a variety of individuals who used a variety of informational and attitud- inal bases to complete their student teaching evaluations. This nonstandardization of recommendations required that inferences not be made to the general population of teacher-education graduates from these recommendations.
A final limitation was confining the study to a five-year period. More information could have been gathered over a longer period of time,
although five years is the point when career patterns begin to become clear.
Definition of Terms
The terms which are listed here are used throughout the study and are defined as follows:
(1) Dropout. For the purposes of this study, the term
applies to any teacher-education graduate who began to teach at some time during the study but as not a class
room teacher or in an education-related position at the
end of the fifth year following graduation.(2) Follow-up study. This term refers to "a procedure for
accumulating pertinent data from or about individuals after they have had similar or corresponding experiences” (Rosser and Denton, 1977)•

15(3) Non-starter. For the purposes of this study, the term
applies to anyone who graduated during the 1978-1979
school year in teacher-education but who did not teach at any time during the five-year study period.
(4) Related-educator. This term refers to an individual who occupied a position which was related in some direct way to education other than classroom teaching. A related- educator was an individual who was enrolled in a postbaccalaureate program of study in some field of education; who was employed as a school administrator; or who was employed as a professional education specialist such
as a school counselor, school psychologist, special education resource room teacher, or the like.
(5) Retention. For the purposes of this study, this term is
used to connote the decision made by a teacher to remain in teaching from one year to the next.
(6) Survival rate. This term refers to the calculated percentage of teachers who remain in the teaching profession at the end of a particular year. This rate has been found to be fairly steady for the first five
years after a group of teachers initially enters the
teaching profession.(7) Survivor♦ For the purposes of this study, the term
applies to any individual who graduated during the 1978- 1979 school year in teacher-education and who was a classroom teacher.in the fall of 1984.

16
(8) Teacher survival. This term refers to the length of time a teacher remained in teaching once s/he entered the profession. For the purposes of this study, survival encompasses remaining in teaching even though there was a change on the part of a teacher from one school district to another district or from one class- room assignment to another.
(9) Teacher-education program. This term refers to a course of study undertaken at a college or University, the completion of which entitles an individual to state
certification as a teacher.(10) Turnover. This term refers to "the number of workers
hired to replace those who have left during a given period of time" (Webster’s New World Dictionary of the
American Language, 1982, p. 1572).
Summary
Teaching has traditionally been known as a profession with a high
rate of turnover among its members. Over the years educators have sought to understand the forces at work in teacher turnover, both to verify the actual rates at which teachers do leave teaching and to establish which individuals are most likely to remain in teaching. With this information, teacher-educators and school hiring officials
would be in a better position to determine the rate at which they could expect to have to train and to hire new teachers to replace those who
leave. The present study provided data on pre-employment variables

17which could individually op in conjunction with other variables offer assistance to individuals in their decision making. It also estab
lished the turnover rate for Montana State University teacher-education graduates during a time of moderate teacher surplus. It enumerated the reasons given by the graduates themselves for leaving the profession, as well as showing the patterns of geographic migration and the range of career choices for these graduates.

18
CHAPTER 2
REVIEW OF RELATED LITERATURE AND RESEARCH
Originally the researcher intended to select the entire class of teacher-education graduates for 1979 and follow them over a five-year period of time. Prior to graduation, standardized test results and various demographic measures would be collected for each graduate. At the end of the study period, members of the class who were teaching would be evaluated by their building-level supervisors. The evalua
tions would provide measures of teaching success. However, an initial review of the literature showed the design was flawed, since numerous
previous studies employing that design were unsuccessful. A research
study using predictor variables of successful classroom performance did not consequently seem practical. As a result, the focus of the study shifted from looking at teacher success to investigating teacher
survival and retention.
Studies of teacher survival and retention possessed three distinct advantages. First, whether a teacher-education graduate remained in
teaching or not was much more straightforward to measure than a teacher’s success or lack of it. Second, recent studies had made promising progress in attempting to predict the factors at work in
teacher retention, but more research was needed on the topic. Finally, by changing the thrust of the study, all teacher-education graduates

19could be included in the study, not just those graduates who were teaching at the end of the study period.
This review of the literature is organized into five major sections. The initial section reviews studies which were concerned with predicting teacher success through the use of predictive variables. The second part reviews rates of survival found in previous studies. In the next section, the research findings in the area of teacher retention are examined. The fourth section enumerates the reasons, cited in the literature, that teachers have left teaching. This chapter concludes with a summary of the careers which teacher- education graduates pursued if they did not teach.
Research Related to Predicting Teacher Success
Studies Predicting SuccessIn the first half of the Twentieth Century, numerous researchers
conducted investigations aimed at predicting success among teachers by gathering many types of variables and then attempting to establish relationships between the variables and measured teaching success.
Barr (1961) reviewed work done oh this topic between 1915 and 1961. His survey failed to find any variables that consistently predicted who
would be a successful teacher and who would not. Pratt (1977) looked
at this literature a decade and a half later. He classified all the predictor variables used in these studies into three major categories:
(I) Achievement measures. These were such variables as standardized achievement and intelligence test scores, grade point averages, and degree levels attained.

20(2) Personality measures. These were such measures as
standardized personality and attitude tests scores.(3) Interviews. It is a common practice for prospective
teachers to be interviewed by faculty members as a part of their selection into teacher-education programs.Once admitted to programs, students may also be interviewed for a variety of other reasons.. These interview scores were used in some success studies.
From his review of the literature and his own research, Pratt concluded that such specific measures as National Teachers’ Examination
scores, undergraduate grade point average, Cattel’s 16 Personality
Factor Questionnaire results, and scores on the Minnesota Teacher Attitude Inventory (MTAI) were not related to measured teaching success. He further asserted since little research existed on whether the results of structured interviews would be an effective way to predict success, he doubted their usefulness.
Robinson (1962) attempted to correlate 126 pre-employment vari
ables with measured teaching success. He found that five of the 126 variables were significantly related. Robinson concluded that such a small number would be about what one would expect to find due to chance
alone and that most likely no relationships existed at all.Quirk et al. (1973) reviewed studies which had been done using the
National Teachers’ Examination (NTE) as the predictive variable. The
authors found a relationship which existed when the combined scores of the general part of the NTE were related to ratings by supervisors was

21
Only one predictive variable has been shown to be related in some studies to measured teaching success. It is the Minnesota Teacher Attitude Inventory (MTAI). The MTAI is a standardized instrument designed to measure the attitudes of teachers towards their pupils. It also distinguishes those teachers who are likely to establish an open classroom atmosphere, which the test makers felt was more desirable, from those less likely to do so. Studies by Tarpey (1965), Popham and Trimble (I960), Justiz (1969), and Herbert and Turnbull (1963) attempted to predict success through the use of a variety of academic,
personality, and interview variables. In each study the MTAI was the
one variable which consistently correlated with successful teaching
performance. However, in studies by Robinson (1962) and Pratt (1977), the Minnesota Teacher Attitude Inventory did not show a relationship
with teaching success. Furthermore, Wright (1975) found teachers who achieved the greatest gains in student learning tended to have more structured, less open classrooms; whereas the basic premise of the MTAI is that an open classroom is the mark of successful teachers. Wright concluded his findings cast doubt on the efficacy of the MTAI as a
predictor of success.The focus of the MTAI on the presumption that an open, cooperative
classroom atmosphere was best was not supported by research done by
Evans (1966). He noted all types of teachers in all types of classroom environments were judged successful by their evaluators. MTAI scores were found by Evans to be higher for people presently in teacher
very low, as were correlation coefficients between success and undergraduate grade point average and student teaching ratings.

22education programs as a group than for both groups of seniors in high school and teachers who had been in the teaching profession for five
years or more. This, he speculated, was due more to the influence of the students' professors who tended to be more "liberal" than to students' own natural inclinations. Indeed, the studies mentioned earlier by Tarpey, Herbert and Turnbull, and Justiz were done with either college students or new teachers with three years or less of teaching experience. The Minnesota Teacher Attitude Inventory has not
been shown conclusively to predict who would be successful as a teacher and who would not.
Difficulties in Measuring Successful Teaching
Not only were predictive variables not found that consistently were related to teacher success, but the measurement of success itself has also been a subject of disagreement. The act of making judgments about performance in any situation is highly complicated. Taft (I960)
said that judgment of others in any setting was at best difficult. Only if the judge and the person being judged were similar in social background or in their traits would judgments likely be accurate.
Start (1966) found in studies where evaluators were asked to rate
success of teachers, problems of judgment frequently resulted. He concluded,
The crux of the problem appears to lie in the wide interpretation of 'success' as a teacher and the multifarious, mainly subjective, criteria which are used individually in some cases but more commonly in varying combinations to decide whether a teacher is efficient or not (Start, p.. 159).
Popham (1971) described methods in which teaching success has beenmeasured based on his review of the literature. One common method used

23ratings by another party such as an administrator, student, or parent. This method proved ineffective. Nonprofessionals tended to rate teachers as successful or not based on nonteaching factors such as ease of grading or community involvement. On the other hand, administrator ratings were suspect because of what Anastasiow (1966) called the "halo effect." Administrators attributed to good teachers the qualities they saw in themselves. They described their weak teachers with negative attributes which they would not choose for themselves. A second method
of evaluating teaching success was systematic observation of classroom practices. This method, while excellent in helping the teacher to see how s/he was interacting with the class, did not really, have any methodology to get at the outcomes of the teaching process. Popham
suggested effective teachers used a variety of techniques to produce positive student outcomes.
Finally, results of standardized tests were a third method of evaluating teaching success. Popham found this approach was not a productive way to measure successful teaching either since the tests themselves were not really accurate in measuring student learning or in knowing what information was necessary and should be tested.
Rosenshine and Furst (1971) noted that research in the whole area of teacher success was plagued by four problems: (I) difficulty in
generalizing from research to actual classroom practice, (2) subjectivity of observation and evaluation, (3) difficulty of translating
teacher behavior into paper-and-pencil items, and (4) hazards of drawing causal inferences from correlational data.

24More recently, writers in the 1980s have expressed caution over
research attempting to measure teacher success. According to Ornstien and Levine (1981),, teacher effectiveness wap such a complex concept that thoughtful people were not able to specify what an effective teacher was. No one seemed to know "how to define, prepare for, and measure teacher competence" (Ornstien and Levine, p. 592). According to Koehler (1983), research has shown variables, such as the type of students, grade level, subject matter, curriculum, and the "organiza
tional context" (Koehler, p. 114) have a strong impact on the act of teaching. What was effective teaching in one situation may not have been in another. Koehler concluded as a result of all we have learned, no one style of teaching can be judged more effective than any other. In conclusion, Huling-Austin (1985) summarized most aptly the current thinking as follows:
This vision [about what effective teaching performance is] will be multifaceted and context-specific in that it will vary from setting to setting. . . . One district may have strict discipline as a goal, while another setting may value a teacher who is nurturing (Huling-Austin, p. 169)•
If anything, accurately assessing teacher performance has grown morecomplex as the knowledge base has expanded.
Need to Study Teacher Survival
Through the years there have been alternating periods of teacher surplus and shortage. Writers in each period have cited the need for insight into the nature of the people who actually did teach.
Collins (1966) cited studies which suggested teachers could be trained to exhibit critical teaching skills J In essence, the studies asserted that good teachers were not born with some basic aptitude
25profile which must be present in order for them to be effective. In his view, the type of individual most likely to teach needed to be established, and then resources would be invested in developing groups consisting of these individuals. Two areas of research in supporting this viewpoint have been studies of teacher survival and teacher retention.
W.W. Charters, one of the pioneers in teacher survival research, said in 1956 that to combat the teacher shortage in existence at that time, the answer was not to train more teachers. Instead the answer was to identify who were the best potential people to survive in teaching. He postulated it was possible to predict who would enter
teaching and stay with the profession.
Shavelson and Trinchero (1973)» in their work done during a time of teacher surplus, stated an increasing need to be selective in
training teachers existed because of the surplus. The authors also believed research which helped predict who would and wouldn't teach was necessary to solve the over-supply problem.
Pratt (1977) based his work on the work of Charters. He maintained the prediction of teacher survival rather than teacher success was a better way to proceed for two reasons. On one hand, teacher
survival was easier to measure. On the other hand, vocational choice instruments such as the Strong Vocational Interest Blank used persistence or continuance in an occupation as a criterion of the instrument's validity. Pratt reasoned if people persisted in teaching, they must be interested. If they were interested enough to persist, they were likely to be enjoying some degree of success.

26If it is true, as Lasley (1986) has suggested, that effective
j
teachers were not born with some set of predisposed aptitudes but rather could be trained to exhibit critical teaching skills once they selected teaching as a career, then it would be valuable to know who would and would not persist in teaching. Such studies have been done. This chapter now examines studies of teacher survival.
Research Related to Teacher Survival
Every profession has turnover in its workforce. However, teaching is regarded as a career field with an especially high rate of turnover. Lortie (1975) has traced the roots of this high turnover back to the
post-Colonial Period in American history. In the Nineteenth Century as schools grew in size and number, the typical male teacher of Colonial America was replaced by large numbers of young, single females. This
group of teachers taught only so long as they remained unmarried, most often due to school district policy prohibiting married women from teaching. Few women were ready to devote their lives to teaching under
these circumstances. A high rate of turnover became institutionalized as one of the features of the teaching profession. The profession
Istill has this reputation. Lortie noted once such a pattern has
developed as a part of the organizational culture, it becomes very
resistant to change. Teaching has remained an easy-come, easy-go career field. Lortie asserted this high turnover feature has reduced
teaching in status to only a "partially-professionalized” career field.Perhaps it is because educators are sensitive to the easy access
reputation of teaching that they study turnover as thoroughly as they

27
do. Studies of gross turnover abound. Yet, these studies have not addressed some of the more nagging questions. This section will look at one specific kind of turnover research — teacher survival. Survival studies have focused on examining who left teaching and when turnover among teachers occurred. The next section will review teacher
retention studies which attempted to answer the more complex questions of why turnover occurred and how to predict turnover.
Teacher survival was defined in Chapter I as the length of time that teachers remained in teaching once they entered the profession. The concept was first articulated by Whitener (1965). Whitener constructed actuarial tables to plot the turnover rates of both male and female teachers. He was particularly interested in the rate at which teachers left the profession for other careers after their initial employment. He maintained teacher turnover occurred because of
interaction between attributes of the individual and attributes of the
school system at a given time. The probability of remaining in
teaching was closely related to the length of a teacher’s completed service in the profession. The highest probability of withdrawal from the profession was in the early years of a teacher’s career.
Survival studies have shown approximately 15 percent of all beginning teachers left the profession at the end of their first year as compared to an overall yearly gross turnover rate of about six
percent for all teachers (Huling-Austin, 1986). Another 10 to 15
percent of those teachers remaining left at the end of both their second and third years in the profession. Five to seven percent left at the end of years four through six (Kerr, 1983). Between 50 percent

28(Kerr, 1983) and 62 percent (Charters, 1970) of all teachers who began to teach in year one have left teaching by the end of year five. The rate at which teachers left teaching beyond five years became more uniform and was much lower.
Shavelson and Trinchero (1974) saw teacher survival as occurring in three distinct stages:
(1) Initial stage. Zero to three years of teaching experience during which there was rapid separation from teaching.
(2) Secondary stage. Three to five years of teaching exper
ience during which separation from teaching continued but was less rapid than before.
(3) Final stage. Beyond five years of teaching experience when the separation from teaching became negligible.
Although all teacher survival studies have followed a sample of teachers from the time of initial employment for at least four successive years, each study has had subtle, yet important, differences. The sample in most studies was drawn in different ways. Each study had a slightly different manner of determining which teachers survived from one year to the next. Finally, each study used a variety of statistical techniques to quantify the rates of survival. For the purpose of this study, survival data will be presented in a format Whitener (1965)
called "service tables."Whitener (1965) limited the population in his research primarily
to teachers, new to districts in the suburb's of St. Louis,. Missouri.
The districts had student enrollments ranging from 1000 to 6000
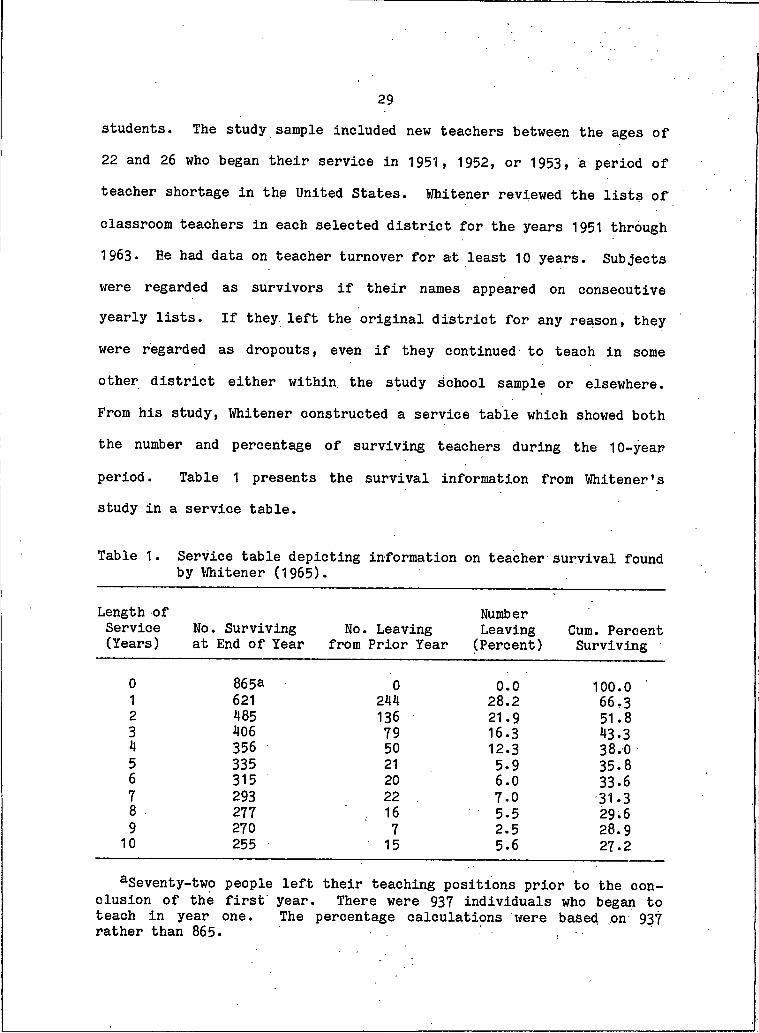
29students. The study sample included new teachers between the ages of 22 and 26 who began their service in 1951, 1952, or 1953, a period of teacher shortage in the United States. Whitener reviewed the lists of classroom teachers in each selected district for the years 1951 through 1963. He had data on teacher turnover for at least 10 years. Subjects were regarded as survivors if their names appeared on consecutive yearly lists. If they, left the original district for any reason, they were regarded as dropouts, even if they continued to teach in some other district either within the study school sample or elsewhere. From his study, Whitener constructed a service table which showed both the number and percentage of surviving teachers during the 10-year
period. Table I presents the survival information from Whitener’s study in a service table.
Table I. Service table depicting information on teacher survival found by Whitener (1965).
Length of Service No.(Years) at
Surviving End of Year
No. Leaving from Prior Year
NumberLeaving(Percent)
Cum. Percent Surviving
0 865a 0 0.0 100.0I 621 244 28.2 66,32 485 136 21.9 51.83 406 79 16.3 43.34 356 50 12.3 38.05 335 21 5.9 35.86 315 20 6.0 33.67 293 22 . 7.0 •31.38 ■ 277 . 16 5.5 29.69 270 7 2.5 28.910 255 15 5.6 27.2
^Seventy-two people left their teaching positions prior to the con-elusion of the first year. There were 937 individuals who began toteach in year one. The percentage calculations were based on 937rather than 865 • , ■ •
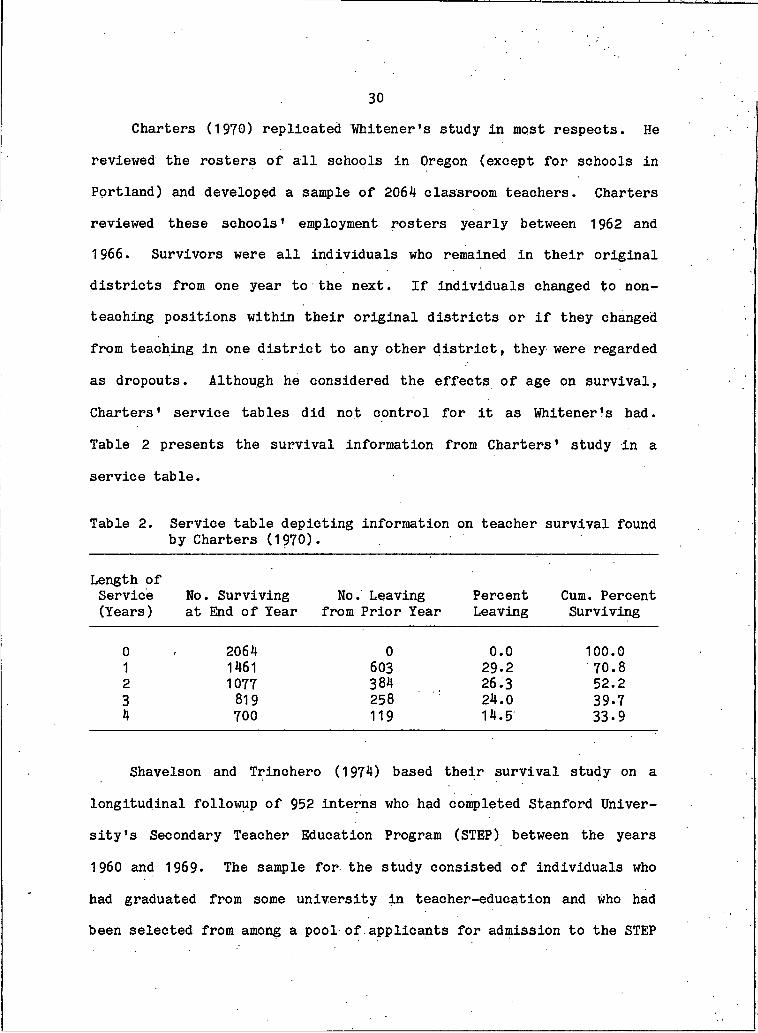
30Charters (1970) replicated Whitener’s study in most respects. He
reviewed the rosters of all schools in Oregon (except for schools in Portland) and developed a sample of 2064 classroom teachers. Charters reviewed these schools * employment rosters yearly between 1962 and 1966. Survivors were all individuals who remained in their original districts from one year to the next. If individuals changed to nonteaching positions within their original districts or if they changed from teaching in one district to any other district, they were regarded as dropouts. Although he considered the effects of age on survival, Charters’ service tables did not control for it as Whitener*s had.
Table 2 presents the survival information from Charters’ study in a service table.
Table 2. Service table depicting information on teacher survival found by Charters (1970).
Length of Service (Years)
No. Surviving at End of Year
No. Leaving from Prior Year
PercentLeaving
Cum. Percent Surviving
0 2064 0 0.0 100.0I 1461 603 29.2 70.82 1077 384 26.3 52.23 819 258 24.0 39.74 700 119 14.5 33-9
Shavelson and Trinchero (1974) based their survival study on a longitudinal followup of 952 interns who had completed Stanford University’s Secondary Teacher Education Program (STEP) between the years
I960 and 1969. The sample for the study consisted of individuals who had graduated from some university in teacher-education and who had been selected from among a pool of applicants for admission to the STEP

31program. They were different from the subjects of other survival studies in three important respects. They were all secondary-trained teachers, they represented a select group, and they were studied during a time of teacher surplus. The procedure Shavelson and Trinchero used was also different from that used by either Whitener or Charters. The subjects were followed for at least five years following completion of STEP; and as long as they continued to teach, they were counted as survivors. People could change districts and still not be regarded as dropouts. As might be expected, the authors found survival rates were higher than had been found in earlier studies with less selective subject populations.
Shavelson and Trinchero constructed a number of tables and charts; however, they presented the survival data over a five-year period of time for only male STEP graduates.. This information is presented in Table 3 in the form of a service table.
Table 3» Service table depicting information on teacher survival found by Shavelson and Trinchero (1973).
Length ofService No. Surviving No. Leaving Percent Cum. Percent(Years) at End of Year from Prior Year Leaving Surviving
0 203 O 0.0 100.01 181 22 10 .8 89.02 150 31 17.1 74.03 134 16 10.7 66.04 112 22 16.4 55.05 99 13 11.6 49.0
Mark and Anderson (1985) conducted their survival research between 1969 and 1982. Their sample included all new teachers in five Missouri

32counties in the St. Louis metropolitan area. As with Charters and Whitener, the authors reviewed lists of teachers in each district each-
fall in gathering their information. The procedures were different from those used in previous studies, however, in some important respects. Survivors were those teachers who remained as employees in the study districts. Individuals were counted as survivors even if they changed to another district within the five-county study area or if they changed from being a classroom teacher to some other education- related position within the same district. Dropouts were those who left teaching entirely or who continued to teach but who were employed outside the five-county area.
Mark and Anderson gathered information on, all beginning teachers for each year between 1969 and 1982. Although they did not do so,
service tables could be constructed for beginning teachers in each
year. The survival data shown in Table 4 is based on the information
which the authors gathered for teachers beginning to teach in 1977, the last year for which data on survival was available for a full five years.
Table 4. Service table depicting information on teacher survival found by Mark and Anderson (1985).
Length of Service (Years)
No. Surviving at End of Year
No. Leaving from Prior Year
PercentLeaving
Cum. Percent Surviving
0 749 0 0.0 100.0I 605 144 19.2 80.82 521 84 13.9 69.63 475 46 8.8 63.44 427 48 10.1 57.05 344 83 19.4 45.9 .

iSeveral intriguing trends have emerged from recent survival
studies that should be mentioned and further investigated. Mark and Anderson noted in 1968, when they began their research, a trend toward higher survival rates among all beginning teachers. Teachers who did secure teaching positions in a tight job market tended to hang onto them. In 1975 the rates began to regress more toward previous levels. Although Mark and Anderson's information in the late 1970s and early 1980s was not complete enough to conclude anything definite, more recent survival rates appeared to have dropped steadily until they were below previous rates. One explanation offered by them is that during this time schools were experiencing financial difficulties which required them to reduce their instructional staffs. In most cases teachers with fewer years of seniority were the ones most likely to be cut first.
The second trend that Mark and Anderson noted was a change in survival rates of both sexes. Charters, Whitener, and Shavelson and
Trinchero had found women left teaching at a much greater rate than
men. In the early years of their, study, Mark and Anderson found this to be accurate. Since 1975, women have consistently had higher survival rates than men. The authors concluded the change may be a
reflection of the increased desire (and, in many cases, the increased
need) on the part of women to remain in the workforce. This trend was reinforced by Benton (1985) who compared turnover rates among a sample
of nurses, teachers, social workers, engineers, accountants, and
computer scientists. The professions in her study with the lowest turnover rates were nursing and teaching, the two professions with the
33
34highest percentage of women workers. . Both trends will bear watching in future survival research.
Research Related to Teacher Retention
Retention has been a term which has appeared in the literature within the past decade. Most often the word "retention” has been used to refer to the decision made by an individual teacher-education graduate to teach, to enter teaching but then drop out, or to never
enter teaching at all. The term implies an intentional decision on the individual’s part. The purpose of most retention studies has been to find characteristics present in teacher-education graduates who chose teaching as a career field in order to distinguish them from other graduates of the same program who chose not to teach.
The effort, at least in part, has been based on the theories of
vocational choice by Holland (1973) and Super and Hall (1978). Holland (1973) theorized that people’s job satisfaction, stability of career, and career achievement all depended on the degree of congruence between
their personalities and the work environment. Individuals searched for career fields that allowed them to use their skills and abilities, express their attitudes and values, and assume roles that were agree
able to them. When people left careers, it was because their needs were not being met. The movement out of a profession was related to one or a combination of three forces. Changes in workers’ personali
ties as they went through the stages of adult development was one possible reason for movement. Movement may also have resulted from changes in the work environment itself. Finally, movement may have

35been attributable to changes in people’s perceptions of what the career field was really like. Super and Hall (1978) added that through experience, people’s goals and needs became clearer. Chapman and Hutcheson (1982) followed on these developmental views of career choice with the belief that researchers would expect people leaving a field such as teaching (or not entering the field at all) to be characterized by a different set of traits, competencies, and values than those remaining in the field.
Retention research has attempted to establish whether differences existed in the personal characteristics, competencies, and values among teacher-education graduates who chose to teach, those who entered teaching but left the profession for other occupations, and those who
never entered teaching at any time following graduation. Most research efforts have borrowed from the" methodologies used in teacher success
research. Retention studies have sought to find personal, professional, and environmental factors which individually or in combination with other factors would predict teacher-education graduates’ decisions regarding their careers.
Since the initial work of Charters in the late 1950s, the popular
ity and sophistication of teacher retention research has grown. To
adequately review the current literature, an overview model must be used. This study will use a model developed by Bloland and Selby (1980) who conducted a review of the retention literature in an effort
to describe what predictive variables had been found relating to why teachers left the field. They found all variables could be assigned to one of three categories: demographic factors, professional and personal

36
factors, and school-related factors. The remainder of this section will describe retention studies using the Bloland and Selby model as a guide.
Demographic FactorsMany studies have used gender of the teacher as a variable related
to retention. Most early studies concluded gender was a factor in an individual's career decision. Oaklander (1969)» Charters (1970), Mueller (1975), Silverman (1957), Rabinowitz and Crawford (I960), and Whitener (1965) found men were more likely than women to not teach at all. If men did elect to enter teaching, they also were more likely to
leave within the first two years of teaching; but after the first two years in the profession, the situation reversed with women more likely
to leave teaching. More recent studies by Pratt (1977), Mobley et al. (1979), Chapman and Hutcheson (1982), and McElroy (1984) found no relationship between the gender of teacher-education graduates and
their career decisions about teaching. The most recent thinking has held that gender was itself not an independent variable but was related
to career choice only as part of other variables.Some studies have investigated the relationship between educa
tional attainment and retention. Mason (1961), Corwin (1965),
Oaklander (1969), and Mobley et al. (1979) failed to find any relationship between the level of the college degree teacher-education graduates earned and their remaining in teaching. In reviewing these
studies, Bloland and Selby (1980) concluded that what evidence existed
on the subject showed individuals with higher levels of education were slightly more mobile. Pratt (1977) found no relationship between type

37of degree earned by teacher-education graduates (honors or regular degrees) and career decisions. Lyson and Falk (1984) even studied the relationship between the educational level of mothers and fathers of teacher-education graduates and teacher turnover. They found no relationship.
The race of a teacher was another demographic factor studied. Mueller (1975), Bridge et al. (1978), and Lyson and Falk (1984) found white teachers were more likely than black and other minority teachers to leave teaching. Chapman and Hutcheson (1982), on the other hand, did not find race to be an explanation of the career decisions of
groups of teacher-education graduates. Bloland and Selby (1980)
concluded that as with gender, race was probably not an independent
variable, but differences between groups were due more directly to socioeconomic status than to race itself.
Gosnell (1977), Feldvebel (1968), Levine et al. (1957), Erickson et al. (1968), and Dworkin (1980) concluded the higher the socioeconomic status of teacher-education graduates, the more likely individuals would either never enter teaching or would eventually leaye teaching. Middle class or higher males were more aware of and able to take advantage of opportunities outside of teaching. Teaching,
according to Lortie (1975), has been regarded, as a solidly middle class profession; and, as a result, teaching historically provided both a "respectable" career for women of all classes and an opportunity to join the middle class for lower socioeconomic men and women. Shavleson and Trinchero (1973) found no relationship between the level of financial need during teacher-education graduates' schooling and
whether individuals left or remained in teaching. Finally, Lyson and Falk (1984) found no relationship between career decisions of graduates and their parents’ careers.
The effect of the community in which teacher-education graduates were reared on their eventual career decisions has not been extensively studied. However, some evidence exists that it may be a significant demographic variable. Lyson and Falk (1984) found graduates who came from rural communities were more likely to remain in teaching than those from suburban or urban settings.
Much has been written in the last eight years about the ability level of recent teacher-education graduates. Weaver (1978) is gener
ally cited as the source of most of this information. His work has noted that the intellectual ability of teacher-education graduates, which has always been among the lowest of all majors among college
graduates, has declined even more sharply during the period of teacher surpluses in the 1970s. Even though the literature has featured articles concerning this ability decline, few studies have attempted to
use some measure of ability as a predictive variable. Schlechty and Vance (1981) found a strong relationship between academic ability and teacher retention. More intellectually able teacher-education graduates were less likely to enter teaching and more likely to leave teaching if they did enter it than were less intellectually able teacher-education graduates. Byers (1984), however, in a study designed to replicate Schlechty and Vance’s study, did not find such
clear results. In Byers’ research, those who remained in teaching were
more capable than Schlechty and Vance’s teaching survivors. He did not
38

39find any significant difference in the turnover rate with regard to intellectual ability; teachers of all ability levels left teaching at the same rates in Byers’ study.
Lyson and Falk (1984) discovered those teacher-education graduates with the highest SAT scores tended to enter a profession other than teaching, while those with the lowest SAT scores tended to not enter any profession at all, including teaching. Pratt (1977) found no relationship between undergraduate grade point average, grade point average in people’s major area of study, or grade earned in student
teaching and teacher-education graduates’ career decisions. Shavelson
and Trinchero (1973) found no relationship between scores on the Graduate Record Examination and teacher-education graduates’ career
choices. While ■ more able individuals may make better teachers as Weaver asserted, conclusive evidence has not been presented about whether they did or did not make teaching their career.
Some studies have attempted to find personality factors that would predict teacher-education graduates’ career choices. Rabinowitz and
Crawford (I960) found no relationship between scores on Cartel's Sixteen Factors Personality Test and career choice. Further, Lortie (1975) reported that Getzels and Jackson (1971) in their work did not isolate any one single teacher personality profile. According to Lortie, this conclusion was to be expected in an occupation with more than two million members. Chapman and Hutcheson (1982) did find
personality differences. People who remained in teaching had higher
scores on measures related to organizational skills such as the abilities to organize time effectively, to develop new approaches to

tasks, and to plan and organize activities. The authors also found teacher-education graduates who were not teaching had greater analytical abilities. Further studies of personality differences among teacher-education graduates are needed.
Age of teacher-education graduates has been the subject of numerous retention studies. Many investigators (Rabinowitz and Crawford, I960; Waters and Roach, 1971; Porter and Steers, 1973; Shavelson and Trinchero, 1973; Harnischfeger, 1975; Mobley et al., 1979; and Hinrich, 1980) concluded a negative relationship existed between age of a teacher and teacher turnover; generally people between the ages of 30
and 50 were much less likely to leave teaching than were individuals either younger than 30 or over 50. On the other hand, McElroy (1984) found no relationship between age and teacher turnover, and Chapman and
Hutcheson (1982) argued age did not explain differences among teacher-
education graduates who taught and those who did not.
A related issue to the age variable has been length of service by a teacher in a school system or other work setting. Hinrich (1980),
Mobley et al. (1979), Porter and Steers (1973), and Waters and Roach (1971) found strong relationships between length of service and teacher turnover. The longer teachers served in a district, the greater the
likelihood they would leave the district. McElroy (1984) looked at this variable as well but did not find a relationship between length of service in a district and teacher turnover. Instead, he found a relationship between tenure in one school building and the career decision to leave teaching.

41
Age and length of service may be factors involved in teacher turnover. Yet, they are not in and of themselves forces acting directly on career change. As Charters (I 970) observed ,
Age [and probably length of service] merely reflects a number of underlying physiological, cultural, economic, and social forces that happen to impinge on teachers as a function of the number of years since birth (p. 25).Retention studies have also used such diverse predictive demo
graphic factors as interview scores, teaching level, student teaching satisfaction, and standardized teacher attitude tests. Pratt (1977) found a strong relationship between interview scores received by applicants to a teacher-education program and their eventual decisions
to teach or to pursue other careers. Rabinowitz and Crawford (1960) and Whitener (1965) found teachers certified at the secondary level were more likely to remain in teaching than were elementary-certified teachers. Finally, Rabinowitz and Crawford (I960) detected people who
expressed high levels of satisfaction with their student teaching
experience were more likely to remain in teaching than those who expressed lower levels or were unsatisfied.
Personal and Professional FactorsThe two personal and professional factors most often investigated
have been salary levels and opportunities for advancement. Teachers
have appeared to be unique in these regards. Lortie (1975) found salary considerations by and large did not draw teachers to teaching.
Studies by Thorndike and Hagen (I960), Blaser (1965), and Sharp (1970) found relationships between career decisions of men who chose some
career field other than teaching and the importance they assigned to

42salary. Male teacher-education graduates who did not teach placed more value on high salary levels than male teacherr-education graduates who did teach. No similar relationship was found between women in these studies. Chapman and Hutcheson (1982) found teacher-education graduates who did not teach were more interested in salary level than
graduates who were teaching. Mobley et al. (1979) found no relationship between the two.
Teaching has been a "stageless" career according to Lortie (1975). As long as individuals continued as classroom teachers, they performed essentially the same duties the day they began to teach as the day they
retired. Kleinert (1968) and Fishel and Pottker (1973) noted individuals seeking advancement were more likely to not enter teaching than
was true of teacher-education graduates who entered teaching.Bloland and Selby (1980) found that teacher-education graduates
who did not teach expressed higher levels of frustration with teaching as a career than those graduates who did teach. Gold (1962), Dillman(1964) , Kleinert (1968), Chussil (1971), Corwin (1965), and Belok(1965) noted teacher-education graduates who did not teach were more burdened by the prospect of nonteaching activities, such as recess
duty, or by the lack of recognition from administrators, school boards,
or communities than were practicing teachers.An individual’s marital status has also been studied as a factor
in teacher retention. Based on their review of the literature, Mobley
et al. (1979) concluded marriage had a profound impact on teachers' career decisions. Bloland and Selby (1980) noted teacher-education graduates were more likely to remain in teaching if their spouses

43and/or friends were positive about teaching as a career. Just what effect marital status has had on whether teacher-education graduates taught or not, however, remains unclear. Rabinowitz and Crawford (I960) and Whitener (1965) concluded married women were more likely to choose careers outside of teaching than single women, while Pratt (1977) and Shavelson and Trinchero (1973) found no relationship between marital status and whether teacher-education graduates taught or not. Possibly, as more women came into the job market, the effect of marital status on career decisions has changed. This trend might be reflected by the conflicting results of studies.
Level of commitment to teaching has been a personal factor which has not been thoroughly studied. Chapman (1984) theorized that it should, maintaining it was the single strongest predictor of retention.
Mobley et al. (1979) found that commitment level was related to turnover; the lower the levels of commitment, the more likely teacher-
education graduates were to leave teaching. It is an area in need of further study.
Other personal factors which have been studied are the effects that acquired behaviors have on career decisions once teacher-education graduates have begun to teach or otherwise pursue their careers. Chapman (1984) found skills and values acquired by teacher-education
graduates once they began to teach were not related to their decision to continue in or leave teaching. He further discovered that individ
ual achievements teachers earned once they began to teach were also not related to their career decisions.

44A final area, which has received more attention in recent studies,
investigated the variable of job satisfaction. Mobley et al. (1979) concluded from their literature review that job satisfaction is definitely related to turnover among teacher-education graduates. Just how it is a factor at this point is not clear. For example, McElroy (1984) found the more satisfaction teachers expressed for their jobs, the more likely they were to leave teaching. Chapman (1984) noted that graduates who did not teach were more interested in job autonomy than were those who did teach. Teachers seemed attracted to the security that teaching offered as a career. Chapman also concluded that practicing teachers preferred jobs which allowed them to work alone,
while teacher-education graduates who chose other careers expressed
desires for jobs that featured teamwork. Again, more research is needed in the area before any clear picture can be seen of.the effect that job satisfaction has on career choice.
School-Related Factors
Research on school-related factors involved in teacher turnover has not been plentiful. The paucity of research in this area could be attributed to the debate over whether the decision to teach or not was
personally-based or environmentally/organizationally based. Bloland and Selby (1980) felt external factors originating within the environ
ment rather than within the individual played a part in some teacher- education graduates * career decisions. However, for most individuals teacher turnover has been primarily, although not entirely, a matter of
decision making based on personal factors, as Mobley et al. (1979) concluded. Benton (1985) underscored this conclusion in a recent
45study. When comparing the career decisions made by teachers, nurses, social workers, engineers, accountants, and computer scientists, she
observed teachers were more likely to base their career decisions on intrinsic or personal motivations than any of the other occupational fields which she studied.
Some research has been done on the effect the size of a school's student body or faculty has had on teachers' career decisions. The results of these studies have been contradictory. Mueller (1975) and National Education Association (I960) found teachers were more likely to leave teaching when student populations were larger. However, Silverman (1957) concluded school size was not related to turnover. Finally, Webb and Metha (1983) and Harnischfeger (1975) noted turnover increased as school size decreased. Abramowitz (1976) noted schools
with smaller faculties experienced less staff turnover, but
Harnischfeger (1975) found just the opposite among schools in his research. More information is needed.
Another school-related factor studied has been the effect that relationships with colleagues and supervisors have had on teacher turnover. Again the results were mixed. Wood (1968), Erickson et al. (1968), and Yuskiewicz and Donaldson (1972) were able to show that the
satisfaction derived by teachers from positive interactions with colleagues was related to occupational stability. The higher the level of satisfaction expressed with co-workers, the more likely teachers
were to remain in teaching. On the other hand, the literature review of Mobley et al. (1979) showed no clear connection of any kind between peer relationships and teacher turnover.

46The amount of satisfaction workers felt with their supervisors was
more likely a factor in career decisions. Silverman (1957), Browning (1963), Yuskiewicz and Donaldson (1972), Hahn (1968), and Mobley et al.
(1979) concluded that good relationships with supervisors tended to influence workers’ career decisions to remain in their positions. Only Chapman (1984) disagreed somewhat with the consensus. He maintained that in the early years of teaching, workers' relationships with their supervisors were critical factors in their remaining or leaving. However, beyond the first few years in teachers’ careers, most of the variables related to career change were not influenced by supervisors in any direct way.
The only other school-related factor studied was the income level of the school. Harnischfeger (1975) discovered no evidence that teachers assigned to low income schools left the profession at any different rate, than teachers in more affluent schools.
That external factors play some part in teacher-education graduates' career decisions seems evident. Not enough research has been done to this point to know how much.
Research Related to the Reasons Teachers Leave Teaching
The purpose of this section is to enumerate the reasons which former teachers have given for their leaving teaching. However, before discussing the specific reasons, this section will review the theory discussed in the two preceding sections. Whitener (1965) found
teachers left teaching because of an interaction which occurred at a given time in teachers ’ lives between personal and school-related

factors. Holland (1973) theorized all movement by workers out of a career field was due to one or more of three lifetime events. These events were: (I) changes in workers' personalities as they went through the stages of adult development, (2) changes in people's perceptions of what the career field was really like, and (3) changes
in the environment itself. Mobley et al. (1979) concluded from their review of the retention literature that teacher turnover was primarily a matter of changes that occurred within individuals, although environmental events could in some cases determine whether a teacher remained in or left teaching. Taken together, these authors have suggested that teachers in most cases have left teaching because of one of two factors. They have reached developmental stages in their lives in which teaching and its conditions no longer attracted them; or they learned more about teaching as a career, and teaching did not provide
the personal satisfactions they believed it did before they entered the field. Teachers, then, have left teaching primarily for personal reasons.
The personal motivation explanation for teacher turnover has also
been supported by research. Eberts (1982) reviewed the literature in an attempt to find whether teachers left teaching for personal or
environmental-based reasons. His conclusion was that teacher turnover was primarily a result of personal rather than environmental considerations. Benton (1985) found teachers were more influenced by intrinsic factors in their decisions to change careers than the other professional career fields which she studied. The reasons teachers have cited for leaving teaching have, at times, been related to
47

48environmental factors; but the basic motivators in their decisions have primarily been personal in nature.
This section will now review the reasons given by former teachers for leaving the teaching profession. Personal or intrinsic factors will be discussed first. The section will then conclude with a brief description of environmental or extrinsic factors.
Intrinsic Reasons
In a recent national study of former teachers, Louis Harris and associates (1985) grouped the reasons given for leaving the teaching profession into eight broad categories. These categories will be used as a framework within which to review the literature.
The first category was inadequate salaries and fringe benefits. Harris et al. (1985) found 60 percent of their sample cited inadequate salaries as a reason for their change of careers. Olstad and Beal
(1984), Sykes (1983), Hefferly (1983), Lashier and Woo (1984), and
Musemeche and Adams (1978) conducted studies in which low salaries and inadequate fringe benefits were cited by former teachers. Darling- Hammond (1984) found teaching salaries were lower than the salaries in nearly all other fields requiring a bachelor's degree, even when adjusted to reflect 12-month salary equivalents. Wendling and Woodbury (1984) noted between 1971 and 1981 the "constant dollar average" declined by 12 percent even though the average number of years of
experience and average educational levels for all teachers rose during that time period.
The second broad category was unfavorable working conditions. Former teachers in studies by Harris et al. (1985) and Hefferly (1983)

49
cited too much paperwork and too many non-teaching duties as reasons for leaving teaching. Sykes (1983) found many teachers left the profession because of increased violence, vandalism, and turbulence in their schools. Clayton and Wilson (1984) found inadequate facilities were reasons given by some former teachers.
Student-related factors comprised the third category. Lack of student motivation and student discipline was listed by Harris et al. (1985). Hefferly (1983) and Clayton and Wilson (1984) credited turnover to the frustration teachers felt when confronted with classes which had excessively wide ranges of student ability.
A fourth general category was administrative concerns. Harris et
al. (1985), Lashier and Woo (1984), and Hefferly (1983) all listed lack of administrative support as a reason which their former teachers gave for leaving teaching. In most cases lack of administrative support was related either to the manner in which administrators evaluated teachers or to the lack of opportunity for input into those decisions which intimately affected teachers. Clayton and Wilson (1984) found that
teachers who dropped out of teaching after their first year in the profession specified a lack of adequate orientation both to their districts and to teaching in general as a contributing factor in their decisions.
The fifth category dealt with emotional aspects involved in teacher turnover. Hefferly (1983) and Harris et al. (1985) found such factors as boredom, frustration, stress, and burnout were reasons offered by former teachers. Stress is an example of a personal reaction to an environmental factor. Chiopn and Koff (1980) concluded

50
stress occurred when workers faced incompatibilities between skills which they possessed and job demands. Usually, these incompatibilities resulted in turnover. When career changes did not occur, the gap intensified. Teachers in this situation either withdrew psychologically or experienced, extremely high levels of stress, referred to in the literature as teacher burnout.
A general lack of respect for teachers as professionals comprises the sixth category. Teachers in studies by Sykes (1983), Olstad and Beal (1984), Darling-Hammond (1984), and Harris et al. (1985) said they left teaching because they came to feel our society no longer respected
teachers as it once did. Teachers no longer occupied the special niche
which society had traditionally reserved for them as noble and honorable professionals.
The seventh general category was community and parental factors. Lack of parental and community support were reasons given by former teachers in the Harris et al. (1985) study. Hefferly (1983) noted teachers cited the unpleasantness associated with contract negotiations as part of their reasons for leaving the field.
Finally, a great many unrelated reasons have been given by former teachers as factors in their leaving teaching. Bredeson et al. (1983) suggested that teachers left the profession because they needed to "broaden their personal horizons." Hefferly (1983) and Ellis et al. (1982) found many former teachers exited from teaching because of
increased family responsibilities. Ellis et al. (1982) listed both retirement and returning to college as reasons given by their sample.
Finally, Clayton and Wilson (1984), in their study of first-year

51teachers, found that their teachers left teaching because of childbirth, marriage, transfer of spouse, and having to teach out of their major area of preparation.
Extrinsic Reasons
Teachers gave a variety of reasons that were beyond their control for leaving teaching. :These extrinsic reasons in most instances caused teachers to depart from teaching when their personal preferences were to remain in teaching.i
Extrinsic reasons were most often related to conditions in society at the time of the study. At the height of the Viet Nam War, Shavelson
and Trinchero (1973) found male STEP graduates withdrew from teaching because of the military draft. The draft has not been cited as a cause of teacher turnover in any studies since 1975.
From about 1975 on, our society has experienced a tighter economy and a large surplus of,teachers. Almost all recent studies have listed reductions-in-force as one of the reasons former teachers gave for leaving teaching. Some teachers cited being terminated by their
districts as their reasons for exiting teaching (Ellis et al., 1982;
Clayton and Wilson, 1984). Shavelson and Trinchero (1973) noted that not being able to find another teaching job was a reason given by some STEP graduates who were not teaching. Death and illness were two reasons listed by Ellis et al. (1982) in their study.
Two other partial reasons have been . identified as potential factors in teacher turnover. Montana is essentially a rural state, and
studies by Pederson (1970), Noble (.1981), and Swift (1984) have shown that teacher turnover was higher in smaller, more rural school

52districts than in larger, more populated ones. Noble concluded in his study that teachers departed from small, rural school districts because
of lower salaries, inflexible administrations, limited curricula, and limited opportunities for personal, cultural and social experiences. These factors, acting in consort, served to accelerate the rate of turnover in rural schools.
The second factor was the isolation in which all teachers worked. Lortie (1975) said that American schools have moved from the one-room school typical in Colonial America to, in essence, 30 one-room schools
under the same roof that one finds in a typical Twentieth. Century American school. Rosenholtz and Smylie (1984) concluded that teacher turnover, while not directly caused by each teacher working alone, was exacerbated by it. Teachers working in isolation from their peers have had to discover how to teach on their own. It has resulted in teachers
exiting from teaching, especially beginning teachers.
Research Related to Careers Outside of Teaching
Little specific information has been available in the literature on the actual careers that teacher-education graduates pursued if they did not teach. One complete study, however, has recently been done. Harris et al. (1985) interviewed a nationwide sample of former
teachers. Among other information, the researchers ascertained the
occupations that former teachers entered when they left teaching. The authors grouped the occupations of former teachers into six categorieswhich are as follows:

53
(1) Sales occupations. Thirty-seven percent of all former teachers had entered some aspect of the sales field.
These jobs included sales supervisors; owners of retail or wholesale businesses; insurance, real estate, securities, and commodities sales people; and workers who reported only that they were engaged in general business activities.
(2) Managerial occupations. Twenty-one percent of the former teachers found jobs in managerial positions. These
jobs included personnel-labor relations specialists; education-related administrators; managers and administrators in business, industry, and government; accountants; and auditors.
(3) Professional specialists. Twenty percent of the former
teachers found employment in some other professional field. These jobs included careers as engineers; mathematicians and computer specialists; natural scientists;
health professionals; teachers in other settings (e.g., post-secondary education or industry); counselors; librarians; psychologists or social scientists; social workers; recreation specialists; religious workers;
lawyers; authors; designers; painters, artists, and sculptors; performing artists; editors; and public relations specialists.
(4) Technical occupations. Five percent of the former teachers entered technical careers. These jobs included

54
science technicians, computer programmers, and miscellaneous technical positions.
(5) Administrative support and clerical occupations. Five percent of the former teachers reported that they had found employment in administrative support and clerical occupations. These jobs included ticket or reservation agents, mail clerks and postal carriers, secretaries, and clerks.
(6) Miscellaneous career fields. The remaining twelve per- ,
cent of former teachers were grouped into this category. Miscellaneous jobs included service workers; fishery workers; farmers; forestry workers; precision production, crafts, and repair workers; machine operators; fabricators; and general laborers.
One final issue related to this topic is the amount of satisfaction which former teachers have experienced in their new careers. Weaver (1978) concluded the oversupply of. teachers in the 1970s would
be long-lasting. The premise was based on his conclusion that a degree in teacher-education was very "narrow." Teacher-education was not the kind of training that would be useful in other careers. He cited a
study of teacher-education graduates done in Pennsylvania in 1975 which showed that only 14 percent of the graduates who did not teach were employed in professional positions. On the other hand, 40 percent of
the graduates were working in blue collar jobs. Weaver asserted that as teaching opportunities became available in the 1980s, the under

55
employed graduates would return to teaching because, in essence, there was nothing else for them to do.
The national survey done by Harris and associates (1985) did not support Weaver's conclusions. Eighty percent of the former teachers in Harris' study sample said they had-been able to use many of the same skills in their new jobs that they had used in teaching. Fifty-eight percent of the former teachers indicated they missed teaching, but few would actually return if given the chance. Ninety-six percent of the sample reported they were satisfied with their new careers, and 83
percent reported they would not consider returning to the classroom, at least within the next five years. Since much of the information about
the supply of teachers has been based on Weaver's (1978, 1979) work and since a more recent study has indicated his information was not totally accurate, the predicted teacher shortage may well be greater than has been forecasted by some experts.

56
CHAPTER 3
PROCEDURES
Introduction
This study was a longitudinal investigation of the 1979 class of teacher-education graduates from Montana State University for the ,five- year period immediately following graduation. The central goal o!f the
Istudy was to ascertain if certain variables selected prior to the teacher-education class's graduation would identify whether! the individual would: (I) not begin to teach at any time between 1979 and
1984, (2) begin to teach at some time after their graduation in 1979
but to have left the profession before 1984, or (3) enter teaching at some time during the five-year study period and remain in the profes
sion as either a classroom teacher or in an education-related capacity
in the fall of 1984. The study also established the rate at which teacher-education graduates in the class of 1979 left teaching once
they began to teach. Finally, the study enumerated types of careersI
members of the class pursued if they did not teach, the reasons given by former teachers in the study group for leaving teaching, and the geographic distribution of the class in 1984.
This chapter describes the research methodologies employed by the researcher to gather and examine the necessary data. The chapter outlines what individuals were included in the study group, how these individuals were studied, and in what manner the data generated were

57
analyzed. Finally, this chapter deals with the precautions taken during the final analysis of the data to ensure accuracy.
Population Description
This study included all individuals who completed the teacher- education program at Montana State University in Bozeman, Montana, some time between the end of fall quarter 1978 and the end of summer quarter 1979. Only those individuals who graduated for the first time with a baccalaureate degree were included in the study. Since the study included all teacher-education graduates in the class, no sampling design was employed.
For the purposes of this study, the population at the end of the five-year study period was divided into four categories. Category one included those individuals who were employed as classroom teachers at the end of the fifth year following their graduation regardless of how long they had taught during the study period. This group has been
referred to as "survivors.” Category two encompassed those individuals
who were in education-related endeavors such as school administrators, school specialists (e.g., counselors, subject area specialists, activity directors, full-time coaches, etc.), and full-time graduate students who were pursuing a graduate degree in education. This group
has been referred to as "related-educatorsCategory three contained those individuals who began to teach at some time during the study
period but who were not teaching in 1984 at the conclusion of the study. This group has been referred to as "dropouts." Finally,
category four consisted of those individuals who did not teach at any

58 I
Another type of category developed in this study was a group of independent predictor variables which were gathered prior to graduation for each teacher-education graduate. These variables were analyzed to see if any significant relationships could be discovered between individual variables and membership in the four teacher-education graduate categories previously identified. The variables which were gathered and analyzed were as follows:
(1) Demographic data — age, gender, socioeconomic status,
time of life when the decision to teach was made, and level of commitment to find a teaching position.
(2) Theoretical, economic, aesthetic, social, political, and
religious subscores on the Allport-Vernon Study of Values.
(3) Overall university grade point average.(4) Grade point average in major field.
(5) Grade point average in teacher-education core courses.(6) Student-teacher effectiveness ratings gathered from
student-teaching supervisors.
(7) Stahine rank on the verbal section of the Montana State University Placement Examination.
(8) Stanine rank on the quantitative section of the Montana
State University Placement Examination.
time during the study period. This group has been referred to as "non-starters."

59
Method of Collecting Data
The data for this study were collected in a variety of ways, The Student-teacher effectiveness ratings were submitted at the completion of teacher-education graduates• student teaching experiences to the Career Planning and Placement Office at Montana State University. The overall grade point average, grade point average in the teacher- education core program, and the grade point average in the major were taken from the yearly report prepared by the Office of Student Teaching and Certification. The stanines for the Montana State University quantitative and verbal scores were taken from the records of the
Testing Center which has the responsibility to gather and norm this
information. Finally, both the demographic information on age, gender, community in which the teacher-education graduate spent the first 10
years of his/her life, family income level, occupation of primary
family breadwinner, time of decision to enter teacher-education, and level of commitment to teach at the time of graduation, as well as the results of the Allport-Vernon Study of Values, were gathered by the investigator during the student-teaching seminar which was a required part of the teacher-education program at Montana State University.
At the end of each year, a brief questionnaire (Appendix B) was sent to each member of the population. The questionnaire contained items which asked individuals their current occupations, and if any career changes had been made, why they had been made. The adequacy of responses to the questionnaire each year was the key issue in guaranteeing accuracy of the study and, hence, the study results. Because of

60the potentiality of non-response becoming a major contaminating variable, the investigator undertook two activities to ensure an adequate return. Each year each non-respondent to the questionnaire was called on the telephone one month following the initial mailing, and the same two brief questions were asked of that individual. The questionnaire was also kept brief and easy to complete.
Information about career choices, rates of survival, reasons for career change, and which persons were assigned to which categories at the end of the five-year study period was gathered by means of the yearly questionnaires. Individuals who did not respond were contacted by telephone and were asked the same questions contained in the written
questionnaire. In each instance, teacher-education graduates were asked to give their current jobs and employers and their reasons for any career changes since the last contact.
This study has employed two standardized instruments, the Montana
State University Placement Examination and the Allport-Vernon Study of Values. The Montana State University Placement Examination was developed by the Testing Center at Montana State University to provide a common reference point for incoming freshmen who variously have taken the SAT, ACT, or other entrance examinations. Verbal and quantitative
stanine scores computed by Montana State University were used in lieu of these standardized test scores. Verbal and quantitative stanine scores were computed for all freshman students. Prior to attending the university, freshmen were required to take the Scholastic Aptitude Test (SAT) or American College Testing Program (ACT). If a student was unable to take either the SAT or the ACT examinations, a Montana State

61
University Placement Examination was administered by the university’s Testing Center. The results of these different tests were then converted to the verbal and quantitative stanine scores. In order to develop a conversion method, students who had taken the SAT were chosen so that their distribution of Ohio scores coincided with the distribution of the Ohio scores obtained by the entire freshman class. Stanines were computed for the SAT verbal scores and were then labeled national verbal stanines. A similar method was used in converting SAT quantitative scores to stanines. In computing the SAT quantitative scores, the School and College Aptitude Test (SCAT) quantitative scores were used as the equating agent. In the same manner the ACT composite score was converted into a national verbal stanine and the ACT quantitative score was computed into a national quantitative stanine (Suvak, 1982).
The Study of Values is a non-projective personality test which
attempts to measure the values present in the individual’s personality. It is based on the research of Eduard Spranger, whose work in the early
days of the Twentieth Century defended the view that the personalities of people were best known through a study of their values or of
valuative attitudes. Hundleby (1965), Radcliffe (1965), and Hogan (1972) have observed the test confused interests and values; however, they seemed to agree that "the Study of Values is a surprisingly viable
test" (Hogan, 1972, p . 146). The manual listed split half reliabili
ties ranging from .84 to .95, with the mean reliability coefficient using a Z transformation being .90. The manual also indicated each theoretical item was positively associated with the total score derived

62
from all the theoretical items, and a positive correlation existed for each item and with the total score. It is significant at the .01 level of confidence. Finally, mean, repeat reliabilities were .89 for one month and, in another study, .88 for a two-month interval.
The manual for the Study of Values indicated the most efficient way to show the validity of the scale was to look at the ability of the test to predict scores expected by groups of people whose characteristics were already known. The manual and reviews in the literature indicated most of the Allport-Vernon Study of Values * norms in research foundation had been closely related to the college-going or college graduate, and according to Hundleby (1965), it was a useful test particularly for counseling and employment and selection purposes. Grimsley and Jarrett (1975), for example, found three subtests—
religious, theoretical and economics — were able to discriminate
between top-management level people and mid-management level people. All in all, although no specific figures were available regarding validity, the Study of Values was an appropriate test for the present study.
One of the special features of the Study of Values is that no particular training is required to administer the test. It could, in fact, be given to the test-taker with no instruction other than to read the instructions given in the test booklet. The main requirements to administer the test are that no discussion be given in advance as to how the test was developed, and that the subjects be cooperative. These conditions were met with the subjects in this study.

63
Statistical Hypotheses
(I)
(2)
(3)
(4)
The following hypotheses were tested:
Hq : There is no significant difference among the means of thefour categories of teacher-education graduates (e.g., survivors, related-educators, dropouts, and non-starters) in their theoretical subscores on the Study of Values.
H-]: There is a significant difference among the means of thefour categories of teacher-education graduates in their theoretical subscores on the Study of Values.
Hq : There is no significant difference among the means of thefour categories of teacher-education graduates in theireconomic subscores on the Study of Values.
H-|: There is a significant difference among the means of thefour categories of teacher-education graduates in their
economic subscores on.the Study of Values.
Hg: There is no significant difference among the means of thefour categories of teacher-education graduates in theiraesthetic subscores on the Study of Values.
H-|; There is a significant difference among the means of the four categories of teacher-education graduates in their
aesthetic subscores on the Study of Values.
Hg: There is no significant difference among the means of thefour categories of teacher-education graduates in theirsocial subscores on the Study of Values.

64
H-]: There is a significant difference among the means of thefour categories of teacher-education graduates in their social subscores on the Study of Values.
(5) Hq : There is no significant difference among the means of thefour categories of teacher-education graduates in their political subscores on the Study of Values.
Hi: There is a significant difference among the means of thefour categories of teacher-education graduates in their political subscores on the Study of Values.
(6) Hq; There is no significant difference among the means of thefour categories of teacher-education graduates in theirreligious subscores on the Study of Values.
Hi: There is a significant difference among the means of thefour categories of teacher-education graduates in theirreligious subscores on the Study of Values.
(7) Hq ; There is no significant difference among the means of thefour categories of teacher-education graduates in theirundergraduate grade point averages.
Hi: There is a significant difference among the means of thefour categories of teacher-education graduates in theirundergraduate grade point averages.
(8) Hq: There is no significant difference among the means of thefour categories of teacher-education graduates in theirgrade point averages in their teaching majors.

65H1:
(9) Hg;
H1:
(IO) H0;
Hi:
(11) H0:
H1:
There is a significant difference among the means of the four categories of teacher-education graduates in their grade point averages in their teaching majors.
There is no significant difference among the means of the four categories of teacher-education graduates in their grade point averages in their teacher-education core programs.
There is a significant difference among the means of the four categories of teacher-education graduates in their grade point averages in their teacher-education core programs.
There is no significant difference among the means of the four categories of teacher-education graduates in their Student-teacher effectiveness ratings.
There is a significant difference among the means of the four categories of teacher-education graduates in their Student-teacher effectiveness ratings.
There is no significant difference among the means of the four categories of teacher-education graduates in their stanine rankings on the verbal section of the Montana State University Placement Examination.
There is a significant difference among the means of the four categories of teacher-education graduates in their stanine rankings on the verbal section of the Montana State University Placement Examination.
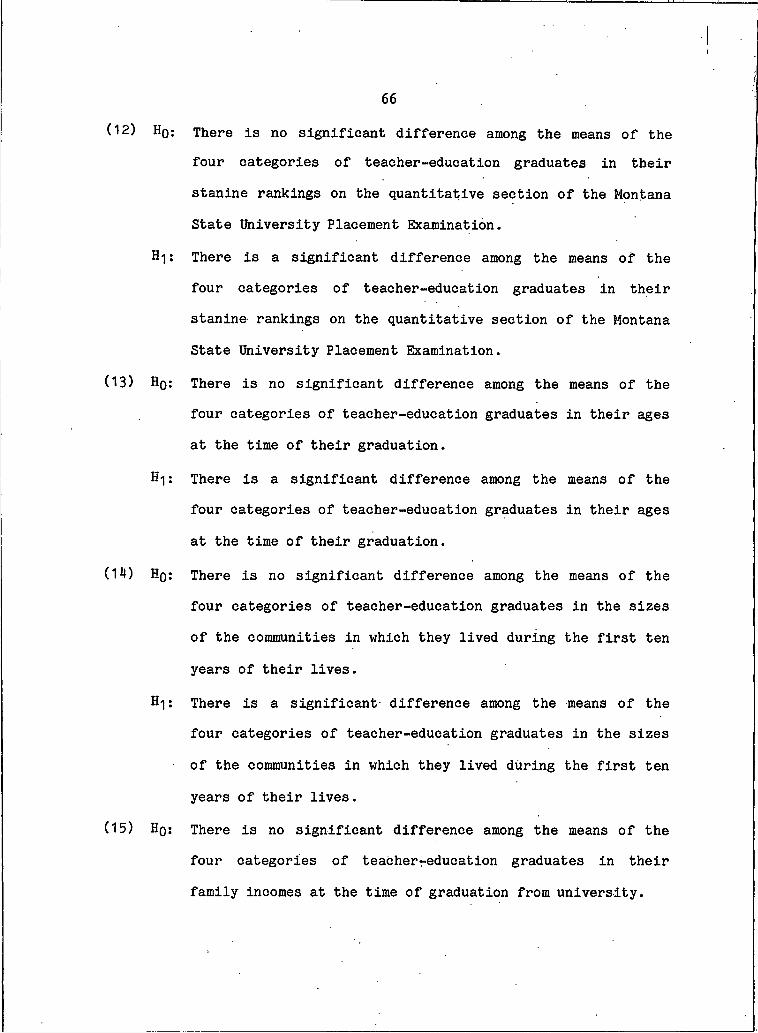
66
(12) H0:
Hi:
(13) H0;
Hi:
(14) H0:
H1:
(15) H0:
There is no significant difference among the means of the four categories of teacher-education graduates in their stanine rankings on the quantitative section of the Montana State University Placement Examination.
There is a significant difference among the means of the four categories of teacher-education graduates in their stanine rankings on the quantitative section of the Montana State University Placement Examination.
There is no significant difference among the means of the four categories of teacher-education graduates in their ages at the time of their graduation.
There is a significant difference among the means of the four categories of teacher-education graduates in their ages at the time of their graduation.
There is no significant difference among the means of the four categories of teacher-education graduates in the sizes of the communities in which they lived during the first ten years of their lives.
There is a significant difference among the means of the four categories of teacher-education graduates in the sizes of the communities in which they lived during the first ten years of their lives.
There is no significant difference among the means of the four categories of teacherr-education graduates in their family incomes at the time of graduation from university.

67H1:
(16) H0:
H1:
(17) H0;
Hi:
(18) H0:
Hi:
(19) H0;
There is a !Significant difference among the means of the four categories of teacher-education graduates in their family incomes at the time of graduation from university.
The gender of teacher-education graduates is independent of the four categories they belonged to at the end of the study.
The gender of teacher-education graduates is dependent on the four categories they belonged to at the end of the study.
The usual occupation (sorted into U.S. Department of Labor categories) of the primary breadwinner in a teacher- education graduate's family is independent of the four categories they belonged to at the end of the study.The usual occupation (sorted into U.S. Department of Labor categories) of the primary breadwinner in a teacher- education graduate's family is dependent on which of the four categories they belonged to at the end of the study.
The time of life when teacher-education graduates decided to prepare for teaching is independent of which of the four categories they belonged to at the end of the study.
The time of life when teacher-education graduates decided to prepare for teaching is dependent on which of the four categories they belonged to at the end of the study.
The attitude of teacher-education graduates toward teaching as a career at the time of their graduation is independent
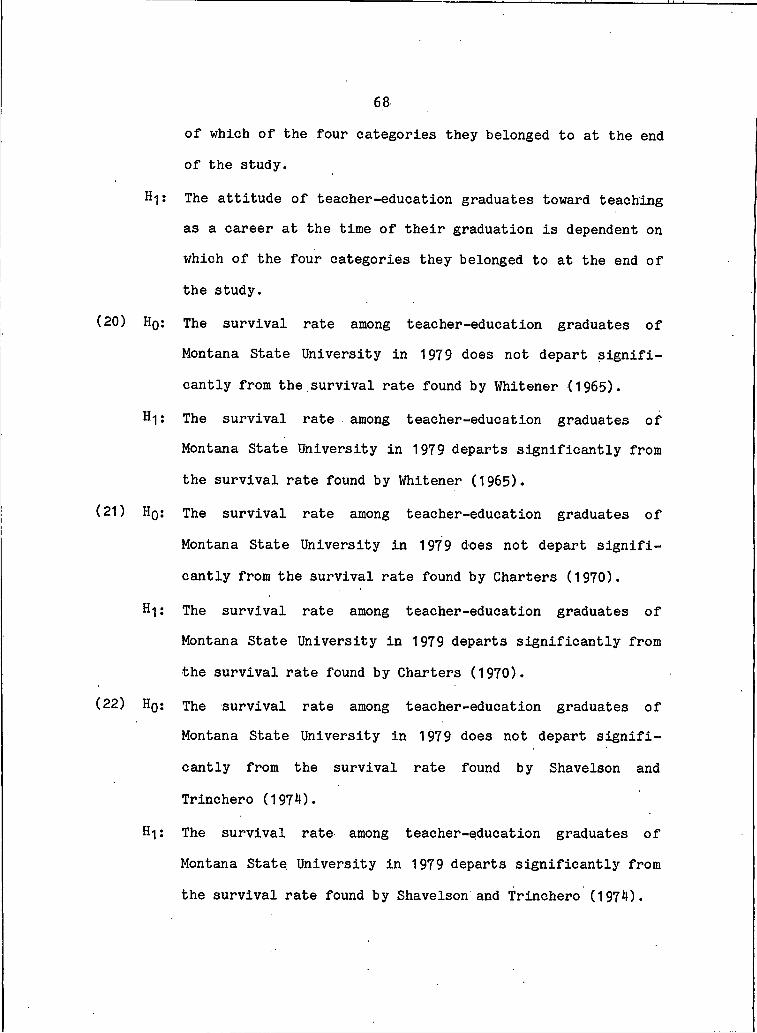
68of which of the four categories they belonged to at the end of the study.
(20)
(21)
(22)
H-|: The attitude of teacher-education graduates toward teachingas a career at the time of their graduation is dependent on which of the four categories they belonged to at the end of the study.
Hq : The survival rate among teacher-education graduates ofMontana State University in 1979 does not depart significantly from the survival rate found by Whitener (1965).
H1: The survival rate among teacher-education graduates ofMontana State University in 1979 departs significantly from the survival rate found by Whitener (1965).
Hq : The survival rate among teacher-education graduates ofMontana State University in 1979 does not depart significantly from the survival rate found by Charters (1970).
Hi: The survival rate among teacher-education graduates ofMontana State University in 1979 departs significantly from the survival rate found by Charters (1970).
Hq : The survival rate among teacher-education graduates ofMontana State University in 1979 does not depart significantly from the survival rate found by Shavelson and Trinchero (1974).
Hi: The survival rate among teacher-education graduates ofMontana State University in 1979 departs significantly from the survival rate found by Shavelson and Trinchero (1974).

69(23) Hq: The survival rate among teacher-education graduates of Mon
tana State University in 1979 does not depart significantly from the survival rate found by Mark and Anderson (1985).
H-|: The survival rate among teacher-education graduates ofMontana State University in 1979 departs significantly from the survival rate found by Mark and Anderson (1985).
Method of Organizing Data
The statistical information generated by analyzing the data previously discussed is presented in two ways in Chapter 4. Most of
the information is presented in tabular form. The three basic analyses employed in the study and examples of the presentations are as follows:
(1) One-Way Analysis of Variance (ANOVA) will be used when looking for differences among individuals in four cate
gories of teacher-education graduates and 15 of the preemployment variables gathered prior to graduation. Tabular information will be presented as shown in Table 5.
Table 5* Example of One-Way Analysis of Variance table used to present information in Chapter 4;
Source df Sum of Squares Mean Squares
Between K-I SS_ MSnD BWithin N-K SS., MS,,W WTotal N-I SSt
MSjl
MSWF =

70(2) Chi Square Test of Independence will be used when
looking for differences among individuals in the four categories of teacher-education graduates and four of the pre-employment variables gathered prior to graduation. Tabular information will be presented as shown in Table 6 .
Table 6 . Example of Chi Square Test of Independence table used to present information in Chapter 4.
Group Male Female Total
Dropouts _ _ _ _
Survivors — — — — — —
Non-Starters — — ee ■ M *
Related-Educators — — — —Total --
Level ofChi Square D.F. Significance
— - -■ — —
(3) Chi Square Test for Goodness of Fit will be used when looking at the survival rate at work among teacher-
education graduates in the class of 1979 and the survival rates found in the studies done by Whitener (1965), Charters (1970), Shavelson and Trinchero (1974), and Mark and Anderson (1985). Tabular information will bepresented as shown in Table 7*

71Table 7. Example of Chi Square Goodness of Fit table used to present
information in Chapter 4.
Category I Category 2 Category 3 Category 4 Category NE E E E E
#1 0 0 0 0 0E E E E E
#2 0 0 0 0 0
The second way in which information in Chapter 4 is presented is in narrative form. Information gathered regarding the reasons graduates left teaching, the types of occupations pursued by individuals who were not teaching at the end of the study period, and the geographic
distributions of teacher-education graduates five years following graduation will be presented in narrative form.
Analysis of Data
The following statistical procedures were used to analyze the hypotheses stated in the previous section:
(1) A One-Way Analysis of Variance was used to analyze the first 15 hypotheses. Where differences among means were found, the Scheffe Post Hoc Analysis was used to determine which categories differed.
(2) A Chi Square Test of Independence was used to analyze hypotheses 16 through 19.
(3) A Chi Square Goodness of Fit Test was used to analyze hypotheses 20 through 23.

72
Precautions Taken for Accuracy
The data collected through the questionnaires and tests and information otherwise gathered during the course of the study were analyzed by the Computing Center at Montana State University. The data were double-checked for accuracy by two separate individuals. The data were inputted into the university’s computer by the researcher and a research assistant. Results of all inferential statistical procedures were separately checked by the researcher and the Director of the Testing Center.

73
CHAPTER 4
PRESENTATION AND ANALYSIS OF DATA
The primary purpose of this study was to follow the 1979 class of teacher-education graduates from Montana State University for a five- year period immediately following their graduation in order to determine the predictive validity of 19 selected variables. These variables were collected prior to the class's graduation. Variables were collected through the use of a questionnaire (Appendix A) and the administration of the Allport-Vernon Study of Values. In addition, grade point averages were gathered from records of Montana State
University's Student Teaching and Certification Office; student
teaching ratings were obtained from the Career Planning and Placement Office; and verbal and quantitative stanine scores were taken from the records of the Montana State University Testing Center.
Each fall from 1980 through 1984, teacher-education graduates were contacted by followup questionnaires (Appendix B). Individuals’
current occupations and geographic locations were ascertained. If they
had changed positions during the preceding 12 months, teacher-education graduates were asked to indicate their reasons for changes. Nonrespondents were contacted by telephone after a period of one month and
asked the same questions that were contained in the questionnaire.After the final followup study, teacher-education graduates were
grouped into one of four categories based on their career decisions

74
A total of 239 individuals graduated in teacher-education from Montana State University at some time between the end of fall quarter 1978 and summer quarter 1979. Of that number, six people (2.5% of the population) indicated during their student-teaching seminars that they did not wish to be included in the study and would not complete the
questionnaire or the Study of Values. During the course of the study, five individuals (2.1%) could not be located through the yearly followup studies. As a result, the statistical and narrative information presented in this chapter is based on data gathered from 228
teacher-education graduates out of a total population of 239» or 95.4% of the total population. Table 8 shows the breakdown of the 228 individuals according to category.
during the study period. As has been discussed previously in thisstudy, the groups were "survivors," "dropouts," "non-starters," and"related-educators."
Table 8. Categorical breakdown of members in the study sample.
Category I Dropouts
Category 2 Survivors
Category 3 Non-Starters
Category 4 Related-Eds.
Males 10 35 15 5Females 46 69 45 3
Total 56 104 60 8
The remainder of Chapter 4 will be devoted to a review of the data
generated by the study. The chapter will be organized as follows:
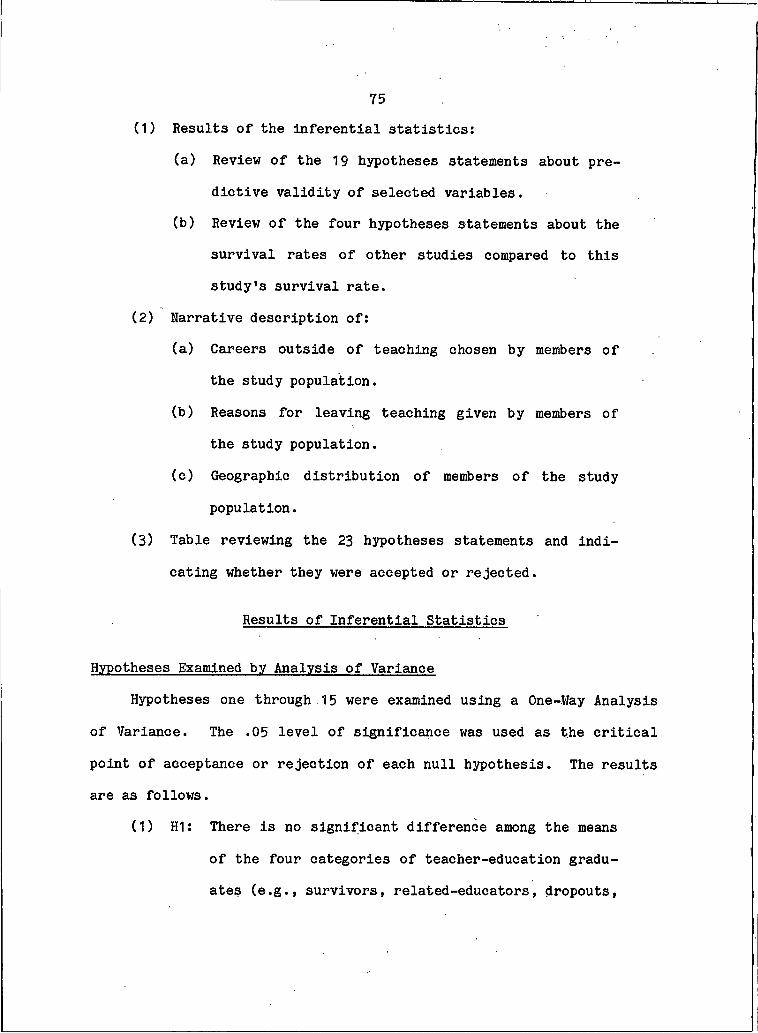
75(1) Results of the Inferential statistics:
(a) Review of the 19 hypotheses statements about predictive validity of selected variables.
(b) Review of the four hypotheses statements about the survival rates of other studies compared to this study’s survival rate.
(2) Narrative description of:(a) Careers outside of teaching chosen by members of
the study population.(b) Reasons for leaving teaching given by members of
the study population.(c) Geographic distribution of members of the study
population.
(3) Table reviewing the 23 hypotheses statements and indicating whether they were accepted or rejected.
Results of Inferential Statistics
Hypotheses Examined by Analysis of Variance
Hypotheses one through 15 were examined using a One-Way Analysis of Variance. The .05 level of significance was used as the critical point of acceptance or rejection of each null hypothesis. The results are as follows.
(I) HI: There is no significant difference among the means
of the four categories of teacher-education graduates (e.g., survivors, related-educators, dropouts,

76and non-starters) in their theoretical subscores on the Study of Values.
Table 9. Table of means on the theoretical subscore of the Study of Values by employment category.
Group Number Mean Std. Deviation
Dropouts 56 38.1964 7-5737Survivors 104 36.8846 8.1029Non-Starters 60 36.8500 7.9996Related-Educators 8 35.8750 5.1669Total 228 37.1623 7.8440
Table 10. One-Way Analysis of Variance for the theoretical subscore of the Study of Values by employment category.
Source
Analysis of Variance
D.F.Sum of Squares
MeanSquares F Ratio
F Probability
Between groups 3 87.0159 29.0053 .4681 .7048Within groups 224 13879-9797 61.9642Total 227 13966.9956
Table 10 indicates no significant difference in the theoreticalsubscores for the four employment categories of teacher-education graduates. Therefore, the null hypothesis is not rejected.
(2) H2: There is no significant difference among the meansof the four categories of teacher-education graduates in their economic subscores on the Study ofValues.

77
Table 11. Table of means on the economic subscore of the Study ofValues by employment category.
Group Number Mean Std., Deviation
Dropouts Survivors Non-Starters Related-Educators
5610460
8
40.035740.721239.600037.1250
7.73188.29379.66247.0191
Total 228 40.1316 8.4874
Table 12. One-Way Analysis of Variance for the economic the Study of Values by employment category.
subscore of
Analysis of Variance
Source D.F.Sum of Squares
MeanSquares F Ratio
F Probability
Between groups Within groups
3224
125.935616226.1170
41.978572.4380
5795 .6290
Total 227 16352.0526
Table 12 indicates no significant difference in the economic
subscores for the four employment categories of teacher-education graduates. Therefore, null hypothesis number two is not rejected.
(3) HS: There is no significant difference among the means
of the four categories of teacher-education graduates in their aesthetic subscores on the Study ofValues.

78
Table 13. Table of means on the aesthetic subscore of the Study ofValues by employment category.
Group Number Mean Std. Deviation
Dropouts 56 43.5893 6.6682Survivors 104 43.4712 9.4128Non-Starters 60 44.1667 10.1867Related-Educators 8 44.3750 7.4438Total 228 43.7149 8.9306
Table 14. One-Way Analysis of Variance for the aesthetic subscore of the Study of Values by employment category.
Analysis of Variance
Source D.F.Sum of Squares
MeanSquares F Ratio
F Probability
Between groups 3 22.7939 7-5980 .0941 .9632Within groups 224 18081.6754 80.7218
Total 227 18104.4693
Table 14 indicates no significant difference in the aesthetic sub
scores for the four employment categories. Therefore, null hypothesis number three is not rejected.
(4) H4: There is no significant difference among the meansof the four categories of teacher-education graduates in their social subscores on the Study ofValues.

79
Table 15. Table of means on the social subscore of the Study ofValues by employment category.
Group Number Mean Std., Deviation
DropoutsSurvivorsNon-StartersRelated-Educators
5610460
8
40.4286 40.1538 38.6833 .42.5000
6.72548.29767.97774.9857
Total 228 39-9167 7.7611
Table 16. One-Way Analysis of Variance for the social the Study of Values by employment category.
subscore of
Analysis of Variance
Source D.F.. Sum of Squares
MeanSquares F Ratio
F Probability
Between groups Within groups
3224
165.180613508.2361
55.060260.3046
.9130 .4354
Total 227 13673.4167
Table 16 indicates no significant difference in the social subscores for the four employment categories of teacher-education graduates. Therefore, null hypothesis number four is not rejected.
(5) H5: There is no significant difference among the meansof the four categories of teacher-education graduates in their political subscores on the Study ofValues.

80
Table 17. Table of means on the political subscore of the Study ofValues by employment category.
Group Number Mean Std. Deviation
Dropouts 56 39-3036 5.7869Survivors 104 38.7404 8.4325Non-Starters 60 38.7404 7.4749Related-Educators 8 39.9167 6.7771 .Total 228 38.9605 7.5094
Table 18. One-Way Analysis of Variance for the political subscore ofthe Study of Values by employment category.
Source
Analysis of Variance
D.F.Sum of Squares
MeanSquares F Ratio
F Probability
Between groups 3 16.7317 5.5772 .0977 .9612Within groups 224 12783.9130 57.0710Total 227 12800.6447
Table 18 indicates no significant difference in the politicalsubscores for the four employment categories of teacher-educationgraduates. Therefore, null hypothesis number five is not rejected.
(6) H6: There_is no significant difference among the means
of the four categories of teacher-education graduates in their religious subscores on the Study ofValues.

81
Table 19- Table of means on the religious subscore of the Study ofValues by employment category.
Group Number Mean Std. Deviation
Dropouts 56 38.6250 9.4956Survivors 104 37.3846 11.5358Non-Starters 60 37.7667 11.2707Related-Educators 8 42.5000 10.2956Total 228 37-9693 10.9321
Table 20. One-Way Analysis of Variance for the religious subscore of the Study of Values by employment category.
Analysis of Variance
Source D.F.Sum of Squares
MeanSquares F Ratio
F Probability
Between groups 3Within groups 224
226.311426902.4737
75.4371 .6281120.1003
.5975
Total 227 27128.7851
Table 20 indicates no significant difference in the religious
subscores for the four employment categories of teacher-education graduates. Therefore, null hypothesis number six is not rejected.
(7) H7: There is no significant difference among the meansof the four categories of teacher-educationgraduates in their undergraduate grade pointaverages.

82
Table 21. Table of means for undergraduate grade point averages byemployment category.
Group Number Mean Std. Deviation
Dropouts 56 301.1071 59.4819Survivors 104 310.5481 46.6463Non-rStarters 60 303.4000 47.9471Related-Educators 8 303.6250 45.9967Total 228 306.1053 50.2460
Table 22. One-Way Analysis of Variance for undergraduate grade point average by employment category.
Analysis of Variance
Source D.F.Sum of Squares
MeanSquares F Ratio
F Probability
Between groups 3 3940.0819 1313-3606 • 5169 .6711Within groups 224 569157-3918 2540.8812Total 227 573097.4737
Table 22 indicates no significant difference in the undergraduate
grade point averages for the four employment categories of teacher- education graduates. Therefore, null hypothesis number seven is notrejected.
(8) H8: There is no significant difference among the meansof the four categories of teacher-education grad
uates in their grade point averages in their teaching majors.

83
Table 23. Table of means for grade point averages in teaching majorsby employment category.
Group Number Mean Std. Deviation
Dropouts 56 303.8393 61.5325Survivors 104 306.1635 49.8733Non-Starters 60 306.3500 47.7489Related-Educators 8 321.0000 49.7489Total 228 306.1623 52.1719
Table 24. One-Way Analysis of Variance for grade point averages in teaching majors by employment category.
Analysis of VarianceSum of Mean F Prob-
Source D.F. Squares Squares F Ratio ability
Between groups 3 2065.5709 688.5236 .2505 .8610Within groups 224 615807.4247 2749.1403Total 227 617872.9956
Table 24 indicates no significant difference in the grade point
averages in their teaching major for teacher-education graduates. Therefore, null hypothesis number eight is not rejected.
(9) H9: There is no significant difference among the meansof the four categories of teacher-education graduates in their grade point averages in their teacher-education core programs.

84
Table 25. Table of means for grade point averages in teacher-education core program by employment category.
Group Number Mean Std. Deviation
Dropouts 56Survivors 104Non-Starters 60Related-Educators 8Total 228
339.4821 62.2695345.0192 43.4958338.0500 62.5683344.6250 40.2241341.8114 53.6226
Table 26. One-Way Analysis of Variance for grade point averages in teacher-education core program by employment category.
Analysis of Variance
Source D.F.Sum of Squares
MeanSquares
F Prob- F Ratio ability
Between groups 3 2286.2217 762.0739 .2625 .8524Within groups 224 650424.6687 2903-6816Total 22? 65271.0.8904
Table 26 indicates no significant difference in the grade pointI
averages in their teacher-education core programs for the four categories of teacher-education graduates. Therefore, . null hypothesis number nine is not rejected.
(10) HTO: There is no significant difference among themeans of the four categories of teacher-education
graduates in their student-teacher effectivenessratings.

85
Table 27. Table of means for student-teacher effectiveness ratingsby employment category.
Group Number Mean Std. Deviation
Dropouts 56 65.1429 8.2427Survivors 104 66.0769 6.6983Non-Starters 60 62.4837 12.7033Related-Educators 8 71.0000 4.2426Total 228 65.0746 9.0990
Table 28. One-Way Analysis of Variance for student-teacher effectiveness ratings by employment category.
Source
Analysis of Variance
D.F.Sum of Squares
Mean F Prob-Squares F Ratio ability
Between groups 3 788.5074 262.8358 .32669 .0221Within groups 224 18005.2251 80.3805Total 227 18793.7325
Table 28 indicates there is a significant difference in student- teacher effectiveness ratings for the employment categories of teacher- education graduates. Therefore, null hypothesis number 10 is rejected.
Using the Scheffe Post Hoc Analysis, the maximum range of differences between the means of the four employment categories was found to
be 3.98. Table 27 indicates that the differences between groups one, two, and three is less than 3.98. Therefore, only the mean of group four is significantly higher than the means of the other groups. This

86
indicates related-educators are rated significantly higher in their student-teacher effectiveness ratings than the other three groups of
teacher-education graduates.(11) H11: There is no significant difference among the
means of the four categories of teacher-education graduates in their stanine rankings on the verbal section of the Montana State University Placement Examination.
Table 29. Table of means for stanine rankings on the verbal section of the Montana State University Placement Examination by employment category.
Group Number Mean Std. Deviation
Dropouts 56 4.0714 2.1897Survivors 104 4.3.750 ,2.4263Non-Starters 60 3.9000 2.2602Related-Educators 8 4.1250 2.6959
Total 228 4.1667 2.3293
Table 30. One-Way Analysis of Variance for stanine rankings on the verbal section of the Montana State University Placement Examination by employment category.
Analysis of VarianceSum of Mean F Prob-
Source D.F. Squares Squares F Ratio ability
Between groups " 3 9.3024 3.1008 .5682 .6365Within groups 224 1222.3643 5.4570
Total 227 1231.6667
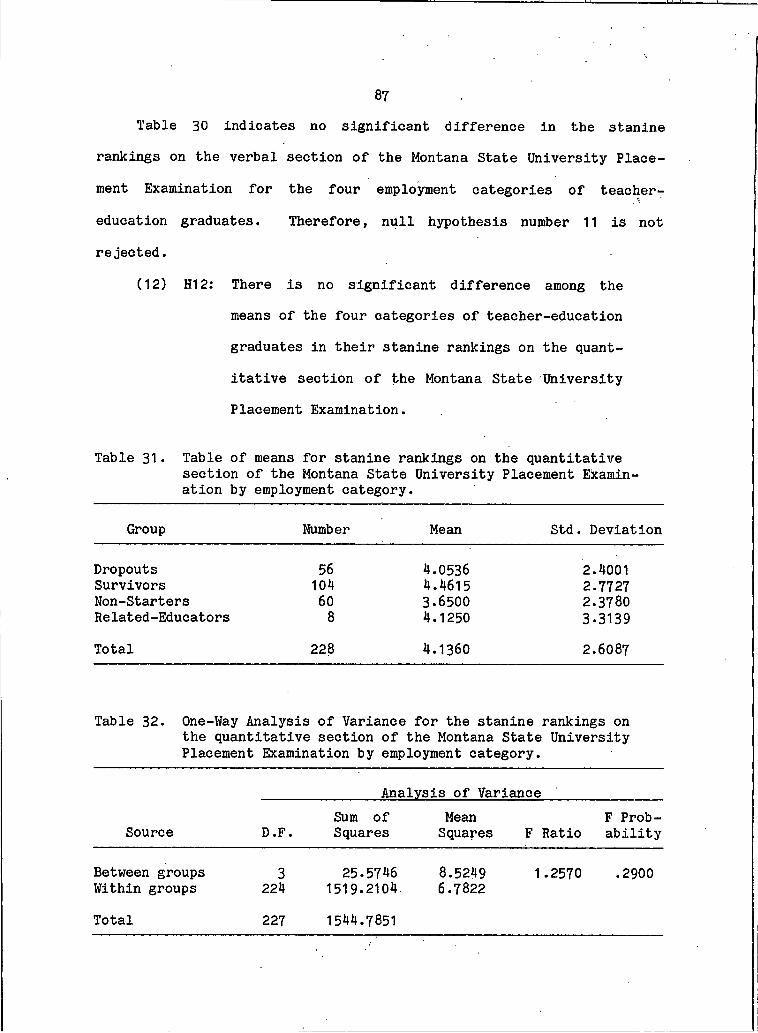
87Table 30 indicates no significant difference in the stanine
rankings on the verbal section of the Montana State University Place
ment Examination for the four employment categories of teacher- education graduates. Therefore, null hypothesis number 11 is not rejected.
(12) HI 2: There is no significant difference among themeans of the four categories of teacher-education graduates in their stanine rankings on the quantitative section of the Montana State University Placement Examination.
Table 31• Table of means for stanine rankings on the quantitativesection of the Montana State University Placement Examination by employment category.
Group Number Mean Std. Deviation
Dropouts Survivors Non-Starters Related-Educators
56104608
4.05364.46153-65004.1250
2.40012.77272.37803-3139
Total 228 4.1360 2.6087
Table 32. One-Way Analysis of Variance for the stanine rankings on the quantitative section of the Montana State University Placement Examination by employment category.
Analysis of Variance
Source D.F.Sum of Squares
MeanSquares
F Prob- F Ratio ability
Between groups Within groups
3224
25.57461519.2104.
8.52496.7822
1.2570 .2900
Total 227 1544.7851

I
88Table 32 Indicates no significant difference in the stanine
rankings on the quantitative section of the Montana State University Placement Examination for the four categories of teacher-education graduates. Therefore, hypothesis number 12 is not rejected.
(13) H13: There is no significant difference among themeans of the four categories of teacher-education graduates in their ages at the time of graduation .
Table 33« Table of means of ages of teacher-education graduates by employment category.
Group Number Mean Std. Deviation
Dropouts 56 I.2321 .5391Survivors 104 1.3846 .8162Non-Starters 60 I.3000 .7658Related-Educators 8 1.1250 • 3536Total 228 1-3158 • 7309
Table 34. One-Way Analysis of Variance of ages of graduates by employment category.
teacher-education
Analysis of Variance
Source D.F.Sum of MeanSquares Squares F Ratio
F Probability
Between groups 3Within groups 224
1.1906 .3969120.0725 .5360
.7404 .5290
Total 227 121.2632

Table 34 indicates no significant difference in the ages of teacher-education graduates for the four employment categories. Therefore, null hypothesis number 13 is not rejected.
(14) HI 4: There is no significant difference among themeans of the four categories of teacher-education graduates in the sizes of communities in which they lived during the first ten years of their, lives.
89
Table 35. Table of means of the size of community in which teacher- education graduates spent the first ten years of their lives by employment category.
Group Number Mean Std. Deviation
Dropouts 56 3-1429 .9616Survivors 104 3.0481 .9178Non-Starters 60 2.7333 .9892Related-Educators 8 2.7500 • 7071Total 228 2.9781 .9501
Table 36. One-Way Analysis of Variance of the size of community inwhich teacher-education graduates spent the first ten years of their lives by employment category.
_______________Analysis of Variance_______________Sum of Mean F Prob-
Source D.F. Squares Squares F Ratio ability
Between groups 3 6.0403 2.0134 2.2681 .0815Within groups 224 198.8501 .8877Total 227 204.8904

90
Table 36 indicates no significant difference for the size of community in which teacher-education graduates spent the first ten years of their lives for the four employment categories. Therefore, null hypothesis number 14 is not rejected.
(15) HI 5: There is no significant difference among themeans of the four categories of teacher-education graduates in their family income at the time of graduation from university.
Table 37• Table of means of family incomes for teacher-education graduates by employment category.
Group Number Mean Std. Deviation
Dropouts 56 3.8214 1.2807Survivors 104 3.7308 I.2940Non-Starters 60 3-6167 1.3666Related-Educators 8 3•8750 I.2464Total 228 3-7281 I.3026
Table 38. One-Way Analysis of Variance of family incomes for teacher- education graduates by employment category.
Analysis of Variance
Source D.F.Sum of Squares
MeanSquares F Ratio
F Probability
Between groups 3 1.4062 .4687 .2736 .8444Within groups 224 383.7342 I.7131Total 227 385.1404

91Table 38 indicates no significant difference in the family incomes
for the four employment categories of teacher-education graduates. Therefore, null hypothesis number 15 is not rejected.
Hypotheses Examined by Chi Square Test of Independence
Hypotheses 16 through 19 were examined using a Chi Square Test of Independence. The .05 level of significance was used as the critical point of acceptance or rejection of the null hypothesis.
(16) HI 6; The gender of teacher-education graduates is independent of the category they belonged to at the end of the study.
Table 39. Chi Square Table: Gender by employment category.
Group Male Female Total
Dropouts 10 46 56Survivors 35 69 104Non-Starters 15 45 60Related-Educators 5 3 8
Total 65 163. 228
Level <)fChi Square D.F. Significance
9-36575 3 .2477
Table 39 indicates the gender of teacher-education graduates is
independent of the employment category to which they belong. Therefore, null hypothesis number 16 is not rejected.

92(17) HI7: The usual occupation (sorted into U.S. Department
of Labor categories) of the primary breadwinner in a teacher-education graduate’s family is independent of the four categories they belonged to at the end of the study.
Table 40. Chi Square Table: Usual occupation of primary breadwinnerby employment category.
Occupations Dropouts Survivors Non--Starters
(I) Owner/Manager/Professional 25 56 30(2) Clerical/Service 8 13 12(3) Farmer/Rancher 15 21 14(4) Assembler/Manufacturer/
Construction 8 14 4
Total 56 104 60
Chi Square D.F.Level of
Significance
5.3471 6 .5017
Table 40 does not have information about the related-educators group. Each cell in the table contained too few individuals, so those
cells were not included in the computation of Chi Square. The table indicates the occupation of the primary breadwinner in a teacher- education graduate’s family is independent of the employment category
to which s/he belongs. Therefore, null hypothesis number 17 is not
rejected.(18) HI 8: The time of life when teacher-education graduates
decided to prepare for teaching is independent of

93
which of the four categories they belong to at the end of the study.
Table 41. Chi Square Table: Time of life when decision was made toprepare for teaching by employment category.
Time of Life Dropouts Survivors Non-Starters
During grades K-6 2 7 .2During grades 7-9 I 9 5During grades 10-12 11 25 13During grades 13-14 19 37 16During grades 15-16 15 18 19At some other time 7 8 3
Total 55 104 58
Chi Square D.F.Level of
Significance
10.951 10 .3623
Table 41 does not have information about the related-educators
group. Each cell for this group contained too few individuals, so these cells were not included in the computation of the Chi Square.
The table indicates the time of life when a teacher-education graduate decided to prepare for teaching is independent of the employment category to which they belong. Therefore, null hypothesis number 18 is
not rejected.(19) HI 9: The attitude of teacher-education graduates
toward teaching as a career at the time of their
graduation is independent of which of the four
categories they belonged to at the end of the
study.

94Table 42. Chi Square Table: Attitude of graduates to teaching as a
career by employment category.
Attitude Towards Teaching Dropouts Survivors Non-Starters
(I) Teaching is first priority 25 55 11(2) Do not plan to teach at all 0 3 6(3) Will teach if job is right 17 31 13(4) Location restricts my ability
to find a teaching position 7 6 15(5) Will not teach next year, but
will in the future 5 4 8(6) Some other attitude towards
teaching 2 5 6
Total 56 104 59
Chi Square D.F.Level of
Significance
38.351 10 .000
Table. 42 does riot have information about the related-educators group. Each cell for this group contained too few individuals, so these cells were not included, in the computation of Chi Square. The table indicates the attitudes of teacher-education graduates towards teaching as■a career are dependent on the employment category to which
they belong. Therefore, null hypothesis number I 9 is rejected.
Hypotheses Examined by Chi Square Test for Goodness of Fit
Hypotheses 20 through 23 were examined using a Chi Square Test for Goodness of Fit. The .05 level of significance was used as the critical point of acceptarice or rejection of the null hypothesis.

95
(20) H20: The survival rate among teacher-education graduates of Montana State University in 1979 does not depart significantly from the survival rate found by Whitener (1965).
Table 43. Chi Square Table: Rates of survival for teacher-educationgraduates of Montana State University in 1979 and for Whitener (1965) by year.
Year I Year 2 Year 3 Year 4 Year 5608.2 483-7 397-7 366.7 346.7
Whitener 621 485 406 356 335119.8 95.3 78.3 72.3 68.3
M.S.U. 107 94 70 83 80
Level ofChi Square D.F. Significance7.0371 4 .1336
Table 43 indicates the survival rate among teacher-education graduates of Montana State University in I 979 does not depart significantly from the rate found by Whitener (1965) in his study. Therefore, null hypothesis number 20 is not rejected.
(21) H21: The survival rate among teacher-education gradu
ates of Montana State University in 1979 does not
depart significantly from the survival rate found by Charters (1970).

96
Table 44. Chi Square Table: Rates of survival for teacher-educationgraduates of Montana State University in 1979 and forCharters (1970) by year.
Year I Year 2 Year 3 Year 41440.2 1075.1 817-6 720.1
Charters 1459 1075 819 700125.8 ' : 93.9 71.4 62.9
M.S.U. 107 94 70 83
Chi Square D.F.Level of
Significance10.0721 3 .1812
Table 44 indicates the survival rate among teacher-education graduates of Montana State University does depart significantly from the
rate found by Charters (.1970) in his study. Therefore, null hypothesis number 21 is not rejected.
(22) H22: The survival rate among teacher-education graduates of Montana State University in I 979 does not depart significantly from the survival rate found
by Shavelson and Trinchero (1974).

97
Table 45. Chl Square Table: Rates of survival for teacher-educationgraduates of Montana State University in 1979 and forShavelson and Trinchero (1974) by year.
Year I Year 2 Year 3 Year 4 Year 5
Shavelson/Trinchero
175.4 148.6 124.2 118.8 109.0181 150 134 112 99
112.6 95.4 79-8 76.2 70.0M.S.U. 107 94 70 83 80
Level ofChi Square D.F. Significance
5.7891 4 .2151
Table 45 indicates the survival rate among teacher-education graduates of Montana State University does not depart significantly from the rate found by Shavelson and Trinchero (1974) in their study. Therefore, null hypothesis number 22 is not rejected.
(23) H23: The survival rate among teacher-education graduates of Montana State University in I 979 does not depart significantly from the survival rate found
by Mark and Anderson (1985).

98
Table 46. Chi Square Table: Rates of survival for teacher-educationgraduates of Montana State University in 1979 and forMark and Anderson (1985) by year.
Year 1 Year 2 Year 3 Year 4 Year 5
Mark/Anderson
601.9 519.9 460.7 431.1 358.4
605 521 475 427 344110.1 95.1 84.3 78.9 65.6
M.S.U. 107 94 70 83 80
Level ofChi Square D.F. Significance
6.9941 4 .1359
Table 46 indicates the survival rate among teacher-education grad
uates of Montana State University does not depart significantly from
the rate found by Mark and Anderson (1985) in their study. Therefore, null hypothesis number 23 is not rejected.
Narrative Description of Teacher- Education Graduates
Careers Outside of EducationAt the conclusion of the study, 124 of the 228 (54.4%) teacher-
education graduates in the class of 1979 were not employed as classroom teachers. Table 47 shows the career fields that graduates entered if they were not teaching in the fall of 1984. The first six categories used to classify occupations were ones suggested by Harris et al. (1985) and discussed in Chapter 2 of this study. The other three categories were added since many teacher^education graduates were

99involved in endeavors which were not adequately covered by Harris *categories.
Table 47- Careers outside of classroom teaching pursued by teacher- education graduates in the fall of 1984.
Career AreaNumber
EmployedPercentEmployed
(I) Sales 14 10.7(2) Managers 7 5.7(3) Professionals 20 16.5(4) Technical 6 4.9(5) Administrative Support/Clerical 13 9.8(6) Miscellaneous 18 14.6(7) Graduate Student 11 9.0(8) Housewife 31 25.5(9) Not Employed 4 3.3
Total 124 100.0
The specific job titles listed by teacher-education graduates for
the first six categories in Table 47 are as follows:(1) Sales occupations. These include bank product special
ist, hotel sales director, money market trader, owner of retail business, and wholesale sales representative.
(2) Managerial occupations. These include auditor, customer service supervisor, director of training for an association of bankers, manager of a department store, manager of a restaurant, and physical education supervisor.
(3) Professional specialists. Included in this group are
artist, athletic equipment manager, college basketball coach, college teacher, commercial artist, county
extension agent, head resident advisor in a college

100
dormitory, lawyer, minister, music teacher (private lessons), performing musician, public librarian, rancher, range soil scientist, and USAF pilot.
(4) Technical occupations. These include accounting technician, computer operator, physics laboratory machinist, medical records librarian, and systems analyst.
(5) Administrative support and clerical occupations. Included in this group are administrative assistant, bank teller, bookkeeper, legal clerk/bailiff, and secretary.
(6) Miscellaneous career fields. The miscellaneous group includes bank loan officer, carpenter, cashier, dental assistant, heavy equipment operator, hog farmer, housekeeper, roust-about foreman, school bus driver, truck driver, waitress, and woodworker.
Reasons for Leaving Teaching
Following their graduation in 1979, all teacher-education graduates were contacted yearly as a part of the followup study. Each fall from 1980 through 1984, graduates were asked to list on a questionnaire
their current employment, place of residence, and the reasons for any changes in employment since the last followup. The questionnaire (Appendix B) listed reasons often cited in the literature for teacher turnover and asked graduates to either choose one of those reasons or to offer a reason not included in the list. When more than one reason contributed to their decision, teacher-education graduates were asked to indicate the primary reason among all the reasons which they gave.

101
Table 48 enumerates the responses given by graduates as their primary reasons for leaving classroom teaching for another position.
Table 48. Reasons given by teacher-education graduates for leaving classroom teaching.
Reasons GivenNo. of Women .
No. of Men Total
(I) Returned for further education 5 7 12(2) Marriage 7 0 7(3) Increased family responsibility 2 0 2(4) Illness or death (self/family) I I 2(5) Birth of child 7 0 7(6) Inadequate salary in position 4 I 5(7) Disliked teaching as career 7 I 8(8) Restricted promotion opportunity 5 3 8(9) Moved to a larger school system 1 I 2
(10) Moved to better geographic locale 8 I 9(11) Eliminated position (R.I.F.) 6 . 2 8(12) Released from position (fired) I 2 3 -(13) Moved due to spouse job transfer 8 . 0 8(14) Disliked position or principal 3 I 4
Geographic Distribution of GraduatesThe final area of narrative information in this chapter is a
description of the geographic distribution of teacher-education gradu
ates in the fall of 1984. This information is presented in Table 49 which shows the geographic distribution of all 228 graduates, and Table 50 which shows the geographic distribution of the 104 graduates who
were employed as classroom teachers.In the fall of 1984, teacher-education graduates were living in 22
states and two foreign countries (Table 49). They were employed as classroom teachers in 14 states and two foreign countries (Table 50).

102
Table 49« Geographic distribution of 228 teacher-education graduates in the fall of 1984.
LocationNo.
Residing% of Total
States Listed by Graduates in Region
Montana 143 62.7Northwest U.S. 37 16.3 Washington, Oregon, Idaho,
Wyoming, AlaskaSouthwest U.S. . 16 7.0 Arizona, New Mexico, Texas, Utah,
CaliforniaSoutheast U.S. 6 2.6 Tennessee, LouisianaNortheast U.S. 5 2.2 New York, Massachusetts, New
HampshireN.Central U.S. 19 8.3 Colorado, North & South Dakota,
Ohio, Minnesota, MissouriAbroadTotal
2228
0.9100.0
Tanzania, Philippines
Table 50. Geographic distribution of fall of 1984.
104 classroom teachers in the
LocationNo.
Residing% of Total
States Listed by Graduates in Region
Montana .71 68.4Northwest U.S. 18 17-3 Washington, Oregon, Idaho,Southwest U.S. 5 4.8
Alaska, Wyoming Arizona, New Mexico, Texas
Northeast U.S. I 0.9 New YorkN. Central U.S. 7 6.7 North & South Dakota, Colorado,Abroad 2 1.9
OhioTanzania, Philippines
Total 104 100.0

103
Summary
Chapter 4 has presented in tabular form the answers to 23 statistical hypotheses raised in Chapter 3. It also has described the careers outside of classroom teaching pursued by teacher-education graduates in the class of 1979» their reasons for leaving teaching, and their geographic locations in the fall of 1984. The chapter concludes with Table 51 which summarizes the 23 null hypotheses and indicates whether they were retained or rejected.
Table 51. Table of hypotheses.
Hypoth. No. Statement Retained Rejected
1 There is no significant difference among Xthe means of the four categories of teacher-education graduates (survivors, related-educators, dropouts , and nonstarters) in their theoretical subscoreson the Study of Values.
2 There is no significant difference among Xthe means of the four categories of teacher-education graduates in theireconomic subscores on the Study of Values.
3 There is no significant difference among Xthe means of the four categories of teacher-education graduates in their aesthetic subscores on the Study of Values.
4 There is no significant difference among Xthe means of the four categories of teacher-education graduates in theirsocial subscores on the Study of Values.
5 There is no significant difference among Xthe means of the four categories of teacher-education graduates in their political subscores on the Study of Values.

104Table 51— continued.Hypoth.
No. Statement Retained Rejected
6 There is no significant difference among the means of the four categories of teacher-education graduates in their religious subscores on the Study of Values.
7 There is no significant difference among the means of the four categories of teacher-education graduates in their undergraduate grade point averages.
8 There is no significant difference among the means of the four categories of teacher-education graduates in their grade point averages in their teaching majors.
9 There is no significant difference among the means of the four categories of teacher-education graduates in their grade point averages in their teacher- education core programs.
10 There is no significant difference among the means of the four categories of teacher-education graduates in their student-teacher effectiveness ratings.
'11 There is no significant difference among the means of the four categories of teacher-education graduates in their stanine rankings on the verbal section of the Montana State University Placement Examination.
12 There is no significant difference among the means of the four categories of teacher-education graduates in their stanine rankings on the quantitative section of the Montana State University Placement Examination.
13 There is no significant difference among the means of the four categories of teacher-education graduates in their ages at the time of graduation.
X
X
X
X
X
X
X
X

105
Table 51— continued.
Hypoth. No. Statement Retained Rejected
IW There is no significant difference among Xthe means of the four categories of teacher-education graduates in the sizes of communities in which they lived during the first 10 years of their lives.
15 There is no significant difference among Xthe means of the four categories of teacher-education graduates in theirfamily incomes at the time of their graduation from university.
16 The gender of teacher-education graduates Xis independent of the category theybelonged to at the end of the study.
17 The usual occupation (sorted into U.S. XDepartment of Labor categories) of theprimary breadwinner in a teacher- education graduate’s family is independent of the four categories they belonged to at the end of the study.
18 The time of life when teacher-education Xgraduates decided to prepare for teachingis independent of which of the four categories they belonged to at the end of the study.
19 The attitude of teacher-education graduates toward teaching as a career at the time of their graduation is independent of which of the four categories they belonged to at the end of the study.
20 The survival rate among teacher-education Xgraduates of Montana State University in1979 does not depart significantly from the survival rate found by Whitener (1965).
21 The survival rate among teacher-education Xgraduates of Montana State University in1979 does not depart significantly from the survival rate found by Charters. (1970).
X

106
Table 51— continued.
Hypoth. No. Statement Retained Rejected
22 The survival rate among teacher-education Xgraduates of Montana State University in1979 does not depart significantly from the survival rate found by Shavelson and Trinchero (1974).
23 The survival rate among teacher-education Xgraduates of Montana State University in1979 does not depart significantly from the survival rate found by Mark and Anderson (1985).

107
CHAPTER 5
SUMMARY, CONCLUSIONS, IMPLICATIONS AND RECOMMENDATIONS
The purpose of Chapter 5 is to summarize the important concepts from Chapters 2 and 4 and to draw meanings from the data. This chapter is divided into four sections. Section one summarizes the important ideas presented in the review of literature as well as the findings in Chapter 4. Section two discusses the findings. Section three is
devoted to implications which can be drawn from the findings, and the
fourth section offers recommendations for further study.
Summary of the Study
Educators have been sensitive to the general perception that the teaching profession is somehow less of a profession because of the high
turnover rate among its workforce as well as the ease with which teachers can leave and then return after a lapse of time to the classroom. As a consequence, many studies have been conducted during this
century on various aspects of teacher turnover.The review of literature presented in Chapter 2 was divided into
five main sections consisting of: (I) research related to predicting
successful teaching, (2) research related to teacher survival, (3) research related to teacher retention, (4) research related to the

108
reasons teachers leave teaching, and (5) research related to careers teacher-education graduates pursue outside of teaching.
In the first half of the Twentieth Century, numerous attempts were
made to find variables which would predict whether teacher-education graduates would be successful as classroom teachers. Three studies reviewed this literature (Barr, 1961; Robinson, 1962; and Pratt, 1977) and found no variables which consistently predicted who would be a successful teacher. The variables investigated were of a general nature: (I) achievement measures, (2) personality measures, and (3) results of interviews used in some colleges to admit lower-division students to their teacher-education programs. One personality measure, the
Minnesota Teacher Attitude Inventory (MTAI), was found to predict successful performers in four studies (Tarpey, 1965; Popham and Trimble, I960; Justiz, 1969; and Herbert and Turnbull, 1963)• However, other studies (Robinson, 1962; Evans, 1965-66; Wright, 1975; and Pratt, 1977) did not find the MTAI to be a valid predictive instrument. These studies also cast doubt on the validity of the premises on which the
test itself was based.In addition to not finding valid predictive variables, studies
attempting to predict successful teaching performance encountered difficulties with measuring success itself. Three studies (Start, 1966; Popham, 1971; and Rosenshine and Furst, 1971) concluded success meant different things to different raters of success and that successful performance was more often simply a product of the situation than of any specific variable. As researchers (for example, Ornstien and
Levine, 1981; Koehler, 1983; and Huling-Austin, 1985) have learned more

109about effective schools and effective teaching, they have concluded teaching is so context-specific and multifaceted that it is highly
unlikely that any one teaching style is best in every situation.
Two areas of teacher turnover research have emerged in the literature in the wake of difficulties with predicting teaching success: teacher survival and teacher retention. These two lines of inquiry are based on the premise that it is easier to measure accurately whether teacher-education graduates remain in teaching over the years than whether they are successful in their work. Two studies (Pratt, 1977; and Lasley, 1986) suggested that if individuals remained in teaching over a period of years, they were more likely suited for the work and were enjoying some degree of success in it. Three researchers (Pratt, 1977; Lasley, 1986; and Charters, 1970) theorized that characteristics of individuals who persisted as teachers should become the center of turnover studies rather than attempting to measure success in some way.
One way the individuals who remain in teaching have been examined
is through survival studies which sought to quantify the rate at which
beginning teachers left classroom teaching. Five studies (Whitener,
1965; Charters, 1970; Shavelson and Trinchero, 1974; Mark and Anderson,
1985; and Huling-Austin, 1985) have shown that the careers of beginning teachers follow a predictable pattern. In the first three years of the typical group of teaching graduates' careers, 10 to 15 percent of all beginning teachers leave their positions each year. In the third to fifth years of teaching, the rate of separation slows to five to seven percent per year. Beyond five years of experience, the rate at which

110
practicing teachers leave the classroom slows to about one to two percent per year.
Retention studies have been directed toward finding factors Qither intrinsic within individuals or extrinsic in the environment which would predict whether teacher-education graduates would teach, enter but then drop out of teaching, or never enter teaching. Factors studied have involved three broad categories of variables, namely: (I) demographic, (2) personal and professional, and (3) school-related items.
Some of the variables studied have shown promise in predicting career decisions of teacher-education graduates. Among the demographic factors studied, six variables have been found to be possible
predictive variables. In six studies (Gosnell, 1977; Feldvebel, 1968;
Levine et al,, 1957; Erickson et al., 1968; Dworkin, 1980; and Lortie, 1975), the socioeconomic status of graduates appeared to be a factor in career decisions, while one study (Shavelson and Trinchero, 1974) found no clear relationship. Another study (Lyson and Falk, 1984) showed teacher-education graduates from rural communities were more likely to
remain in teaching than others. While no personality type emerged for teachers in two studies focusing on that variable (Rabinowitz and
Crawford, I960; and Getzels and Jackson, 1971), one study (Chapman and
Hutcheson, 1982) indicated that teachers exhibited basic attitudinal differences toward their work from non-teachers. One study (Pratt,
1977) found a significant difference between teacher-education graduates who did and did not teach based on the results of a structured interview. Two studies (Rabinowitz and Crawford, I960; and Whitener, 1965) found secondary-certified teacher-education graduates were

111
significantly more likely to remain in teaching once they began teaching than were elementary-certified graduates. Finally, one study (Rabinowitz and Crawford, 1960) noted that people who expressed high levels of satisfaction with student teaching were significantly more likely to remain in teaching than those who did not have a positive response to student teaching.
Six personal and professional factors showed promise as predictive variables. Five studies (Thorndike and Hagen, 1960; Blaser, 1965; Sharp, 1970; Lortie, 1975; and Chapman and Hutcheson, 1982) noted relationships between the importance teacher-education graduates assigned to salary levels and their career decisions, while one study (Mobley et al., 1979) did not find the relationship. Three studies (Lortie, I 975; Kleinert, I 968; and Fishel and Pottke, I 973) showed that individuals who placed great importance on career advancement were significantly less likely to teach than those who did not. One study (BioIand and Selby, 1980) found that teacher-education graduates who did not teach were more likely to express frustration with the restric
tions of teaching than those who did teach. Six studies (Gold, 1962; Dillman, 1964; Kleinert, 1968; Chussil, 1971; Corwin, I 965; and Belok,
1965) indicated non-teachers expressed more dissatisfaction with the prospect of non-instructional duties that were a part of education than did teachers. Two studies (Chapman, 1984; and Mobley et al., 1979) showed the expressed level of commitment to teaching made by teacher- education graduates was significantly higher among those who eventually remained in teaching than for other teacher-education graduates who did not elect to teach. Finally, three studies (Mobley et al., 1979;

112
McElroy, 1984; and Chapman, 1984) revealed job satisfaction is definitely related to career decisions about remaining in or leaving
teaching, although it remains to be determined exactly how this is a factor.
Only two school-related factors were found to be significant predictive variables. Three studies (Wood, 1968; Erickson et al., 1968; and Yuskiewicz and Donaldson, 1972) indicated positive peer relationships were related to whether teacher-education graduates remained in teaching or not. Closely related to peer relationships
were the six studies (Silverman, 1957; Browning, 1963; Yuskiewicz and Donaldson, 1972; Hahn, 1968; Mobley et al., 1979; and Chapman, 1984)
which showed that the amount of satisfaction teachers felt with their supervisors was directly related to their decisions to remain in teaching or not.
The retention research indicated that gender, level of educational attainment, race, intellectual ability, age, length of service in a district, marital status, acquired skills and behaviors, size of a school's student body, size of a school's faculty, and income level of the school district did not appear to be valid predictive variables.
The literature involving the reasons former teachers give for leaving teaching has shown most teachers dropped out of teaching for
personally-motivated reasons rather than for. environmentally-based
reasons. Personal reasons were grouped into eight broad categories.
One reason cited in eight studies (Harris et al., 1985; Olstad and Beal, 1984; Sykes, 1983; Hefferly, 1983; Lashier, 1984; Musemache and Adams, 1978; Darling-Hammond, 1984; and Wendling and Woodbury, 1984)

113clustered on inadequate salaries and fringe benefits. A second broad category of reasons offered in four studies (Harris et al.,' 1985;
Hefferly, 1983; Sykes, 1983; and Clayton and Wilson, 1 984) was unfavor-- :able working conditions. Another reason given by former teachers inthree studies (Harris et al., 1985; Hefferly, 1983; and Clayton and Wilson, 1984) was student-related factors. A fourth category named in four studies (Harris et al., 1985; Lashier, 198%; Hefferly, 1983; and Clayton and Wilson, 1984) was general concerns with administrators. Fifth, emotional factors such as stress, burnout, and boredom were given by former teachers in three studies (Harris et al., 1985; Hefferly, 1983; and Chicon and Koff, 1980). A sixth category named in four studies (Harris et al., 1985; Sykes, 1983; Olstad and Beal, 1984; and Darling-Hammond, 1984) was the increasing lack of respect forteachers as professionals. Seventh, community-based and parental
factors were reasons given by former teachers in two studies (Harris et
al., 1985; and Hefferly, 1983). Finally, various miscellaneous reasons such as increased family responsibility, retirement, college training, birth of child, spousal transfer, and teaching out of college major were listed in four studies (Bredeson et al., 1983; Hefferly, 1983; Ellis, et al., 1982; and Clayton and Wilson, 1984).
Three studies (Shavelson and Trinchero, 19.74; Ellis et al., 1982; and Clayton and Wilson, 1984) cited reasons for leaving teaching that were environmentally-based. Former teachers left teaching despite
wanting to continue because of the military draft, reductions in force,
being fired, death, and illness.

114The careers outside of teaching that teacher-education graduates
pursued if they did not teach were grouped into six categories by the single study (Harris et al., 1985) focused on this topic. Thirty-seven percent of all former teachers were employed in sales occupations, 21 percent in managerial careers, 20 percent in other professional careers, five percent in technical jobs, five percent in administrative support and clerical jobs, and the remaining 11 percent were in a range of miscellaneous occupations. Miscellaneous occupations cited by Harris et al. (1985) included service workers, fishery workers, farmers and ranchers, forestry workers, precision production workers, machine operators, fabricators, and general laborers.
In summary, this researcher was lead to review the educational literature because of his interest in career patterns of teacher-
education graduates. A major part of the literature on this broad
topic is concerned with various aspects of teacher turnover. In an
effort to provide some insight into the broad issue of teacher turnover, this researcher in Chapter 2 reviewed the literature of five separate but related research areas. Further research related to teacher retention, teacher survival, careers outside of teaching for teacher-education graduates, reasons given for leaving teaching, and geographic distribution of teacher-education graduates was warranted.
Results of the Study
In this study, 19 pre-employment variables were collected about members of the study population prior to their graduation in teacher-
education from Montana State University in 1979. Variables were chosen

115for inclusion in this study based on the preceding review of the literature. These variables can be grouped into five broad categories:
(I) personality measures, (2) measures of academic achievement, (3). a measure of teaching performance, (4) a measure of attitude toward teaching as a career, and (5) demographic measures. Statistical analyses showed only two of the 19 variables differentiated among members of the four employment categories. One of the significant variables was student-teacher effectiveness ratings, the one measure among the variables of teaching performance. Student-teacher effectiveness ratings were evaluations given members of the study sample by their classroom supervising teachers at the conclusion of their student teaching experiences. The ratings of the related- educator group were significantly higher than the means of the survivor, dropout, and non-starter groups of teacher-education
graduates. The other significant variable among the 19 was level of commitment toward finding a teaching position expressed by graduates
just before they actually graduated.Table 52 is the service table for the teacher-education graduates
of Montana State University in the class of 1979 who began to teach in the fall of 1979. Only those individuals who began to teach during that fall were included in the table, even though other members of the class taught at other times during the period this study covers. As
with the four retention studies cited in Chapter 2 (Whitener, 1965;
Charters, 1970; Shavelson and Trinchero, 1974; and Mark and Anderson, 1985), certain assumptions were made about what constituted survival among members of the population. In addition to including only those

116Montana State University teacher-education graduates in the class of 1979 who began to teach in the fall of 1979, dropouts were defined for the purposes of this study as being only those individuals who left teaching entirely. Teachers could move from one school system to another, and so long as they continued to teach, they were not counted as a dropout. In addition, any study subject who began to teach in the fall of 1979, subsequently dropped out, but then returned to teaching before the end of the study period in 1984, was included among the individuals surviving in the year they returned. This last condition accounted for the increase in survivors in year four of the study.
Table 52. Service table depicting information on survival found by Steadman.
Length of Service (Years)
No. Surviving at End of Year
No. Leaving from Prior Year
PercentLeaving
Cum. Percent Surviving
0 127 0 0 100.0I 107 -20 -15.7 84.32 94 -13 -12.1 74.03 70 -24 -25.5 55.14 83 +13 +18.6 65.45 80 - 3 - 3-6 63-0
The final section of Chapter 4 contained three narrative descrip
tions of the teacher-education graduates in the class of 1979- The data were gathered about the graduates in the fall of 1984. One narrative description listed the careers outside of teaching that study members pursued. Twenty-five percent of all graduates were housewives;
these were followed, in descending order of frequency, by careers in other professions, sales, administrative support and clerical

117
A second narrative description listed the reasons members of the study population who dropped out of teaching gave for leaving. Seventy-two persons gave reasons for leaving teaching that were based on internal motivations. Reasons given by dropouts included returning for further post-secondary education, marrying, increased family responsibility, birth of child, inadequate salary, dislike of teaching
or of supervisor, restricted promotion opportunities, movement to a
larger school system or to a more desirable geographic location, and movement due to spousal transfer. Thirteen people listed reasons which were based on events outside their control for their leaving teaching such as illness, death, reduction in force in a district, and being
fired.The third narrative description listed the geographic distribution
of all teacher-education graduates in the study population in the fall of 1984. Seventy-eight percent of the class was residing either in
Montana or in the other northwestern states. The other graduates were scattered throughout 16 other states and two foreign countries. Nearly
86 percent of all those graduates who were teaching in the fall of 1984 were working in Montana or the other northwestern states. The others were employed as teachers in eight states outside the region as well as
in two foreign countries.
occupations, graduate study, managerial careers, and technical workers.Of those graduates not teaching in the fall of 1984, 3.3 percent were
unemployed. ,
118
Discussion
From the preceding review of the literature and summary . of findings I eight points for discussion seem warranted. First, in retention studies, discrete variables such as personality test results, intelligence test scores, measures of academic achievement, gender, age, community size, family income, and parental occupation indicate no differences among groups of teacher-education graduates who choose
teaching as a career, drop out of teaching after once beginning, or never enter teaching at all. Much of the research which dealt with
discrete variables in Chapter 2 provided contradictory information; in
some instances, researchers found variables which were significant predictive variables while in others the same variables were not.
While there may be some variables that were not measured in this study which are valid predictive measures, it is this researcher's view that the knowledge of pre-employment variables alone will not predict whether teacher-education graduates will teach or not. As the individ
uals in this study sorted themselves into the four categories, it became apparent that those who shared a category designation (i.e.,
survivor, dropout, related-educator, and non-starter) did not necessarily have much else in common. There is clearly no "teacher
personality." No members of any category were clearly more intelligent
or more advanced academically. Individuals came to occupy the category they did mostly because of events which occurred in their lives subsequent to graduation. It is likely that individuals in one

119category could have easily been members of another category had events in their lives occurred differently.
Second * in retention studies, process variables such as attitudes
at a given time toward teaching as a career show promise of predicting differences among groups of teacher-education graduates who choose teaching as a career, drop out of teaching after once beginning, or never enter teaching. Unlike discrete variables which are more or less set and part of people’s basic personal makeup, process variables are subject to changes as individuals progress through their lives. Chapman (1984) had hypothesized that teacher-education graduates’ level of commitment to teaching as a career would prove to be an important
pre-employment predictor of whether they would teach or not. In this study the two variables which were found to be significant predictors ' of the category individuals belonged to are arguably aspects of
attitude. Attitude toward teaching at the time of graduation iscertainly a part of commitment to teaching. Success in student teaching also may well be at least in part a function of how committed individuals are to mastering the skills of their chosen profession. However, level of commitment to teaching prior to graduation or any process variables by themselves are not a complete description of the
process by which individuals choose to teach as a career. Lifetime I events which occur after graduation most likely play a larger role in
the career decisions that teacher-education graduates makes.Third, the decision by a teacher-education graduate to choose
teaching as a career, drop out of teaching after once beginning to
teach, or never enter teaching is a very individual one which usually

120 •
is a function of the interaction among personal characteristics, personal lifetime experiences, and environmental forces present in the work environment itself as distinguished from any single factor or event. As has been said in the first two discussion points, the teacher-education graduates in this study made their career choices in light of events that occurred in their lives after they graduated and embarked on their careers. That personal characteristics played some role in the decisions they made is very likely true. However, these characteristics were not the primary motivating factors. Instead, the decisions to enter or to leave teaching were most probably connected to
the three reasons offered by Holland (1973)« Workers’ personalities
changed as they went through the adult developmental stages. Workers
found the career field of their choice was not what they thought it was before entering it. Or, perhaps, the work environment changed in some way, causing workers to change their career paths, often against their wills.
Fourth, the survival rate among beginning teachers is consistent
over time, job market condition, and geographic location. This study found little difference between the survival rate for Montana State University teacher-education graduates and the survival rates found by
Whitener (1965), Charters (1970), Shavelson and Trinchero (1974), and
Mark and Anderson (1985). This consistency of rates means, for one thing, the survival rate has not varied significantly over a four- decade period. In addition, there is little difference among the survival rates of beginning teachers in times of teacher shortage (the late 1950s in Whitener's study), teacher surplus (the late 1960s and

121early 1970s in the studies by Charters and Shavelson and Trinchero), and near equilibrium in the"supply of teachers (the early 1980s in Mark and Anderson's study). Finally, little significant difference exists among the survival rates of beginning teachers in widely different geographical locations (i.e., rural Montana, the urban St. Louis Metropolitan Area, and suburban California) in these studies.
The fifth point of discussion is that studies which attempt to quantify the rate at which teachers leave teaching are a more accurate reflection of teachers' career patterns if they follow the individual teacher's career path than if they use the lists of teachers of a circumscribed number of school districts. Survival studies were motivated originally by the desire among educators to get a clearer picture of teacher turnover. It has been accepted that teachers are more mobile than members of other professions. It therefore makes
sense to follow teachers as they pursue their careers rather than to concentrate on school district turnover data. The latter is easier to
do, but it is not as accurate an approach as the former. One of the findings of this study, which previous studies did not include, was
that individuals do indeed leave teaching, but often return at a later time in another school district. Shavelson and Trinchero (1974) had
described a three-stage survival rate in which the turnover decelerated but continued in years three through five. This study showed that not only did turnover slow down in the years three through five, but that the trend in year four was actually an increase in numbers as more beginning teachers returned to the classroom after a year or more absence. It is possible that had the four other studies followed

122
individual teachers' career paths as this study did, the rates of survival in all studies would have been even more similar.
A sixth point of discussion is that Montana State University teacher-education graduates who dropped out of teaching during the study primarily did so for personal rather than environmental-based reasons. Holland (1973) offered three reasons why a teacher, or any other worker, would enter and then leave a career field. The first two reasons, career moves motivated by changes in adult developmental stage and by discovery that the career field was not what was expected prior to entry, were largely personal or intrinsically motivated reasons. The third reason, changes in the work environment itself, was largely
beyond the control of the worker and hence environmentally- or extrinsically-based. A review of the reasons offered by Montana State University teacher-education graduates in this study shows a total of 85 reasons given by graduates for leaving teaching. Of that number, 72 reasons, or 84.7 percent, were intrinsic in nature as defined in
Chapter 2 using the Harris et al. (1985) model.Seventh, a degree in teacher-education is good preparation for
entry not only into the education profession, but also into the world of work in general. Weaver (1978) had concluded that teacher-education
was very "narrow" and had little application to other possible career fields. Harris et al. (1985) presented evidence that contradicted Weaver's conclusions. This study shows only 1.8 percent of the
teacher-education graduates in the class of 1979 were unemployed in the
fall of 1984. This percentage is well below both the national and
regional unemployment rates. Graduates were employed in a wide variety

123
of occupations. Of particular interest were the 54.4 percent who were employed either as teachers or other professionals. This researcher also thinks the 25.5 percent of the study population who listed housewife as their career field in the fall of 1984 is a misleading result. The national trend is toward both husband and wife being employed. Many of these women in the years to come will be found in career fields outside the home; many are likely to be employed in teaching.
A final point of discussion is that Montana State University teacher-education graduates, especially those who teach, tend to continue to reside in or near Montana following their graduation. Education has been promoted at Montana State University as one career field which would allow people to remain in Montana. This assertion appears to have merit. In the fall of 1984, 68.4 percent of all
members of the class who were teaching were teaching in Montana. Also, 91.6 percent of all teacher-education graduates teaching in the fall pf 1984 were teaching either in Montana or the eight nearby states of
Alaska, Washington, Oregon, Idaho, North Dakota, South Dakota, Wyoming, and Colorado. That not everyone was employed in Montana and the nearby states is an indication that teacher-education graduates do have the
opportunity to teach in a wide variety of geographic locations.
Implications of the Data
The focus of this chapter now shifts to two major implications which the researcher has drawn from the information presented in Chapter 2, the data presented in Chapter 4, and the conclusions stated

in the preceding section of this chapter. The first implication concerns teacher retention. One of the final articles which the researcher reviewed prior to actually beginning to write this dissertation was one by Chapman (1984) in which he offered a tentative model of career choice based on his own research and thinking. Chapman’s model is presented in Figure I. The model is based on Krumbolt’s social learning theory which maintained the interaction of genetic factors, environmental factors, learning experiences, cognitive and affective responses, and performance skills caused individuals to move in their career choices from one career path to another. This researcher has concluded that discrete personal characteristics such as the ones tested in this study by themselves do not determine the career choice which an individual makes, but they do contribute in some way. This
researcher has also concluded that the process of career choice is an
individual one, varying from one individual to another and influenced by the interaction among personal characteristics, personal lifetime
experiences, and environmental factors present in the work environment itself.
Figure I, taken from Chapman’s model, visually presents how the process of career choice may occur. In the first stage of the process
are personal characteristics, educational preparation, and the individ
ual's initial commitment to teaching as a career. The researcher has grouped and labeled the first stage factors as "pre-employment vari
ables." These factors are personal traits and experiences which characterize each individual prior to beginning his/her career. The second stage includes factors which this researcher has labeled "lifetime
124

125
- PRE--MP LOIHEBT VARIABLES -
I4Personal
Characteristics
Educational Preparation- Adequacy of teacher prepared program
- Student performance in program
- Amount of education
Initial Commitment . to Teaching
4 4- U F m m EEPESIEECES -
(Intrinsic and Eztrinsic Factors)Z =4Quality of First
Employment Experience4External Influences
- Employment climate- Alternative employment opportunities
Integration into Teaching- Social integration- Professional integration- Values- Skills and abilities- Accomplishments
«=5--------- *
± 4 tI—IIL- INDIVIDUAL FILTERING PROCESS -
HCareer Satisfaction
CI
- CAREER DECISION -
~ T ~□
Remain In or Leave Teaching
Figure I. A modified figure of Chapman’s Model of the Influences Associated with Teacher Attrition.0
[♦Model taken from Chapman [1984, p. 274] and adapted for this study.]

126
experiences" and which are events that occur in an individual's life after s/he begins a career. These events are both intrinsic and
extrinsic in nature. All stage one and two characteristics and experiences are then filtered through each person's "individual filtering p r o c e s s I n the end, each person makes a decision to remain
in or to leave teaching based on personal characteristics and experiences peculiar to that individual. It is reasonable to assume that a process much like this would occur in every worker's career path.
The thrust of this implication is that an individual teacher- education graduate's career path is influenced by largely similar personal characteristics and experiences; however, just what career
decision s/he makes is unique and dependent on the individual's own
filtering system. For example, each person who teaches in School District Number Two in Billings, Montana is paid according to the same salary schedule. For some the salary will be adequate. Others will leave the district, citing low pay as a major reason for leaving. It
is the interaction of personal characteristics, educational preparation, commitment to teaching, quality of first employment experience, integration into teaching, and the external influences one encounters that come together at a given time to cause one group to leave teaching
and the other group to sign happily another teaching contract.This first implication has ramifications that extend beyond the
individual teacher-education graduate and his/her career choice.
Universities such as Montana State University must be certain to refrain from using pre-employment variables as the sole predictors of which students are likely to teach. There have been instances when

127teacher-educators have screened individuals seeking admission into teacher-education programs based on selected demographic and personal characteristics. This has been particularly true in times of national surpluses or shortages of teachers. While colleges of education and universities may want to take these pre-employment variables into
account in their decisions about educating potential teachers, this research shows that they should not use personal characteristics to screen candidates either into or out of their programs.
Likewise, hiring officials should avoid using these personal and demographic characteristics in their hiring decisions. Clearly this study has found that age, gender, and the other bits of information
that school districts gather as a matter of course about candidates for employment do not aid appreciably in the prediction of either success or survival. Again, these facts can add depth to the picture, but they are not valid predictors by themselves.
The second implication concerns the rate of survival in teaching among males and females in the T980s. It was concluded in the preceding section of this chapter that the survival rates among teachers in four other survival studies were not significantly different from the
rate in this study. It was also concluded previously that the survival
rates in the studies would have been even more similar had the studies all followed teacher turnover by following teachers' career paths rather than by studying school district turnover rates. Mark and
Anderson (1985) had noted the survival rate of women in their more recent study had changed from the rates for women found in earlier studies by Whitener (1965), Charters (1970), and Shavelson and.
I

128Trinchero (197*0* It has been speculated in the literature that for many reasons the career patterns of women would become more like male career patterns in the 1980s and beyond. This study does not entirely support these speculations.
Table 53 is a service table showing the survival rate for the male members of the study population who taught in the fall of 1979* Table 54 is a service table showing the survival rate for female members of
Table 53 * Service table depicting information on survival for males found by Steadman.
Length of Service (Years)
No. Surviving at End of Year
No. Leaving from Prior Year
PercentLeaving
Cum. Percent Surviving
0 42 0 0 100.0I 36 -6 -14.3 84.32 32 -4 -11.1 74.03 28 -4 -12.5 55*14 32 +4 +14.3 65.45 30 -2 - 6.3 63*0
Table 54. Service table depicting information found by Steadman.
on survival for females
Length ofService No. Surviving No..Leaving Percent Cum. Percent(Years) at End of Year from Prior Year Leaving Surviving
0 85 0 0 100.0I 71 -14 -16.5 83.52 62 - 9 -12.7 72.93 42 -20 -32.3 49*44 51 + 9 +21.4 60.05 50 - I - 2.0 58.8

129the study population who taught in the fall of 1979. Table 55 is a Chi Square Goodness of Fit table comparing the survival rates of men and wpmen in the study population who taught in the fall of 1979-
Table 55. Chi Square Table: Rates of survival for female teacher-education graduates of Montana State University in 1979 and for male teacher-education graduates in 1979 by year.
Group Year I Year 2 Year 3 Year 4 Year 568.0 59-8 44.5 52.8 50.9
Females 71 62 42 51 5039.0 34.2 25.5 30.2 29.1
Males 36 32 28 32 30
Level ofChi Square D.F. Significance
1.1761 4 .8818
As Table 55 shows, the survival rate of men in the Montana State University teacher-education class of 1979 does not depart signifi
cantly from the rate of women. Figure 2 plots the survival rates of men and women during the study period. The rates are similar, running almost identically. In this regard, what had been predicted in the
literature is supported by this study.On the other hand, there are differences in the reasons both sexes
in this study gave for leaving teaching. Benton (1985), Mark and
Anderson (1985), and others said women in the job market would be subject to the same influences in their career decisions; and yet, the reasons offered by the women in this study tended to be gender

130specific. Table 56 lists in descending order the five reasons given by men and women in this study for leaving teaching. Three of the top five reasons given by women as their primary reasons for leaving
teaching are gender-specific. This trend, coupled with the fact that 21 of the 94 women not teaching in the fall of 1984 gave their occupation as "housewife," would indicate that women in the Montana State University 1979 class of teacher-education graduates are still bound by traditional roles and expectations on their career decisions. This differs from the trends forecasted and found in other more recent studies.
PercentMale SurvivalFemale Survival
- Year -
Figure 2. Yearly percent of male and female teacher-education graduates of Montana State University in 1979 surviving by year.

131
Table 56. Reasons given most often by male and female teacher- education graduates for leaving teaching in order of frequency.
PercentReasons Given for Leaving Teaching Giving
Female:(1) Moved to better geographic locale 12.3(2) Moved due to transfer of spouse 12.3(3) Marriage 10.7(4) Birth of child 10.7(5) Disliked teaching as a career 10.7Male:(1) Returning to college 35.0(2) Restricted promotion opportunity 15.0(3) RIFed 10.0(it) Fired 10.0(5) [Six reasons tied for fifth place]
Recommendations
Chapter 5 now concludes with eight recommendations for further study. First, a study should be conducted comparing the rates of turnover among teachers and other professionals. Teaching long has
endured the reputation of a career field with a higher turnover rate than other professions. Benton (1985) found the actual rate of turnover among teachers in her sample was lower than the turnover rates
for accountants, engineers, computer scientists, and social workers. Wendling and Woodbury (1984) have contended teachers were less mobile than most other college graduates. It would be of value to know if
teaching is as subject to turnover as its reputation suggests.

132Second, a study should be conducted comparing the reasons teachers
and other college-trained workers give for changing career fields.
Holland (1973) theorized that all workers leave one career field for another for essentially the same reasons. It would be of value to know how similar or dissimilar individual motivations to change careers are, especially in relation to individuals in teaching. For example, a research study which followed graduating seniors in teacher-education and other graduates of professional university-level programs such as engineering, accounting, and nursing over a period of five years would be of value. Such a comparative study could help to establish the reasons that members of each group give for leaving their positions.
The reasons could then be compared and contrasted.
Third, studies should be conducted on the career patterns of midcareer and older teachers. The research in the areas of retention and teacher survival concentrates almost exclusively on beginning teachers. As the number of young people entering teacher-education declines, these questions take on added significance. At what rate do mid-career
and older teachers leave teaching? What reasons do they give for leaving? What do they do if they leave teaching? What effect will
their career choices have on the supply of teachers?Fourth, further studies should be conducted on the rate at which
women teacher-education graduates are entering and leaving teaching. Women have always constituted the majority of teachers. Recent studies
have speculated that with more career opportunities available to women and with changing societal expectations about acceptable careers for women, a smaller percentage of women would be initially attracted to

133teaching as a career. This study did not find this trend necessarily to be the case. More research is needed with other populations of
female teacher-education graduates.
Fifth, as more is learned in the newly emerging field of adult development, further studies on teacher turnover should be conducted, attempting to clarify the role adult development plays in turnover. That adults do pass through developmental stages is likely. How these stages interact with career patterns of teachers and other workers is
unclear.Sixth, studies should be conducted on the effect school-related,
environmental factors have on teacher turnover. Most researchers
believe, and this study would seem to support that belief, that school- related factors play a decidedly minor role in the career decisions of
teachers. Yet, they do play some role, and this role has not been
adequately researched. What effect, if any, do school size, faculty
size, level of integration within the school, student attitudes, student discipline, relationship with colleagues and supervisors, and
income level of both the school and the school district have on
teachers’ career patterns?Seventh, studies should be conducted in the whole area of job
satisfaction. Mobley et al. (1979) concluded that as much as any
variable related to teacher turnover, job satisfaction plays a vital role in a worker's career choice; and yet, the results of studies to date are contradictory and confusing. For example, a longitudinal research study could be conducted which would measure levels of satisfaction for all individuals in a group of teacher-education

graduates over a period of five years. At the conclusion of the study, subjects would be placed in categories according to the career choices they had made, much like this study did. The levels of satisfaction could then be compared statistically to ascertain whether members of one category are more or less satisfied with their career choices than
members of the other categories.Finally, retention studies should be conducted using Chapman's
model as the focus. Rather than centering on one concept or phase in the turnover process, studies should be done in which individual teacher-education graduates are followed over at least five years. Information should be gathered about personal characteristics, educa
tional preparation, initial commitment to teaching, quality of first employment experience, external influences, and integration into teaching for each subject. In some way all this information should be
studied together to establish the effect that all parts of the process have on the ultimate decision to teach, drop out, or never teach.
134

REFERENCES CITED

(
136
REFERENCES CITED
Abramowitz, S.J. The Effects of Mini-School Size on the Organization and Management of Instruction. Washington, D.C.: Rand Corporation, 1976.
Anastasiow, Nicholas. "Assimilation and Contrast Effects in Principals' Ratings of Teachers." Psychological Reports 18 (1966): 255- 258.
Barr, A.S. The Measurement and Prediction of Teacher Effectiveness. Milwaukee, WI: Dunbar Publishing Co., 1961.
Beery, John R. "Does Professional Preparation Make a Difference?" Journal of Teacher Education 13 (Dec. 1962): 386-395.
Belok, Michael W. "Teacher Freedom— How Much?" Journal of Teacher Education 16 (Dec. 1965): 450-452.
Benton, Cynthia. Predicting Occupational Persistence: A Comparison of Teachers and Five Other Occupational Groups. Los Angeles, CA: ERIC Document Reproduction Service, ED 255 522, 1985.
Blaser, J.W. "Factors Contributing to the Problems of Men Graduates from the University of Idaho (1951-1960) Leaving the Teaching Profession." Ed.D. dissertation, University of Idaho, 1965.
Bloland, Paul and Thomas T. Selby. "Factors Associated with Career Change Among Secondary Teachers: A Review of the Literature." Education Research Quarterly 5 (Fall 1980): 13-24.
Bredeson, Paul V., Marvin J. Fruth, and Katherine L. Kasten. "Organizational Incentives and Secondary School Teaching." Journal of Research and Development in Education 16 (Summer 1983): 52-58.
Bridge, Jacque, Claude Cunningham, and Janet Forsbach. "Faculty Stability and Effective Schools." NAASP Bulletin 62 (April 1978): 36-41.
Browning, C.C. "How to Tackle the Problem of Teacher Turnover." School Management 7 (June 1963): 80-82.
Byers, Joe. "The Prediction of Commitment to the Teaching Profession." East Lansing, MI: ERIC Document Reproduction Service, ED 251 452,1984.

137Chapman, David W. "Teacher Retention: A Model." American Educational
Research Journal 21 (Fall 1984): 645-658.Chapman, David W. and Michael S. Green. "Teacher Retention: A Further
Examination." Journal of Educational Research 79 (May/June 1986): 273-279.
Chapman, David W. and Sigrid A. Hutcheson. "Attrition from Teaching Careers: A Discriminant Analysis." American Educational Research Journal 19 (Spring 1982): 93-105.
Charters, W.W. "Survival in the Profession: A Criteria for Selecting Teacher. Trainees." Journal of Teacher Education 7 (1956): 251- 254.
Charters, W.W. "Some Factors Affecting Teacher Survival in School Districts." American Educational Research Journal 7 (Jan. 1970): 1-27.
Chicon, D.J. and R.H. Koff. "Stress in Teaching.” NAASP Bulletin 64 (1980): 91-104.
Chussil, Yale. "Teacher-Administrator Relations: A Continuing Hiatus." The Clearing House 45 (March 1971): 387-391-
Clayton, W. Donald and Edward S. Wilson. "Non-Returning First-Year Teachers: A Profile." East Lansing, MI: ERIC Document Reproduction Service, ED 258 329, 1984.
Corwin, Ronald G. A Sociology of Education: Emerging Patterns ofClass, Status, and Power in the Public Schools. New York, NY: Appleton-Century-Croft, 1965.
Darling-Hammond, Linda. "Beyond the Commission Reports: The Coming Crisis in Teaching." Santa Monica, CA: ERIC Document Reproduction Service, ED 248 245, 1984.
Dillman, Beryl R. "Teacher Activities and Professional Growth asPerceived by Physicians, Lawyers, Clergymen, and Educators." Journal of Teacher Education 15 (Dec. 1964): 386-392.
Dworkin, Anthony G. "The Changing Demography of Public School Teachers: Some Implications for Faculty Turnover in Urban Areas." Sociology of Education 53 (April 1980): 65-73*
Eberts, Randall W. "Profile of Teacher Turnover in New York State School Districts: 1972-1977: Final Report, Paper 1." Eugene, OR:ERIC Document Reproduction Service, ED 239 408, 1982.
Ellis, Joseph, Sherman Frey, and Michael Thompson. "A Statistical Analysis of Education Dropout in Illinois Public Schools." Illinois School Research and Development 18 (Winter 1982): 32-40.

138
Evans, K.M. "The Minnesota Teacher Attitude Inventory." Educational Research 8 (1965-1966): 134-141.
Feldvebel, Alexander M. "Correlates of Alienation." Illinois School Research 5, no. 3 (1968): 30-36.
Fishel, Andrew P . and Janice Pottker. "Women Lose Out: Is There SexDiscrimination in School Administration?” The Clearing House 47 (March 1973): 387-390.
Getzels, Jacob W. and Philip W. Jackson. Creativity and Intelligence: Explorations with Gifted Students. New York: John Wiley andSons, 1971.
Gold, Frank S. "Bus Watching and Professionalism?" The Clearing House 37 (Nov. 1962): 173-174.
Gosnell, John W. "The Relationship Between Work Experience and Occupational Aspiration and Attrition from Teaching." The Clearing House 51 (1977): 176-179.
Grimsley, Glen and Hilton Jarrett. "The Relation of Past Managerial Achievement to Test Measures Obtained in the Employment Situation: Methodology and Results— II.". Personnel Psychology 28 (Summer1975) : 215-231.
Hahn, Robert D . "Creative Teachers: Encouraged or Discouraged?" The Clearing House 43 (Nov. 1968): 150-153«
Hage, Jerald. "An Axiomatic Theory of Organizations." Administrative Science Quarterly 16 (Dec. 1965): 289-320.
Harnischfeger, Annegrat. "Personal and Institutional Characteristics Affecting Teacher Mobility: Schools Do Make a Difference."Stanford, CA: ERIC Document Reproduction Service, ED: 303 245,1975.
Harris, Louis, Michael Kagay, and Stuart Leichenko. Former Teachers in America. New York, NY: Metropolitan Life Insurance Co., 1985.
Hawks, D.L. "Absenteeism and Turnover." Personnel Journal 55 (Jan.1976) : 293-303.
Hefferly, Ronald C. "Factors Affecting Teacher Turnover in Kansas." Ed.D. dissertation, University of Kansas, 1983.
Erickson, Edsel L., George W. Jacobs, Judith J. Johansen, and StanleyRobin. "Teacher Mobility, Teacher Dropout, and the Expectationsof Family and Friends." Kalamazoo, MI: ERIC Document Reproduction Service, ED 021 785, 1968.

139Herbert, N. and G.H. Turnbull. "Personality Factors and Effective
Progress in Teaching." Educational Research 16 (1963): 24-31.Herzberg, Frederick. Job Attitudes: A Review of Research and Opinion.
Pittsburgh, PA: Psychological Service of Pittsburgh, 1957.Hinrich, John R . Controlling Absenteeism and Turnover. New York, NY:
Work in America Institute, 1980.Hogan, Robert. ”Review of the Allport-Vernon Study of Values." In:
The Seventh Mental Measurement Yearbook. Ed. Oscar K . Buros. Highland Park, NJ: The Gryphon Press, 1972.
Holland, John. Psychology of Vocational Choice. Waltham, MA:Blaisdell Publishing Co., 1966.
Hoppock, Robert. College Placement Council Seminars, Pacific Grove, CA. Speech, Summer 1978.
Huling-Austin, Leslie. "Teacher Induction Programs: What Is and Isn’tReasonable to Expect." R and D Review 3 (Fall 1985): 3-15.
Huling-Austin, Leslie.' "Factors to Consider in Alternative Certification Programs: What Can Be Learned from Teacher InductionResearch?" Action in Teacher Education 8 (Summer 1986): 51-58.
Hundleby, John D. "Review of the Allport-Vernon Study of Values." In: The Sixth Mental Measurement Yearbook. Ed. Oscar K. Buros. Highland Park, NJ: The Gryphon Press, 1965.
Justiz, Thomas B. "A Reliable Measure of Teacher Effectiveness." Educational Leadership 27 (Oct. 1969): 49-55.
Kerr, H. Donna. "Teacher Competence and Teacher Education in the United States." Teachers College Record 84 (Spring 1983): 525- 552.
Kleinert, Jack. "Teacher Turnover in the Affluent School District." The Clearing House 42 (Jan. 1968): 297-299«
Koehler, Virginia. "A Research Base for the Content of Teacher Education." In: Essential Knowledge for Beginning Educators. Ed.David Smith. Washington, D.C.: American Association of Collegesfor Teacher Education, 1983.
Lashier, William S. and Wan Yung Woo. "A Longitudinal Study of the Supply and Demand for Physics and Chemistry Teachers in Kansas." Journal of Research in Science Teaching 21 (Jan. 1984): 17-26.

140Lasley, Thomas J. "Expectations for the Environments of Teacher Educa
tion." In: The Dynamics of Change in Teacher Education: Volume I: Background Papers from the National Commission for Excellence in Teacher Education. Ed. David Smith. Washington, D.C.: AmericanAssociation of Colleges for Teacher Education, 1986.
Levine, Harry, Thomas L. Hilton, and Gloria F. Leidermann. "Studies of Teacher Behavior." Journal of Experimental Education 26 (Sept. 1957): 81-91.
Lortie, Dan C . Schoolteacher: A Sociological Study. Chicago, IL:University of Chicago Press, 1975.
Lyson, Thomas A. and William A. Falk. "Recruitment to School Teaching: The Relationship Between High School Plans and Early Adult Attainments." American Educational Research Journal 21 (Spring 1984): 181-193.
Mark, Jonathan H. and Barry D . Anderson. "Teacher Survival Rates in St. Louis, 1969-1982." American Educational Research Journal 22 (Fall 1985): 413-421.
Marsh, J.E. and E.W. Wilder. "Identifying the Effective Instructor: A Review of Quantitative Studies, 1900-1952." Research Bulletin TR54-44. Lackland Air Force Base, TX, United States Air Force, 1954.
Mason, Ward S. "The Beginning Teacher, Status, and Career Orientation: Final Report on the Survey of New Teachers in the Public Schools, 1956-1957." Washington, D.C.: United States Government PrintingOffice, 1961.
McElroy, Lee A., Jr. "Teacher Absenteeism and Teacher Turnover in the Secondary Public School." Ed.D. dissertation, University of Houston, 1984.
Mobley, W.H., R.W. Griffith, H.H. Hand, and B.M. Meglino. "Review and Conceptual Analysis of the Employee Turnover Process." Psychological Bulletin 86 (May 1979): 493-522.
Mueller, Doris L. "Where the Graduates Are." St. Louis, MO: ERICDocument Reproduction Service, ED 115 631» 1975.
Murname, Richard. "Teacher Mobility Revisited." Journal of Human Resources 16 (Jan. 1981): 3-19.
Musemeche, Richard and Sam Adams. "The Coming Teacher Shortage." Phi Delta Kappan 59 (June 1978): 691-693-

141National Education Association. Teacher Supply and Demand in Public
Schools , 1976. Research Memo 1977-3• Washington, D.C.: NationalEducation Association, 1977•
National Education Association. Concepts. Strategies, and Priorities for Research in Educational Manpower: A Symposium on Educational Manpower. Washington, D.C.: ERIC Document Reproduction Service, ED 013 778, 1967.
National Education Association. Some Whys and Wherefores of Teacher Turnover. Research Memo 1960-24. Washington, D.C.: NationalEducation Association, I960.
Noble, A. Candace. "Some New Perspectives on Rural Education." The Rural Educator 3 (Winter 1980/81): 10-14.
Oaklander, Harold. "Some Unanticipated Effects of Advanced Education on a Critical Professional Manpower Resource, the Inservice Teacher." New York, NY: ERIC Document Reproduction Service, ED 044350, 1969.
Olstad, Roger G. and Jack L. Beal. "The Sciences and Mathematics Teacher Shortage: A Study of Recent Graduates." Science Education 68 (July 1984): 397-402.
Ornstien, Allan C. and Daniel U. Levine. "Teacher Behavior Research: Overview and Outlook." Phi Delta Kappan 62 (April 1981): 592-596.
Owumanam, Donatus 0. "Providing for Job Tenure, Job Satisfaction, and Productivity in Teachers." Adolescence 19 (Spring 1984): 221-224.
Pederson, K . George. "Economic and Sociological Correlates of Teacher Turnover." East Lansing, MI: ERIC Document Reproduction Service,ED 038 334, 1970.
Popham, W. James. "Teaching Skill Under Scrutiny." Phi Delta Kappan 52 (1971): 599-602.
Popham, W. James and Robert Trimble. "The Minnesota Teacher Attitude Inventory as an Index of General Teaching Competence." Educational and Psychological Measurement 20 (Autumn I960): 509-512.
Porter, L.W. and R.M. Steers. "Organization, Work, and Personal Factors in Employee Turnover and Absenteeism." Psychological Bulletin 80 (1973): 151-176.
Pratt, David. "Predicting Teacher Survival." Journal of Educational Research 7 (Sept./Oct. 1977): 12-18.
Price, J.L. The Study of Turnover. Ames, IA: Iowa State UniversityPress, 1977.
Quirk, Thomas J., Barbara Witten, and Susan Weinberg. "Review of Studies of the Concurrent and Predictive Validity of the National Teachers Examinations.n Review of Educational Research 43 (Winter
Rabinowitz, William and Kay Crawford. nA Study of Teachers* Careers." The School Review 68 (Winter I960): 377-399.
Radcliffe, John A. "A Review of the Allport-Vernon-Lindzey Study of Values." In: The Sixth Mental Measurement Yearbook. Ed. Oscar K. Buros. Highland Park, NJ: The Gryphon Press, 1965.
Robinson, Willis. "A Validity Study of the Testing Program for Selection of Students for Teacher Education." Ph.D. dissertation. Purdue University, 1962.
Rosenholtz, Susan and Mark A. Smylie. "Teacher Compensation and Career Ladders." The Elementary School Journal 85 (Nov. 1984): 149-166.
Rosser, R.S. and J.J. Denton. "Assessing Recent Teacher Education Graduates Using a Two-Scaled Instrument." Education Q8 (Fall1977): 97-104. ---------
Ryans, David G. Characteristics of Teachers. Milwaukee, WI: George ‘Banta Co., Inc., I960.
Schlechty, Phillip C. and Victor Vance. "Do Academically Able Teachers Leave Education? The North Carolina Case." Phi Delta Kacnan 6% (Oct. 1981): 106-112.
Schwartz, Henrietta. "Recruitment, Selection, Retention, and Graduation of Teacher Education Candidates." In: The Dynamics ofChange in Teacher Education: Volume I: Background Papers fromNational Commission for Excellence in Teacher Education. Ed. Thomas Lasley. Washington, D.C.: American Association ofColleges for Teacher Education, 1986.
Sharp, M.M. Education and Employment: The Earlv Careers of College Graduates♦ Baltimore, MD: Johns Hopkins Press, 1970.
Shavelson, Richard J. and Robert L. Trinchero. "Survival in the Field of Education After Intern Training: The Training Institution’s Perspective." California Journal of Educational Research 25 (1974): 161-179. ------------ "—
Shavelson, Richard J. and Robert L. Trinchero. "Teacher Survival from the Perspective of the Training Institution." Palo Alto, CA: ERIC Document Reproduction Service, ED 083 179, 1973.

Silverman, Martin J. "Principals: What Are They Doing to TeacherMorale?" Educational Administration and Supervision 43 (April1957): 204-210.
Start, K.B. "The Relation of Teaching Ability to Measures of Personality." British Journal of Educational Psychology 36 (1966): 158- 165.
Super, Donald E . and Douglas T. Hall. "Career Development: Exploration and Planning." Annual Review of Psychology 29 (1978): 333-372.
Suvak, Albert. "Preliminary Long-Term Report on Montana State University Freshmen." Bozeman, MT: Montana State University TestingService, 1982.
Swift, Doug. "Finding and Keeping Teachers: Strategies for SmallSchools." Las Cruces, MM: ERIC Document Reproduction Service,ED 259 875, 1984.
Sykes, Gary. "Teacher Preparation and the Teacher Workforce: Problems and Prospects for the 80s." American Education 19 (March 1983): 23-30.
Taft, Ronald. "Judgement and Judging in Person Cognition." In: Perceptions in Personality Research. Ed. H.P. David and J.C. Brengelman. New York, NY: Springer Co., I960.
Tarpey, Sister M. Simeon. "Personality Factors in Teacher Trainee Selection." British Journal of Educational Psychology 35 (1965): 140-149.
Thorndike, R.L. and E.W. Hagen. "Characteristics of Men Who Remained In and Who Left Teaching." New York, NY: ERIC Document Reproduction Service, ED 002 902, I960.
Vroom, Victor H. Work and Motivation. New York, NY: John Wiley andSons, Inc., 1964.
Wannous, John and Edward E. Lawler, III. "Measurement and Meaning of Job Satisfaction." Journal of Applied Psychology 56 (1972): 95- 105.
Waters, L.K. and Darrell Roach. "Relationship Between Job Satisfaction , Attitudes, and Two Forms of Withdrawal from the Work Situation." Journal of Applied Psychology 55 (Feb. 1971): 92-94.
Weaver, W. Timothy. "In Search of Quality: The Need for Talent in Teaching." Phi Delta Kappan 61 (Sept. 1979): 29-32.
Weaver, W. Timothy. "Education in Supply and Demand: Effects onQuality." School Review 86 (Aug. 1978): 552-593*

m
Webster's New World Dictionary of the American Language: CollegeEdition. Cleveland, OH: The World Publishing Co., 1982.
Wendling, Wayne R. and Stephen A. Woodbury. The Future Labor Market for Teachers: Quantities. Aptitudes, and Retention of StudentsChoosing Teaching Careers. Kalamazoo, MI: W.E. Upjohn Institutefor Employment Research, 1984.
Whitener, Joy E. "An Actuarial Approach to Teacher Turnover." Ph.D. dissertation, Washington University, 1965.
Wood, C.L. "The Principal and Faculty Morale." Journal of Secondary Education 43 (1968): 353-358.
Wright, Robert J. "The Affective and Cognitive Consequences of an Open Education Elementary School." American Education Research Journal 12 (1975): 449-468.
Yuskiewicz, Vincent D . and William S. Donaldson. "Job Satisfaction of the Public School Teacher: A Function of Subculture Consensus with Respect to Pupil Control Ideology." Chicago, IL: ERIC DocumentReproduction Service, ED 061 178, 1972.
Webb, L. Dean and Arlene Metha. "Educational Program Quality andSchool District Size." Texas Journal of Education 10 (Winter1983): 21-28.

APPENDICES

146
APPENDIX A
PRE-EMPLOYMENT QUESTIONNAIRE

U 7
PBE-MPLomEm1. QOESHOraMBB
(1) Name____________________________ , ________________________(first) (middle) (maiden) (last)
(2) Permanent address____________________________________________
What is your present age?[ ] 20 to 24[ ] 25 to 29[ ] 30 to 34[ 3 35 to 39[ 3 40 or over
(4) Check the size of the community in which you spent the first ten years of your life.
[ ] Metropolitan area (over 100,000 people)[ ] Large town (20,000 to 99,999 people)[ ] Small town (1 ,000 to .19,999 people)[ ] Rural area (less than 1,000 people)[ ] No fixed location (moved from one size community to
another during the first ten years of life)(5) What is the income bracket of your family? (This refers to parents
or guardians rather than spouse if married. IF BOTH PARENTS WORK, PLEASE LIST COMBINED INCOME.)
[ ] $ 8,000 per year income or less[ ] $ 8,001 to $12,000 per year income[ ] $12,001 to $15,500 per year income[ ] $15,501 to $20,000 per year income[ ] $20,001 per year income or more
(6) What job does the primary breadwinner in your family normally perform? (This refers to parents or guardians rather than spouse if married.)
(7) When did you decide to enter a teacher education program which would lead toward your being certifiable to teach?
[ ] During elementary school [ ] During junior high school (grades 7-9)[ ] During high school (grades 10-12)[ ] During the first two years of college [ ] During the final two years of college [ ] At some other time (please specify)

148
(8) How would you describe your present attitude toward entering the teaching profession?
[ ] Finding a teaching position is my first priority.[ ] I have no plans to teach in the foreseeable future.C ] I will teach if I can find a position that suits my
interests and needs.[ 3 I am restricted to one geographic location because ______[ ] I do not plan to teach next year but will teach at some
future time.C ] Other attitude (please specify) _________________________
(9) In what activities did you participate during high school?[ ] Speech and drama (please specify).____ ;___________[ ] Athletics (please specify)C ] Student government (please specify)[ ] Social organizations such as Demolay or Rainbow (please
specify) ________________________________________________[ ] Service organizations such as Key Club (please specify)[ ] Music (please specify)t ] Media such as newspaper, radio, TV or the like (please
specify) ________________________________________________(10) In what activities did you participate during college?
[ ] Speech and drama (please specify) _______________________
[ ] Athletics (please specify)[ ] Student government (please specify)[ ] Social organizations such as Greek organizations (please
specify) ________________________________________:________[ ] Service organizations such as Key Club (please specify)
[ 3 Music (please specify)[ 3 Media such as newspaper, radio, TV or the like (please
specify) ________________________________________________
APPENDIX B
YEARLY QUESTIONNAIRES AND COVER LETTER

150
Testing Center Montana State University Bozeman, Montana 59717September 1, 1981
Dear_______________ :Last year at about this time, you may remember receiving a letter
and accompanying questionnaire similar to the one enclosed. That was the first yearly followup of the teacher education graduates in MSU's class of 1979. Ninety-seven percent of your classmates were kind enough to take a few minutes out of their busy days to answer the three short questions on the questionnaire. Again this year I am asking you and your fellow graduates to complete a brief survey on your occupational decisions in the last twelve months. It remains my intention to follow your class over a five-year period following graduation to gain information concerning the number of people who teach during the period, the reasons people leave teaching, and the kinds of occupations available to graduates outside of teaching.
Would you please complete the enclosed, brief questionnaire and return it to the University Testing Center in the postage-paid envelope provided? Your response to this and subsequent yearly questionnaires will only take a few minutes of your time, but is essential to the completion of the study.
I was very pleased to receive personal notes from so many of you during last year's return. You all seem to be "doing your own thing." I continue to spend my winters working at an international school in Dhahran, Saudi Arabia, and my summers in Montana. It is surprising how small the world is and how much more the peoples of the world are alike than different. I look forward to receiving this year's questionnaire from you and hope that the next twelve months are good ones for you.
Sincerely yours,
Richard J. Steadman
Enclosure

151
QtiraSTOmflIBEDIRECTIONS; Please answer each question on the survey. Your response
will be kept confidential. This form has been coded so that your signature is not necessary.
(I) In September o f _____the _____yearly followup questionnaire indicated your occupational choice at that time was:______________________________ in _________________________________
(job) (city) (state)
(2) Please list below the job(s) and the geographic location(s) that you have held since the occupation listed above. Please list your present position and geographic location first.
Present Position _____________________ __________________________(job) (city) (state)
Other Position(s)_____________________ __________________________(job) (city) (state)
(job) (city) (state)
(3) If you have changed jobs and/or geographic locations since thefall of ____ (listed above in #1), please indicate your reason(s)for changing by placing a checkmark in the box before the reason(s). If you check more than one reason, please place an N beside the box representing the most important of your reasons for changing.[ ] a. Returning to school for further training[ ] b. Marriage[ ] c . Increased family responsibility[ 3 d. Personal illness or illness or death of immediate family
member[ ] e. Childbirth[ ] f. Inadequate salary in former position[ ] g. Found that you disliked the occupational field[ ] h. Lack of advancement opportunity[ ] i. Moved within career field from one employer to another
because of:- movement to a larger organization- movement to a more desirable geographic location
[ ] j. Other reason(s) (please specify) _______________________