Embed Size (px)
Citation preview

Perceived professional development strengths and weaknesses among Montana agricultural educationand family and consumer science educatorsby James Carl Hafer
A thesis submitted in partial fulfillment of the requirements for the degree of Master of Science inAgricultural EducationMontana State University© Copyright by James Carl Hafer (2002)
Abstract:The purpose of this study was to determine the perceptions of agricultural education and family andconsumer science teachers toward twenty professional development-related categories in Montanaduring 1996 - 1997. This research used a descriptive study approach to identify perceived professionaldevelopment strengths and weaknesses of Montana Agricultural Education and Family and ConsumerScience teachers. Each Agricultural Education and Family and Consumer Science teacher was sent amailed survey to complete and return to the researcher.
A survey entitled “Professional Development Survey” was administered to 180 Montana AgriculturalEducation and Family and Consumer Science teachers, who appeared in the statewide directories forthe respective groups of teachers. The professional development survey instrument adapted for thisstudy was originally developed by the Human Resource Development (HRD) program at theWestinghouse Waste Isolation Division in Carlsbad, New Mexico.
A final response rate of 57.7% was obtained. Anonymity was protected throughout the course of thestudy. Professional development categories examined in this study were divided into twenty categories:Quality of Work, Quantity of Work, Job Knowledge, Related Work Knowledge, Judgment, Initiative,Dependability, Analytical Ability, Adaptability to Work Assignments, Ability to Work Under Pressure,Creativity, Planning and Organization, Communication Skills, Interpersonal Skills, Leadership, CostConsciousness, Personal Safety and Housekeeping, Supervision Level, Attendance and Punctuality,and Conflict Resolution.
Results of the study show when grouped by teaching profession, some of the professional developmentcategories significantly differed between the two vocational educator groups. When grouped by yearsof experience, results also showed that some of the professional development categories significantlydiffered among years of experience category subgroups. Descriptive statistics used in this studyindicated the perceived strengths and weaknesses between Montana Family and Consumer Science andAgricultural Educators, as to the twenty categorical areas of professional development, found in thesurvey instrument.
It is recommended that a professional development needs assessment be conducted on a periodic basiswith the instrument used in this study to determine nontechnical professional development needs. It isalso recommended that school administrators use the instrument to identify and plan future professionaldevelopment goals and workshops.
PERCEIVED PROFESSIONAL DEVELOPMENT STRENGTHS AND WEAKNESSES
AMONG MONTANA AGRICULTURAL EDUCATION AND FAMILY AND
CONSUMER SCIENCE EDUCATORS
by
James Carl Hafer
A thesis submitted in partial fulfillment of the requirements for the degree
of
Master of Science
in
Agricultural Education
Montana State University-Bozeman Bozeman, Montana
April 2002

Mtm APPROVAL
Of a thesis submitted by
James C. Hafer
This thesis has been read by each member of the thesis committee and has been found to be satisfactory regarding content, English usage, format, citations, bibliographic style, and consistency, and is ready for submission to the College of Graduate Studies.
Martin J. FrisK (Committee Chair)3 2 iiO JZ-
Date
Approved for the College of Agriculture
Sue Bloagett (Acting Department Head)
2- T-Xlyr) r t/ £
Date
Approved for the College of Graduate Studies
Bruce Mcleod (Graduate Dean)
Z 1 =>2-0Date

Ill
STATEMENT OF PERMISSION TO USE
In presenting this thesis in partial fulfillment of the requirements for a Master of
Science degree at Montana State University-Bozeman,, I agree that the Library shall make
it available to borrowers under the rules of the Library.
If I have indicated my intention to copyright this thesis by including a copyright
notice page, copying is allowable only for scholarly purposes, consistent with “fair use” as
prescribed in the U.S. Copyright Law. Requests for permission for extended quotation
from or reproduction of this thesis, in whole or in part, may be granted only by the
copyright holder.
Date

ACKNOWLEDGEMENTS
To ray Mother and Father, of whom I have no words to adequately express ray appreciation of their unqualified support, love, encouragement and teachings for which I will always be grateful and appreciative.
I wish to extend ray heart-felt appreciation to those who endeavored to assist me in making this study a reality. I very much appreciate their support. A special thank you to Dull Knife Memorial College and in particular, Judith Davis, for the unfaltering support, encouragement and dedication in this undertaking.
To my graduate committee, Dr. Martin Frick, Dr. Richard Howard and Dr. Van Shelhamer for their encouragement, understanding and steadfast commitment and dedication to produce a successful and worthwhile study. I also wish to thank Ms. Barb Planalp for her countless hours of advise, unbiased support arid super-human effort to . make this study a reality.
Richard and Ethel, Heidi, Randy, Alex, Kirk and Dr. B thank you for your friendship, support and kind words of encouragement.
A special word of thanks to the Montana Agricultural Science and Family and Consumer Science Educators whom with their time and effort helped to make this study possible.
And lastly, to my beautiful son Jace, one’s destiny is not a matter of chance but a matter of choice, work and play hard, and have fun!

V
TABLE OF CONTENTS
LIST OF TABLES
ABSTRACT.........
1. THE PROBLEM AND ITS SETTING................................................................. I
Introduction............................................................................................................ IThe Purpose of the Study.......................................................................................3Need for the Study..................................... 3Objectives....................................................................... 5Assumptions........................................................................................................... 5Limitations..................................................................................................................................................... . . . . .6Definitions of Terms.............................................................................................. 6
2. REVIEW OF LITERATURE.................................. 8
Introduction.......................................................................................................... ..8Content Need Areas..............................................................................................10Responsibility for Delivery...................................................................................13
3. METHODOLOGY......................................................................................................16
Population........................................Instrument Design.............................Instrument Reliability and ValidationData Collection.................................Data Analysis....................................
161.7202122
4. RESULTS OF THE STUDY 23
Demographics.....................................................................:............................ .-23Professional Development Perceptions............................................. ....... :.........27
5. CONCLUSIONS, IMPLICATIONS AND RECOMMENDATIONS............ :......... 40
Conclusions.............................................................. 41Implications.................................................................... 45
. Recommendations...................................... ........................................... :............46
BIBLIOGRAPHY............................................................................................................ 48

TABLE OF CONTENTS-CONTINUED
APPENDICES..................................................................................................................52
APPENDIX A-RESPONDENT CORRESPONDENCE....... ,...............................53APPENDIX B-SURVEY INSTRUMENT..............................................................57
vi

LIST OF TABLES
Table Page
1. Results of Analysis Using the Crobach’s Alpha Procedure to DetermineInstrument Reliability (n=104)........................................... 19
2. General Respondent Demographics.................................................................... 24
3. Professional Organization Membership of Respondents..................................... 25
4. Career Choice Satisfaction of Respondents....... 26
5. Participation in Self-Study and Improvement Activities of Montana Family andConsumer Science and Agricultural Educators......................... :........................ 26
6. Means and Standard Deviations of the 20 Professional Development Categoriesby Agricultural and Family and Consumer Science Educators........................... 28
7. Comparison of Professional Development Category Mean using the T-Test forEquality of Means by Montana Agricultural Education and Family Consumer Science Educators..... :........................................ 29
8. Comparison of Professional Development Categorical Mean using the One-wayANOVA by Montana Four Categories of Years Experience.......... :..................31
9. Means and Standard Deviations of Professional Development Categories byFourYears Experience Categories...... ................................................................33
10. Analysis of Variance Test Results for Years Experience SubgroupsComposed of Agricultural Education Respondents...................................... 34
11. Four Categories of Years of Participants Means for the 20 ProfessionalDevelopment Categories by Agricultural Education Years Experience Subgroups........................................................................................................... 37
12. Analysis of Variance Test Results for Years Experience SubgroupsComposed of Family and Consumer Science Respondents........... ................. ...38
13. Means of 20 Professional Development Categories by Family andConsumer Science Educators Years Experience Subgroups................. 39
vii

viii
ABSTRACT
The purpose of this study was to determine the perceptions of agricultural education and family and consumer science teachers toward twenty professional development-related categories in Montana during 1996 - 1997. This research used a descriptive study approach to identify perceived professional development strengths and weaknesses of Montana Agricultural Education and Family and Consumer Science teachers. Each Agricultural Education and Family and Consumer Science teacher was sent a mailed survey to complete and return to the researcher.
A survey entitled “Professional Development Survey” was administered to 180 Montana Agricultural Education and Family and Consumer Science teachers, who appeared in the statewide directories for the respective groups of teachers. The professional development survey instrument adapted for this study was originally developed by the Human Resource Development (HRD) program at the Westinghouse Waste Isolation Division in Carlsbad, New Mexico.
A final response rate of 57.7% was obtained. Anonymity was protected throughout the course of the study. Professional development categories examined in this study were divided into twenty categories: Quality of Work, Quantity of Work, Job Knowledge, Related Work Knowledge, Judgment, Initiative, Dependability, Analytical Ability, Adaptability to Work Assignments, Ability to Work Under Pressure, Creativity, Planning and Organization, Communication Skills, Interpersonal Skills, Leadership, Cost Consciousness, Personal Safety and Housekeeping, Supervision Level, Attendance and Punctuality, and Conflict Resolution.
Results of the study show when grouped by teaching profession, some of the professional development categories significantly differed between the two vocational educator groups. When grouped by years of experience, results also showed that some of the professional development categories significantly differed among years of experience category subgroups. Descriptive statistics used in this study indicated the perceived strengths and weaknesses between Montana Family and Consumer Science and Agricultural Educators, as to the twenty categorical areas of professional development, found in the survey instrument.
It is recommended that a professional development needs assessment be conducted on a periodic basis with the instrument used in this study to determine nontechnical professional development needs. It is also recommended that school administrators use the instrument to identify and plan future professional development goals and workshops.

I
CHAPTER I
THE PROBLEM AND ITS SETTING
Introduction
These are times of considerable promise and challenge for all who work in
education. The nation should now understand that raising the academic expectation
levels of all learners, from kindergarten through adult, should be a top priority and
essential to America’s future economic security, social stability, and well-being.
High-quality professional development must be part of all successful educational
programs. All too often, the part the educator will play is ignored in discussion of
educational reform. How effectively will educators be prepared to stand and deliver first-
class instruction to an increasingly diverse group of learners?
As stated in Goals 2000: Educate America Act (1994):
Professional development to enhance the skills and abilities is increasingly viewed by federal, state and local educational administrators and policy makers as the primary means for providing students opportunities to meet world class standards. The Goals 2000 legislation enacted in 1994, the framework for all federal education programs, emphasized the importance of professional development through the addition of a national goal to provide the country’s teaching force with access to staff development programs. This goal states by the year 2000, ‘the nation’s teaching force will have access to programs for the continued improvement of their professional skills and the opportunity to acquire the knowledge and skills needed to instruct and prepare all American students for the next century.(p. 8).
The professional development needs of the public school educators are identified
and administered in a style which best suits all educators. Often this style of “mass
2
treatment” provides a “feast or famine” setting for many educators, an approach which
often, if not totally, ignores the needs of individual educators and certain programs.
Professional development topics are well received and needed, while others are non
productive and often void of any specific content pertaining to instructional areas or
educational program context for most educators. In the vocational education setting, the
evolving nature of the workplace and the time lag of knowledgeable dissemination
impacts professional development needs (Finch and Crunkilton, 1999).
Normally, vocational educators spend about eight hours a day, five days a week,
fifty weeks a year for as many as forty years in the classroom. Educators owe it to
themselves and their profession to make this time as productive as possible.
What do professional educators need to do to assure their effectiveness in the
future? How do educators control their future goals and direction? How are educators to
better serve their students’ needs and better their profession without a direction?
The most comprehensive and suitable way to allow educators to control their own
destiny is to allow them to direct their own professional development. By developing a
“professional development survey”, an opportunity is provided for vocational teachers to
have a say in the direction of their destiny, whether that destiny is related to the content
of yearly inservice programs, or the opportunity to voice an opinion within the local
district. This survey will give educators an opportunity to express their concerns.
It is apparent that educators need the chance to express their opinions and
concerns regarding professional development. Without a voice in the inservice subject
arena, educators stand to lose precious, hard-fought ground regarding their professional

3
development needs and wants. Dr. Gerald M. Therman (1986) stated it best when he
said:
To know who you are and to be who you are is the ultimate form of self- expression and power. To the extent that you do know who you are, your work, career, and life choices are more likely to lead you to a more fully self-expressive work life—a life of more satisfaction, contribution, and joy(p.3). '
The Purpose of the Study
The purpose of this study was to determine the perceptions of agricultural
education and family and consumer science teachers toward twenty professional
development-related categories in Montana during 1996 - 1997.
Need for the Study
The concept of professional development is not new. The majority of today’s in-
service education is targeted at a vast array of teachers. Within these strata lie several
different topic areas of instruction, each requiring specific, specialized information and
training. Often educators attempt to direct their professional development and in-service
sessions to address the majority of the campus educator’s needs, ignoring or not fully
addressing the needs of vocational educators.
The daily requirements of the vocational educator are often much different and
more demanding than that of the main-stream classroom educator. Knowledge and
training is needed which allow teacher-educators and administrators the opportunity to
address and document their needs, plan or map their instructional goals and strategies,

4
sharpen their technical skills and provide information on state of the art technological
advances.
Schools and society have changed dramatically. One can look to technology to
see just how massive the changes are becoming. For example, the personal computer was
not invented when many educators went through their student teaching. Other evidence
of change in our schools include the increasing diversity of students, the social changes
which have impacted learners and schools and the ever-growing body of knowledge and
research on how students learn. In addition, new legislation and ideas in education make
the need for area specific professional development and in-service clear. Industry, the
medical contingency, higher education, and the life sciences all respond to scientific and
technological advances through continuing education; educators must be given the same
opportunity for continued professional development.
Too often, professional development has been treated as a passing trend rather
than a long term planning and diagnostic tool. Often professional development is treated
as a luxury, rather than a necessity and is the first item to be dropped when budgets are
tight. In an article by Howell (1989) and Schmuck & Schmuck (1992), the authors
stated:
Providing ongoing professional opportunities that support systematic school reform remains a challenge for rural and small schools. Declining rural enrollment and the consequent loss of funds, school closings, taxpayer revolts and staff reductions have been dominant issues (p. 15).
School districts cannot expect their teachers to acquire updated skills and respond
to the challenges facing today’s students without helping them gain these new skills.

5
Camp (1988) stated:
To further complicate matters for rural educators, the school reform movement in the 1980’s led to an increased emphasis on accountability, stricter teacher accreditation standards, and increased course requirements for high school graduation (p.7).
Objectives
In order to accomplish the purpose of this study, specific objectives were
developed.
1. The instrument used in this study was adapted for educational purposes from an
industrial setting. Therefore, an objective of this study was to establish overall
validity of the instrument used, as well as reliability for each of the 20 categories
represented in the instrument.
2. Develop a categorical profile for Montana Agricultural Educators and Family and
Consumer Science Educators that describes differences in the two sample
populations.
3. Compare responses to the 20 professional development categories between
Montana Agricultural Educators and Montana Family and Consumer Science
Educators.
Assumptions
The following assumptions were made concerning this study:
I . Professional development is important to educators.

6
2. Professional development needs of vocational educators differ from those of other
professional educators.
3. Educators posses the ability to identify perceived professional development strengths and
weaknesses and be honest in their responses.
Limitations
This study was limited in the following ways:
1. The study took place during the 1996-97 academic school year. The data were
collected April through May and represented respondent attitudes at that time.
2. The preexisting level of professional development, knowledge and interest the
agricultural and family and consumer science educators possess.
3. The study will be limited to agricultural and family and consumer science educators
in the state of Montana.
Definition of Terms
The following terms are defined as they are applied to this study:
AAFCS: American Association of Family and Consumer Sciences.
Agricultural Educator: A person who is responsible for the daily instruction of agricultural concepts.
AVA: American Vocational Association.
Family and Consumer Science Educator: A person who is responsible for the daily instruction of family and consumer related concepts.
Inservice: Professional growth and development enrichment opportunities and activities for educators to participate throughout the academic school year.
7
PIR: A day provided for inservice education in Montana schools.
Preservice: Professional growth and development enrichment opportunities and activities for educators to participate before the academic school year.
Professional Development: Any process or activity, planned or otherwise, that contributes to an increase in or the maintenance of knowledge, skills, and personal qualities related to
' learning and teaching.
MAFCS: Montana Association of Family and Consumer Sciences.
MEA: Montana Education Association.
MVA: Montana Vocational Association.
MVATA: Montana Vocational Agricultural Teachers Association.
NBA: National Education Association.

8
CHAPTER 2
REVIEW OF LITERATURE
Introduction
A wealth of information exists on the holistic needs of educators. Historically,
educators are known to voice opinions regarding their needs. Often their opinions fall
upon deaf ears. The specific content of vocational educators’ needs indicate they are a
mixed group, with different yet similar needs. One overall need which is agreed upon is
the need for professional in-service development.
Professional development is a term that makes many an educator or administrator
cringe. Brown (2000) stated:
■ Often, professional development means and extra inservice meeting after school, or more time learning new ideas or techniques that may not be all that readily transferable to one’s work. As a result, Professional Development may be seen useless and time consuming... (p. 26).
Varied ideas and opinions exist regarding the construction of personal development for
educators. Some will argue in favor of preservice education, yet others side for the
notion of in-service education. In-service, for this purpose, Goodland (1983) defined
professional development as:
.... efforts to promote by appropriate means the professional growth and development of workers while on the job...includes planned and organized efforts to improve the knowledge, skill, and attitudes of instructional staff members to make them more effective on the job... (p. 18).

9
Bail and Shinn (1982) reported that inservice education, at its broadest dimension,
is to be defined as “any professional activity which purports to upgrade the performance
of a teacher” (p. 183). Barrick and Hughes (1992) defined professional development as,
“planned workshops, correspondence, or other activities designed to improve teachers’
technical, pedagogical, or professional skills” (p. 2).
Anderson (1988) stated: “only through ongoing education and development can
one become a more effective professional. However, one must, remember what the
primary focus for Professional Development should be - ultimately improving student
learning” (p. 211).
Regardless of definition, most educators will agree that professional development
is an important and critical part of their educational and instructional task. The history of\
professional development in education is a long and rich one. Bail and Shinn (1982)
reported,
In-service education and professional development for teachers had its origin in the beginning of the formal school. Following the Land-Grant Act of 1862, attention was focused upon assisting the school to respond to social change with the “agricultural and mechanical” aspects of a changing society beginning to be reflected in the public school curriculum. By the 1880’s many colleges and institutions were holding summer courses designed for teachers. These in-service programs helped teachers deal with changes in both the technical and philosophical issues of the day (p. 273).
True (1929) reported that, “by 1910,46 agricultural colleges had teacher-training
work in agriculture” (p. 273). Martin (1967) concluded that, “this work was chiefly
inservice in nature and evidently was not regarded as constituting a “teacher-training
program” (p.6). True (1929) stated, “this increased attention in agricultural sciences
resulted in programs in more than 3000 public secondary schools as well as many normal

10
schools by 1915-1916” (p. 276). Udell (1993) reported, “The passage of the Smith-
Hughes Act, Public Law No. 347, by the 64th U.S. Congress on February 23, 1917,
moved agricultural education into a new era” (p. 7).
Bail and Shinn (1982) reported, “The Smith-Hughes Act supported in-service and
professional development of the teacher of vocational agriculture. By 1919, 40 states had
teacher education programs in agriculture. Many states had well-developed programs for
preservice and inservice education by 1930” (p. 186).
Content Need Areas
With this information in mind, educators have yet to address the content needs of
the professional development area(s). What specific areas and information regarding
professional development are most important? How do they go about the task of
identifying these areas? Bail and Shinn (1982) stated:
Even the best preservice program is limited in scope and application. Performance must be accurately evaluated to determine if the desired changes have come about... It is no longer acceptable to speak of teachers of agriculture as a monolithic group. Specialization in subject matter, variation in preservice training, and personal socio-economic factors lead to much diversity. Target groups must then be those with commonality, as determined by a sophisticated needs assessment (p. 184).
Bail and Shinn (1982) reported, “As a primary responsibility, the teacher
representatives should poll their subgroup to determine the needs for credit and non
credit courses, workshops, and other professional development activities” (p. 187) while
Murphy (1997) stated:
In many cases, time is the critical factor. Although Professional Development programs often provide educators with useful and

11
meaningful ideas, their incorporation into daily use is often impeded by a lack of time for teachers to routinely Ieam together, reflect on their teaching practices in a collaborative fashion, test new ideas together and support each other... (p. 29).
Supporting the need for this study are statements which are crucial in reinforcing
the need for an instrument which will address the audience regarding professional
development perceptions. Hall and Scanlon (1990) reported, “The lack of teacher
participation in professional development activities is an on-going concern to leaders in
agricultural education across the country” (p. 245). Ryan (1987) emphasized the critical
nature of professional development, suggesting that the nation annually spends two
billion dollars to facilitate such programs. The National Research Council Committee on
Agricultural Education in Secondary Schools (1988) recommended increased agricultural
education teacher in-service involvement. This was not a revolutionary recommendation
since agricultural educators have typically recognized the need for keeping current with
both technical and pedagogical changes. Emphasizing the agricultural educator
profession’s concerns, all five of the 1986 issues of volume 59, The Agricultural
Education Magazine, dealt with themes addressing “staying current”.
Bail and Shinn (1982) stated,
If teaching is truly a profession, then the professionals therein should play the major role in determining their professional development and growth.In theory this is correct. In actual practice, it may sometimes vary with the reality that teachers may not have adequate time or resources to plan such activities. A needs assessment should be used to evaluate both individual and collective priority needs (p. 194).
In a review of professional development needs, Lovelace and LaBrecque (1991)
stated:

12
The implementation of professional development activities based on the assessed needs can improve the ability of postsecondaxy instructors to meet the special needs of their students. The considered judgment of the respondents regarding their perception of their present level and desired level of development is an effective approach for identifying the professional development needs of current faculty of postsecondary technical/vocational education programs (p. 11).
Hartley, Brookhart, and Smith (1990) found, “There were few regional
differences in perceived professional development needs of secondary and postsecondary
vocational educators in Colorado.” They also found that, “vocational educators at
different levels had similar professional development needs and that the top four methods
of meeting needs identified by vocational educators were: group workshops, seminars,
on-the-job work experiences, and university courses. However, formats most preferred
were all day, intensive activities, three-hour blocks and weekends” (p. 381).
Brown (2000) commented, “As the internet has pervaded life, a variety of
approaches to professional development involve the use of electronic technology.”
Linkages with other teachers are an important professional development strategy for
sharing practical knowledge” (p. 17).
Cook and Fine (2000) further stated, “A number of educational reformers have
recommended that at least 20% of a teacher’s total work time be devoted to professional
study and collaborative work” (p. 4).
Hartley, Brokhart, and Smith (1990) also found:
The areas of greatest perceived professional development needs of secondary and postsecondary vocational educators in Colorado were: (I) keeping abreast of new technology, (2) computer managed instruction, (3) computer assisted instruction, (4) motivating students, (5) writing proposals for funding, and (6) developing critical thinking skills (p. 381).

13
Brown (2000) recommended:
Teachers look for professional development that integrate technology with other subjects and identify practitioners who can model technology use in teaching. The need to link professional development to the workplace and community is a recurring theme (p. I).
Responsibility for Delivery
Herein lies another opportunity for a professional development needs assessment.
As previously mentioned, many postsecondary educators harbor the same concerns as
that of the secondary classroom educator; what professional development skills do
educators really need, and where can they go to get them?
To help answer this question, Hamilton and McElroy (1983) stated:
Large numbers of vocational/technical teachers at both the secondary and postsecondary levels were considered to have substantial or critical need for updating in the technology of their teaching fields. Ofthe occupational areas, one-half of the agricultural instructors showed substantial or critical need for updating in the technology of their teaching fields (p. 3).
According to Goodland (1983),
The teacher is the single most important variable in school effectiveness. Maintaining an effective teaching force requires that qualified teachers regularly enter the ranks and that practicing teachers are kept abreast of changes in the profession. Teachers develop their skills, pedagogical and technically, through high quality professional development programs.Because of increased public demand for teacher accountability and technical advancements in the occupational areas of vocational programs, vocational teacher professional development has never been more important (p. 18).
Another area of uncertainty exists as to the responsibility for professional
development. Who ultimately has the responsibility for organizing, delivering, and
14
evaluating professional development? How should educators address the broad areas of
educational need? “If high quality professional development activities are to be
provided, cooperation and a clear understanding of responsibilities among groups
involved in providing the activities are essential (Wolpert, 1984, p.l).
Anderson (1988) stated, “Although professional development is viewed as an
imperative for vocational teachers, little research has been conducted to clarify the
responsibilities that various groups have for providing professional development
activities (p. 211).
How much of their professional development opportunities do teachers care to
leave to chance? Who should have a say in professional development processes? Reyes,
Alter, and Smith (1986) stated, “We all understand that the key player in the educational
process is the teacher” (p. 56): However, Cruickshank and Armaline (1986) stated:
Yet, the processes that are used in the education and professional development of public school agriculture teachers are more the result of political decisions, administrative convenience, and historical accident than of educational research or empirically-based theory (p. 36).
Miller (1975) identified the “partners” of an education system as teachers,
administrators, teacher educators, and state education agency administration staff.
Cooperation among these groups is essential if high quality professional development
activities are to result. Hawley and Valli 2000 stated:
Professional development clearly involves time and effort, requiring decision making and planning on a number of levels, from the district to the teacher. Professional Development also involves the use of technology to expand current practices and upgrade skills, as well opportunities for teachers to gain first-hand knowledge of the workplace in order to create authentic learning experience for their students... (p. 9).

15
Another question in need of discussion is: Which teachers are the most in need of
professional development? Is it new educators? What about the teachers with the most
experience in the field? Are these the teachers with the most to gain, especially from the
information on new technology and instructional methodology? Wolpert (1984)
contended that to become a master teacher is a lengthy, challenging undertaking that must
be viewed as a long-term, developmental process. Camp (1988) added, “Teacher
professional development can be visualized as a continuum, including preservice
education, induction, and continuing development” (p. I ) .
A review of the literature found that no research studies on professional
development, which used similar methodologies to the methodology in this study,
existed. In addition, a review of the literature found that there were no survey
instruments similar to the one used in this study related to professional development
topics.
In summary, this review of literature represents the vast array of activities, needs
and strategies for professional development that exist within the education profession.
Only through the use of a reliable and valid instrument can these needs be identified.

16
CHAPTER 3
METHODOLOGY
In this chapter, the procedures used in completing this study are described. This
chapter is organized into five different sections: (I) Population Selection, (2) Instrument
Design, (3) Instrument Validation, (4) Data Collection and (5) Data Analysis.
Population
The population for this study was comprised of Montana Family and Consumer
Science and Agricultural Education secondary teachers. The selection of this population
was based on the assumption that professional development needs of Agricultural
Educators and Family and Consumer Educators differed from those of other professional
educators. A purposeful census of these educators was conducted for this study.
The teacher population for this study consisted of 180 teachers from the vocational
areas of Agricultural Education and Family and Consumer Science in Montana during the
1996-1997 academic year. The population was identified by utilizing respective
vocational teaching program lists obtained from the Montana Office of Public Instruction.
Fifty-eight agricultural education teachers comprised a segment of the population, while
52 family and consumer science educators constituted the rest of the population. Of the
104 teachers participating in the study, 57 were female, 47 were male. When analyzed by
respective vocational area, six female and 54 male teachers were found in the agricultural

17
education teacher segment of the population, while 55 female and 2 male teachers were
found in the family and consumer science educator segment.
Instrument Design
The instrument used in this study was originally developed by the Human Resource
Development (HRD) Program at the Westinghouse Waste Isolation Division, which
operates the Waste Station Pilot Plant (WSPP) for the US Department of Energy located
near Carlsbad, New Mexico. The instrument originated with the need to establish a
developmental program geared toward the non-management employee. In an attempt to
set forth the developmental program, the Human Resource Development and Total
Quality (HRD&TQ) Department began development of the Successful Professional
Development Program (SUPRO) which consisted of self-paced classroom courses built
upon the Westinghouse 12 Conditions for Excellence. A condition was development,
specifically focusing on self-assessment and professional development in the workplace.
To encourage self-assessment, HRD&TQ developed a paper-and-pencil self-assessment
tool. HRD&TQ conducted focus groups with managers, employees, and customers to
determine the content of the self-assessment tool. HRD&TQ piloted the tool and made
modifications. HRD&TQ calculated KR-20 coefficients and standard deviation and
found them to be acceptable. A numeric KR-20 coefficient was not made available to the
researcher. Over 300 division personnel participated in the program, and the SUPRO
program has been transferred to over 500 organizations across the U.S. through the '
federal government's Technology Transfer Program. The instrument had 20 categories
18
and IOO items, which were changed for the secondary school teacher context. All items
remaining were reworded for the context of a vocational teacher. The . first section of the.
data collection instrument (perceptions) consisted of 100 perception statements, (20
categories, five statements for each category) to which respondents were directed to use a
Likert-type response scale ranging from (4) Always, (3) Most of the time, (2)
Occasionally, (I) Seldom, and (0) Never. The instrument assessed teachers’ professional
development needs other than technical knowledge within their respective vocational
areas.
Demographic variables included gender, age, other experience, years of teaching
experience, membership in professional organizations, and offices held within
professional organizations. Career choice satisfaction, self-study improvement,
responsibility for professional development, and delivery of professional development
were also variables included in section two.
The first objective of this,study was to determine a reliability estimate for the'
Westinghouse Waste Isolation Human Resources Unit Professional Development Survey
instrument as it was used for the purposes of this study. Items in the original survey
instrument were modified to address agricultural education and family and consumer
science teachers education context. The overall Cronbach’s alpha reliability coefficient
for the entire instrument was .97 for the pilot test of the instrument. A Cronbach’s alpha
was also calculated to determine instrument reliability for its administration with this
study’s population. When calculated with using this population, the Cronbach’s alpha
coefficient was .94. A Cronbach's alpha was computed for each of the 20 categories (5
A

19
items per category), which constitutes section one of the survey instrument. Table I
reflects the results of analysis using the Crobach’s Alpha procedure to determine
instrument reliability. The Cronbach’s Alpha’s for 16 of the 20 categories was found to
be above .60, while the Initiative category Cronbach’s Alpha (.4061), Supervision level
(.5204), Communication Skills (.5822) and Attendance and punctuality (.5204) were
found to be lower than this standard. The category with the highest reliability estimate
was Creativity (.8241).
Table I. Results of Analysis Using the Crobach’s Alpha Procedure to Determine _______ Instrument Reliability (n=T04).____________
No. Categories and D escriptionsCronbach A lpha
I. Q uality o f w ork-Thoroughness and acceptability o f w ork produced or accom plished. .61092. Q uantity o f w ork-V olum e o f acceptable work. .73533. Job K now ledge- K now ledge o f requirem ents, m ethods, techniques, and skills involved in
the job ..6545
4. R elated W ork K now ledge- K now ledge o f how own w ork im pacts o th er areas. .6699■ 5. Judgm ent- Soundness o f conclusions, decisions, and actions. .6177
6. Initiative- A bility to take effective action w ithout being told. .40617. D ependability- R eliability in assum ing and carrying ou t com m itm ents, obligations, and
assignm ents..7589
8. A nalytical A bility- E lfectiveness in th inking through a problem . .81149. A daptability to W ork Assignm ents- A bility to Ieam new know ledge and com plete a
variety o f assignm ents..6645
10. A bility to W ork U nder Pressure- Perform under unusual circum stances and in m eeting tigh t schedules.
.6294
1.1. C reativity- A bility to generate w orthw hile new ideas o r techniques w ith practical applications.
.8241
12. P lanning and O rganization- A bility to p lan and organize w orkload to m eet priorities. .721313. C om m unication Skills- E ffectiveness com m unicating w ith peers, supervisors, and o ther
contacts..5822
14. In terpersonal Skills- W orks effectively w ith others and in accordance w ith school district.
.7167
15. L eadership- D em onstration o f leadership characteristics and qualities. .6787.
16. C ost C onsciousness- Effective uses o f school supplies, m aterials and service. .8466
17. Personal Safety and H ousekeeping- D em onstrates good safety practices and aw areness o f ow n personal safety and safety o f others. M aintains neat and orderly w ork area and exhibits care and use o f equipm ent, tools, etc.
.7127
18. Supervision L evel- A m ount o f supervision needed as com pared to the position standard. .5204
19. A ttendance and punctuality- R eports to class on a regu lar basis, on tim e and ready to w ork a t start o f day and after lunch period; devotes school hours to conduct o f school/teaching assignm ents.
.3982
20. C onflict R esolu tion- A bilitv to handle conflict and disagreem ents betw een se lf and others. .7593

21
Data Collection
The first instrument mailing to Montana Agricultural Educators and Family and
Consumer Science Educators took place on May 9, 1997. A total of 91 teachers
responded to the questionaire on the initial mailing. A follow up post card requesting
outstanding surveys was mailed on May 20,1997 (see Appnedix A). A total of 13
teachers responded to the first follow-up request. A second and final request was made
for any non-retumed surveys at the Montana Vocational Agriculture Teachers
Association Update Conference in July, 1997, in Havre, Montana. A second request was
not made for Family and Consumer Science Educators. All of the remaining agricultural
education surveys were returned due to a captive audience. Early and late respondents
were examined for statistical difference. Gall, Borg, and Gall (1996) suggested that if
you are concerned about score, you should consider doing both a t-test and a Mann-
Whitney U test. No difference was found to exist between the two respective respodent
groups.
All instruments were hand-scored by the researcher, and responses were entered
into a Microsoft Excel® (1996) spreadsheet. A tally sheet was provided to all survey
participants to track their categorical responses. With the aid of the tally sheet, all survey
respondents had the opportunity to graph their personal categorical score responses
directly from their completed survey instrument. A graph sheet was included and
intended to be of use in the identification and tracking of personal professional
development needs of each census participant (see Appendix B). ■

20
The census population included 180 family and consumer science and agricultural
educators in Montana during the 1996-97 school year. A total of 104 surveys were
collected and used for analysis. This represented a usable response rate of 57.7 %. The
second section of the data instrument was developed with the assistance of a committee
of agricultural educators and statisticians at Montana State University-Bozeman. This
section consisted of questions directed to the respondents in an attempt to collect personal
and situational demographic information.
Instrument Reliability and Validation
The reseacher conducted a teacher pilot test with 15 high school teachers in the
Commerce High School ISD in Commerce, Texas. The pilot test was validated after a
review of clarity, readability, and relevance to the objectives of the research project. This
audience was encouraged to review the survey for content and face validity. The
respondents said it was well written and easily understood. Minor corrections were made,
and the instrument was deemed ready for the population group. This group was chosen to
pilot the instrument due to convenience as the researcher had previously taught at this 1
school. Pilot instruments were distributed before the Semester break (1996-1997) to
Commerce High School teachers, and were completed by the teachers and returned to the
researcher by February 1 ,1997. A survey draft was also administered to an expert panel
of educators within the College of Agriculture at Montana State University.

22
Data Analysis
The data from the respondents were recorded, the researcher keyed in the numbered
response for each item of the 100 possible questions in section One of the instrument as:
(4) Always, (3) Most of the time, (2) Occasionally, (I) Seldom, and (0) Never/ After each
item was entered into the spreadsheet, the items were then categorized into the 20
categories noted in the Instrument Design section of this chapter. Means were computed
for each of the 20 job performance categories. Data were then transferred into SPSS-7.5
for Windows statistical analysis. The results were then compiled into comparative tables
to facilitate ease of accurate reporting.
The responses to demographic variables from section two of the instrument were
entered into a Microsoft Excel spreadsheet. The researcher sorted demographic data by
assigning a simple numeric code for each of the demographic respondents. The data were
compiled for analysis for descriptive statistics and significant differences among
segments of the study's population. For descriptive purposes only, T-Test and an
Analysis of Variance was conducted on the 20 professional development categories to
determine if there were any differences between agricultural education, and family and
consumer science teachers.

23
CHAPTER 4
RESULTS OF THE STUDY
This chapter presents results to satisfy the objectives of the study. The results are
based on data collected from a Teacher Professional Development survey. Data collected
represent two different groups of vocational teachers in Montana; agricultural education
and family and consumer sciences. The results of the study can only be generalized to
agricultural education and family and consumer science instructors teaching in Montana
during the 1996-1997 academic year.
Demographics
Data frequencies presented in the following tables describe the demographic
characteristics of the respondent groups. The two subgroups consist of Montana
Agricultural Educators and Montana Family and Consumer Science Educators.
Table 2 represents specific demographic variables of agricultural education
(AGED) and family and consumer science educators (PCS). The family and consumer
science educators averaged 15.87 years of teaching experience while the agriculture
educators averaged 11.34 years. The gender distribution for family and consumer science
educators consisted of 2 male respondents and 55 female respondents. Agricultural
educators consisted of 45 male and 2 female respondents. Eighteen FCS educators
indicated that they had “other” career experience, whereas thirty-four AGED respondents
indicated other experience. Concerning delivery of professional development activities,
thirty-three FCS and forty AGED professionals mentioned that workshops were the

24
preferred method of professional development delivery. Twenty-five FCS educators and
29 AGED educators preferred inservice activities hosted within their local school district.
Table 2. General Respondent Demographics.Frequencies
Demographic Variable:FCS(n=50)
AGED(n=54) Total
Years taught (average) 15.87 11.34 N/AGender (Male) 2 45 . 47Gender (Female) 55 2 57Other experience 18 34 52Workshops 33 40 73Inservice/local schools 25 29 54
Data in Table 3 depict the membership within professional organizations of
Montana Family and Consumer Science and Agricultural Education teachers. Fifty-one
agricultural education teachers indicated that they were members of at least one
professional organization. The top three responses were noted: “Other, miscellaneous ”
46; “MVATA” 42, and “AYA” 32. Forty-six family and consumer teachers indicated
that they too were members of at least one professional organization. The top three
responses were recorded in the following order: “MEA” 19; “AVA/MVA/NEA/MAFCS”
12 (each); and “AAFCS” 11. The number of respondents who belonged to professional
organizations was 97 (93%).

25
Table 3. Professional Organization Membership of Respondents.Frequencies
MembershipFCS(n=50)
AGED(n=54) Total
Professional Organization membership. 46 51 97Other miscellaneous. 0 46 46MVATA. 0 42 42AVA. 12 32 44MEA. 19 0 ' 19MVA. 12 o 12NBA. 12 0 12MAFCS 12 0 12AAFCS 11 0 11
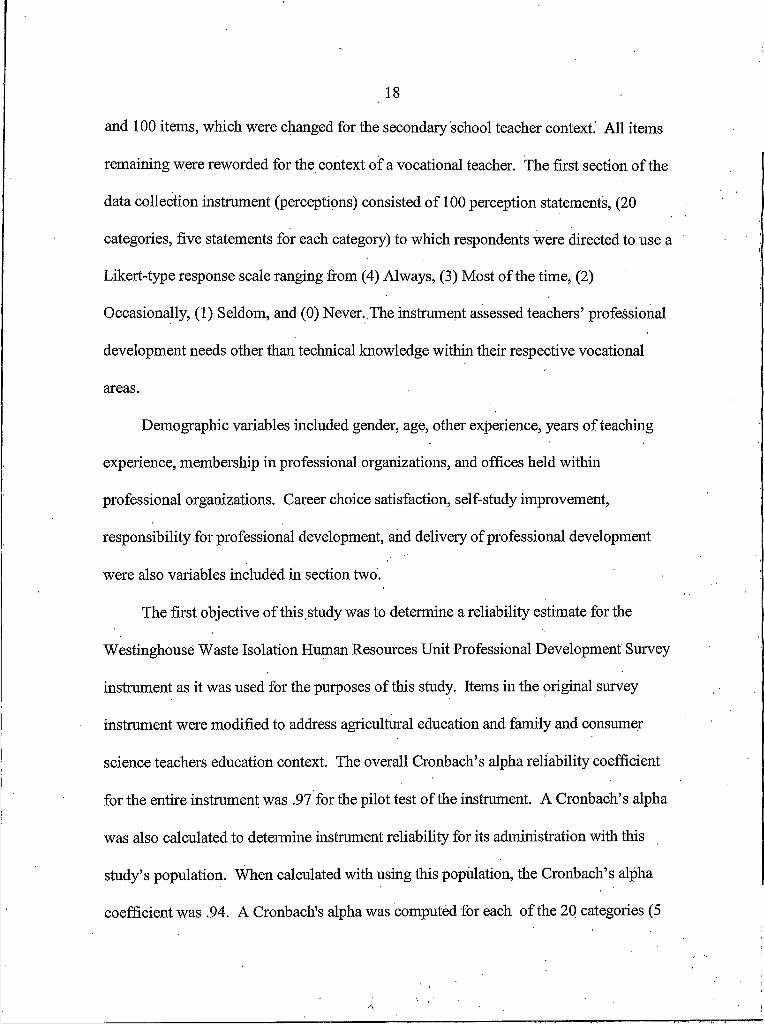
Data in Table 4 presents respondent data regarding the demographic variable of
career choice satisfaction. Twenty-two respondents specified that they were “always
satisfied” (4), 79 indicated they were “satisfied most of the time” (3), 3 noted they were
“occasionally satisfied” (2), 0 responded that they were “seldom satisfied” (I), while 0
indicated they were “never satisfied” (0). When analyzed by discipline, 10 agricultural
education teachers said they were “always satisfied”(4), 43 indicated they were “satisfied
most of the time”(3), I said they were “occasionally satisfied” (2), 0 noted they were
“seldom satisfied”(l), while 0 said they were “never satisfied” (0). Regarding their
career choice, 12 family and consumer science teachers said they were “always satisfied”,
36 indicated they were “satisfied most of the time”, 2 said they were “occasionally
satisfied”, 0 noted they were “seldom satisfied”, while 0 said they were “never satisfied”.
26
Table 4. Career Choice Satisfaction of Respondents.Frequencies
Demographic Variable:FCS(n=50)
AGED(n=54) Total
“Always satisfied” 12 10 22“Satisfied most of the time” 36 43 79“Occasionally satisfied” 2 I 3“Seldom satisfied” 0 0 0“Never satisfied” 0 0 0
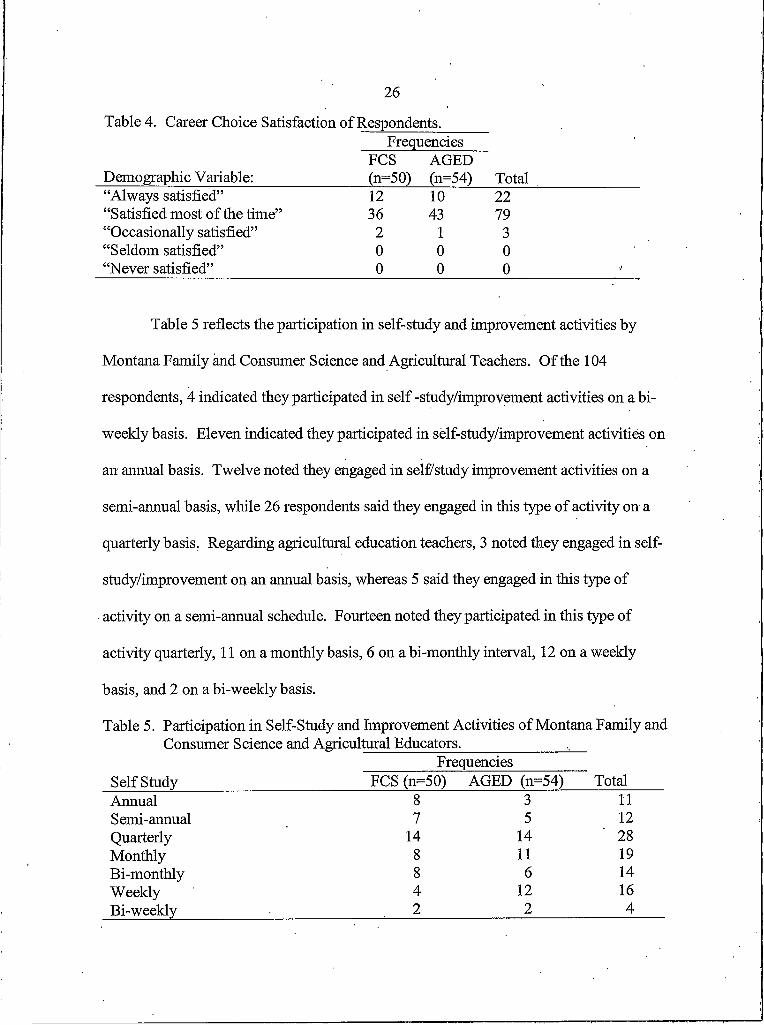
Table 5 reflects the participation in self-study and improvement activities by
Montana Family and Consumer Science and Agricultural Teachers. Of the 104
respondents, 4 indicated they participated in self -study/improvement activities on a bi
weekly basis. Eleven indicated they participated in self-study/improvement activities on
an annual basis. Twelve noted they engaged in self/study improvement activities on a
semi-annual basis, while 26 respondents said they engaged in this type of activity on a
quarterly basis, Regarding agricultural education teachers, 3 noted they engaged in self
study/improvement on an annual basis, whereas 5 said they engaged in this type of
activity on a semi-annual schedule. Fourteen noted they participated in this type of
activity quarterly, 11 on a monthly basis, 6 on a bi-monthly interval, 12 on a weekly
basis, and 2 on a bi-weekly basis.
Table 5. Participation in Self-Study and Improvement Activities of Montana Family and Consumer Science and Agricultural Educators._____________ ,__
FrequenciesSelf Study FCS (n=50) AGED (n=54) TotalAnnual 8 3 11Semi-annual 7 5 12Quarterly 14 14 28Monthly 8 11 19Bi-monthly 8 6 14Weekly 4 12 16Bi-weekly 2 2 4

27
The second objective sought to develop a professional development categorical
profile of the respondents. The evaluation scale for each category was adapted from the
Human Resource Development (HRD) program at the Westinghouse Waste Isolation
Division. For this study, a mean for a category (5 items per category with a possible high
score of 25) between 25-20 is considered a strength with little or no development needed
in this area. A mean between 19-15 is considered within normal range for a professional
development performance factor, whereas a mean score between 14-10 indicates a need
for improvement is needed for this professional development performance factor. A mean
between 9 -0 denotes a need for immediate improvement in this professional
development performance factor.
The data in Table 6 show the means and standard deviations for the 20
professional development categories. The highest mean of the professional development
categories was “Attendance and Punctuality”(23.00), whereas, the professional
development category with the lowest mean was “Conflict Resolution” with a mean score
Professional Development Perceptions
of 17.54.

28
Table 6. Means and Standard Deviations o f the 20 Professional Development Categoriesby Agricultural and Family and Consumer Science Educators.
AGEDM eanyz
FCSMeanyz
N o . Categories and Descriptions (n=54) S.D. (n=50) S.D.I. Quality of work- Thoroughness and acceptability of work
produced or accomplished.21.27 2.06 21.06 2.72
2. Quantity of work- Volume of acceptable work. 20.75 2.56 20.77 2.703. Job Knowledge- Knowledge of requirements, methods,
techniques, and skills involved in the job. - .19.45 3.20 19.79 3.20
4. Related Work Knowledge- Knowledge of how own work impacts other areas.
18.95 2.92 18.72 2.89
5. Judgment- Soundness of conclusions, decisions, and actions. 18.64 3.13 18.64 • 2.916. Initiative- Ability to take effective action without being told. 19.56 2.70 19.08 2.567. Dependability- Reliability in assuming and carrying out
commitments, obligations, and assignments.21.91 . 2.58 23.14 1.83
8. Analytical Ability- Effectiveness in thinking through a problem. 19.45 2.81 19.77 3.409. Adaptability to Work Assignments- Ability to Ieam new
knowledge and complete a variety of assignments.20.77 2.48 20.22 2.88
10. Ability to Work Under Pressure- Perform under unusual circumstances and in meeting tight schedules.
19.27 2.98 19.00 2.99
11. Creativity- Ability to generate worthwhile new ideas or techniques with practical applications.
19.16 3.52 19.06 3.52
12. Planning and Organization- Ability to plan and organize workload to meet priorities.
18.43 2.96 19.22 3.19
13. Communication Skills- Effectiveness communicating with peers, supervisors, and other contacts.
19.08 ■ 2.43 18.81 3.15
14. Interpersonal Skills- Works effectively with others and in accordance with school district.
20.22 2.46 21.02 2.60
15. Leadership- Demonstration of leadership characteristics and qualities.
21.31 2.42 21.18 2.64
16. Cost Consciousness- Effective uses of school supplies, materials and service.
21.27 2.98 22.58 2.64
17. Personal Safety and Housekeeping- Demonstrates good safety practices and awareness of own personal safety and safety of others. Maintains neat and orderly work area and exhibits care and use of equipment, tools, etc.
20.77 2.37 21.87 2.48
18. Supervision Level- Amount of supervision needed as compared to the position standard.
22.18 1.75 23.77 7.03
19. Attendance and punctuality- Reports to class on a regular basis, onetime and ready to work at start of day and after lunch period; devotes school hours to conduct of school/teaching assignments.
23.00 1.67 23.14 1.89
20. Conflict Resolution- Ability to handle conflict and disagreements between self and others.
17.54 3.42 16.89 3.64
y Mean calculated from a Likert-type response scale ranging from Always (5), to Nearly Always (4), toOften (3), to Occasionally (2), to Rarely (I), to Never (0).
z Total Category scale ranged from 0 to 25.

29
Table 7 reflects the respective means of agricultural education teachers and family
and consumer science teachers and T-Test results from a comparison of the two teaching
professions. The conduct of a T-Test found three professional development category
means to be significantly different at the .05 probability level. The three significant
professional development categories were Dependability (p=.008), Cost Consciousness
(p=025), and Personal Safety and Housekeeping (p=.028). The family and consumer
science teacher sample had higher means than agricultural education teachers in all three
of the statistically significant professional development categories.
Table 7. Comparison of Professional Development Category Mean Using the T-Test for Equality of Means by Montana Agricultural Education and Family Consumer
■ . Science Educators. ____________Mean2
No. Professional Development CategoryAGEDn=54
FCSn=50 T Value Sig.
• I. Quality of Work 21.27 21.06 .423 .6742. Quantity of Work 20.75 20.77 -.039 .9693. Job Knowledge 19.45 19.79 -.509 .6124. Related Work Knowledge 18.95 18.72 .386 .7005. Judgment 18.64 18.64 .000 1.0006. Initiative 19.56 19.08 .890 .3767. Dependability 21.91 23.14 -2.688 .008*8. Analytical Ability 19.45 19.77 -.490 .6259. Adaptability to work assignments 20.77 20.22 .984 .32710. Ability to work under pressure 19.27 19.00 .443 .65811. Creativity 19.16 19.06 .145 .88512. Planning and Organization 18.43 19.22 -1.259 .21113. Communication skills 19.08 18.81 .471 .63914. Interpersonal skills 20.22 21.02 -1.528 .13015. Leadership 21.31 21.18 .241 .81016. Cost Consciousness 21.27 22.58 -2.281 .025*17. Personal Safety and Housekeeping 20.77 21.87 -2.229 .028*18. Supervision Level 22.18 23.77. -1.513 .13419. Attendance and punctuality 23,00 23.14 -.400 .69020. Conflict resolution 17.54 16.89 .895 .373
* T-Prob < .05.2 Total Category scale ranged from 0 to 25.
30
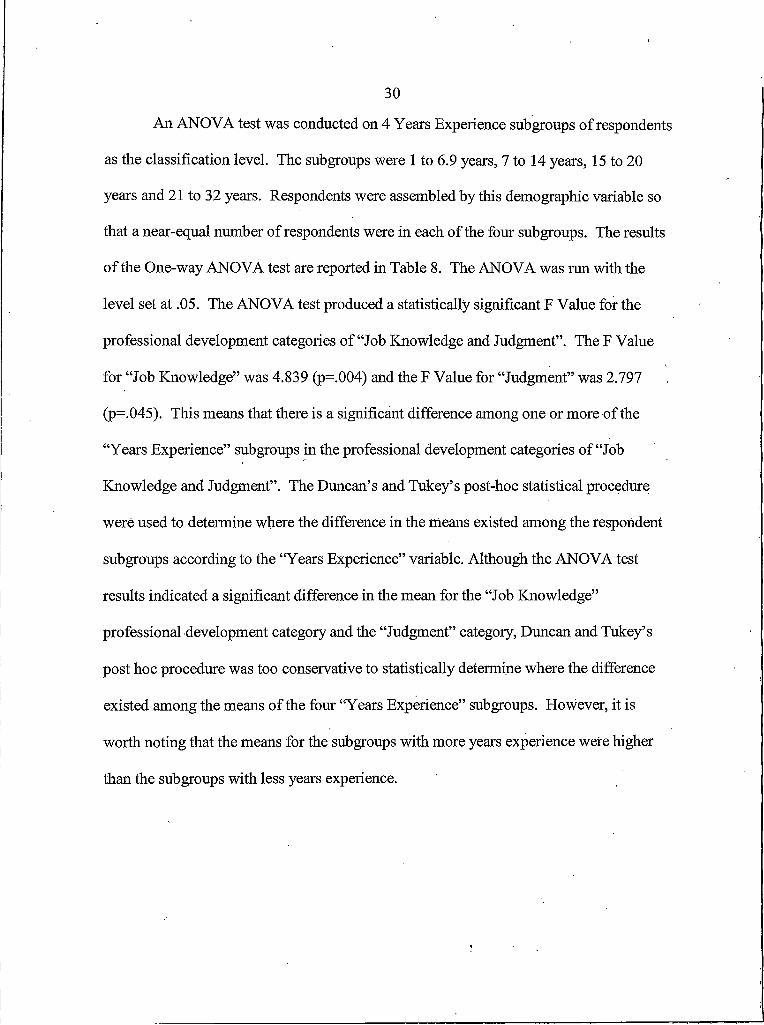
An ANOVA test was conducted on 4 Years Experience subgroups of respondents
as the classification level. The subgroups were I to 6.9 years, 7 to 14 years, 15 to 20
years and 21 to 32 years. Respondents were assembled by this demographic variable so
that a near-equal number of respondents were in each of the four subgroups. The results
of the One-way ANOVA test are reported in Table 8. The ANOVA was run with the
level set at .05. The ANOVA test produced a statistically significant F Value for the
professional development categories of “Job Knowledge and Judgment”. The F Value
for “Job Knowledge” was 4.839 (p=.004) and the F Value for “Judgment” was 2.797
(p=.045). This means that there is a significant difference among one or more of the
“Years Experience” subgroups in the professional development categories of “Job
Knowledge and Judgment”. The Duncan’s and Tukey’s post-hoc statistical procedure
were used to determine where the difference in the means existed among the respondent
subgroups according to the “Years Experience” variable. Although the ANOVA test
results indicated a significant difference in the mean for the “Job Knowledge”
professional development category and the “Judgment” category, Duncan and Tukey’s
post hoc procedure was too conservative to statistically determine where the difference
existed among the means of the four “Years Experience” subgroups. However, it is
worth noting that the means for the subgroups with more years experience were higher
than the subgroups with less years experience.

31
Table 8. Comparison of Professional Development Categorical Mean using the One-way ______ ANOVA by Montana Four Categories of Years Experience.________________
No. Professional Development Category dfMeanSquare
FValue SiR.
I. Quality of Work Between Groups 3 21.06 .223 .880Within Groups 90 5.98
2 Quantity of Work Between Groups 3 20.77 .231 .875Within Groups 90 7.05
3. Job Knowledge Between Groups 3 19.79 4.839 .004*Within Groups 90 9.20
4. Related Work Knowledge Between Groups 3 18.72 1.440 .236Within Groups 90 8.39
5. Judgment Between Groups 3 18.64 2.797. .045*Within Groups 90 8.56
6. Initiative Between Groups 3 19.08 1.341 .266Within Groups 90 77.00
7. Dependability Between Groups 3 23.14 .525 .666Within Groups 90 5.541
8. Analytical Ability Between Groups 3 19.77 1.778 .157Within Groups 90 9.55
9. Adaptability to Work Assignment Between Groups 3 20.22 .105 .957Within Groups 90 7.63
10. Ability to Work Under Pressure Between Groups 3 19.00 .857 .466Within Groups 90 8.85
11. Creativity Between Groups 3 19.06 2.361 .077.Within Groups 90 11.89
12. Planning and Organization Between Groups 3 19.22 1.514 .216Within Groups 90 9.43
13. Communication Skills Between Groups 3 18.8 1.096 .355Within Groups 90 7.94
14. Interpersonal Skills Between Groups 3 21.01 .504 .681Within Groups 90 6.75
15. Leadership Between Groups 3 21.18 .163 .921Within Groups 90 6.60
16. Cost Consciousness Between Groups 3 22.58 L931 .130Within Groups 90 8.11
17. Personal Safety and Housekeeping Between Groups 3 21.87 1.110 .349Within Groups 90 6.23
18. Supervision Level Between Groups 3 23.77 1.946 .128Within Groups 90 26.39
19. Attendance and Punctuality Between Groups 3 23.14 1.782 .156Within Groups 90 3.07
20. Conflict Resolution Between Groups 3 16.89 .856 .467Within Groups 90 12.77
* F-Prob < .05.

32
Table 9 presents the means of the 20 professional development categories by
Years Experience subgroups. For the two significant professional development
categories “Job Knowledge” and “Judgment”, the two subgroups with the highest number
of years experience, 15 to 20, and 21 to 32 years, recorded higher means than the two
subgroups, I to 6.9, and 7 to 14 years, with less number of years experience.
An ANOVA test was also conducted on the Years Experience subgroups for all
agricultural education respondents. The Duncan post hoc procedure was employed to
determine which subgroups of significant professional development categories differed
significantly. The results of the One-way ANOVA test are reported iii Table 10.
The ANOVA produced a statistically significant F Value for the professional
development categories of “Job Knowledge” and “Personal Safety and Housekeeping”.
The F Value for “Job Knowledge” was 3.076 (p=.038) and the F Value for “Personal
Safety and Housekeeping” was 4.771 (p=.006). This means that there is a significant
difference among one or more of the agricultural education Years Experience subgroups
in the professional development categories of “Job Knowledge” and “Personal Safety and
Housekeeping”. The Duncan’s post hoc statistical procedure (p=.50) revealed that the
two agricultural education groups with the highest number of years of experience
recorded a higher mean in the “Job Knowledge” professional development category.
However, the Duncan’s and Tukey’s post hoc procedure did not find the significant
differences that existed between the subgroups regarding the “Personal Safety and
Housekeeping” professional development category.

33
Table 9. Means and Standard Deviations o f Professional Development Categoriesby Four Years Experience Categories.
No. Categories and Descriptions
Means o f Years o f Experience Subgroups y
n=22 ri=25 n=23 n=24I to 6.9 7 to 14 15 to 20 21 to 32 Years Years Years Years
I. Quality of work- Thoroughness and acceptability of work produced or accomplished.
20.77 21.16 21.22 21.33
2. Quantity of Work- Volume of acceptable work. 20.36 20.76 21.00 20.833. Job Knowledge- Knowledge of requirements, methods,
techniques, and skills involved in the job.18.00 18.96 21.17 20.25
4. Related Work Knowledge- Knowledge of how own work impacts other areas.
18.05 18.56 19.78 18.88
5. Judgment- Soundness of conclusions, decisions, and actions. 17.36 18.20 19.70 19.136. Initiative- Ability to take effective action without being told. 18.45 19.16 19.91 19.677. Dependability- Reliability in assuming and carrying out
commitments, obligations, and assignments.22.14 22.32 22.70 22.92
8. Analytical Ability- Effectiveness in thinking through a problem.
18.73 19.00 20.57 20.00
9. Adaptability to Work Assignments- Ability to Ieam new knowledge and complete a variety of assignments.
20.55 20.48 20.74 20.29
10. Ability to Work Under Pressure- Perform under unusual circumstances and in meeting tight schedules.
18.73 19.36 19.74 18.50
11. Creativity- Ability to generate worthwhile new ideas or techniques with practical applications.
17.86 18.52 20.30 19.71
12. Planning and Organization- Ability to plan and organize workload to meet priorities.
17.95 18.96 19.78 18.38
13. Communication Skills- Effectiveness communicating with peers, supervisors, and other contacts.
19.23 18.72 19.65 18.25
14. Interpersonal Skills- Works effectively with others and in accordance with school district.
20.50 20.52 21.17 20.29
15. Leadership- Demonstration of leadership characteristics and qualities.
21.14 21.24 21.57 21.08
16. Cost Consciousness- Effective uses of school supplies, materials and service.
20.77 22.40 22.61 21.67
17. Personal Safety and Housekeeping- Demonstrates good safety practices and awareness of own personal safety and safety of others. Maintains neat and orderly work area and exhibits care and use of equipment, tools, etc.
22.05 21.40 21.09 20.75
18. Supervision Level- Amount of supervision needed as compared to the position standard.
21.18 22.88 22.87 24.83
19. Attendance and punctuality- Reports to class on a regular ■ basis, onetime and ready to work at start of day and after lunch period; devotes school hours to conduct of school/teaching assignments.
22.64 23.00 22.74 23.71
20. Conflict Resolution- Ability to handle conflict and disagreements between self and others.
16.36 17.04 18.00 17.50
y Mean calculated from a Likert-type response scale ranging from Always (5), to Nearly Always (4), to Often (3), to Occasionally (2), to Rarely (I), to Never (0).

34
Table 10. Analysis of Variance Test Results for Years Experience Subgroups Composed ________ of Agricultural Education Respondents.______________________________
MeanNo. Professional Development Category_____________df Square F Value Sig.I. Quality of Work Between Groups 3 2.614
Within Groups 43 4.386.596 .621
2. Quantity of Work Between Groups 3 5.292 Within Groups 43 6.966
.806 .497
3. Job Knowledge Between Groups 3 27.991 Within Groups 43 9.101
3.076 .038*
4. Related Work Knowledge Between Groups 3 6.703 Within Groups 43 8.780
.763 .521
5. Judgment Between Groups 3 14.304 Within Groups 43 9.319
1.535 .219
6. Initiative Between Groups 3 15.039 Within Groups 43 6.897
2.180 .104
7. Dependability Between Groups 3 2.711 Within Groups 43 7.078
.383 .766
8. Analytical Ability Between Groups 3 7.535 Within Groups 43 8.067
.934 .433
9. Adaptability to Work Assignment Between Groups 3 1.866Within Groups 43 6.611
.282 .838
10. Ability to Work Under Pressure Within Groups
Between Groups 3 1.36643 9.129
.150 .929
11. Creativity Between Groups 3 24.111Within Groups 43 11.678
2.065 .119
12. Planning and Organization Between Groups 3 7.185Within Groups 43 8.966
.801 .500
13. Communication Skills Between Groups 3 1.730Within Groups 43 6.296
.275 .843
14. Interpersonal Skills Between Groups 3 2.630Within Groups 43 6.478
.406 .749
15. Leadership Between Groups 3 2.201Within Groups 43 6.205
.355 .786
16. Cost Consciousness Between Groups 3 4.567Within Groups 43 9.319
.490 .691
17. Personal Safety and Housekeeping Between Groups 3 21.889Within Groups 43 4.588
4.771 .006*
18. Supervision Level Between Groups 3 7.087Within Groups 43 2.869
2.470 .075
19. Attendance and Punctuality Between Groups 3 6.092Within Groups 43 2.550
2.389 .082
20. Conflict Resolution Between Groups 3 4.786Within Groups 43 12.448
.384 .765
* F-Prob < .05.
35
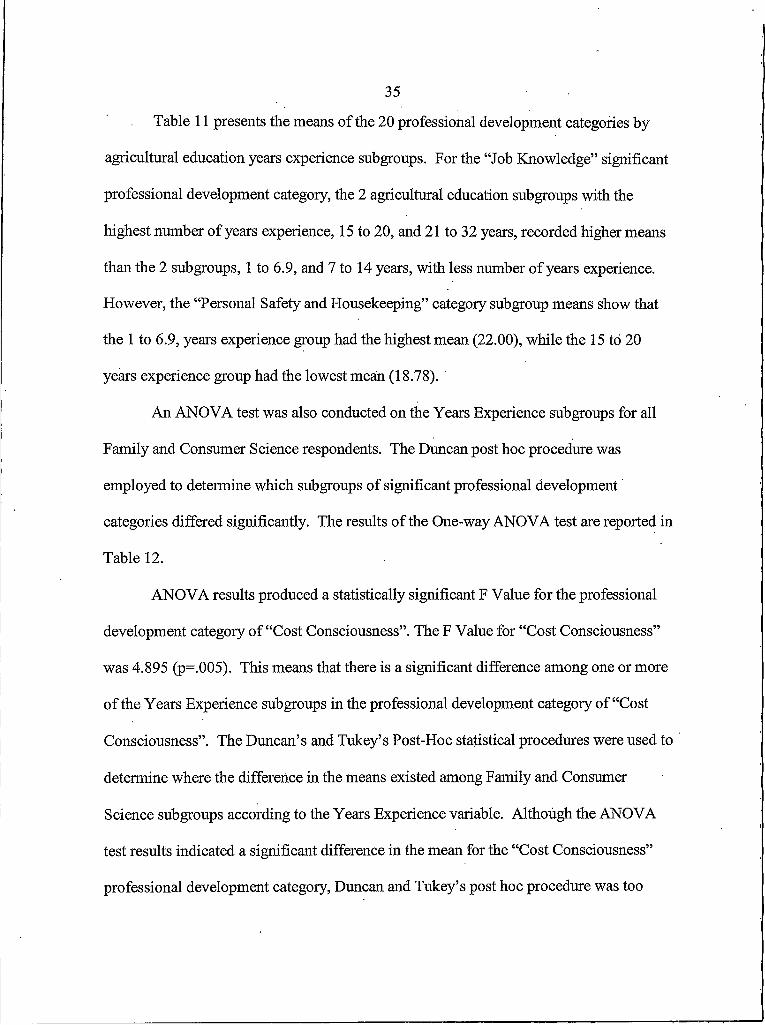
Table 11 presents the means of the 20 professional development categories by
agricultural education years experience subgroups. For the “Job Knowledge” significant
professional development category, the 2 agricultural education subgroups with the
highest number of years experience, 15 to 20, and 21 to 32 years, recorded higher means
than the 2 subgroups, I to 6.9, and 7 to 14 years, with less number of years experience.
However, the “Personal Safety and Housekeeping” category subgroup means show that
the I to 6.9, years experience group had the highest mean (22.00), while the 15 to 20
years experience group had the lowest mean (18.78).
An ANOVA test was also conducted on the Years Experience subgroups for all
Family and Consumer Science respondents. The Duncan post hoc procedure was
employed to determine which subgroups of significant professional development
categories differed significantly. The results of the One-way ANOVA test are reported in
Table 12.
ANOVA results produced a statistically significant F Value for the professional
development category of “Cost Consciousness”. The F Value for “Cost Consciousness”
was 4.895 (p=.005). This means that there is a significant difference among one or more
of the Years Experience subgroups in the professional development category of “Cost
Consciousness”. The Duncan’s and Tukey’s Post-Hoc statistical procedures were used to
determine where the difference in the means existed among Family and Consumer
Science subgroups according to the Years Experience variable. Although the ANOVA
test results indicated a significant difference in the mean for the “Cost Consciousness”
professional development category, Duncan and Tukey’s post hoc procedure was too

36
conservative to statistically determine where the difference existed among the means of
the four Years Experience subgroups for that professional development category.
Table 13 presents the means of the 20 professional development categories by
family and consumer science Years Experience subgroups. For the “Cost
Consciousness” professional development category, the two subgroups with the middle
number of years experience, 15 to 20 (23.79), and 7 to 14 (23.73), years recorded higher
means than the 2 highest years experience subgroups, 21 to 32 (21.33), and lowest
number of years experience I to 6.9 (20.71) years.

37
Table 11. Four categories of Years of Participants Means for the 20 Professional Development Categories by Agricultural Education Years Experience Subgroups. __________________
Means of Years of Experience _______ Subgroups y_______
No. Categories and Descriptions
n=15 I to 6.9 Years
n=14 7 to 14 Years
n=915 to 20 Years
n=921 to 32 Years .
I. Quality of work-Thoroughness and acceptability of 21.26 21.42 20.44 21.66
2.work produced or accomplished.Quantity of work-Volume of acceptable work. 20.80 20.85 19.55 21.33
3. Job Knowledge- Knowledge of requirements, methods, 18.06 18.71 21.33 20.77
4.techniques, and skills involved in the job.Related Work Knowledge- Knowledge of how own 18.13 18.92 19.11 20.00
5.work impacts other areas.Judgment- Soundness of conclusions, decisions, and 17.66 18.07 19.11 20.22
6.actions.Initiative- Ability to take effective action without being 18.40 19.57 19.67 21.22
7. Dependability- Reliability in assuming and carrying out 22.13 21.86 21.11 22.33
8.commitments, obligations, and assignments.Analytical Ability- Effectiveness in thinking through a 18.80 19.07 19.78 20.67
9.problem.Adaptability to Work Assignments- Ability to Ieam 20.53 20.57 20.89 21.44
10.new knowledge and complete a variety of assignments. Ability to Work Under Pressure- Perform under 19.00 19.57 18.78 19.22
11.unusual circumstances and in meeting tight schedules. Creativity- Ability to generate worthwhile new ideas or 17.67 18.79 20.22 20.89
12.techniques with practical applications. Planning and Organization- Ability to plan and 17.53 19.07 18.11 19.00
13.organize workload to meet priorities.Communication Skills- Effectiveness communicating 19.47 18.64 19.11 18.89
14.with peers, supervisors, and other contacts. Interpersonal Skills- Works effectively with others and 20.80 19.79 . 20.11 20.11
15.in accordance with school district.Leadership- Demonstration of leadership characteristics 21.67 20.79 21.11 21.56
16.and qualities.Cost Consciousness- Effective uses of school supplies, 20.80 21.36 20.78 22.22
17.materials and service.Personal Safety and Housekeeping- Demonstrates good 22.00 21.14 18.78 20.00
18.
safety practices and awareness of own personal safety and safety of others. Maintains neat and orderly work area and exhibits care and use of equipment, tools, etc. Supervision Level- Amount of supervision needed as 21.40 23.00 21.78 22.56
19.compared to the position standard.Attendance and Punctuality- Reports to class on a regular basis, onetime and ready to work at start of day 22 93 23 07 21 89 23 89
20.
and after lunch period; devotes school hours to conduct of school/teaching assignments.Conflict Resolution- Ability to handle conflict and 13 17.36 18.22 18.22
_____ disagreements between self and others.________________________________________________y Mean calculated from a Likert-type response scale ranging from Always (5), to Nearly Always (4), to Often (3), to Occasionally (2), to Rarely (I), to Never (0).

38Table 12. Analysis of Variance Test Results for Years Experience Subgroups Composed of Family and Consumer Science Respondents. ____________________
No. Professional Development Category dfMean
Square F Value Sig.I. Quality o f Work Between Groups 3• 6.441 .850 .474
Within Groups 43 7.5732 Quantity o f Work Between Groups 3 10.785 1.501 . .228
Within Groups 43 7.1843. Job Knowledge Between Groups 3 17.459 1.742 .173
Within Groups 43 10.0214. Related Work Knowledge Between Groups 3 14.960 1.846 .153
Within Groups 43 8.1055. Judgment Between Groups 3 18.639 2.339 .087
Within Groups 43 7.9686. Initiative Between Groups 3 6.913 .965 .418
Within Groups 43 6.7477. Dependability Between Groups 3 4.134 1.221 .314
Within Groups 43 3.3858. Analytical Ability Between Groups 3 14.084 1.218 .315
Within Groups 43 11.5629. Adaptability to Work Assignments Between Groups 3 3.117 .350 .789
Within Groups 43 8.90910. Ability to Work Under Pressure Between Groups 3 14.695 1.672 .187
Within Groups 43 8.78911. Creativity Between Groups 3 12.063 .953 .424
Within Groups 43 12.65812. Planning and Organization Between Groups 3 20.810 2.192 .103
Within Groups 43 9.49313. Communication Skills Between Groups 3 11.053 1.103 .358
Within Groups 43 10.01914. Interpersonal Skills Between Groups 3 9.034 1.335 .275
Within Groups 43 6.76515. Leadership Between Groups 3 7.558 1.077 .369
Within Groups 43 7.01716. Cost Consciousness Between Groups 3 27.467 4.895 .005*
Within Groups 43 5.61217. Personal Safety and Housekeeping Between Groups 3 4.789 .749 .529
Within Groups 43 6.39218. Supervision Level Between Groups 3 55.478 1.106 .357
Within Groups 43 50.17319. Attendance and Punctuality Between Groups 3 4.367 1.241 .307
Within Groups 43 3.52020. Conflict Resolution Between Groups 3 11.870 .868 .465
Within Groups 43 13.676* F-Prob < .05

39
Table 13. Means of 20 Professional Development Categories by Family and Consumer Science Years Experience Subgroups.
Means of Years of Experience _______ Subgroups y_______
No. Categories and Descriptions
n=7 I to 6.9 Years
n = ll I to 14 Years
n=14 15 to 20 Years
n=15 21 to 32 Years
I. Quality of work-Thoroughness and acceptability of work produced or accomplished.
19.71 20.82 21.71 21.13
2. Quantity of work-Volume of acceptable work. 19.43 20.64 21.93 20.533. Job Knowledge- Knowledge of requirements, methods,
techniques, and skills involved in the job.17.86 19.27 21.07 19.93
4. Related Work Knowledge- Knowledge of how own work impacts other areas.
17.86 18.09 20.21 18.20
5. Judgment- Soundness of conclusions, decisions, and actions.
16.71 18.36 20.07 18.47
6. Initiative-Ability to take effective action without being 18.57 18.64 20.07 18.73
7. Dependability- Reliability in assuming and carrying out commitments, obligations, and assignments.
22.14 22.91 23.71 23.27
8. Analytical Ability- Effectiveness in thinking through a problem.
18.57 18.91 21.07 19.60
9. Adaptability to Work Assignments- Ability to Ieam new knowledge and complete a variety of assignments.
20.57 20.36 20.64 19.60
10. Ability to Work Under Pressure- Perform under unusual circumstances and in meeting tight schedules.
18.14 19.09 20.36 18.07
11. Creativity- Ability to generate worthwhile new ideas or techniques with practical applications.
18.29 18.18 20.36 19.00
12. Planning and Organization- Ability to plan and organize workload to meet priorities.
18.86 18.82 20.86 18.00
13. Communication Skills- Effectiveness communicating with peers, supervisors, and other contacts.
18.71 18.82 20.00 17.87
. 14. Interpersonal Skills- Works effectively with others and in accordance with school district.
19.86 21.45 21.86 20.40
15. Leadership- Demonstration of leadership characteristics and qualities.
20.00 21.82 21.86 20.80
16. Cost Consciousness- Effective uses of school supplies, materials and service.
20.71 23.73 23.79 21.33
17. Personal Safety and Housekeeping- Demonstrates good safety practices and awareness of own personal safety and safety of others. Maintains neat and orderly work area and exhibits care and use of equipment, tools, etc.
22.14 21.73 22.57 21.20
18. Supervision Level- Amount of supervision needed as compared to the position standard.
20.71 22.73 23.57 26.20
19. Attendance and punctuality- Reports to class on a regular basis, on time and ready to work at start of day and after lunch period; devotes school hours to conduct of school/teaching assignments.
. 22.00 22.91 23.29 23.60
20. Conflict Resolution- Ability to handle conflict and disagreements between self and others.
. 15.14 16.64 17.86 17.07
y Mean calculated from a Likert-type response scale ranging from Always (5), to Nearly Always (4), to Often (3), to Occasionally (2), to Rarely (I), to Never (0).

40
CHAPTER 5
CONCLUSIONS, IMPLICATIONS and RECOMMENDATIONS
This study measured a population of agricultural education and family and
consumer science teachers’ self-perception toward 20 professional development-related
categories and attempted to identify relationships between teaching characteristics such as
years experience, teaching profession and teachers' self-perceptions toward professional
development categories. Agricultural education and family and consumer science
teachers were grouped by demographic variables in order to conduct further analysis of
data.
Further quantitative and qualitative research is heeded to identify other variables
that influence an educator’s perceived confidence toward professional development
topics. With sufficient evidence generated from this instrument, administrators, educators
and academic program coordinators could develop workshops that would focus on the
professional development needs and perceptions of agricultural education and family and
consumer science educators. Academic administrators may wish to consider
administering this instrument to teachers through numerous methods: inrservice, PIR
days, extended workshops and other related opportunities
To fulfill the purpose of this study, the following objectives were identified.
Agricultural educators were surveyed to:
I . The instrument used in this study was adapted for educational purposes from an
industrial setting. Therefore, an objective of this study was to establish overall
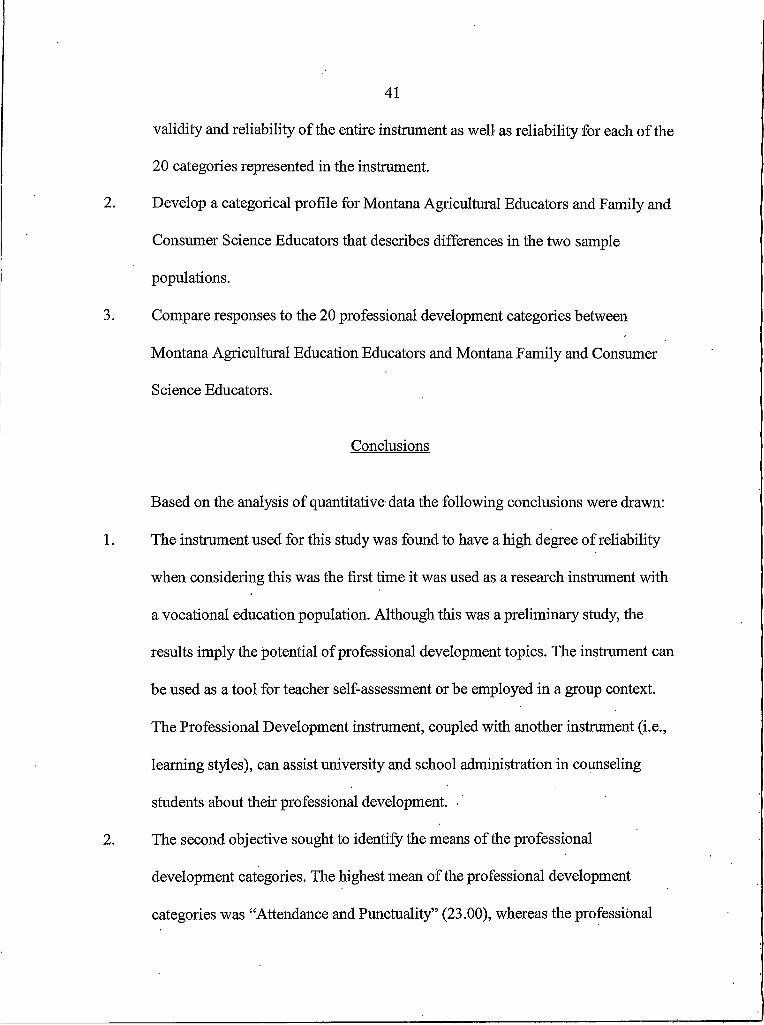
41
validity and reliability of the entire instrument as well as reliability for each of the
20 categories represented in the instrument.
2. Develop a categorical profile for Montana Agricultural Educators and Family and
Consumer Science Educators that describes differences in the two sample
populations.
3. Compare responses to the 20 professional development categories between
Montana Agricultural Education Educators and Montana Family and Consumer
Science Educators.
Conclusions
Based on the analysis of quantitative data the following conclusions were drawn:
1. The instrument used for this study was found to have a high degree of reliability
when considering this was the first time it was used as a research instrument with
a vocational education population. Although this was a preliminary study, the
results imply the potential of professional development topics. The instrument can
be used as a tool for teacher self-assessment or be employed in a group context.
The Professional Development instrument, coupled with another instrument (i.e.,
learning styles), can assist university and school administration in counseling
students about their professional development.
2. The second objective sought to identify the means of the professional
development categories. The highest mean of the professional development
categories was “Attendance and Punctuality” (23.00), whereas the professional

42
development category with the lowest mean was “Conflict Resolution” (17.54). A
mean for a category (possible high score of 25) between 25-20 is considered a
strength with little or no development needed in this area; a mean between 19-15
is considered within normal range for this academic work performance factor; a
mean score between 14-10 indicates a need for improvement needed for this
academic work performance factor; and a mean between 9-0 denotes a need for
immediate improvement in this academic performance factor. Although no means
were in the lowest range, some respondents did score in this range. All
respondents were given an opportunity to determine their individual scores as a
means to identify professional development categories where they may need to
focus their attention. The three highest category means for Montana Family and
Consumer Science educators were “Supervision Level” (23.77), “Attendance and
Punctuality” (23.14) and “Dependability” (23.14) tied, and “Cost Consciousness”
(22.58). The lowest means for Montana Family and Consumer Science educators
were “Conflict resolution” (16.89) and “Judgment” (18.64).
3. The third objective sought to determine significant categorical difference between
and among subgroups of Montana Agricultural Education Teachers And Montana
Family And Consumer Science Educators. A T- test was employed to make
comparisons between Montana Family and Consumer Science educator and
Agricultural educator respondent means for each of the twenty professional
development categories. Three categories “Dependability’ (p=.008), “Cost
Consciousness” (p=.025) and “Personal Safety and Housekeeping” (p=.028), were
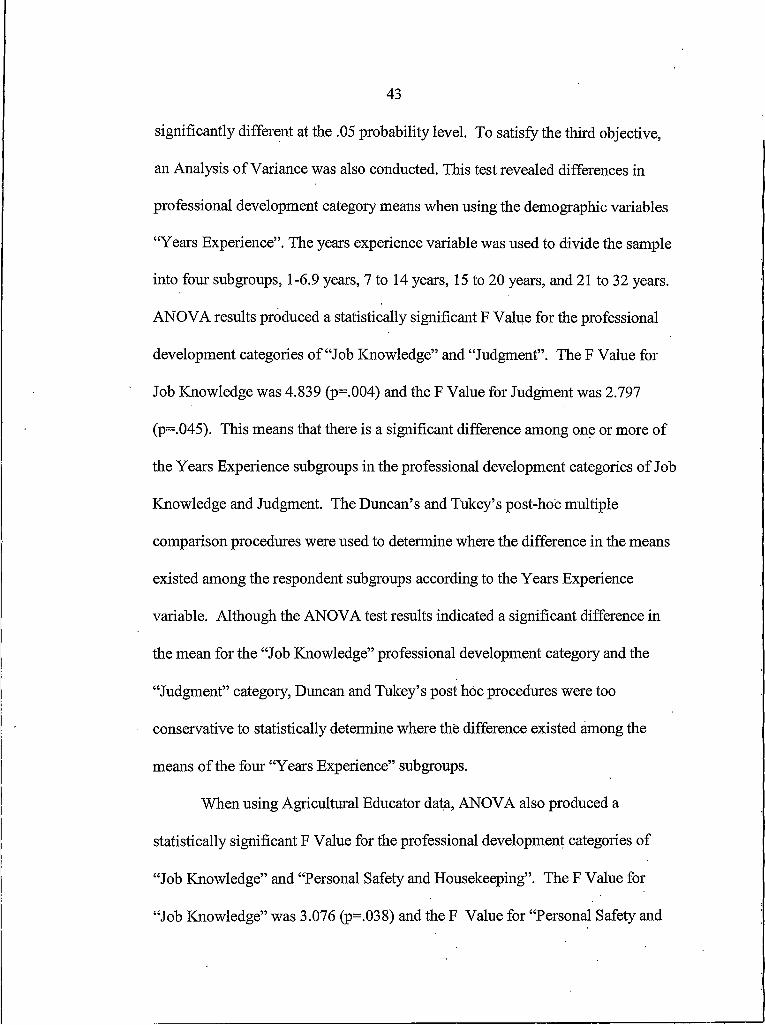
43
significantly different at the .05 probability level. To satisfy the third objective,
an Analysis of Variance was also conducted. This test revealed differences in
professional development category means when using the demographic variables
“Years Experience”. The years experience variable was used to divide the sample
into four subgroups, 1-6.9 years, 7 to 14 years, 15 to 20 years, and 21 to 32 years.
ANOVA results produced a statistically significant F Value for the professional
development categories of “Job Knowledge” and “Judgment”. The F Value for
Job Knowledge was 4.839 (p=.004) and the F Value for Judgment was 2.797
(p=.045). This means that there is a significant difference among one or more of
the Years Experience subgroups in the professional development categories of Job
Knowledge and Judgment. The Duncan’s and Tukey’s post-hoc multiple
comparison procedures were used to determine where the difference in the means
existed among the respondent subgroups according to the Years Experience
variable. Although the ANOVA test results indicated a significant difference in
the mean for the “Job Knowledge” professional development category and the
“Judgment” category, Duncan and Tukey’s post hoc procedures were too
conservative to statistically determine where the difference existed among the
means of the four “Years Experience” subgroups.
When using Agricultural Educator data, ANOVA also produced a
statistically significant F Value for the professional development categories of
“Job Knowledge” and “Personal Safety and Housekeeping”. The F Value for
“Job Knowledge” was 3.076 (p=.038) and the F Value for “Personal Safety and

44
Housekeeping” was 4.771 (p=006). This means that there is a significant
difference among one or more of the agricultural education Years Experience
subgroups in the professional development categories of “Job Knowledge” and
“Personal Safety and Housekeeping”. The Duncan’s post hoc statistical procedure/
(p=.50) revealed that the two agricultural education groups with the highest
number of years of experience recorded a higher mean in the “Job Knowledge”
professional development category. However, the Duncan’s and Tukey’s post
hoc procedures did not find the significant differences that existed between the
subgroups regarding the “Personal Safety and Housekeeping” professional
development category. When used to group respondents, the highest years of
experience subgroups were found to have significantly higher means for the
professional development categories of “Job Knowledge” and “Personal Safety
and Housekeeping”.
An analysis of variance test was also conducted on the Years Experience
subgroups for all family and consumer science respondents. The Duncan post hoc
procedure was employed to determine which subgroups of significant professional
development categories differed significantly. This ANOVA produced a
statistically significant F Value for the professional development category of
“Cost Consciousness”. The F Value for “Cost Consciousness” was 4.895
(p=.005). ,This means that there is a significant difference among one or more of
the Years Experience subgroups in the professional development category of
“Cost Consciousness”. The Duncan’s and Tukey’s post-hoc statistical procedures

45
were used to determine where the difference in the means existed among family
and consumer science subgroups according to the Years Experience variable.
Although the ANOVA test results indicated a significant difference in the mean
for the “Cost Consciousness” professional development category, Duncan and
Tukey’s post hoc procedures were too conservative to statistically determine
where the difference existed among the means of the four Years Experience
subgroups for that professional development category.
Implications
The results imply the potential utility of this study’s instrument and provide for
implications within the education profession. The analysis of survey responses led to the
following:
1. The results suggest that inservice coordinators can use teachers with “more years
of experience” as a resource in order to integrate professional development topics
of this study within technical agriculture. Many of the professional topics in this
study can be considered a complement to effective teaching. For example, from
the results it is noted that teachers with more years of experience had a better
perception of “Job Knowledge and Judgment” than did younger, less experienced
teachers.
2. The results of this study also suggest that inservice coordinators should look at
using vocational educators from outside their specific discipline as a resource
when designing and conducting inservice with their specific discipline.

46
3. Some professional development inservice could be provided by professional
peers. When grouped by years of experience, results showed that respondents
with more years experience scored higher than respondents with less years of
experience in some professional development categories. Teachers with more
years of experience should be considered as a resource for professional
development initiatives.
4. Results revealed this study’s instrument may also be pertinent in other areas of
vocational education and public education. Such research can also contribute to
identifying professional development needs of other educators.
5. Besides its use in specific areas of professional education, the instrument may
have use within one school system. Administrators could use potential survey
results to provide direction to school-wide professional development inservice.
.6. A responsibility exists for organizations, such as university educators and
Montana Office of Public Instruction, already performing professional
development activities to consider utilizing this instrument to integrate the type of
professional development discussed in this study into specific technical training.
Recommendations
The entire research process, including review of literature, collection and analysis
of data, and consideration of comments made by survey respondents, committee members
and others led the researcher to make the following recommendations:

47
1. With sufficient evidence generated from this instrument, university advisors and
in-service program coordinators should develop workshops that would focus on
the lowest professional development category perceptions of Agricultural
Education and Family and Consumer Science teachers.
2. A new professional development component to an existing inservice program,
specific to vocational education, should be developed as soon as possible. It
should consider using vocational educators with more years of experience for
some professional development inservice subjects. It should also cross
professional inservice where Family and Consumer Science teachers may provide
inservice to Agricultural Education instructors.
3. Professional development of the kind focused on in this study should be made an
integral part of college studies for those pursuing teaching degrees in agriculture.
4. The professional development categories of this study complement good teaching
and should be integrated into technical inservice workshops.
5. It is recommended that further use of this instrument include a reduction of the
number of questions and categories to make the instrument more usable and thus
increase the response rate, yet still obtain data from which decisions can be made
regarding professional development.

48
BIBLIOGRAPHY
49
Anderson, T. J.,(1988). Responsibilities and evaluation criteria for Idaho vocational- technical education professional development programs. Unpublished doctoral dissertation, The Ohio State University, Columbus., (p. 211).
Bail, J. P., and Shinn, G. C. (1982). “Inservice Education for Teachers Of Agriculture,” in A. L. Berkley, ed., Teacher Education in Agriculture (2nd ed.) Danville, IL: Interstate Printers and Publishers, Inc.(p. 183-195).
Barrick, K. R. and Hughes, M. (1992). Responsibilities of Vocational Teacher Education for Ohio Vocational Teacher Professional Development (Summary Report). Department of Agricultural Education, The Ohio State University. (Eric Document Reproduction Service No. ED 351 454).
Brown, B.L. Vocational Teacher Professional Development. Practice Application Brief number 11. Columbus: ERIC Clearinghouse on Adult, Career, and Vocational Education, the Ohio State University, 2000. (p.1-22). http ://www. ericacve. org/fulltext. asp.
Camp, W. G., (1988). Professional development of teachers of vocational education. In M. Griggs, R. (p.7)
Camp, W. G., and Camp, - Heath, B., (1993). Professional Development: The Beginning Teachers Perspective The Agricultural Education Magazine, February, 1993 (p. 12-14).
Cook, CJ., and Fine, C. Critical Issue: Finding Time For Professional Development. Oak Brook, IL.: North Central Regional Educational Laboratory, 2000.(p.4) http ://www.ncrel.org/sdrs/areas/issues/educatrs/profdevl/pd300.htm
Cruickshank, D. R. and Armaline, W. D. (1986). Field experiences in teacher education: Considerations and recommendations. Journal of Teacher Education, 37 (3), 34- 40.
Finch, C.(1999). Using Professional Development to Meet Teachers’Changing Needs: What We Have Learned. Centerpoint no. 2. Berkeley, CA: National Center for Research in Vocational Education,(ED 428 259).
Finch, R. and Crunkilton, R. (1999). Curriculum Development in Vocational and Technical Education. (5th ed.) Allyn and Bacon Publishers.
Gall, M., Borg, W. and Gall, P. (1996) Educational Research an Introduction. (6th ed.) Longman Publishers USA., (p.390)

50
Goals 2000: Educate America Act (1994), Pub.L. No. 103-336,102,4(A),8.
Goodland, J. (1983) A place called school. New York: McGraw- Hill, (p.18)
Hall, D. E., and Scanlon, D. C., (1990). Factors related to the participation of Agricultural education teachers in professional development activities. Proceedings of the National Agricultural Education Research Meeting, 17th, Cincinnati, Ohio, November, 1990. (p.242-248), (Eric Document Reproduction Service No. ED 336 529).
Hamilton, J.B.,and McElroy, J. (1983, December). Approaches to technological update of vocational/technical teachers. Paper presented at the Annual American Vocational Association Convention, Anaheim, CA.(Eric Document Reproduction Service No. ED 237 637). (p.3)
Hartley, N.K., Brookhart, D.A.and Smith, G.P. (1990). An analysis of the professional development needs of Colorado vocational educators (Final Report), (p.381). Denver; Colorado State Community College and Occupational Education System. (Eric Document Reproduction Service No. ED 344 051)
Hawley, W.D., and Valli L. Learner-Centered Professional Development. Phi Delta Kappa Research Bulletin no. 27 (August 2000): 7-10. Holmes Group. (1986). Tomorrow’s teachers. East Lansing, MI: Author.
Howell, F.M. (1989). Rural Education Reform and rural youth in the United States: Some thoughts with special reference to the South. In Rural Education: A changing landscape, (p. 9-16). Washington, DC: U.S. Department of Education, Office of Educational Research and Improvement.
Lovelace, B. E., and La Brecque, S. V. (1991). Professional improvement needs of faculty of postsecondarv technical/vocational programs (Summary Report)(p.l I). Austin: Texas Higher Education Coordinating Board.(Eric Document Reproduction Service No. ED 335 522)
Martin, W. H., (1967) “Development of Teacher Education in Agriculture,” in V. R.Cardozier, ed., Teacher Education in Agriculture. 1st ed., Danville, IL. Interstate Printers and Publishers, Inc. (p. 6).
Microsoft Corporation (1996). Microsoft Excel. Version 6.(!Microsoft Corporation.
Miller, M.D. (1975). A state model for vocational inservice education. Theory in practice, 14 (I),52.58.

51
Mitchell, M. (2002). Indexes of Intemal Consistency. Research Design Explained Home Page. http://spsp.clarion.edu/mm/RDE3/c3/C3Handout32.html
Murphy, C. (1997). Finding Time to Study Together. Journal of Staff Development 18. no.3 (Summer of 1997): (p.29-32). http://www.nsdc.org./library/jsd/murphyl 83.html
National Research Council Committee on Agricultural Education in Secondary Schools, (1988), Understanding agriculture: New directions for education. Washington,DC: National Academy Press.
Reyes, D. J., Alter, G. T. and Smith, R. B. (1986). Applying teacher effectivenessresearch in the classroom. Northern Illinois University, Dekalb. (Eric Document Reproduction Service No. ED 274 105). (p. 56).
Ryan, R. L. (1987). The complete inservice staff development program. Englewood Cliff, NI: Prentice Hall.
Schmuck, R. A. and Schmuck, P. A. (1992). Small districts, big problems: Making schools everybody’s house. Newbury Park, CA: Corwin Press, Inc.
Seltzer, D. A., and Himley, 0. T. (1995). A Model for Professional Development and School Improvement in Rural Schools. Journal of Research in Rural Education. Spring, 1995, Vol. 11, No.I, (p.36-44).
SPSS Inc. (1997). SPSS-X for MS Windows Release 7.5. Chicago. IL: SPSS Inc.
True, A. C.,(1929). A History of Agricultural Education: 1785-1925. Miscellaneous Publication No. 36, USD A, Washington, D.C., U.S. Government Printing Office, (p. 273 - 276).
Udell, G. G., comp.(1993). Laws Relating to Vocational Education and AgriculturalExtension Work. Section 703, Public Law 347, 64th U.S. Congress, Washington, D.C., U.S. Government Printing Office, (p. 4-11).
Wolpert, E. M. (1984). The state’s responsibility for teacher education: Some views/p . 11 Washington D.C.: The National Committee for Excellence in Teacher Education. (Eric Document Reproduction Service No. ED 250 301).

APPENDICES

53
APPENDIX A
RESPONDENT CORRESPONDENCE

54
B O Z E M A N
Department o f EducationAgricultural and Technology Education Cheever Hall .MSU • Bozeman Bozeman, MT 59717-0374Telephone (406) 994-3201 Fax (406) 994-6696
May 9,1997
Dear Educator;
Identifying Professional Development needs is an initial step toward increasing a teacher’s professional growth. As part of my graduate program at Montana State University-Bozeman, we are conducting a survey in conjunction with my study to determine the Professional Development needs of Family and Consumer Science and Agricultural Science Educators in Montana.
To gain a state wide educational perspective, you have been selected to participate in this survey. The enclosed survey has been tested on-campus at MSU-Bozeman and Northwest College in Powell, Wyoming by educators with a common interest - improving their professional development
Ynur imnut is imnortant! All information submitted to us will be kept confidential and will only.be used for purposes related to this study. No individuals or schools shall be identified. The survey instrument should take no more than forty-five minutes of your valuable time.
You will find that the enclosed instrument has a complete instruction sheet within the suney packet Please refer to this sheet to complete the survey. The packet includes a pre-paid, self addressed return envelope. Please return the appropriate information in this envelope. The remainder of the packet is yours to keep for future reference.
Please take the time to complete the survey and its related contents. We hope that the information you obtain from this survey will act as a benchmark to guide your own professional development and possibly help others in the education profession.
Please return mv ennv of the survey bv Mav 20.1997. Upon completion of this project, we will bappilv furnish vou with a report of the findings. Please complete and return this postcard, even if vou are not interested in a copy of the study results. If you are interested, please fill out the pertinent information on the post card on the inside front cover of this survey.
If vou have anv questions or concerns, please feel free to contact us at any time. We can be reached at 406-994-577*8 in the daytime or 406-586-6351 in the evening. We are looking forward to receiving , your completed survey and comments.
Thank you for your time and trouble.
Sincerely,
James C. HaferGraduate StudentMontana State University-Bozeman
Dr. Marty Frick Assistant Professor ■Montana State University-Bozeman

55
Dear Educator
Within the next week, you will receive a request to complete a Professional Development Survey. As part of a research program at Montana State Univcrsity-Bozcman, this survey is being conducted to address the current state and the future needs of Professional Dev elopment in the Family and Consumer Science Education field.
The survey will require approximately 45 minutes of your valuable time. Using the materials provided in the survey, upon completion, you should know where you as an Educator stand in the area of Professional Development Once this information is compiled, we will know where we are headed as a profession. Your assistance with this project is greatly appreciated.
Thank you in advance for your help.
Sincerely,
Laurie StelterFamily and Consumer Science Specialist

56
DearEducaton
Please return this postage-paid postcard as soon as you receive your survey to acknowledge its arrival
Name (PRINTED):__________________________ — -
Mailing Address (PRINTED): ----------------------------- ---------------------- ------- •
Signature:_________________________ _______ •
Please indicate when you will return the completed survey forms. Check one:
________ I will return the completed survey forms by May 20, 1997.
I will return the completed survey forms by:.________________ .' (Fill in Date)
Ifyou would like a report of the summarized findings of this study, please check below.
________Yes, I would like a copy of the summarized findings.

57
Dear Educator:I recently sent you a survey dealing with Professional Development To date I have not received your response. Believe me, I know how busy this time of the year can be, yet I truly need vourhelp. Ifyou have yet to complete your survey, would you please take the time to do so and return the appropriate forms to me. I would greatly appreciate your response. Please rest assured that all responses will be kept confidential. I f you have already completed the survey and returned it to me, thank you and disregard this notice!
Ifyou should need an additional copy of the Professional Development survey instrument, or if you have any questions please feel free to call me at (406) 994-5778 or 994-3201.
Thank you for your time and dedication towards this survey. I hope that your comments and effort put forth will prove to have a positive impact on professional development in Montana’s public schools.
Sincerely,
James Hafer Graduate Student Agricultural Education

APPENDIX B
SURVEY INSTRUMENT
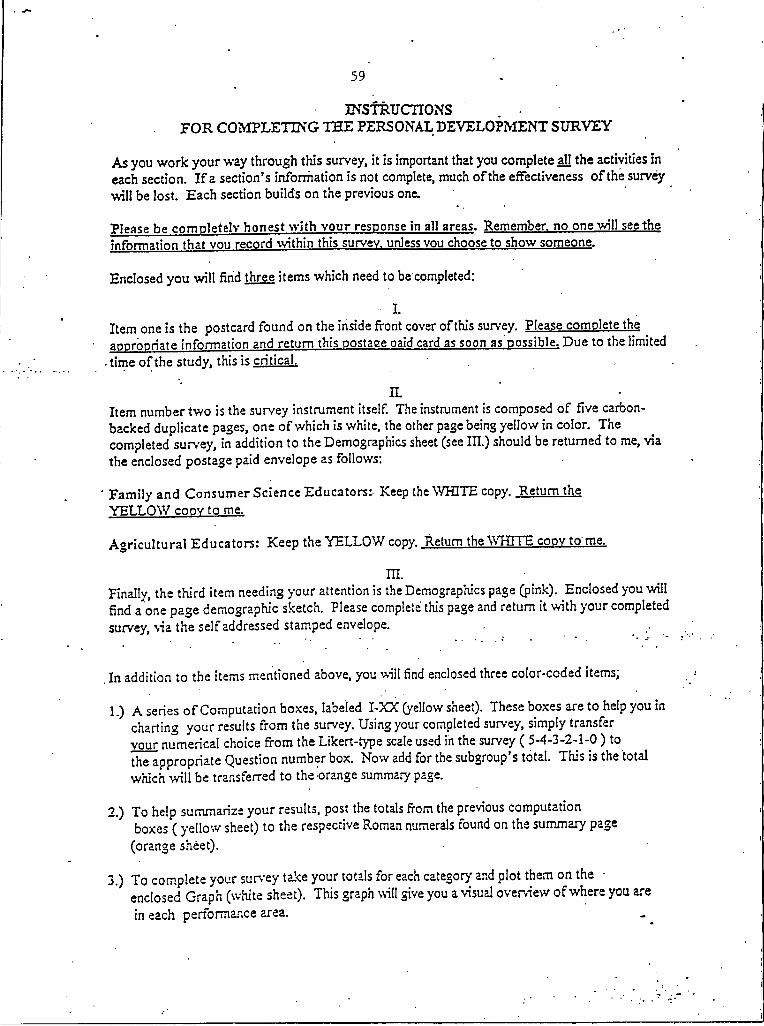
59INSTRUCTIONS
f o r c o m p l e t in g t h e pe r so n a l d e v e l o p m e n t s u r v e y
As you work your way through this survey, it is important that you complete all the activities in each section. Ifa section’s information is not complete, much of the effectiveness of the survey will be lost. Each section builds on the previous one.
Please be completely honest with vour response in all areas. Remember, no one will seethe information that you record within this survey, unless vou choose to show someone.
Enclosed you will find three items which need to be completed:
• I
Item one is the postcard found on the inside front cover of this survey. Please complete the appropriate information and return this postage paid card as soon as possible. Due to the limited time of the study, this is critical
n.Item number two is the survey instrument itself. The instrument is composed of five carbon- backed duplicate pages, one of which is white, the other page being yellow in color. The completed survey, in addition to the Demographics sheet (see III.) should be returned to me, via the enclosed postage paid envelope as follows:
Family and Consumer Science Educators:- Keep the WHITE copy. Return the YELLOW copy to me.
Agricultural Educators: Keep the YELLOW copy. Return the WHITE copy to me.
H I .
Finally, the third item needing your attention is the Demographics page (pink). Enclosed you will find a one page demographic sketch. Please complete this page and return it with your completed survey, via the self addressed stamped envelope.
In addition to the items mentioned above, you will find enclosed three color-coded items;
I.) Aseries of Computation boxes, labeled I-XX (yellow sheet). These boxes are to help you in charting your results from the survey. Using your completed survey, simply transfer vour numerical choice from the Likert-type scale used in the survey ( 5-4-3-2-I-O ) to the appropriate Question number box. Now add for the subgroup’s total. This is the total which will be transferred to the orange summary page.
2.) To help summarize your results, post the totals from the previous computationboxes ( yellow sheet) to the respective Roman numerals found on the summary page
(orange sheet).
3.) To complete your survey take your totals for each category and plot them on the •enclosed Graph (white sheet). This graph will give you a visual overview of where you are in each performance area.

60
PROFESSIONAL DEVELOPMENT SURVEY
DEMOGRAPHICS INFORMATION SHEET
Please read each of lhe following statements and respond appropriately. Please check only one item under each , heading unless otherwise instructed. Please rest assured that your responses will be held in the strictest confidentiality! When finished, please return this sheet with your completed survey. Please find enclosed a self-addressed, postage-paid envelope for your convenience.
THANK Y O U !!
1. ) Age:_____ .
2. ) Gender: (please circle one) MALE FEMALE
3. ) Number of years in the Teaching profession:_______ .
4. ) Other experience; business, industry, professional, etc. (please circle one) YES NOIf YES, how many years experience:_______ .
5 ) Are you currently, or have you ever been affiliated with any Professional organizations? (please circle one) YES NO If YES, please LIST these affiliations below:
Are you now, or have you ever held any ofilce(s) with a Professional organization®? (please circle one) Y E S NO If YES, please LIST below 03ice(s) held:
How satisfied arc you with your career choice? (please circle one response from the list below)
Always - 4 MostoftheT im e- 3. Occasionally “ 2 Seldom - I . Never = O '
How often are you actively involved in self-snidy/improvement activities of more than two (2)" consecutive hours? (please cirde'one choice from the list below)
■ i.) Annually 3.) Quart:-'!/ 5.) Bi-monthly 7.) Bi-weekly 2.) Semi-annually 4.) Monthly 6.) Weekly 8.) Other----------------------- -
Who do you feel has the responsibility of developing criteria for Professional Development within" the public schools of Montana?.________________ __________________-------------------------
How should Professional Development be funded?.
11.) How should Professional Development be delivered at the secondary level? (e.g.. inservice, workshops, etc)
Thank’s again for your time! . “•
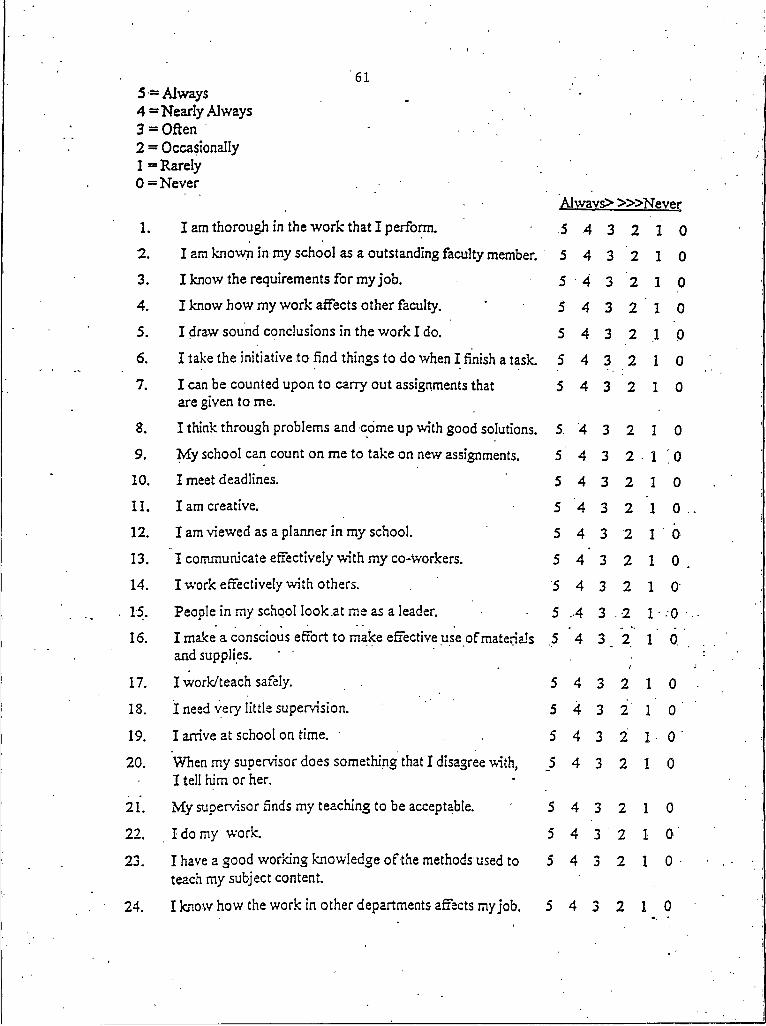
615 = Always 4 =NearlyAlways 3 = Often 2 = Occasionally I=RareIy O = Never
AIwavs> »>N ever
I. I am thorough in the work that I perform. 5 4 3 2 I 02. I am known in my school as a outstanding faculty member. 5 4 3 2 I 03. I know the requirements for my job. 5 4 3 2 I 04. I know how my work affects other faculty. 5 4 3 2 I 05. I draw sound conclusions in the work I do. 5 4 3 2 I P6. I take the initiative to find things to do when I finish a task. 5 4 3 2 I 07. I can be counted upon to carry out assignments that
are given to me.5 4 3 2 I 0
8. I think through problems and come up with good solutions. 5. 4 3 2 I 09. My school can count on me to take on new assignments. 5 4 3 2 I 010. I meet deadlines. 5 4 3 2 I 0
1 1 . I am creative. 5 4 3 2 I 012. I am viewed as a planner in my school. 5 4 3 2 I 6
13. I communicate effectively with my co-Workers. 5 4 3 2 I 0 ,
14. I work effectively with others. 5 4 3 2 I 0
15. People in my school look .at me as a leader. 5 A 3 2 I • o •16. I make a conscious effort to make effective use of materials 5 4 3 2 I 6.
and supplies.
17. I work/teach safely. 5 4 3 2 I 0
18. I need very little supervision. 5 4 3 2 I 0
19. I arrive at school on time. ■ 5 4 3 2 I 0
20. When my supervisor does something that I disagree with, I tell him or her.
_5 4 3 2 I 0
21. My supervisor finds my teaching to be acceptable. 5 4 3 2 I 0
22. I do my work. 5 4 3 2 I 0
23. I have a good working knowledge of the methods used to teach my subject content.
5 4 3 2 I 0
24. I know how the work in other departments affects my job. 5 4 3 2 I 0

625=* Always 4 = Nearly Always 3 = Often 2 = Occasionally I = Rarely 0 = Never
A lw a v s » » Never
25. I make sensible decisions. 5 4 3 2 I. 0
26. IfI see a job that needs to be done, I do it. 5 4 3 2 I 0
Tl. My supervisor knows I will meet deadlines. 5 4 3 2 I 0
28. I am good at analyzing problems. 5 4' 3 2 I 0
29. I like a variety of assignments. 5 4 3 2 I 0
30. I am not bothered by tight schedules. ■ ■ 5 4 3 2 I 0
31. I have generated innovative methods to solve problems in 5 4 3 2 I 0my teaching area.
32. When I have more than one task to do, 5 4 3 2 I 0I can quickly decide what needs to be done first.
33. I communicate easily with supervisors and administrators. 5 4 : 3 2 I 0
34. I try to treat everyone fairly. 5 4 3 2 I 0
35. When I believe in the “rightness” o f a position, 5 4 3 2 I 0I strongly support that position.
36. I save my department money through my work/ 5 4 3 2 I 0teaching practices.
37. I stay alert to my personal safety. • 5 4 3 2 I 0
38. Once I am told what needs to be done, I do it. 5 4 3 2 I 0
39. I am ready to work when my lunch break is over. 5 4 3 2 I 0
40. When faced with conflict with another staff member, 5 4 3 2 I 0I tackle the problem head on, instead of avoiding it.
41. I pay very close attention to the details of 5 4 3 2 I 0tasks assigned to me.
42. I work quickly and accurately. 5 4 3 2 I 0
43. I am an expert in my field. 5 4 3 2 I 0
44. ' I know what the other departments are doing. 5 4 3 2 I 0
45. I make solid judgments in the actions I take. S 4 3 2 .1 0
46. I take on many new assignments at my request. 5 4 3 2. I 0

63
5 = Always 4 = Nearly Always3 = Often .2 = Occasionally .I = Rarely 0 = Never
Always » > > Never
47. I am reliable. 5 4 3 2 I 0
48. I am asked to solve problems because I am good at “seeing” all sides.
5 4 3 2 I 0
49. I work on several assignments at the same time. 5 4 3 2 I 0
50. I can handle the pressure of meeting an aggressive schedule.
5 4 3 2 I 0
51. . My school relies on me to come up with new ideas.
5 4 3 2 I 0
52. I am very organized. 5 4 ' 3 2 I 0
53. When I have a problem to resolve, I usually talk to people face-to-face rather than over the phone or via
5 4 3 2 I 0
memos.
"54. I work hard at getting along with people. 5 4 3 2 I 0
55. I strive to be a good influence on the people with whom I work.
5 4 3 .2 I 0
56. I work very hard to be as cost effective as possible. 5 4 3 2 I 0
57. I look out for the safety of colleagues. 5 4 3 2 I 0
58. •I try to solve problems myself before bringing them 5 •4 - 3 2 I 0to my supervisor.
59. I do not leave school before the designated quitting time. 5 4 3 2 I 0
60. . When I have a disagreement with a colleague,I resolve it face-to-face, rather than going to my supervisor.
5 •.4 3 2 I 0 .
61. I pride myself in the quality of my work. 5 4 3 2 "I 0
62.. I pride myseif in being a "high producer." 5 4 3 2 I 0
63. I possess the skills to perform my job with excellence.
5 4 ■3 2 I Q '
64. When I am working on something that will affect my 5 4 3 2 I Qcolleagues, I let them know what I am doing.
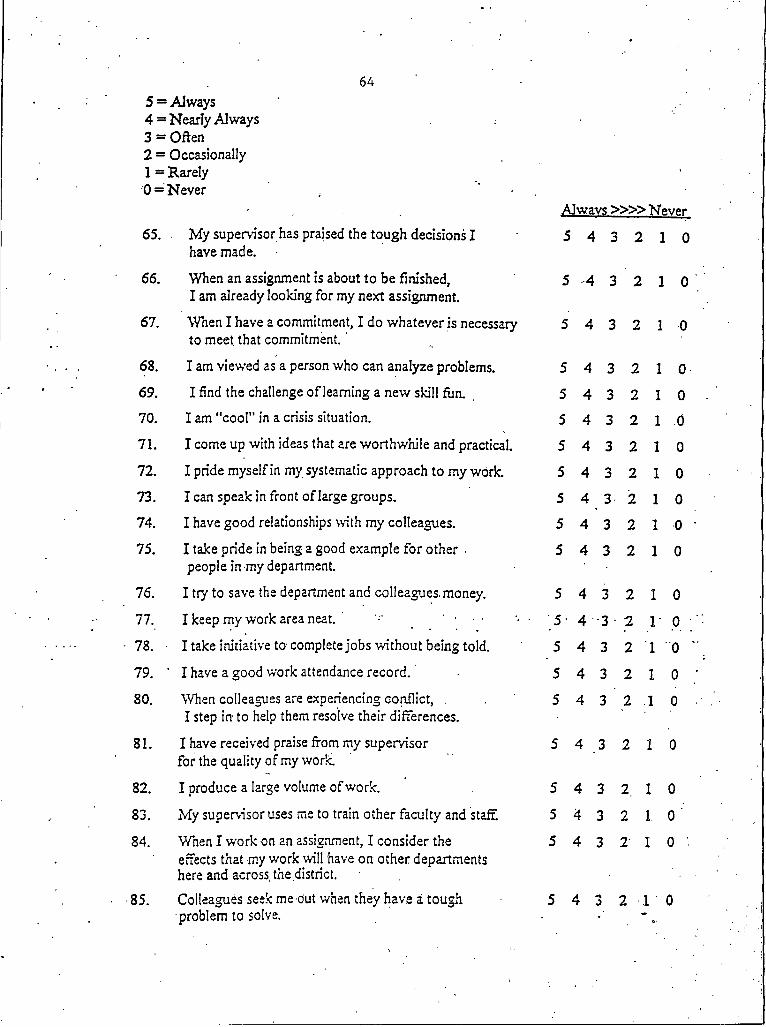
645 =* Always 4 = Nearly AJways 3 - Often 2 = Occasionally I = Rarely O = Never
Alwavs » » Never
65. My supervisor has praised the tough decisions I have made.
5 4 3 2 I 0
66. When an assignment is about to be finished,I am already looking for my next assignment.
5 4 3 2 I 0
67. When I have a commitment, I do whatever is necessary to meet, that commitment.'
5 4 3 2 I 0
68. I am viewed as a person who can analyze problems. 5 4 3 2 I 069. I find the challenge of learning a new skill fun. 5 4 3 2 I 070. I am "cool" in a crisis situation. 5 4 3 2 I 071. I come up with ideas that are worthwhile and practical. 5 4 3 2 I 072. I pride myself in my systematic approach to my work. 5 4 3 2 I 073. I can speak in front of large groups. 5 4 3 2 I 074. I have good relationships with my colleagues. 5 4 3 2 I 0 •75. I take pride in being a good example for other •
people in my department.5 4 3 2 I 0
76. I try to save the department and colleagues, money. 5 4 3 2 I 0
77. I keep my work area neat. • 5 4 3 - 2 I 0 _78. ■ I take initiative to complete jobs without being told. 5 4 3 2 I 0 '
79. '' I have a good work attendance record. 5 4 3 2 I 0
80. When colleagues are experiencing conflict, .I step in to help them resolve their differences.
5 4 3 2 I 0
81. I have received praise from my supervisor for the quality of my work.
5 4 3 2 I 0
82. I produce a large volume of work. 5 4 3 2 I 0
83. My supervisor uses me to train other faculty and staff. 5 4 3 2 I 0
84. When I work on an assignment, I consider the effects that my work will have on other departments here and across, the district.'
5 4 3 2 I 0
85. Colleagues seek me out when they have a tough ■problem to solve.
5 4 3 2 I 0

655 = Always 4 =Nearly Always 3 = Often 2 = OccasionallyI = Rarely 0 = Never
Alwavs » » Never
86. My supervisor commends me for taking effective action without being told.
5 4 3 2 I 0
87. When people ask me for help with a task, they can be sure they will get it.
5 4 3' 2 I 0
88. I am very.logical in solving problems. 5 4 3 2 I 0
89. I adapt quickly to changes in procedures and policies. 5 4 3 2 I 0
90. I have been complemented on the way I handle high stress situations.
5 4 3 2 • I 0
91. I enjoy the challenge of coming up with new original ideas that really work.
5 4 3 2 I 0
92. I can immediately place my hands on information that my supervisor requests.
5 4 3 2 I 0
93. I am an effective writer. 5 4 3 2 I 0
94. I know how to ask for a favor and get results. . 5 4 3 2 I 0
95. I like to help other people excel. 5 4 3 2 I 0
96. I watch what I spend out of budgets over which I am responsible.
5 4 3 2 I 0
97. I take good care of my resources and equipment. 5 4 3 2 I 0
98. Once my supervisor tells me what to do, I don’t 5 4 3 2 I 0
need a lot of additional direction. ..
99: I devote my hours' at work to doing the tasks I am assigned. ■5" 4 -T 2 I 0 -
100. Ifa colleague does something that I believe is wrong, I tell the colleague face-to-face.
5 4 3 2 I 0
ADDITIONAL COMMENTS:

66
Record the number circled for each question in the appropriate box. Then add to find the total for each group.
I
QuestionNumber
Number
I
21
41
61
SI
Total
.IL
Question . Number
Number
2
22
42
62
82
Total
HL
QuestionNumber
Number
2
23
43
63
83
Total
r / . •
QuestionNumber
Number
4
24
44
64
84
Total
QuestionNumber
QuestionNumber
Number QuestionNumber
Number QuestionNumber
Number
DC.
QuestionNumber
Number
9
29
49 '
69
89
Total
X.QuestionNumber
Number
10
30
50
70
90
Total - Total .
(Over)

67
XHLQuestionNumber
Number
13
33
53
73
93
Total
XVH
QuestionNumber
Number
17
37
57
77
97
Total
Xiv..QuestionNumber
Number
14
34
54
74
94
Total
x v m
QuestionNumber
Number
13
33
53
78
93
Total
XV.
QuestionNumber
Number
1535557595Total
X IX
QuestionNumber
Number
19
39
59
79
99
Total
XVLQuestionNumber
Number
16
36 ' •
56
76 .
96
Total
X X
QuestionNumber
Number.
20
40
60
SO"
100
Total
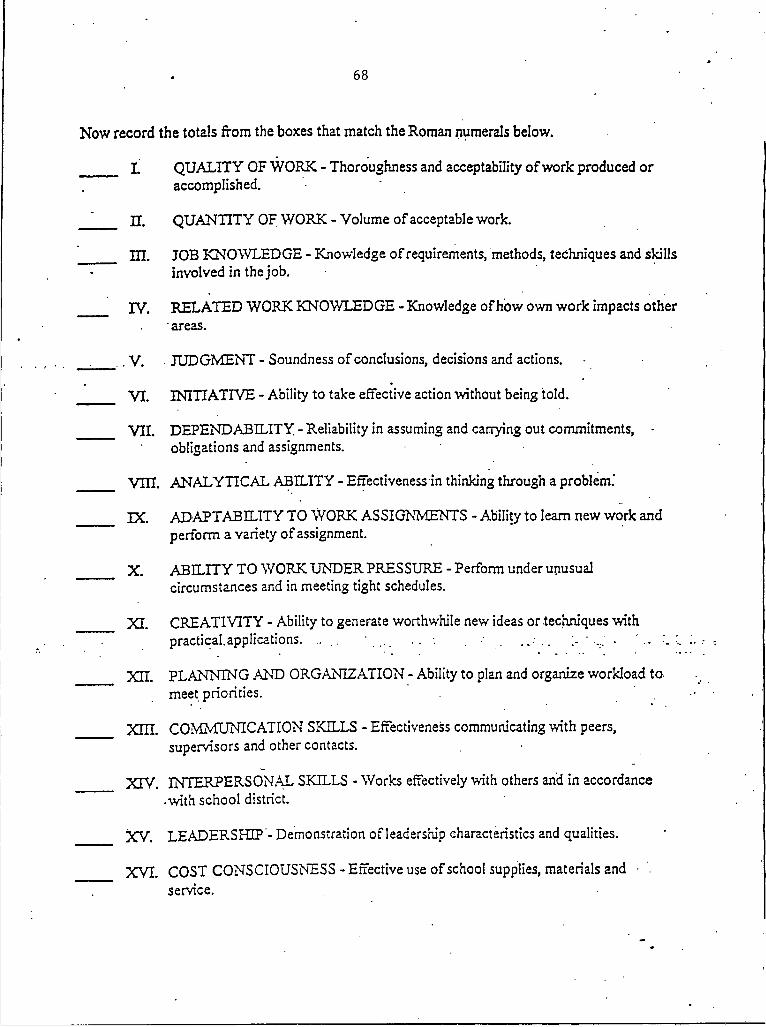
68
Now record the totals from the boxes that match the Roman numerals below.
I QUALITY OF WORK - Thoroughness and acceptability of work produced or accomplished.
n. QUANTITY OF WORK - Volume of acceptable work.
m. JOB KNOWLEDGE - Knowledge of requirements, methods, techniques and skills involved in the job.
____i IV. RELATED WORK KNOWLEDGE - Knowledge of how own work impacts other ■ areas.
v. . JUDGMENT - Soundness of conclusions, decisions and actions.
VI. INITIATIVE - Ability to take effective action without being told.
VII. DEPENDABILITY. - Reliability in assuming and carrying out commitments, obligations and assignments.
V m . ANALYTICAL ABILITY - Effectiveness in thinking through a problem."
DC. ADAPTABILITY TO WORK ASSIGNMENTS - Ability to Ieam new work and perform a variety of assignment.
X. ABILITY TO WORK UNDER PRESSURE - Perform under unusual circumstances and in meeting tight schedules.
XI. CREATIVITY - Ability to generate worthwhile new ideas or techniques with practical, applications. . . . . . . . . . . ■ .... . "...
xn. PLANNING AND ORGANIZATION - Ability to plan and organize workload tomeet priorities. . ■
X m . COMMUNICATION SKILLS - Effectiveness communicating with peers, supervisors and other contacts.
XTV. INTERPERSONAL SKILLS - Works effectively with others and in accordance .with school district.
XV. LEADERSHIP - Demonstration of leadership characteristics and qualities.
XVI. COST CONSCIOUSNESS - Effective use of school supplies, materials and • service.
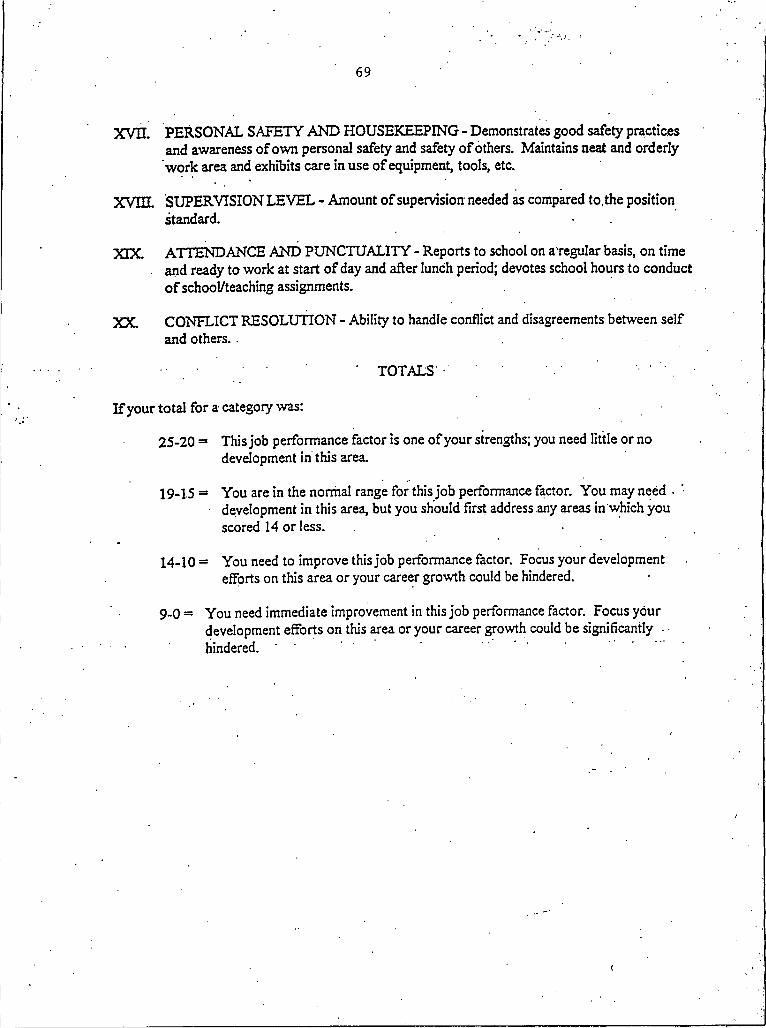
69
XVII. PERSONAL SAFETY AND HOUSEKEEPING - Demonstrates good safety practices and awareness of own personal safety and safety o f others. Maintains neat and orderly work area and exhibits care in use of equipment, tools, etc.
XVIIL SUPERVISION LEVEL - Amount of supervision needed as compared to, the position standard.
XIX ATTENDANCE AND PUNCTUALITY - Reports to school on a regular basis, on time. and ready to work at start of day and after lunch period; devotes school hours to conduct
o f school/teaching assignments.
X X CONFLICT RESOLUTION - Ability to handle conflict and disagreements between self and others.
TOTALS
I f your total for a category was:
25-20 = This job performance factor is one of your strengths; you need little or no development in this area.
1 9 -1 5 = You are in the normal range for this job performance factor. You may need • development in this area, but you should first address any areas in which you scored 14 or less.
14-10 = You need to improve this job performance factor. Focus your development efforts on this area or your career growth could be hindered.
9_0 = You need immediate improvement in this job performance factor. Focus your development efforts on this area or your career growth could be significantly • hindered. ' ' ' ' . . . . . .

MONTANA STATE UNIVERSITY - BOZEMAN
3 1762 03591