Embed Size (px)
Citation preview
University of IowaIowa Research Online
Theses and Dissertations
2012
Ammonia Production at Ambient Temperatureand Pressure: An Electrochemical and BiologicalApproachTimothy Michael PaschkewitzUniversity of Iowa
Copyright 2012 Timothy M. Paschkewitz
This dissertation is available at Iowa Research Online: http://ir.uiowa.edu/etd/4893
Follow this and additional works at: http://ir.uiowa.edu/etd
Part of the Chemistry Commons
Recommended CitationPaschkewitz, Timothy Michael. "Ammonia Production at Ambient Temperature and Pressure: An Electrochemical and BiologicalApproach." PhD (Doctor of Philosophy) thesis, University of Iowa, 2012.http://ir.uiowa.edu/etd/4893.
AMMONIA PRODUCTION AT AMBIENT TEMPERATURE AND PRESSURE:
AN ELECTROCHEMICAL AND BIOLOGICAL APPROACH
by
Timothy Michael Paschkewitz
An Abstract
Of a thesis submitted in partial ful�llmentof the requirements for the Doctor ofPhilosophy degree in Chemistryin the Graduate College ofThe University of Iowa
May 2012
Thesis Supervisor: Associate Professor Johna Leddy
1
ABSTRACT
The majority of power generated worldwide is from combustion of fossil fuels.
The sustainability and environmental impacts of this non renewable process are
severe. Alternative fuels and power generation systems are needed, however, to
cope with increasing energy demands. Ammonia shows promise for use in power
generation, however it is costly to produce and very few methods of using it as a fuel
are developed. To address the need for alternative methods of ammonia synthesis,
this research designed and tested a bioelectrochemical device that generates NH3
through electrode induced enzyme catalysis. The ammonia generating device
consists of an electrode modi�ed with a polymer that contains whole cell Anabaena
variabilis, a photosynthetic cyanobacterium. A. variabilis contains nitrogenase and
nitrate/nitrite reductase, catalysts for the production of ammonia. In this system,
the electrode supplies driving force and generates a reductive microenvironment
near cells to facilitate enzymatic production of NH3 at ambient temperatures and
pressures.
Farm animal wastes contain signi�cant amounts of NO�2 and NO�3 , which can
leech into groundwater sources and contaminate them. The system described here
recycles NO�2 and NO�3 to NH
+4 by the nitrate/nitrite reductase enzyme. Unlike
nitrogen �xation by the nitrogenase enzyme whose substrate is atmospheric N2, the
substrates for nitrate/nitrite reductase are NO�2 and NO�3 . The ammonia produced
by this system shows great potential as a crop fertilizer.
While the substrates and enzymatic basis for ammonia production by nitrogenase
and nitrate/nitrite reductase are very di¤erent, there is utility in the comparison
2
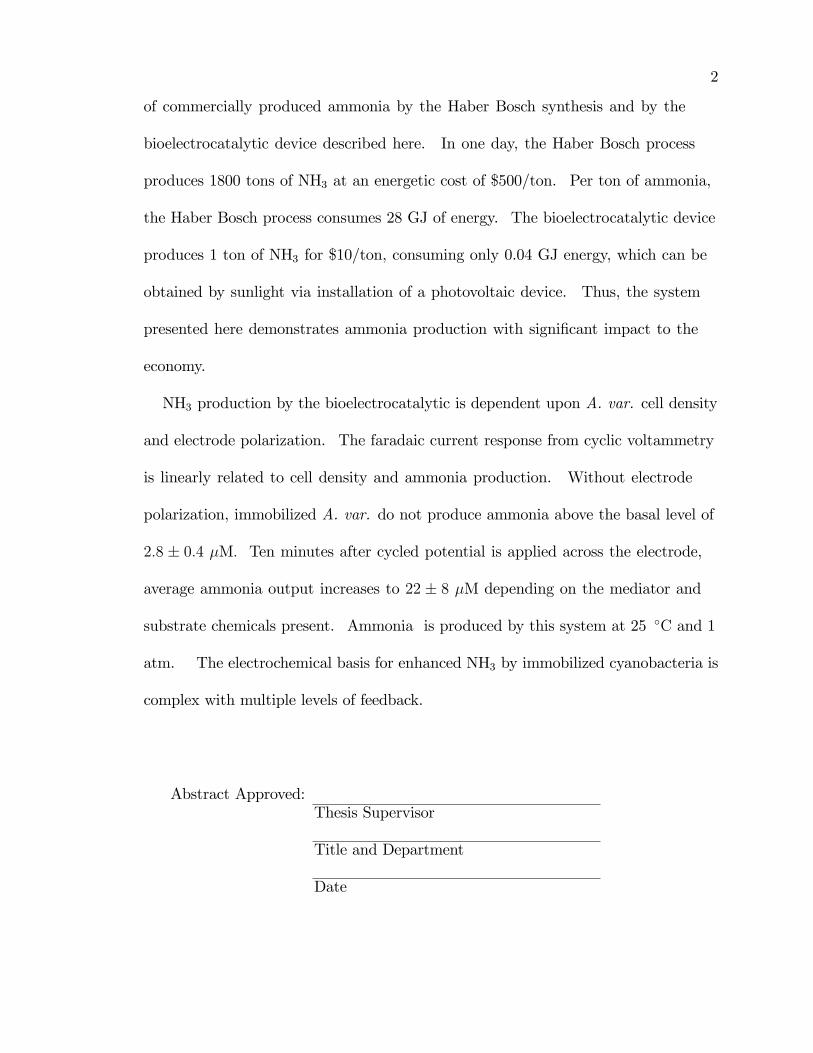
of commercially produced ammonia by the Haber Bosch synthesis and by the
bioelectrocatalytic device described here. In one day, the Haber Bosch process
produces 1800 tons of NH3 at an energetic cost of $500/ton. Per ton of ammonia,
the Haber Bosch process consumes 28 GJ of energy. The bioelectrocatalytic device
produces 1 ton of NH3 for $10/ton, consuming only 0.04 GJ energy, which can be
obtained by sunlight via installation of a photovoltaic device. Thus, the system
presented here demonstrates ammonia production with signi�cant impact to the
economy.
NH3 production by the bioelectrocatalytic is dependent upon A. var. cell density
and electrode polarization. The faradaic current response from cyclic voltammetry
is linearly related to cell density and ammonia production. Without electrode
polarization, immobilized A. var. do not produce ammonia above the basal level of
2:8 � 0:4 �M: Ten minutes after cycled potential is applied across the electrode,
average ammonia output increases to 22 � 8 �M depending on the mediator and
substrate chemicals present. Ammonia is produced by this system at 25 �C and 1
atm. The electrochemical basis for enhanced NH3 by immobilized cyanobacteria is
complex with multiple levels of feedback.
Abstract Approved:Thesis Supervisor
Title and Department
Date
AMMONIA PRODUCTION AT AMBIENT TEMPERATURE AND PRESSURE:
AN ELECTROCHEMICAL AND BIOLOGICAL APPROACH
by
Timothy Michael Paschkewitz
A thesis submitted in partial ful�llmentof the requirements for the Doctor ofPhilosophy degree in Chemistryin the Graduate College ofThe University of Iowa
May 2012
Thesis Supervisor: Associate Professor Johna Leddy

Copyright by
TIMOTHY MICHAEL PASCHKEWITZ
2012
All Rights Reserved
Graduate CollegeThe University of Iowa
Iowa City, Iowa
CERTIFICATE OF APPROVAL
PH.D. THESIS
This is to certify that the Ph.D. thesis of
Timothy Michael Paschkewitz
has been approved by the Examining Committee for the thesisrequirement for the Doctor of Philosophy degree in Chemistryat the May 2012 graduation.
Thesis Committee:Johna Leddy, Thesis Supervisor
Ned Bowden
Lei M. Geng
Amnon Kohen
Tonya Peeples

To my father, Michael Andrew Paschkewitz.
ii

ACKNOWLEDGMENTS
Without supportive friends, family, peers, and advisors, completing this body of
work would not likely have been possible. I sincerely thank my advisor, Professor
Johna Leddy for her caring support, advice, encouragement and guidance. It was
truly a privilege to work with such an accomplished scientist. I wish to thank present
and past students of the Leddy lab with whom I worked, Murat Unlu, Stephanie
Schmidt, Heung Chan Lee, Chester Duda, Garett Lee, Perry Motsegood, Jessica
Jewett, Krysti Knoche, Sarah Cyrus, and Emily Mrugacz for all their support. I
also thank Michael Ivanov and David Rotsch for helpful conversations, support, and
guidance along the way. For �nancial assistance, I acknowledge the the Iowa Energy
Center.
While this page cannot accommodate the list of persons for whom I wish to
acknowledge, I have the space to name a few. For endless love and support
throughout this long journey, I thank Nana, Mom, Heidi, Dave, Sarah, and Andy.
I acknowledge all my Wisconsin friends, too numerous to name, but certainly, you
know who you are. Lastly, but not least signi�cantly, I thank Michael Combs for
putting up with me and being there when my stress levels would drive away just
about anyone. You�ve been with me through the best and worst parts of this process
for the last couple years. Only bigger and better things can come next. Thank
you, everyone.
iii
TABLE OF CONTENTS
LIST OF TABLES . . . . . . . . . . . . . . . . . . . . . . . . . . . . . . . . . . . . . . . . . . . . . . . . . . . . . . . . . . . . . . . . vii
LIST OF FIGURES. . . . . . . . . . . . . . . . . . . . . . . . . . . . . . . . . . . . . . . . . . . . . . . . . . . . . . . . . . . . . . . ix
CHAPTER
1. INTRODUCTION . . . . . . . . . . . . . . . . . . . . . . . . . . . . . . . . . . . . . . . . . . . . . . . . . . . . . . . . . . . . . 1
1.1 Renewable Energy Outlook . . . . . . . . . . . . . . . . . . . . . . . . . . . . . . . . . . . . . . . . . . . . . . . . 21.2 Ammonia as a Fuel . . . . . . . . . . . . . . . . . . . . . . . . . . . . . . . . . . . . . . . . . . . . . . . . . . . . . . . . 41.3 Haber Bosch Synthesis. . . . . . . . . . . . . . . . . . . . . . . . . . . . . . . . . . . . . . . . . . . . . . . . . . . . . 61.4 Biological Production of Ammonia . . . . . . . . . . . . . . . . . . . . . . . . . . . . . . . . . . . . . . . . 9
1.4.1 Reaction Center Chemicals of Interest . . . . . . . . . . . . . . . . . . . . . . . . . . . . . 141.4.2 Ammonia Production by Biological Nitrogen Fixation
(Nitrogenase) . . . . . . . . . . . . . . . . . . . . . . . . . . . . . . . . . . . . . . . . . . . . . . . . . . . . . . 181.4.3 Ammonia Production by Enzymatic Conversion of Fixed
Nitrogen Sources (Nitrate/Nitrite Reductase Enzyme) . . . . . . . . . . . . 221.4.4 Nitrogenase and Nitrate/Nitrite Reductase Relationship . . . . . . . . . . 24
1.5 Research Goals . . . . . . . . . . . . . . . . . . . . . . . . . . . . . . . . . . . . . . . . . . . . . . . . . . . . . . . . . . . 26
2. EXPERIMENTAL BACKGROUND AND DESIGN . . . . . . . . . . . . . . . . . . . . . . . . . . 28
2.1 Cyanobacteria . . . . . . . . . . . . . . . . . . . . . . . . . . . . . . . . . . . . . . . . . . . . . . . . . . . . . . . . . . . . 292.1.1 Anabaena variabilis . . . . . . . . . . . . . . . . . . . . . . . . . . . . . . . . . . . . . . . . . . . . . . . . 30
2.2 Cell Culture . . . . . . . . . . . . . . . . . . . . . . . . . . . . . . . . . . . . . . . . . . . . . . . . . . . . . . . . . . . . . . 342.2.1 Monitoring Culture . . . . . . . . . . . . . . . . . . . . . . . . . . . . . . . . . . . . . . . . . . . . . . . . 352.2.2 Density Assays . . . . . . . . . . . . . . . . . . . . . . . . . . . . . . . . . . . . . . . . . . . . . . . . . . . . . 35
2.3 Cell Immobilization . . . . . . . . . . . . . . . . . . . . . . . . . . . . . . . . . . . . . . . . . . . . . . . . . . . . . . . 402.3.1 Na�on . . . . . . . . . . . . . . . . . . . . . . . . . . . . . . . . . . . . . . . . . . . . . . . . . . . . . . . . . . . . . 402.3.2 Trimethyloctadecyl Ammonium Bromide Modi�ed Na�on . . . . . . . . . 432.3.3 Film Casting . . . . . . . . . . . . . . . . . . . . . . . . . . . . . . . . . . . . . . . . . . . . . . . . . . . . . . . 45
2.4 Electroanalytical Methods . . . . . . . . . . . . . . . . . . . . . . . . . . . . . . . . . . . . . . . . . . . . . . . . 492.4.1 Cyclic Voltammetry. . . . . . . . . . . . . . . . . . . . . . . . . . . . . . . . . . . . . . . . . . . . . . . . 492.4.2 Three Electrode Cell . . . . . . . . . . . . . . . . . . . . . . . . . . . . . . . . . . . . . . . . . . . . . . . 522.4.3 Experimental Parameters . . . . . . . . . . . . . . . . . . . . . . . . . . . . . . . . . . . . . . . . . . 532.4.4 Quanti�cation of Ammonia Production . . . . . . . . . . . . . . . . . . . . . . . . . . . . 55
2.5 Bioelectrocatalytic Device Design . . . . . . . . . . . . . . . . . . . . . . . . . . . . . . . . . . . . . . . . 602.5.1 Experimental Setup . . . . . . . . . . . . . . . . . . . . . . . . . . . . . . . . . . . . . . . . . . . . . . . . 61
iv
3. AMMONIA GENERATION BY ELECTRODE IMMOBILIZEDANABAENA VARIABILIS . . . . . . . . . . . . . . . . . . . . . . . . . . . . . . . . . . . . . . . . . . . . . . . . . . . 64
3.1 Background . . . . . . . . . . . . . . . . . . . . . . . . . . . . . . . . . . . . . . . . . . . . . . . . . . . . . . . . . . . . . . . 643.2 Experimental . . . . . . . . . . . . . . . . . . . . . . . . . . . . . . . . . . . . . . . . . . . . . . . . . . . . . . . . . . . . . 67
3.2.1 Cyclic Voltammetric Analysis of System . . . . . . . . . . . . . . . . . . . . . . . . . . . 673.2.2 Ammonia Quanti�cation Method . . . . . . . . . . . . . . . . . . . . . . . . . . . . . . . . . . 693.2.3 Chlorophyll a Assay . . . . . . . . . . . . . . . . . . . . . . . . . . . . . . . . . . . . . . . . . . . . . . . 703.2.4 Total Protein Assay. . . . . . . . . . . . . . . . . . . . . . . . . . . . . . . . . . . . . . . . . . . . . . . . 71
3.3 Results . . . . . . . . . . . . . . . . . . . . . . . . . . . . . . . . . . . . . . . . . . . . . . . . . . . . . . . . . . . . . . . . . . . 713.3.1 Initial Voltammetric Response and Ammonia Output . . . . . . . . . . . . . 733.3.2 Cofactor, Chemical, and Substrate E¤ects . . . . . . . . . . . . . . . . . . . . . . . . . 803.3.3 Cell Disruption Experiments . . . . . . . . . . . . . . . . . . . . . . . . . . . . . . . . . . . . . . 1083.3.4 E¤ect of gases and pH . . . . . . . . . . . . . . . . . . . . . . . . . . . . . . . . . . . . . . . . . . . . 1143.3.5 Suppression of Nitrogenase and Nitrate/Nitrite Reductase
Speci�c Analyses. . . . . . . . . . . . . . . . . . . . . . . . . . . . . . . . . . . . . . . . . . . . . . . . . . 1213.4 Summary . . . . . . . . . . . . . . . . . . . . . . . . . . . . . . . . . . . . . . . . . . . . . . . . . . . . . . . . . . . . . . . . 139
4. DEVELOPMENT OF MECHANISTIC MODEL FRAMEWORK FORAMMONIA PRODUCTION . . . . . . . . . . . . . . . . . . . . . . . . . . . . . . . . . . . . . . . . . . . . . . . . . 143
4.1 Model Considerations . . . . . . . . . . . . . . . . . . . . . . . . . . . . . . . . . . . . . . . . . . . . . . . . . . . . 1434.1.1 Redox Reactions . . . . . . . . . . . . . . . . . . . . . . . . . . . . . . . . . . . . . . . . . . . . . . . . . . 1454.1.2 Nitrate/Nitrite Reductase Production of Ammonia . . . . . . . . . . . . . . . 1544.1.3 Model Simpli�cations . . . . . . . . . . . . . . . . . . . . . . . . . . . . . . . . . . . . . . . . . . . . . 160
4.2 Model. . . . . . . . . . . . . . . . . . . . . . . . . . . . . . . . . . . . . . . . . . . . . . . . . . . . . . . . . . . . . . . . . . . . 1644.3 Results . . . . . . . . . . . . . . . . . . . . . . . . . . . . . . . . . . . . . . . . . . . . . . . . . . . . . . . . . . . . . . . . . . 1654.4 Discussion . . . . . . . . . . . . . . . . . . . . . . . . . . . . . . . . . . . . . . . . . . . . . . . . . . . . . . . . . . . . . . . 167
5. CONCLUSIONS . . . . . . . . . . . . . . . . . . . . . . . . . . . . . . . . . . . . . . . . . . . . . . . . . . . . . . . . . . . . . 173
5.1 Increased Ammonia Production Depends on Electrode Polarization . . . . . 1735.2 Ammonia Production at Ambient Temperature and Pressure. . . . . . . . . . . 1745.3 Nitrate/Nitrite Reductase Enzyme Electrochemically Accessible . . . . . . . . 1755.4 Mechanistic Framework Model . . . . . . . . . . . . . . . . . . . . . . . . . . . . . . . . . . . . . . . . . . 1765.5 Possible Impacts and Signi�cance . . . . . . . . . . . . . . . . . . . . . . . . . . . . . . . . . . . . . . . 1775.6 Comparison to Haber Bosch Commercial Synthesis and Research
Signi�cance . . . . . . . . . . . . . . . . . . . . . . . . . . . . . . . . . . . . . . . . . . . . . . . . . . . . . . . . . . . . . . 178
6. FUTURE WORK . . . . . . . . . . . . . . . . . . . . . . . . . . . . . . . . . . . . . . . . . . . . . . . . . . . . . . . . . . . . 184
6.1 Thermodynamic Considerations . . . . . . . . . . . . . . . . . . . . . . . . . . . . . . . . . . . . . . . . . 1856.2 Further Kinetic Evaluation . . . . . . . . . . . . . . . . . . . . . . . . . . . . . . . . . . . . . . . . . . . . . . 1866.3 Biological Considerations . . . . . . . . . . . . . . . . . . . . . . . . . . . . . . . . . . . . . . . . . . . . . . . . 1876.4 Experimental Considerations . . . . . . . . . . . . . . . . . . . . . . . . . . . . . . . . . . . . . . . . . . . . 188
v

APPENDIX
A.ANABAENA VARIABILIS CULTURE PROTOCOL AND METHODS . . . . 190
B. KINETIC MODEL DERIVATION. . . . . . . . . . . . . . . . . . . . . . . . . . . . . . . . . . . . . . . . . . . 198
REFERENCES . . . . . . . . . . . . . . . . . . . . . . . . . . . . . . . . . . . . . . . . . . . . . . . . . . . . . . . . . . . . . . . . . . 202
vi
LIST OF TABLES
Table
1. Comparison of the energy density of common fuels. . . . . . . . . . . . . . . . . . . . . 6
2. Listing of chemical substrates and corresponding enzymeconsidered in this research. . . . . . . . . . . . . . . . . . . . . . . . . . . . . . . . . . . . . . . . . 67
3. Total protein, Chlorophyll a density, and reverse wave currentmeasurements in di¤erent Anabaena variabilis SA-1 cellsuspension:TMODA Na�on suspension (v/v) ratios. . . . . . . . . . . . . . . . . . . 77
4. Values of NH3 concentration, Chl a density, and reductive peakcurrent obtained after voltammetric perturbation of the systemwhen NADPH is added to the electrolyte. . . . . . . . . . . . . . . . . . . . . . . . . . . . 89
5. Values of NH3 concentration, Chl a density, and reductive peakcurrent at 1:1 (v/v) cells:TMODA Na�on modi�ed electrodesafter voltammetric perturbation of the system when ferredoxinsare added to the background electrolyte. . . . . . . . . . . . . . . . . . . . . . . . . . . . . 92
6. Values of NH3 concentration, Chl a density, and reductive peakcurrent at 1:1 (v/v) cells:TMODA Na�on modi�ed electrodesafter voltammetric perturbation of the system when chemicalcofactors are independently added to 0.1 M Na2SO4. . . . . . . . . . . . . . . . . . 100
7. Faradaic peak current measurements from 1:1 (v/v) cell:TMODANa�on modi�ed electrodes after successive additions of chemicalcofactors to 0.1 M Na2SO4. . . . . . . . . . . . . . . . . . . . . . . . . . . . . . . . . . . . . . . 108
8. Faradaic peak current measurements from disrupted cell electrode�lms. . . . . . . . . . . . . . . . . . . . . . . . . . . . . . . . . . . . . . . . . . . . . . . . . . . . . . . . . . 113
9. Summary of observations when various gases are introduced tothe electrochemical cell. . . . . . . . . . . . . . . . . . . . . . . . . . . . . . . . . . . . . . . . . . 117
10. Quantitative values of NH3 concentration, Chl a density, andreductive peak current with wild type or SA-1 mutant A. var.strains used in the preparation of 1:1 (v/v) cells:TMODA Na�onmodi�ed electrodes after voltammetric perturbation of the system. . . . . . 132
11. List of experimental conditions tested to explore ammoniaproduction by nitrate/nitrite reductase after cyclic voltammetricperturbation at 1:1 (v/v) Anabena variabilis SA-1:TMODANa�on electrodes. . . . . . . . . . . . . . . . . . . . . . . . . . . . . . . . . . . . . . . . . . . . . . . . 134
vii
12. Values of chlorophyll a concentration, reductive peak current,and current density for each experiment designated in Table 11. . . . . . . . 135
13. Listing of possible NO�2 and NO�3 and redox reactions at various
pH. . . . . . . . . . . . . . . . . . . . . . . . . . . . . . . . . . . . . . . . . . . . . . . . . . . . . . . . . . . . 148
14. Possible redox reactions of intermediate nitrogen containingspecies that may contribute to ammonia production bynitrate/nitrite reductase at various pH. . . . . . . . . . . . . . . . . . . . . . . . . . . . . 149
15. Listing of intermediate species and cofactor redox reactionsconsidered in this research. . . . . . . . . . . . . . . . . . . . . . . . . . . . . . . . . . . . . . . . 151
16. Energy balance calculations comparing the Haber Bosch synthesisand process described by this research. . . . . . . . . . . . . . . . . . . . . . . . . . . . . . 181
A1. Listing of Standard Reagents used to prepare BG-110 media. . . . . . . . . . . 194
A2. Listing of Trace Metals Mix components of which 1 mL is addedto 1 L BG-110 media. . . . . . . . . . . . . . . . . . . . . . . . . . . . . . . . . . . . . . . . . . . . 194
viii
LIST OF FIGURES
Figure
1. Illustration of the interrelated reaction centers in Anabaenavariabilis. . . . . . . . . . . . . . . . . . . . . . . . . . . . . . . . . . . . . . . . . . . . . . . . . . . . . . . . 10
2. The chemical structure of the amino acid backbone. . . . . . . . . . . . . . . . . . 11
3. The stepwise reductions of the adenosine molecule, the backboneof ATP. . . . . . . . . . . . . . . . . . . . . . . . . . . . . . . . . . . . . . . . . . . . . . . . . . . . . . . . . 16
4. Structure and reaction pathway for the nitrogenase enzyme. . . . . . . . . . . . 20
5. Schematic representation of the nitrogenase enzyme. . . . . . . . . . . . . . . . . . . 21
6. Representation of the nitrate/nitrite reductase enzyme. . . . . . . . . . . . . . . . 24
7. 50� bright�eld image of Anabaena variabilis SA-1. . . . . . . . . . . . . . . . . . . . 31
8. Bright�eld images of Anabaena variabilis SA-1 captured at 50�and 100� magni�cation. . . . . . . . . . . . . . . . . . . . . . . . . . . . . . . . . . . . . . . . . . . 36
9. Total protein calibration plot by the Bradford method. . . . . . . . . . . . . . . . . 41
10. Chemical structure of Na�on ion exchange polymer. . . . . . . . . . . . . . . . . . . 42
11. Drawing of the micellar structure of Na�on. . . . . . . . . . . . . . . . . . . . . . . . . 43
12. Chemical structure of octadecyltrimethylammonium (TMODA)bromide. . . . . . . . . . . . . . . . . . . . . . . . . . . . . . . . . . . . . . . . . . . . . . . . . . . . . . . 44
13. Drawing of the micellar structure of octadecyltrimethylammonium(TMODA) bromide modi�ed Na�on. . . . . . . . . . . . . . . . . . . . . . . . . . . . . . . 44
14. Modi�cation of glassy carbon electrode surfaces (A = 0.460 cm2;Pine Research Instrumentation, Inc.). . . . . . . . . . . . . . . . . . . . . . . . . . . . . . . . 47
15. Modi�cation of glassy carbon electrode surfaces (A = 0.196 cm2;ALS Japan). . . . . . . . . . . . . . . . . . . . . . . . . . . . . . . . . . . . . . . . . . . . . . . . . . . . . 48
16. Illustration of the cyclic voltammetry (CV) electroanalyticalmethod . . . . . . . . . . . . . . . . . . . . . . . . . . . . . . . . . . . . . . . . . . . . . . . . . . . . . . . . 51
17. Photograph of the three electrode cell used in this research. . . . . . . . . . . . . 54
18. Diagram of the ammonia ion selective electrode components. . . . . . . . . . . 57
ix
19. Calibration plot of the ammonia ion selective electrode. . . . . . . . . . . . . . . . 59
20. Schematic of the bioelectrocatalytic device for ammonia production . . . . . 62
21. Illustration of the most important biochemical and electrochemicalprocesses present in the system at cell immobilized electrodes. . . . . . . . . . 63
22. Cyclic voltammogram in 100 mM Na2SO4 that shows the currentresponse of the electrodes in the bioelectrocatalytic device. . . . . . . . . . . . . 75
23. Overlay of cyclic voltammograms, each with a di¤erent densityloading of Anabaena variabilis cells. . . . . . . . . . . . . . . . . . . . . . . . . . . . . . . . 76
24. The relationship between forward (oxidative) peak current andconcentration of chlorophyll a in the cell suspension used in the�lm preparation. . . . . . . . . . . . . . . . . . . . . . . . . . . . . . . . . . . . . . . . . . . . . . . . . 78
25. The relationship between forward (oxidative) peak current andconcentration of total protein in the cell suspension used in the�lm preparation. . . . . . . . . . . . . . . . . . . . . . . . . . . . . . . . . . . . . . . . . . . . . . . . . 79
26. Cyclic voltammogram in 100 mM Na2SO4 that compares thetypical bare, TMODA Na�on and 1:1 Cells:TMODA Na�onelectrode response. . . . . . . . . . . . . . . . . . . . . . . . . . . . . . . . . . . . . . . . . . . . . . . . 82
27. Cyclic voltammogram overlay of bare, TMODA Na�on, and 1:1(v/v) cells:TMODA Na�on electrodes in 1 mM NH4OH in 0.1 MNa2SO4. . . . . . . . . . . . . . . . . . . . . . . . . . . . . . . . . . . . . . . . . . . . . . . . . . . . . . . . . 84
28. Cyclic voltammogram in freshly prepared 100 mM Na2SO4, thatfollowed previous analysis of same electrodes in a 1 mM NH4OHsolution. . . . . . . . . . . . . . . . . . . . . . . . . . . . . . . . . . . . . . . . . . . . . . . . . . . . . . . . 86
29. Overlay of cyclic voltammetric responses after the addition ofsu¢ cient NADPH to the background electrolyte for a �nalconcentration of 1 mM. . . . . . . . . . . . . . . . . . . . . . . . . . . . . . . . . . . . . . . . . . . . 88
30. E¤ect of adding ferredoxin to the background electrolyte duringcyclic voltammetry. . . . . . . . . . . . . . . . . . . . . . . . . . . . . . . . . . . . . . . . . . . . . . . 93
31. Cyclic voltammetric responses from a bare electrode to comparethe e¤ect of mediating/co-factor chemical additions. . . . . . . . . . . . . . . . . . . 96
32. Cyclic voltammetric responses from a TMODA Na�on electrodeto compare the e¤ect of separate and independent additions ofmediating/cofactor chemical. . . . . . . . . . . . . . . . . . . . . . . . . . . . . . . . . . . . . . . 97
x
33. Cyclic voltammetric response overlay for 1:1 (v/v) cells:TMODANa�on electrodes to compare the e¤ect of individual additions ofmediating/cofactor chemicals. . . . . . . . . . . . . . . . . . . . . . . . . . . . . . . . . . . . . . 99
34. Plot that shows the relationship between forward (reductive)peak current and the measured concentration of NH3 afterindependent additions of NADPH, ferredoxins, and ATP aftervoltammetric pertubation. . . . . . . . . . . . . . . . . . . . . . . . . . . . . . . . . . . . . . . 102
35. Cyclic voltammogram overlay of a bare glassy carbon workingelectrode with successive additions of known mediating andcofactor species. . . . . . . . . . . . . . . . . . . . . . . . . . . . . . . . . . . . . . . . . . . . . . . . . 104
36. Cyclic voltammogram overlay of a TMODA Na�on glassy carbonworking electrode with successive additions of known mediatingand cofactor species. . . . . . . . . . . . . . . . . . . . . . . . . . . . . . . . . . . . . . . . . . . . . 105
37. Cyclic voltammogram overlay of a 1:1 (v/v) cells:TMODA-Na�onglassy carbon working electrode with successive additions ofknown mediating and cofactor species . . . . . . . . . . . . . . . . . . . . . . . . . . . . . 107
38. Cyclic voltammogram overlay that shows the e¤ect of di¤erentcell preparation techniques. . . . . . . . . . . . . . . . . . . . . . . . . . . . . . . . . . . . . . . 112
39. Plot of the relationship between forward (reductive) peak currentand the measured concentration of NH3 following voltammetricpertubation. . . . . . . . . . . . . . . . . . . . . . . . . . . . . . . . . . . . . . . . . . . . . . . . . . . . 115
40. E¤ect of elevated pH in 0.1 M Na2SO4 on sonicated and lysozymetreated cells. . . . . . . . . . . . . . . . . . . . . . . . . . . . . . . . . . . . . . . . . . . . . . . . . . . . 120
41. E¤ect of elevated pH in 0.1 M Na2SO4 on sonicated and lysozymetreated cells, with the scale adjusted to highlight the cellularcurrent signals. . . . . . . . . . . . . . . . . . . . . . . . . . . . . . . . . . . . . . . . . . . . . . . . . . 122
42. Bright�eld microscope images of Anabaena variabilis SA-1highlighting morphological di¤erences dependent upon culturemedium at 50� and 100�. . . . . . . . . . . . . . . . . . . . . . . . . . . . . . . . . . . . . . . . 124
43. Drawn representation of the species and reaction centers involvedin NH+4 production by nitrate/nitrite reductase at an electrode. . . . . . . . 125
44. Cyclic Voltammetric overlay to compare current responses from1:1 (v/v) cells:TMODA Na�on �lms loaded with whole Anabaenavariabilis �laments, cultured on BG-110 and on BG-11 thatcontains 17 mM NaNO2: . . . . . . . . . . . . . . . . . . . . . . . . . . . . . . . . . . . . . . . . . 127
xi
45. Cyclic Voltammetric overlay to compare current responses fromwild type A. var. and A. var. SA-1 cells cultured on BG-110 andon BG-11 that contains 17 mM NaNO2: . . . . . . . . . . . . . . . . . . . . . . . . . . . . 129
46. The relationship between forward (oxidative) peak current andNH3 density following voltammetric pertubation of immobilizedA. var. (wild type or SA-1 mutant) cultured in either BG-110 orBG-110 + 17 mM NaNO3. . . . . . . . . . . . . . . . . . . . . . . . . . . . . . . . . . . . . . . . 131
47. The relationship between forward (oxidative) peak current andNH3 density following voltammetric pertubation of immobilizedA. var. SA-1 mutants cultured in BG-110 + 17 mM NaNO3(nitrogenase repressed). . . . . . . . . . . . . . . . . . . . . . . . . . . . . . . . . . . . . . . . . . . 136
48. NH3 output from A. var. SA-1 during media supplementationwith NaNO2 and methionine D,L-sulfoximine (MSX) over a 4 dayperiod. . . . . . . . . . . . . . . . . . . . . . . . . . . . . . . . . . . . . . . . . . . . . . . . . . . . . . . . . 138
49. Potential axis for NADPH/NADP+ and ferredoxin (oxidizedcomponent LEFT, reduced component RIGHT). . . . . . . . . . . . . . . . . . . . . 153
50. Potential axis of possible NO�3 and NO�2 redox reactions at pH =
7. . . . . . . . . . . . . . . . . . . . . . . . . . . . . . . . . . . . . . . . . . . . . . . . . . . . . . . . . . . . . 155
51. Potential axes of thermodynamically possible nitrate and nitritereductase reduction reactions between 1.10 and 0.3 V vs. SCE. . . . . . . . 159
52. Potential axes of thermodynamically possible nitrate and nitritereductase reduction reactions between 0.5 and -0.1 V vs. SCE. . . . . . . . . 161
53. Illustration of the indirect electron transfer possibilities with thenitrate/nitrite reductase enzyme of A. var. . . . . . . . . . . . . . . . . . . . . . . . . . 163
54. Model output normalized by A� (NO�3 ) for the nitrate/nitritereductase enzyme, at a �xed time t = 600 s. . . . . . . . . . . . . . . . . . . . . . . . . 166
55. Potential axis with the primary nitrate/nitrite reductase enzymesubstrates and cofactors listed. . . . . . . . . . . . . . . . . . . . . . . . . . . . . . . . . . . . 169
56. Drawing (not to scale) of the basic bioelectrocatalytic deviceconnected to a solar/PV harvesting system. . . . . . . . . . . . . . . . . . . . . . . . . 180
A1. Photograph and description of the culture setup constructed forthis research . . . . . . . . . . . . . . . . . . . . . . . . . . . . . . . . . . . . . . . . . . . . . . . . . . . 191
xii
1
CHAPTER 1
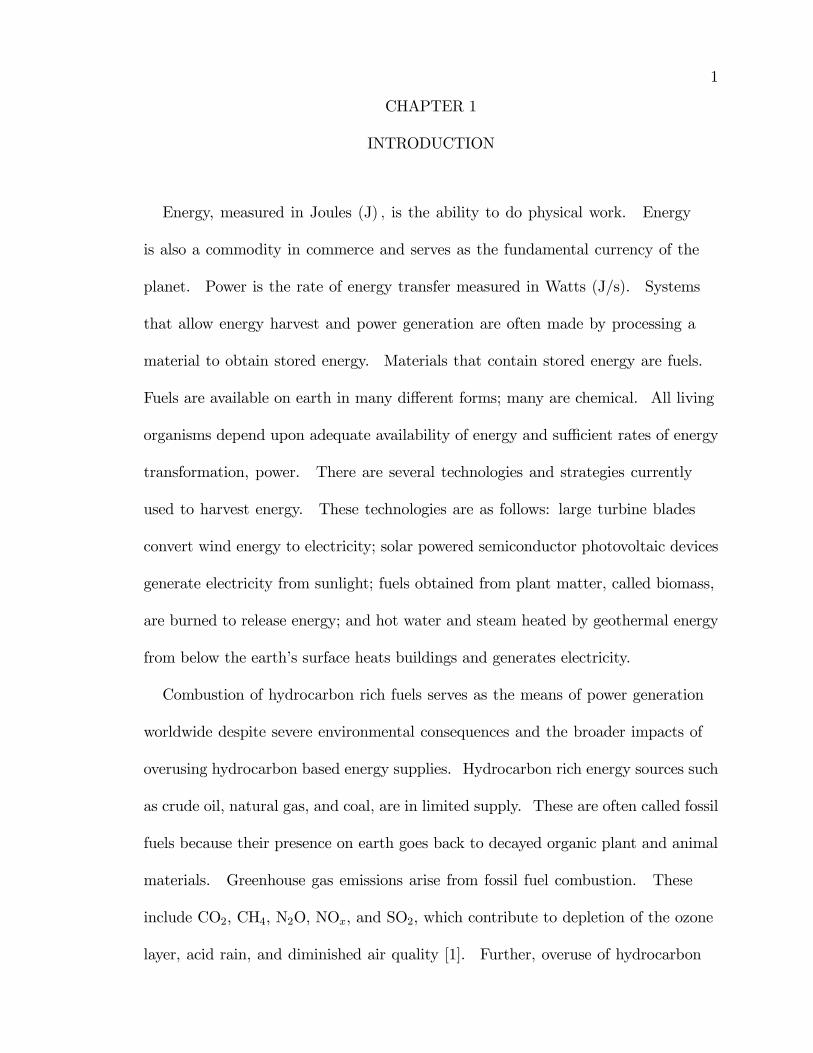
INTRODUCTION
Energy, measured in Joules (J) ; is the ability to do physical work. Energy
is also a commodity in commerce and serves as the fundamental currency of the
planet. Power is the rate of energy transfer measured in Watts (J/s). Systems
that allow energy harvest and power generation are often made by processing a
material to obtain stored energy. Materials that contain stored energy are fuels.
Fuels are available on earth in many di¤erent forms; many are chemical. All living
organisms depend upon adequate availability of energy and su¢ cient rates of energy
transformation, power. There are several technologies and strategies currently
used to harvest energy. These technologies are as follows: large turbine blades
convert wind energy to electricity; solar powered semiconductor photovoltaic devices
generate electricity from sunlight; fuels obtained from plant matter, called biomass,
are burned to release energy; and hot water and steam heated by geothermal energy
from below the earth�s surface heats buildings and generates electricity.
Combustion of hydrocarbon rich fuels serves as the means of power generation
worldwide despite severe environmental consequences and the broader impacts of
overusing hydrocarbon based energy supplies. Hydrocarbon rich energy sources such
as crude oil, natural gas, and coal, are in limited supply. These are often called fossil
fuels because their presence on earth goes back to decayed organic plant and animal
materials. Greenhouse gas emissions arise from fossil fuel combustion. These
include CO2, CH4, N2O, NOx, and SO2, which contribute to depletion of the ozone
layer, acid rain, and diminished air quality [1]. Further, overuse of hydrocarbon
2
based fuels has a direct e¤ect on the world�s economy, because it costs more to
produce less as demand for power continues to rise and the supply of energy rich
fuels continues to decrease. Lastly, most combustion processes are irreversible and
therefore not renewable as the products of hydrocarbon combustion are primarily
polluting chemical waste. While energy is of concern to humankind, lower organisms
and plants adapted and already depend upon a renewable source of energy, the sun.
Living organisms depend on an external source of energy to grow and function.
Many plants and some bacteria obtain energy directly from the sunlight through
a process called photosynthesis. Photosynthesis is the light driven reduction
of CO2 into biomass energy [2]. Plant life is the largest source of agricultural
foodstu¤s. Plant life obtains its energy in a clean and renewable manner. Plant
energy utilization schemes can serve as a model for alternative strategies of energy
production for humankind.
Energy supply, demand, production, and consumption are important topics.
Reducing our dependence upon limited carbon based fuels requires new energy
technologies and applications. Additional methods to use renewable fuels must be
developed to meet an increasing energy needs [3].
1.1 Renewable Energy Outlook
The British thermal unit (Btu) is the unit of energy used in the U.S. There
are 1,055 J in 1 Btu. The U.S. Department of Energy reports that renewable
energy capacity installed both worldwide and in the United States has nearly tripled
between 1949 and 2009, rising from about 32 quadrillion Btu to 95 quadrillion Btu
3
for all sources of energy. Of the 94.6 quadrillion Btu, the majority were supplied
by carbon based petroleum (35.3%), natural gas (23.4%), coal (19.7%), and nuclear
sources (8.3%). Thus, only 7.7% of U.S. energy consumption comes from renewable
sources [4]. Renewable energy sources are regenerable and can be sustained
inde�nitely. Carbon based fossil fuels are not renewable and will eventually be
exhausted. The most commonly utilized renewable energy resources are biomass
(wood and wood waste, municipal solid waste, land�ll gas, and biofuels such as
ethanol), hydropower, geothermal, wind, and solar sources [1, 3, 5]. Renewable
energy technologies have the potential to strengthen our national energy security,
improve environmental quality, and contribute to a strong energy economy [4].
Because implementation of renewable energy technologies is generally more expensive
than historically used nonrenewable sources, renewable energy is less commonly
used. An additional complexity is that renewable sources such as wind, solar, and
hydroelectric are subject to environmental variations such as cloud cover, night,
drought, and stagnant air. Under such environmental conditions, renewable sources
are not always available for energy production.
A signi�cant amount of research focuses on alternative fuels that provide hydrogen.
Hydrogen is the simplest and most abundant element in the universe; however,
hydrogen is rarely found alone in nature. Hydrogen is present in compounds such as
water (H2O), hydrocarbons that include natural gas and methane, CH4, and almost
all other organic matter. E¢ cient release of hydrogen from these compounds is the
largest impediment to widespread implementation. Currently, steam reforming of
CH4 accounts for about 95% of the hydrogen produced in the United States [4].
4
Hydrogen burns well in energy devices, has a wide range of �ammability, and has
a large heat of combustion per unit mass. The combustion of H2 releases only
water, however processing CH4 to harvest the hydrogen contributes to greenhouse
gas emission, because energy for processing is typically generated by combustion
of fossil fuels. Hydrogen is extremely �ammable and combustible and is therefore
dangerous to handle, store, transport, and use. Thus, H2 as an alterative energy
source is limited despite the high energy content of hydrogen [1,6,7].
With energy consumption projected to increase at a rate of 1.3 % annually until
2025, sustainable and environmentally friendly fuels, methods to synthesize and
obtain such fuel, and devices to use these fuels are now imperative research vectors
[5]. Well developed systems that operate on alternative and renewable fuels will
lessen the dependence on carbon based fuel sources. One fuel worthy of development
is anhydrous ammonia [8].
1.2 Ammonia as a Fuel
Structurally, ammonia is a central nitrogen atom bonded to three peripheral
hydrogen atoms. Ammonia (NH3) is widely used in plastics, explosives, and crop
fertilizers. Crops grow with NH3 supplementation as plants uptake ammonia to
synthesize amino acids essential to living cells. Nitrogen is the nutrient element
that most frequently limits growth of green plants. Typically, the limitation arises
as nitrogen is lost from the soil. The regular removal of nitrogen containing crop
residues that is common in modern farming practices depletes soil of nitrogen.
Addition of N, called "�xed" or reduced nitrogen, to soil in the form of NH3
5
replenishes lost nitrogen [9]. A less commonly known use of ammonia is as a
fuel. It can be used in internal combustion engines with minimal modi�cation to
a traditional engine, directly in ammonia fuel cells, and as a hydrogen source in
hydrogen fuel cells [10�14]. Ammonia as a fuel is not a newly discovered technology.
Ammonia was �rst used as a fuel in Belgium during 1943 to power a bus �eet during
World War II [8].
Ammonia shares similar alternative fuel bene�ts with hydrogen. Advantageous
properties of ammonia fuel are as follows: 1) no greenhouse gases upon combustion,
only N2 and H2O as products;
4NH3 + 3O2 2N2 + 6H2O (1)
2) renewable resource, synthesized commercially from a hydrogen source and
atmospheric N2; 3) �exibility, as ammonia can be produced from any primary
energy source [12]; 4) storage, as anhydrous ammonia is liquid at moderate pressure,
whereas hydrogen requires cryogenic temperatures to condense the gas to liquid; 5)
transportation and delivery, as signi�cant systems and existing infrastructure are
already in place for industry and farming applications of ammonia; 6) domestic,
as the U.S. is a signi�cant producer of NH3, thus dependence on imported fuel
is negligible; and 7) existing technologies, as the scienti�c community is actively
developing new systems to utilize ammonia as a fuel [13, 14]. The energy density
of ammonia as a fuel exceeds that of hydrogen, whose technological use and
development currently far exceeds that of ammonia. Table 1 compares some
common liquid fuels.
6
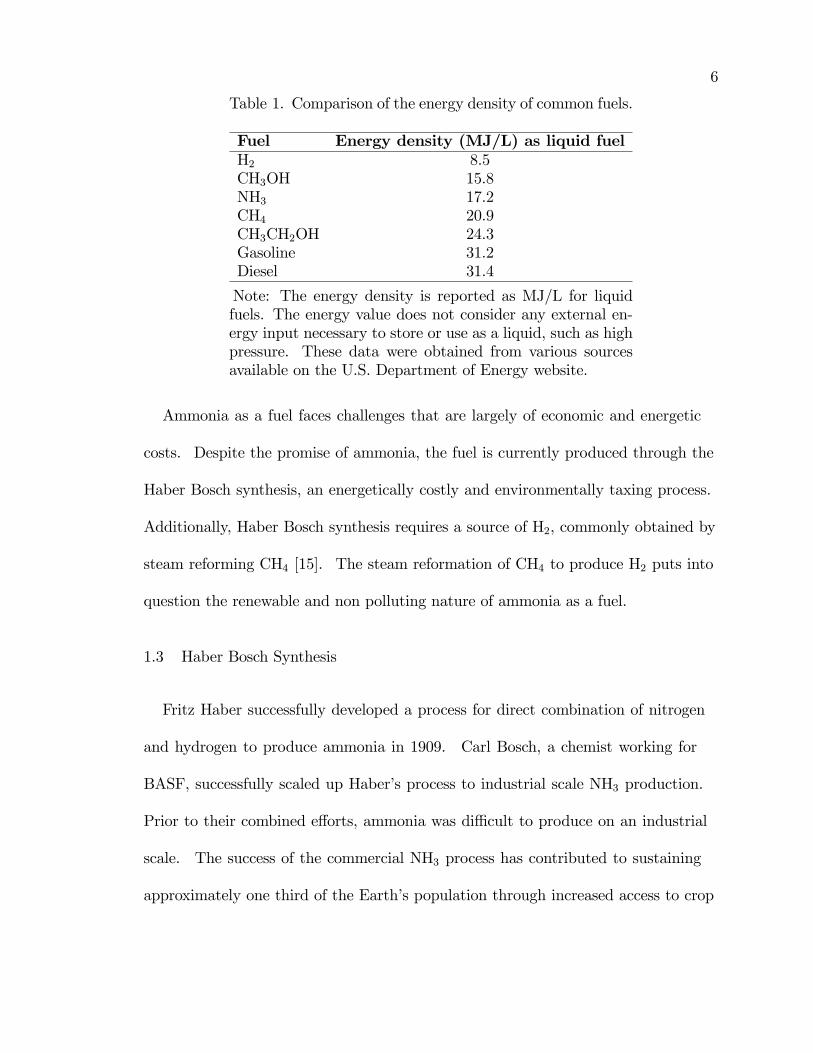
Table 1. Comparison of the energy density of common fuels.
Fuel Energy density (MJ/L) as liquid fuelH2 8.5CH3OH 15.8NH3 17.2CH4 20.9CH3CH2OH 24.3Gasoline 31.2Diesel 31.4
Note: The energy density is reported as MJ/L for liquidfuels. The energy value does not consider any external en-ergy input necessary to store or use as a liquid, such as highpressure. These data were obtained from various sourcesavailable on the U.S. Department of Energy website.
Ammonia as a fuel faces challenges that are largely of economic and energetic
costs. Despite the promise of ammonia, the fuel is currently produced through the
Haber Bosch synthesis, an energetically costly and environmentally taxing process.
Additionally, Haber Bosch synthesis requires a source of H2, commonly obtained by
steam reforming CH4 [15]. The steam reformation of CH4 to produce H2 puts into
question the renewable and non polluting nature of ammonia as a fuel.
1.3 Haber Bosch Synthesis
Fritz Haber successfully developed a process for direct combination of nitrogen
and hydrogen to produce ammonia in 1909. Carl Bosch, a chemist working for
BASF, successfully scaled up Haber�s process to industrial scale NH3 production.
Prior to their combined e¤orts, ammonia was di¢ cult to produce on an industrial
scale. The success of the commercial NH3 process has contributed to sustaining
approximately one third of the Earth�s population through increased access to crop
7
fertilization [16]. In 2009, the world production of ammonia was 1:3�1014 g [17] and
more than 90% of ammonia production worldwide uses the Haber Bosch synthesis
process [18].
The Haber Bosch chemical synthesis of ammonia uses iron oxide as a catalyst and
other oxide promoters (K2O, Al2O, and CaO) to react N2 and H2 in the gas phase.
Overall, the net reaction is thermodynamically exothermic.
N2(g) + 3H2(g) 2NH3(g) �H� = �92 kJ (2)
The Haber Bosch synthesis mechanism includes dissociation of N2 to atomic nitrogen
using on iron oxides (Fe3O4 and Fe2O3) catalyst and formation of NH3 by reaction
with oxidized H2, as follows [19, 20] (where the subscripts g = gas and ad =
adsorbed):
H2(g) 2H(ad) (3)
N2(g) N2(ad) 2N(ad) (4)
N(s) +H(ad) NH(ad) (5)
NH(ad) +H(ad) NH2(ad) (6)
NH2(ad) +H(ad) NH3(ad) (7)
NH3(ad) NH3(g) (8)
A temperature increase would increase the sluggish kinetics of the exothermic
reaction (Reaction 2). An increase in temperature would also shift the reaction
to favor the reactants and reduce NH3 produced. Fe3O4 and Fe2O3 catalyst in
Haber Bosch process requires high temperatures between 400-600 �C for e¢ cient
8
catalysis. Ammonia production can be entropically enhanced with elevated gas
pressure between 200 and 400 atm as there are 4 moles of gas reactant for every 2
moles of gas product; however, increasing the pressure of a system has signi�cant
economic costs as pressure is an expensive commodity. Therefore, in consideration
of the challenging thermodynamic and kinetic limitations of the system, cost and
energy e¢ cient reduction of N2 to NH3 requires a �ne balance between elevated
temperature and pressure. Additionally, the process requires H2, which is not
readily available as a reagent. Steam reforming methane, the most commonly used
method to obtain hydrogen, produces H2 required in step 3. Steam reforming CH4
releases ozone layer depleting CO2 as a by product. Alternatively, it is possible to
supply hydrogen renewably by the electrolysis of water�2H2O(l) 2H2(g) +O2(g)
�,
however steam reforming CH4 is less costly with current industrial technology.
Despite the costs of production, the Haber Bosch synthesis is highly e¢ cient. To
date, there has not been development of other ammonia syntheses that approach the
Haber Bosch 8 15% conversion rates [21, 22]. Therefore, despite the high energetic
cost and environmental tax of Haber Bosch produced ammonia, it remains the
most used synthetic method for ammonia production. Richard Shrock recently
stated,�Even though the huge and highly successful Haber Bosch process is unlikely
to be displaced readily by a new process, even if e¢ cient and inexpensive, it must be
kept in mind that >1% of the energy consumed by humans is consumed by the Haber
Bosch process� [15]. Shrock�s statement sets expectations for those researching
ammonia syntheses: do not try to compete with the Haber Bosch synthesis but
instead, focus on development of methods of ammonia synthesis that are less costly,
9
both �nancially and environmentally, more sustainable, and cleaner.
Inclusion of the energetic, environmental, and resource costs of commercial
production of NH3 in the cost analysis of Haber Bosch synthesis of anhydrous
ammonia does not conclude that ammonia is an economically viable alternative
fuel, despite its excellent properties as a fuel. The expected energetic output as
compared to the energetic input is not favorable. The economic cost of ammonia
synthesis is high, due in part to the very strong triple bond between the nitrogen
atoms that must be broken for e¤ective synthesis. Similar chemical processes
that require only atmospheric temperature and pressure are achieved by numerous
bacteria. In contrast to the commercial process of making NH3, biological processes
o¤er an interesting model of low energy and renewable ammonia synthesis.
1.4 Biological Production of Ammonia
There are at least two signi�cant biological methods of producing ammonia;
nitrogen �xation by the nitrogenase enzyme and nitrate/nitrite reductase catalysis of
NO�2 and NO�3 : In vivo, these enzyme depend upon other biochemical pathways for
the recycling of redox cofactors, generation of substrates, and low potential electron
carrier cycling. Together, the enzyme and dependent chemical processes are the
reaction centers within the cell (Figure 1). All of these reaction centers involve
electron transfer.
The reaction centers illustrated in Figure 1 represent the most probable and
important pathways and chemicals in the electrochemically induced production of
ammonia from immobilized cyanobacteria. These reaction centers are: Nitrogenase,
10
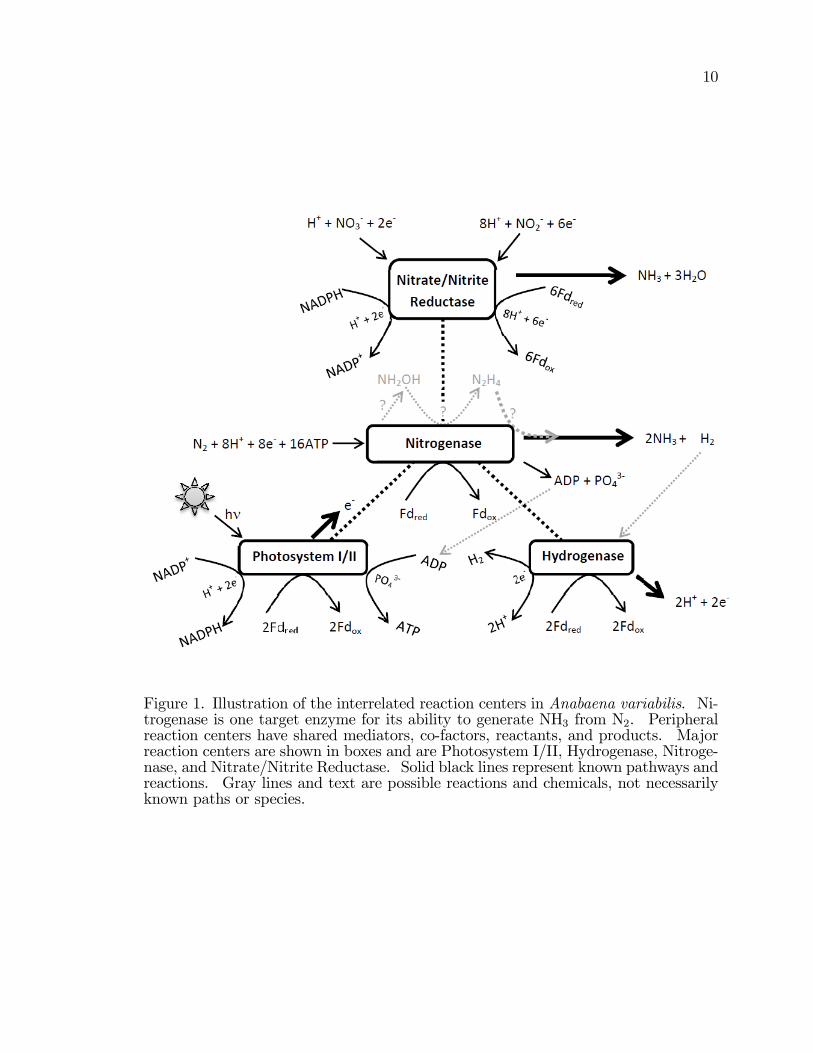
Figure 1. Illustration of the interrelated reaction centers in Anabaena variabilis. Ni-trogenase is one target enzyme for its ability to generate NH3 from N2. Peripheralreaction centers have shared mediators, co-factors, reactants, and products. Majorreaction centers are shown in boxes and are Photosystem I/II, Hydrogenase, Nitroge-nase, and Nitrate/Nitrite Reductase. Solid black lines represent known pathways andreactions. Gray lines and text are possible reactions and chemicals, not necessarilyknown paths or species.
11
H2N+ C C
R
O-
O
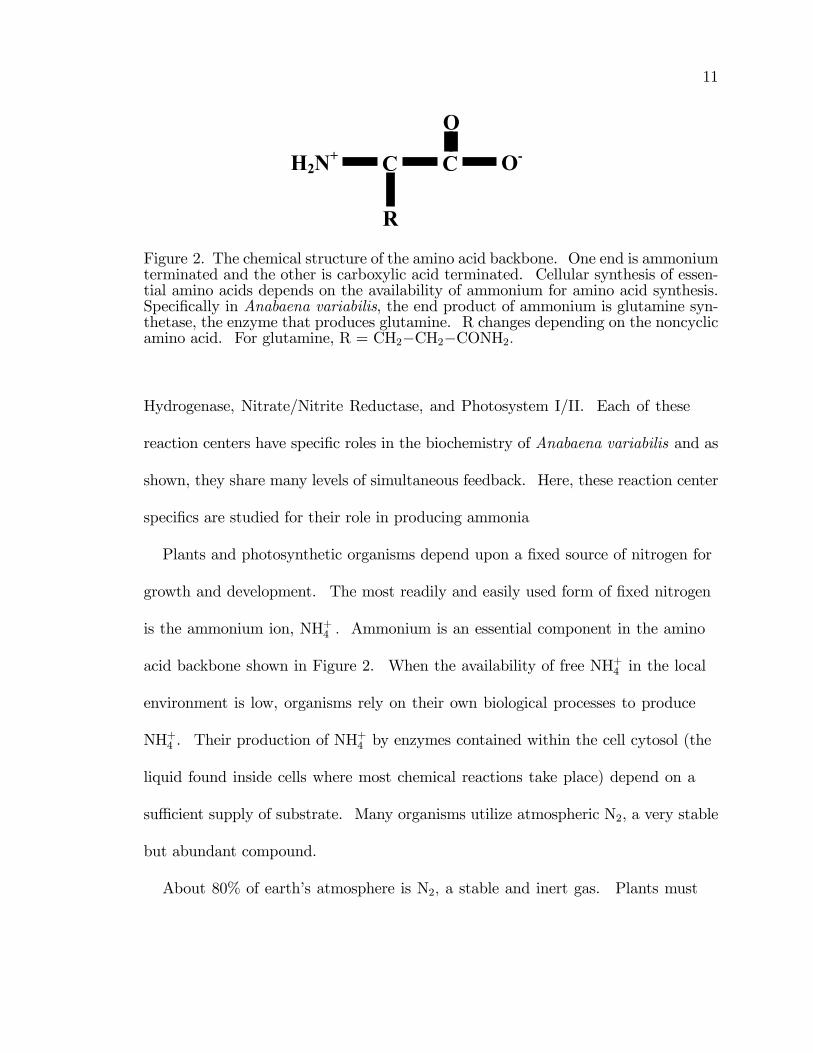
Figure 2. The chemical structure of the amino acid backbone. One end is ammoniumterminated and the other is carboxylic acid terminated. Cellular synthesis of essen-tial amino acids depends on the availability of ammonium for amino acid synthesis.Speci�cally in Anabaena variabilis, the end product of ammonium is glutamine syn-thetase, the enzyme that produces glutamine. R changes depending on the noncyclicamino acid. For glutamine, R = CH2�CH2�CONH2:
Hydrogenase, Nitrate/Nitrite Reductase, and Photosystem I/II. Each of these
reaction centers have speci�c roles in the biochemistry of Anabaena variabilis and as
shown, they share many levels of simultaneous feedback. Here, these reaction center
speci�cs are studied for their role in producing ammonia
Plants and photosynthetic organisms depend upon a �xed source of nitrogen for
growth and development. The most readily and easily used form of �xed nitrogen
is the ammonium ion, NH+4 : Ammonium is an essential component in the amino
acid backbone shown in Figure 2. When the availability of free NH+4 in the local
environment is low, organisms rely on their own biological processes to produce
NH+4 . Their production of NH+4 by enzymes contained within the cell cytosol (the
liquid found inside cells where most chemical reactions take place) depend on a
su¢ cient supply of substrate. Many organisms utilize atmospheric N2, a very stable
but abundant compound.
About 80% of earth�s atmosphere is N2; a stable and inert gas. Plants must
12
assimilate signi�cant amounts of nitrogen for amino acid and nucleotide biosynthesis,
as shown in Figure 2. Despite the renewable supply of N2; it is not usable by
plants due to its chemical stability. Thus, the unreactive nature of N2 requires
strategies to reduce N2 to more reactive nitrogen species for further incorporation
into biochemical pathways. In general, �xation of nitrogen is the reduction of triple
bonded dintrogen, N2, to other stable nitrogen containing species such as N2O, NO�3 ,
NO�2 , and NH+4 [19, 23�25]. Biological nitrogen �xation (BNF), the evolutionary
response of many organisms to obtain nitrogen from the environment, reduces
atmospheric N2 to NH3=NH+4 . Nitrogen �xing organisms produce an estimated
1.80 �1014 tons of ammonia annually worldwide [15, 26]. A vast majority of the
ammonia produced never leaves the ecosystem and is consumed as it is produced;
therefore, the total mass produced by biological sources is di¢ cult to estimate.
Although nitrogen �xation involves a number of oxidation reduction reactions
that occur sequentially, the net reaction for the complete conversion in an acidic
environment is:
N2 + 8H+ + 6e 2NH+
4 E�0pH=7 = 0:034 V (9)
Organisms evolved to �x nitrogen in a cascading reaction sequence that is
eloquent and complex. Many research hours and dollars spent on constructing an
inorganic mimic to biological nitrogen �xation have not yet achieved the success
of the biological system [27, 28]. Biological organisms catalyze the reduction of
atmospheric nitrogen, a kinetically challenging task, by an enzyme catalyst called
nitrogenase.
13
Here, the main objective is generation of ammonia at an electrode modi�ed
with ammonia producing cells or their ammonia producing enzymes. Either cells
or enzymes would be held at the electrode with a benign polymer matrix. The
electrode is to serve as a component in the redox sequence, either directly or by
means of a mediator.
Nitrogenase was an enzyme of interest for this research because the enzyme
reduces N2 and produces NH3 as a product and the fundamental goal of this research
was to generate ammonia at ambient temperature and pressure for use as a fuel.
Another major enzymatic pathway for cyanobacterial production of ammonia is
the nitrate/nitrite reductase enzyme. Unlike nitrogenase, nitrate/nitrite reductase
catalyzes the formation of NH+4 from already reduced (or �xed) sources of nitrogen,
NO�2 and NO�3 . The ammonia produced by nitrate/nitrite reductase is not as
well studied but signi�cant to the work described here. Both nitrogenase and
nitrate/nitrite reductase enzymes have been considered in this research. Nitrogenase
was the primary enzyme of interest as it has been the target of many studies and its
feedstock of ubiquitous N2 and sunlight were very attractive from a renewable energy
perspective. Less is known and reported about the nitrate/nitrite reductase enzyme,
however electrochemically, there are more reaction possibilities with nitrates and
nitrites. Further, there are high concentrations of NO�2 and NO�3 in livestock wastes.
These wastes can contaminate groundwater sources and contribute to hazardous
runo¤ into fresh water systems near farming operations. Therefore, there is
considerable interest in ammonia production by the nitrate/nitrite reductase enzyme
for waste remediation and ammonia production purposes. Experiments conducted
14
early in this research sought to correlate observed electrochemical phenomena with
known nitrogenase biochemistry and kinetics as related to ammonia production.
Some data provide evidence of electrode nitrogenase interactions but much data did
not correlate well. Data from experiments conducted with cells whose nitrogenase
synthesis had been suppressed suggested that an alternative enzyme and biochemical
pathway results in unique voltammetry and increased ammonia production. It
is important to note that both pathways are biologically capable of producing
ammonia, but at an electrode surface, nitrate/nitrite reductase produced ammonia
agrees more consistently with data obtained and observations made.
1.4.1 Reaction Center Chemicals of Interest
The focus of this research is NH+4 production at an electrode surface modi�ed
with cells that contain ammonia producing enzymes. A critical question was
whether electrode enzyme interactions are accomplished by direct electron transfer
between electrode and enzyme. There are two signi�cant considerations about such
a question: 1) enzymes are buried within cells where the cell membrane is at least 10
nm thick, a distance greater than can be easily traversed by electron tunneling during
a charge transfer reaction; and 2) electron transfer through a hydrophobic membrane
without known electron channels has not been reported and is di¢ cult to justify
without appropriate electrostatic compensation While direct electron transfer case
is more straightforward and easier to model and verify experimentally, it is not the
only possible method by which electron transfer reactions occur. Indirect electron
transfer depends on a mediating chemical species that either cycles electrons to and
15
from the electrode and cell, or a chemical species that transfers electrons to the
cytosol that elicits a more reductive environment within the cell. Many chemicals
can passively di¤use across the cell membrane while others pass through a cellular
energy gated channel. Because known spatial, temporal, and physical barriers
exist that challenge the likelihood of direct electron transfer between electrode and
enzymes, indirect electron transfer will be considered here. Known in vivo mediators
and cofactors (redox recycling agents) for several enzymes within cyanobacteria
are: ATP (required by nitrogenase, produced by photosystem I), NADP+/NADPH
(required in redox recycling in Nitrate/Nitrite Reductase, photosystem I), and
ferredoxins, which are low potential reductant used by all reaction centers in Figure
1. These mediators and cofactors are discussed in the following sections.
1.4.1.1 Adenosine Triphosphate
Adenosine triphosphate, ATP, is a biological energy source. As in Figure 3, the
electrochemistry of the adenine base is reported as similar to ATP, a molecule
containing the adenine moiety [29]. At macro electrode cyclic voltammetry (as in
this research), only a single peak has been detected (step III to IV in Figure 3),
however two other steps have been observed at microelectrodes under fast scan CV.
Thus, step III is the kinetically slow step in the reaction sequence. In the reaction,
I, II, and III for adenosine refer to the structures in Figure 3. ATP participates
in respiratory reactions in Photosystem I and II, becoming hydrolyzed to adenosine
diphosphate (ADP) and possibly again to adenosine monophosphate (AMP). The
hydrolysis shift reactions for each step are analogous to the electron and proton
16
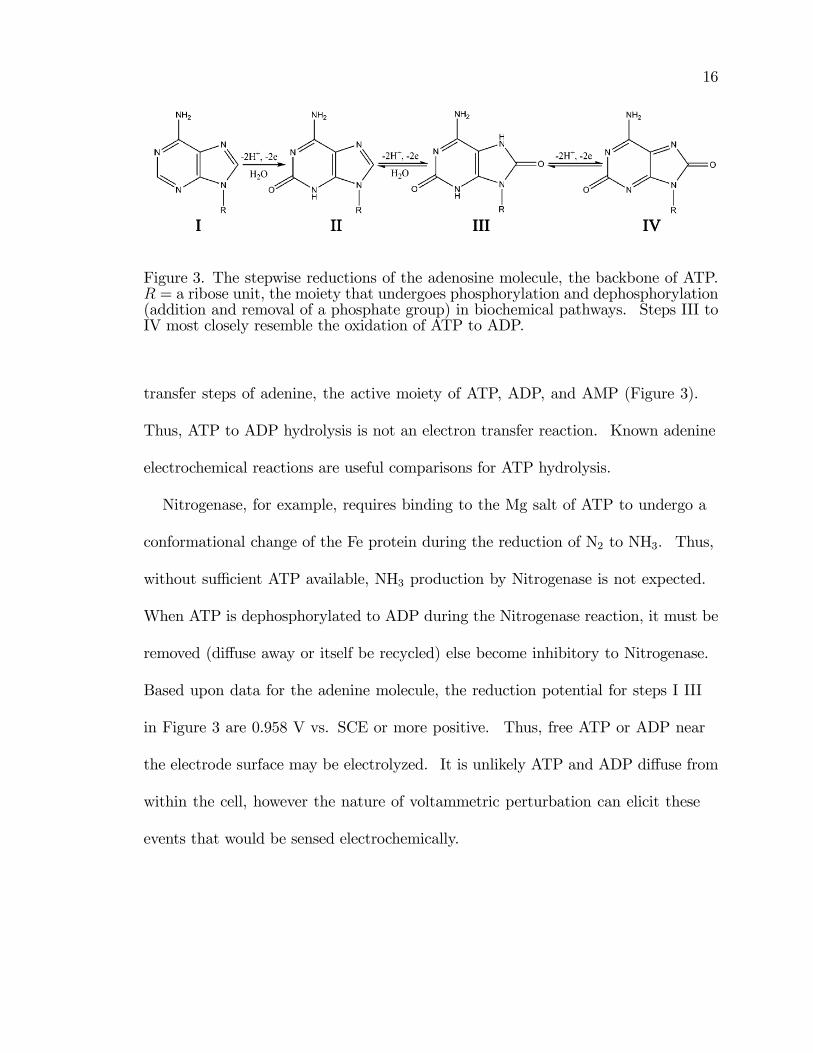
Figure 3. The stepwise reductions of the adenosine molecule, the backbone of ATP.R = a ribose unit, the moiety that undergoes phosphorylation and dephosphorylation(addition and removal of a phosphate group) in biochemical pathways. Steps III toIV most closely resemble the oxidation of ATP to ADP.
transfer steps of adenine, the active moiety of ATP, ADP, and AMP (Figure 3).
Thus, ATP to ADP hydrolysis is not an electron transfer reaction. Known adenine
electrochemical reactions are useful comparisons for ATP hydrolysis.
Nitrogenase, for example, requires binding to the Mg salt of ATP to undergo a
conformational change of the Fe protein during the reduction of N2 to NH3. Thus,
without su¢ cient ATP available, NH3 production by Nitrogenase is not expected.
When ATP is dephosphorylated to ADP during the Nitrogenase reaction, it must be
removed (di¤use away or itself be recycled) else become inhibitory to Nitrogenase.
Based upon data for the adenine molecule, the reduction potential for steps I III
in Figure 3 are 0.958 V vs. SCE or more positive. Thus, free ATP or ADP near
the electrode surface may be electrolyzed. It is unlikely ATP and ADP di¤use from
within the cell, however the nature of voltammetric perturbation can elicit these
events that would be sensed electrochemically.
17
1.4.1.2 Nicotinamide Adenine Dinucleotide Phosphate
The ubiquitous nature of nicotinamide adenine dinucleotide phosphate (NADPH)
in the reaction center in Figure 1 is clear. NADPH is one of the most important
electron donors in many organisms. NADPH/NADP+ shares a close redox
recycling relationship with ferredoxins. In vivo, NADPH is directly involved in
photosystem I/II and nitrate/nitrite reductase enzyme and indirectly involved in
nitrogenase by the recycling of ATP to ADP (Figure 1). The redox reaction of the
NADPH/NADP+ system is
NADP+ +H+ + 2e! NADPH E�0
pH=7 = �0:565 V vs. SCE (10)
In aqueous solutions, the solvent limit at a glassy carbon electrode nears 1.0 V
vs. SCE. Thus, faradaic current arising from direct electron transfer between
electrode and NADP+ or NADPH will overlap with the capacitive current of water
and not be su¢ ciently resolved for direct electrochemical analysis. Extensive, but
contradictory, data regarding the electrochemical reversibilitiy of reaction 10 that
results in biochemically active species is di¢ cult, but possible [30].
1.4.1.3 Ferredoxins
Ferredoxins are small iron sulfur proteins that receive electrons from photosystem
I and transfers the electrons to various reductases. Ferredoxins are also ubiquitous in
cyanobacteria freely di¤usible within cells. Ferredoxins act as biological capacitors,
that accept and discharge electrons as part of several enzymatic pathways (Figure
1). Components of the nitrogenase proteins are structurally similar to ferredoxin
18
in that both contain Fe-S linkages. In the Nitrogenase proteins, the Fe-S linkages
are in the cysteine residues of the terminal end of the enzyme proteins. Generally,
ferredoxins are one electron transfer reagents that alter the oxidation state of an Fe
atom (between +2/+3). Ferredoxins are electroactive and exist within the cell as
both freely mobile and membrane bound reductants within cells. This low potential
electron donor matches well with the low redox potentials of nitrogenase enzyme
proteins. The redox reaction of ferredoxins are represented as [25]:
Fd�Fe3+
�+ e Fd
�Fe2+
�E�
0
pH=7 = �0:596 V vs. SCE (11)
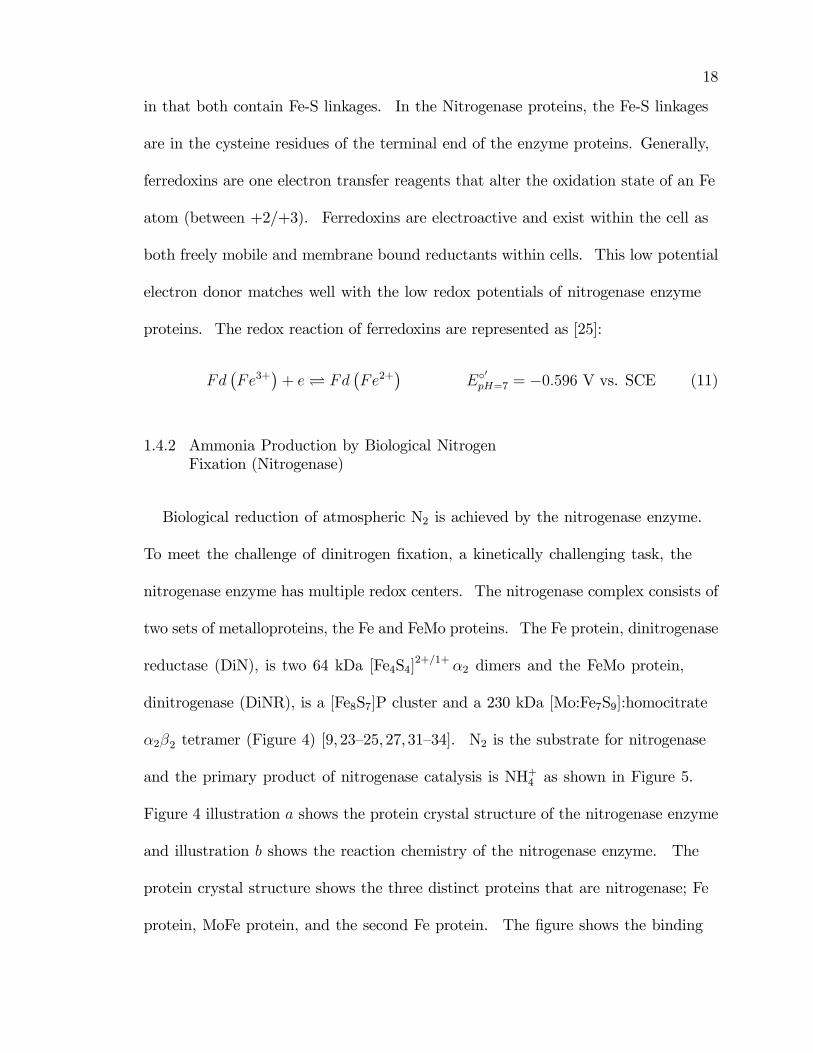
1.4.2 Ammonia Production by Biological NitrogenFixation (Nitrogenase)
Biological reduction of atmospheric N2 is achieved by the nitrogenase enzyme.
To meet the challenge of dinitrogen �xation, a kinetically challenging task, the
nitrogenase enzyme has multiple redox centers. The nitrogenase complex consists of
two sets of metalloproteins, the Fe and FeMo proteins. The Fe protein, dinitrogenase
reductase (DiN), is two 64 kDa [Fe4S4]2+=1+ �2 dimers and the FeMo protein,
dinitrogenase (DiNR), is a [Fe8S7]P cluster and a 230 kDa [Mo:Fe7S9]:homocitrate
�2�2 tetramer (Figure 4) [9, 23�25, 27, 31�34]. N2 is the substrate for nitrogenase
and the primary product of nitrogenase catalysis is NH+4 as shown in Figure 5.
Figure 4 illustration a shows the protein crystal structure of the nitrogenase enzyme
and illustration b shows the reaction chemistry of the nitrogenase enzyme. The
protein crystal structure shows the three distinct proteins that are nitrogenase; Fe
protein, MoFe protein, and the second Fe protein. The �gure shows the binding
19
of ATP (bound nucelotide), the Fe-S based P cluster, and the FeMo cofactor
species intercalated into the protein residues. In image b, the reaction chemistry of
nitrogenase is diagrammed. The basic steps are outlined and include ATP to ADP
hydrolysis, electron transfer, complex formation, and complex dissociation.
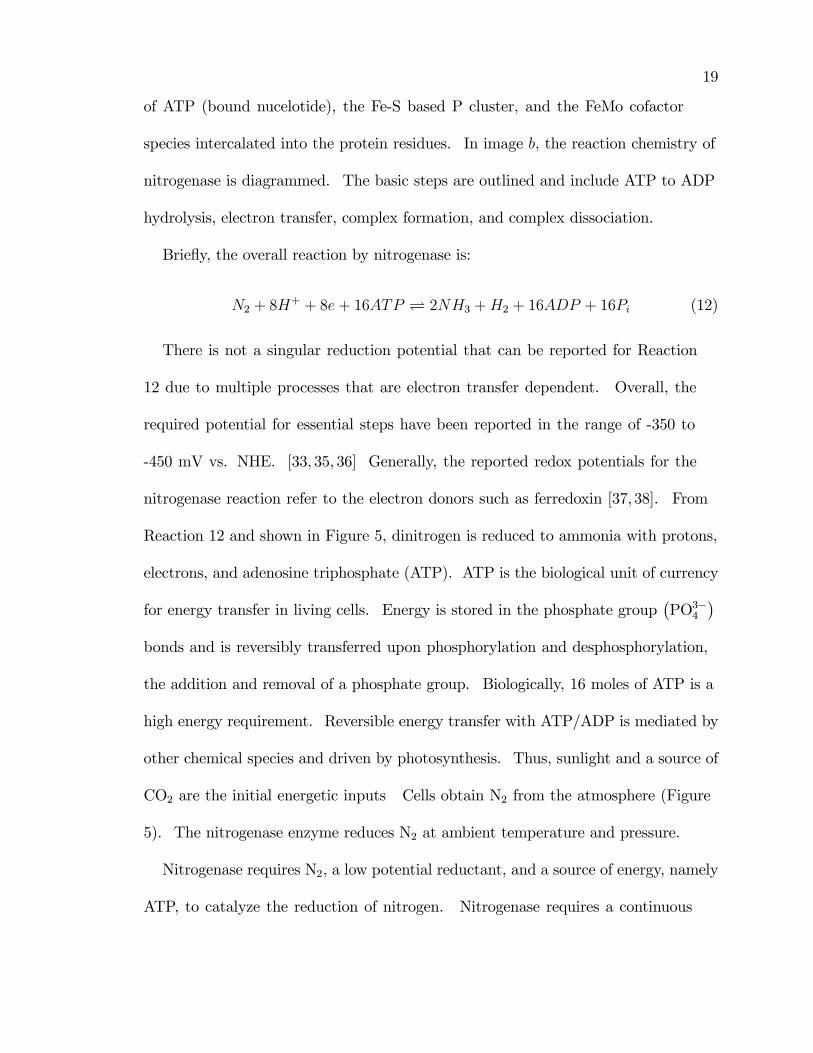
Brie�y, the overall reaction by nitrogenase is:
N2 + 8H+ + 8e+ 16ATP 2NH3 +H2 + 16ADP + 16Pi (12)
There is not a singular reduction potential that can be reported for Reaction
12 due to multiple processes that are electron transfer dependent. Overall, the
required potential for essential steps have been reported in the range of -350 to
-450 mV vs. NHE. [33, 35, 36] Generally, the reported redox potentials for the
nitrogenase reaction refer to the electron donors such as ferredoxin [37, 38]. From
Reaction 12 and shown in Figure 5, dinitrogen is reduced to ammonia with protons,
electrons, and adenosine triphosphate (ATP). ATP is the biological unit of currency
for energy transfer in living cells. Energy is stored in the phosphate group�PO3�4
�bonds and is reversibly transferred upon phosphorylation and desphosphorylation,
the addition and removal of a phosphate group. Biologically, 16 moles of ATP is a
high energy requirement. Reversible energy transfer with ATP/ADP is mediated by
other chemical species and driven by photosynthesis. Thus, sunlight and a source of
CO2 are the initial energetic inputs Cells obtain N2 from the atmosphere (Figure
5). The nitrogenase enzyme reduces N2 at ambient temperature and pressure.
Nitrogenase requires N2, a low potential reductant, and a source of energy, namely
ATP, to catalyze the reduction of nitrogen. Nitrogenase requires a continuous
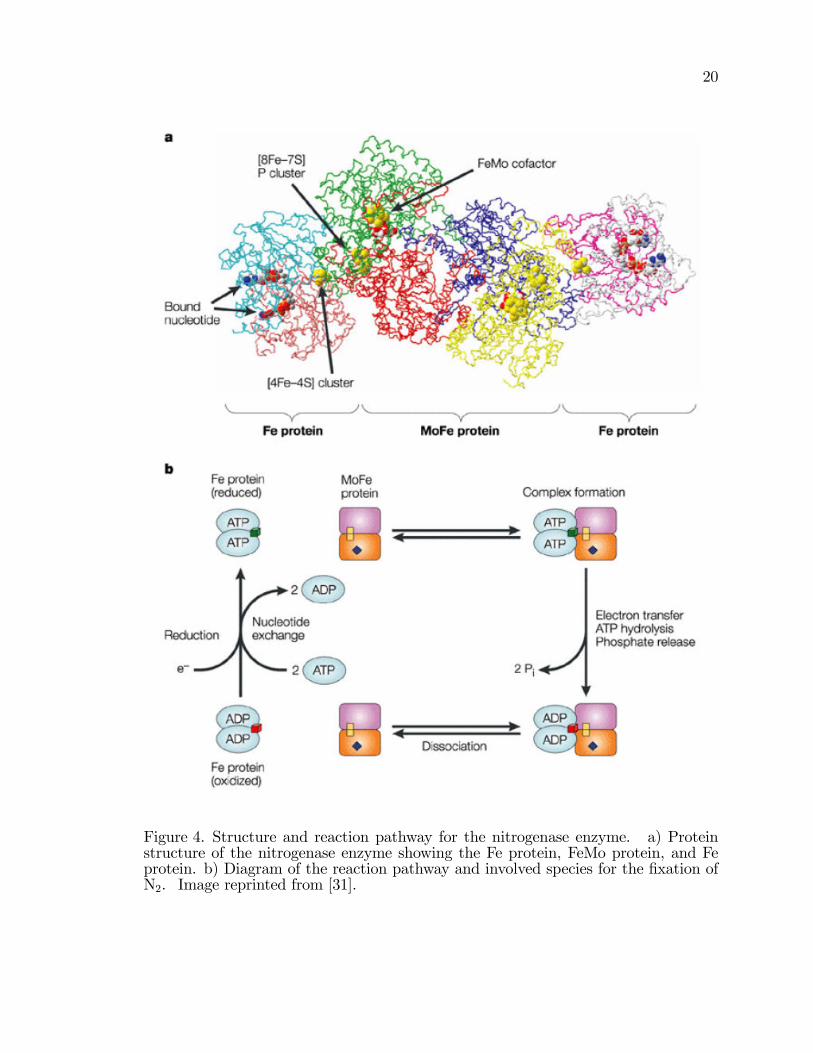
20
Figure 4. Structure and reaction pathway for the nitrogenase enzyme. a) Proteinstructure of the nitrogenase enzyme showing the Fe protein, FeMo protein, and Feprotein. b) Diagram of the reaction pathway and involved species for the �xation ofN2. Image reprinted from [31].
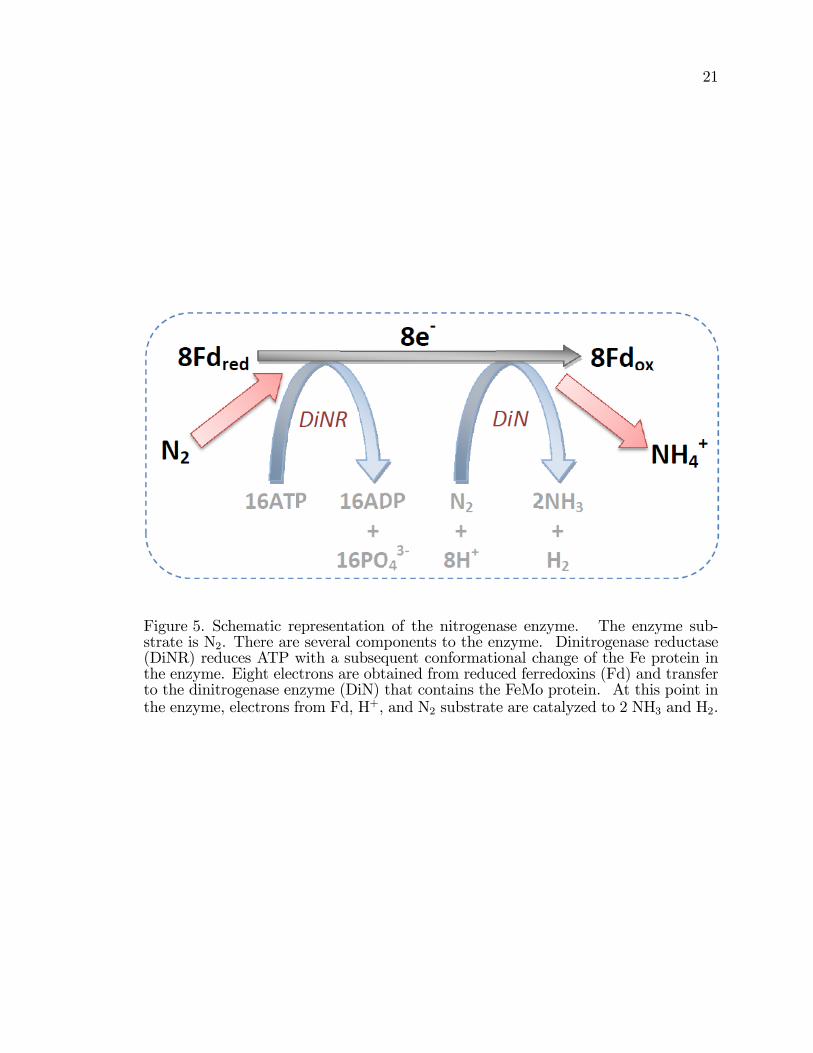
21
Figure 5. Schematic representation of the nitrogenase enzyme. The enzyme sub-strate is N2. There are several components to the enzyme. Dinitrogenase reductase(DiNR) reduces ATP with a subsequent conformational change of the Fe protein inthe enzyme. Eight electrons are obtained from reduced ferredoxins (Fd) and transferto the dinitrogenase enzyme (DiN) that contains the FeMo protein. At this point inthe enzyme, electrons from Fd, H+, and N2 substrate are catalyzed to 2 NH3 and H2.
22
supply of ATP during nitrogen �xation and shows a high rate of ATP utilization.
The electron carrier in the nitrogenase system is ferredoxin. The free energy for
reduction of N2 by ferredoxins is negative, but additional energy required for �xation
arises from ATP hydrolysis. Nitrogenase is synthesized by cells in response to
ammonia starvation. Such ammonia starvation triggers nif genes to transcribe
nitrogenase protein synthesis. Due to the high cellular energetic tax to �x nitrogen,
other enzyme pathways can also produce ammonia. Such is the case when a �xed
source of nitrogen is available to the cell. High �xed nitrogen represses nitrogenase
synthesis. Common environmental sources of �xed nitrogen are nitrates and nitrites.
1.4.3 Ammonia Production by Enzymatic Conversionof Fixed Nitrogen Sources (Nitrate/NitriteReductase Enzyme)
This research initially focused on nitrogenase mediated NH+4 production. This
was achieved by removing all ammonia from the cell culture medium. Nitrogen
starvation in Anabaena variabilis elicits a genetic response to synthesize nitrogenase
within heterocysts to �x nitrogen to ammonia. Thus, under starvation conditions,
nitrogenase produced ammonia is the primary source of any ammonia measured.
Nitrate and nitrite are also substrates for another enzyme found in cyanobacteria,
the nitrate/nitrite reductase enzyme.
The nitrate/nitrite reductase complex consists of two components, ferredoxin
nitrite reductase (NiR) and nitrate reductase (NR) (Figure 6). NiR is a monomeric
protein of approximately 63 kDa in size. NiR contains a single [4Fe� 4S] cluster
and a single heme like prosthetic group that serves as the active site to achieve
23
reduction of nitrogen. NR is a Mo centered homo dimer protein with two identical
subunits joined by the molybdenum cofactor (MoC, molecular weight 100 - 114 kDa)
[39�41]. The reduction of NO�3 by nitrate/nitrite reductase is a two step process.
First, nitrate/nitrite reductase catalyzes the reduction of NO�3 to NO�2 . This occurs
in the cytosol and requires reductant in the form of NADPH. The second step of the
nitrate/nitrite reductase, dependent on ferredoxins as electron carriers, is reduction
of NO�2 to NH+4 .
Addition of NO�3 and NO�2 to the electrolyte impacts NH3 production and the
faradaic response due to voltammetric perturbation. As shown in Figure 6, the
electrochemical reactions of interest in nitrate/nitrite reductase are
NO�3 + 2H+ + 2e NO�2 +H2O E�
0
pH=7 = 0:18 V vs. SCE (13)
NO�2 + 8H+ + 6e NH+
4 E�0
pH=7 = 0:071 V vs. SCE (14)
The formal potentials stated for Reactions 13 and 14 are thermodynamic values. The
nitrate/nitrite reductase reactions are signi�cantly dependent on pH and the H+/e
ratio. Further, Chapter 4 will discuss the complexity of the electrochemical reaction
possibilities for nitrates and nitrites. Chapter 4 discusses how the redox potentials
to drive these reactions are closely related and di¢ cult to distinguish. The likelihood
of disproportionation reactions is large, which complicates exact identi�cation of
the stepwise ammonia generation. The intermediates in denitri�cation are NO
and N2O. Denitri�cation is a dissilmilatory route for the reduction of NO�2 and
NO�3 in prokaryotic organisms like Anabaena variabilis [41]. The end product of
denitri�cation is N2. Denitri�cation is a catalytic process dependent upon enzymes.
24
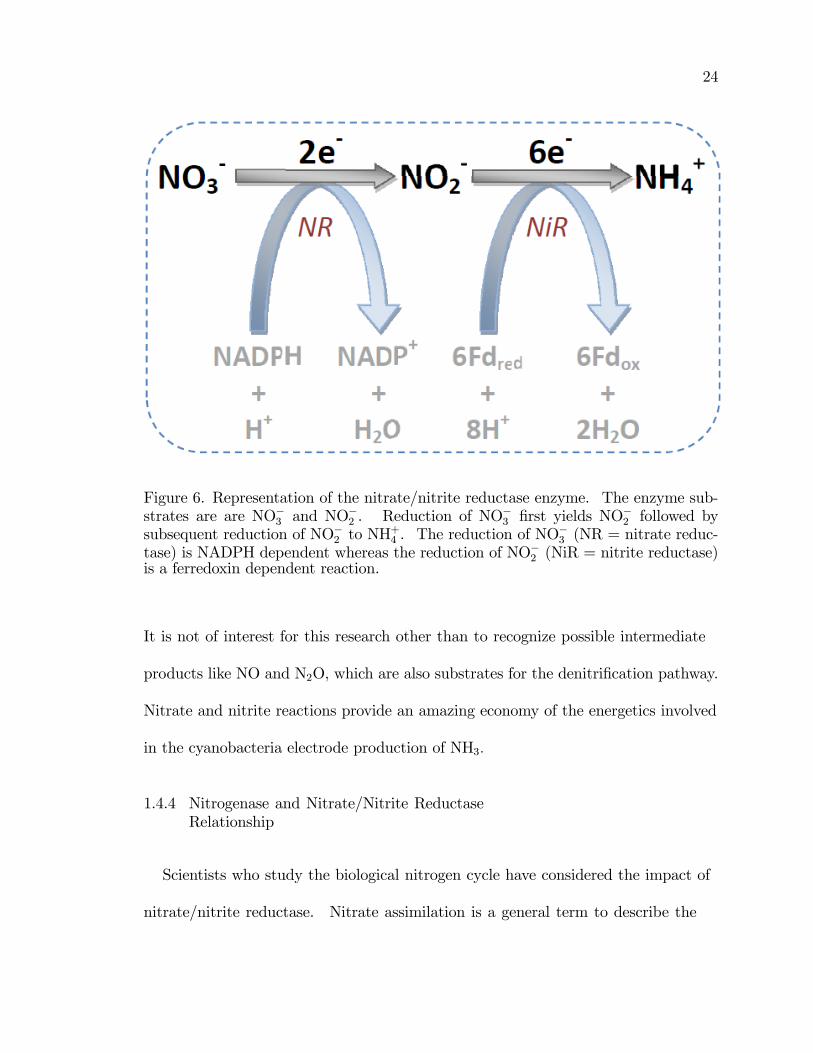
Figure 6. Representation of the nitrate/nitrite reductase enzyme. The enzyme sub-strates are are NO�3 and NO
�2 . Reduction of NO�3 �rst yields NO
�2 followed by
subsequent reduction of NO�2 to NH+4 . The reduction of NO
�3 (NR = nitrate reduc-
tase) is NADPH dependent whereas the reduction of NO�2 (NiR = nitrite reductase)is a ferredoxin dependent reaction.
It is not of interest for this research other than to recognize possible intermediate
products like NO and N2O, which are also substrates for the denitri�cation pathway.
Nitrate and nitrite reactions provide an amazing economy of the energetics involved
in the cyanobacteria electrode production of NH3:
1.4.4 Nitrogenase and Nitrate/Nitrite ReductaseRelationship
Scientists who study the biological nitrogen cycle have considered the impact of
nitrate/nitrite reductase. Nitrate assimilation is a general term to describe the
25
enzymatic bacterial conversion of NO�3 to NH+4 . In the denitri�cation pathway,
the roles of NO�3 and NO�2 are considered for the formation of N2, the substrate
for nitrogen �xation. Thus, in the absence of ammonia, nitrate/nitrite reductase
produces ammonia from NO�3 or NO�2 . If both enzymes are present and active,
perhaps when nitrogenase synthesis has not yet been repressed but has low activity,
some NO�2 can divert to the denitri�cation path for eventual N2 formation and
�xation. [41�43]
Both nitrogenase and nitrate/nitrite reductase produce ammonia as a product.
Nitrogenase requires gaseous N2 as a substrate whereas nitrate/nitrite reductase
depends on reduced nitrogen in the NO�2 or NO�3 form as a substrate. Nitrogenase
is an ATP dependent reaction. Biochemically, respiration through photosystem I
recycles ADP to ATP in a ferredoxins and NADPH dependent manner. Further,
it is known that ATP binding to the Fe protein of nitrogenase is the rate limiting
step. Nitrate/nitrite reductase does not depend on reducing equivalents provided
by the dephosphorylation or ATP to ADP, which simpli�es the mechanism.
Nitrogenase produced H2 as a byproduct, but nitrate/nitrite reductase does not.
Both nitrogenase and nitrate/nitrite reductase depend on the reducing power of
NADPH. NADPH electrolysis is a ubiquitous electron transfer reaction in living
organisms. The relationship between nitrogenase and nitrate/nitrite reductase
presents a complex system with multiple levels of shared substrates, cofactors, and
mediators. Decoupling the exclusive contribution to total ammonia production
by each enzyme is not the goal of this research. Rather, the goal is to capitalize
on either or both enzyme contributions to sustained and increased production of
26
ammonia.
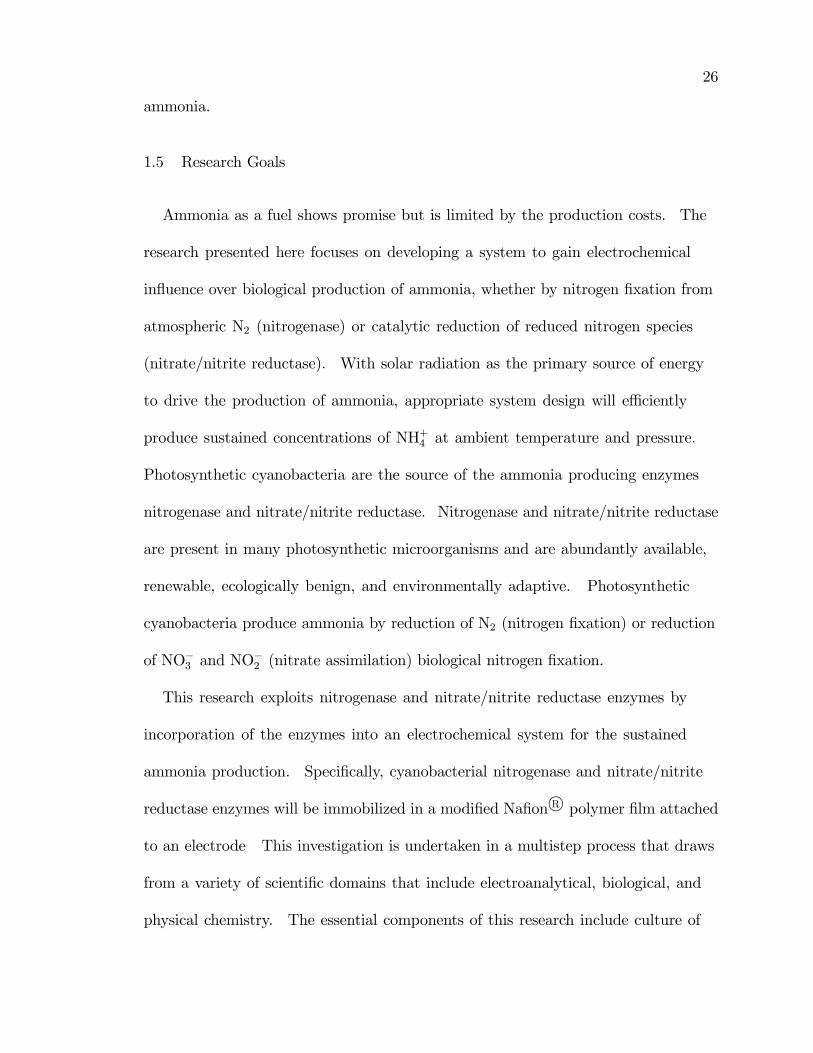
1.5 Research Goals
Ammonia as a fuel shows promise but is limited by the production costs. The
research presented here focuses on developing a system to gain electrochemical
in�uence over biological production of ammonia, whether by nitrogen �xation from
atmospheric N2 (nitrogenase) or catalytic reduction of reduced nitrogen species
(nitrate/nitrite reductase). With solar radiation as the primary source of energy
to drive the production of ammonia, appropriate system design will e¢ ciently
produce sustained concentrations of NH+4 at ambient temperature and pressure.
Photosynthetic cyanobacteria are the source of the ammonia producing enzymes
nitrogenase and nitrate/nitrite reductase. Nitrogenase and nitrate/nitrite reductase
are present in many photosynthetic microorganisms and are abundantly available,
renewable, ecologically benign, and environmentally adaptive. Photosynthetic
cyanobacteria produce ammonia by reduction of N2 (nitrogen �xation) or reduction
of NO�3 and NO�2 (nitrate assimilation) biological nitrogen �xation.
This research exploits nitrogenase and nitrate/nitrite reductase enzymes by
incorporation of the enzymes into an electrochemical system for the sustained
ammonia production. Speci�cally, cyanobacterial nitrogenase and nitrate/nitrite
reductase enzymes will be immobilized in a modi�ed Na�on R polymer �lm attached
to an electrode This investigation is undertaken in a multistep process that draws
from a variety of scienti�c domains that include electroanalytical, biological, and
physical chemistry. The essential components of this research include culture of
27
photosynthetic cyanobacteria that contain at least two ammonia producing enzymes
(Chapter 2); immobilization of the cells containing enzyme in an immobilization
polymer on an electrode (Chapters 2, 3); characterization of cells and enzymes
electrochemically (Chapter 3); evaluation of the ammonia production e¢ ciency of
the electrode immobilized cells (Chapter 5); and development of the mechanistic
model framework to describe the observed ammonia production (Chapter 5).
28
CHAPTER 2
EXPERIMENTAL BACKGROUND AND DESIGN
An alternative method for ammonia production that is not dependent upon high
temperatures and pressures and a fossil fuel based source of hydrogen would make
ammonia a more �nancially and environmentally promising fuel. Biological nitrogen
�xation and other cyanobacterial enzyme processes achieve ammonia production
under ambient conditions with sunlight as its primary energy source. Each known
ammonia producing enzyme within cyanobacteria depends on low potential electron
carriers to di¤use to the enzyme and increase the reductive potential within the
cell. Reactions involved in the biocatalytic conversion of nitrogen sources to
ammonia require low potential driving forces to accomplish e¢ cient conversion.
The need for low potential electron transfer presents an electrochemically interesting
system to study. Many currently investigate cell and enzyme immobilization to
electrode surfaces for enhancing electrocatalysis [44�51]. Free living photosynthetic
cyanobacteria produce ammonia along existing biosynthetic pathways in their natural
habitat. The complex electrochemical system driving the reduction of nitrogen
to ammonia via nitrogenase, for example, is only partially understood from an
electrochemical approach of study [27,35,38,52�59]. Electrochemical interrogation
of ammonia producing enzymes with cyclic voltammetry and subsequent modeling
assists in a broader understanding of the cell, enzyme, and electrode interactions.
While these biological systems tend to be very complex, electrochemical analysis
of enzymejelectrode reactions provides a framework for understanding increased
29
ammonia production by immobilized cells.
As the goal for this research is to produce ammonia at ambient temperature and
pressure, organisms already capable of achieving this on a small scale were selected
as to exploit the ability of cells to drive the kinetically challenging and energy
intensive process of producing ammonia. In general, the ammonia produced by
these cells is destined for amino acid synthesis for organism growth and nutrition.
A system that intercepts or diverts the �ow of ammonia produced enzymatically
has signi�cant implications. This research attempts to construct a multiple domain
architecture to support the ammonia producing mechanism of cyanobacteria without
the requirement of signi�cant energy input. The research also extends further into
the system by building a foundation for the correlation of electrochemical data with
ammonia production data and a resultant kinetic model framework.
2.1 Cyanobacteria
Cyanobacteria, commonly referred to as blue green algae, is a phylum of bacteria
that obtain their energy through carbon sequestration via photosynthesis. The
ability of cyanobacteria to perform oxygenic photosynthesis is thought to have
converted the early reducing atmosphere of Earth into an oxidizing environment,
which dramatically changed the composition of life forms on Earth by stimulating
biodiversity and leading to the near extinction of oxygen intolerant organisms.
Cyanobacteria are a ubiquitous genera of organism found in almost every possible
environment, from oceans to fresh water to bare rock and soil. Cyanobacteria are
easy to culture in a laboratory and are available commercially from the American
30
Type Culture Collection (ATCC). Ammonia producing cyanobacterial strains
have several key characteristics that warrant study from an energy perspective.
Cyanobacteria depend upon sunlight for energy (a renewable source), produces
ammonia (alternative fuel and essential fertilizer), �x carbon (releases O2 as a
product), and grows as a self contained ecosystem with 2 - 8 % conversion e¢ ciencies
[1, 7, 23�25, 60, 61]. Biotechnological development of energy systems have often
focused on algae for biomass or H2 production, but few have focused on using algae
for NH3 production. Anabaena variabilis is a strain of photosynthetic cyanobacteria
that contains enzymes that produce NH3 at ambient temperatures and pressures.
2.1.1 Anabaena variabilis
Anabaena variabilis (ATCC #29314) is a hearty strain of �lamentous heterocystic
cyanobacteria that have been studied and investigated since their discovery and
genetic sequencing in the early 1980�s. A great deal has been reported about
culturing cyanobacteria and immobilizing live cells for the purpose of NH3 and
H2 production [38, 62�69]. The A. var. strain was primarily selected because it
produced some of the highest NH3 output relative to other strains of cyanobacteria.
Further, A. var. is a commonly found strain of cyanobacteria that does not have
extreme environmental conditions for survival and growth.
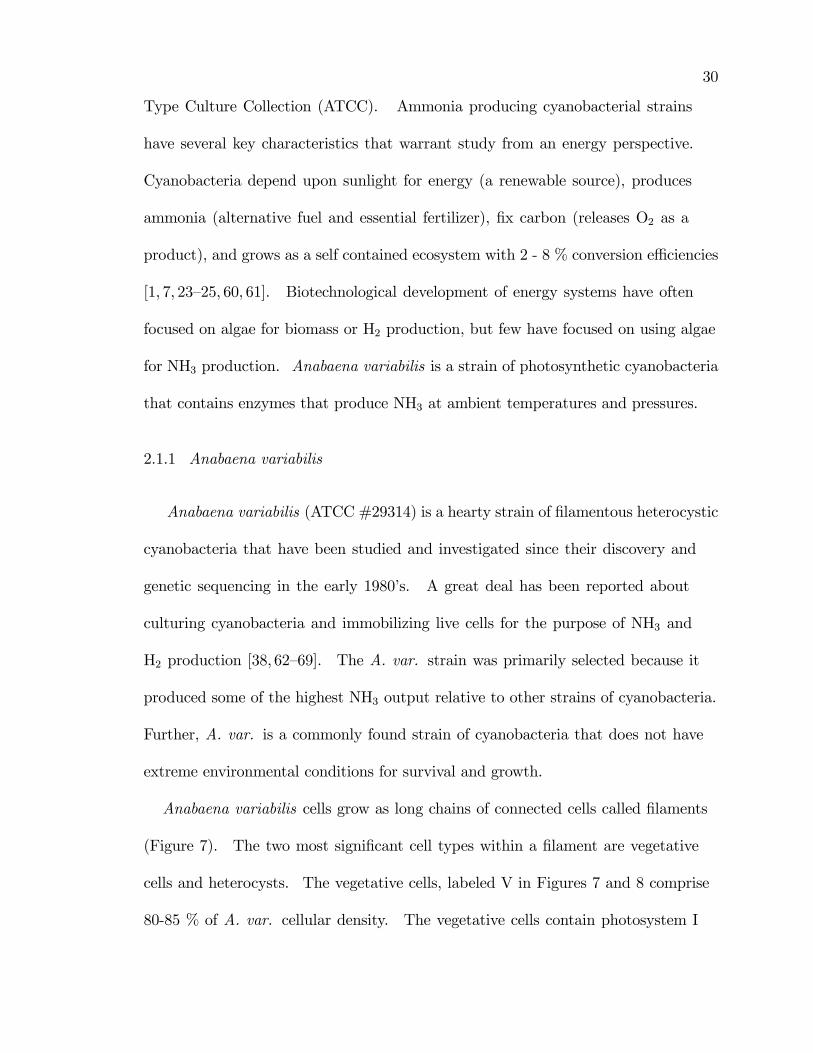
Anabaena variabilis cells grow as long chains of connected cells called �laments
(Figure 7). The two most signi�cant cell types within a �lament are vegetative
cells and heterocysts. The vegetative cells, labeled V in Figures 7 and 8 comprise
80-85 % of A. var. cellular density. The vegetative cells contain photosystem I
31
Figure 7. 50� bright�eld image of Anabaena variabilis SA-1. 5 �L of cell suspensionwas applied to a new glass slide, covered with a coverslip, and imaged on an invertedmicroscope. Two signi�cant cell types are highlighted, vegetative cells (V) andheterocysts (H). Scale bar indicates 60 �m.
32
and II, the active sites of cellular respiration and carbon �xation. Additionally,
the vegetative cells contain many enzymes within the cytosol. The enzyme of
interest located in vegetative cells is nitrate/nitrite reductase. The cell membranes
are multilayered structures approximately 1 �m in diameter. The vegetative cells
fuse into long �laments, typically 20-30 cells in length. The membrane is a typical
phospholipid bilayer with additional cellular layers interspersed. The membrane
contains numerous channels for the passage of species into and out of the cell. Some
of these channels are actively controlled. An active channel requires cellular energy,
such as adenosine triphosphate (ATP), to bind to the channel and thereby allow
entrance or exit of chemical species from the cytosol. Passive channels are typically
ion selective and allow for the passive di¤usion of ions into the cytosol. Uncharged
species can freely di¤use through the membrane as well, thus enzyme substrates like
NO�3 and NO�2 and N2 and products like NH
+4 are able to enter and exit the cell.
At an approximate 10 % spacing density, heterocysts are found in A. var. grown
without a �xed source of nitrogen; thus, one in ten cells in a Anabaena variabilis
�lament is a nitrogenase containing heterocyst.
Under �xed nitrogen starvation conditions, nitrogen �xation (nif) genes encode for
the formation of heterocysts, the evolutionary response to an organism�s limited �xed
nitrogen availability. Heterocysts have thickened (2 �m) diameter cell membranes
and are relatively impermeable to O2. Nitrogenase is strictly located in the
heterocysts. Due to protection o¤ered by the heterocysts, nitrogenase is protected
from its most common inhibitor, O2, which irreversibly binds to nitrogenase.
Heterocysts, labeled H in Figures 7 and 8 are easily distinguished visually due to
33
their larger size and lack of color resulting from the absence of photosystem I/II. To
achieve nitrogen �xation, nitrogenase requires ATP, which is the end product of the
respiratory electron transport chain in the vegetative cell chloroplasts. Heterocysts
and vegetative cells are connected by a thin channel that allows shuttling of products
and reactants from one cell type to another. Heterocysts can be isolated and exhibit
high enzyme activity for short periods of time if not supplemented with an ATP
recycling system, normally provided by the vegetative cells.
Ammonia produced by A. var. is the primary substrate for the enzyme glutamine
synthetase; therefore, nearly all NH+4 produced enzymatically never exits the
cytosol. A.var. have been genetically mutated to be nitrogenase derepressed
[70�74]. The process of mutagenesis is described elsewhere in full detail [73].
Brie�y, the procedure to generate Anabaena variabilis SA-1 was accomplished by
ethyl methanesulfonate (EMS) mutagenesis. EMS is a mutagenic organic compound
that produces random nucleotide substitutions in genetic sequences. After screening
resultant mutants, the SA-1 strain was isolated and subcultured, producing only
nitrogenase derepressed progeny. The method is fully described by Spiller, et. al
[73].
The mutant strain SA-1 is used in this research because enzymatic production
of NH+4 is blocked at the assimilation step of glutamine synthetase, the primary
route for intercellularly produced NH+4 . NH+4 itself is a mediator of nitrogenase
synthesis and nitrate/nitrite reductase activity. In wild type cells, su¢ cient NH+4
in medium repress enzymatic production of NH+4 due to decreased synthesis of
nitrogenase enzyme. Genetic manipulation has generated several strains of A. var.
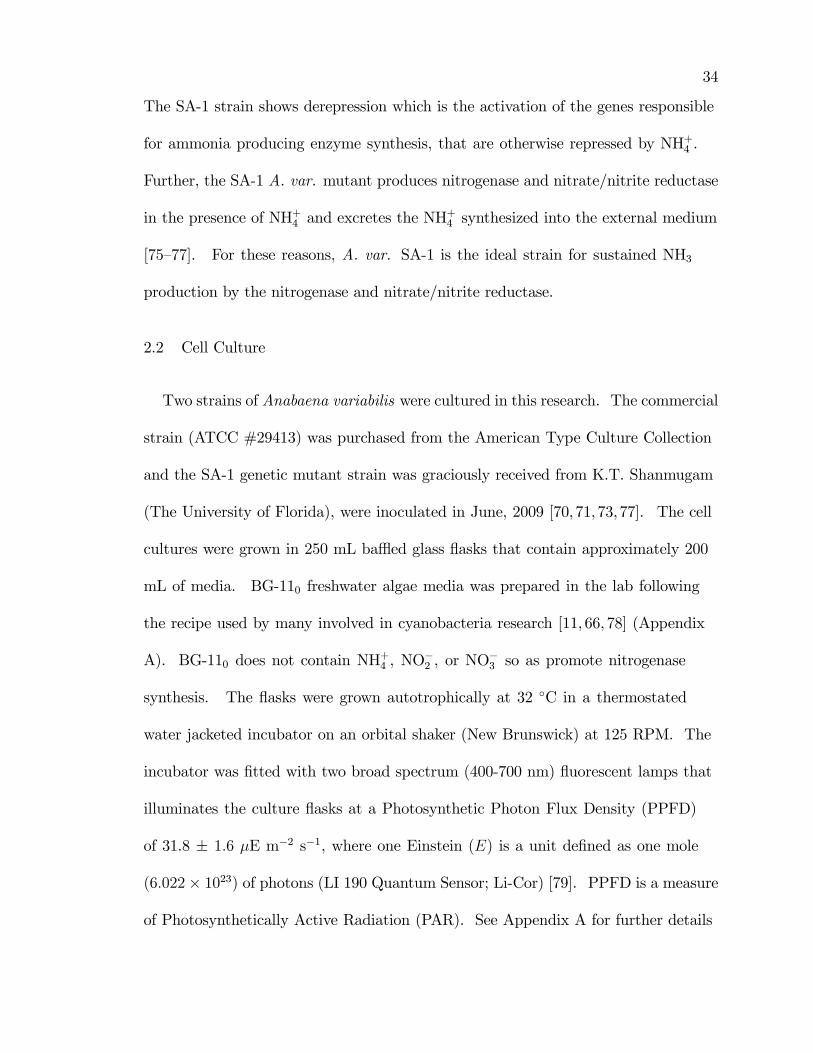
34
The SA-1 strain shows derepression which is the activation of the genes responsible
for ammonia producing enzyme synthesis, that are otherwise repressed by NH+4 .
Further, the SA-1 A. var. mutant produces nitrogenase and nitrate/nitrite reductase
in the presence of NH+4 and excretes the NH+4 synthesized into the external medium
[75�77]. For these reasons, A. var. SA-1 is the ideal strain for sustained NH3
production by the nitrogenase and nitrate/nitrite reductase.
2.2 Cell Culture
Two strains of Anabaena variabilis were cultured in this research. The commercial
strain (ATCC #29413) was purchased from the American Type Culture Collection
and the SA-1 genetic mutant strain was graciously received from K.T. Shanmugam
(The University of Florida), were inoculated in June, 2009 [70,71,73, 77]. The cell
cultures were grown in 250 mL ba ed glass �asks that contain approximately 200
mL of media. BG-110 freshwater algae media was prepared in the lab following
the recipe used by many involved in cyanobacteria research [11, 66, 78] (Appendix
A). BG-110 does not contain NH+4 , NO�2 , or NO
�3 so as promote nitrogenase
synthesis. The �asks were grown autotrophically at 32 �C in a thermostated
water jacketed incubator on an orbital shaker (New Brunswick) at 125 RPM. The
incubator was �tted with two broad spectrum (400-700 nm) �uorescent lamps that
illuminates the culture �asks at a Photosynthetic Photon Flux Density (PPFD)
of 31.8 � 1:6 �E m�2 s�1, where one Einstein (E) is a unit de�ned as one mole
(6:022� 1023) of photons (LI 190 Quantum Sensor; Li-Cor) [79]. PPFD is a measure
of Photosynthetically Active Radiation (PAR). See Appendix A for further details
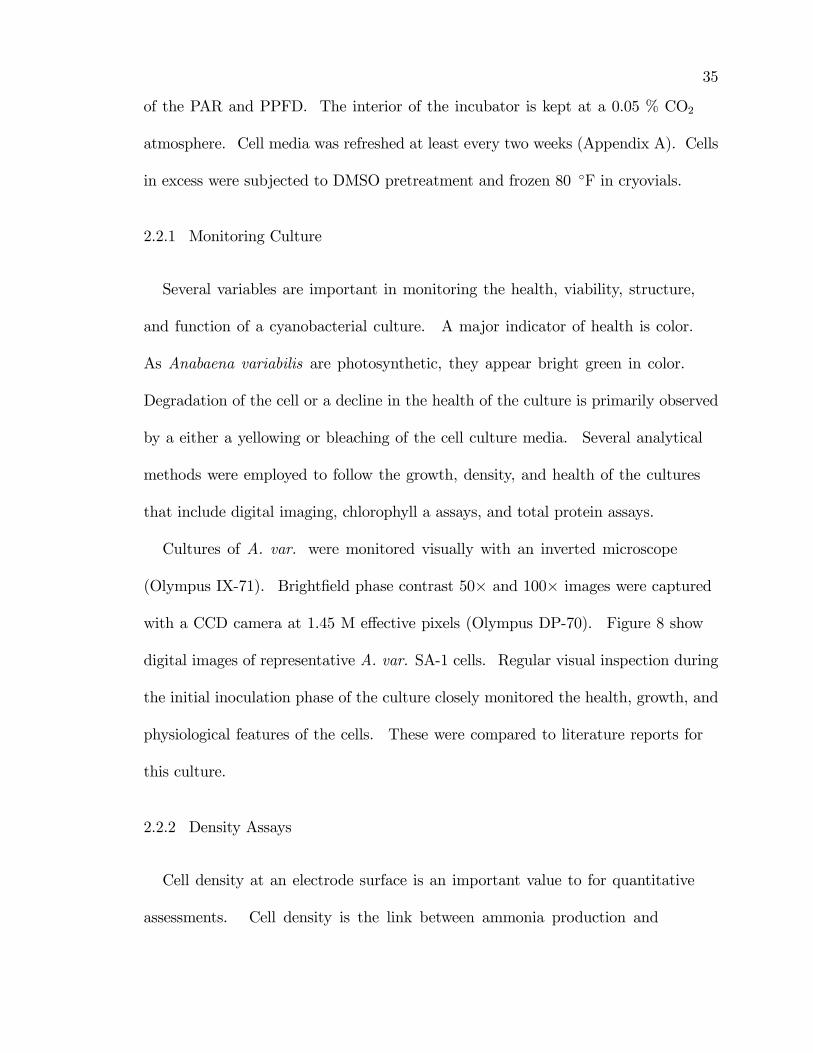
35
of the PAR and PPFD. The interior of the incubator is kept at a 0.05 % CO2
atmosphere. Cell media was refreshed at least every two weeks (Appendix A). Cells
in excess were subjected to DMSO pretreatment and frozen 80 �F in cryovials.
2.2.1 Monitoring Culture
Several variables are important in monitoring the health, viability, structure,
and function of a cyanobacterial culture. A major indicator of health is color.
As Anabaena variabilis are photosynthetic, they appear bright green in color.
Degradation of the cell or a decline in the health of the culture is primarily observed
by a either a yellowing or bleaching of the cell culture media. Several analytical
methods were employed to follow the growth, density, and health of the cultures
that include digital imaging, chlorophyll a assays, and total protein assays.
Cultures of A. var. were monitored visually with an inverted microscope
(Olympus IX-71). Bright�eld phase contrast 50� and 100� images were captured
with a CCD camera at 1.45 M e¤ective pixels (Olympus DP-70). Figure 8 show
digital images of representative A. var. SA-1 cells. Regular visual inspection during
the initial inoculation phase of the culture closely monitored the health, growth, and
physiological features of the cells. These were compared to literature reports for
this culture.
2.2.2 Density Assays
Cell density at an electrode surface is an important value to for quantitative
assessments. Cell density is the link between ammonia production and
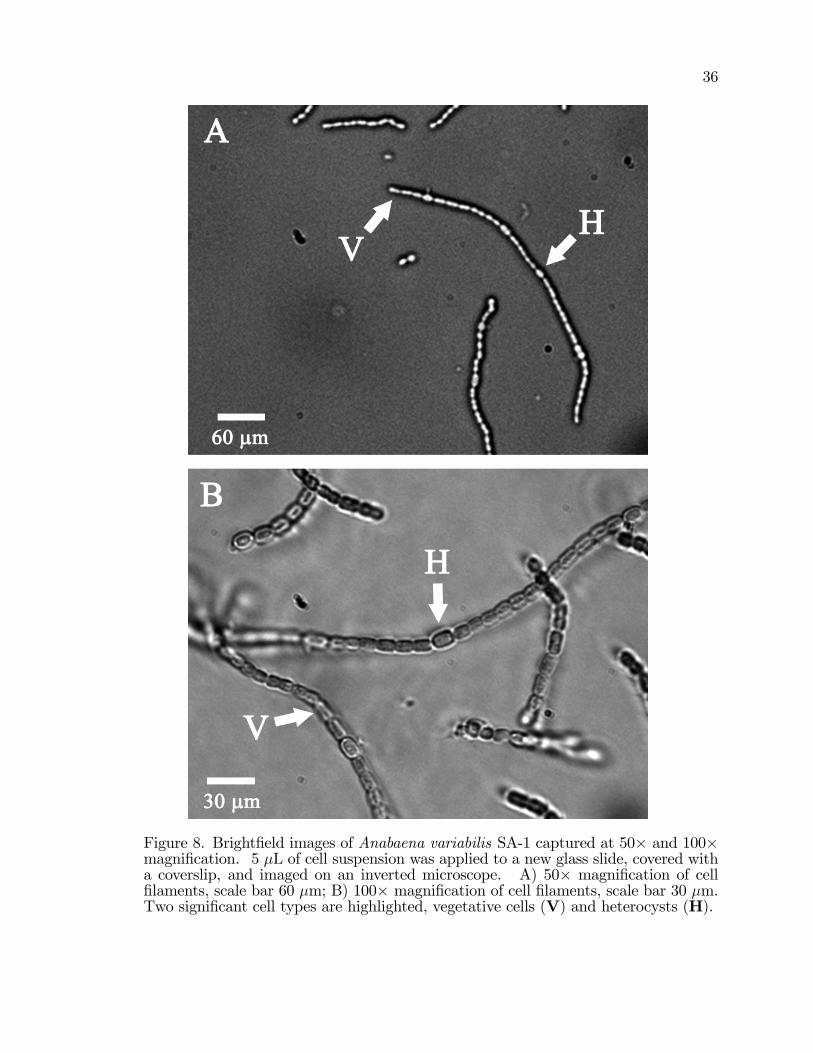
36
Figure 8. Bright�eld images of Anabaena variabilis SA-1 captured at 50� and 100�magni�cation. 5 �L of cell suspension was applied to a new glass slide, covered witha coverslip, and imaged on an inverted microscope. A) 50� magni�cation of cell�laments, scale bar 60 �m; B) 100� magni�cation of cell �laments, scale bar 30 �m.Two signi�cant cell types are highlighted, vegetative cells (V) and heterocysts (H).
37
electrochemical signals. Catalytic production of ammonia is proportional to the
amount of enzyme present. Thus, for a �xed concentration of enzyme per cell, total
cell density is a reasonable estimate and measure by which to normalize ammonia
output data. This research used two methods by which to estimate cell density in a
suspension, total chlorophyll a extraction and total protein measurements.
2.2.2.1 Chlorophyll a Assay
Algae research data relate total chlorophyll a concentration to nearly all
measured parameters. Chlorophyll a is the major pigment found in oxygen
tolerant photosynthetic organisms. Chlorophyll a is a porphyrin ring with a long
hydrocarbon tail. The tail interacts with the hydrophobic thylakoid membranes to
hold its position within the cell. Solar radiation incident to a cell surface excites
electrons in the porphyrin ring and transfers them into the electron transport chain.
The reaction centers photosystem I and II contain chlorophyll a molecules and are
only located within vegetative Anabaena variabilis cells. A calibration between
chlorophyll a concentration and cell density is di¢ cult to construct because cells
contain various concentrations of chlorophyll a depending on the growth cycle
stage and environment where the cells are grown. Thus, while [chlorophyll a] is
not a direct measure of cell density, it is a manner by which to relate analytical
measurements such as ammonia output to the photosynthetic activity of a culture
sample.
Chlorophyll a has a peak of maximum absorption at 565 nm. By the method of
Mackinney [80], chlorophyll a is extracted from the cells in 100 % methanol whose
38
absorbance is measured at 565 nm in a UV-Vis spectrometer (Ocean Optics 4000).
A 250 mL culture �ask is well mixed. 1.5 mL sample of cell suspension is placed into
a microcentrifuge tube and centrifuged at 4,400� for 5 minutes (Eppendorf 5260).
The media is decanted and replaced with 1.5 mL 100 % methanol. After mixing
for 5 minutes by vortexing, the methanol extracts chlorophyll a from the cells in a
dark container to minimize light oxidation of the pigment. Cells and cellular debris
are centrifuged from the methanol solution at 4,400� for 5 minutes. The resultant
chlorophyll a solution in methanol is placed into a 1 cm cuvette. The absorbance at
750 nm, if any, results from interfering pigments such as chlorophyll b. Absorbance
at 750 nm is subtracted from absorbance at 565 nm. By the Beer Lambert law,
A = �bc (15)
where A = absorbance in arbitrary units, � = the molar extinction coe¢ cient for
chlorophyll a in units of mL �g�1, b = the path length of the cell in cm, and c =
concentration of the analyte in �g mL�1. In 100 % methanol, �chlorophyll a = 12:7
mL �g�1. All absorbance measurements reported have the background methanol
absorbance subtracted. The density of chlorophyll is useful to normalize data
obtained from the system, such as ammonia concentration per unit of cells
immobilized, which is proportional to the density of chlorophyll a extracted.
2.2.2.2 Total Protein Assay
Another method to estimate the density of A. var. is to measure the total protein
in a sample. The Coomassie (Bradford) Assay is a colorimetric method for total
39
protein quantitation. The method used in this research is a modi�cation of the
Bradford method [81, 82]. A Coomassie Plus (Bradford) Assay Kit was purchased
from Thermo Scienti�c. This kit supplies a coomassie reagent that results in
signi�cantly less protein to protein variation than is observed with traditionally used
Bradford reagents.
When the coomassie dye binds to protein in an acidic solution, an immediate
shift in absorption maximum occurs from 465 nm to 595 nm with a simultaneous
color change from a clear brown to a brilliant clear blue. The absorbance at 595
nm is measured with a UV-Vis spectrometer (Ocean Optics 4000) and correlated to
a calibration completed with bovine serum albumin (BSA) as the standard protein.
The working range of the Coomassie Plus Assay is 100-1500 �g mL�1 of protein.
This range su¢ ciently covers the density of cells immobilized to electrode surfaces
in this research.
The process of binding the coomassie dye to protein residues is the same for both
the standard (BSA) and A. var. suspensions. In 1.5 mL microcentrifuge tubes,
50 �L of sample containing protein is added to 1.5 mL of Coomassie Plus Reagent
and thoroughly mixed by vortexing for 2 minutes. The tube is incubated at room
temperature for 10 minutes for more consistent results. The UV-Vis spectrum of
the blank (BG-110 media) was obtained and stored for subtraction. Absorbance
was measured, in quadruplicate, for nine BSA standards. The BSA standard
were prepared from commercially obtained BSA (2 mg/mL). Figure 9 is the
representative calibration curve for the BSA standards. Vertical error bars represent
� 1� from the mean of 4 samples. Total protein measurements from solutions of
40
di¤erent cell density are analyzed in the same manner. Protein concentration is
measured versus the calibration shown in Figure 9.
2.3 Cell Immobilization
Modi�cation of electrodes with enzymes is not a new idea. The literature has
examples of hydrogen fuel cells in which the catalytic breakdown of H2 is achieved
with enzymatic machinery instead of expensive metal catalysts on the anode surface
[49]. Minteer and her group have provided a wealth of information and methods
for immobilizing enzymes in polymer layers on electrodes and exploiting enzymes to
catalyze electrochemical reactions and drive biofuel cells [83]. Most often, enzymes
are more stable and more e¤ective when immobilized in a matrix than in their
natural state [48].
Others have immobilized enzymes in modi�ed Na�on layers on electrodes and
demonstrated e¤ective enzyme catalysis of appropriate substrates.[83] The Na�on
matrix provides enhanced stability and lifetime of the enzyme and enhances enzyme
reactivity. Where such systems are stable and e¢ cient, product output is low.
An ideal immobilization polymer should provide structural support and allow for
ready di¤usion of species to and from the cells and active enzyme sites. With some
modi�cation, Na�on is an ideal physical support polymer.
2.3.1 Na�on
Na�on is a highly acidic ion exchange polymer, sharing the same polymeric
�uorocarbon backbone as Te�on R . The molecular structure of the hydrogen form
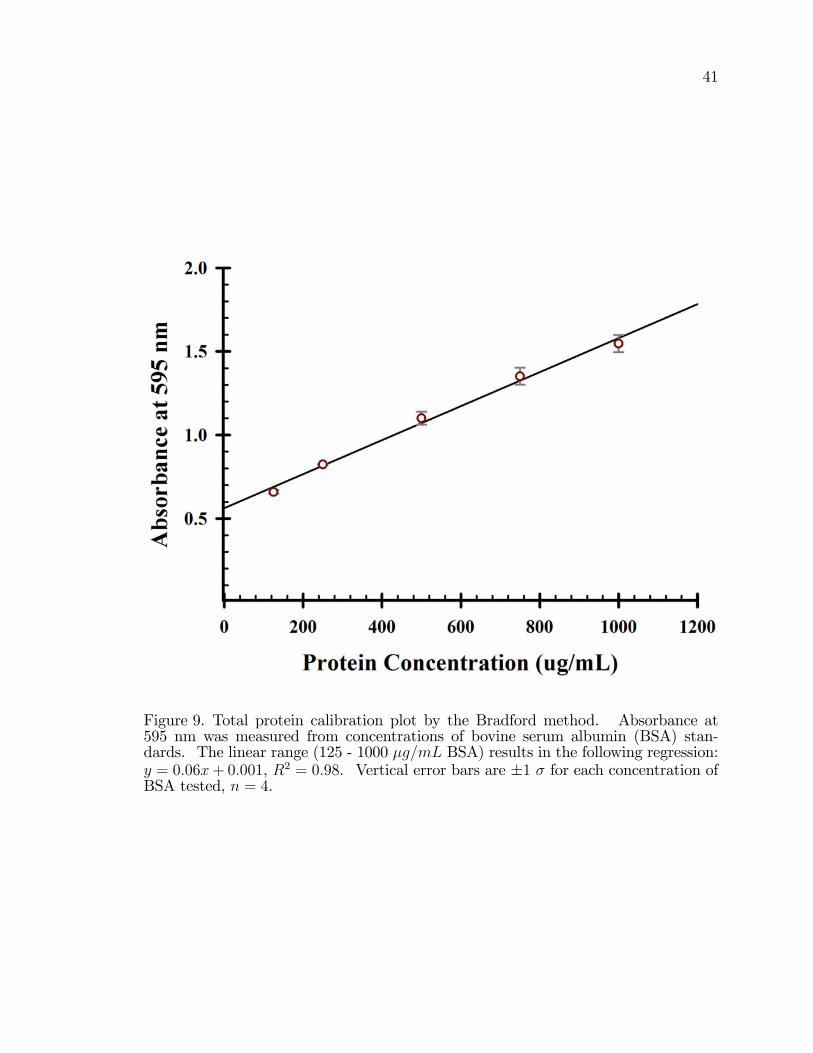
41
Figure 9. Total protein calibration plot by the Bradford method. Absorbance at595 nm was measured from concentrations of bovine serum albumin (BSA) stan-dards. The linear range (125 - 1000 �g=mL BSA) results in the following regression:y = 0:06x+ 0:001, R2 = 0:98. Vertical error bars are �1 � for each concentration ofBSA tested, n = 4.
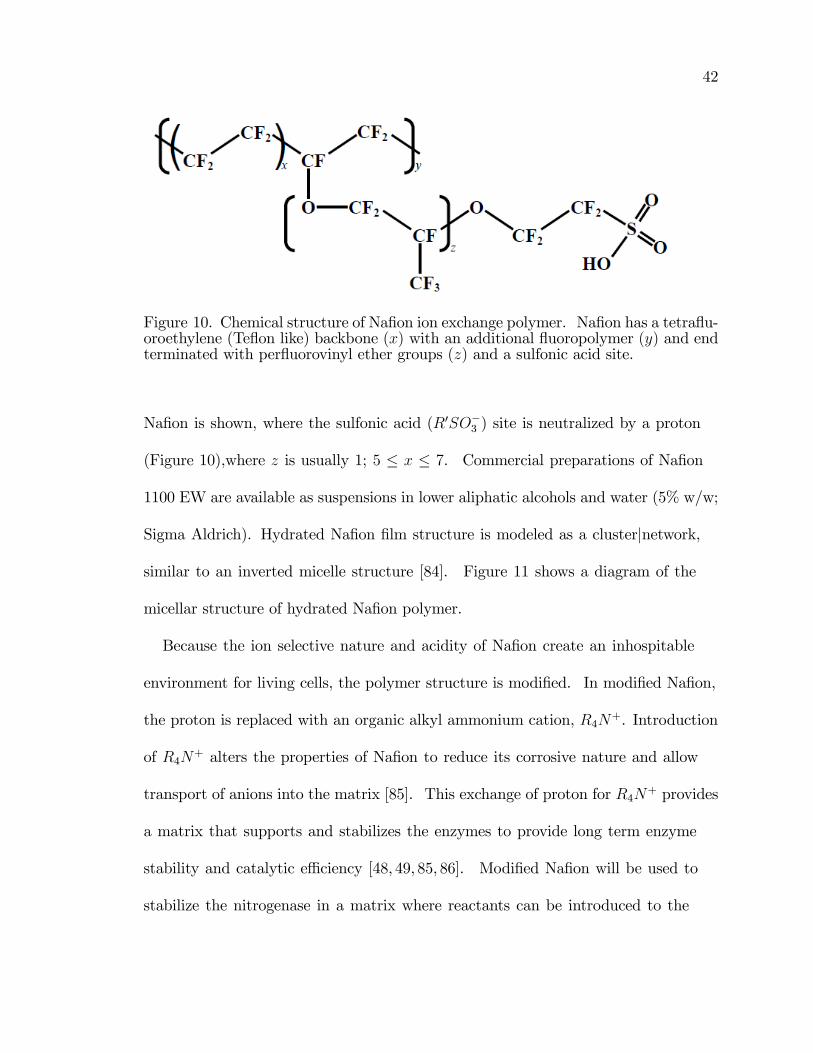
42
Figure 10. Chemical structure of Na�on ion exchange polymer. Na�on has a tetra�u-oroethylene (Te�on like) backbone (x) with an additional �uoropolymer (y) and endterminated with per�uorovinyl ether groups (z) and a sulfonic acid site.
Na�on is shown, where the sulfonic acid (R0SO�3 ) site is neutralized by a proton
(Figure 10),where z is usually 1; 5 � x � 7. Commercial preparations of Na�on
1100 EW are available as suspensions in lower aliphatic alcohols and water (5% w/w;
Sigma Aldrich). Hydrated Na�on �lm structure is modeled as a clusterjnetwork,
similar to an inverted micelle structure [84]. Figure 11 shows a diagram of the
micellar structure of hydrated Na�on polymer.
Because the ion selective nature and acidity of Na�on create an inhospitable
environment for living cells, the polymer structure is modi�ed. In modi�ed Na�on,
the proton is replaced with an organic alkyl ammonium cation, R4N+. Introduction
of R4N+ alters the properties of Na�on to reduce its corrosive nature and allow
transport of anions into the matrix [85]. This exchange of proton for R4N+ provides
a matrix that supports and stabilizes the enzymes to provide long term enzyme
stability and catalytic e¢ ciency [48, 49, 85, 86]. Modi�ed Na�on will be used to
stabilize the nitrogenase in a matrix where reactants can be introduced to the
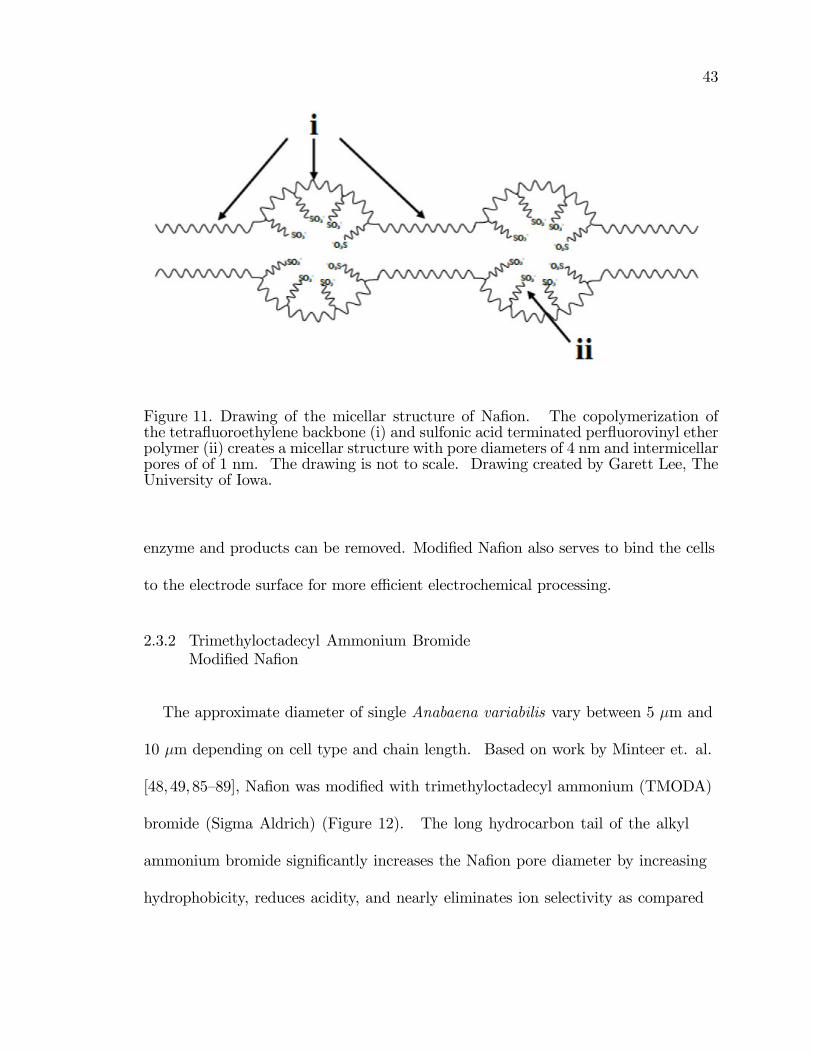
43
Figure 11. Drawing of the micellar structure of Na�on. The copolymerization ofthe tetra�uoroethylene backbone (i) and sulfonic acid terminated per�uorovinyl etherpolymer (ii) creates a micellar structure with pore diameters of 4 nm and intermicellarpores of of 1 nm. The drawing is not to scale. Drawing created by Garett Lee, TheUniversity of Iowa.
enzyme and products can be removed. Modi�ed Na�on also serves to bind the cells
to the electrode surface for more e¢ cient electrochemical processing.
2.3.2 Trimethyloctadecyl Ammonium BromideModi�ed Na�on
The approximate diameter of single Anabaena variabilis vary between 5 �m and
10 �m depending on cell type and chain length. Based on work by Minteer et. al.
[48, 49,85�89], Na�on was modi�ed with trimethyloctadecyl ammonium (TMODA)
bromide (Sigma Aldrich) (Figure 12). The long hydrocarbon tail of the alkyl
ammonium bromide signi�cantly increases the Na�on pore diameter by increasing
hydrophobicity, reduces acidity, and nearly eliminates ion selectivity as compared
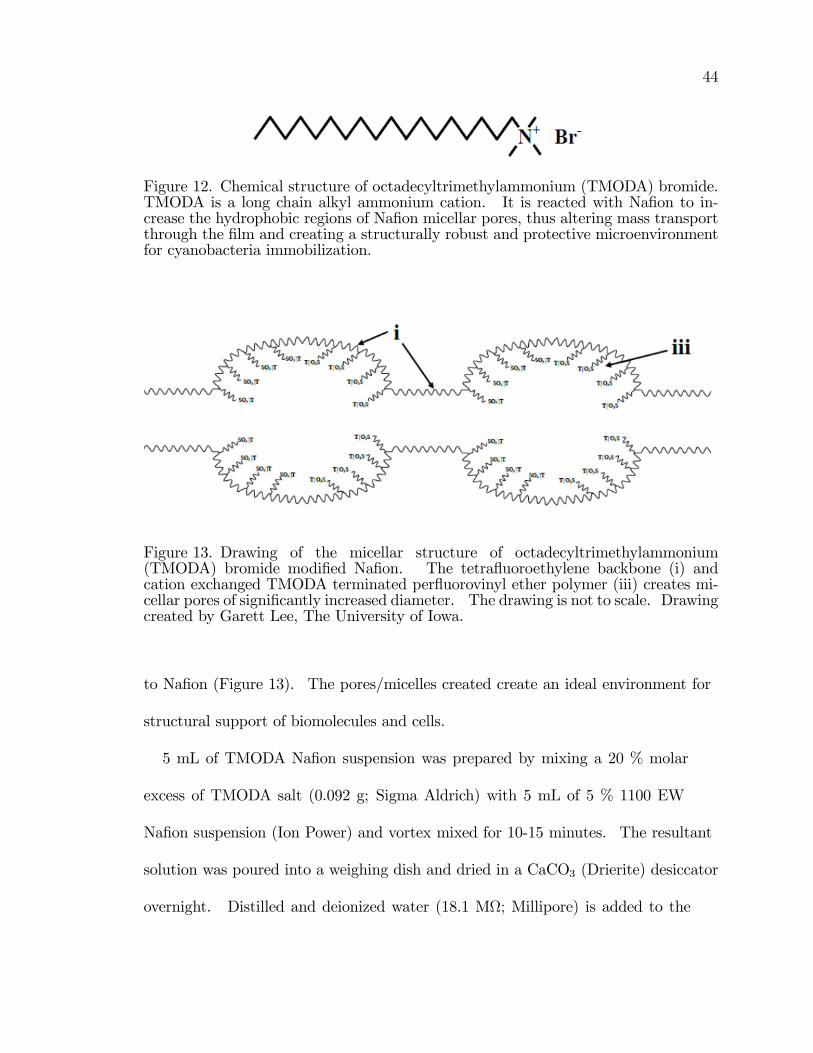
44
Figure 12. Chemical structure of octadecyltrimethylammonium (TMODA) bromide.TMODA is a long chain alkyl ammonium cation. It is reacted with Na�on to in-crease the hydrophobic regions of Na�on micellar pores, thus altering mass transportthrough the �lm and creating a structurally robust and protective microenvironmentfor cyanobacteria immobilization.
Figure 13. Drawing of the micellar structure of octadecyltrimethylammonium(TMODA) bromide modi�ed Na�on. The tetra�uoroethylene backbone (i) andcation exchanged TMODA terminated per�uorovinyl ether polymer (iii) creates mi-cellar pores of signi�cantly increased diameter. The drawing is not to scale. Drawingcreated by Garett Lee, The University of Iowa.
to Na�on (Figure 13). The pores/micelles created create an ideal environment for
structural support of biomolecules and cells.
5 mL of TMODA Na�on suspension was prepared by mixing a 20 % molar
excess of TMODA salt (0.092 g; Sigma Aldrich) with 5 mL of 5 % 1100 EW
Na�on suspension (Ion Power) and vortex mixed for 10-15 minutes. The resultant
solution was poured into a weighing dish and dried in a CaCO3 (Drierite) desiccator
overnight. Distilled and deionized water (18.1 M; Millipore) is added to the
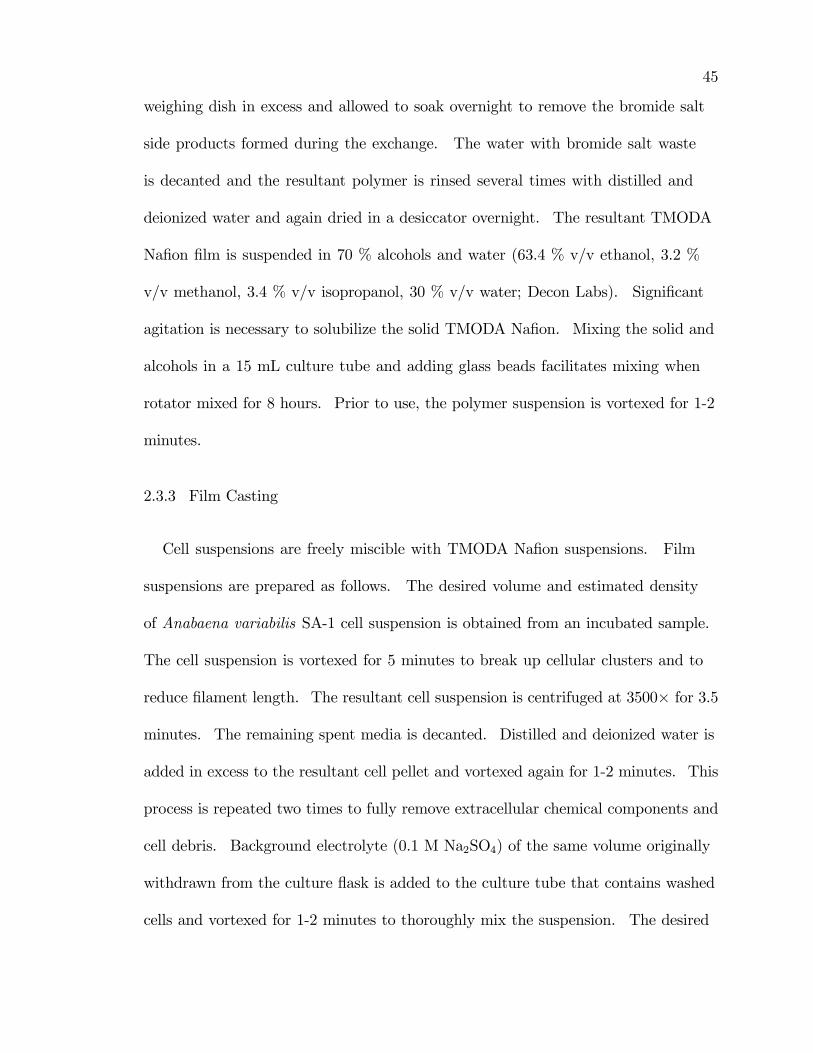
45
weighing dish in excess and allowed to soak overnight to remove the bromide salt
side products formed during the exchange. The water with bromide salt waste
is decanted and the resultant polymer is rinsed several times with distilled and
deionized water and again dried in a desiccator overnight. The resultant TMODA
Na�on �lm is suspended in 70 % alcohols and water (63.4 % v/v ethanol, 3.2 %
v/v methanol, 3.4 % v/v isopropanol, 30 % v/v water; Decon Labs). Signi�cant
agitation is necessary to solubilize the solid TMODA Na�on. Mixing the solid and
alcohols in a 15 mL culture tube and adding glass beads facilitates mixing when
rotator mixed for 8 hours. Prior to use, the polymer suspension is vortexed for 1-2
minutes.
2.3.3 Film Casting
Cell suspensions are freely miscible with TMODA Na�on suspensions. Film
suspensions are prepared as follows. The desired volume and estimated density
of Anabaena variabilis SA-1 cell suspension is obtained from an incubated sample.
The cell suspension is vortexed for 5 minutes to break up cellular clusters and to
reduce �lament length. The resultant cell suspension is centrifuged at 3500� for 3.5
minutes. The remaining spent media is decanted. Distilled and deionized water is
added in excess to the resultant cell pellet and vortexed again for 1-2 minutes. This
process is repeated two times to fully remove extracellular chemical components and
cell debris. Background electrolyte (0.1 M Na2SO4) of the same volume originally
withdrawn from the culture �ask is added to the culture tube that contains washed
cells and vortexed for 1-2 minutes to thoroughly mix the suspension. The desired
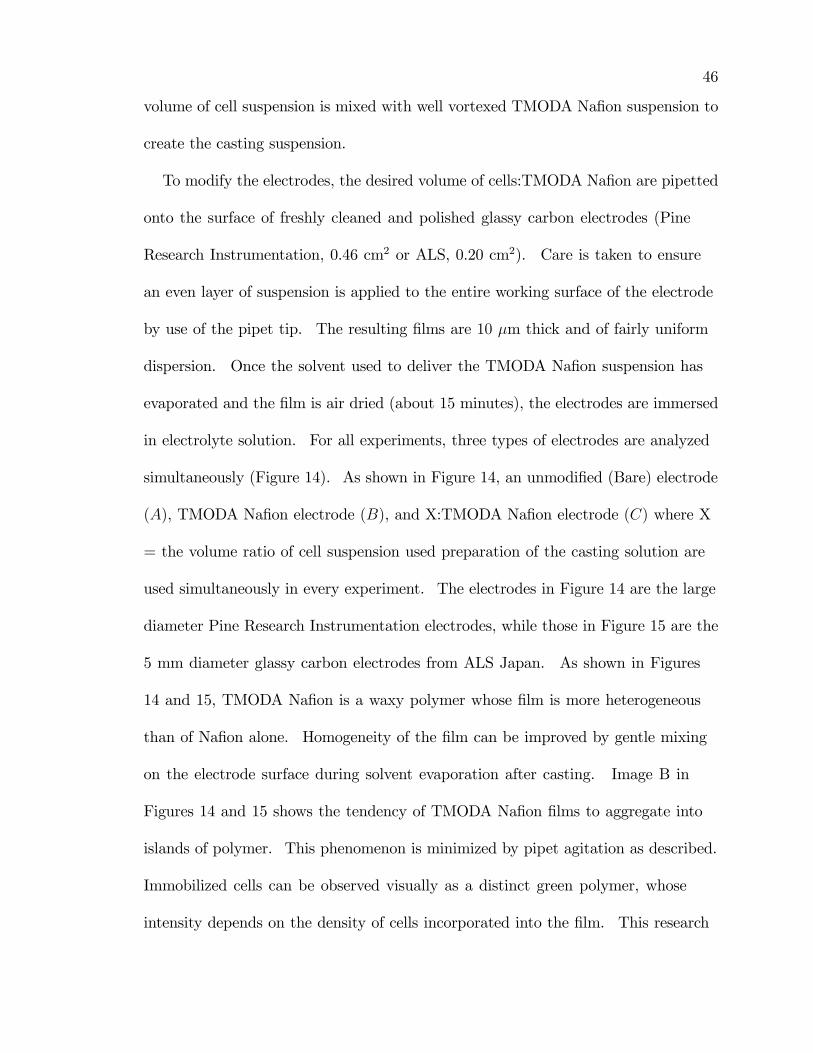
46
volume of cell suspension is mixed with well vortexed TMODA Na�on suspension to
create the casting suspension.
To modify the electrodes, the desired volume of cells:TMODA Na�on are pipetted
onto the surface of freshly cleaned and polished glassy carbon electrodes (Pine
Research Instrumentation, 0.46 cm2 or ALS, 0.20 cm2). Care is taken to ensure
an even layer of suspension is applied to the entire working surface of the electrode
by use of the pipet tip. The resulting �lms are 10 �m thick and of fairly uniform
dispersion. Once the solvent used to deliver the TMODA Na�on suspension has
evaporated and the �lm is air dried (about 15 minutes), the electrodes are immersed
in electrolyte solution. For all experiments, three types of electrodes are analyzed
simultaneously (Figure 14). As shown in Figure 14, an unmodi�ed (Bare) electrode
(A), TMODA Na�on electrode (B), and X:TMODA Na�on electrode (C) where X
= the volume ratio of cell suspension used preparation of the casting solution are
used simultaneously in every experiment. The electrodes in Figure 14 are the large
diameter Pine Research Instrumentation electrodes, while those in Figure 15 are the
5 mm diameter glassy carbon electrodes from ALS Japan. As shown in Figures
14 and 15, TMODA Na�on is a waxy polymer whose �lm is more heterogeneous
than of Na�on alone. Homogeneity of the �lm can be improved by gentle mixing
on the electrode surface during solvent evaporation after casting. Image B in
Figures 14 and 15 shows the tendency of TMODA Na�on �lms to aggregate into
islands of polymer. This phenomenon is minimized by pipet agitation as described.
Immobilized cells can be observed visually as a distinct green polymer, whose
intensity depends on the density of cells incorporated into the �lm. This research
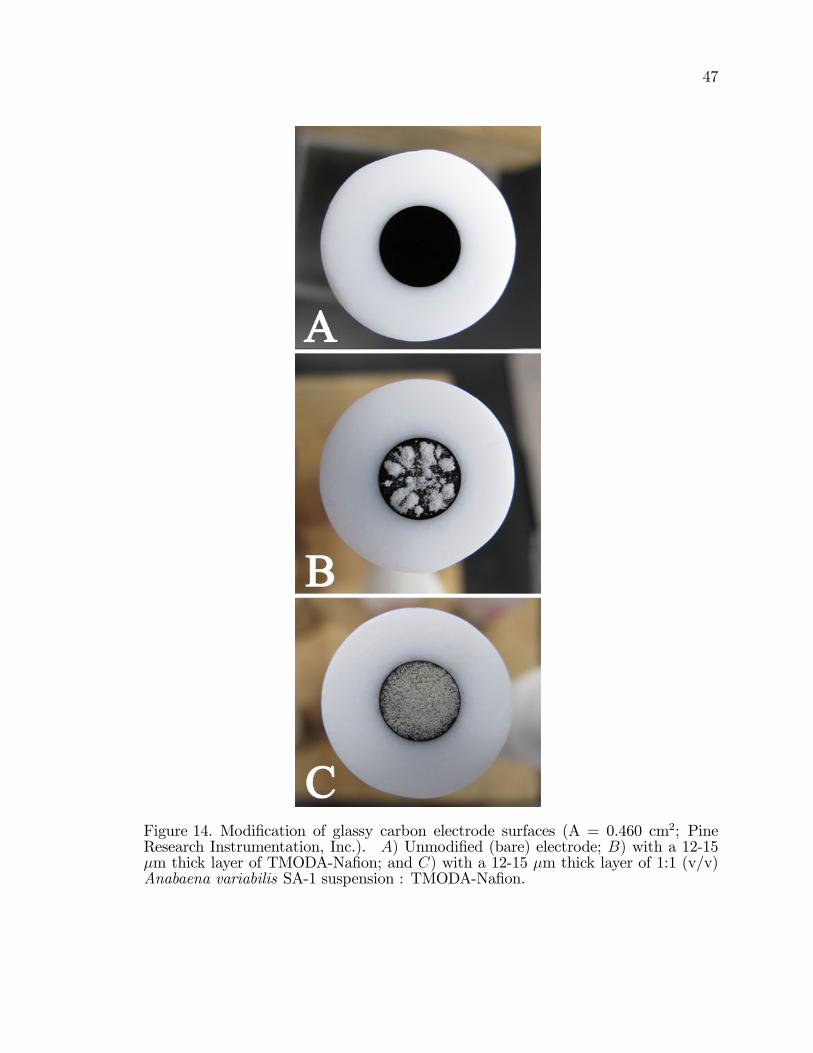
47
Figure 14. Modi�cation of glassy carbon electrode surfaces (A = 0.460 cm2; PineResearch Instrumentation, Inc.). A) Unmodi�ed (bare) electrode; B) with a 12-15�m thick layer of TMODA-Na�on; and C) with a 12-15 �m thick layer of 1:1 (v/v)Anabaena variabilis SA-1 suspension : TMODA-Na�on.
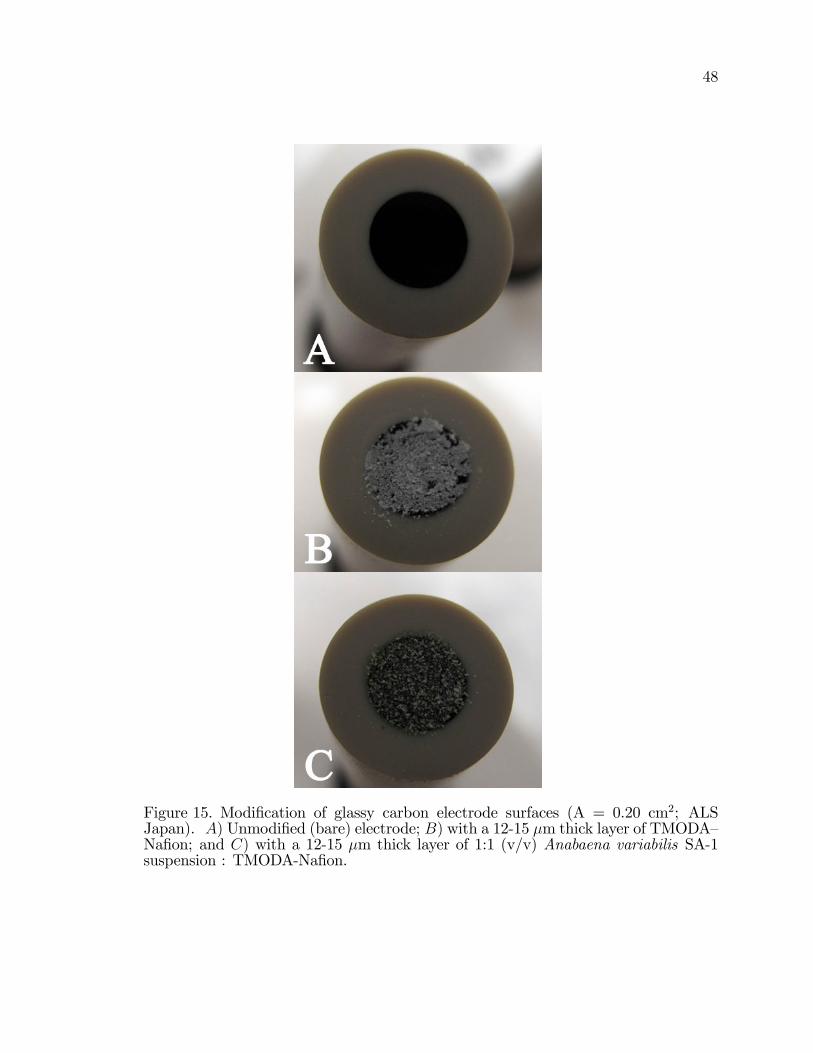
48
Figure 15. Modi�cation of glassy carbon electrode surfaces (A = 0.20 cm2; ALSJapan). A) Unmodi�ed (bare) electrode; B) with a 12-15 �m thick layer of TMODA�Na�on; and C) with a 12-15 �m thick layer of 1:1 (v/v) Anabaena variabilis SA-1suspension : TMODA-Na�on.
49
employed two types of working electrodes. Glassy carbon electrodes shrouded in
Te�on with an electroactive area of 0.456 cm2 (Pine Research Instrumentation, Inc.)
give a total current spread of approximately �50 �A whereas those glassy carbon
electrodes shrouded in PEEK polymer with an electroactive area of 0.196 cm2 (ALS,
distributed by BAS Instruments) give a total current spread of approximately � 10
�A. Most data are not reported as current density, thus a note is made regarding
the electrode used. The electrodes give the same voltammetric morphologies,
however the larger electrodes are more prone to solution leakage that resulted in
false currents.
2.4 Electroanalytical Methods
The ability to produce sustained levels of ammonia by immobilized Anabaena
variabilis immobilized to a glassy carbon electrode depends upon voltammetric
perturbation. A potential gradient can be established at a solution electrode
interface by a variety of methods and techniques.
2.4.1 Cyclic Voltammetry
Cyclic voltammetry is a useful technique in electrochemistry for studying chemical
processes that involve electron transfer reactions. The technique is similar to other
voltammetric procedures in that the current generated at an electrode surface
is measured as a function of a scanned electrode potential. The distinguishing
characteristic of cyclic voltammetry is that the potential is scanned in both the
forward and reverse directions. E¤ectively, this allows the analyst to investigate
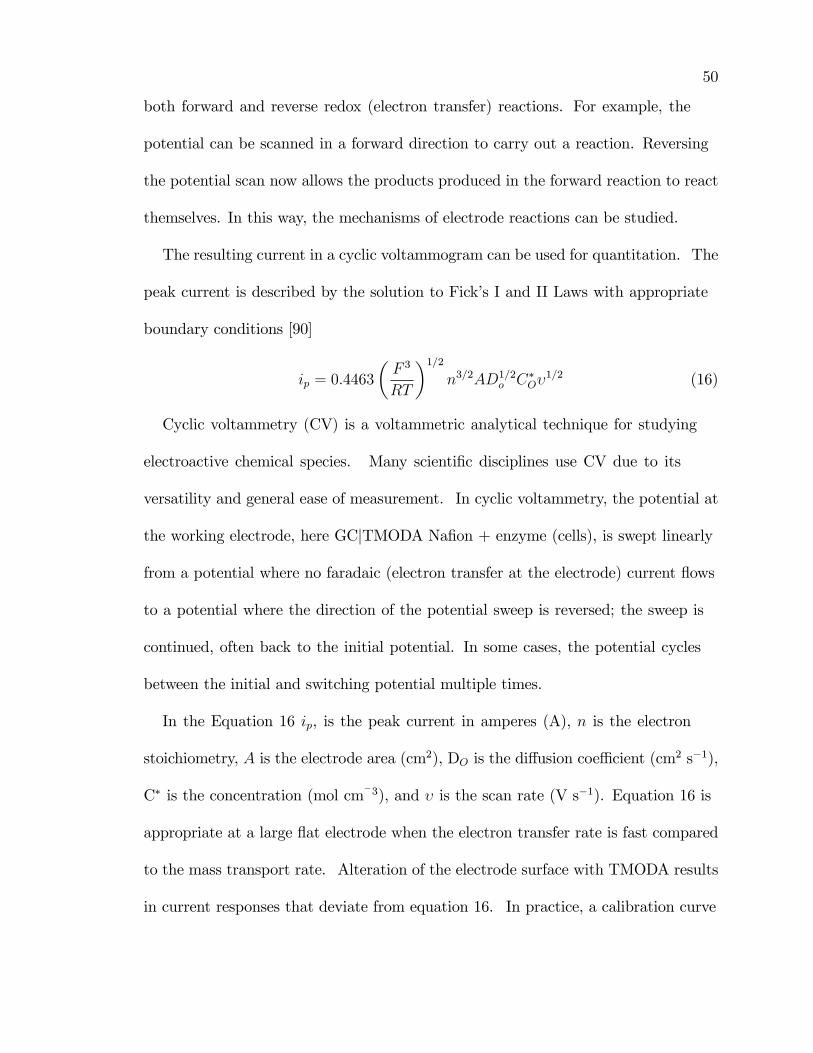
50
both forward and reverse redox (electron transfer) reactions. For example, the
potential can be scanned in a forward direction to carry out a reaction. Reversing
the potential scan now allows the products produced in the forward reaction to react
themselves. In this way, the mechanisms of electrode reactions can be studied.
The resulting current in a cyclic voltammogram can be used for quantitation. The
peak current is described by the solution to Fick�s I and II Laws with appropriate
boundary conditions [90]
ip = 0:4463
�F 3
RT
�1=2n3=2AD1=2
o C�O�1=2 (16)
Cyclic voltammetry (CV) is a voltammetric analytical technique for studying
electroactive chemical species. Many scienti�c disciplines use CV due to its
versatility and general ease of measurement. In cyclic voltammetry, the potential at
the working electrode, here GCjTMODA Na�on + enzyme (cells), is swept linearly
from a potential where no faradaic (electron transfer at the electrode) current �ows
to a potential where the direction of the potential sweep is reversed; the sweep is
continued, often back to the initial potential. In some cases, the potential cycles
between the initial and switching potential multiple times.
In the Equation 16 ip, is the peak current in amperes (A), n is the electron
stoichiometry, A is the electrode area (cm2), DO is the di¤usion coe¢ cient (cm2 s�1),
C� is the concentration (mol cm�3), and � is the scan rate (V s�1). Equation 16 is
appropriate at a large �at electrode when the electron transfer rate is fast compared
to the mass transport rate. Alteration of the electrode surface with TMODA results
in current responses that deviate from equation 16. In practice, a calibration curve
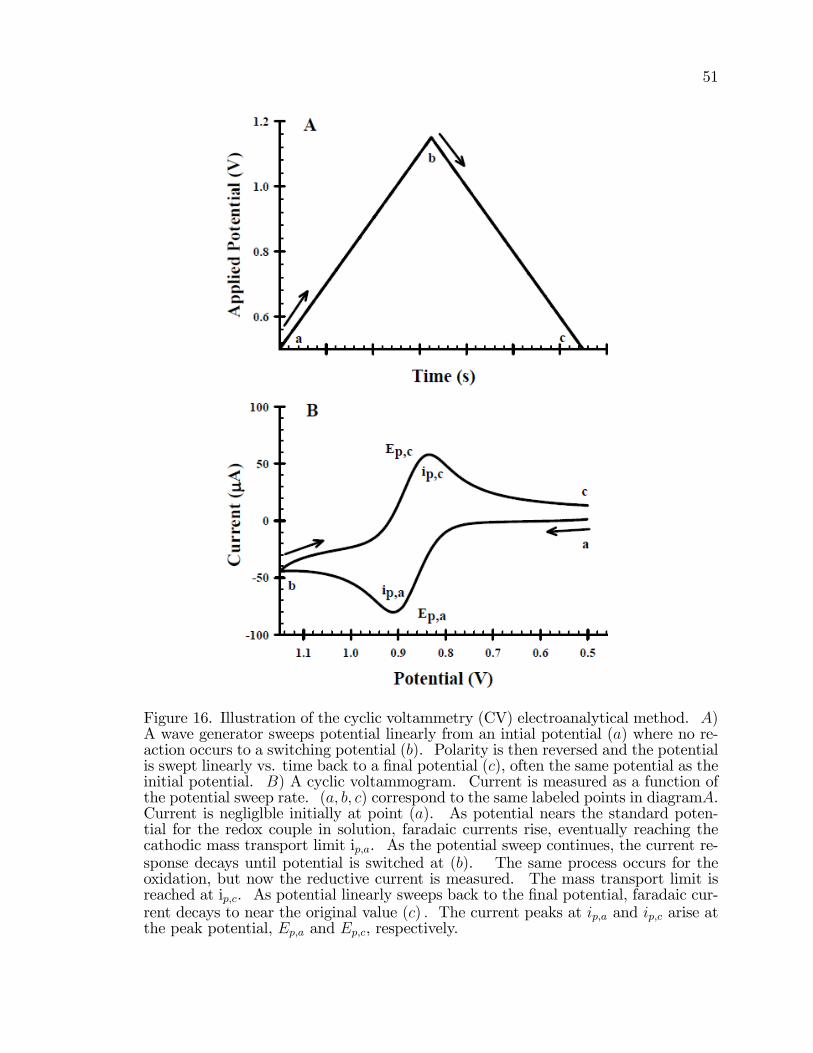
51
Figure 16. Illustration of the cyclic voltammetry (CV) electroanalytical method. A)A wave generator sweeps potential linearly from an intial potential (a) where no re-action occurs to a switching potential (b). Polarity is then reversed and the potentialis swept linearly vs. time back to a �nal potential (c), often the same potential as theinitial potential. B) A cyclic voltammogram. Current is measured as a function ofthe potential sweep rate. (a; b; c) correspond to the same labeled points in diagramA.Current is negliglble initially at point (a). As potential nears the standard poten-tial for the redox couple in solution, faradaic currents rise, eventually reaching thecathodic mass transport limit ip;a. As the potential sweep continues, the current re-sponse decays until potential is switched at (b). The same process occurs for theoxidation, but now the reductive current is measured. The mass transport limit isreached at ip;c. As potential linearly sweeps back to the �nal potential, faradaic cur-rent decays to near the original value (c) : The current peaks at ip;a and ip;c arise atthe peak potential, Ep;a and Ep;c, respectively.
52
is generated between ip and concentration, employing a set of standard solutions.
In the use of cyclic voltammetry for quantitative analyses, two considerations are
important. First, a baseline must be established on the voltammogram. This usually
involves an extrapolation of the baseline current. A second important consideration
is the subtraction of any current due to the supporting electrolyte. Failure to
subtract the background current can lead to a systematic error in a subsequent
prediction of concentration.
The experimental parameters in cyclic voltammetry are the potential range
scanned, the scan rate, and the type of working electrode. The potential range is
dependent upon the electrochemical properties of the species being studied and
the working electrode material. Each type of working electrode (Pt, Au, C, etc.)
possesses a di¤erent working potential range. The presence of electrochemical
reactions involving the electrode determines the operating range of each. The scan
rate selected depends on the information desired. For reaction studies, the use of a
fast scan rate may lead to missed information. For example, a slow scan rate may
allow time for a species produced in a chemical reaction to accumulate to the level
required for its subsequent oxidation or reduction to be observed.
2.4.2 Three Electrode Cell
The electrochemical methodology uses a three electrode system that includes a
saturated calomel reference electrode (SCE) and a glassy carbon electrode modi�ed
with either heterocysts or whole cells supported in TMODA Na�on. The third
electrode is a high surface area counter electrode. In cyclic voltammetry, the
53
potential at the working electrode, here GCjTMODA Na�on + whole cells, is swept
linear from a potential where no faradaic (electron transfer at the electrode) current
�ows to a potential where the direction of the potential sweep is reversed; the sweep
is continued, often back to the initial potential. In some cases, the potential cycles
between the initial and switching potential multiple times.
2.4.3 Experimental Parameters
The bioelectrocatalytic device generates ammonia at Anabaena variabilis
modi�ed electrodes. Electrodes are modi�ed with a modi�ed ion exchange
polymer, TMODA Na�on, that contains the cells. To modify the electrodes,
octadecyltrimethylammonium bromide modi�ed Na�on (1100 EW) (TMODA
Na�on) is mixed with cell/heterocysts (SA-1 strain) suspensions and cast onto
glassy carbon (GC) electrodes (0:5 cm2). The resulting �lms are approximately
10 �m thick and of fairly uniform dispersion. Once the solvent used to deliver the
TMODA Na�on suspension evaporates and the �lm is air dried (about 15 minutes),
the electrodes are immersed in test electrolyte solution. The electrolyte used is
100 mM Na2SO4 to provide ionic conductivity. The electrodes are evaluated by
cyclic voltammetry (CV). By varying CV scan rates, faradaic (electrolysis) currents
are analyzed and compiled to build a kinetic model of electron transfer within the
system. In all cases, controls are run with two unmodi�ed (bare) electrodes, two
electrodes modi�ed with only TMODA Na�on, and at least 4 cell modi�ed electrodes.
This simultaneous electrode measurements allows discrimination between matrix
e¤ects and cellular/enzyme activity. In the laboratory, the electrode is connected
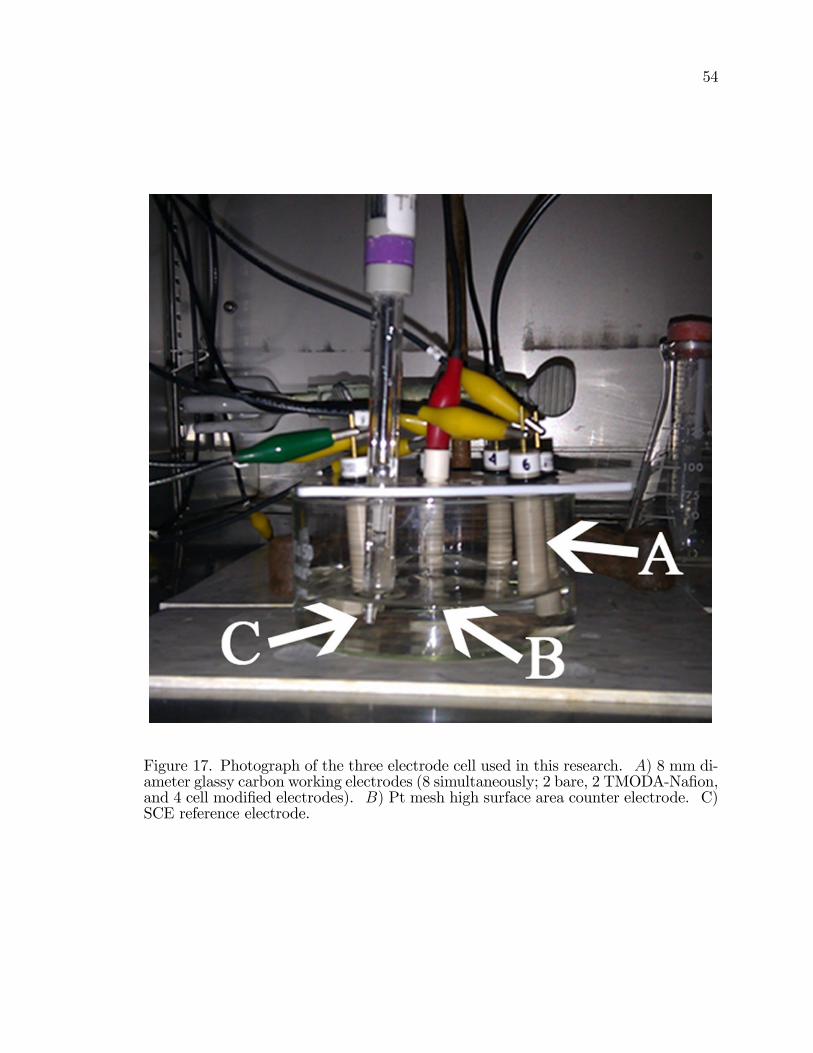
54
Figure 17. Photograph of the three electrode cell used in this research. A) 8 mm di-ameter glassy carbon working electrodes (8 simultaneously; 2 bare, 2 TMODA-Na�on,and 4 cell modi�ed electrodes). B) Pt mesh high surface area counter electrode. C)SCE reference electrode.
55
to a potentiostat. The potentiostat controls the potential drop between the cell
immobilized working electrode and the reference electrode where no current �ows.
The counter electrode passes current su¢ cient to balance the current measured at
the working electrode. The potentiostat used is an 8-channel potentiostat 1030A
(CH Instruments). Up to eight working electrodes share a common counter and
reference electrode. Each channel independently records current vs. potential for
cyclic voltammetry sweeps. The instrument does not provide iR compensation.
2.4.4 Quanti�cation of Ammonia Production
Low level detection and quanti�cation of ammonia can be a challenging analytical
task.. Ammonia detection is of signi�cant interest as it is commonly studied due to
the toxic e¤ects exerted on plant and animal life when found in high concentrations
as, for example, resulting from runo¤. The oceanography and limnology �elds of
study rely upon an indophenol reaction at high pH with colorimetric detection [91].
While the method is fast and selective, its lower limit of quantitation is high relative
to the small amounts of NH3 produced by immobilized cyanobacteria.
In water, ammonia exists simultaneously as free un-ionized gaseous ammonia
(NH3) and as the ionized ammonium ion (NH+4 ). The ratio of NH3 to NH+4 that
exists in water depend strongly on pH and to a lesser degree, temperature. Given
that the pKa of NH3 is 9.24, at 25 �C, aqueous samples of ammonia are nearly all
NH+4 , equally NH3 and NH+4 , and all NH3 at pH 7.3, 9.3, and 11.3, respectively.
Thus, the local pH near the site of ammonia release by cyanobacteria have a
signi�cant e¤ect on the form and physical state of ammonia.
56
The acid base nature of ammonia can be harnessed and coupled to a pH probe for
sensitive and fast detection and quantitation. Ammonia can be measured directly
by an ion selective electrode (ISE). As shown in Figure 18, dissolved NH3 is gaseous
and passes through the hydrophobic polytetra�uoroethylene (PTFE) membrane of
the ammonia ISE. To ensure all ammonia present exists as the gaseous form, the
sample is spiked with 1 % (v/v) 10 � 0:5 M NaOH, that converts all NH+4 to NH3
as given by the equilibrium
NH3 +H2O NH+4 +OH
� (17)
The pH change of the electrolyte solution on the other side of the membrane (0.083
�0:005 M NH4Cl) caused by the di¤used NH3 (g) is sensed by the inner body of the
ammonia electrode, which is a common pH electrode. The pH change is relative to
the amount of dissolved NH3 present and can be measured with a pH or ion meter.
The dissolved ammonia present in a sample di¤uses through the membrane until the
partial pressure of ammonia has reach equilibrium on either side of the ammonia.
In any sample the partial pressure of ammonia is proportional to its concentration.
Ammonia di¤using through the membrane dissolves into the electrode �lling solution
and, to a small extent, reacts reversibly with water. As shown in equation 17, the
base equilibrium constant expression is given by
Kb =
�NH+
4
�[OH�]
[NH3](18)
The concentration of ammonium chloride in the thin layer between the PTFE
membrane and glass membrane pH electrode body is su¢ ciently high so the
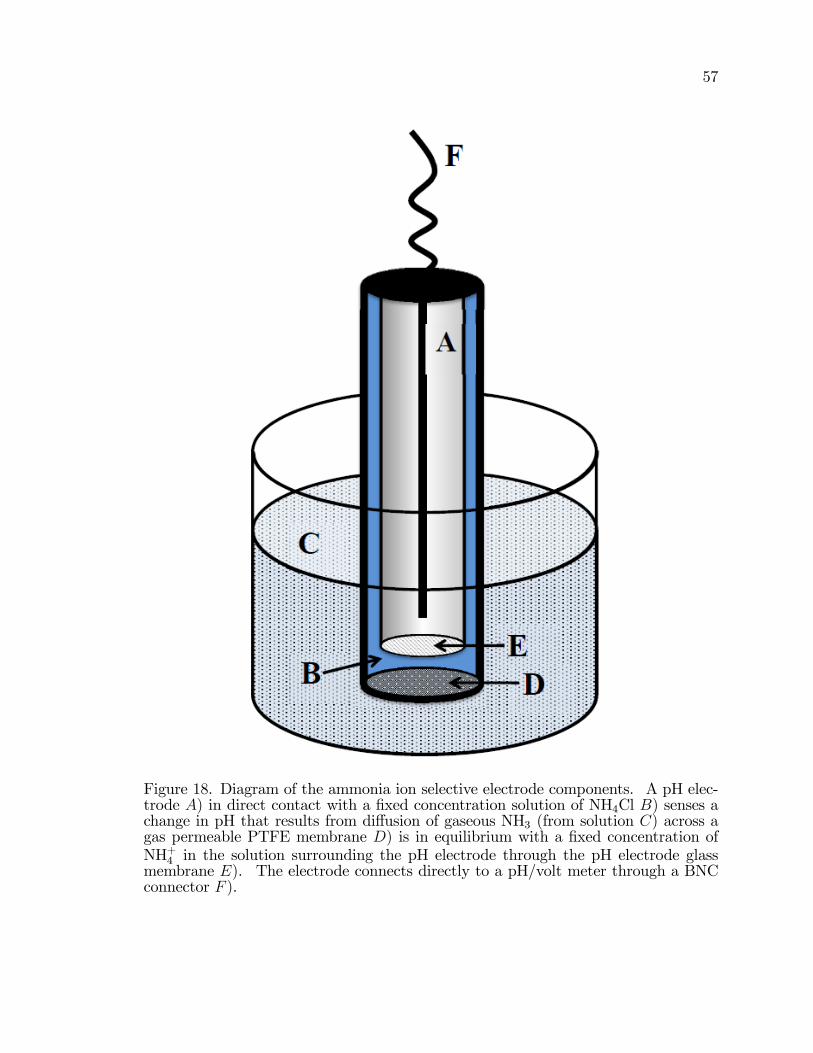
57
Figure 18. Diagram of the ammonia ion selective electrode components. A pH elec-trode A) in direct contact with a �xed concentration solution of NH4Cl B) senses achange in pH that results from di¤usion of gaseous NH3 (from solution C) across agas permeable PTFE membrane D) is in equilibrium with a �xed concentration ofNH+4 in the solution surrounding the pH electrode through the pH electrode glassmembrane E). The electrode connects directly to a pH/volt meter through a BNCconnector F ).
58
concentration of NH+4 approaches unity,
�OH�� = [NH3] Kb�
NH+4
� (19)
The potential of the sensing element with respect to the internal reference element
is described by the Nernst equation,
E = E�0 � S log
�OH�� (20)
where E = measured electrode potential (mV), E00= reference potential (mV), and
S = the electrode slope as determined from calibration (-59 mV/decade). Thus,
since [OH�] _ [NH3] as shown in equation 19, electrode response to ammonia is
also Nernstian
E = E�0 � S log [NH3] (21)
Measurement of NH3 with the ion selective electrode is fast, requires minimal setup
and sample preparation, and is regularly calibrated. Daily calibration is necessary
for low level ammonia detection, < 70 �M: Calibrations were performed with
commercially purchased ammonia standards (0.01 ppm, 0.1 ppm, 1 ppm, 10 ppm,
and 100 ppm; Aqua Solutions). The concentration detection range of the electrode
is between 5 �10�7 M and 1 M (0:01 and 17; 000 ppm NH3). Between analyses,
the electrode is stored in a solution of 1 ppm NH3 standard containing 1 % alkaline
reagent (10 M NaOH).
To calibrate the ion selective electrode, 15 mL of standard is placed into a 20 mL
scintillation vial with a magnetic stir bar. 150 �L of 10 M NaOH is added to the
stirring analyte. The ISE is cleaned with four successive washes in distilled and
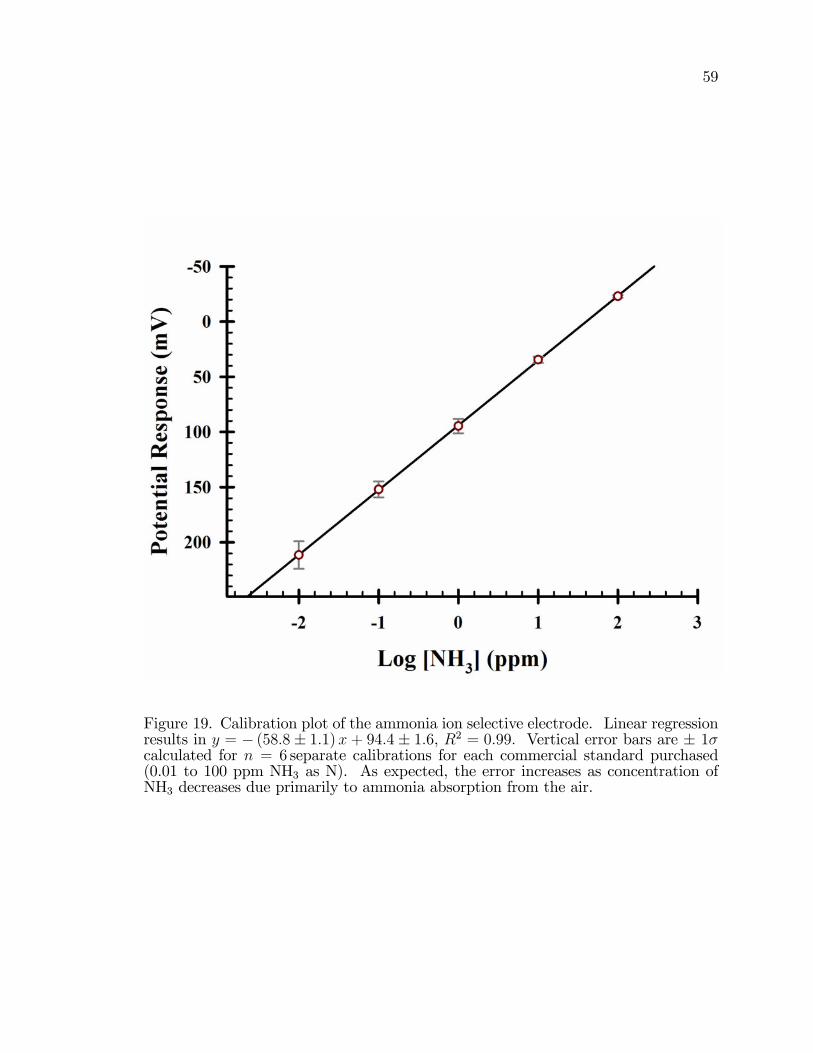
59
Figure 19. Calibration plot of the ammonia ion selective electrode. Linear regressionresults in y = � (58:8� 1:1)x + 94:4� 1:6, R2 = 0:99: Vertical error bars are � 1�calculated for n = 6 separate calibrations for each commercial standard purchased(0.01 to 100 ppm NH3 as N). As expected, the error increases as concentration ofNH3 decreases due primarily to ammonia absorption from the air.
60
deionized water. The ISE is placed into the test solution and the vial is covered
with Para�lm to minimize NH3 losses. Within 1 3 minutes (more time for lower
concentrations of NH3), the resultant potential is recorded. A plot of potential
response vs. log [NH3] yields a linear curve with an expected m = �59 mV. at
25 �C. Figure 19 shows the calibration of the NH3 ISE for 6 trials. The error bars
show � 1� for each NH3 standard potential measurement. Slight �uctuations in lab
temperature are the major contributing factor to error. Further, at the lower limit
of detection, equilibration between analyte and inner NH4Cl solution takes longer
time and is more subject to drift thus the error is more signi�cant at lower [NH3],
as observed by the larger relative error at low concentrations of NH3.
2.5 Bioelectrocatalytic Device Design
The bioelectrocatalytic device is simple in design. The most important element
is the working electrode whose surface has been modi�ed with Anabaena variabilis
SA-1 cells immobilized in TMODA Na�on. A basic diagram showing the anticipated
reactions at the working electrode are shown in Figure 20. The glassy carbon
electrode with a thin (10 � 1 �m thickness as estimated by calculation) �lm of
TMODA that contain cyanobacteria is fully immersed into a conductive background
electrolyte solution. Enzyme substrate di¤uses through solution to the TMODA
Na�onjsolution interface. TMODA Na�on is not a selective polymer and solution
equilibrates fully into the membrane after �5 minutes of soaking.
61
2.5.1 Experimental Setup
This research investigates NH3 generation from cyanobacterial enzymes
immobilized in a modi�ed Na�on polymer �lm and attached to an electrode (Figure
20). This will be undertaken in a multistep process that draws from a variety of
scienti�c domains. The essential steps are grow the enzyme; isolate the enzyme;
embed the enzyme in an ion exchange polymer on an electrode; evaluate the
e¢ ciency of the electrode bound enzyme to convert N2 to ammonia and model the
kinetics; and use the model to optimize the system for ammonia production.
Figure 21 illustrates the biological to electrochemical interface and involved
reactions. Vegetative and heterocyst cells of A. variabilis are in close contact with
the electrode. The heterocyst contains the nitrogenase enzyme. The vegetative cell
contains nitrate/nitrite reductase enzyme and photosystem I and II. Both cell types
contain the NADPH Ferredoxin oxioreductase enzyme that catalyzes the redox of
the NADP+/NADPH and oxidized ferredoxin/reduced ferredoxin reactions. Solid
arrows represent biochemical reactions. The double headed arrow show transport of
molecules. The transport may be passive by di¤usion or active by gated channels.
The diagram highlights the complexity of the system. Accordingly, data obtained
capture several levels of interrelated mechanisms.
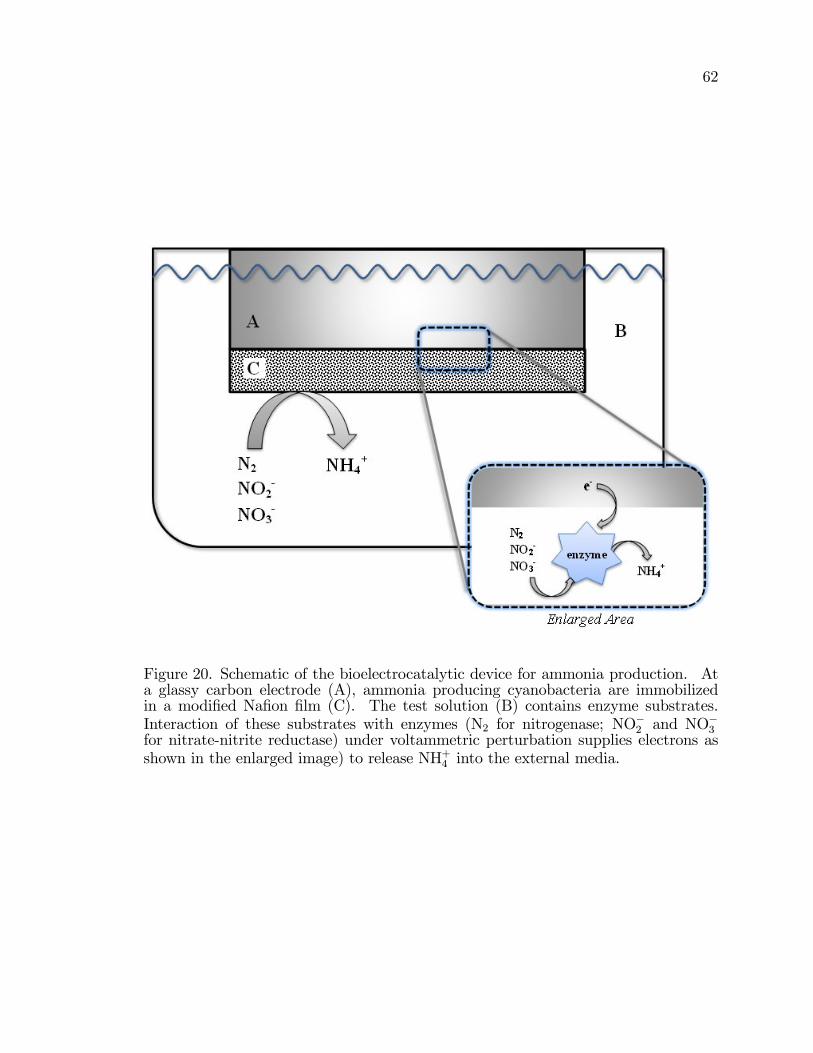
62
Figure 20. Schematic of the bioelectrocatalytic device for ammonia production. Ata glassy carbon electrode (A), ammonia producing cyanobacteria are immobilizedin a modi�ed Na�on �lm (C). The test solution (B) contains enzyme substrates.Interaction of these substrates with enzymes (N2 for nitrogenase; NO�2 and NO
�3
for nitrate-nitrite reductase) under voltammetric perturbation supplies electrons asshown in the enlarged image) to release NH+4 into the external media.
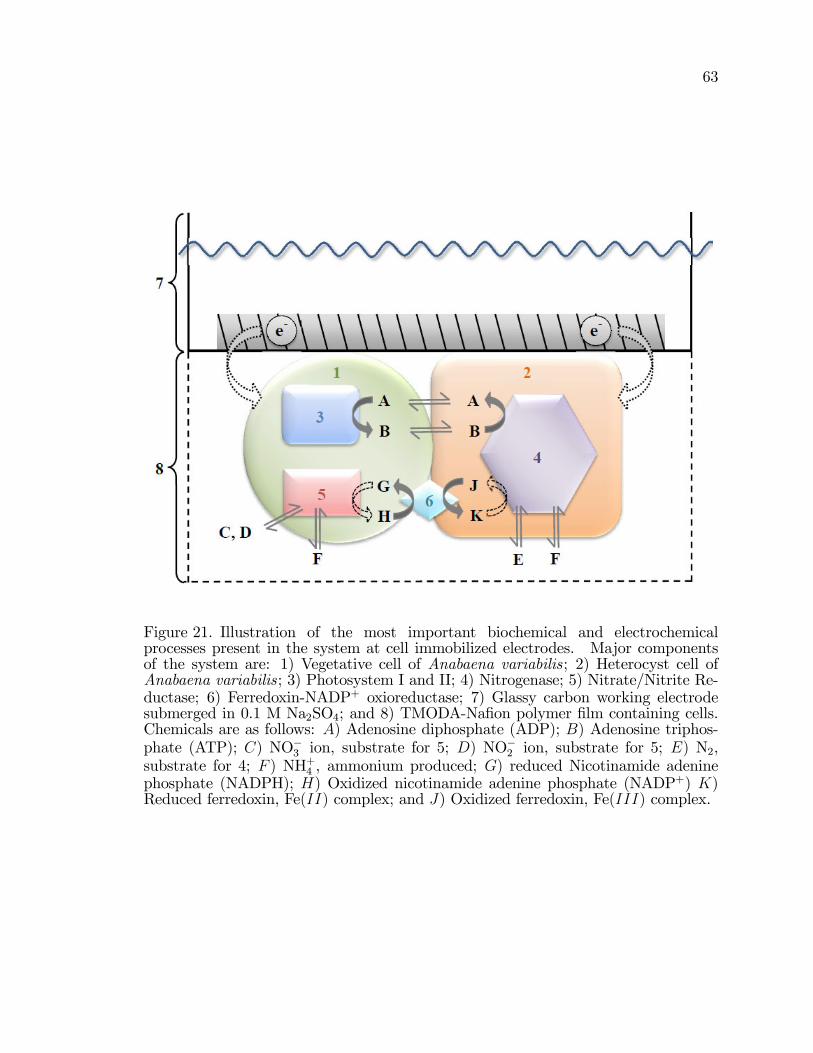
63
Figure 21. Illustration of the most important biochemical and electrochemicalprocesses present in the system at cell immobilized electrodes. Major componentsof the system are: 1) Vegetative cell of Anabaena variabilis; 2) Heterocyst cell ofAnabaena variabilis; 3) Photosystem I and II; 4) Nitrogenase; 5) Nitrate/Nitrite Re-ductase; 6) Ferredoxin-NADP+ oxioreductase; 7) Glassy carbon working electrodesubmerged in 0.1 M Na2SO4; and 8) TMODA-Na�on polymer �lm containing cells.Chemicals are as follows: A) Adenosine diphosphate (ADP); B) Adenosine triphos-phate (ATP); C) NO�3 ion, substrate for 5; D) NO
�2 ion, substrate for 5; E) N2,
substrate for 4; F ) NH+4 , ammonium produced; G) reduced Nicotinamide adeninephosphate (NADPH); H) Oxidized nicotinamide adenine phosphate (NADP+) K)Reduced ferredoxin, Fe(II) complex; and J) Oxidized ferredoxin, Fe(III) complex.
64
CHAPTER 3
AMMONIA GENERATION BY ELECTRODE IMMOBILIZED ANABAENA
VARIABILIS
3.1 Background
Ammonia is a chemical compound of signi�cant demand that is energetically
and environmentally taxing to synthesize. H2, most commonly obtained by thermal
processing of CH4, reacts with atmospheric N2 over a bed of catalysts and promoters
in reaction vessels held at high temperature and pressure to produce NH+4 . Similarly,
cyanobacteria contain enzymes that catalyze the reduction of N2; NO�2 , and NO�3 to
NH+4 but at ambient temperature and pressure. Two enzymes of signi�cant interest
are nitrogenase and nitrate/nitrite reductase. Anabaena variabilis, a common
photosynthetic cyanobacteria, produce some of the highest amounts of NH+4 of
prokaryotes. [11,53,63,64,78,92,93]
NH+4 production by cyanobacteria is highly regulated with multiple levels of
biochemical feedback. Su¢ cient concentrations of NH+4 in the external medium of
the cells represses nitrogenase synthesis, thus biologically, sustained production and
release of NH+4 by A. var. is not observed. Nitrogenase derepressed genetic mutants
of A. var, the SA-1 strain, release NH+4 externally. Despite the presence of NH+4
or other reduced forms of nitrogen like NO�2 and NO�3 ; the A. var. SA-1 mutant
continues to produce NH+4 by nitrogenase and nitrate/nitrite reductase enzymes.
[70,71,73,74]
65
Many of the biochemical reactions necessary to reduce nitrogen sources to
ammonia are electron transfer reactions. Electrical potential a¤ects charge
transfer reactions and the thermodynamics of physical and biological systems.
Immobilization of enzymes at an electrode surface increases biocatalytic capacity,
stabilized enzyme activities, and provides an environment where continuous
enzymatic turnover is highly likely [48, 49, 83]. Electroanalytical study of enzymes
in fuel cells [49,61,83,94], protein �lms on electrodes [50,85,95,96], and of biological
mediators [29, 50, 96�98] promote the approach to whole cell ammonia production
at ambient temperature and pressure. Thus, immobilization of A. var. within a
polymer at a glassy carbon surface presents an interesting system to study.
This interdisciplinary research describes a system that capitalizes on well
studied cyanobacterial enzyme pathways nitrogenase and nitrate/nitrite reductase.
These enzyme exhibit high rates of catalytic activity in vivo and are dependent
upon a network of redox reactions. Use of isolated pure enzymes signi�cantly
reduces the complexity of analysis required to decouple simultaneous biological
and electrochemical processes. While certain enzyme lifetimes have been extended
by entrapment in a polymer at an electrode surface [44�48, 99, 100], additional
considerations arise that complicates the use of isolated enzymes. If the enzyme
depends on ATP, as does nitrogenase for example, then an ATP/ADP recycling
system must be added to the system and regularly replenished. In the case of
phototrophic cyanobacteria, puri�ed and isolated enzymes do not have access
to cellular respiration products as the cellular components necessary to achieve
respiration are absent from enzyme isolates. Wastes and cellular byproducts must
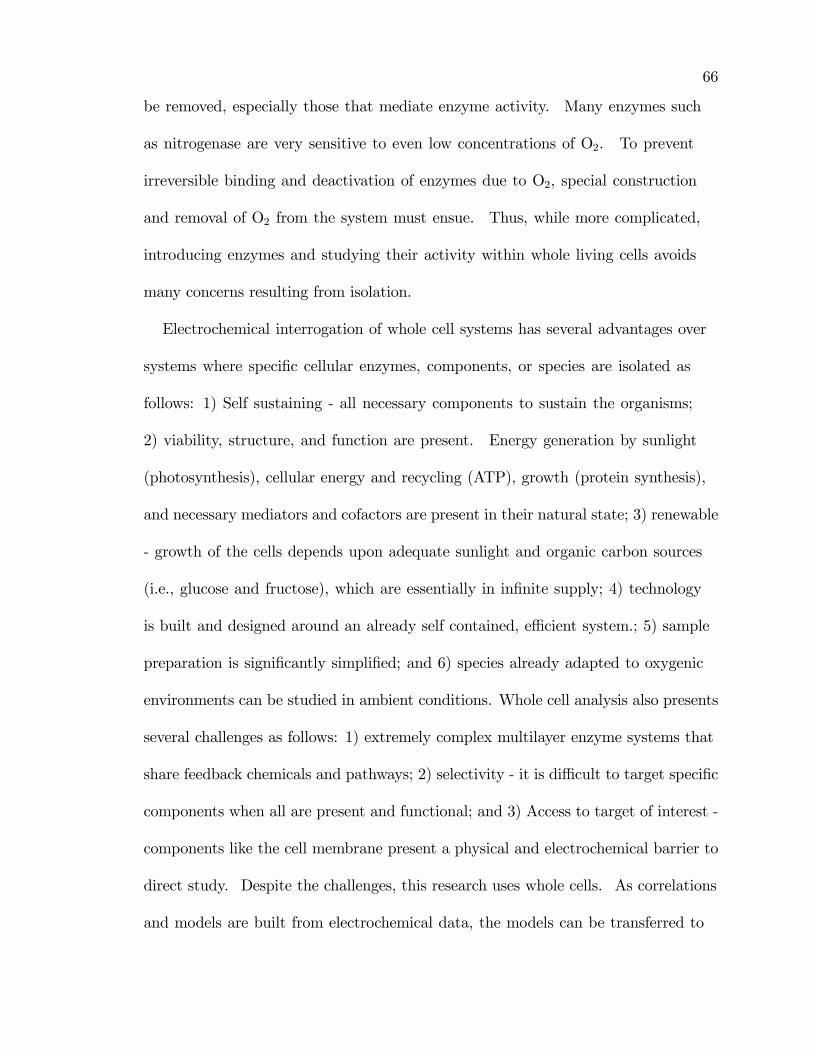
66
be removed, especially those that mediate enzyme activity. Many enzymes such
as nitrogenase are very sensitive to even low concentrations of O2. To prevent
irreversible binding and deactivation of enzymes due to O2, special construction
and removal of O2 from the system must ensue. Thus, while more complicated,
introducing enzymes and studying their activity within whole living cells avoids
many concerns resulting from isolation.
Electrochemical interrogation of whole cell systems has several advantages over
systems where speci�c cellular enzymes, components, or species are isolated as
follows: 1) Self sustaining - all necessary components to sustain the organisms;
2) viability, structure, and function are present. Energy generation by sunlight
(photosynthesis), cellular energy and recycling (ATP), growth (protein synthesis),
and necessary mediators and cofactors are present in their natural state; 3) renewable
- growth of the cells depends upon adequate sunlight and organic carbon sources
(i.e., glucose and fructose), which are essentially in in�nite supply; 4) technology
is built and designed around an already self contained, e¢ cient system.; 5) sample
preparation is signi�cantly simpli�ed; and 6) species already adapted to oxygenic
environments can be studied in ambient conditions. Whole cell analysis also presents
several challenges as follows: 1) extremely complex multilayer enzyme systems that
share feedback chemicals and pathways; 2) selectivity - it is di¢ cult to target speci�c
components when all are present and functional; and 3) Access to target of interest -
components like the cell membrane present a physical and electrochemical barrier to
direct study. Despite the challenges, this research uses whole cells. As correlations
and models are built from electrochemical data, the models can be transferred to
67
Table 2. Listing of chemical substratesand corresponding enzyme considered inthis research.
Substrate EnzymeN2 nitrogenaseNO�2 nitrate/nitrite reductaseNO�3 nitrate/nitrite reductaseO2 nitrogenase
Note: Whereas O2 is not a desirablesubstrate, it irreversibly binds to nitro-genase and is considered in this work.
other research and emerging technologies. Without the need to prepare, isolate,
separate, and alter an already functional system, the work here studies the intact
system in vivo. This supports exploitation of an already functional and e¢ cient
system that has not yet ever been synthetically reproduced. Enzymes and required
substrates for ammonia generation by Anabaena variabilis in this research are
summarized in Table 2.
3.2 Experimental
Unless noted otherwise, experimental setup shared the characteristics as
described in this section. In general, at least two of each electrode were analyzed
simultaneously in electrochemical experiments. Whenever available, data are
reported with statistics.
3.2.1 Cyclic Voltammetric Analysis of System
CV uses a three electrode system that includes a saturated calomel reference
electrode (SCE) and a glassy carbon electrode modi�ed with whole cells supported
68
in TMODA Na�on. The third electrode is a high surface area platinum counter
electrode. By varying CV scan rates, faradaic (electrolysis) currents are analyzed
and compiled to build a kinetic model of electron transfer within the system.
In all cases, controls are run with an unmodi�ed (bare) electrode, an electrode
modi�ed with only TMODA Na�on, and at least 4 cell modi�ed electrodes. This
simultaneous electrode measurements allows discrimination between matrix e¤ects
and cellular/enzyme activity. The six working electrodes are connected to a multi
channel potentiostat (CH Instruments 1030A) and share a common reference and
counter electrode.. The potentiostat controls the potential drop between the cell
immobilized working electrode and the reference electrode.
Working electrodes are coated with a modi�ed ion exchange polymer, TMODA
Na�on, that contains the cells. To modify the electrodes, octadecyltrimethylammo-
nium (TMODA) modi�ed Na�on (1100 EW) is mixed with cell/heterocysts (SA-1
strain) suspensions and cast onto glassy carbon electrodes (0:5 cm2) The resulting
�lms are approximately 10 �m thick and of fairly uniform dispersion. Once the sol-
vent used to deliver the TMODA Na�on suspension evaporates and the �lm is air
dried (about 15 minutes), the electrodes are immersed in 15 mL electrolyte solution.
The electrolyte used is 100 mM Na2SO4 to provide ionic conductivity. The elec-
trodes are evaluated by cyclic voltammetry (CV). Cyclic voltammetry is conducted
at the scan rates as follows (in order): 100, 75, 50, 25, 50, 75, 100 mV/s. This man-
ner of voltammetric perturbation exposes cells to about 10 minutes of voltammetric
perturbation. Following CV, the electrodes are removed and electrolyte analyzed
for produced ammonia.
69
3.2.2 Ammonia Quanti�cation Method
NH3 production from this bioelectrocatalytic device is following with an ammonia
ion selective electrode (Thermo Fisher). Dissolved NH3 is gaseous and passes
through the hydrophobic membrane of the ammonia ion selective electrode (ISE).
The pH change of the electrolyte solution on the other side of the membrane caused
by the di¤used gas is sensed by the inner body of the ammonia electrode which is a
pH electrode. The pH change is relative to the amount of dissolved NH3 present and
is measured with a pH capable of voltage readings. The lower limit of quantitation
with the ammonia ISE is 0.5 �M NH3. The response time to concentrations of
NH3 � 1 �M is signi�cantly higher as the pH change across the membranes requires
longer equilibration time. To ensure ammonia measured was above the lower limit of
quantitation, six working electrodes were analyzed in a single 15 mL vial of Na2SO4.
Following cyclic voltammetric analysis, the solution was collected for ammonia
analysis. To the 15 mL solution sample,1 % (v/v) 10 � 0:5 M NaOH (150 �L) is
added to raise the pH to near 14, thus converting all protonated NH+4 to gaseous
NH3 (pKa = 9.3). Under constant stirring, the ISE is place into the solution and
the vial is covered with Para�lm to minimize loss of gaseous NH3. The potential
is measured. A calibration of NH+4 standard resulted in a linear equation of
y = � (58:8� 1:1)x + (94:4� 1:6) with a correlational coe¢ cient of R2 = 0:99.
Ammonia concentrations in the sample were calculated from this calibration
equation.
70
3.2.3 Chlorophyll a Assay
By the method of Mackinney [80], chlorophyll a is extracted from the cells in
methanol whose absorbance is measured at 565 nm in a UV-Vis spectrometer (Ocean
Optics 4000). Absorbance at 750 nm can arise from the extraction of other pigments
like carotenoids and chlorophyll b; thus, the absorbance at 750 nm is subtracted from
the absorbance at 565 nm.. Brie�y, a 1.5 mL sample of cell suspension is placed into
a micro centrifuge tube and centrifuged at 4,400� for 5 minutes (Eppendorf 5260).
The media is decanted and replaced with 1.5 mL methanol (HPLC grade; Sigma).
Following a 5 minute mixing by vortexing, the methanol extracts chlorophyll a from
the cells in a dark container to minimize light oxidation of the pigment. Cells and
cellular debris are centrifuged from the methanol solution at 4,400x for 5 minutes.
The resultant chlorophyll a solution in methanol is placed into a 1 cm cuvette.
Chlorophyll a concentration is calculated from the Beer Lambert law, A = �bc for
� = 12:7 mL �g�1, b = 1 cm, and A = absorbance in arbitrary units. All absorbance
measurements reported have the background methanol absorbance subtracted. The
concentration of chlorophyll a is used to relate ammonia produced to cell density.
The relationship is an arbitrary comparison, but because chlorophyll a concentration
correlates to some K vegetative cell density, and nitrate/nitrite reductase is located
within vegetative cells, normalization of ammonia output to chlorophyll a density is
representative of ammonia output per unit enzyme. When statistics are reported,
they represent x� 1� for n = 4 samples of cell suspension.
71
3.2.4 Total Protein Assay
Total protein was assayed by the Bradford method [81, 82]. Commercially
available Coomassie Assay kit was purchased (Sigma). A calibration plot was
constructed against bovine serum albumin (BSA). The linear response range for
the calibration is 100-1500 �g/mL total protein. In 1.5 mL microcentrifuge tubes,
50 �L of sample containing protein is added to 1.5 mL of Coomassie Plus Reagent
and thoroughly mixed by vortexing for 2 minutes. The tube is incubated at room
temperature for 10 minutes for more consistent results. The UV-Vis spectrum of
the blank (BG-110 media) was obtained and stored for subtraction. Absorbance
was measured, in quadruplicate, for nine BSA standards. The BSA standard
were prepared from commercially obtained BSA (2 mg/mL). Figure 9 is the
representative calibration curve for the BSA standards. Vertical error bars represent
� 1� from the mean of 4 samples. Total protein measurements from suspensions of
A. var. were measured in the same manner and compared to the BSA calibration.
Total protein quanti�es protein contribution from both vegetative and heterocyst
cells. Nitrate/nitrate reductase is found within vegetative cells while nitrogenase is
located in heterocysts. Thus, the total protein normalization factor is useful when
the ammonia output is from both nitrogenase and nitrate/nitrite reductase.
3.3 Results
For every CV experiment, six electrodes are prepared for the electrochemical
cells. 100 mM Na2SO4 is the electrolyte and provides su¢ cient ionic conductivity.
72
By varying cyclic voltammetric scan rates, faradaic (electrolysis) currents can be
analyzed within established kinetic models. In all cases, controls are run. For
statistical redundancy, at least two of each type electrode are run simultaneously:
two unmodi�ed glassy carbon electrodes, two GC electrodes with only TMODA
Na�on �lms, and two electrodes with TMODA Na�on:cells (whole cells or cell wall
ruptured cells). This allows discrimination between matrix e¤ects and enzyme
activity.
In cyclic voltammetry, electron �ux to the electrode surface is measured as
current. Redox active species in solution di¤use to the electrode surface, undergo
electron transfer, and di¤use away. If the electron transfer is reversible and chemical
reactions are not apparent, what is oxidized on the forward sweep is reduced on the
reverse sweep, typically at a separation of 60 mV/n electrons transferred. The �ux
of electrons during these electrolysis steps are limited by di¤usion, concentration,
and kinetics. Thus, a current signal may appear as a distinct peak or a sigmoidal
wave. The working potential range for Anabaena variabilis immobilized to glassy
carbon is between 0.9 V and 0.5 V vs SCE. This potential range is adequate to
study nitrogenase, nitrate/nitrite reductase, and the mediating chemical reactions
corresponding to the enzyme process as their reported redox potentials fall within
this range vs. SCE [35,37,56,96,98,101�104]. Solvent electrolysis arises at potentials
greater than 0.9 V and O2 reduction currents arise at potentials more negative than
0.5 V. Increasing current at either limit interfere with measurement of intended
faradaic processes. Whether CV initiated with an oxidative or reductive sweep
�rst had no signi�cant e¤ect in the observed current responses. Data are more
73
reproducible when CVs are initiated at 0.8 V and scanned reductively to 0.5 V, then
cycled back to +1.1 V.
Data will be presented and discussed from the most prominent studies conducted
in this research. When appropriate, data are statistically vetted. Modi�cation of
electrodes with polymer �lms carries an inherent error in thickness, distribution, and
�ux characteristics due to variability in temperature, humidity, and heterogeneity of
casting suspensions. Depending on the extent of potential window electrolysis, the
current scale in reported CV data has been adjusted accordingly.
3.3.1 Initial Voltammetric Response and AmmoniaOutput
The presence of whole Anabaena variabilis near the electrode surface provides
a unique electrochemical response when studied with CV (Figure 22). In these
experiments, faradaic current peaks/plateaus arise only when cells are immobilized
to an electrode. Faradaic current waves arise at 0.65 V (oxidation) and 0.3 V
(reduction) for the electrode where cells are present. A 1:1 (v/v) cell suspension :
TMODA Na�on suspension was used to cast an approximately 10 �m thick �lm on
the electrode. The faradaic waves are of higher current than both the responses
at bare and TMODA Na�on electrodes. The current signals that appear in Figure
22 are not indicative of a reversible electrolysis of a single species. Data suggest
at least two distinct electron transfer reactions occur under cycled voltammetric
perturbation. The waves are separated by approximately 300 mV. At more positive
potentials, electrolysis of H2O begins to overlap with the oxidative current signal as
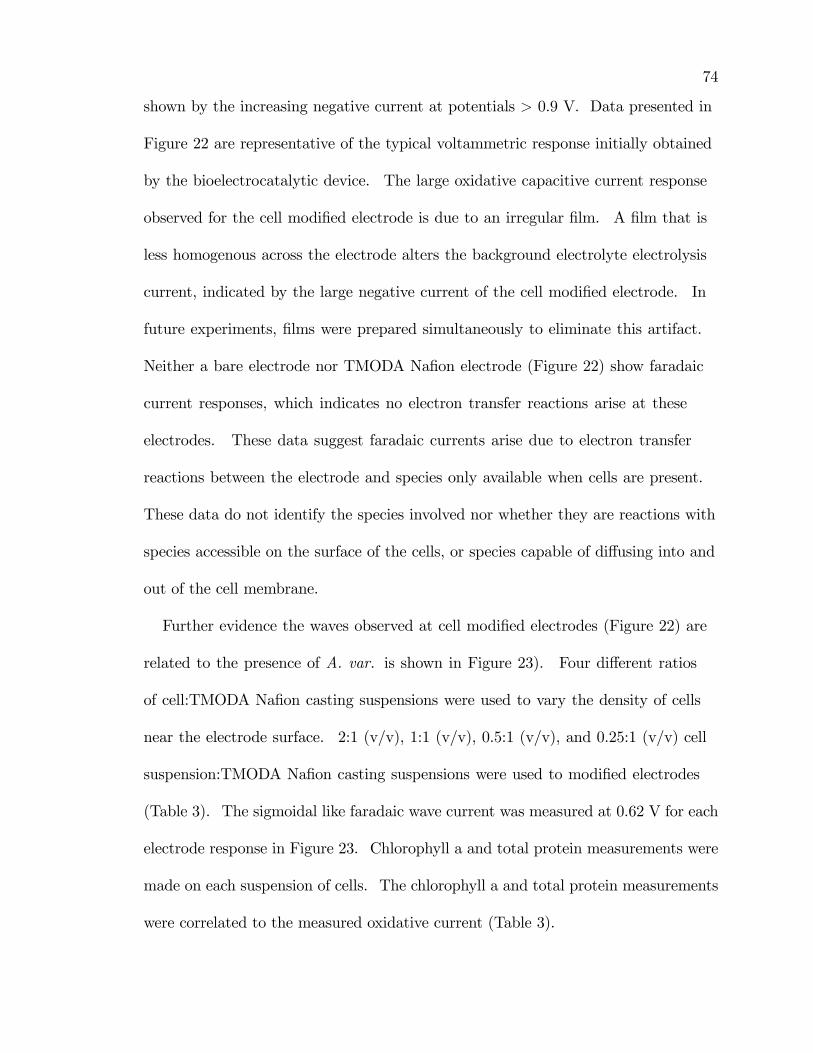
74
shown by the increasing negative current at potentials > 0.9 V. Data presented in
Figure 22 are representative of the typical voltammetric response initially obtained
by the bioelectrocatalytic device. The large oxidative capacitive current response
observed for the cell modi�ed electrode is due to an irregular �lm. A �lm that is
less homogenous across the electrode alters the background electrolyte electrolysis
current, indicated by the large negative current of the cell modi�ed electrode. In
future experiments, �lms were prepared simultaneously to eliminate this artifact.
Neither a bare electrode nor TMODA Na�on electrode (Figure 22) show faradaic
current responses, which indicates no electron transfer reactions arise at these
electrodes. These data suggest faradaic currents arise due to electron transfer
reactions between the electrode and species only available when cells are present.
These data do not identify the species involved nor whether they are reactions with
species accessible on the surface of the cells, or species capable of di¤using into and
out of the cell membrane.
Further evidence the waves observed at cell modi�ed electrodes (Figure 22) are
related to the presence of A. var. is shown in Figure 23). Four di¤erent ratios
of cell:TMODA Na�on casting suspensions were used to vary the density of cells
near the electrode surface. 2:1 (v/v), 1:1 (v/v), 0.5:1 (v/v), and 0.25:1 (v/v) cell
suspension:TMODA Na�on casting suspensions were used to modi�ed electrodes
(Table 3). The sigmoidal like faradaic wave current was measured at 0.62 V for each
electrode response in Figure 23. Chlorophyll a and total protein measurements were
made on each suspension of cells. The chlorophyll a and total protein measurements
were correlated to the measured oxidative current (Table 3).
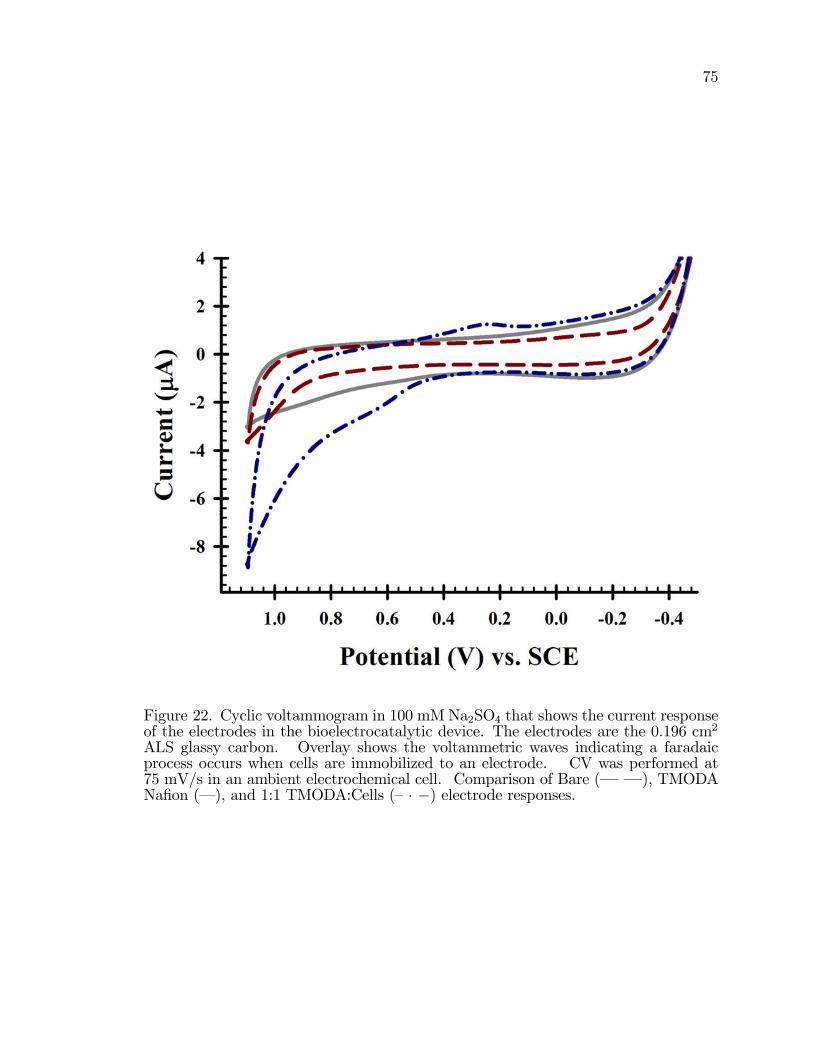
75
Figure 22. Cyclic voltammogram in 100 mM Na2SO4 that shows the current responseof the electrodes in the bioelectrocatalytic device. The electrodes are the 0.196 cm2
ALS glassy carbon. Overlay shows the voltammetric waves indicating a faradaicprocess occurs when cells are immobilized to an electrode. CV was performed at75 mV/s in an ambient electrochemical cell. Comparison of Bare (� � ), TMODANa�on (� ), and 1:1 TMODA:Cells (�� �) electrode responses.
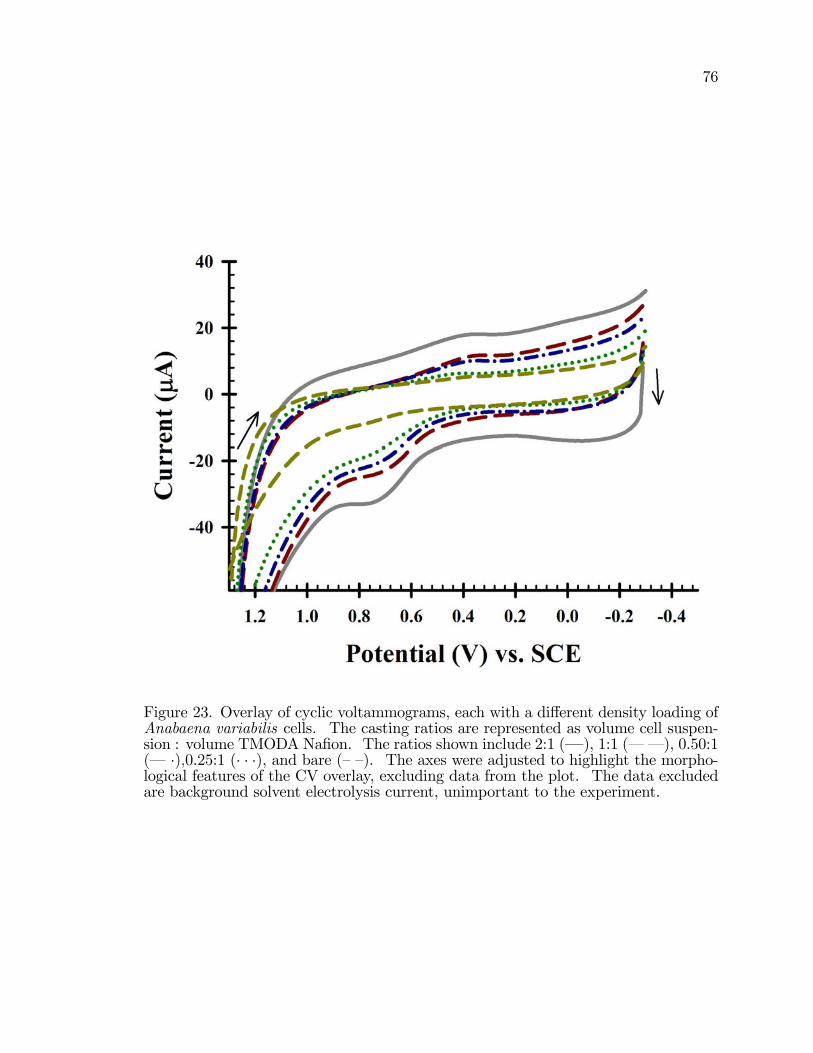
76
Figure 23. Overlay of cyclic voltammograms, each with a di¤erent density loading ofAnabaena variabilis cells. The casting ratios are represented as volume cell suspen-sion : volume TMODA Na�on. The ratios shown include 2:1 (� ), 1:1 (� � ), 0.50:1(� �);0.25:1 (� � �), and bare (��). The axes were adjusted to highlight the morpho-logical features of the CV overlay, excluding data from the plot. The data excludedare background solvent electrolysis current, unimportant to the experiment.
77
Table 3. Total protein, Chlorophyll a density, and reverse wave current mea-surements in di¤erent Anabaena variabilis SA-1 cell suspension:TMODANa�on suspension (v/v) ratios.
Cell : TMODA Total Protein [Chl a] Wave CurrentCasting Ratio (v/v) (�g=mL) (�g=mL) (�A)
0.25:1 141:9� 15:1 0:97� 0:1 11:2� 0:90.5:1 426:5� 20:1 1:94� 0:11 13:3� 1:11:1 621:3� 14:8 3:88� 0:16 15:4� 0:72:1 827:5� 17:4 7:76� 0:20 19:6� 0:6
Note: Total protein was measured with the Bradford method against a BSAcalibration and the error reported is from that calibration. Chlorophyll aabsorbance was measured from methanolic extracts [80] and is reported asx � 1� for n = 5 extraction assays. Wave currents reported as x � 1� forn = 4 electrodes and two 100 mV/s cyclic voltammograms.
Total casting solution volume was 10 �L. These data suggest a direct correlation
between electrochemical signal and cell density. There exists a linear agreement
between wave current and chlorophyll a content (y = 1:2x + 10:6; R2 = 0:99) and
total protein (y = 0:1x + 8:9; R2 = 0:94). The y intercept is expected to be zero
for both correlations, however they both result in a similar value between 8 and 10
�g/mL.
This semi quantitative analysis resulted from initial observations of the
electrochemical behavior of the system. Attempts to quantify ammonia production
were not successful due to the poor lower limit of detection of the ISE available
during the time of these experiments. These initial observations about the behavior
of A. var. immobilized to an electrode reveal a correlation between faradaic current
response and the density of cells present on the electrode
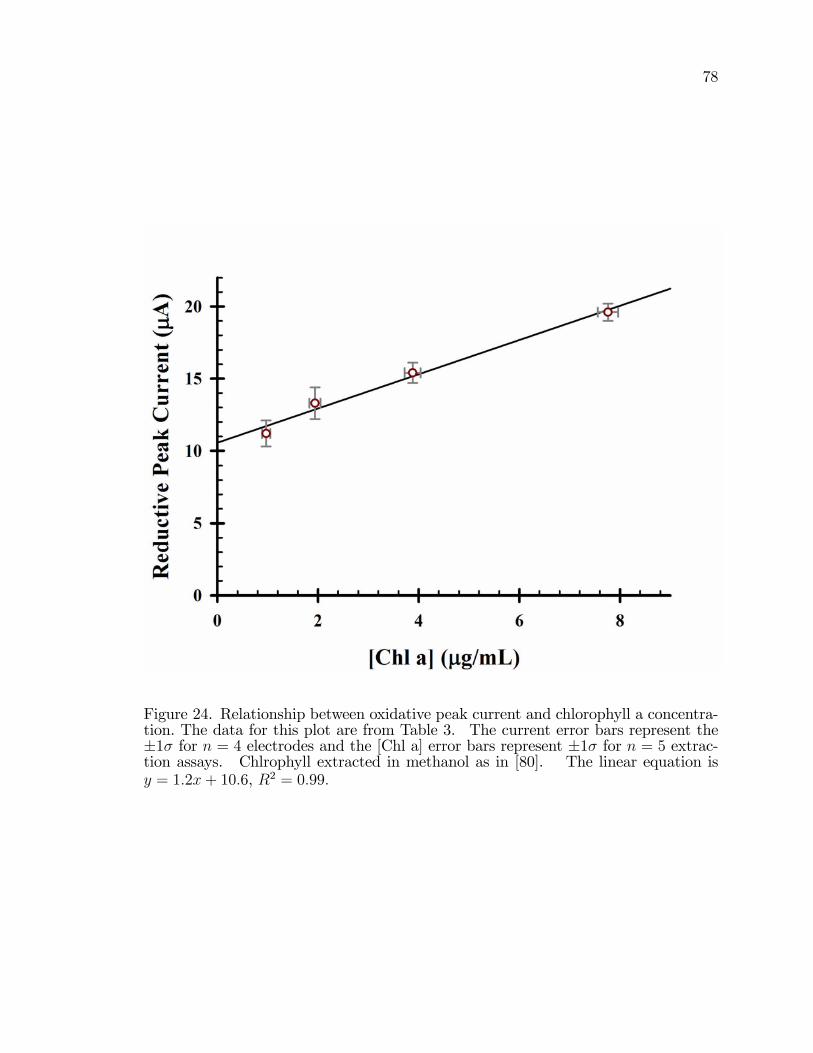
78
Figure 24. Relationship between oxidative peak current and chlorophyll a concentra-tion. The data for this plot are from Table 3. The current error bars represent the�1� for n = 4 electrodes and the [Chl a] error bars represent �1� for n = 5 extrac-tion assays. Chlrophyll extracted in methanol as in [80]. The linear equation isy = 1:2x+ 10:6, R2 = 0:99:
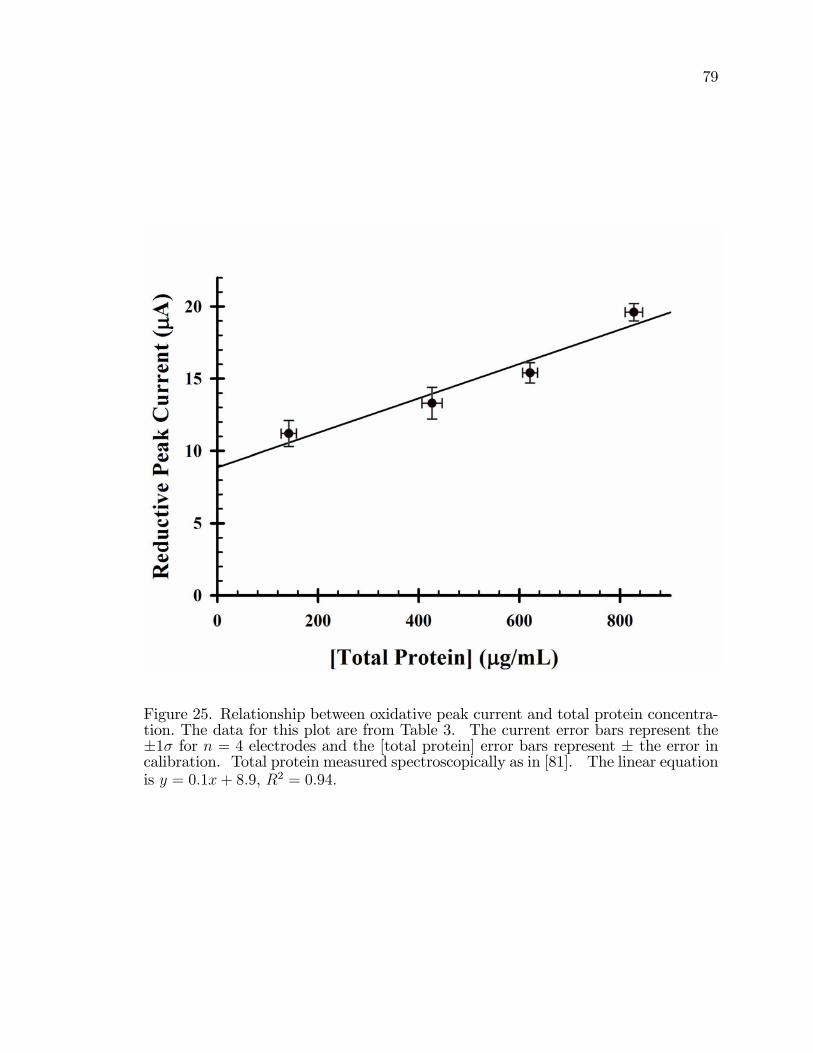
79
Figure 25. Relationship between oxidative peak current and total protein concentra-tion. The data for this plot are from Table 3. The current error bars represent the�1� for n = 4 electrodes and the [total protein] error bars represent � the error incalibration. Total protein measured spectroscopically as in [81]. The linear equationis y = 0:1x+ 8:9, R2 = 0:94:
80
3.3.2 Cofactor, Chemical, and Substrate E¤ects
Although the faradaic currents observed from the CV analysis are consistent
with a direct proportionality with A. var. density, they do not describe the speci�c
chemical reactions. NH+4 is not electroactive in the potential limits used in this
research. Catalytic reduction or oxidation shifts observed electrochemical potentials.
Several chemical species were introduced to the background electrolyte and their
e¤ects on voltammetry observed. Either directly or indirectly, NH+4 (as NH4OH
or NH4Cl), nicotinamide adenine dinucleotide phosphate (NADPH/NADP+),
ferredoxins, and adenosine triphosphate (ATP) are each involved in the enzymatic
production of ammonia from A. var (Figure 1). Addition of these species to the
background electrolyte followed by voltammetric analysis provides data to delineate
the chemical basis for faradaic response generated between cells and the electrode.
3.3.2.1 Ammonia
Ammonia is the desired product in this system. The simplest case would be
direct electrochemical assessment of ammonia production. NH4OH was added to the
background electrolyte for two reasons: 1) as a standard addition to probe whether
or not the faradaic currents observed in Figures 22 and 23 are representative of an
ammonia electron transfer reaction and 2) as a means to repress nitrogenase and
nitrate/nitrite reductase synthesis when the concentration of NH+4 in the external
media is su¢ ciently high Repression is the blocking of gene expression. This
repression has been shown to be rapid and not nif gene dependent for short periods
81
of NH+4 abundance [64, 76, 79, 92]. Current enhancement and peak potential shifts
of peaks as a direct result of ammonia addition would suggest electron transfer
reactions arise due to reactions between the electrode and either the cell or enzyme
contained within the cell.
Initial control cyclic voltammograms were obtained in the common background
electrolyte (0.1 M Na2SO4) at several scan rates. These cyclic voltammograms
were compared to those run in background electrolyte with the addition of NH4OH
to 1 mM. The small addition of NH4OH alters the pH of the test solution by
approximately 3 pH units (test solution pH � 7, pH of 1 mM NH4OH � 10), which
then shifts potential axis by 0.059 V/�pH= 0:02 V: Thus, aside from a small shift
of the potential axis, di¤erences between voltammograms from control and NH+4
additions are noted.
From an overlay of voltammograms from the controls in Figure 26, a forward
oxidative wave at 0.65 V and a reverse reductive wave at 0.3 V was observed but
only when cells are present. This is as was observed in Figure 22. These faradaic
waves are discernible above bare and TMODA Na�on electrode responses.
After the addition of NH4OH to 1 mM, the electrodes equilibrated in solution
for 5 minutes prior to voltammetric analysis. An overlay of the voltammograms
resulting from the ammonia containing electrolyte does not show faradaic current
responses for any electrode (Figure 27). These data suggest NH4OH suppressed the
waves observed at the 1:1 TMODA:Cells electrode. The notable di¤erences between
data in Figures 26 and 27 are that NH4OH addition elicited higher background
charging and solvent electrolysis as shown by the higher oxidative currents > 1 V,
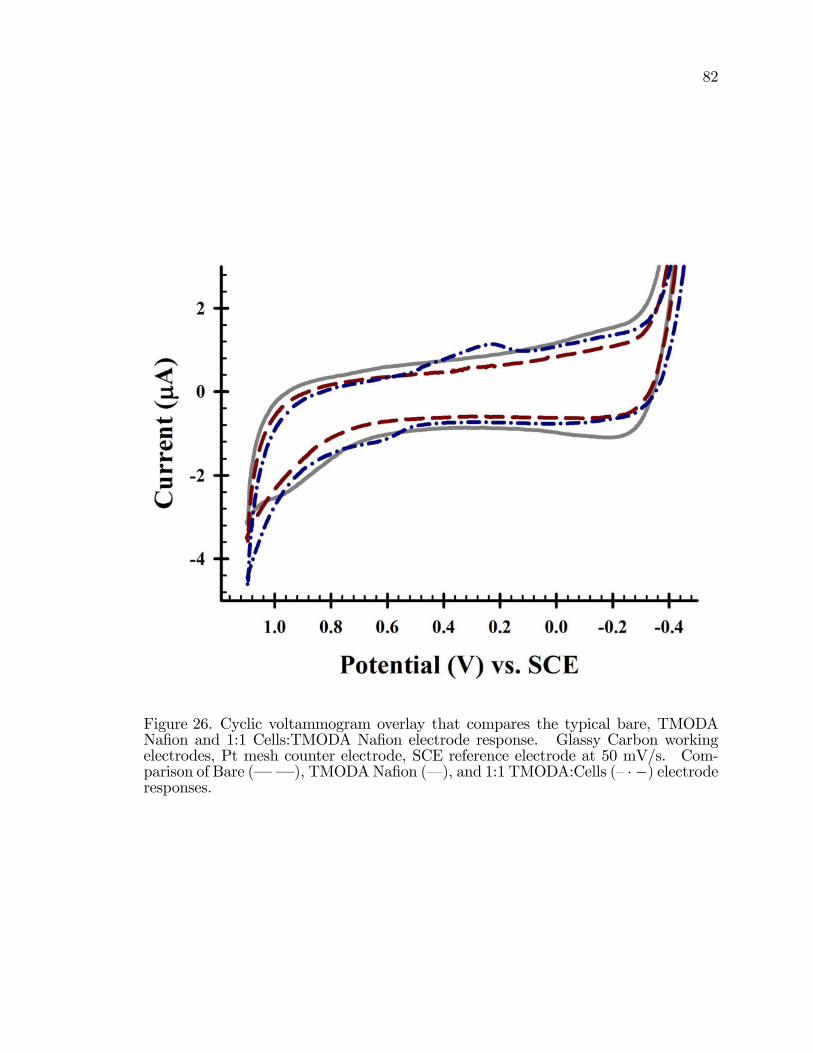
82
Figure 26. Cyclic voltammogram overlay that compares the typical bare, TMODANa�on and 1:1 Cells:TMODA Na�on electrode response. Glassy Carbon workingelectrodes, Pt mesh counter electrode, SCE reference electrode at 50 mV/s. Com-parison of Bare (� � ), TMODANa�on (� ), and 1:1 TMODA:Cells (�� �) electroderesponses.
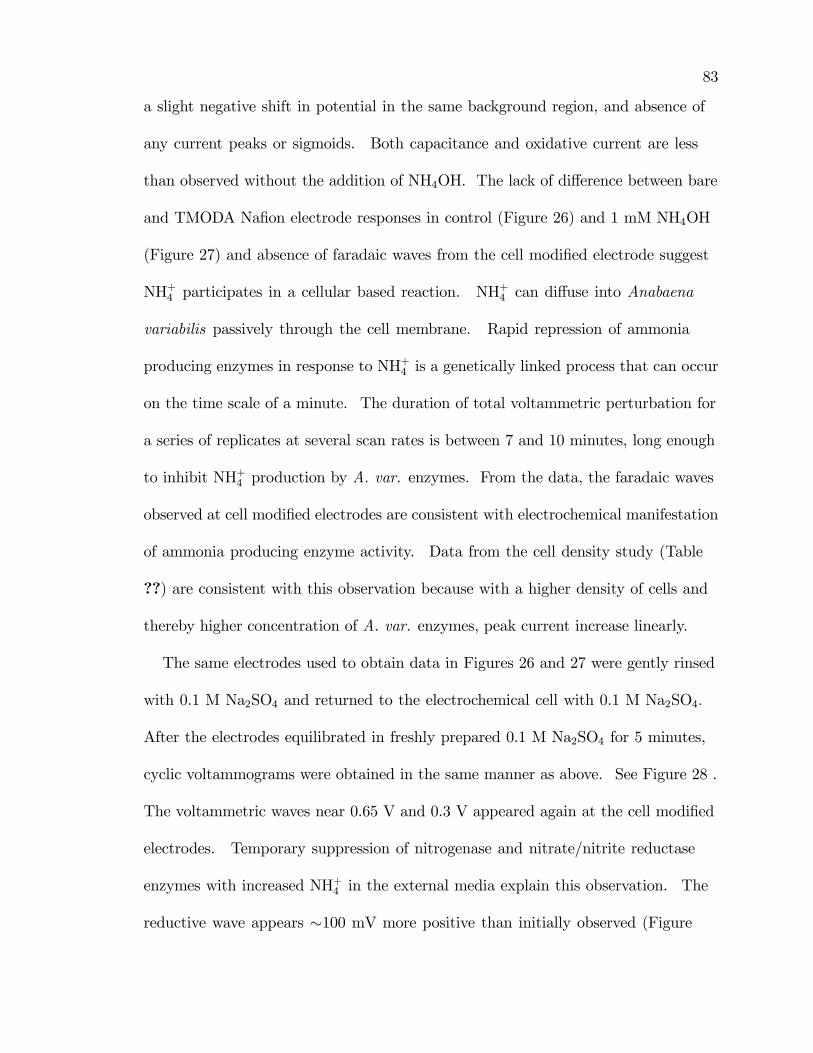
83
a slight negative shift in potential in the same background region, and absence of
any current peaks or sigmoids. Both capacitance and oxidative current are less
than observed without the addition of NH4OH. The lack of di¤erence between bare
and TMODA Na�on electrode responses in control (Figure 26) and 1 mM NH4OH
(Figure 27) and absence of faradaic waves from the cell modi�ed electrode suggest
NH+4 participates in a cellular based reaction. NH+4 can di¤use into Anabaena
variabilis passively through the cell membrane. Rapid repression of ammonia
producing enzymes in response to NH+4 is a genetically linked process that can occur
on the time scale of a minute. The duration of total voltammetric perturbation for
a series of replicates at several scan rates is between 7 and 10 minutes, long enough
to inhibit NH+4 production by A. var. enzymes. From the data, the faradaic waves
observed at cell modi�ed electrodes are consistent with electrochemical manifestation
of ammonia producing enzyme activity. Data from the cell density study (Table
??) are consistent with this observation because with a higher density of cells and
thereby higher concentration of A. var. enzymes, peak current increase linearly.
The same electrodes used to obtain data in Figures 26 and 27 were gently rinsed
with 0.1 M Na2SO4 and returned to the electrochemical cell with 0.1 M Na2SO4:
After the electrodes equilibrated in freshly prepared 0.1 M Na2SO4 for 5 minutes,
cyclic voltammograms were obtained in the same manner as above. See Figure 28 .
The voltammetric waves near 0.65 V and 0.3 V appeared again at the cell modi�ed
electrodes. Temporary suppression of nitrogenase and nitrate/nitrite reductase
enzymes with increased NH+4 in the external media explain this observation. The
reductive wave appears �100 mV more positive than initially observed (Figure
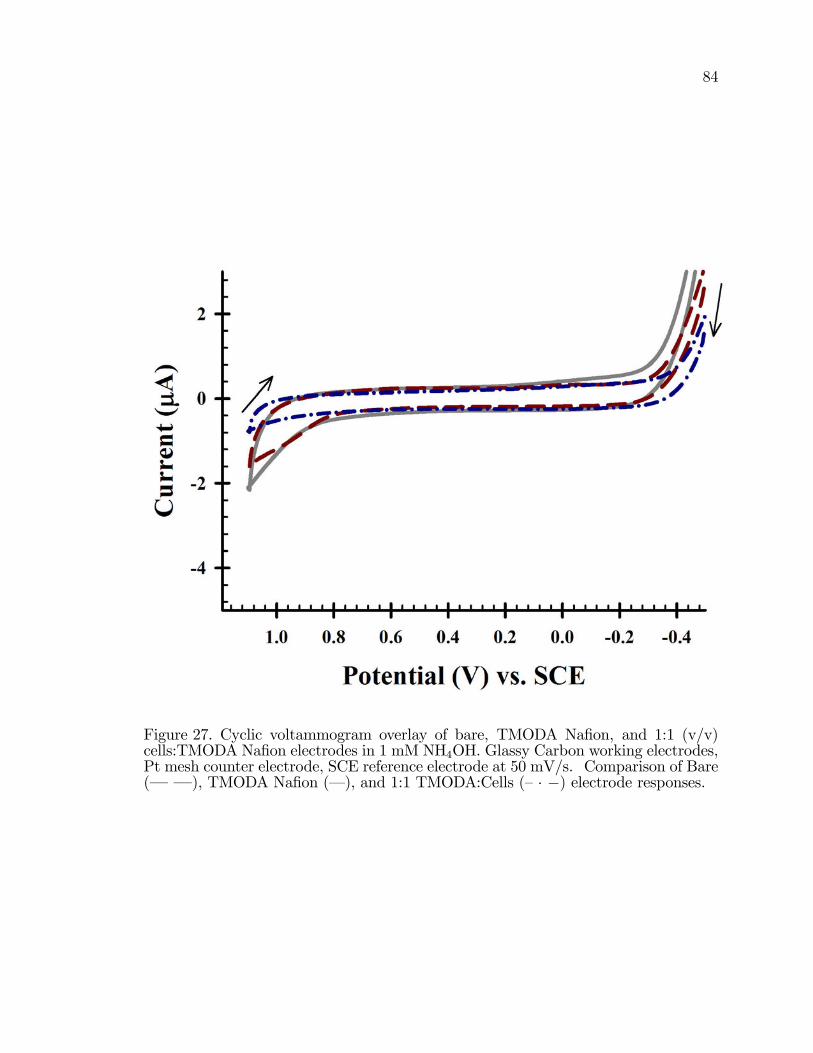
84
Figure 27. Cyclic voltammogram overlay of bare, TMODA Na�on, and 1:1 (v/v)cells:TMODA Na�on electrodes in 1 mM NH4OH. Glassy Carbon working electrodes,Pt mesh counter electrode, SCE reference electrode at 50 mV/s. Comparison of Bare(� � ), TMODA Na�on (� ), and 1:1 TMODA:Cells (�� �) electrode responses.
85
26), but the oxidative wave remains at 0.6 V. The shift in the reductive wave as
the oxidative wave potential does not change is consistent with the reduction and
oxidation waves associated with distinct rather than a common chemical reaction.
The TMODA Na�on electrode departs from background current near 0.65 V that
was not observed previously. The reason for this is not known. Sensitization
of channels to NH+4 on the time scale of these experiments likely manifests itself
voltammetrically
3.3.2.2 Nicotinamide Adenine Dinucleotide Phosphate
The ubiquitous nature of nicotinamide adenine dinucleotide phosphate
(NADPH/NADP+) in cyanobacteria can not be ignored. NADPH is the most
important electron shuttle in cyanobacteria [43,102]. The NADP+/NADPH couple
shares a close redox recycling relationship with ferredoxins. This includes ferredoxins
bound to enzyme protein residues and as a freely mobile molecule. In vivo, NADPH
is directly involved in photosystem I and II and nitrate/nitrite reductase in the
conversion of NO�2 to NH3 and indirectly involved in nitrogenase through ATP to
ADP recycling (See Figure 1).
The pH dependent redox reaction of the NADP/NADPH system is
NADP+ +H+ + 2e NADPH E�0
pH=7 = �0:565 V vs. SCE (22)
Much has been reported on the electrochemical recycling of NADP+, yet the direct
electrolysis of the NADP+/NADPH couple at a bare electrode [30] is not reported.
Synthetic recycling of NADP+ at an electrodes requires enzyme and mediators [30].
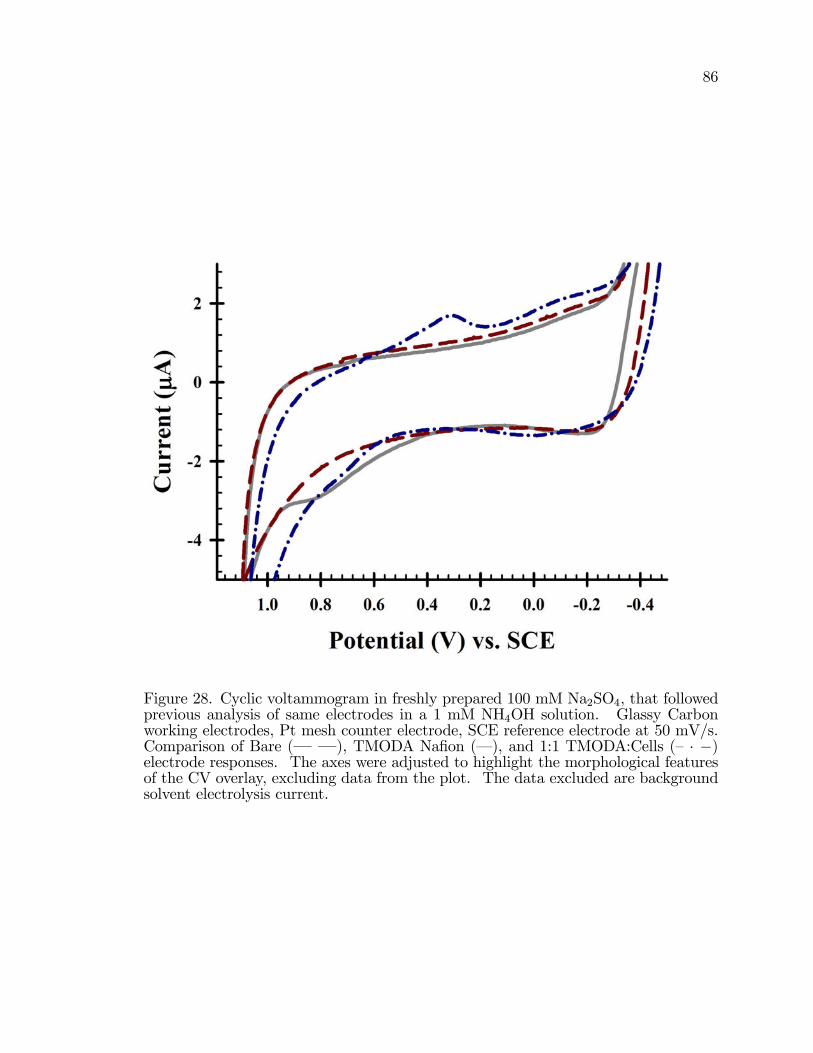
86
Figure 28. Cyclic voltammogram in freshly prepared 100 mM Na2SO4, that followedprevious analysis of same electrodes in a 1 mM NH4OH solution. Glassy Carbonworking electrodes, Pt mesh counter electrode, SCE reference electrode at 50 mV/s.Comparison of Bare (� � ), TMODA Na�on (� ), and 1:1 TMODA:Cells (� � �)electrode responses. The axes were adjusted to highlight the morphological featuresof the CV overlay, excluding data from the plot. The data excluded are backgroundsolvent electrolysis current.
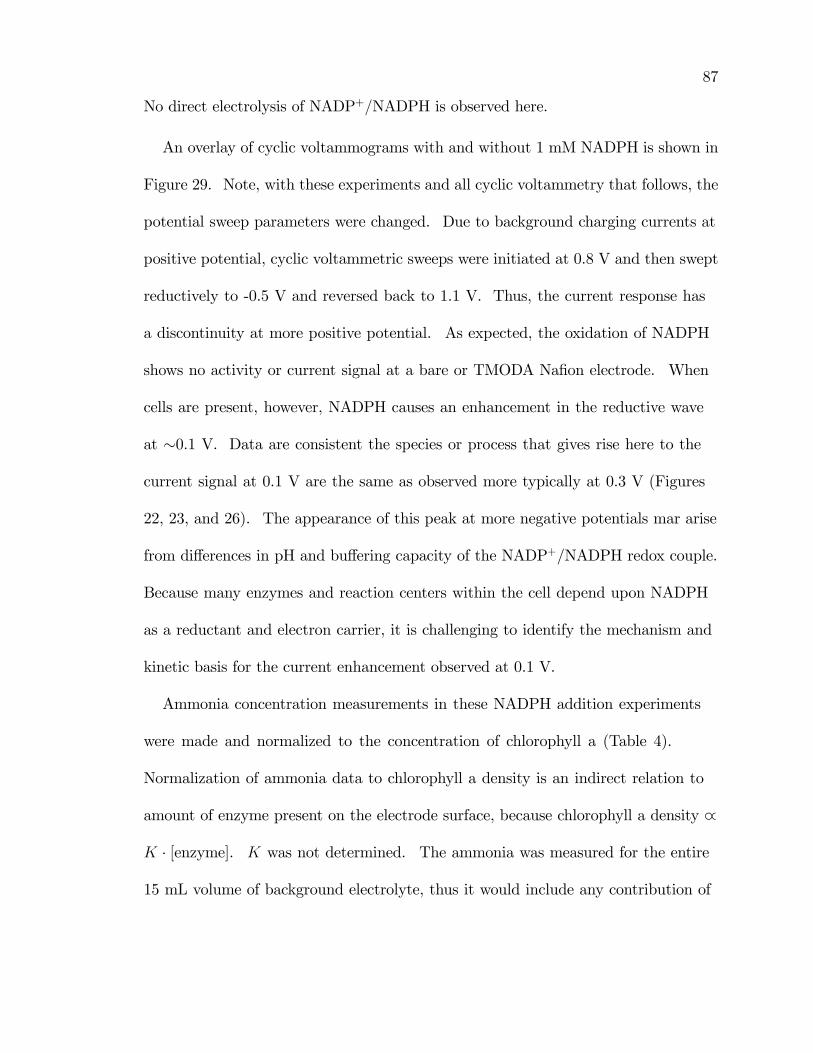
87
No direct electrolysis of NADP+=NADPH is observed here.
An overlay of cyclic voltammograms with and without 1 mM NADPH is shown in
Figure 29. Note, with these experiments and all cyclic voltammetry that follows, the
potential sweep parameters were changed. Due to background charging currents at
positive potential, cyclic voltammetric sweeps were initiated at 0.8 V and then swept
reductively to -0.5 V and reversed back to 1.1 V. Thus, the current response has
a discontinuity at more positive potential. As expected, the oxidation of NADPH
shows no activity or current signal at a bare or TMODA Na�on electrode. When
cells are present, however, NADPH causes an enhancement in the reductive wave
at �0.1 V. Data are consistent the species or process that gives rise here to the
current signal at 0.1 V are the same as observed more typically at 0.3 V (Figures
22, 23, and 26). The appearance of this peak at more negative potentials mar arise
from di¤erences in pH and bu¤ering capacity of the NADP+/NADPH redox couple.
Because many enzymes and reaction centers within the cell depend upon NADPH
as a reductant and electron carrier, it is challenging to identify the mechanism and
kinetic basis for the current enhancement observed at 0.1 V.
Ammonia concentration measurements in these NADPH addition experiments
were made and normalized to the concentration of chlorophyll a (Table 4).
Normalization of ammonia data to chlorophyll a density is an indirect relation to
amount of enzyme present on the electrode surface, because chlorophyll a density _
K � [enzyme]. K was not determined. The ammonia was measured for the entire
15 mL volume of background electrolyte, thus it would include any contribution of
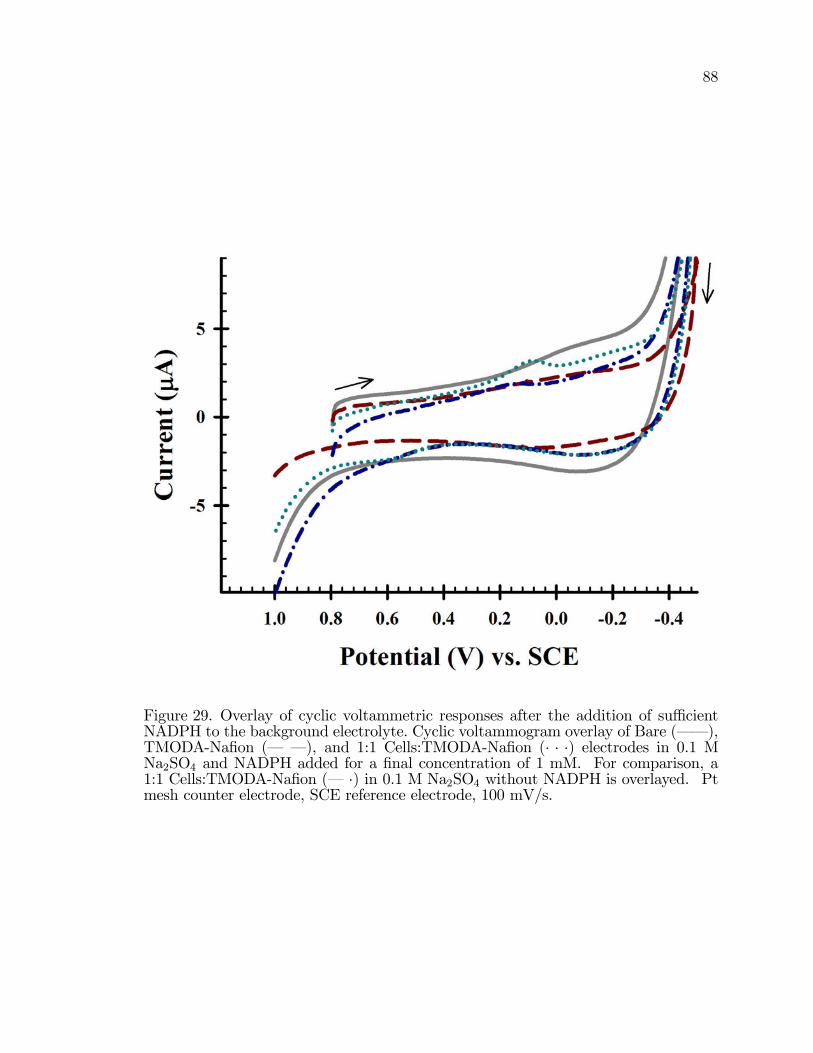
88
Figure 29. Overlay of cyclic voltammetric responses after the addition of su¢ cientNADPH to the background electrolyte. Cyclic voltammogram overlay of Bare (� � ),TMODA-Na�on (� � ), and 1:1 Cells:TMODA-Na�on (� � �) electrodes in 0.1 MNa2SO4 and NADPH added for a �nal concentration of 1 mM. For comparison, a1:1 Cells:TMODA-Na�on (� �) in 0.1 M Na2SO4 without NADPH is overlayed. Ptmesh counter electrode, SCE reference electrode, 100 mV/s.
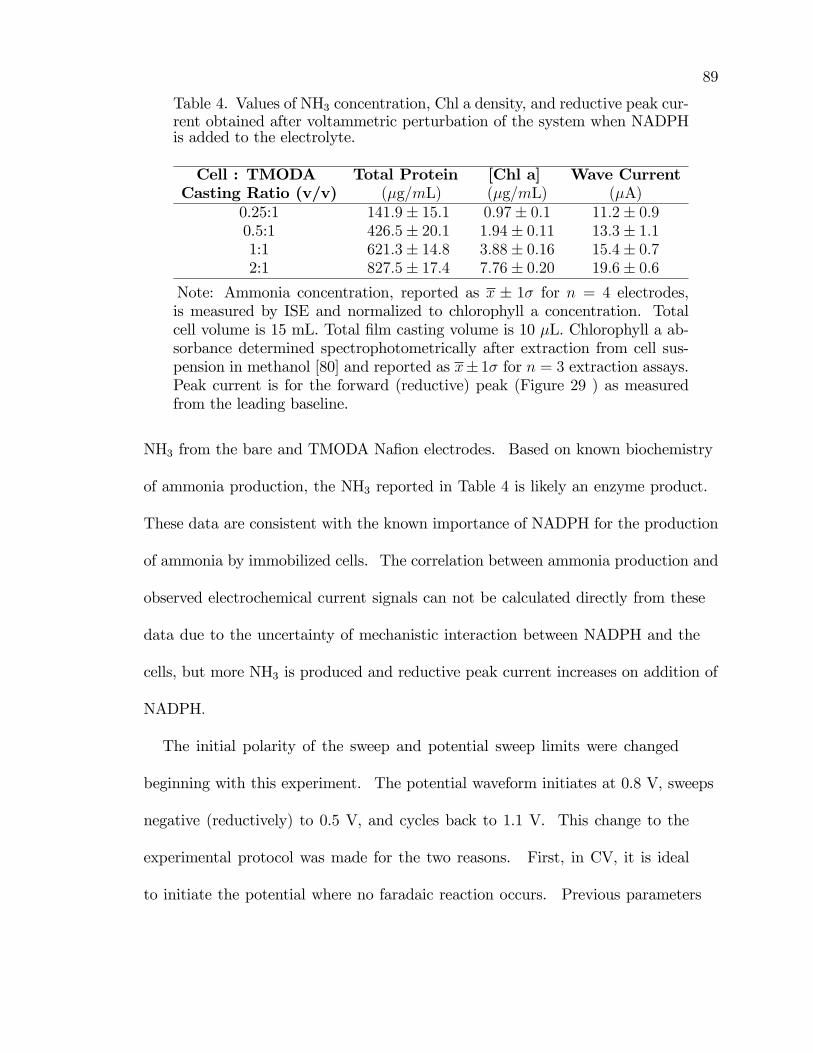
89
Table 4. Values of NH3 concentration, Chl a density, and reductive peak cur-rent obtained after voltammetric perturbation of the system when NADPHis added to the electrolyte.
Cell : TMODA Total Protein [Chl a] Wave CurrentCasting Ratio (v/v) (�g=mL) (�g=mL) (�A)
0.25:1 141:9� 15:1 0:97� 0:1 11:2� 0:90.5:1 426:5� 20:1 1:94� 0:11 13:3� 1:11:1 621:3� 14:8 3:88� 0:16 15:4� 0:72:1 827:5� 17:4 7:76� 0:20 19:6� 0:6
Note: Ammonia concentration, reported as x � 1� for n = 4 electrodes,is measured by ISE and normalized to chlorophyll a concentration. Totalcell volume is 15 mL. Total �lm casting volume is 10 �L. Chlorophyll a ab-sorbance determined spectrophotometrically after extraction from cell sus-pension in methanol [80] and reported as x� 1� for n = 3 extraction assays.Peak current is for the forward (reductive) peak (Figure 29 ) as measuredfrom the leading baseline.
NH3 from the bare and TMODA Na�on electrodes. Based on known biochemistry
of ammonia production, the NH3 reported in Table 4 is likely an enzyme product.
These data are consistent with the known importance of NADPH for the production
of ammonia by immobilized cells. The correlation between ammonia production and
observed electrochemical current signals can not be calculated directly from these
data due to the uncertainty of mechanistic interaction between NADPH and the
cells, but more NH3 is produced and reductive peak current increases on addition of
NADPH:
The initial polarity of the sweep and potential sweep limits were changed
beginning with this experiment. The potential waveform initiates at 0.8 V, sweeps
negative (reductively) to 0.5 V, and cycles back to 1.1 V. This change to the
experimental protocol was made for the two reasons. First, in CV, it is ideal
to initiate the potential where no faradaic reaction occurs. Previous parameters
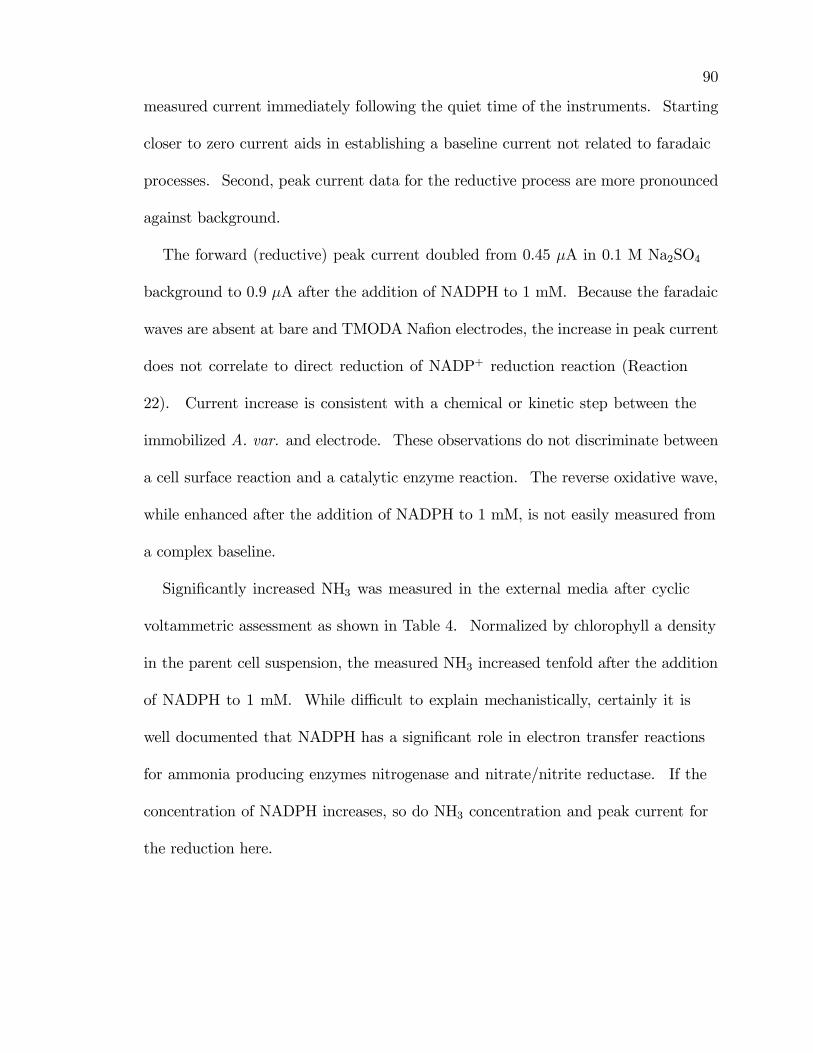
90
measured current immediately following the quiet time of the instruments. Starting
closer to zero current aids in establishing a baseline current not related to faradaic
processes. Second, peak current data for the reductive process are more pronounced
against background.
The forward (reductive) peak current doubled from 0.45 �A in 0.1 M Na2SO4
background to 0.9 �A after the addition of NADPH to 1 mM. Because the faradaic
waves are absent at bare and TMODA Na�on electrodes, the increase in peak current
does not correlate to direct reduction of NADP+ reduction reaction (Reaction
22). Current increase is consistent with a chemical or kinetic step between the
immobilized A. var. and electrode. These observations do not discriminate between
a cell surface reaction and a catalytic enzyme reaction. The reverse oxidative wave,
while enhanced after the addition of NADPH to 1 mM, is not easily measured from
a complex baseline.
Signi�cantly increased NH3 was measured in the external media after cyclic
voltammetric assessment as shown in Table 4. Normalized by chlorophyll a density
in the parent cell suspension, the measured NH3 increased tenfold after the addition
of NADPH to 1 mM. While di¢ cult to explain mechanistically, certainly it is
well documented that NADPH has a signi�cant role in electron transfer reactions
for ammonia producing enzymes nitrogenase and nitrate/nitrite reductase. If the
concentration of NADPH increases, so do NH3 concentration and peak current for
the reduction here.
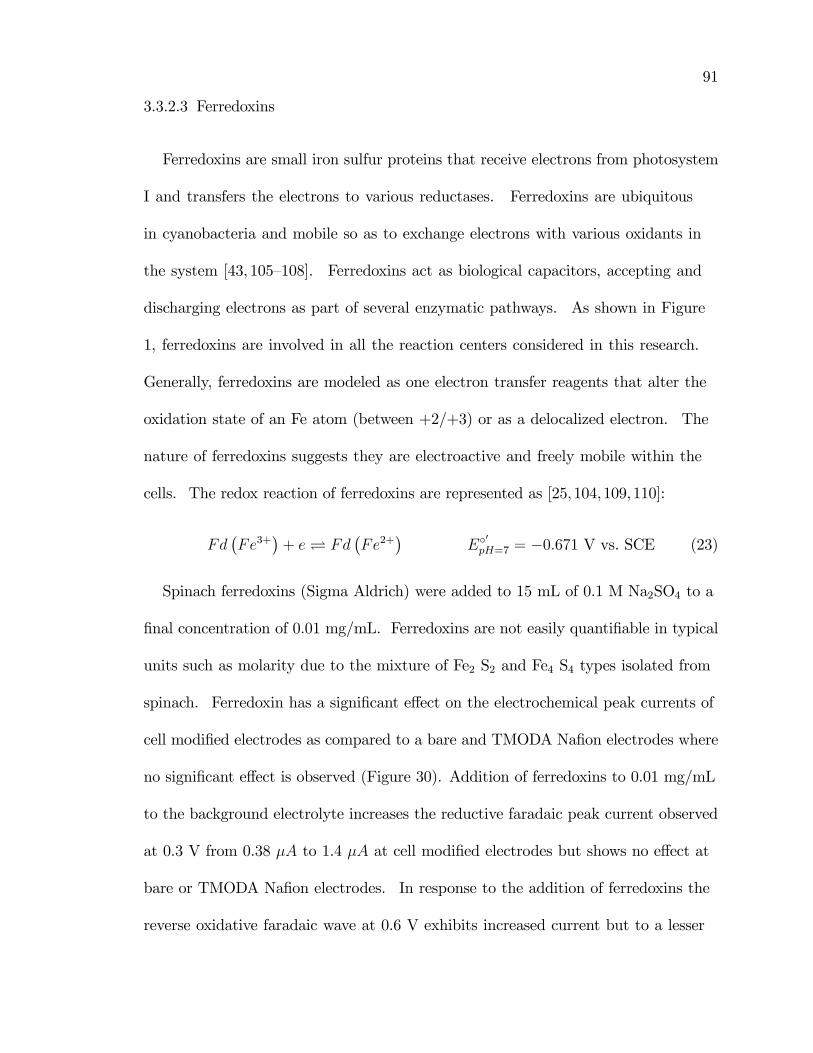
91
3.3.2.3 Ferredoxins
Ferredoxins are small iron sulfur proteins that receive electrons from photosystem
I and transfers the electrons to various reductases. Ferredoxins are ubiquitous
in cyanobacteria and mobile so as to exchange electrons with various oxidants in
the system [43, 105�108]. Ferredoxins act as biological capacitors, accepting and
discharging electrons as part of several enzymatic pathways. As shown in Figure
1, ferredoxins are involved in all the reaction centers considered in this research.
Generally, ferredoxins are modeled as one electron transfer reagents that alter the
oxidation state of an Fe atom (between +2/+3) or as a delocalized electron. The
nature of ferredoxins suggests they are electroactive and freely mobile within the
cells. The redox reaction of ferredoxins are represented as [25,104,109,110]:
Fd�Fe3+
�+ e Fd
�Fe2+
�E�
0
pH=7 = �0:671 V vs. SCE (23)
Spinach ferredoxins (Sigma Aldrich) were added to 15 mL of 0.1 M Na2SO4 to a
�nal concentration of 0.01 mg/mL. Ferredoxins are not easily quanti�able in typical
units such as molarity due to the mixture of Fe2 S2 and Fe4 S4 types isolated from
spinach. Ferredoxin has a signi�cant e¤ect on the electrochemical peak currents of
cell modi�ed electrodes as compared to a bare and TMODA Na�on electrodes where
no signi�cant e¤ect is observed (Figure 30). Addition of ferredoxins to 0.01 mg/mL
to the background electrolyte increases the reductive faradaic peak current observed
at 0.3 V from 0.38 �A to 1.4 �A at cell modi�ed electrodes but shows no e¤ect at
bare or TMODA Na�on electrodes. In response to the addition of ferredoxins the
reverse oxidative faradaic wave at 0.6 V exhibits increased current but to a lesser
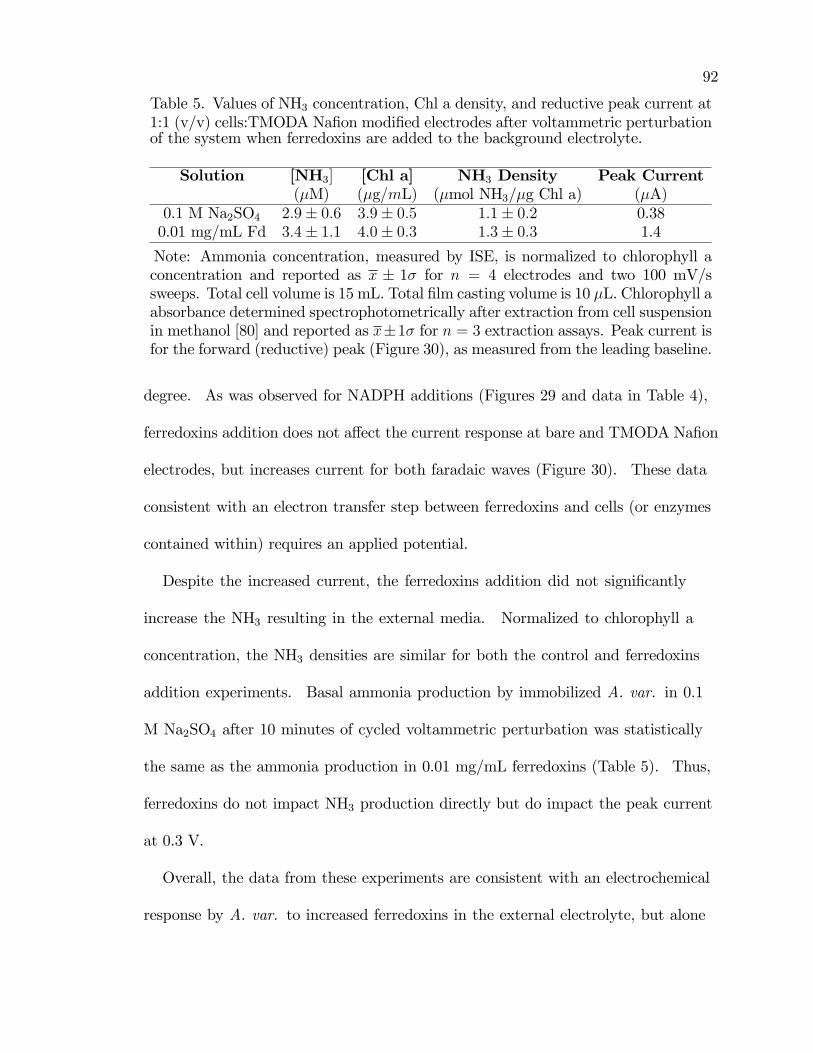
92
Table 5. Values of NH3 concentration, Chl a density, and reductive peak current at1:1 (v/v) cells:TMODA Na�on modi�ed electrodes after voltammetric perturbationof the system when ferredoxins are added to the background electrolyte.
Solution [NH3] [Chl a] NH3 Density Peak Current(�M) (�g=mL) (�mol NH3/�g Chl a) (�A)
0.1 M Na2SO4 2:9� 0:6 3:9� 0:5 1:1� 0:2 0.380.01 mg/mL Fd 3:4� 1:1 4:0� 0:3 1:3� 0:3 1.4
Note: Ammonia concentration, measured by ISE, is normalized to chlorophyll aconcentration and reported as x � 1� for n = 4 electrodes and two 100 mV/ssweeps. Total cell volume is 15 mL. Total �lm casting volume is 10 �L. Chlorophyll aabsorbance determined spectrophotometrically after extraction from cell suspensionin methanol [80] and reported as x�1� for n = 3 extraction assays. Peak current isfor the forward (reductive) peak (Figure 30), as measured from the leading baseline.
degree. As was observed for NADPH additions (Figures 29 and data in Table 4),
ferredoxins addition does not a¤ect the current response at bare and TMODA Na�on
electrodes, but increases current for both faradaic waves (Figure 30). These data
consistent with an electron transfer step between ferredoxins and cells (or enzymes
contained within) requires an applied potential.
Despite the increased current, the ferredoxins addition did not signi�cantly
increase the NH3 resulting in the external media. Normalized to chlorophyll a
concentration, the NH3 densities are similar for both the control and ferredoxins
addition experiments. Basal ammonia production by immobilized A. var. in 0.1
M Na2SO4 after 10 minutes of cycled voltammetric perturbation was statistically
the same as the ammonia production in 0.01 mg/mL ferredoxins (Table 5). Thus,
ferredoxins do not impact NH3 production directly but do impact the peak current
at 0.3 V.
Overall, the data from these experiments are consistent with an electrochemical
response by A. var. to increased ferredoxins in the external electrolyte, but alone
93
Figure 30. E¤ect of adding ferredoxins to the background electrolyte during cyclicvoltammetry. Cyclic voltammogram overlay of Bare (� � ), TMODA-Na�on (�� ), and 1:1 Cells:TMODA-Na�on (� �) electrodes in 0.1 M Na2SO4 with 0.1 mg/mLferredoxin added. For comparison, a 1:1 Cells:TMODA-Na�on (� � �) in 0.1 M Na2SO4without ferredoxin is overlayed. Pt mesh counter electrode, SCE reference electrode,75 mV/s.
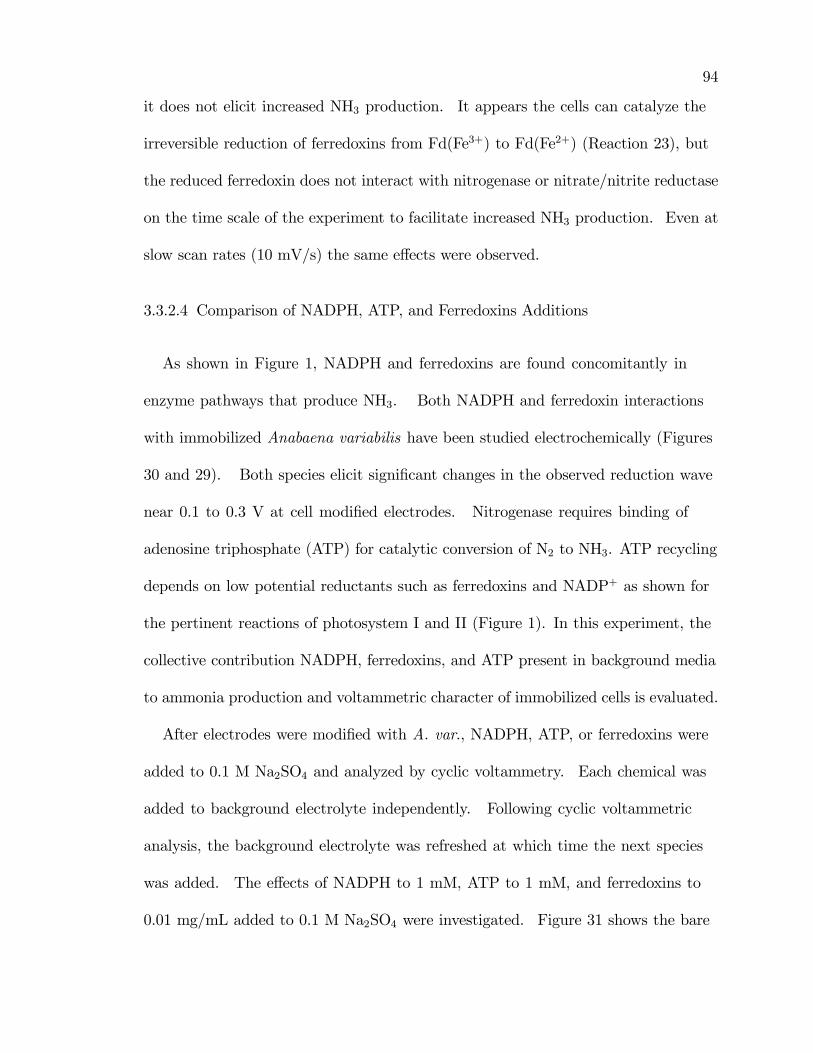
94
it does not elicit increased NH3 production. It appears the cells can catalyze the
irreversible reduction of ferredoxins from Fd(Fe3+) to Fd(Fe2+) (Reaction 23), but
the reduced ferredoxin does not interact with nitrogenase or nitrate/nitrite reductase
on the time scale of the experiment to facilitate increased NH3 production. Even at
slow scan rates (10 mV/s) the same e¤ects were observed.
3.3.2.4 Comparison of NADPH, ATP, and Ferredoxins Additions
As shown in Figure 1, NADPH and ferredoxins are found concomitantly in
enzyme pathways that produce NH3. Both NADPH and ferredoxin interactions
with immobilized Anabaena variabilis have been studied electrochemically (Figures
30 and 29). Both species elicit signi�cant changes in the observed reduction wave
near 0.1 to 0.3 V at cell modi�ed electrodes. Nitrogenase requires binding of
adenosine triphosphate (ATP) for catalytic conversion of N2 to NH3. ATP recycling
depends on low potential reductants such as ferredoxins and NADP+ as shown for
the pertinent reactions of photosystem I and II (Figure 1). In this experiment, the
collective contribution NADPH, ferredoxins, and ATP present in background media
to ammonia production and voltammetric character of immobilized cells is evaluated.
After electrodes were modi�ed with A. var., NADPH, ATP, or ferredoxins were
added to 0.1 M Na2SO4 and analyzed by cyclic voltammetry. Each chemical was
added to background electrolyte independently. Following cyclic voltammetric
analysis, the background electrolyte was refreshed at which time the next species
was added. The e¤ects of NADPH to 1 mM, ATP to 1 mM, and ferredoxins to
0.01 mg/mL added to 0.1 M Na2SO4 were investigated. Figure 31 shows the bare
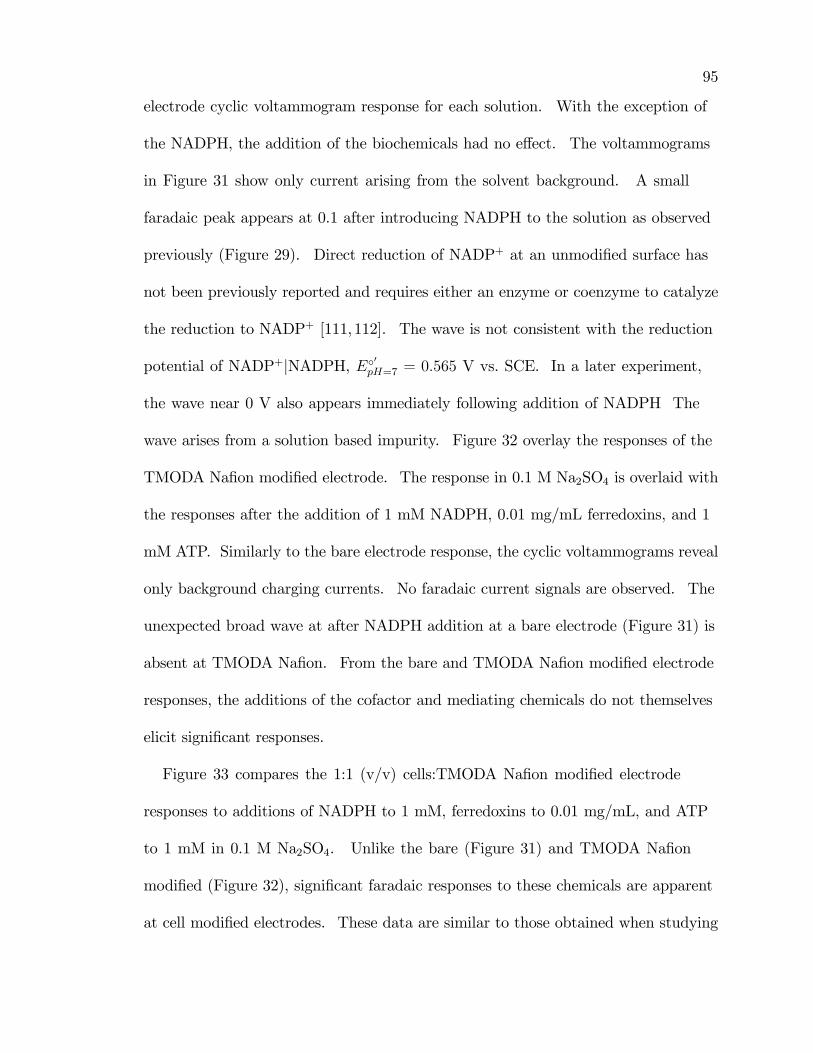
95
electrode cyclic voltammogram response for each solution. With the exception of
the NADPH, the addition of the biochemicals had no e¤ect. The voltammograms
in Figure 31 show only current arising from the solvent background. A small
faradaic peak appears at 0.1 after introducing NADPH to the solution as observed
previously (Figure 29). Direct reduction of NADP+ at an unmodi�ed surface has
not been previously reported and requires either an enzyme or coenzyme to catalyze
the reduction to NADP+ [111,112]. The wave is not consistent with the reduction
potential of NADP+jNADPH, E�0pH=7 = 0:565 V vs. SCE. In a later experiment,
the wave near 0 V also appears immediately following addition of NADPH The
wave arises from a solution based impurity. Figure 32 overlay the responses of the
TMODA Na�on modi�ed electrode. The response in 0.1 M Na2SO4 is overlaid with
the responses after the addition of 1 mM NADPH, 0.01 mg/mL ferredoxins, and 1
mM ATP. Similarly to the bare electrode response, the cyclic voltammograms reveal
only background charging currents. No faradaic current signals are observed. The
unexpected broad wave at after NADPH addition at a bare electrode (Figure 31) is
absent at TMODA Na�on. From the bare and TMODA Na�on modi�ed electrode
responses, the additions of the cofactor and mediating chemicals do not themselves
elicit signi�cant responses.
Figure 33 compares the 1:1 (v/v) cells:TMODA Na�on modi�ed electrode
responses to additions of NADPH to 1 mM, ferredoxins to 0.01 mg/mL, and ATP
to 1 mM in 0.1 M Na2SO4. Unlike the bare (Figure 31) and TMODA Na�on
modi�ed (Figure 32), signi�cant faradaic responses to these chemicals are apparent
at cell modi�ed electrodes. These data are similar to those obtained when studying
96
Figure 31. Cyclic voltammetric responses from a bare electrode to compare the e¤ectof mediating/cofactor chemical additions. Cyclic voltammogram overlay of bareelectrodes in 0.1 M Na2SO4;control (� � ), 1 mM NADPH (� � ), 0:01 mg/mLferredoxins (� �), and 1 mM ATP (� � �). Pt mesh counter electrode, SCE referenceelectrode, 100 mV/s.
97
Figure 32. Cyclic voltammetric responses from a TMODA Na�on electrode to com-pare the e¤ect of separate and independent additions of mediating/cofactor chemical.Cyclic voltammogram overlay of TMODA-Na�on electrodes in 0.1 M Na2SO4;control(� � ), 1 mM NADPH (� � ), 0:01 mg/mL ferredoxins (� � �), and 1 mM ATP (� �).Pt mesh counter electrode, SCE reference electrode, 100 mV/s.
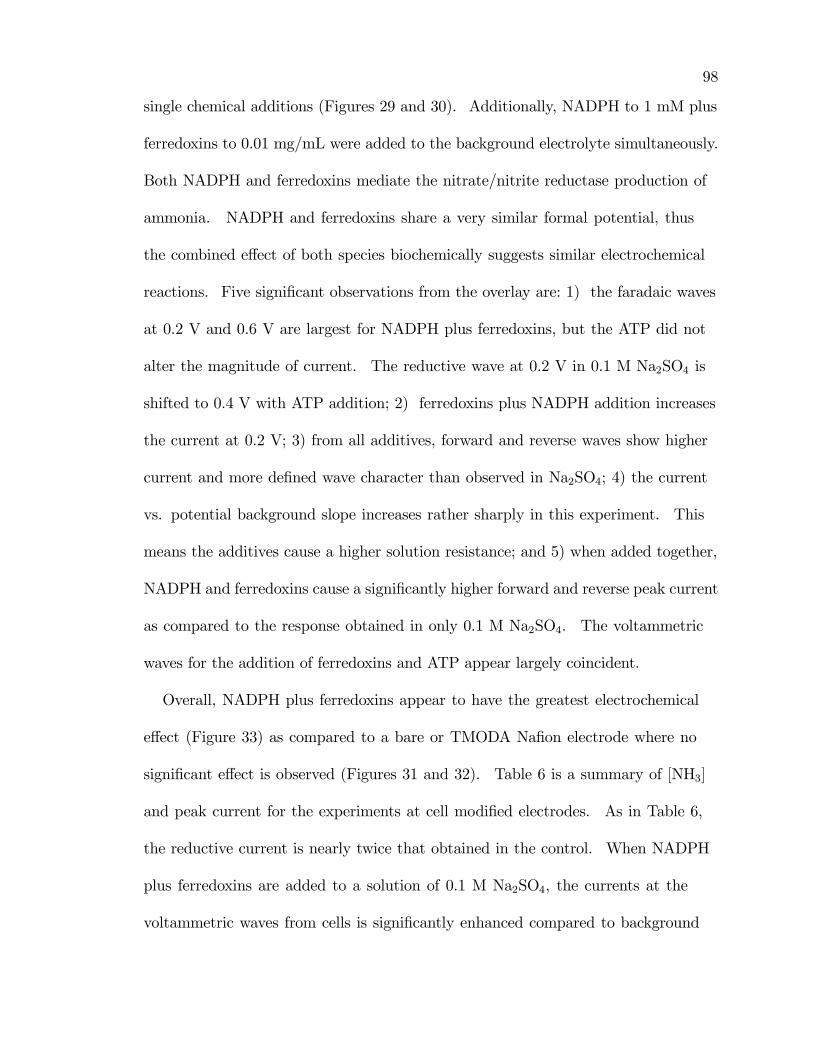
98
single chemical additions (Figures 29 and 30). Additionally, NADPH to 1 mM plus
ferredoxins to 0.01 mg/mL were added to the background electrolyte simultaneously.
Both NADPH and ferredoxins mediate the nitrate/nitrite reductase production of
ammonia. NADPH and ferredoxins share a very similar formal potential, thus
the combined e¤ect of both species biochemically suggests similar electrochemical
reactions. Five signi�cant observations from the overlay are: 1) the faradaic waves
at 0.2 V and 0.6 V are largest for NADPH plus ferredoxins, but the ATP did not
alter the magnitude of current. The reductive wave at 0.2 V in 0.1 M Na2SO4 is
shifted to 0.4 V with ATP addition; 2) ferredoxins plus NADPH addition increases
the current at 0.2 V; 3) from all additives, forward and reverse waves show higher
current and more de�ned wave character than observed in Na2SO4; 4) the current
vs. potential background slope increases rather sharply in this experiment. This
means the additives cause a higher solution resistance; and 5) when added together,
NADPH and ferredoxins cause a signi�cantly higher forward and reverse peak current
as compared to the response obtained in only 0.1 M Na2SO4. The voltammetric
waves for the addition of ferredoxins and ATP appear largely coincident.
Overall, NADPH plus ferredoxins appear to have the greatest electrochemical
e¤ect (Figure 33) as compared to a bare or TMODA Na�on electrode where no
signi�cant e¤ect is observed (Figures 31 and 32). Table 6 is a summary of [NH3]
and peak current for the experiments at cell modi�ed electrodes. As in Table 6,
the reductive current is nearly twice that obtained in the control. When NADPH
plus ferredoxins are added to a solution of 0.1 M Na2SO4, the currents at the
voltammetric waves from cells is signi�cantly enhanced compared to background
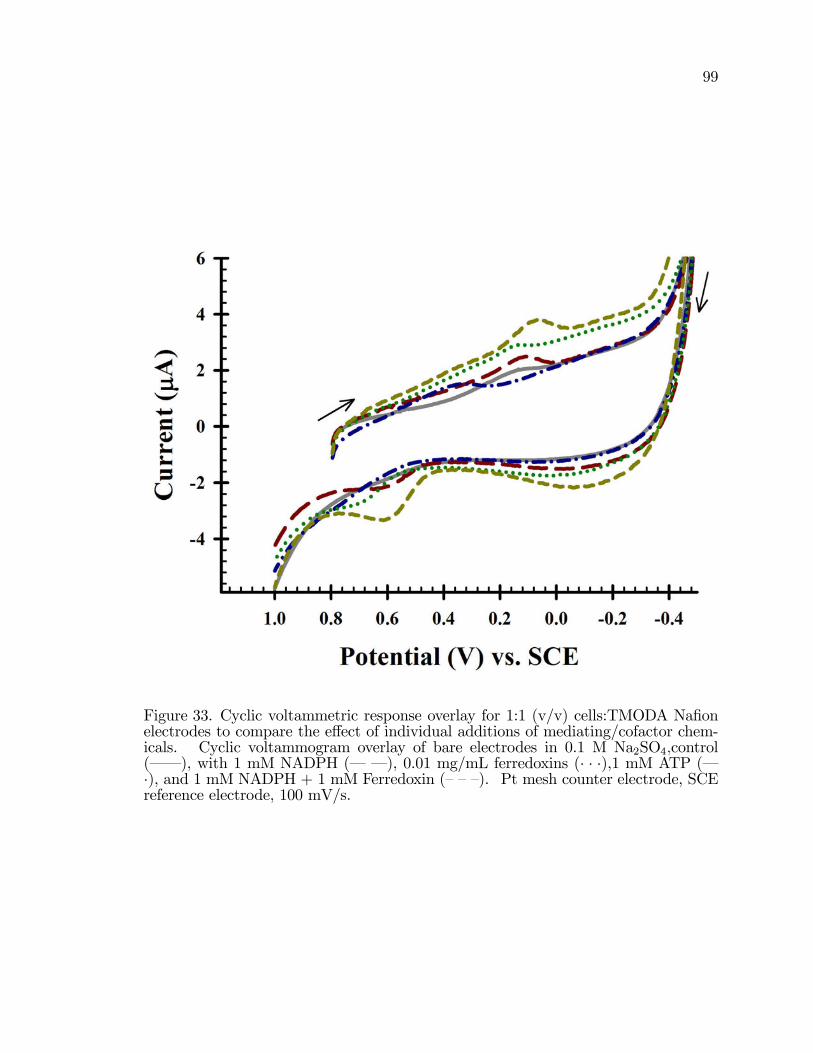
99
Figure 33. Cyclic voltammetric response overlay for 1:1 (v/v) cells:TMODA Na�onelectrodes to compare the e¤ect of individual additions of mediating/cofactor chem-icals. Cyclic voltammogram overlay of bare electrodes in 0.1 M Na2SO4;control(� � ), with 1 mM NADPH (� � ), 0.01 mg/mL ferredoxins (� � �),1 mM ATP (��), and 1 mM NADPH + 1 mM Ferredoxin (���). Pt mesh counter electrode, SCEreference electrode, 100 mV/s.
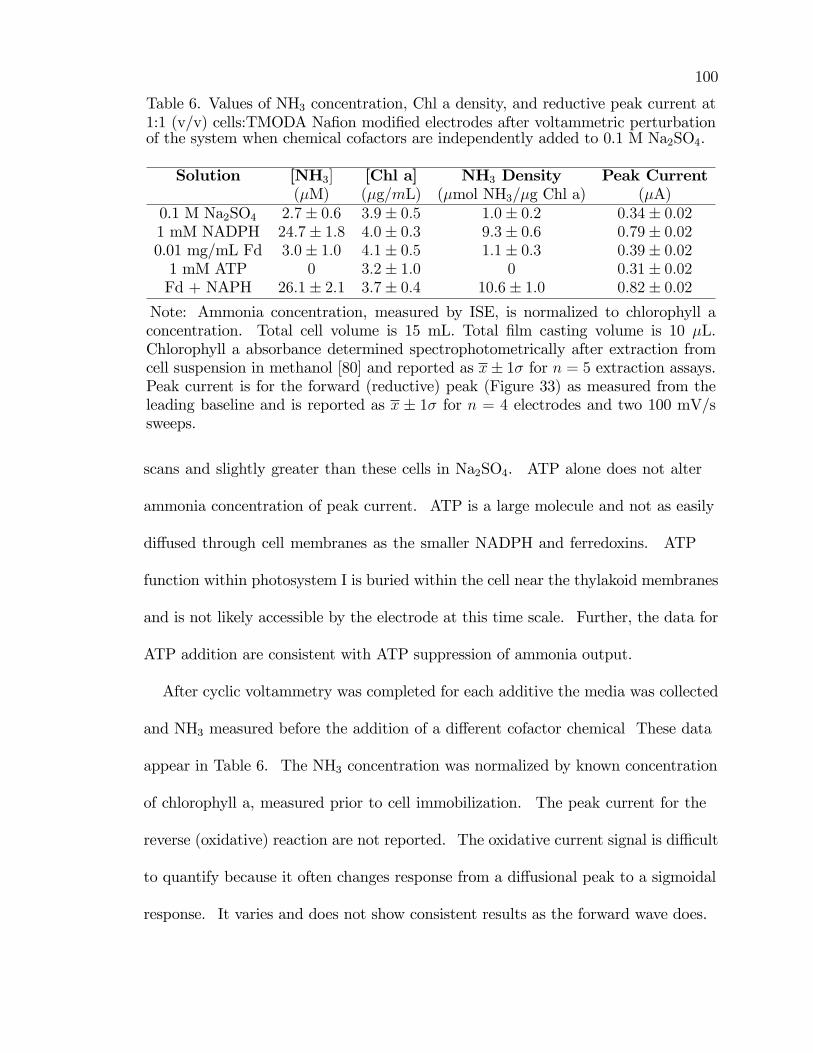
100
Table 6. Values of NH3 concentration, Chl a density, and reductive peak current at1:1 (v/v) cells:TMODA Na�on modi�ed electrodes after voltammetric perturbationof the system when chemical cofactors are independently added to 0.1 M Na2SO4.
Solution [NH3] [Chl a] NH3 Density Peak Current(�M) (�g=mL) (�mol NH3/�g Chl a) (�A)
0.1 M Na2SO4 2:7� 0:6 3:9� 0:5 1:0� 0:2 0:34� 0:021 mM NADPH 24:7� 1:8 4:0� 0:3 9:3� 0:6 0:79� 0:020.01 mg/mL Fd 3:0� 1:0 4:1� 0:5 1:1� 0:3 0:39� 0:021 mM ATP 0 3:2� 1:0 0 0:31� 0:02Fd + NAPH 26:1� 2:1 3:7� 0:4 10:6� 1:0 0:82� 0:02
Note: Ammonia concentration, measured by ISE, is normalized to chlorophyll aconcentration. Total cell volume is 15 mL. Total �lm casting volume is 10 �L.Chlorophyll a absorbance determined spectrophotometrically after extraction fromcell suspension in methanol [80] and reported as x� 1� for n = 5 extraction assays.Peak current is for the forward (reductive) peak (Figure 33) as measured from theleading baseline and is reported as x � 1� for n = 4 electrodes and two 100 mV/ssweeps.
scans and slightly greater than these cells in Na2SO4. ATP alone does not alter
ammonia concentration of peak current. ATP is a large molecule and not as easily
di¤used through cell membranes as the smaller NADPH and ferredoxins. ATP
function within photosystem I is buried within the cell near the thylakoid membranes
and is not likely accessible by the electrode at this time scale. Further, the data for
ATP addition are consistent with ATP suppression of ammonia output.
After cyclic voltammetry was completed for each additive the media was collected
and NH3 measured before the addition of a di¤erent cofactor chemical These data
appear in Table 6. The NH3 concentration was normalized by known concentration
of chlorophyll a, measured prior to cell immobilization. The peak current for the
reverse (oxidative) reaction are not reported. The oxidative current signal is di¢ cult
to quantify because it often changes response from a di¤usional peak to a sigmoidal
response. It varies and does not show consistent results as the forward wave does.
101
A linear relationship between the forward wave and ammonia output is shown in
Figure 34. These data suggest that the added NADPH and ferredoxins interact with
the cells near the electrode surface. The interaction is measured voltammetrically.
This interaction appears to facilitate higher production of NH3. Certainly, as shown
in Figure 1; both NADPH and ferredoxins are essential mediating and cofactor
species for nitrogenase and nitrate/nitrite reductase enzyme production of NH3.
These data are not conclusive, but provide initial correlational observations.
3.3.2.5 Successive Additions of Mediating Species NADPH, Ferredoxins,and ATP
In the previous section, mediating and cofactor chemicals NADPH, ferredoxins,
and ATP were added individually to the electrolyte and analyzed voltammetrically
at cell modi�ed electrodes. When ferredoxins plus NADPH were added to the
background electrolyte, a signi�cant increase in both forward and reverse peak
currents were observed. Peak currents and ammonia concentration correlate linearly.
Here, the cofactor and mediating chemicals are added to the a 0.1 M Na2SO4
background successively. After each addition, cyclic voltammetry was performed
to study the electrochemical e¤ects of these species and how currents relate to
ammonia measured after cyclic voltammetry.. In these experiments, the addition
of the mediating species was in the same volume of background electrolyte, so that
the �nal cyclic voltammetric analysis was of a 0.1 M Na2SO4 solution containing
NADPH, ferredoxins, and ATP.
As observed for individual additions (Figure 31), an overlay of cyclic
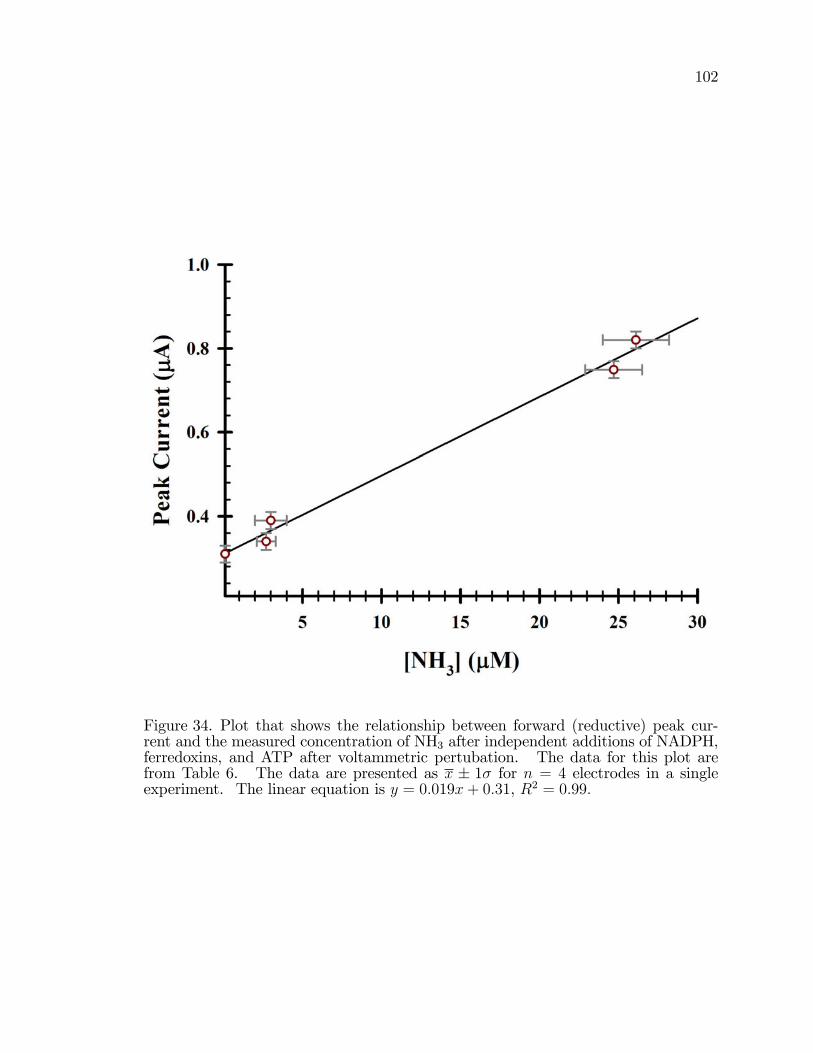
102
Figure 34. Plot that shows the relationship between forward (reductive) peak cur-rent and the measured concentration of NH3 after independent additions of NADPH,ferredoxins, and ATP after voltammetric pertubation. The data for this plot arefrom Table 6. The data are presented as x � 1� for n = 4 electrodes in a singleexperiment. The linear equation is y = 0:019x+ 0:31, R2 = 0:99:
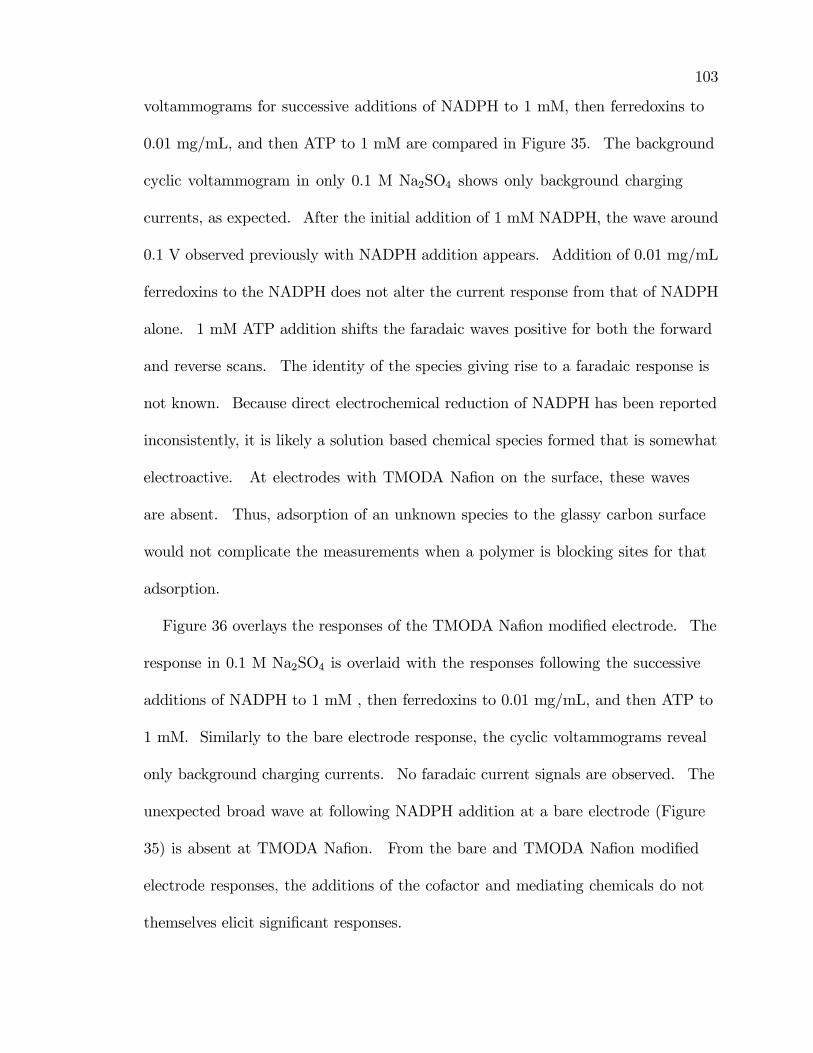
103
voltammograms for successive additions of NADPH to 1 mM, then ferredoxins to
0.01 mg/mL, and then ATP to 1 mM are compared in Figure 35. The background
cyclic voltammogram in only 0.1 M Na2SO4 shows only background charging
currents, as expected. After the initial addition of 1 mM NADPH, the wave around
0.1 V observed previously with NADPH addition appears. Addition of 0.01 mg/mL
ferredoxins to the NADPH does not alter the current response from that of NADPH
alone. 1 mM ATP addition shifts the faradaic waves positive for both the forward
and reverse scans. The identity of the species giving rise to a faradaic response is
not known. Because direct electrochemical reduction of NADPH has been reported
inconsistently, it is likely a solution based chemical species formed that is somewhat
electroactive. At electrodes with TMODA Na�on on the surface, these waves
are absent. Thus, adsorption of an unknown species to the glassy carbon surface
would not complicate the measurements when a polymer is blocking sites for that
adsorption.
Figure 36 overlays the responses of the TMODA Na�on modi�ed electrode. The
response in 0.1 M Na2SO4 is overlaid with the responses following the successive
additions of NADPH to 1 mM , then ferredoxins to 0.01 mg/mL, and then ATP to
1 mM. Similarly to the bare electrode response, the cyclic voltammograms reveal
only background charging currents. No faradaic current signals are observed. The
unexpected broad wave at following NADPH addition at a bare electrode (Figure
35) is absent at TMODA Na�on. From the bare and TMODA Na�on modi�ed
electrode responses, the additions of the cofactor and mediating chemicals do not
themselves elicit signi�cant responses.
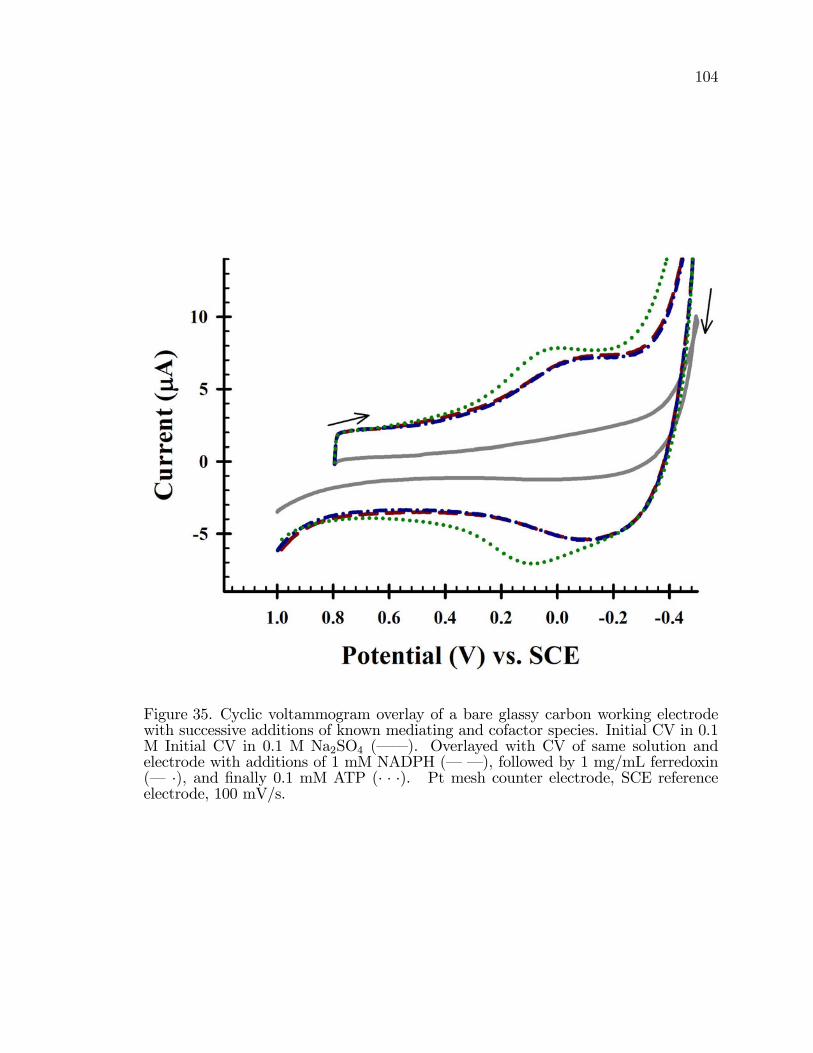
104
Figure 35. Cyclic voltammogram overlay of a bare glassy carbon working electrodewith successive additions of known mediating and cofactor species. Initial CV in 0.1M Initial CV in 0.1 M Na2SO4 (� � ). Overlayed with CV of same solution andelectrode with additions of 1 mM NADPH (� � ), followed by 1 mg/mL ferredoxin(� �), and �nally 0.1 mM ATP (� � �). Pt mesh counter electrode, SCE referenceelectrode, 100 mV/s.
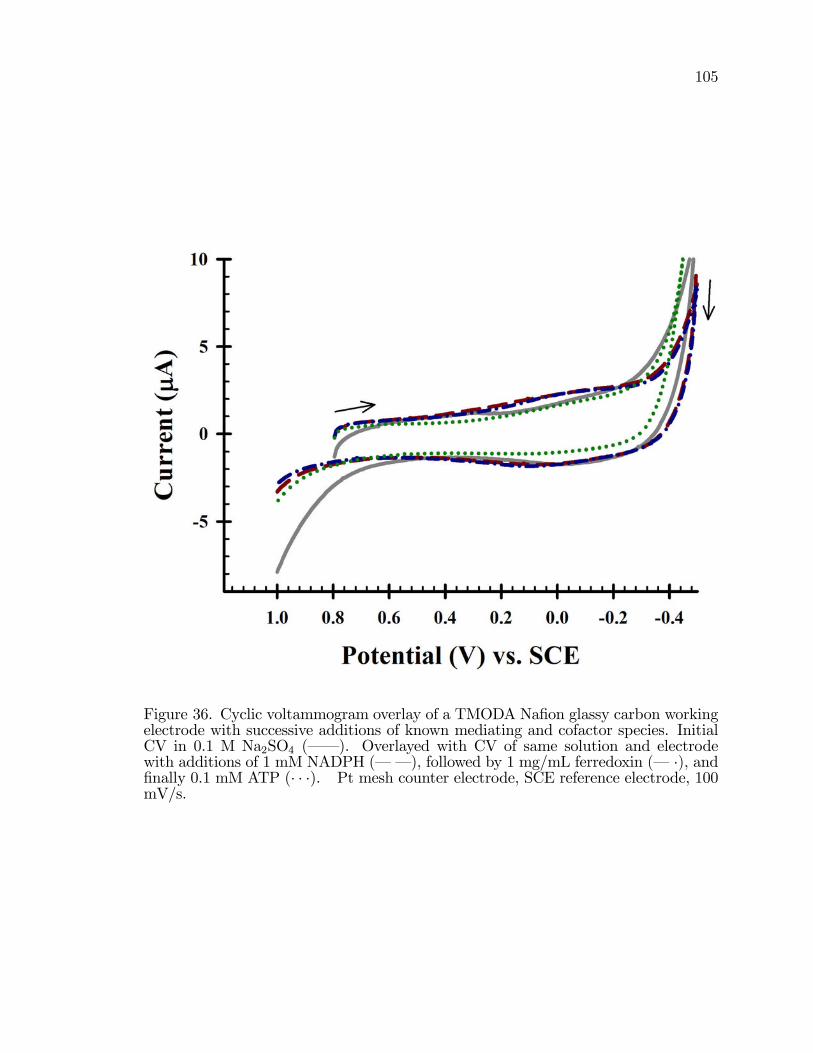
105
Figure 36. Cyclic voltammogram overlay of a TMODA Na�on glassy carbon workingelectrode with successive additions of known mediating and cofactor species. InitialCV in 0.1 M Na2SO4 (� � ). Overlayed with CV of same solution and electrodewith additions of 1 mM NADPH (� � ), followed by 1 mg/mL ferredoxin (� �), and�nally 0.1 mM ATP (� � �). Pt mesh counter electrode, SCE reference electrode, 100mV/s.
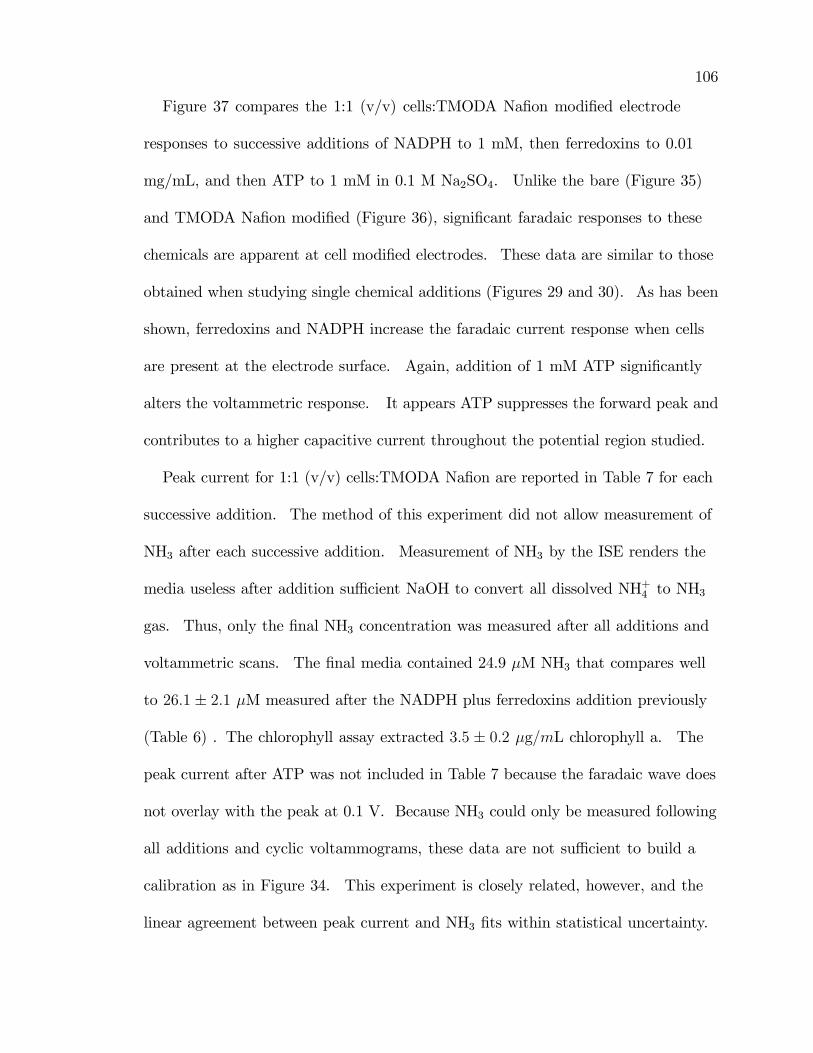
106
Figure 37 compares the 1:1 (v/v) cells:TMODA Na�on modi�ed electrode
responses to successive additions of NADPH to 1 mM, then ferredoxins to 0.01
mg/mL, and then ATP to 1 mM in 0.1 M Na2SO4. Unlike the bare (Figure 35)
and TMODA Na�on modi�ed (Figure 36), signi�cant faradaic responses to these
chemicals are apparent at cell modi�ed electrodes. These data are similar to those
obtained when studying single chemical additions (Figures 29 and 30). As has been
shown, ferredoxins and NADPH increase the faradaic current response when cells
are present at the electrode surface. Again, addition of 1 mM ATP signi�cantly
alters the voltammetric response. It appears ATP suppresses the forward peak and
contributes to a higher capacitive current throughout the potential region studied.
Peak current for 1:1 (v/v) cells:TMODA Na�on are reported in Table 7 for each
successive addition. The method of this experiment did not allow measurement of
NH3 after each successive addition. Measurement of NH3 by the ISE renders the
media useless after addition su¢ cient NaOH to convert all dissolved NH+4 to NH3
gas. Thus, only the �nal NH3 concentration was measured after all additions and
voltammetric scans. The �nal media contained 24.9 �M NH3 that compares well
to 26:1 � 2:1 �M measured after the NADPH plus ferredoxins addition previously
(Table 6) . The chlorophyll assay extracted 3:5 � 0:2 �g=mL chlorophyll a. The
peak current after ATP was not included in Table 7 because the faradaic wave does
not overlay with the peak at 0.1 V. Because NH3 could only be measured following
all additions and cyclic voltammograms, these data are not su¢ cient to build a
calibration as in Figure 34. This experiment is closely related, however, and the
linear agreement between peak current and NH3 �ts within statistical uncertainty.
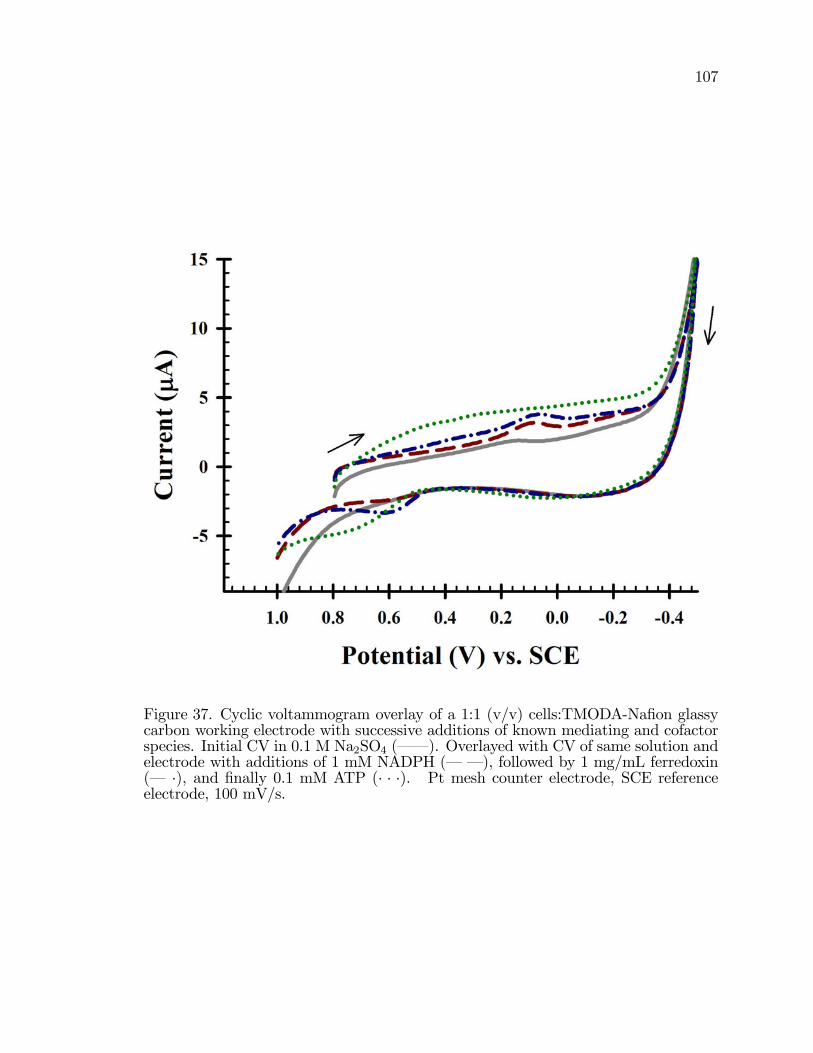
107
Figure 37. Cyclic voltammogram overlay of a 1:1 (v/v) cells:TMODA-Na�on glassycarbon working electrode with successive additions of known mediating and cofactorspecies. Initial CV in 0.1 M Na2SO4 (� � ). Overlayed with CV of same solution andelectrode with additions of 1 mM NADPH (� � ), followed by 1 mg/mL ferredoxin(� �), and �nally 0.1 mM ATP (� � �). Pt mesh counter electrode, SCE referenceelectrode, 100 mV/s.
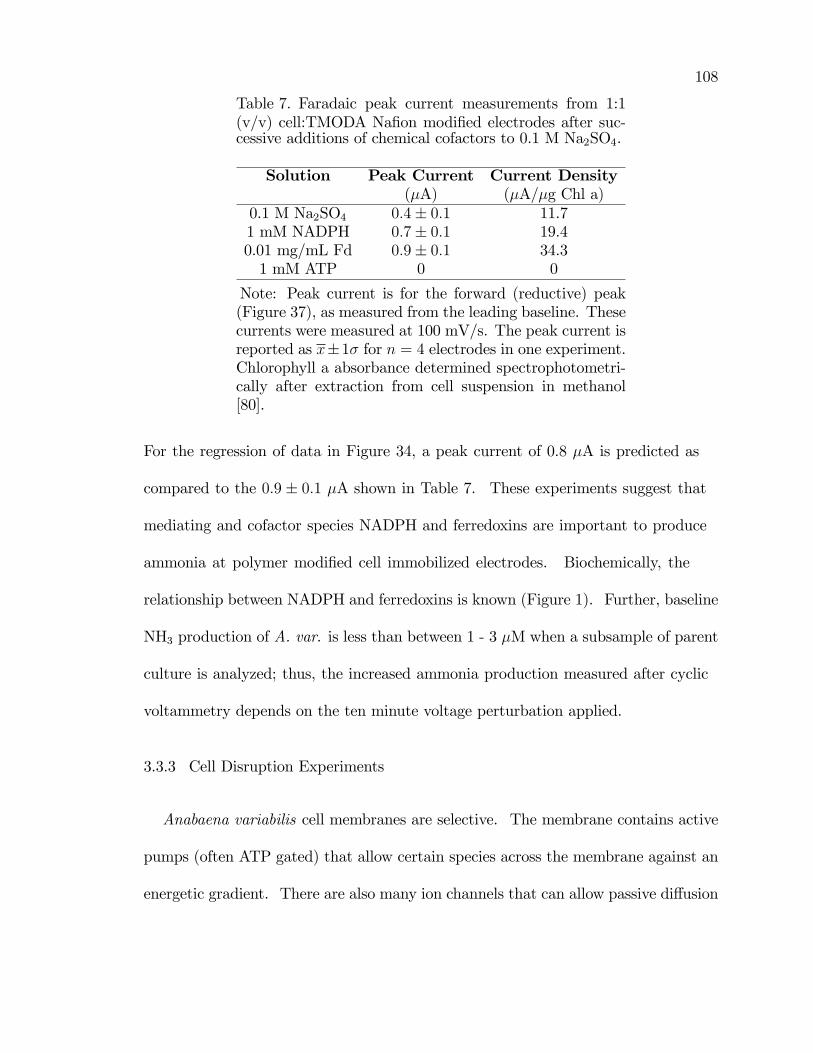
108
Table 7. Faradaic peak current measurements from 1:1(v/v) cell:TMODA Na�on modi�ed electrodes after suc-cessive additions of chemical cofactors to 0.1 M Na2SO4.
Solution Peak Current Current Density(�A) (�A/�g Chl a)
0.1 M Na2SO4 0:4� 0:1 11.71 mM NADPH 0:7� 0:1 19.40.01 mg/mL Fd 0:9� 0:1 34.31 mM ATP 0 0
Note: Peak current is for the forward (reductive) peak(Figure 37), as measured from the leading baseline. Thesecurrents were measured at 100 mV/s. The peak current isreported as x�1� for n = 4 electrodes in one experiment.Chlorophyll a absorbance determined spectrophotometri-cally after extraction from cell suspension in methanol[80].
For the regression of data in Figure 34, a peak current of 0.8 �A is predicted as
compared to the 0:9 � 0:1 �A shown in Table 7. These experiments suggest that
mediating and cofactor species NADPH and ferredoxins are important to produce
ammonia at polymer modi�ed cell immobilized electrodes. Biochemically, the
relationship between NADPH and ferredoxins is known (Figure 1). Further, baseline
NH3 production of A. var. is less than between 1 - 3 �M when a subsample of parent
culture is analyzed; thus, the increased ammonia production measured after cyclic
voltammetry depends on the ten minute voltage perturbation applied.
3.3.3 Cell Disruption Experiments
Anabaena variabilis cell membranes are selective. The membrane contains active
pumps (often ATP gated) that allow certain species across the membrane against an
energetic gradient. There are also many ion channels that can allow passive di¤usion
109
into and out of the cell. On the 100 mV/s time scale used for most CV experiments,
it is a question as to whether reduced or oxidized species can cycle between electrode
and active enzyme site. From an electrochemical perspective, resistance prohibits
electron transfer to the active site of the enzymes unless the chemical species
carrying reductive electrons can enter the cell. The electron hopping distance from
the electrode is < 2 nm. The enzyme in the cell is at least 1 �m from the electrode
because of the cell membrane thickness. Physically and chemically disrupting
this cell membrane barrier exposes the reaction centers. Because the reaction
centers are located in the cytosol behind the cell membrane (either in the heterocyst
or vegetative cells), trials with ruptured cells were studied. For the purpose of
speci�cally targeting individual enzymes or cellular biochemical pathways, many
researchers disrupt the cells and isolate components for precise experimentation
[76,77,113�117]. These type of extractions and puri�cations require instrumentation
not available for this research. To address whether the cell membrane inhibits
electron transfer between electrode and enzyme, the cell membranes were degraded
with sonication and enzymatic breakdown using lysozyme. These partially disrupted
cell suspensions were used in place of whole cell suspensions. They were immobilized
to an electrode in TMODA Na�on and their electrochemical properties studied.
Five di¤erent preparations were made of disrupted cells: sonicated and dried,
dried, sonicated and co-cast, lysozyme treated and dried, and lysozyme treated and
co-cast preparations. For the preparations where lysozyme was employed, 1.5 mL of
a high density cell suspension is treated with 5 mg/mL lysozyme. The suspension
is thoroughly mixed by vortexing for 5 minutes. The enzyme reacts with the cells
110
for 30 minutes at which time the cells and debris are centrifuged from the vial.
Solution volume is replaced with 0.1 M Na2SO4 to resuspend the disrupted cells and
debris. This suspension is then introduced to TMODA Na�on for electrode casting.
For the sonication preparations, 10 mL of high density cell culture is exposed to 30 s
sonication (40 % duty cycle) by a titanium sonication probe (Biologics, Inc.). These
sonicated were cells were then used to make casting suspensions as appropriate. The
sonication procedure ruptures most of the vegetative cells, however the thickened
outer envelope of the heterocysts do not rupture, but are somewhat damaged near
the ends that connect to vegetative cells [53, 76, 77, 114�116, 118]. For the dried
preparations, the disrupted cell suspension was pipetted directly onto the electrode
surface and allowed to air dry before 10 �L of TMODA Na�on was placed on top
to secure the cells to the electrode. For the co-cast suspensions, the disrupted cell
suspensions were mixed with TMODA Na�on in a 1:1 (v/v) ratio and cast as a
single suspension onto the electrode surface. After the solvents from the �lms dried,
the electrodes were placed into 15 mL of 0.1 M Na2SO4.
Data suggest electron �ux is higher in the case of disrupted cells (Figure 38).
Films are evaluated in 0.1 M Na2SO4. As previously, neither bare nor TMODA
Na�on electrodes showed any faradaic responses, thus they are not presented here.
For both the reductive and oxidative peak currents, disrupting the cells prior to
immobilizing to an electrode surface signi�cantly enhanced the current responses.
As shown, the peak currents that arise from immobilized whole cells small as
compared to those with disrupted cell membranes. The reductive peak current from
the disrupted cells, however, is shifted to approximately 0.45 V compared to the
111
cells that were not disrupted where peak current appears at about 0.1 V. Cells that
were sonicated and dried to the electrode surface gave the highest current peak in
the forward direction, but a broad, shallow current wave on the reverse scan.
The reductive peak current from the disrupted cells, however, is shifted to
approximately 0.45 V compared to the cells that were not disrupted where peak
current appears at about 0.1 V. This observation suggests that upon disruption,
the cells and release enzymatic contents, such that electron transfer reactions are
less inhibited by the cell membrane; however, the identity of the species or processes
undergoing reduction/oxidation are not clear. The potential shift to the positive
direction may arise from a lower potential necessary to drive catalytic processes,
because the reaction centers are more easily accessed and resistance to transport
across the cell membrane is eliminated. While there are many possibilities to
consider from these data, it is clear disrupting cells increases the faradaic current
response. The peak data are reported in Table 8. For each cell preparation
technique, four electrodes were prepared in the same manner, thus, the statistics
re�ect the standard deviation of the peak current over four electrodes.
After a set of cyclic voltammograms at scan rates = 100, 75, 50, and 25 mV/s,
the background electrolyte was collected and the NH3 measured. The results are
also reported in Table 8. Each of these experiments were only conducted once, so
statistics for the ammonia concentration are not available. Based on the reductive or
oxidative currents, correlations were sought between the ammonia measured and the
peak current. In Figure 39, the reductive peak current was compared to the total
NH3 concentration. These data show a linear correlation (R2 = 0:98): Previously
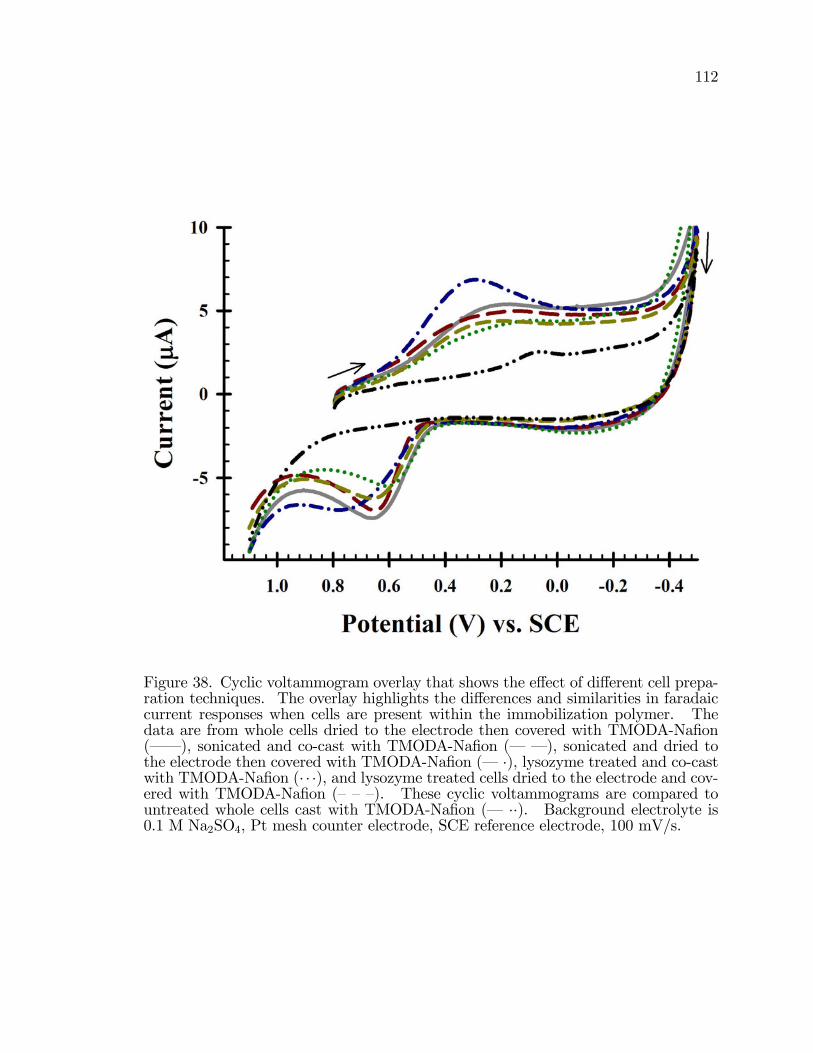
112
Figure 38. Cyclic voltammogram overlay that shows the e¤ect of di¤erent cell prepa-ration techniques. The overlay highlights the di¤erences and similarities in faradaiccurrent responses when cells are present within the immobilization polymer. Thedata are from whole cells dried to the electrode then covered with TMODA-Na�on(� � ), sonicated and co-cast with TMODA-Na�on (� � ), sonicated and dried tothe electrode then covered with TMODA-Na�on (� �), lysozyme treated and co-castwith TMODA-Na�on (� � �), and lysozyme treated cells dried to the electrode and cov-ered with TMODA-Na�on (���). These cyclic voltammograms are compared tountreated whole cells cast with TMODA-Na�on (� ��). Background electrolyte is0.1 M Na2SO4, Pt mesh counter electrode, SCE reference electrode, 100 mV/s.
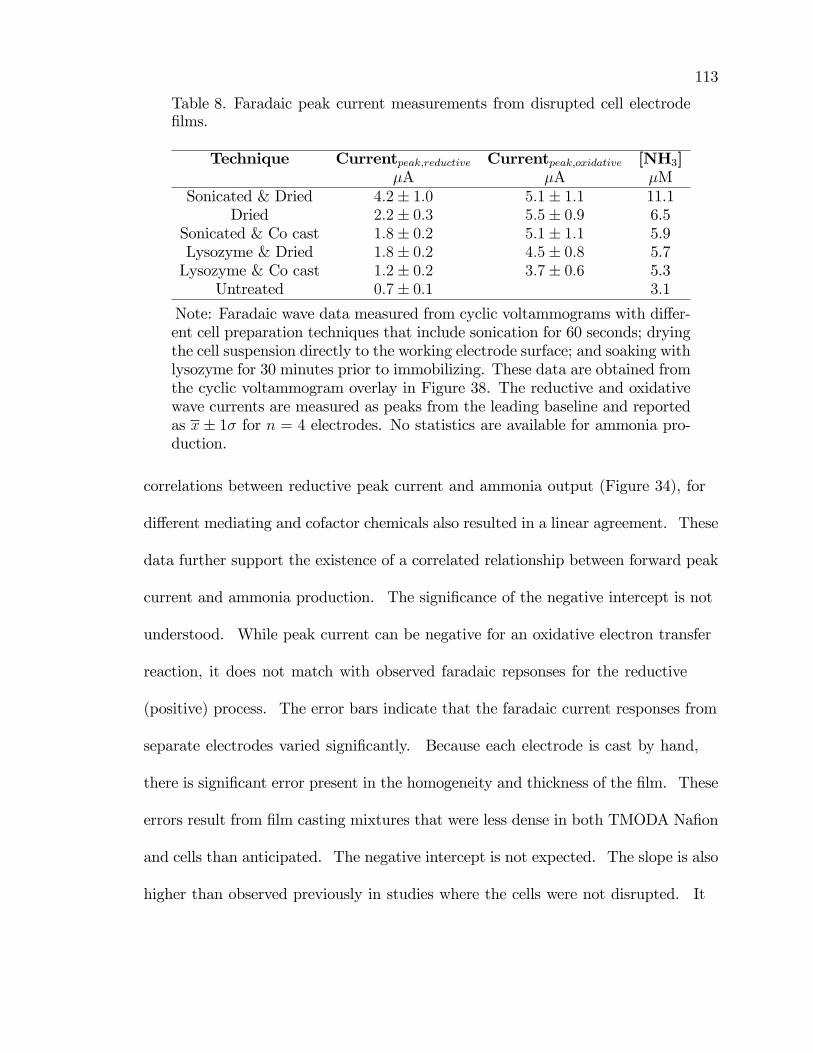
113
Table 8. Faradaic peak current measurements from disrupted cell electrode�lms.
Technique Currentpeak;reductive Currentpeak;oxidative [NH3]�A �A �M
Sonicated & Dried 4:2� 1:0 5:1� 1:1 11.1Dried 2:2� 0:3 5:5� 0:9 6.5
Sonicated & Co cast 1:8� 0:2 5:1� 1:1 5.9Lysozyme & Dried 1:8� 0:2 4:5� 0:8 5.7Lysozyme & Co cast 1:2� 0:2 3:7� 0:6 5.3
Untreated 0:7� 0:1 3:1
Note: Faradaic wave data measured from cyclic voltammograms with di¤er-ent cell preparation techniques that include sonication for 60 seconds; dryingthe cell suspension directly to the working electrode surface; and soaking withlysozyme for 30 minutes prior to immobilizing. These data are obtained fromthe cyclic voltammogram overlay in Figure 38. The reductive and oxidativewave currents are measured as peaks from the leading baseline and reportedas x � 1� for n = 4 electrodes. No statistics are available for ammonia pro-duction.
correlations between reductive peak current and ammonia output (Figure 34), for
di¤erent mediating and cofactor chemicals also resulted in a linear agreement. These
data further support the existence of a correlated relationship between forward peak
current and ammonia production. The signi�cance of the negative intercept is not
understood. While peak current can be negative for an oxidative electron transfer
reaction, it does not match with observed faradaic repsonses for the reductive
(positive) process. The error bars indicate that the faradaic current responses from
separate electrodes varied signi�cantly. Because each electrode is cast by hand,
there is signi�cant error present in the homogeneity and thickness of the �lm. These
errors result from �lm casting mixtures that were less dense in both TMODA Na�on
and cells than anticipated. The negative intercept is not expected. The slope is also
higher than observed previously in studies where the cells were not disrupted. It
114
is expected that exposing cytosolic components to the electrode surface contributes
signi�cantly to electrolysis currents, thus while seeming to be more sensitive, the
preparation of cells by disruption allows access to a greater number of electron
transfer reactions. We do not report increased sensitivity as the slope may indicate.
Ammonia output is high compared to co-cast whole cell modi�ed electrodes
(Table 8). Cyclic voltammetry is sensitive but lacks selectivity. Thus, it is
challenging to decouple the increase in peak current and ammonia production to well
identi�ed electron transfer reactions. The pathways and reactions shown in Figure
1 represent those targeted in this research, however the diagram is not an exhaustive
electrochemical or biochemical model of possible reactions.
3.3.4 E¤ect of gases and pH
The dissolved gases in the system are important considerations for producing
ammonia because the gases may contribute to the reduction sequence or they may
displace important reactants, cofactors, and products. These e¤ects can be manifest
in voltammetric results and for the electrochemical implications thereof. Both
N2 and Ar are electrochemically inert while O2; CO2;and H2 are electroactive and
when in aqueous solution, are often involved in many chemical and electrochemical
reactions. For nitrogenase, N2 is a necessary substrate for the production of NH3.
The nitrogenase enzyme is very susceptible to irreversible deactivation by O2,
because O2 competitively binds to the same active site as N2 in nitrogenase. A.
var. contain hydrogenases that can reduce H2 when additional H+ is required by
the cells. H2 is also a byproduct of the nitrogenase reaction, thus, depending on
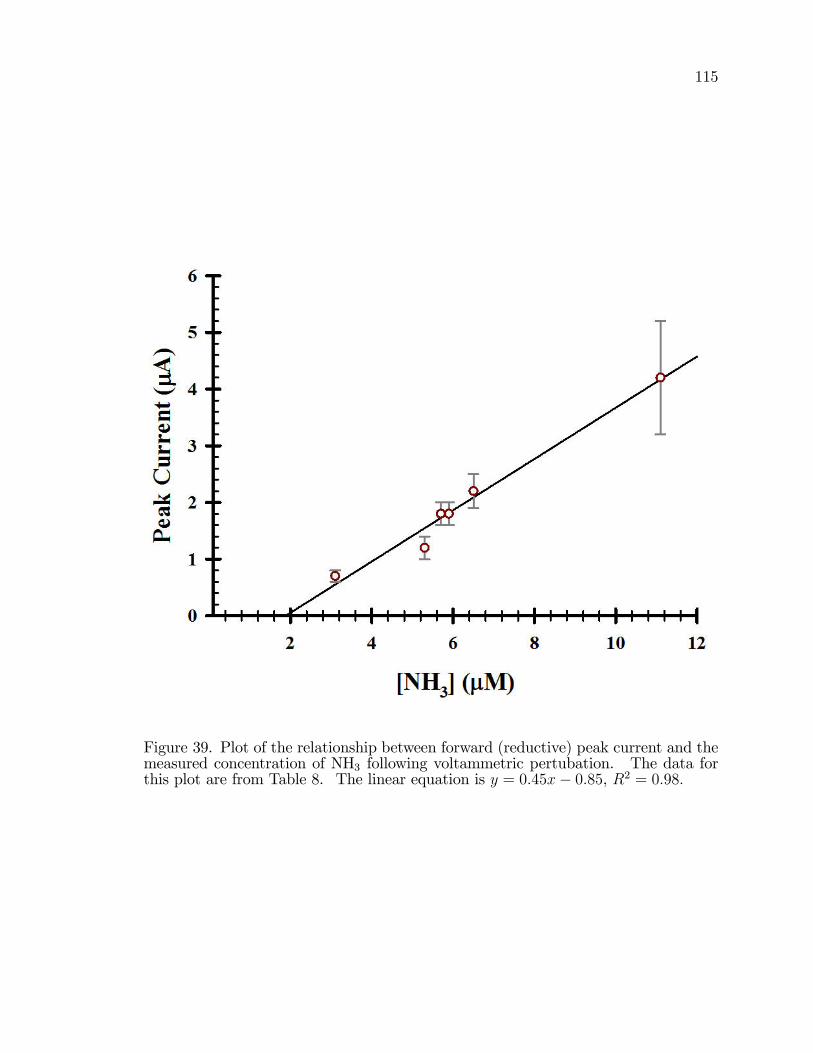
115
Figure 39. Plot of the relationship between forward (reductive) peak current and themeasured concentration of NH3 following voltammetric pertubation. The data forthis plot are from Table 8. The linear equation is y = 0:45x� 0:85, R2 = 0:98:
116
how the cells physiological needs are being met while immobilized on an electrode,
it is important to consider the e¤ect of additional H2 within the system. Absent
of complications from hydrogenases, the addition of H2 as a product of nitrogenase
may suppress nitrogen reduction. CO2 is important for growth of the cells through
their photosynthetic respiration route via PSI/II. PSI/II converts CO2 and H2O
into sugars and protein building blocks with PSII (in vegetative cells only) releasing
O2 as a by product and uses sunlight as an energy source.
The e¤ect of gases on whole cell A. var. immobilized to an electrode were studied.
Tubing connected to a di¤user is an e¤ective method to sparge solutions. 0.1
M Na2SO4 solutions were sparged with the gases listed in Table 9 for 10 minutes
at a high pressure. This drives out dissolved gases and concentrates the target
gas into solution. After the sparging, prepared electrodes were put into the
sparged background electrolyte and the cell covered with ParaFilm to minimize
gas dissolution. Cyclic voltammetric analysis of each sparged solution revealed
several important observations as summarized in Table 9. The �nal concentration
of NH3 after the experiments was measured with the ion selective electrode for three
replicate electrodes in each gas. Here, we will brie�y discuss the most understood
results of these experiments.
Increased availability of nitrogenase substrate (N2) did not increase ammonia
production nor did it result in higher currents at the reductive peak. It has been
reported that N2 availability is not the limiting step in nitrogenase action, yet in the
system as constructed, �nite N2 is available near the cells and electrode. Increased
availability of N2 would predict increased ammonia production. This suggests that
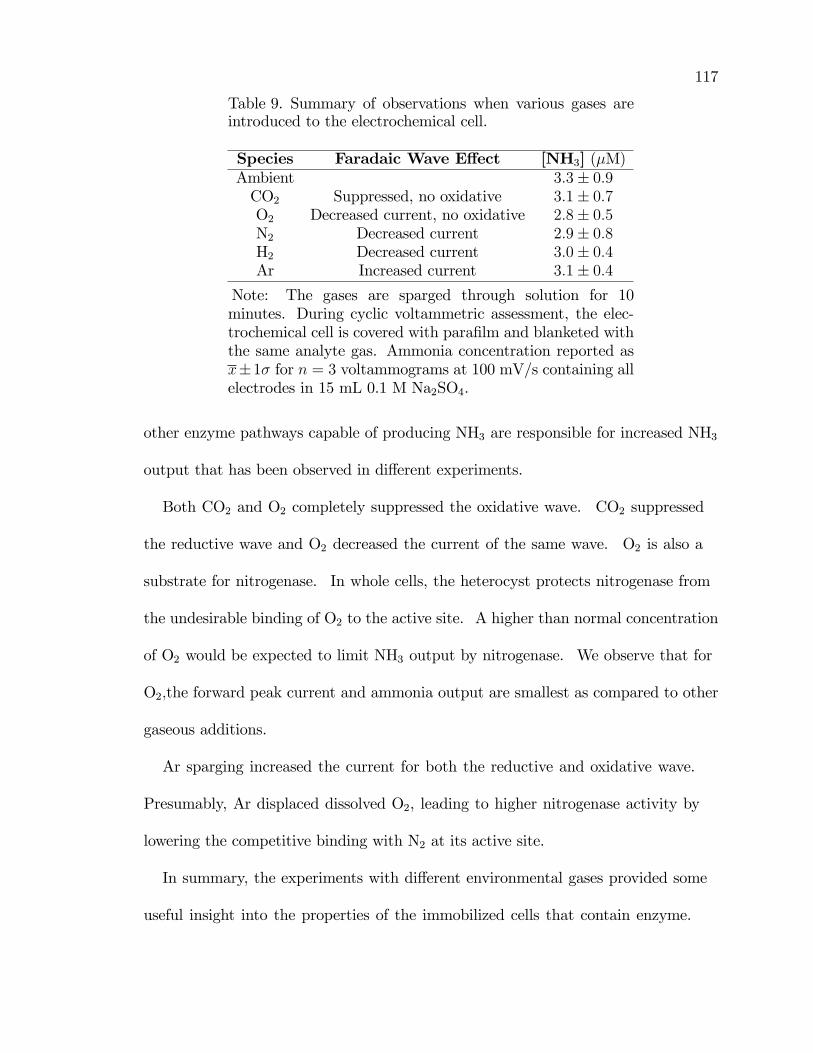
117
Table 9. Summary of observations when various gases areintroduced to the electrochemical cell.
Species Faradaic Wave E¤ect [NH3] (�M)Ambient 3:3� 0:9CO2 Suppressed, no oxidative 3:1� 0:7O2 Decreased current, no oxidative 2:8� 0:5N2 Decreased current 2:9� 0:8H2 Decreased current 3:0� 0:4Ar Increased current 3:1� 0:4
Note: The gases are sparged through solution for 10minutes. During cyclic voltammetric assessment, the elec-trochemical cell is covered with para�lm and blanketed withthe same analyte gas. Ammonia concentration reported asx�1� for n = 3 voltammograms at 100 mV/s containing allelectrodes in 15 mL 0.1 M Na2SO4.
other enzyme pathways capable of producing NH3 are responsible for increased NH3
output that has been observed in di¤erent experiments.
Both CO2 and O2 completely suppressed the oxidative wave. CO2 suppressed
the reductive wave and O2 decreased the current of the same wave. O2 is also a
substrate for nitrogenase. In whole cells, the heterocyst protects nitrogenase from
the undesirable binding of O2 to the active site. A higher than normal concentration
of O2 would be expected to limit NH3 output by nitrogenase. We observe that for
O2;the forward peak current and ammonia output are smallest as compared to other
gaseous additions.
Ar sparging increased the current for both the reductive and oxidative wave.
Presumably, Ar displaced dissolved O2, leading to higher nitrogenase activity by
lowering the competitive binding with N2 at its active site.
In summary, the experiments with di¤erent environmental gases provided some
useful insight into the properties of the immobilized cells that contain enzyme.
118
Overall, the gases had small e¤ects on the faradaic current peak potentials between
0.3 and 0.1 V for the reductive A. var. wave and 0.6 to 0.7 V for the oxidative A.
var. wave. In most cases, the current was decreased. Table 9 reports the signi�cant
data and results from di¤erent gases introduced into the system.
pH was also considered. Anabaena variabilis prefer an environment that is near
physiological pH, 7.4. Due to the small density of cells on electrodes (and the
relatively small output of measurable chemicals produced therein), global pH changes
are not expected as a result of voltammetric analysis. A global pH change may
a¤ect certain reaction centers thus, induce changes to the observed voltammetry.
The protective microenvironment within TMODA Na�on supports high levels of
cellular and enzyme activity [48], but these experiments are not bu¤ered even within
this microenvironment. There may be local pH changes.
Because so many pertinent reactions require electrons and H+ (Figure 1), the
concentration of H+ in the background electrolyte was varied and subsequent CVs
were performed to assess the dependencies. Further, CV data collected in previous
experiments indicated the presence of a redox reaction at potentials < 0.5 V vs.
SCE. Many reactions in the system are thermodynamically accessible at these low
potentials (as will be shown in Tables 13, 14, and 15). It is imperative to study
the large current at this negative potential to understand its role in the evolving
electrochemical model of immobilized A. var. Dissolved H2 or O2 at su¢ cient
concentrations can give rise to voltammetric peaks at negative potentials.
0.1 M Na2SO4 solutions were adjusted to pH = 5, 7, and 9 with dilute HCl and
NaOH. In the control experiment the solutions were not sparged (ambient) and in
119
another each solution was N2 sparged for 10 minutes prior to use. The cells were
immobilized to the glassy carbon electrode after physical and chemical disruption of
the cell wall membranes by sonication and lysozyme treatment of cell suspensions.
This treated suspension was cast onto the electrode surface and allowed to dry in
ambient conditions for 10 minutes. To secure the disrupted cells to the electrode,
TMODA Na�on was applied and dried on top of the cell layer.
Figure 40 shows the CVs obtained at various pH and gaseous conditions. Due
to O2 reduction, the forward potential is usually limited to 0.55 V. In the cyclic
voltammograms in Figure 40, the potential was swept to 1.1 V. At potentials more
negative than 0.5 V, the reduction of oxygen is apparent (Reaction 24).
After sparging with N2, reduction of O2 decreases signi�cantly. Further evidence
is the peak current for the reduction of O2 based on the pH. In ambient solutions,
the pH sensitivity of Reaction 24 is shown clearly in Figure 40. These observations
from the CV overlay in Figure 40 suggest the prominent wave arises due to dissolved
O2
O2 + 4H+ + 4e 2H2O E�
0
pH=7 = �1:1 V vs. SCE (24)
O2 is well known to have poor electron transfer kinetics. Thus, the signi�cant
potential shift for the reduction of O2 is expected. The reduction of O2 is an H+
dependent reaction as well. Thus, changes in measured current can be related to
the change in H+ concentration. Figure 40 shows that as pH increases, the O2 peak
current increases. Kinetics for O2 reactions are generally faster in base. This same
relationship is not observed when the solutions have been purged of most dissolved
O2. These data provide information about the faradaic currents that arise from
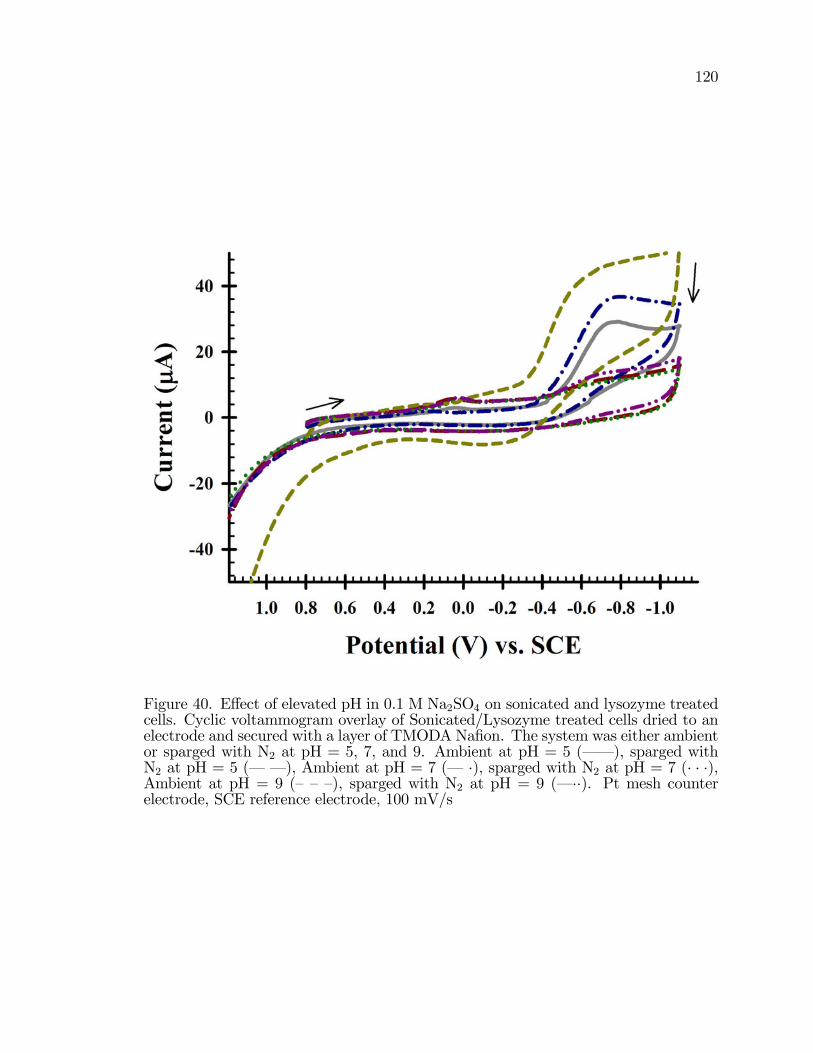
120
Figure 40. E¤ect of elevated pH in 0.1 M Na2SO4 on sonicated and lysozyme treatedcells. Cyclic voltammogram overlay of Sonicated/Lysozyme treated cells dried to anelectrode and secured with a layer of TMODA Na�on. The system was either ambientor sparged with N2 at pH = 5, 7, and 9. Ambient at pH = 5 (� � ), sparged withN2 at pH = 5 (� � ), Ambient at pH = 7 (� �), sparged with N2 at pH = 7 (� � �),Ambient at pH = 9 (���), sparged with N2 at pH = 9 (� ��). Pt mesh counterelectrode, SCE reference electrode, 100 mV/s
121
cells, but the data scale must be adjusted accordingly, as shown in Figure 41
Figure 41 overlays the voltammograms in pH = 5 for the ambient and N2 sparged
cases as in Figure 40, but with current and potential axes expanded to show the
a¤ects on the waves at 0.1 and 0.6 V. When solutions are sparged with N2, the
current peak at 0.1 V is prominent at all pH studied. The magnitude of the peak
current is not statistically di¤erent at pH = 5, 7, or 9. These data show that O2
can a¤ect the faradaic A. var. reductive current. In ambient solutions, pH has a
much greater e¤ect, shifting the potential of the reductive wave from 0.1 V at pH
= 5 to 0.3 V at pH = 7 and 9 as observed in Figure 41. Further, as pH increases,
the current decreases for ambient solutions. The oxidative current is small in this
experiment and challenging to quantify, but is present for all N2 sparged solutions at
the same potential, 0.6 V. These data are also consistent with the minimal e¤ect of
pH on current as measured at electrodejcelljsolution interface. Because the pKa for
NH3 is 9.3, the higher pH solution a¤ected the NH3 measurement. Quanti�cation of
NH3 at pH = 5 and pH = 7 then, were not obtained. These experiments conclude
that O2 strongly impacts faradaic current responses and bulk pH does not.
3.3.5 Suppression of Nitrogenase and Nitrate/NitriteReductase Speci�c Analyses
Cells cultured on BG-110 medium lacking any source of �xed (reduced) nitrogen
results in nitrogen starvation. Nitrogen starvation in Anabaena variabilis elicits
a genetic response to develop heterocysts and produce ammonia by nitrogenase
contained within the heterocysts. Thus, under starvation conditions, nitrogenase
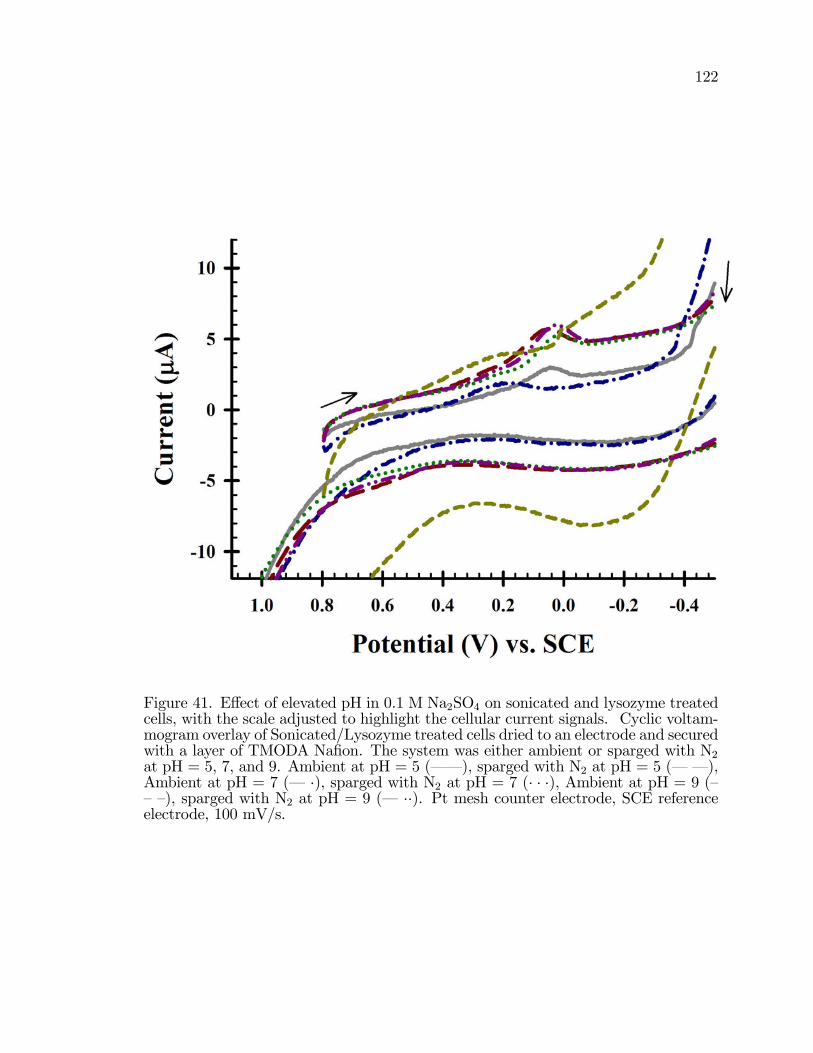
122
Figure 41. E¤ect of elevated pH in 0.1 M Na2SO4 on sonicated and lysozyme treatedcells, with the scale adjusted to highlight the cellular current signals. Cyclic voltam-mogram overlay of Sonicated/Lysozyme treated cells dried to an electrode and securedwith a layer of TMODA Na�on. The system was either ambient or sparged with N2at pH = 5, 7, and 9. Ambient at pH = 5 (� � ), sparged with N2 at pH = 5 (� � ),Ambient at pH = 7 (� �), sparged with N2 at pH = 7 (� � �), Ambient at pH = 9 (���), sparged with N2 at pH = 9 (� ��). Pt mesh counter electrode, SCE referenceelectrode, 100 mV/s.
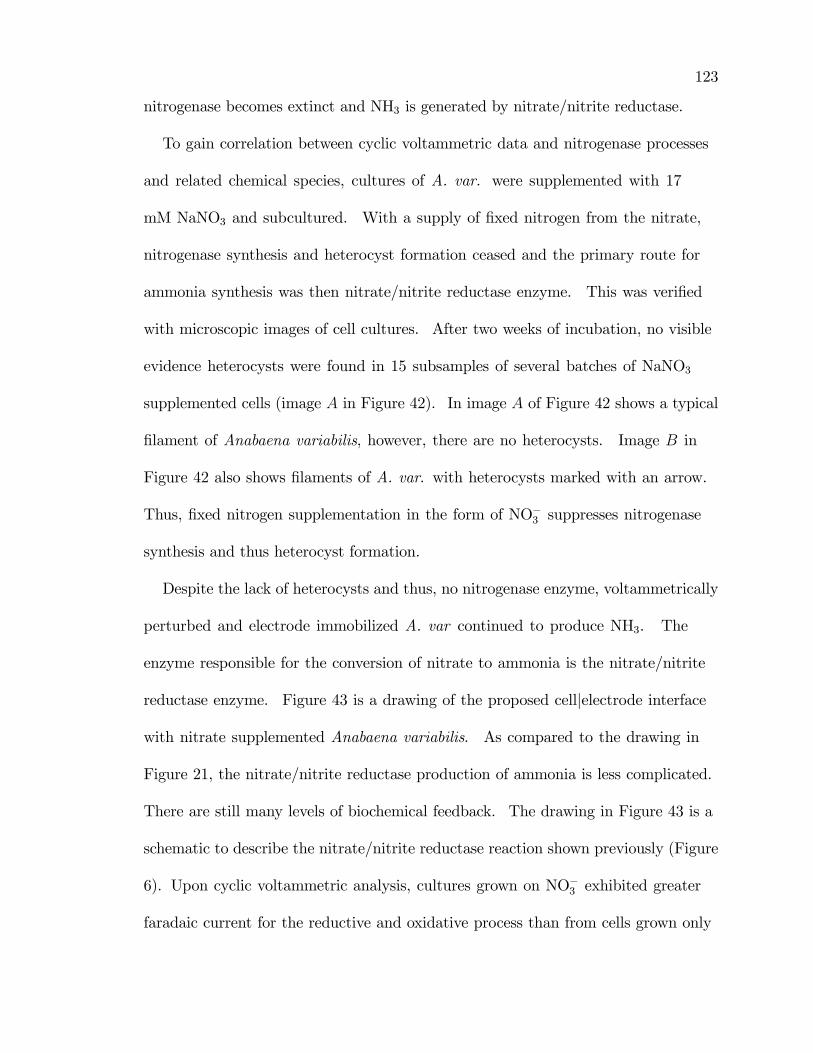
123
nitrogenase becomes extinct and NH3 is generated by nitrate/nitrite reductase.
To gain correlation between cyclic voltammetric data and nitrogenase processes
and related chemical species, cultures of A. var. were supplemented with 17
mM NaNO3 and subcultured. With a supply of �xed nitrogen from the nitrate,
nitrogenase synthesis and heterocyst formation ceased and the primary route for
ammonia synthesis was then nitrate/nitrite reductase enzyme. This was veri�ed
with microscopic images of cell cultures. After two weeks of incubation, no visible
evidence heterocysts were found in 15 subsamples of several batches of NaNO3
supplemented cells (image A in Figure 42). In image A of Figure 42 shows a typical
�lament of Anabaena variabilis, however, there are no heterocysts. Image B in
Figure 42 also shows �laments of A. var. with heterocysts marked with an arrow.
Thus, �xed nitrogen supplementation in the form of NO�3 suppresses nitrogenase
synthesis and thus heterocyst formation.
Despite the lack of heterocysts and thus, no nitrogenase enzyme, voltammetrically
perturbed and electrode immobilized A. var continued to produce NH3. The
enzyme responsible for the conversion of nitrate to ammonia is the nitrate/nitrite
reductase enzyme. Figure 43 is a drawing of the proposed celljelectrode interface
with nitrate supplemented Anabaena variabilis. As compared to the drawing in
Figure 21, the nitrate/nitrite reductase production of ammonia is less complicated.
There are still many levels of biochemical feedback. The drawing in Figure 43 is a
schematic to describe the nitrate/nitrite reductase reaction shown previously (Figure
6). Upon cyclic voltammetric analysis, cultures grown on NO�3 exhibited greater
faradaic current for the reductive and oxidative process than from cells grown only
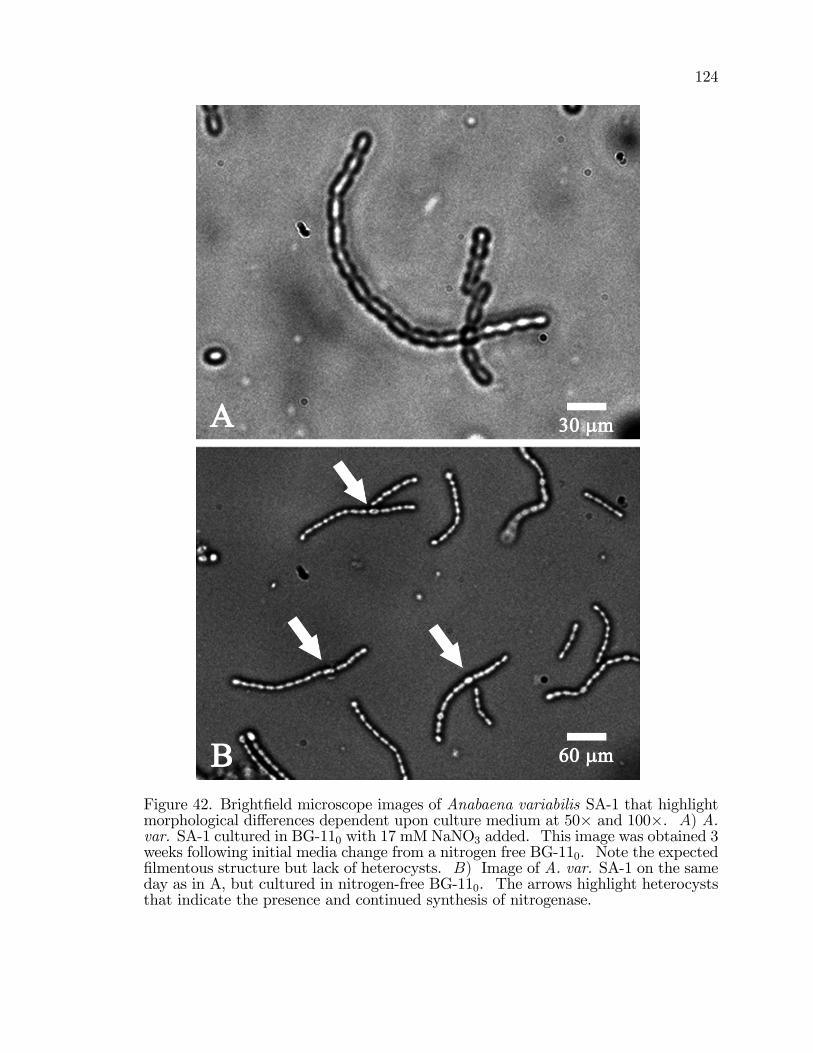
124
Figure 42. Bright�eld microscope images of Anabaena variabilis SA-1 that highlightmorphological di¤erences dependent upon culture medium at 50� and 100�. A) A.var. SA-1 cultured in BG-110 with 17 mM NaNO3 added. This image was obtained 3weeks following initial media change from a nitrogen free BG-110. Note the expected�lmentous structure but lack of heterocysts. B) Image of A. var. SA-1 on the sameday as in A, but cultured in nitrogen-free BG-110. The arrows highlight heterocyststhat indicate the presence and continued synthesis of nitrogenase.
125
Figure 43. Drawn representation of the species and reaction centers involved in NH+4production by nitrate/nitrite reductase at an electrode. Similar to Figure 21with the heterocysts and nitrogenase dependent reactions removed. NRE = ni-trate/nitrite reductase enzyme. 1) Vegetative cell of Anabaena variabilis; 6) NADP�Ferredoxin oxioreductase enzyme catalyzes the redox state of NADPH/NADP+ andFereduced=Fdoxidized; 7) Glassy carbon working electrode submerged in electrolyte; and8) 10 �m thick TMODA-Na�on immobilization polymer. Chemicals represented areC) NO�3 ; D) NO
�2 ; F ) NH
+4 ; G) reduced Nicotinamide adenine phosphate (NADPH);
H) Oxidized nicotinamide adenine phosphate (NADP+); K) Reduced ferredoxin,Fe(II) complex; and J) Oxidized ferredoxin, Fe(III) complex.
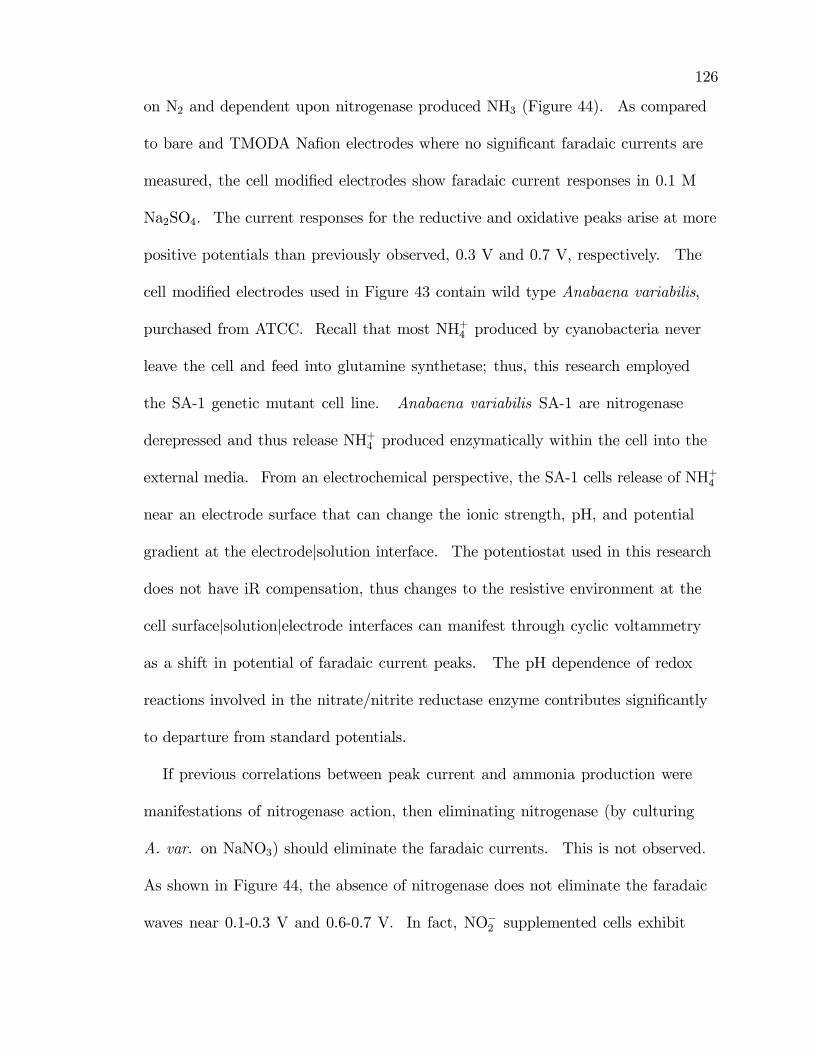
126
on N2 and dependent upon nitrogenase produced NH3 (Figure 44). As compared
to bare and TMODA Na�on electrodes where no signi�cant faradaic currents are
measured, the cell modi�ed electrodes show faradaic current responses in 0.1 M
Na2SO4. The current responses for the reductive and oxidative peaks arise at more
positive potentials than previously observed, 0.3 V and 0.7 V, respectively. The
cell modi�ed electrodes used in Figure 43 contain wild type Anabaena variabilis,
purchased from ATCC. Recall that most NH+4 produced by cyanobacteria never
leave the cell and feed into glutamine synthetase; thus, this research employed
the SA-1 genetic mutant cell line. Anabaena variabilis SA-1 are nitrogenase
derepressed and thus release NH+4 produced enzymatically within the cell into the
external media. From an electrochemical perspective, the SA-1 cells release of NH+4
near an electrode surface that can change the ionic strength, pH, and potential
gradient at the electrodejsolution interface. The potentiostat used in this research
does not have iR compensation, thus changes to the resistive environment at the
cell surfacejsolutionjelectrode interfaces can manifest through cyclic voltammetry
as a shift in potential of faradaic current peaks. The pH dependence of redox
reactions involved in the nitrate/nitrite reductase enzyme contributes signi�cantly
to departure from standard potentials.
If previous correlations between peak current and ammonia production were
manifestations of nitrogenase action, then eliminating nitrogenase (by culturing
A. var. on NaNO3) should eliminate the faradaic currents. This is not observed.
As shown in Figure 44, the absence of nitrogenase does not eliminate the faradaic
waves near 0.1-0.3 V and 0.6-0.7 V. In fact, NO�2 supplemented cells exhibit
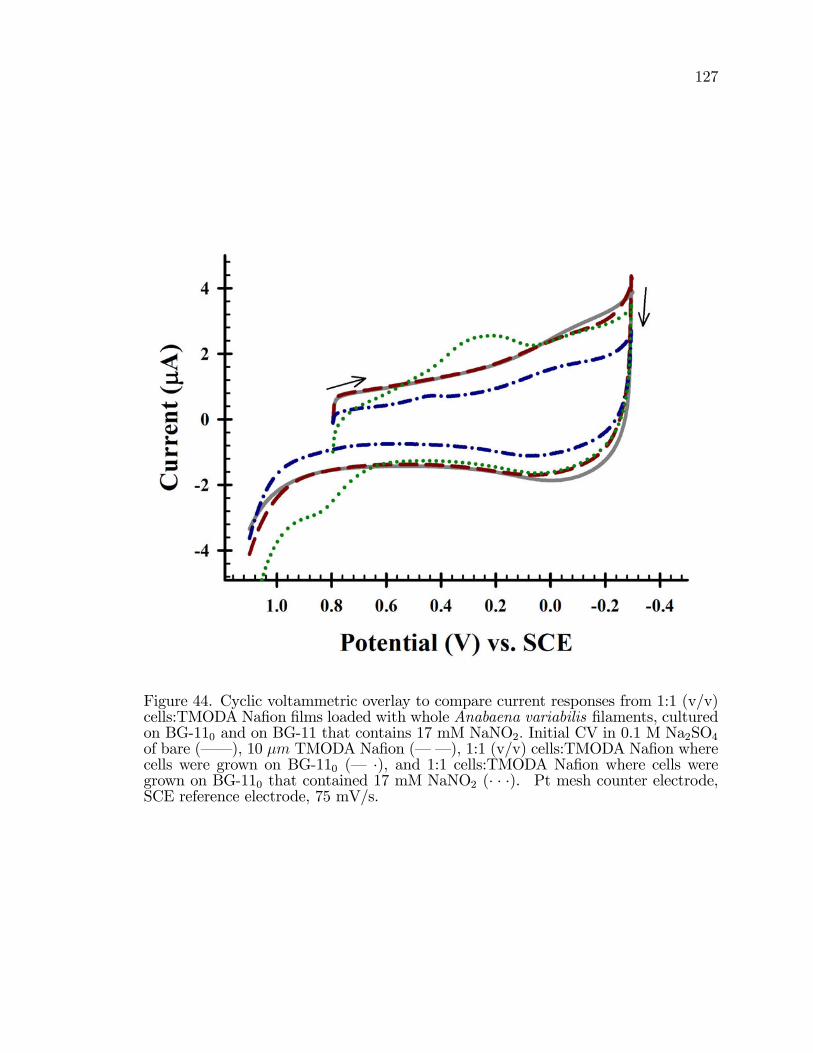
127
Figure 44. Cyclic voltammetric overlay to compare current responses from 1:1 (v/v)cells:TMODA Na�on �lms loaded with whole Anabaena variabilis �laments, culturedon BG-110 and on BG-11 that contains 17 mM NaNO2: Initial CV in 0.1 M Na2SO4of bare (� � ), 10 �m TMODA Na�on (� � ), 1:1 (v/v) cells:TMODA Na�on wherecells were grown on BG-110 (� �), and 1:1 cells:TMODA Na�on where cells weregrown on BG-110 that contained 17 mM NaNO2 (� � �). Pt mesh counter electrode,SCE reference electrode, 75 mV/s.
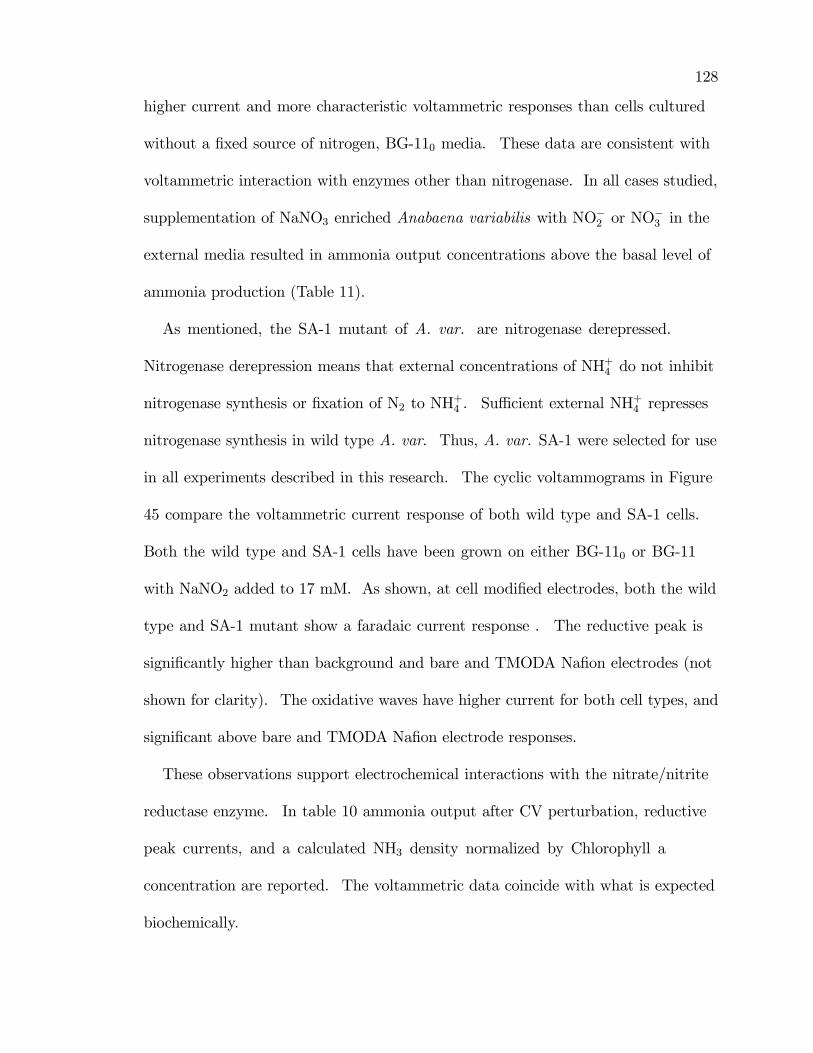
128
higher current and more characteristic voltammetric responses than cells cultured
without a �xed source of nitrogen, BG-110 media. These data are consistent with
voltammetric interaction with enzymes other than nitrogenase. In all cases studied,
supplementation of NaNO3 enriched Anabaena variabilis with NO�2 or NO�3 in the
external media resulted in ammonia output concentrations above the basal level of
ammonia production (Table 11).
As mentioned, the SA-1 mutant of A. var. are nitrogenase derepressed.
Nitrogenase derepression means that external concentrations of NH+4 do not inhibit
nitrogenase synthesis or �xation of N2 to NH+4 . Su¢ cient external NH+4 represses
nitrogenase synthesis in wild type A. var. Thus, A. var. SA-1 were selected for use
in all experiments described in this research. The cyclic voltammograms in Figure
45 compare the voltammetric current response of both wild type and SA-1 cells.
Both the wild type and SA-1 cells have been grown on either BG-110 or BG-11
with NaNO2 added to 17 mM. As shown, at cell modi�ed electrodes, both the wild
type and SA-1 mutant show a faradaic current response . The reductive peak is
signi�cantly higher than background and bare and TMODA Na�on electrodes (not
shown for clarity). The oxidative waves have higher current for both cell types, and
signi�cant above bare and TMODA Na�on electrode responses.
These observations support electrochemical interactions with the nitrate/nitrite
reductase enzyme. In table 10 ammonia output after CV perturbation, reductive
peak currents, and a calculated NH3 density normalized by Chlorophyll a
concentration are reported. The voltammetric data coincide with what is expected
biochemically.
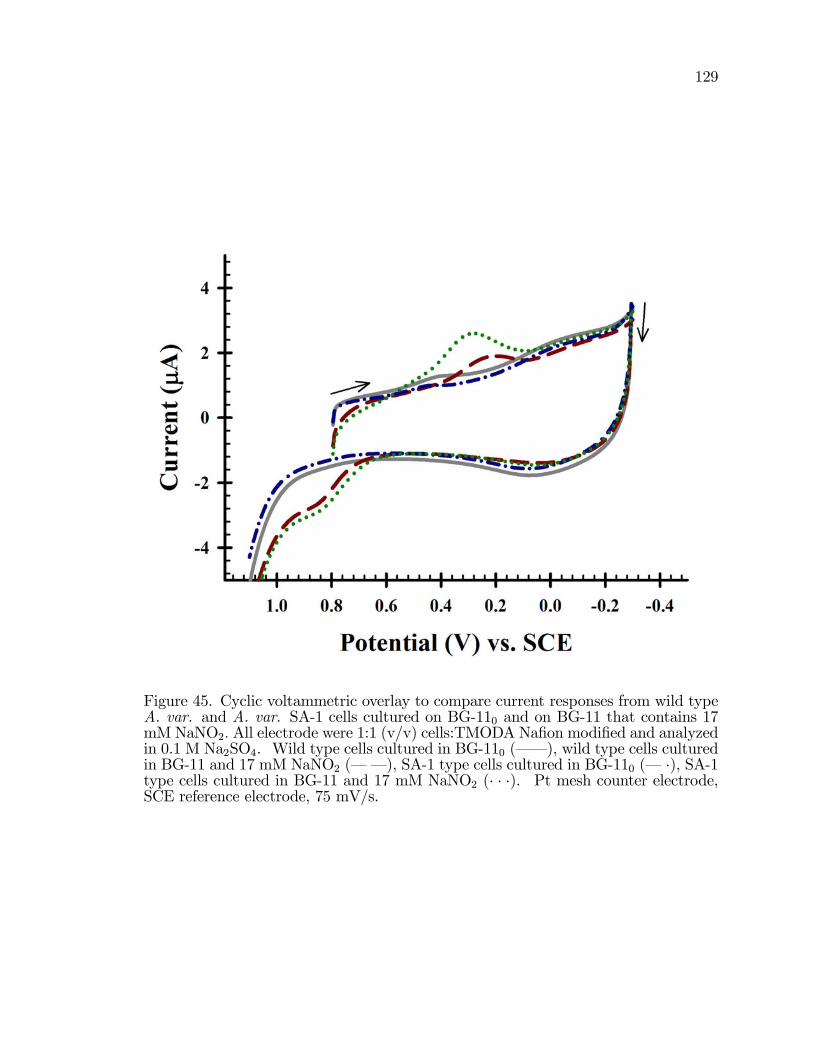
129
Figure 45. Cyclic voltammetric overlay to compare current responses from wild typeA. var. and A. var. SA-1 cells cultured on BG-110 and on BG-11 that contains 17mM NaNO2: All electrode were 1:1 (v/v) cells:TMODA Na�on modi�ed and analyzedin 0.1 M Na2SO4. Wild type cells cultured in BG-110 (� � ), wild type cells culturedin BG-11 and 17 mM NaNO2 (� � ), SA-1 type cells cultured in BG-110 (� �), SA-1type cells cultured in BG-11 and 17 mM NaNO2 (� � �). Pt mesh counter electrode,SCE reference electrode, 75 mV/s.
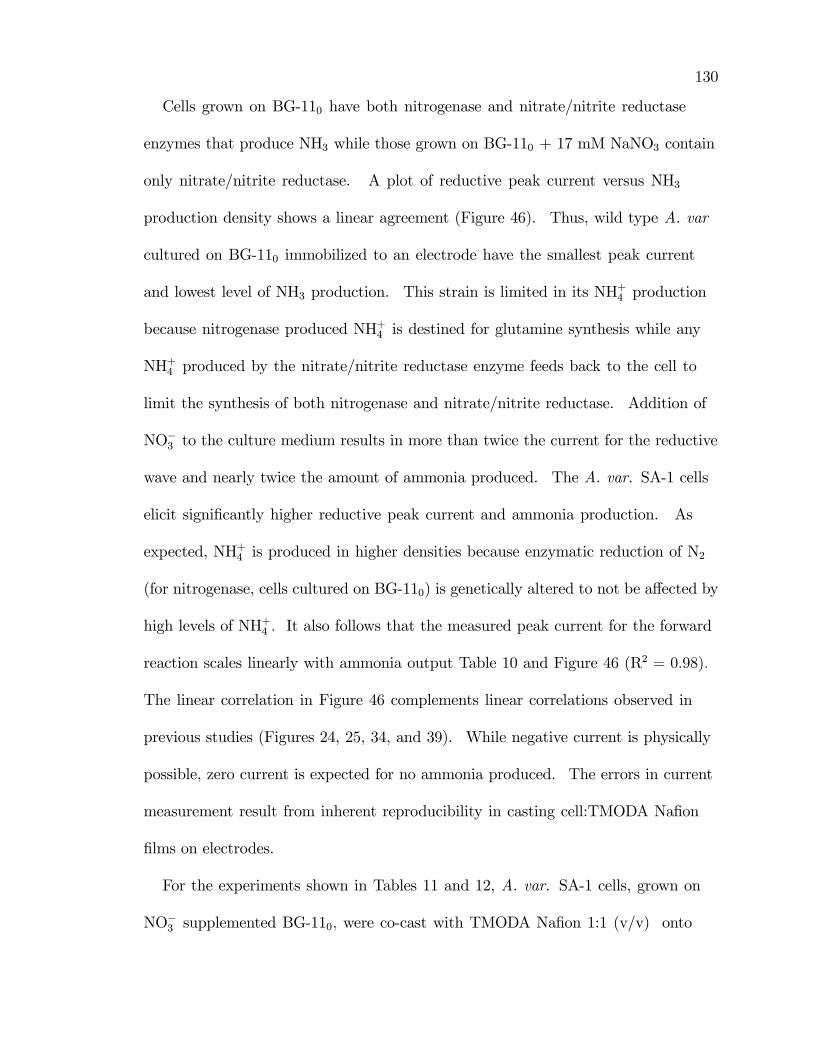
130
Cells grown on BG-110 have both nitrogenase and nitrate/nitrite reductase
enzymes that produce NH3 while those grown on BG-110 + 17 mM NaNO3 contain
only nitrate/nitrite reductase. A plot of reductive peak current versus NH3
production density shows a linear agreement (Figure 46). Thus, wild type A. var
cultured on BG-110 immobilized to an electrode have the smallest peak current
and lowest level of NH3 production. This strain is limited in its NH+4 production
because nitrogenase produced NH+4 is destined for glutamine synthesis while any
NH+4 produced by the nitrate/nitrite reductase enzyme feeds back to the cell to
limit the synthesis of both nitrogenase and nitrate/nitrite reductase. Addition of
NO�3 to the culture medium results in more than twice the current for the reductive
wave and nearly twice the amount of ammonia produced. The A. var. SA-1 cells
elicit signi�cantly higher reductive peak current and ammonia production. As
expected, NH+4 is produced in higher densities because enzymatic reduction of N2
(for nitrogenase, cells cultured on BG-110) is genetically altered to not be a¤ected by
high levels of NH+4 : It also follows that the measured peak current for the forward
reaction scales linearly with ammonia output Table 10 and Figure 46 (R2 = 0:98):
The linear correlation in Figure 46 complements linear correlations observed in
previous studies (Figures 24, 25, 34, and 39). While negative current is physically
possible, zero current is expected for no ammonia produced. The errors in current
measurement result from inherent reproducibility in casting cell:TMODA Na�on
�lms on electrodes.
For the experiments shown in Tables 11 and 12, A. var. SA-1 cells, grown on
NO�3 supplemented BG-110; were co-cast with TMODA Na�on 1:1 (v/v) onto
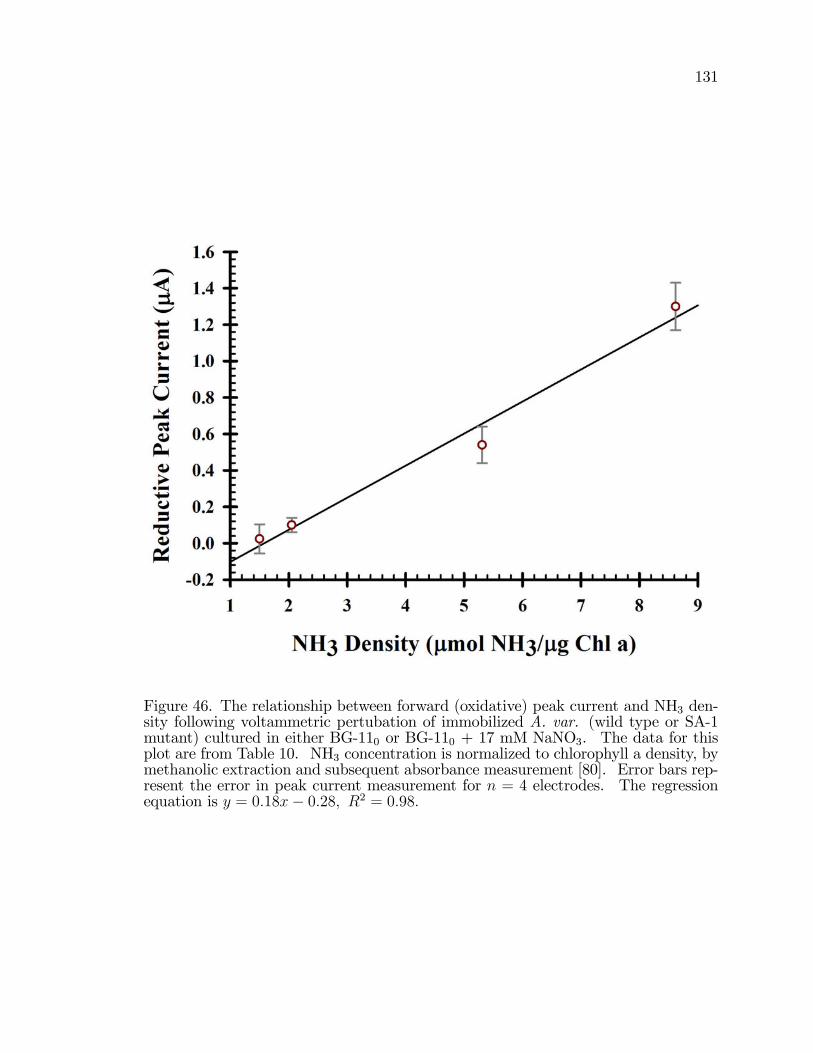
131
Figure 46. The relationship between forward (oxidative) peak current and NH3 den-sity following voltammetric pertubation of immobilized A. var. (wild type or SA-1mutant) cultured in either BG-110 or BG-110 + 17 mM NaNO3. The data for thisplot are from Table 10. NH3 concentration is normalized to chlorophyll a density, bymethanolic extraction and subsequent absorbance measurement [80]. Error bars rep-resent the error in peak current measurement for n = 4 electrodes. The regressionequation is y = 0:18x� 0:28; R2 = 0:98:
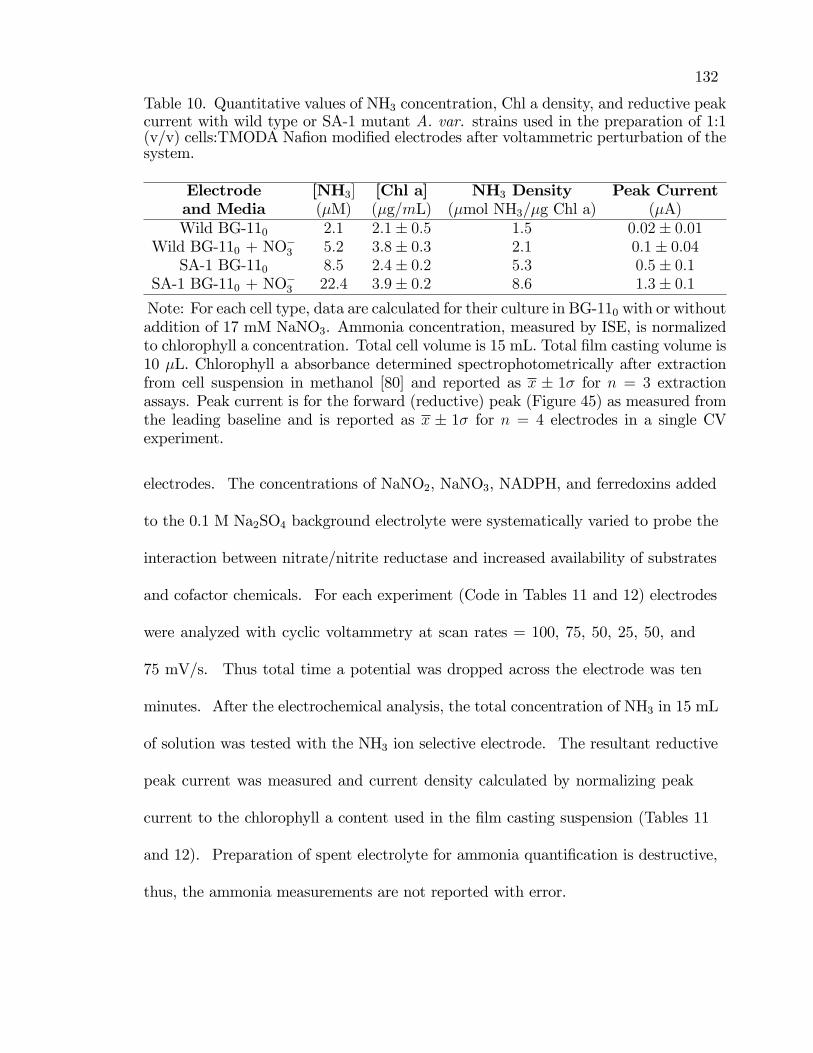
132
Table 10. Quantitative values of NH3 concentration, Chl a density, and reductive peakcurrent with wild type or SA-1 mutant A. var. strains used in the preparation of 1:1(v/v) cells:TMODA Na�on modi�ed electrodes after voltammetric perturbation of thesystem.
Electrode [NH3] [Chl a] NH3 Density Peak Currentand Media (�M) (�g=mL) (�mol NH3/�g Chl a) (�A)Wild BG-110 2:1 2:1� 0:5 1:5 0:02� 0:01
Wild BG-110 + NO�3 5:2 3:8� 0:3 2:1 0:1� 0:04SA-1 BG-110 8:5 2:4� 0:2 5:3 0:5� 0:1
SA-1 BG-110 + NO�3 22:4 3:9� 0:2 8:6 1:3� 0:1Note: For each cell type, data are calculated for their culture in BG-110 with or withoutaddition of 17 mM NaNO3. Ammonia concentration, measured by ISE, is normalizedto chlorophyll a concentration. Total cell volume is 15 mL. Total �lm casting volume is10 �L. Chlorophyll a absorbance determined spectrophotometrically after extractionfrom cell suspension in methanol [80] and reported as x � 1� for n = 3 extractionassays. Peak current is for the forward (reductive) peak (Figure 45) as measured fromthe leading baseline and is reported as x � 1� for n = 4 electrodes in a single CVexperiment.
electrodes. The concentrations of NaNO2, NaNO3, NADPH, and ferredoxins added
to the 0.1 M Na2SO4 background electrolyte were systematically varied to probe the
interaction between nitrate/nitrite reductase and increased availability of substrates
and cofactor chemicals. For each experiment (Code in Tables 11 and 12) electrodes
were analyzed with cyclic voltammetry at scan rates = 100, 75, 50, 25, 50, and
75 mV/s. Thus total time a potential was dropped across the electrode was ten
minutes. After the electrochemical analysis, the total concentration of NH3 in 15 mL
of solution was tested with the NH3 ion selective electrode. The resultant reductive
peak current was measured and current density calculated by normalizing peak
current to the chlorophyll a content used in the �lm casting suspension (Tables 11
and 12). Preparation of spent electrolyte for ammonia quanti�cation is destructive,
thus, the ammonia measurements are not reported with error.
133
In lieu of presenting cyclic voltammograms, the raw data are su¢ cient to see that
ammonia production and current densities are high compared to experiments where
A. var. SA-1 were starved of nitrogen and dependent primarily upon nitrogenase
for ammonia synthesis. In all experiments, the ammonia production density was
higher than for the control (Code N in Tables 11 and 12). Further, all experiments
in which NADPH was supplemented to the electrolyte, ammonia production was
signi�cantly higher than control.
The NH3 production data from NO�2 and NO�3 additions alone, while higher
in ammonia production and reductive peak current than control, do not follow
a systematic pattern. It is reasonable to assume that increasing substrate
concentration and availability to the enzyme would increase its activity, however it
must be more complex than that. Possibilities and a kinetic model framework are
presented in Chapter 4.
Data from Table 12 were used to estimate the correlation between the forward
reduction wave and the ammonia density measured after voltammetric perturbation.
In a plot of peak current versus ammonia density, a linear relationship with
a near zero intercept resulted (Figure 47). The resultant linear regression is
y = 0:06x + 0:07; R2 = 0:91: These data continue to support other observations
that peak current varies linearly with ammonia production by A. var.
Early in this research, �asks of cells were subjected to two chemicals, methionine
D,L sulfoximine (MSX), which blocks the reuptake of NH+4 and NaNO2. Many
researchers measure increased and sustained production of ammonia and hydrogen
by cyanobacteria through the use of these chemicals [11, 64, 79, 92, 93, 121]. MSX
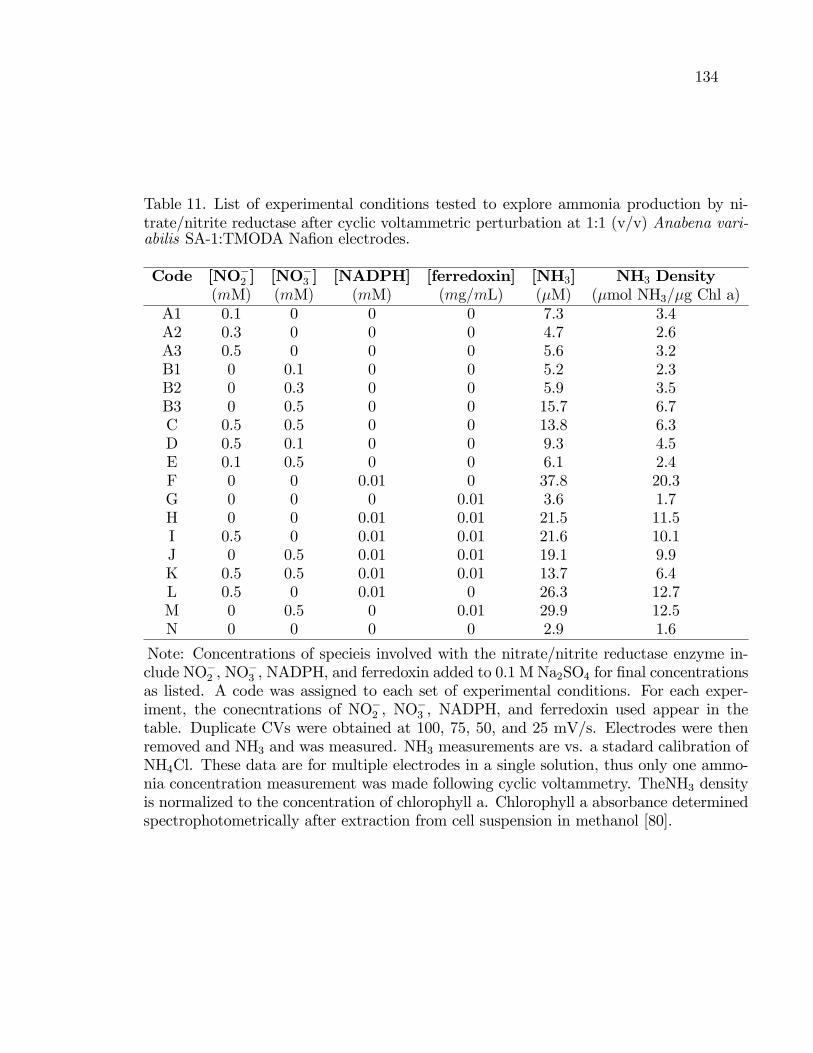
134
Table 11. List of experimental conditions tested to explore ammonia production by ni-trate/nitrite reductase after cyclic voltammetric perturbation at 1:1 (v/v) Anabena vari-abilis SA-1:TMODA Na�on electrodes.
Code [NO�2 ] [NO�
3 ] [NADPH] [ferredoxin] [NH3] NH3 Density(mM) (mM) (mM) (mg=mL) (�M) (�mol NH3=�g Chl a)
A1 0.1 0 0 0 7.3 3.4A2 0.3 0 0 0 4.7 2.6A3 0.5 0 0 0 5.6 3.2B1 0 0.1 0 0 5.2 2.3B2 0 0.3 0 0 5.9 3.5B3 0 0.5 0 0 15.7 6.7C 0.5 0.5 0 0 13.8 6.3D 0.5 0.1 0 0 9.3 4.5E 0.1 0.5 0 0 6.1 2.4F 0 0 0.01 0 37.8 20.3G 0 0 0 0.01 3.6 1.7H 0 0 0.01 0.01 21.5 11.5I 0.5 0 0.01 0.01 21.6 10.1J 0 0.5 0.01 0.01 19.1 9.9K 0.5 0.5 0.01 0.01 13.7 6.4L 0.5 0 0.01 0 26.3 12.7M 0 0.5 0 0.01 29.9 12.5N 0 0 0 0 2.9 1.6
Note: Concentrations of specieis involved with the nitrate/nitrite reductase enzyme in-clude NO�2 , NO
�3 , NADPH, and ferredoxin added to 0.1 M Na2SO4 for �nal concentrations
as listed. A code was assigned to each set of experimental conditions. For each exper-iment, the conecntrations of NO�2 , NO
�3 , NADPH, and ferredoxin used appear in the
table. Duplicate CVs were obtained at 100, 75, 50, and 25 mV/s. Electrodes were thenremoved and NH3 and was measured. NH3 measurements are vs. a stadard calibration ofNH4Cl. These data are for multiple electrodes in a single solution, thus only one ammo-nia concentration measurement was made following cyclic voltammetry. TheNH3 densityis normalized to the concentration of chlorophyll a. Chlorophyll a absorbance determinedspectrophotometrically after extraction from cell suspension in methanol [80].
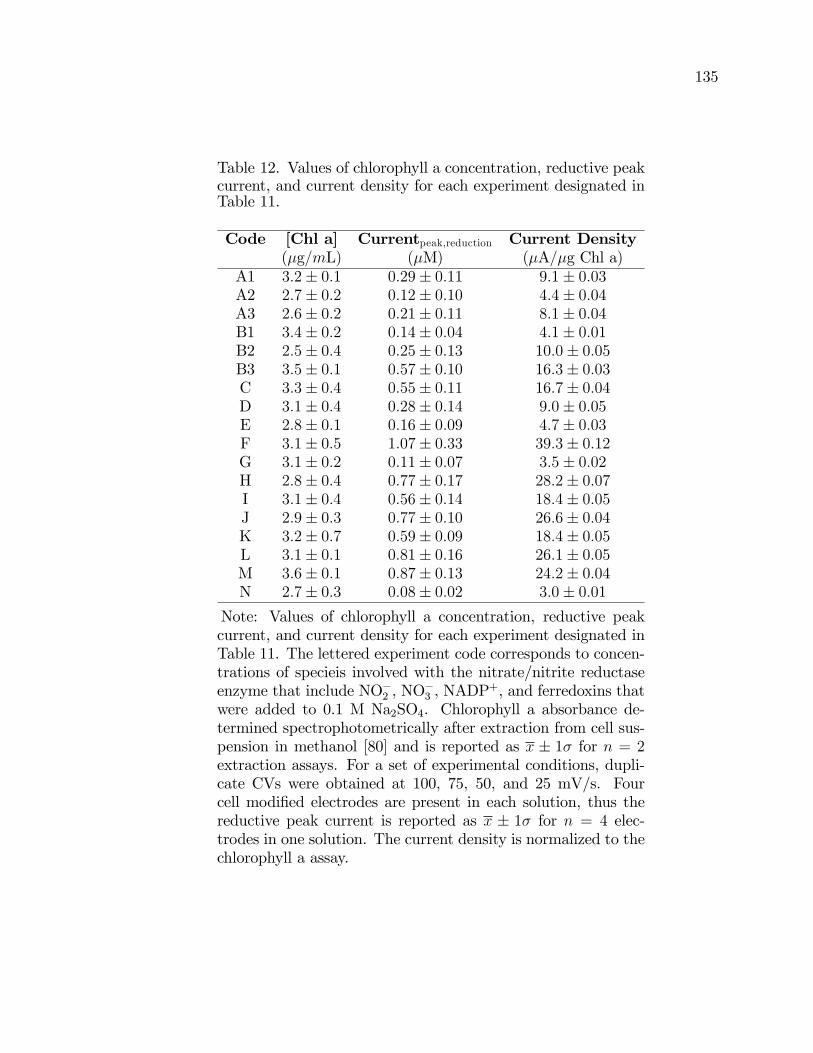
135
Table 12. Values of chlorophyll a concentration, reductive peakcurrent, and current density for each experiment designated inTable 11.
Code [Chl a] Currentpeak,reduction Current Density(�g=mL) (�M) (�A=�g Chl a)
A1 3:2� 0:1 0:29� 0:11 9:1� 0:03A2 2:7� 0:2 0:12� 0:10 4:4� 0:04A3 2:6� 0:2 0:21� 0:11 8:1� 0:04B1 3:4� 0:2 0:14� 0:04 4:1� 0:01B2 2:5� 0:4 0:25� 0:13 10:0� 0:05B3 3:5� 0:1 0:57� 0:10 16:3� 0:03C 3:3� 0:4 0:55� 0:11 16:7� 0:04D 3:1� 0:4 0:28� 0:14 9:0� 0:05E 2:8� 0:1 0:16� 0:09 4:7� 0:03F 3:1� 0:5 1:07� 0:33 39:3� 0:12G 3:1� 0:2 0:11� 0:07 3:5� 0:02H 2:8� 0:4 0:77� 0:17 28:2� 0:07I 3:1� 0:4 0:56� 0:14 18:4� 0:05J 2:9� 0:3 0:77� 0:10 26:6� 0:04K 3:2� 0:7 0:59� 0:09 18:4� 0:05L 3:1� 0:1 0:81� 0:16 26:1� 0:05M 3:6� 0:1 0:87� 0:13 24:2� 0:04N 2:7� 0:3 0:08� 0:02 3:0� 0:01
Note: Values of chlorophyll a concentration, reductive peakcurrent, and current density for each experiment designated inTable 11. The lettered experiment code corresponds to concen-trations of specieis involved with the nitrate/nitrite reductaseenzyme that include NO�2 , NO
�3 , NADP
+, and ferredoxins thatwere added to 0.1 M Na2SO4. Chlorophyll a absorbance de-termined spectrophotometrically after extraction from cell sus-pension in methanol [80] and is reported as x � 1� for n = 2extraction assays. For a set of experimental conditions, dupli-cate CVs were obtained at 100, 75, 50, and 25 mV/s. Fourcell modi�ed electrodes are present in each solution, thus thereductive peak current is reported as x � 1� for n = 4 elec-trodes in one solution. The current density is normalized to thechlorophyll a assay.
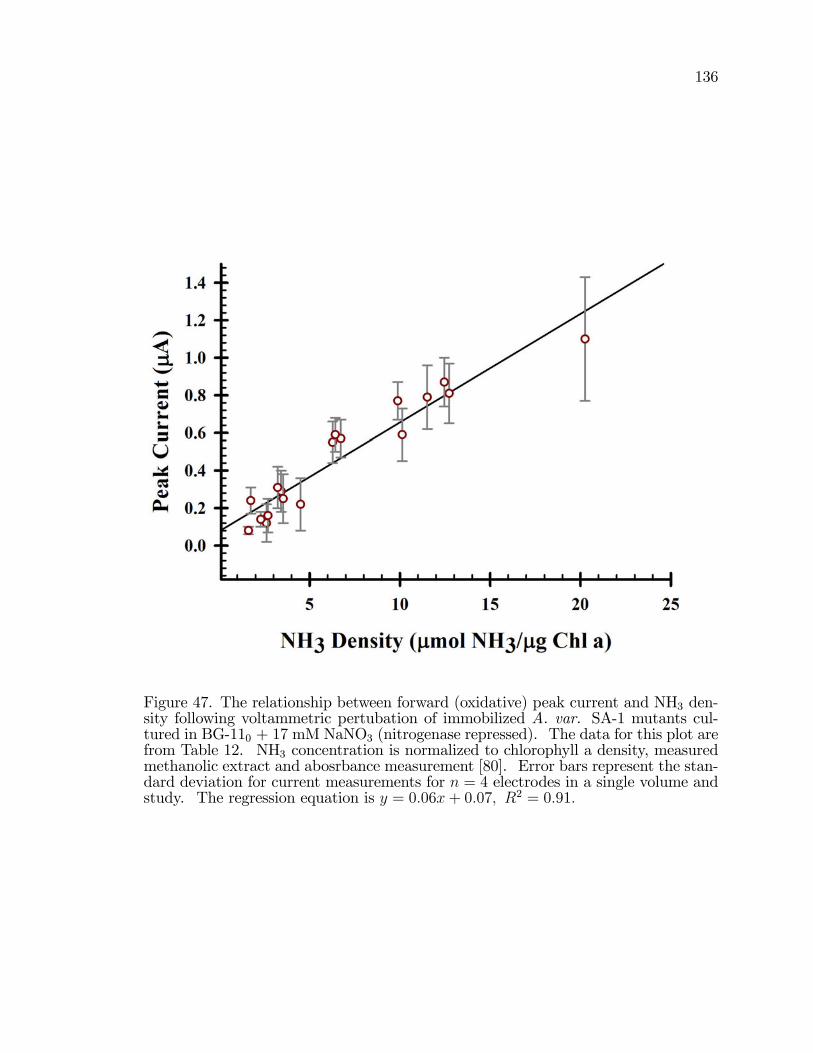
136
Figure 47. The relationship between forward (oxidative) peak current and NH3 den-sity following voltammetric pertubation of immobilized A. var. SA-1 mutants cul-tured in BG-110 + 17 mM NaNO3 (nitrogenase repressed). The data for this plot arefrom Table 12. NH3 concentration is normalized to chlorophyll a density, measuredmethanolic extract and abosrbance measurement [80]. Error bars represent the stan-dard deviation for current measurements for n = 4 electrodes in a single volume andstudy. The regression equation is y = 0:06x+ 0:07; R2 = 0:91:
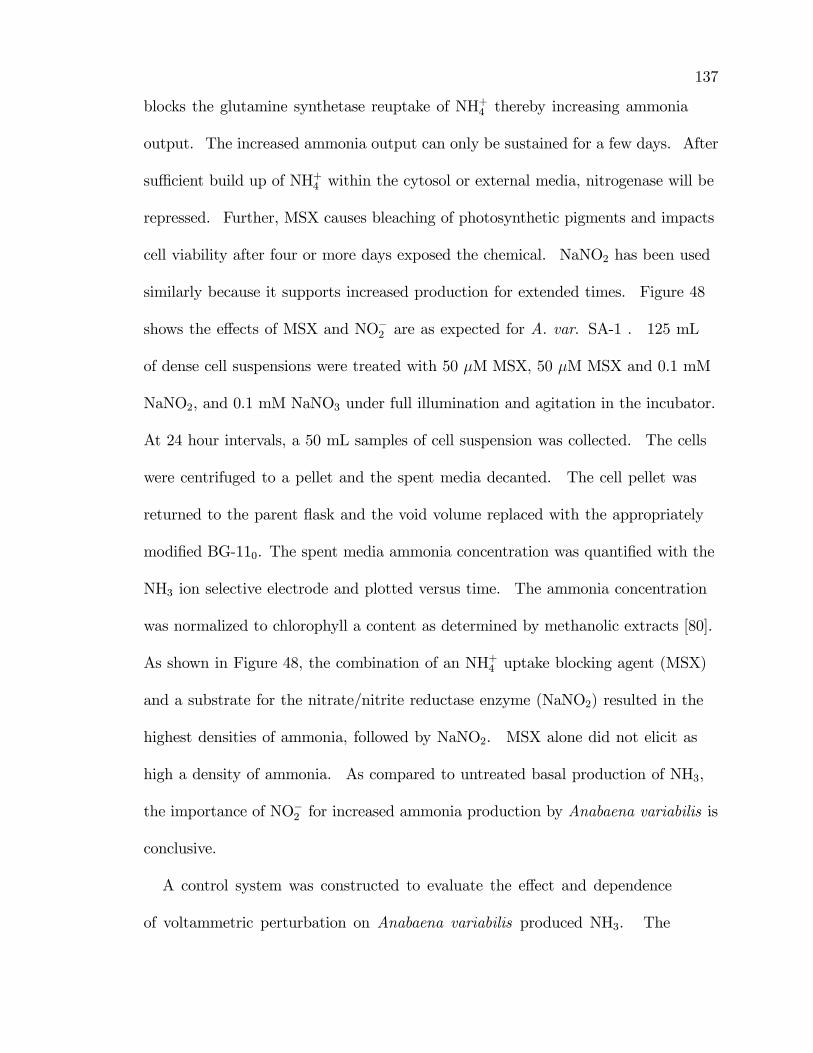
137
blocks the glutamine synthetase reuptake of NH+4 thereby increasing ammonia
output. The increased ammonia output can only be sustained for a few days. After
su¢ cient build up of NH+4 within the cytosol or external media, nitrogenase will be
repressed. Further, MSX causes bleaching of photosynthetic pigments and impacts
cell viability after four or more days exposed the chemical. NaNO2 has been used
similarly because it supports increased production for extended times. Figure 48
shows the e¤ects of MSX and NO�2 are as expected for A. var. SA-1 . 125 mL
of dense cell suspensions were treated with 50 �M MSX, 50 �M MSX and 0.1 mM
NaNO2, and 0.1 mM NaNO3 under full illumination and agitation in the incubator.
At 24 hour intervals, a 50 mL samples of cell suspension was collected. The cells
were centrifuged to a pellet and the spent media decanted. The cell pellet was
returned to the parent �ask and the void volume replaced with the appropriately
modi�ed BG-110. The spent media ammonia concentration was quanti�ed with the
NH3 ion selective electrode and plotted versus time. The ammonia concentration
was normalized to chlorophyll a content as determined by methanolic extracts [80].
As shown in Figure 48, the combination of an NH+4 uptake blocking agent (MSX)
and a substrate for the nitrate/nitrite reductase enzyme (NaNO2) resulted in the
highest densities of ammonia, followed by NaNO2. MSX alone did not elicit as
high a density of ammonia. As compared to untreated basal production of NH3,
the importance of NO�2 for increased ammonia production by Anabaena variabilis is
conclusive.
A control system was constructed to evaluate the e¤ect and dependence
of voltammetric perturbation on Anabaena variabilis produced NH3. The
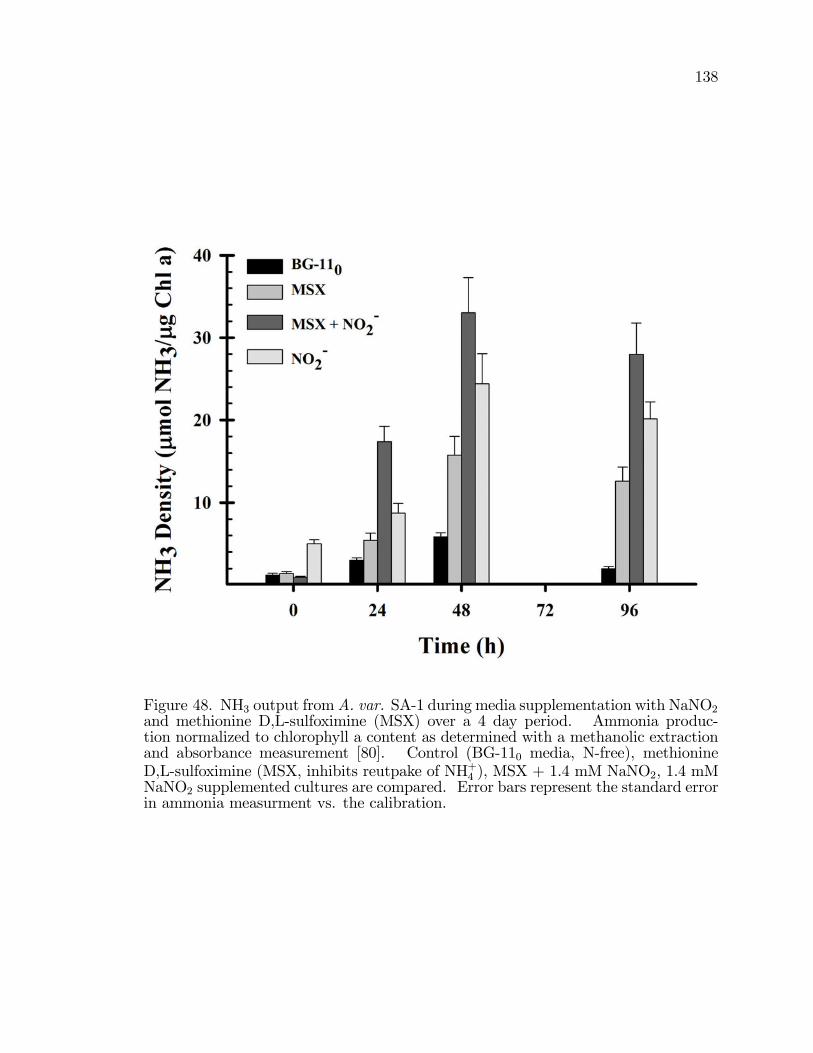
138
Figure 48. NH3 output fromA. var. SA-1 during media supplementation with NaNO2and methionine D,L-sulfoximine (MSX) over a 4 day period. Ammonia produc-tion normalized to chlorophyll a content as determined with a methanolic extractionand absorbance measurement [80]. Control (BG-110 media, N-free), methionineD,L-sulfoximine (MSX, inhibits reutpake of NH+4 ), MSX + 1.4 mM NaNO2, 1.4 mMNaNO2 supplemented cultures are compared. Error bars represent the standard errorin ammonia measurment vs. the calibration.
139
electrochemical cell was setup in the same manner described throughout Chapter 3.
Eight working electrodes of which two were bare, two were modi�ed with TMODA
Na�on, and four were modi�ed with 1:1 (v/v) cells:TMODA Na�on were prepared
and equilibrated into 15 mL of 0.1 M Na2SO4 to which NADPH was added to 1 mM
and ferredoxins were added to 1 mM as in Figure 33 and 37. The cells used in the
�lm were grown on BG-110 containing 17 mM NaNO3. After 10 minutes without
applying a potential gradient, the electrodes were removed and the concentration
of NH3 measured. Note, 10 minutes is the same amount of time used during
cyclic voltammetry and corresponds to the time a potential is applied. 2:5� 1 �M
NH3 was measured in the solution. When the same system was subject to cyclic
voltammetry, 21.5 �M NH3 was measured as shown in Table 11. This observation
suggests that applied potential is required to produce increased NH3: Cells that
were subjected to cycled potential produced a ten-fold increase in NH3, all other
parameters and conditions equal. Ammonia production by the bioelectrocatalytic
device requires an externally applied driving force. Chapter 4 presents a simpli�ed
mechanistic model for ammonia production by the nitrate/nitrite reductase enzyme.
3.4 Summary
Upon consideration of all data collected and analyzed, direct electron transfer
between electrode and enzyme is not apparent. This is consistent with the
nitrogenase buried within the heterocysts of Anabaena variabilis where the enzyme
is too remote from the electrode surface to allow direct electron transfer. It is
approximated that the distance for electron transfer from the electrode to a species
140
in solution � 1 nm. The cells are several microns and the enzymes are not bound
near the cell wall because the cells are prokaryotic, thus enzyme location within the
cell is not constant. This suggests that the conversion of dinitrogen to ammonia or
other nitrogen containing species will be achieved through either introduction of an
appropriate mediator or by disruption of the cell membranes such that the enzymes
are able to contact directly the electrode and direct electron transfer is possible.
Species explored include known nitrogenase mediating and cofactor species. The
results in Table 9 contributed to the body of data that suggested nitrogenase was
not being probed directly. Data with nitrogen species like NO�2 , NO�3 , and NH
+4
had signi�cant e¤ects on the voltammetry and ammonia output.
The overarching electrochemical focus has been to determine what is present at cell
modi�ed electrodes that is electroactive. Many chemical and environmental variables
such as air gases, possible mediating chemical species, and pH were examined in this
research. The electrochemical activity has demonstrated dependence upon chemical
constituents and environmental variables including species generated by the partially
reduced dinitrogen, nitrogen containing species, and the addition of chemicals
normally present in vivo. There exists linear correlations between electrochemical
peak currents from cell modi�ed electrodes and the density of ammonia produced
under voltammetric perturbation.
By subjecting the cell immobilized electrode to voltammetric perturbation,
signi�cantly more ammonia is produced then is expected physiologically. Low basal
levels of ammonia production by batch (125 mL) cultures of A. var. have been
measured with an ammonia ion selective electrode. This measurement represents
141
the in vivo output of NH3. This basal output of ammonia from 15 mL samples
of well mixed cultures (where cells and debris are removed) is <4 �M Following
voltammetric perturbation of the same density of cells immobilized to the electrodes
at various scan rates, average ammonia production for select experimental conditions
increases, in some cases to over 30 �M:
Alternative enzyme pathways that produce ammonia are present in Anabaena
variabilis such as the nitrite/nitrate reductase enzyme. The data presented are more
consistent with this nitrate/nitrite reductase than nitrogenase based on the following:
1) Both NADPH and ferredoxins share a critical role in electron transfer to and from
nitrate/nitrite reductase; 2) Voltammetric currents appear and are increased when
nitrogenase synthesis has been repressed; 3) Nitrogenase substrate N2 and cofactor
ATP do not increase ammonia production or increase the electrochemical signals
observed; 4) NH+4 can inhibit and suppress both nitrogenase and nitrate/nitrite
reductase, yet even the SA-1 strain, which also contains nitrate/nitrite reductase,
achieves sustained and increased production of NH3; and 5) The heterocyst o¤ers
great protection of the nitrogenase enzyme from oxygen but also severely limits the
ability to induce a reductive environment within the cell due to thick cell walls and
lack of ion channels and gated pumps. Nitrogenase are buried and protected behind
thick heterocyst cell membranes and likely not accessible by small mediators, on the
short analyses times, and there is no known mechanism to transfer electrons directly
to the cytosol.
An externally applied driving force appears to be necessary to produce NH3
from immobilized A. var. Without cyclic voltammetric perturbation, electrode
142
immobilized cells did not produce concentrations of ammonia above the basal level.
Nitrogenase and nitrate/nitrite reductase are very di¤erent enzymes. They
share one feature of interest in this research, production of ammonia at ambient
temperature and pressure. From a biochemical perspective, if the electrode
can induce a more reductive environment within the cytosol, nitrogenase and
nitrate/nitrite reductase e¢ ciency and activity would certainly increase. The
data presented in this section highlight that the A. var., void of nitrogenase, still
produce signi�cant levels of ammonia. Additional linear relationships between
electrochemical peak current and ammonia production that has been normalized
to an indirect measure of enzyme density (chlorophyll a assay) support that
nitrate/nitrite reductase is accessible in the electrochemical cell as described.
143
CHAPTER 4
DEVELOPMENT OF MECHANISTIC MODEL FRAMEWORK FOR AMMONIA
PRODUCTION
4.1 Model Considerations
The research discussed here describes a system where whole cells of Anabaena
variabilis are immobilized to an electrode surface. After voltammetric perturbation,
ammonia density in the external media is higher than compared to the basal level
for parent cells and from the data, a linear relationship between reductive peak
current and this ammonia output is found. In cultures grown on 17 mM NaNO3,
nitrogenase is no longer synthesized and the primary route for ammonia production
is by nitrate uptake and reduction to NH3. This nitrate update and reduction
is catalyzed by the nitrate/nitrite reductase enzymes. Electrochemical data are
useful to explain the thermodynamics and kinetics of electron transfer and chemical
reactions involved enzyme based ammonia production at an electrode surface on
the cyclic voltammetric time scale. The data discussed in Chapter 3 are consistent
with a signi�cant role of nitrate/nitrite reductase in producing ammonia from
immobilized Anabaena variabilis.
Throughout the 1980�s, the structure and function parameters of nitrate and
nitrite reductase were an area of research focus. During this time, several con�icting
reports were made as to the mechanisms of the nitrate/nitrite reductase enzymes
[122�125]. In the mid 1990�s, a more de�nitive model proposed of nitrate uptake
144
and enzymatic reduction to nitrite and ammonia has advanced [126]. Even so,
several reviews on the role of nitrate and nitrite in cyanobacteria are not consistent.
Some site evidence that some photosynthetic bacteria may synthesize NADPH
[122] dependent nitrate reductase and others report that photosynthetic bacteria
synthesize only ferredoxin dependent nitrate reductase [127,128]
Cyclic voltammetry data provide thermodynamic and kinetic data simultaneously.
The kinetic and thermodynamic parameters are embedded within the current
versus potential curves. These data are not always readily extracted and often
require construction of a model before extraction of the values. The complexity of
bioelectrochemical reactions, even when speci�cally targeting those involved in the
production of ammonia, require several types of simultaneous kinetic analyses to map
pertinent and accessible reactions. Due to the multiple levels of biochemical feedback
present within a whole cell system, the simple model here makes initial assumptions.
The basic model framework establishes a foundation to incorporate additional
redox considerations such as mediators and additional electron transfer reactions.
The model presented here is the framework to describe the basic foundation for
the electrochemical contribution to the kinetics of ammonia production by the
nitrate/nitrite reductase enzyme. It does not consider all contributing reactions.
The model described here complements electrochemical, ammonia output, and
cell density data obtained in the types of experiments discussed in Chapter 3.
The model re�ects the union of reported biochemical pathways and experimental
electrochemical data. The framework described here is foundational. Until this
work, no electrochemical to biochemical correlational data strictly focused on
145
Anabaena variabilis ammonia production has been published.
4.1.1 Redox Reactions
Much has been reported about the structure and function of cyanobacterial
nitrate/nitrite reductase [122, 123, 126�130]. These reports take advantage of
enzyme isolation to study the nitrate/nitrite reductase dynamics. Preparation
of cell free extracts is time consuming and can often require strict environmental
control. Further, the integrity of long term (greater than 1 day) measurements of
isolated systems are often compromised due to insu¢ cient nutrients and biochemical
mediators present to drive catalysis that requires external supplementation. Instead,
whole cell analysis of enzymatic systems, while extremely complex, is advantageous
because it studies a functional system without the complications of providing all
necessary biochemicals to observe sustained behavior. The goal in this research
is to electrochemically support biochemical production of ammonia at ambient
temperature and pressure, not to evaluate and determine enzyme kinetics of whole
cells. Thus, a brief discussion of the pertinent redox reactions as they relate to this
goal are appropriate.
The redox reactions that involve NO�2 and NO�3 are pH dependent reactions. The
optimal pH for Anabaena variabilis is 7.2, yet changes in pH at the electrodejcell
interface have signi�cant e¤ect on the potential required to drive a reduction or
oxidation. In some cases, a 12 molar excess of H+ is chemically required to
overcome kinetic limitations of involved electron transfer reactions. Also, pH near
the electrode can be altered as H+ produced from redox reactions alter the pH
146
microenvironment near the electrode, the site of heterogenous electron transfer.
Bulk pH measurements do not describe the pH environment at the electrode
interface. Tables 13, 14, and 15 list many of the possible redox reactions that are
thermodynamic possibilities. The reactions in Table 13 are the nitrate and nitrite
reactions at di¤erent values of pH. For each reaction, the electrochemical potential
is reported at pH = 0, 6, 7, and 8. These pH adjusted electrochemical potentials
are calculated by the Nernst equation (Equation 25).
E = E� +RT
nFln�O�R
(25)
In the Nernst equation, E, the measured electrode potential, can be calculated from
a the standard thermodynamic potential of a redox reaction, E� for the general
electrochemical reduction, O + ne R. Equation 25 is shown for the case where
there is one reactant and one product species. When there are multiple chemical
species, the expressions under the logarithm are changed. The product of the
activities of the oxidized species raised to their stoichiometric coe¢ cient (k) ;j
�n=1�kn
replaces �O and the product of the activities of the reduced species raised to their
stoichiometric coe¢ cients (p),m
�i=1�pi , replaces �R: R is the gas constant (8.31
J mol�1K�1), T is temperature in K, F is Faraday constant (96485 C mol�1); and n
is the number of electrons transferred in the overall reaction.
For reactions that are pH dependent, either H+ or OH� is a product or reaction.
As evident from Equation 25, change in one pH unit is a decade change in [H+]. As
a product or reactant, the electrode potential shifts in response to changes in pH.
When pH is changed, the number of electrons transferred, n ;also impacts the shift
147
from E� at standard temperature.. The formal potential, E�0; calculated in Tables
13 and 14 assumes � = 1 for all species other than H+, which changes based on the
pH, and the appropriate number of electrons transferred for each reduction reaction.
A formal potential is calculated from the standard potential (E�) for conditions
other than standard; here, [H+] 6= 1 M. Thus, these electrode potentials show the
signi�cant manifestation of the H+/e ratio for reactions at the electrodejsolutionjcell
interface. It is important to recognize that localized changes in pH impact electrode
potentials for reactions. As pH and potential shift, thermodynamically allowed
disproportionation reactions may become more or less likely when a species common
to two or more reactions is present.
The redox reactions in Table 13 are representative of the nitrate and nitrite
reductions, those related to the mechanism and ammonia production capabilities of
the nitrate/nitrite reductase enzyme. The electrode potential reported has been
calculated thermodynamically and do not consider any kinetic limitations [131].
Anabaena variabilis prefer a local external pH of 7.2, but reactions at the electrode
surface can deplete local H+ or generate additional OH�: Experiments in this work
are not conducted in a bu¤ered electrolyte, thus electrochemical turnover of these
pH dependent reactions can have a signi�cant e¤ect on the pH at the electrodejcell
interface.
The redox reactions in Table 14 are for reductions of nitrogen species.
These nitrogen reduction reactions represent possible intermediate steps in the
electrocatalytic conversion of nitrate and nitrite to ammonia. N2 is not involved
in the nitrate/nitrite reductase pathway, but is shown in the Table because in
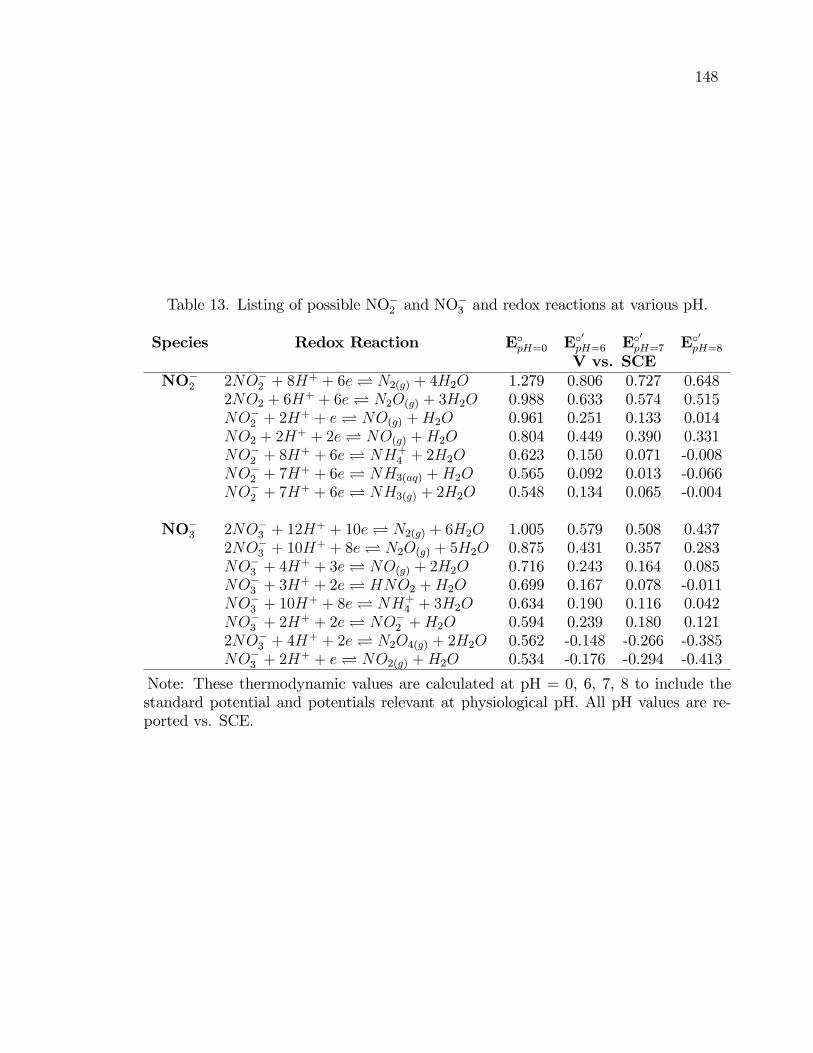
148
Table 13. Listing of possible NO�2 and NO�3 and redox reactions at various pH.
Species Redox Reaction E�pH=0 E�0pH=6 E�0pH=7 E�0pH=8V vs. SCE
NO�2 2NO�2 + 8H
+ + 6e N2(g) + 4H2O 1.279 0.806 0.727 0.6482NO2 + 6H
+ + 6e N2O(g) + 3H2O 0.988 0.633 0.574 0.515NO�2 + 2H
+ + e NO(g) +H2O 0.961 0.251 0.133 0.014NO2 + 2H
+ + 2e NO(g) +H2O 0.804 0.449 0.390 0.331NO�2 + 8H
+ + 6e NH+4 + 2H2O 0.623 0.150 0.071 -0.008
NO�2 + 7H+ + 6e NH3(aq) +H2O 0.565 0.092 0.013 -0.066
NO�2 + 7H+ + 6e NH3(g) + 2H2O 0.548 0.134 0.065 -0.004
NO�3 2NO�3 + 12H
+ + 10e N2(g) + 6H2O 1.005 0.579 0.508 0.4372NO�3 + 10H
+ + 8e N2O(g) + 5H2O 0.875 0.431 0.357 0.283NO�3 + 4H
+ + 3e NO(g) + 2H2O 0.716 0.243 0.164 0.085NO�3 + 3H
+ + 2e HNO2 +H2O 0.699 0.167 0.078 -0.011NO�3 + 10H
+ + 8e NH+4 + 3H2O 0.634 0.190 0.116 0.042
NO�3 + 2H+ + 2e NO�2 +H2O 0.594 0.239 0.180 0.121
2NO�3 + 4H+ + 2e N2O4(g) + 2H2O 0.562 -0.148 -0.266 -0.385
NO�3 + 2H+ + e NO2(g) +H2O 0.534 -0.176 -0.294 -0.413
Note: These thermodynamic values are calculated at pH = 0, 6, 7, 8 to include thestandard potential and potentials relevant at physiological pH. All pH values are re-ported vs. SCE.
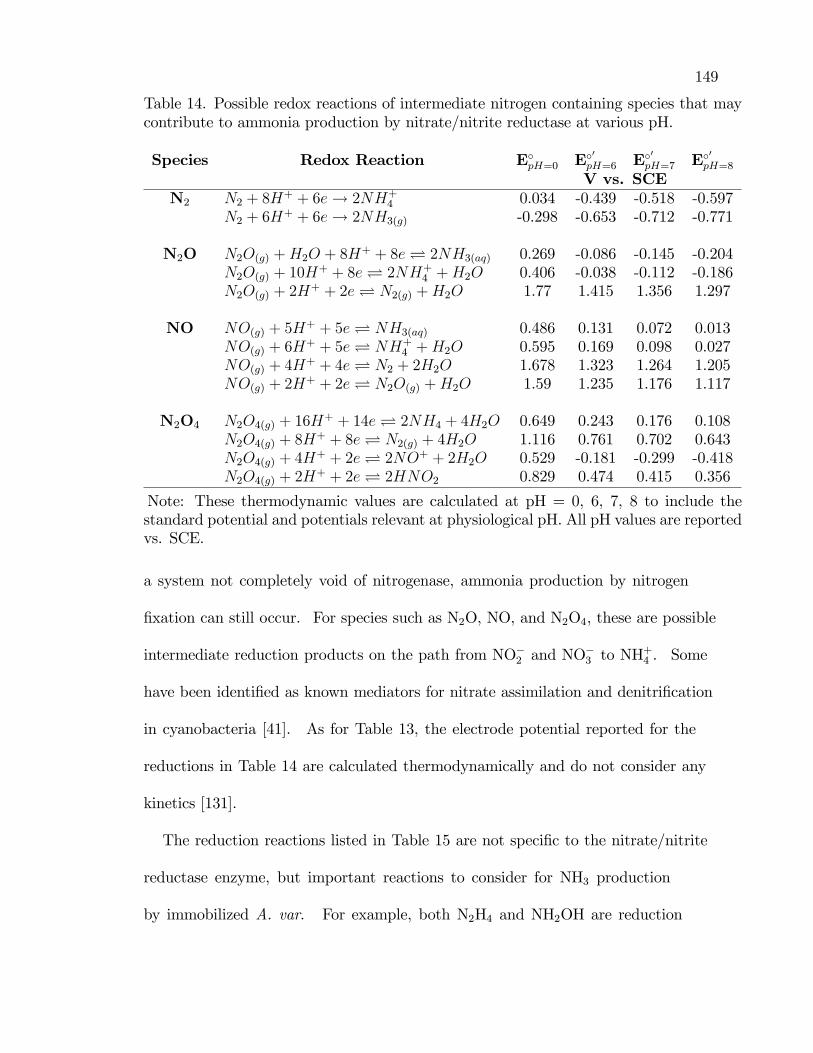
149
Table 14. Possible redox reactions of intermediate nitrogen containing species that maycontribute to ammonia production by nitrate/nitrite reductase at various pH.
Species Redox Reaction E�pH=0 E�0pH=6 E�0pH=7 E�0pH=8V vs. SCE
N2 N2 + 8H+ + 6e! 2NH+
4 0.034 -0.439 -0.518 -0.597N2 + 6H
+ + 6e! 2NH3(g) -0.298 -0.653 -0.712 -0.771
N2O N2O(g) +H2O + 8H+ + 8e 2NH3(aq) 0.269 -0.086 -0.145 -0.204
N2O(g) + 10H+ + 8e 2NH+
4 +H2O 0.406 -0.038 -0.112 -0.186N2O(g) + 2H
+ + 2e N2(g) +H2O 1.77 1.415 1.356 1.297
NO NO(g) + 5H+ + 5e NH3(aq) 0.486 0.131 0.072 0.013
NO(g) + 6H+ + 5e NH+
4 +H2O 0.595 0.169 0.098 0.027NO(g) + 4H
+ + 4e N2 + 2H2O 1.678 1.323 1.264 1.205NO(g) + 2H
+ + 2e N2O(g) +H2O 1.59 1.235 1.176 1.117
N2O4 N2O4(g) + 16H+ + 14e 2NH4 + 4H2O 0.649 0.243 0.176 0.108
N2O4(g) + 8H+ + 8e N2(g) + 4H2O 1.116 0.761 0.702 0.643
N2O4(g) + 4H+ + 2e 2NO+ + 2H2O 0.529 -0.181 -0.299 -0.418
N2O4(g) + 2H+ + 2e 2HNO2 0.829 0.474 0.415 0.356
Note: These thermodynamic values are calculated at pH = 0, 6, 7, 8 to include thestandard potential and potentials relevant at physiological pH. All pH values are reportedvs. SCE.
a system not completely void of nitrogenase, ammonia production by nitrogen
�xation can still occur. For species such as N2O, NO, and N2O4, these are possible
intermediate reduction products on the path from NO�2 and NO�3 to NH
+4 . Some
have been identi�ed as known mediators for nitrate assimilation and denitri�cation
in cyanobacteria [41]. As for Table 13, the electrode potential reported for the
reductions in Table 14 are calculated thermodynamically and do not consider any
kinetics [131].
The reduction reactions listed in Table 15 are not speci�c to the nitrate/nitrite
reductase enzyme, but important reactions to consider for NH3 production
by immobilized A. var. For example, both N2H4 and NH2OH are reduction
150
intermediates in the inorganic reduction of N2 to NH3. This work explored
the e¤ect of adding these species to the background electrolyte during cyclic
voltammetric analysis of cells on electrodes, but did not contribute signi�cantly to
the correlation between peak current and ammonia production (data not shown).
These reductions are reported because the complexity of bioelectrocatalytic system
require consideration of the multiple levels of electrochemical feedback present in
whole cellular systems. These data were adjusted to a saturated calomel electrode
(SCE) reference and adapted from literature [131].
Simultaneous consideration of all reductions shown in Tables 13, 14, and
15 is challenging. Employing whole cells as the source of catalyst requires
consideration of numerous possibilities when mapping pertinent kinetic pathways
and possibilities The H+/e ratio further complicates the reaction possibilities.
From an electrochemists�view, plotting these reactions on a potential axis aids in
visualizing thermodynamic possibilities from which to begin kinetic and mechanistic
modeling e¤orts. The potential axis (Figure 49) is a horizontal axis with oxidative
potential (more positive) on the left and reductive potential (more negative) on the
right. For each redox reaction under consideration, a vertical line is drawn at the
appropriate E. The oxidized species appears on the left of the vertical line and the
reduced of the redox couple is written on the right.
A potential axis maps out reaction possibilities. The potentials for the redox
couple diagrammed in Figure 49 are calculated thermodynamically. Consider the
utility in the potential axis. The reduction reactions for NADP+jNADPH and
ferredoxinoxjferredoxinred (represented as Fd(Fe+z), z = 2; 3) are plotted on a single
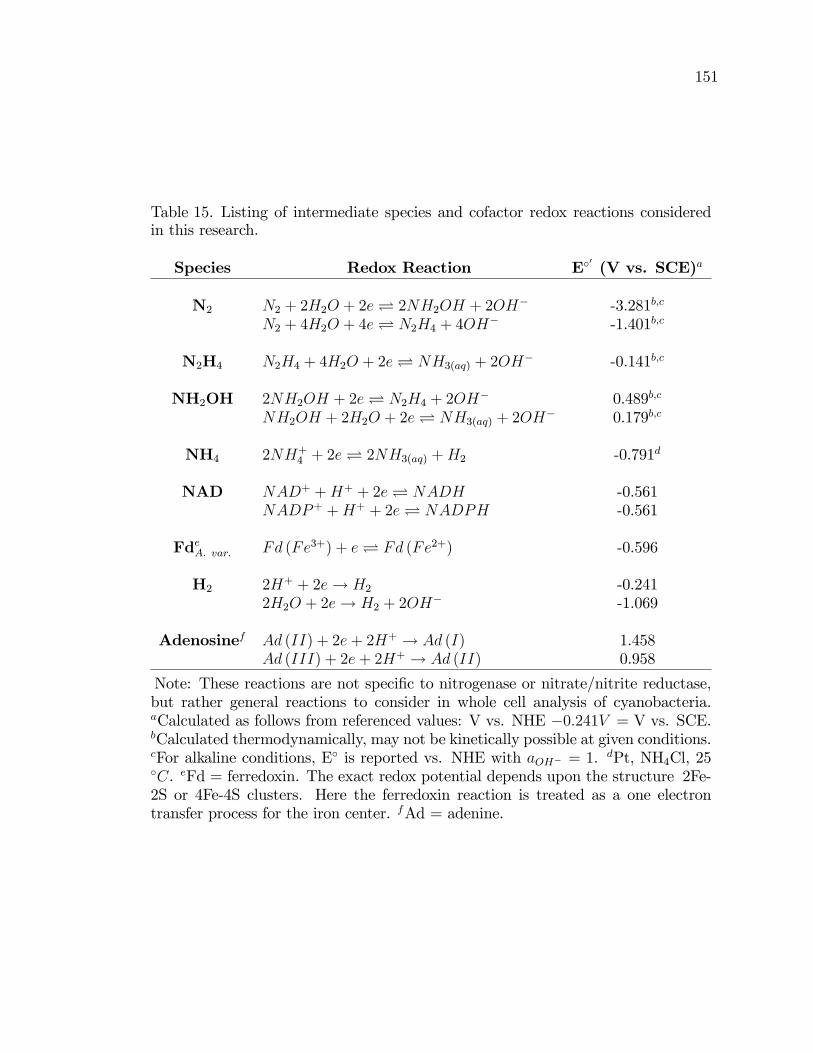
151
Table 15. Listing of intermediate species and cofactor redox reactions consideredin this research.
Species Redox Reaction E�0 (V vs. SCE)a
N2 N2 + 2H2O + 2e 2NH2OH + 2OH� -3.281b;c
N2 + 4H2O + 4e N2H4 + 4OH� -1.401b;c
N2H4 N2H4 + 4H2O + 2e NH3(aq) + 2OH� -0.141b;c
NH2OH 2NH2OH + 2e N2H4 + 2OH� 0.489b;c
NH2OH + 2H2O + 2e NH3(aq) + 2OH� 0.179b;c
NH4 2NH+4 + 2e 2NH3(aq) +H2 -0.791d
NAD NAD+ +H+ + 2e NADH -0.561NADP+ +H+ + 2e NADPH -0.561
FdeA: var: Fd (Fe3+) + e Fd (Fe2+) -0.596
H2 2H+ + 2e! H2 -0.2412H2O + 2e! H2 + 2OH
� -1.069
Adenosinef Ad (II) + 2e+ 2H+ ! Ad (I) 1.458Ad (III) + 2e+ 2H+ ! Ad (II) 0.958
Note: These reactions are not speci�c to nitrogenase or nitrate/nitrite reductase,but rather general reactions to consider in whole cell analysis of cyanobacteria.aCalculated as follows from referenced values: V vs. NHE �0:241V = V vs. SCE.bCalculated thermodynamically, may not be kinetically possible at given conditions.cFor alkaline conditions, E� is reported vs. NHE with aOH� = 1. dPt, NH4Cl, 25�C. eFd = ferredoxin. The exact redox potential depends upon the structure 2Fe-2S or 4Fe-4S clusters. Here the ferredoxin reaction is treated as a one electrontransfer process for the iron center. fAd = adenine.
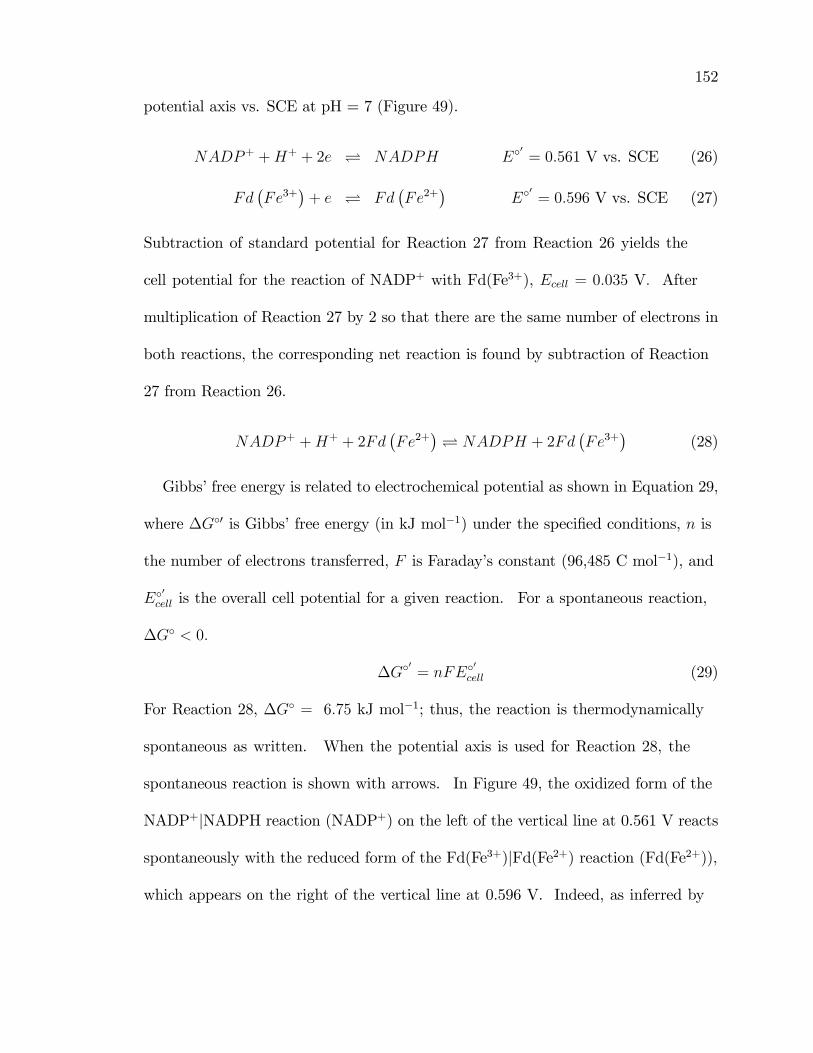
152
potential axis vs. SCE at pH = 7 (Figure 49).
NADP+ +H+ + 2e NADPH E�0= 0:561 V vs. SCE (26)
Fd�Fe3+
�+ e Fd
�Fe2+
�E�
0= 0:596 V vs. SCE (27)
Subtraction of standard potential for Reaction 27 from Reaction 26 yields the
cell potential for the reaction of NADP+ with Fd(Fe3+), Ecell = 0:035 V: After
multiplication of Reaction 27 by 2 so that there are the same number of electrons in
both reactions, the corresponding net reaction is found by subtraction of Reaction
27 from Reaction 26.
NADP+ +H+ + 2Fd�Fe2+
� NADPH + 2Fd
�Fe3+
�(28)
Gibbs�free energy is related to electrochemical potential as shown in Equation 29,
where �G�0 is Gibbs�free energy (in kJ mol�1) under the speci�ed conditions, n is
the number of electrons transferred, F is Faraday�s constant (96,485 C mol�1), and
E�0cell is the overall cell potential for a given reaction. For a spontaneous reaction,
�G� < 0:
�G�0= nFE�
0
cell (29)
For Reaction 28, �G� = 6:75 kJ mol�1; thus, the reaction is thermodynamically
spontaneous as written. When the potential axis is used for Reaction 28, the
spontaneous reaction is shown with arrows. In Figure 49, the oxidized form of the
NADP+jNADPH reaction (NADP+) on the left of the vertical line at 0.561 V reacts
spontaneously with the reduced form of the Fd(Fe3+)jFd(Fe2+) reaction (Fd(Fe2+)),
which appears on the right of the vertical line at 0.596 V. Indeed, as inferred by
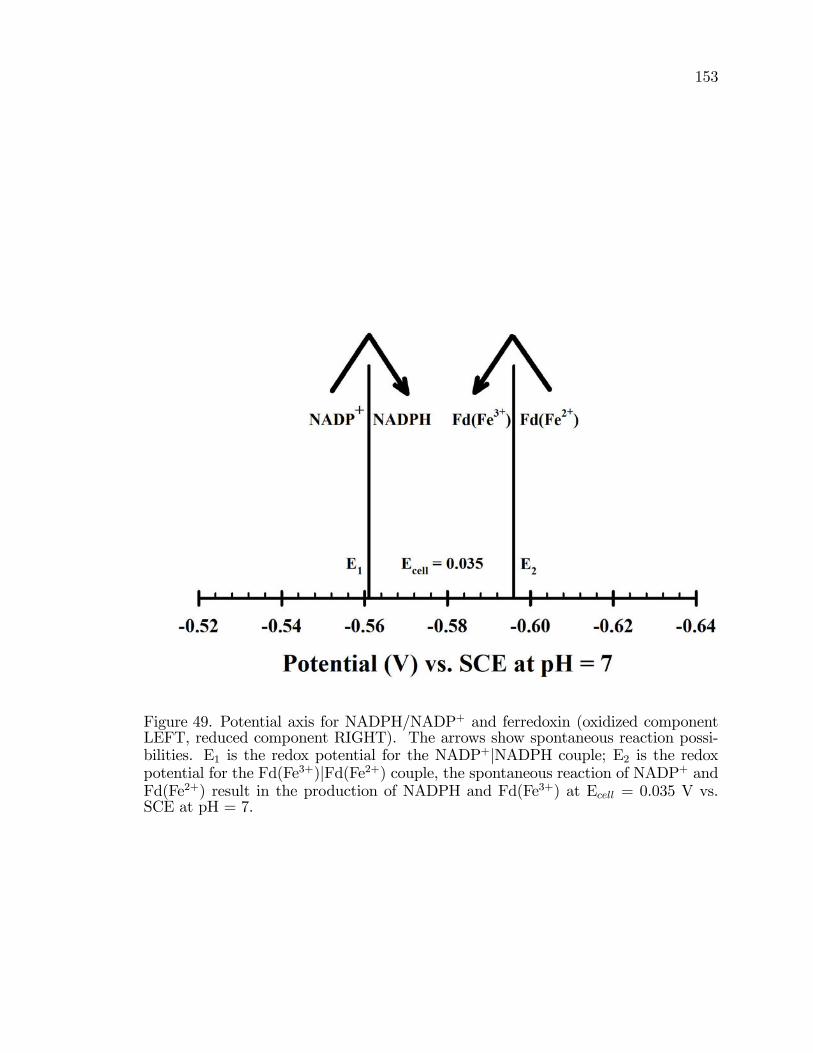
153
Figure 49. Potential axis for NADPH/NADP+ and ferredoxin (oxidized componentLEFT, reduced component RIGHT). The arrows show spontaneous reaction possi-bilities. E1 is the redox potential for the NADP+jNADPH couple; E2 is the redoxpotential for the Fd(Fe3+)jFd(Fe2+) couple, the spontaneous reaction of NADP+ andFd(Fe2+) result in the production of NADPH and Fd(Fe3+) at Ecell = 0.035 V vs.SCE at pH = 7.
154
Equation 29, the reaction is spontaneous. The discussion of this example highlights
the utility of the potential axis. and identify species that can react spontaneously.
The reduction reactions reported in Table 13 have been plotted on the potential
axis in Figure 29 at pH = 7. There are additional thermodynamic possibilities at
more positive and negative potentials than shown; however, under voltammetric
perturbation, the suggested linear correlation between faradaic peak current and
ammonia production result from current peaks between 0 and 0.3 V vs SCE for the
reductive wave and 0.6 to 0.8 V vs SCE for the oxidative wave. As shown in Figure
29, thermodynamic possibilities are numerous with overlapping redox potentials.
Consider some nitrogen species X, Y , and Z that are plotted on the potential axis in
Figure 29, for example. Species X is generated at the electrode under voltammetric
perturbation, which can then chemically react spontaneously with species Y to
produce Z, which itself is electroactive and has a reduction potential near that of X.
There are numerous possible events of this type, thus, electrochemical evaluation of
nitrate/nitrite reductase system must consider kinetic limitations and requirements
to limit the reaction possibilities and determine critical reactions in the process.
4.1.2 Nitrate/Nitrite Reductase Production ofAmmonia
Redox reactions given in Tables 13 and 14 and plotted on the potential axis
in Figure 29 represent the thermodynamically possible reactions consistent with
the reduction of nitrate to nitrite to ammonia. The successive multi proton,
multi electron reduction of NO�3 to NH+4 in Anabaena variabilis is possible by the
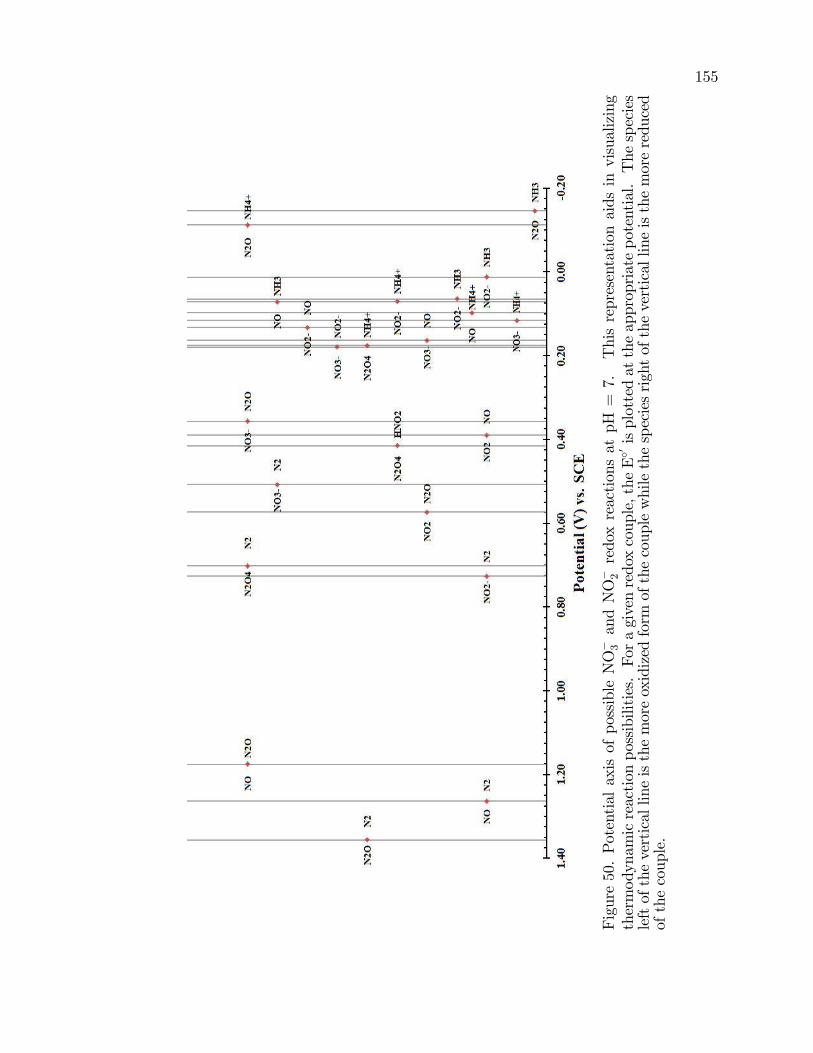
155
Figure50.PotentialaxisofpossibleNO� 3andNO� 2redoxreactionsatpH
=7.
Thisrepresentationaidsinvisualizing
thermodynamicreactionpossibilities.Foragivenredoxcouple,theE�0isplottedattheappropriatepotential.Thespecies
leftoftheverticallineisthemoreoxidizedformofthecouplewhilethespeciesrightoftheverticallineisthemorereduced
ofthecouple.
156
nitrate/nitrite reductase enzyme. Data presented and discussed in Chapter 3 for A.
var. are grown on NaNO3 are consistent with the ammonia measured in the external
media that result, not from nitrogenase, but nitrate/nitrite reductase. From the
data, a linear correlation between forward peak current and ammonia output is
found.
Consider the previous example with NADPH and ferredoxins (Reaction 28
and Figure 49). From Chapter 3, the cyclic voltammograms in Figures 29 and
30 show that additions of NADPH and ferredoxins to a background electrolyte
solution resulted in higher current forward waves at 0.1 V. Simultaneous additions
of NADPH and ferredoxins signi�cantly increase the forward and reverse current
at the 0.1 V and 0.6 V peaks (Figure 37) as compared to a solution containing
only Na2SO4. Before ammonia can be produced by the nitrate/nitrite reductase
enzyme, conditions must be satisfactory for the cells to produce the enzyme. While
this mechanism, whether by repression, inhibition, or other process, is not clearly
understood [123�125, 132, 133], it is generally accepted that NO�3 is present and
NH+4 , if present, is not uptaken by the A. var. SA-1 cells. These two constraints are
con�rmed in the model for the results outlines in Chapter 3.
In this research, A. var. SA-1 are cultured in BG-110 + 17 mM NaNO3: Thus,
both conditions are satis�ed; the addition of NaNO3 provides enzyme substrate, and
the SA-1 mutant is nitrogenase derepressed because NH+4 is not uptaken into the
glutamine synthetase pathway. NO�3 enters the cell through ATP gated channels.
Some NO�3 is stored within the cell but most is destined for nitrate reductase.
Biologically, it has been shown that in photosynthetic nitrogen �xing bacteria,
157
such as Anabaena variabilis, the reductant required by nitrate reductase is reduced
ferredoxin. Others have proposed NADPH as an alternative reductant, especially
in environments scarce of Fe. The overall two step process by which nitrate/nitrite
reductase converts NO�3 to NH+4 is summarized by Reactions 30 and 33. As written,
both of these reactions are spontaneous. The potential was calculated from the
reported �G at pH = 7 [122]. Note, these reactions do not occur absent the
nitrate/nitrite reductase catalyst at a bare electrode.
NO�3 +NADPH +H+ + 2e NO�2 +NADP
+ +H2O (30)
�G�0
pH=7 = 34 kcal �mol�1 = nFE�0cell (31)
E�0
cell = 0:837 V (32)
NO�2 + 6Fdred + 8H+ + 6e NH+
4 + 6Fdox + 2H2O (33)
�G�0
pH=7 = 103:5 kcal �mol�1 = nFE�0cell (34)
E�0
cell = 0:748 V (35)
E�0cell for the Reactions 30 and 33 are within the potential limits of cyclic voltammetric
analysis of this system. These reactions also represent the biochemical reactions
without regard to the in�uence of an applied potential. The challenge in the
construction of the model framework for this system is to determine which of several
reaction possibilities arise in the system as constructed. Both Reactions 30 and
33 are pH dependent, thus the in�uence of the H+/e ratio complicates several
disproportionation reaction possibilities. Figure 51 shows potential axes for the
158
reduction reactions in Table 13 at pH = 6 (A), pH = 7 (B), and pH = 8 (C)
at a potential range appropriate to cover the oxidative backwave observed under
previous experimentation (for example, in Figures 29, 30, and 38). The cyclic
voltammograms obtained and corresponding data is reported in Table 11 in Chapter
3 are consistent with the observation that when NO�2 is present in the external
media, the oxidative wave near 0.6 V has higher current above the baseline at cell
modi�ed electrodes. Consideration of the oxidative back wave observed near +0.6
V in terms of NO�2 provides a correlation as discussed from the experiments focused
on nitrate/nitrite reductase (Figures 44 and 45). There are several redox reactions
from Table 13 that involve NO�2 as a product or reactant near 0.6 V In �gure 52,
potential axes for the reduction reactions in Table 13 at pH = 6 (A), pH = 7 (B),
and pH = 8 (C) all shown at a potential range appropriate to cover the reductive
forward peak observed under previous experimentation (for example, in Figures
44 and 45). As the potential axes in Figure 52 show, there are signi�cantly more
thermodynamic reactions possibilities to consider. The correlation between forward
peak current and ammonia production do not suggest an electrochemical mechanism.
The relationship between electrochemical current, ammonia production, and�NO�2
�and
�NO�3
�(Tables 11 and 12, Figure 47) collectively suggest that reactions such as
those shown in Figure 52 are responsible for the observed e¤ects. Coupling between
various reactions is a strong possibility. Previously, it was shown in Figures 40 and
41 that bulk pH does not appreciably a¤ect the faradaic current response. Further,
by the linear correlations between faradaic current and NH3 production shown
previously in Figures 34, 39, 46, and 47, bulk pH is not expected to a¤ect NH3
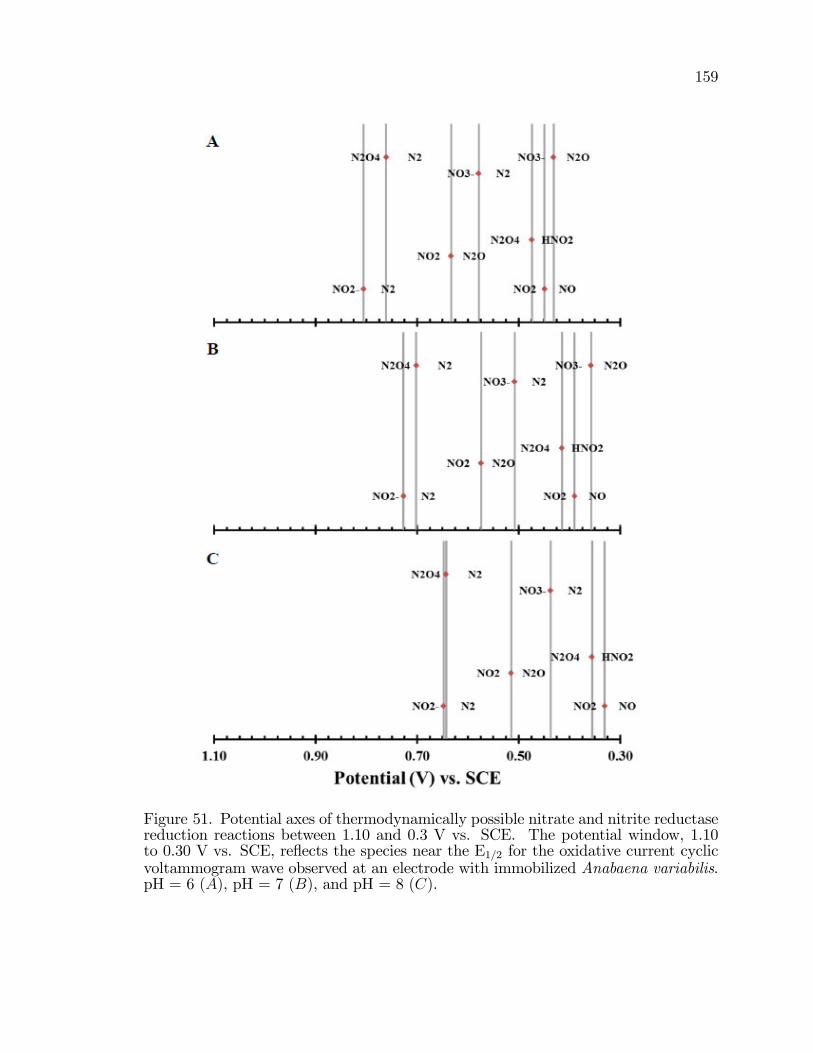
159
Figure 51. Potential axes of thermodynamically possible nitrate and nitrite reductasereduction reactions between 1.10 and 0.3 V vs. SCE. The potential window, 1.10to 0.30 V vs. SCE, re�ects the species near the E1=2 for the oxidative current cyclicvoltammogram wave observed at an electrode with immobilized Anabaena variabilis.pH = 6 (A), pH = 7 (B), and pH = 8 (C).
160
production. The research here is mostly concerned with interfacial electron transfer;
thus, the local pH at the electrodejcell interface is expected to signi�cantly e¤ect the
driving force necessary to achieve electrolysis for the reactions from Tables 13 and
14. The interfacial change in pH changes the formal potentials of these reactions,
as shown in Figure 52 for pH = 6 (A), 7 (B), and 8 (C).
There are many reactions from which to choose, each having distinct intermediate
products, reduction potentials, and kinetic limitations. NO, for example, is a known
free radical mediating species in many organisms. In the human body, for example,
NO is a signi�cant neurotransmitter. Several NO�2 and NO�3 redox reactions share
NO as an intermediate.
The model framework presented here arose from the observations shown in
Table 11. The relationship to NH3 output and substrate input did not suggest an
immediate correlation. Thus, the model presented here focuses on nitrate/nitrite
reductase substrates NO�2 and NO�3 in a simple kinetic model.
4.1.3 Model Simpli�cations
The model presented here provides a framework to consider the observations
presented in Chapter 3. The framework relies upon data consistent with
the nitrate/nitrite reductase enzyme production of NH3 under voltammetric
perturbation. The framework has been simpli�ed by not considering side reaction,
concomitant reactions, enzyme feedback, or the role of mediators and low potential
reductants. Instead, it only considers that reduction of NO�3 to NO�2 to NH3:
Others have modeled kinetics of the enzyme system but from a biological viewpoint
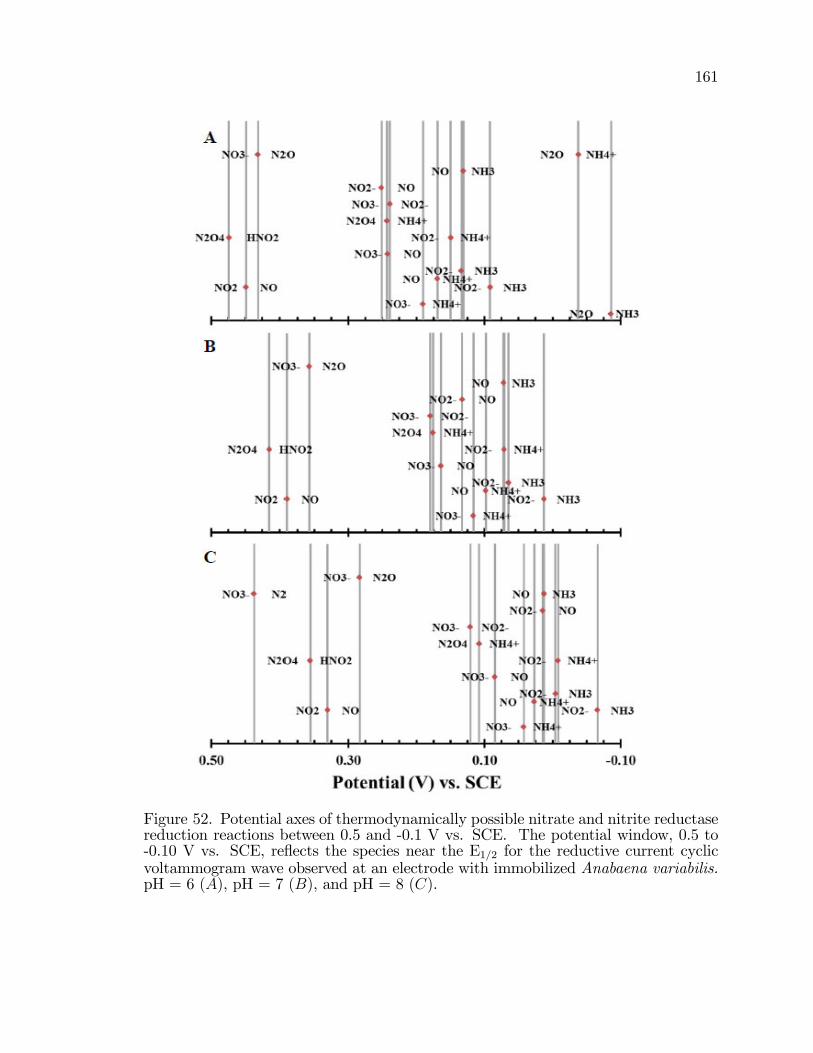
161
Figure 52. Potential axes of thermodynamically possible nitrate and nitrite reductasereduction reactions between 0.5 and -0.1 V vs. SCE. The potential window, 0.5 to-0.10 V vs. SCE, re�ects the species near the E1=2 for the reductive current cyclicvoltammogram wave observed at an electrode with immobilized Anabaena variabilis.pH = 6 (A), pH = 7 (B), and pH = 8 (C).
162
using Michaelis Menten kinetics [41, 122, 130]. The Michaelis Menten model of
reaction and enzyme kinetics is appropriate in many enzyme studies, but does not
account well for conditions under voltammetric perturbation.
Figure 53 diagrams the bioelectrochemical system when the cells do not contain
nitrogenase. Figure 53 includes two possible indirect electron transfer mechanisms
by which the reductive power of the electrode is translated to the cell and eventually
the nitrate/nitrite reductase enzyme for the purpose of ammonia production. One
mechanism is by indirect electron transfer that uses a mediating chemical species
(left in Figure 53). In this mechanism, an electroactive species facilitates electron
transfer to the cell, itself recycling at the electrode surface. Because there are
no known electron channels in a cell membrane, the mediating species modulates
electron transfer between a cell surface species that is membrane permeable. The
other possible mechanism is a chemical mediating species that itself enters the cell
to mediate electron transfer with the nitrate/nitrite reductase active sites (right in
Figure 53). The oxidized form di¤uses from the cell to be recycled at the electrode.
The model data presented in the following section does not speci�cally di¤erentiate
these possibilities. As the framework transitions to a more robust and complete
model, it may allow discrimination of the possibilities shown in Figure 53.
Here, the model assumes: 1) all species react by �rst order reactions; 2) no
intermediate species or partially reduced products are signi�cant; and 3) the reactions
are chemically and electrochemically irreversible. Given these assumptions, no
feedback processes are considered.
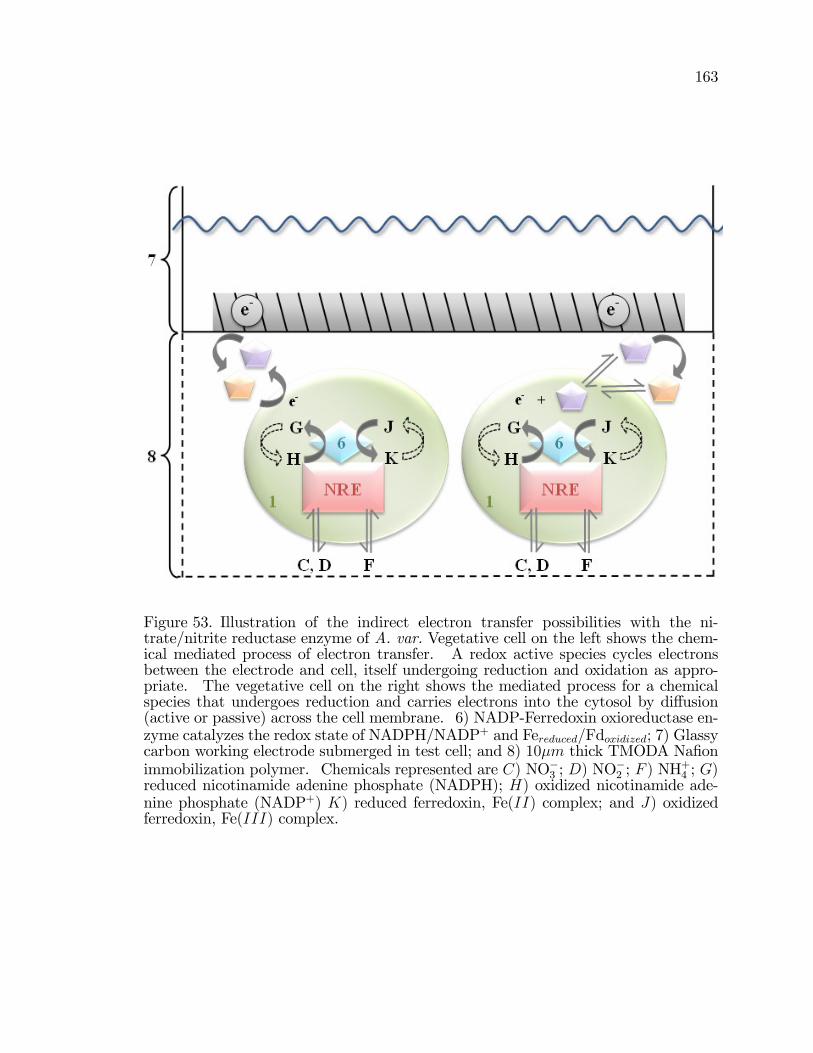
163
Figure 53. Illustration of the indirect electron transfer possibilities with the ni-trate/nitrite reductase enzyme of A. var. Vegetative cell on the left shows the chem-ical mediated process of electron transfer. A redox active species cycles electronsbetween the electrode and cell, itself undergoing reduction and oxidation as appro-priate. The vegetative cell on the right shows the mediated process for a chemicalspecies that undergoes reduction and carries electrons into the cytosol by di¤usion(active or passive) across the cell membrane. 6) NADP-Ferredoxin oxioreductase en-zyme catalyzes the redox state of NADPH/NADP+ and Fereduced=Fdoxidized; 7) Glassycarbon working electrode submerged in test cell; and 8) 10�m thick TMODA Na�onimmobilization polymer. Chemicals represented are C) NO�3 ; D) NO
�2 ; F ) NH
+4 ; G)
reduced nicotinamide adenine phosphate (NADPH); H) oxidized nicotinamide ade-nine phosphate (NADP+) K) reduced ferredoxin, Fe(II) complex; and J) oxidizedferredoxin, Fe(III) complex.
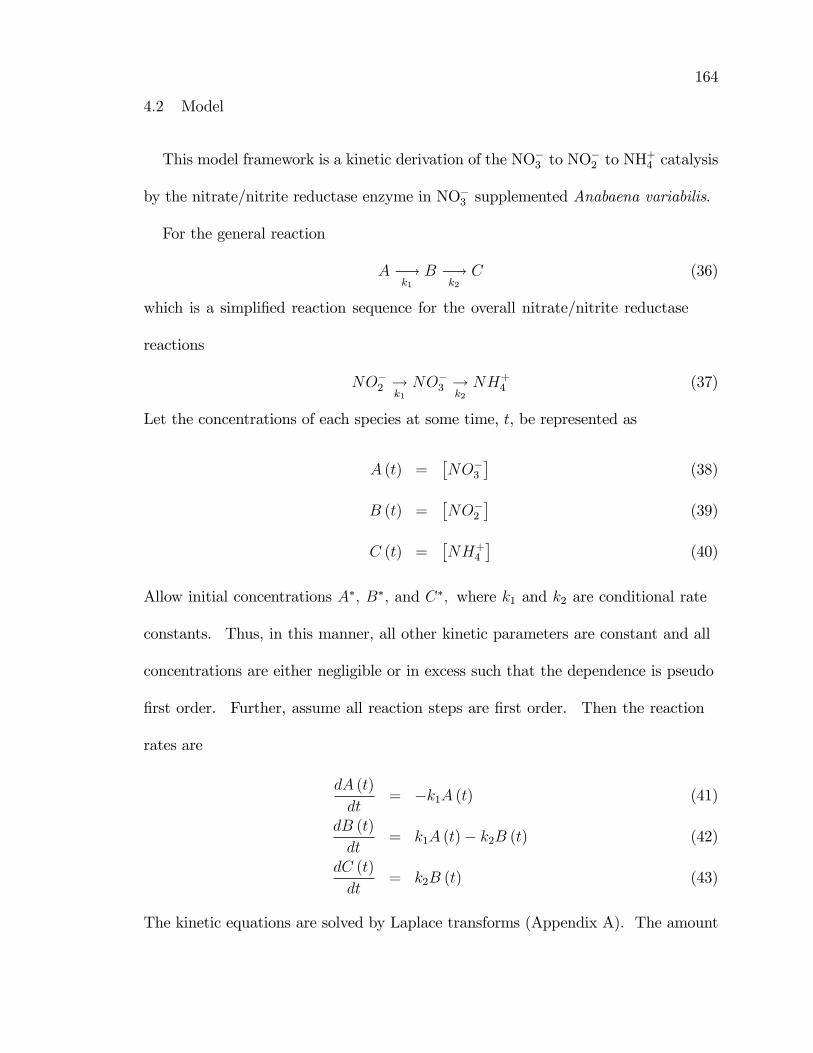
164
4.2 Model
This model framework is a kinetic derivation of the NO�3 to NO�2 to NH
+4 catalysis
by the nitrate/nitrite reductase enzyme in NO�3 supplemented Anabaena variabilis.
For the general reaction
A �!k1B �!
k2C (36)
which is a simpli�ed reaction sequence for the overall nitrate/nitrite reductase
reactions
NO�2 !k1NO�3 !
k2NH+
4 (37)
Let the concentrations of each species at some time, t, be represented as
A (t) =�NO�3
�(38)
B (t) =�NO�2
�(39)
C (t) =�NH+
4
�(40)
Allow initial concentrations A�, B�, and C�; where k1 and k2 are conditional rate
constants. Thus, in this manner, all other kinetic parameters are constant and all
concentrations are either negligible or in excess such that the dependence is pseudo
�rst order. Further, assume all reaction steps are �rst order. Then the reaction
rates are
dA (t)
dt= �k1A (t) (41)
dB (t)
dt= k1A (t)� k2B (t) (42)
dC (t)
dt= k2B (t) (43)
The kinetic equations are solved by Laplace transforms (Appendix A). The amount
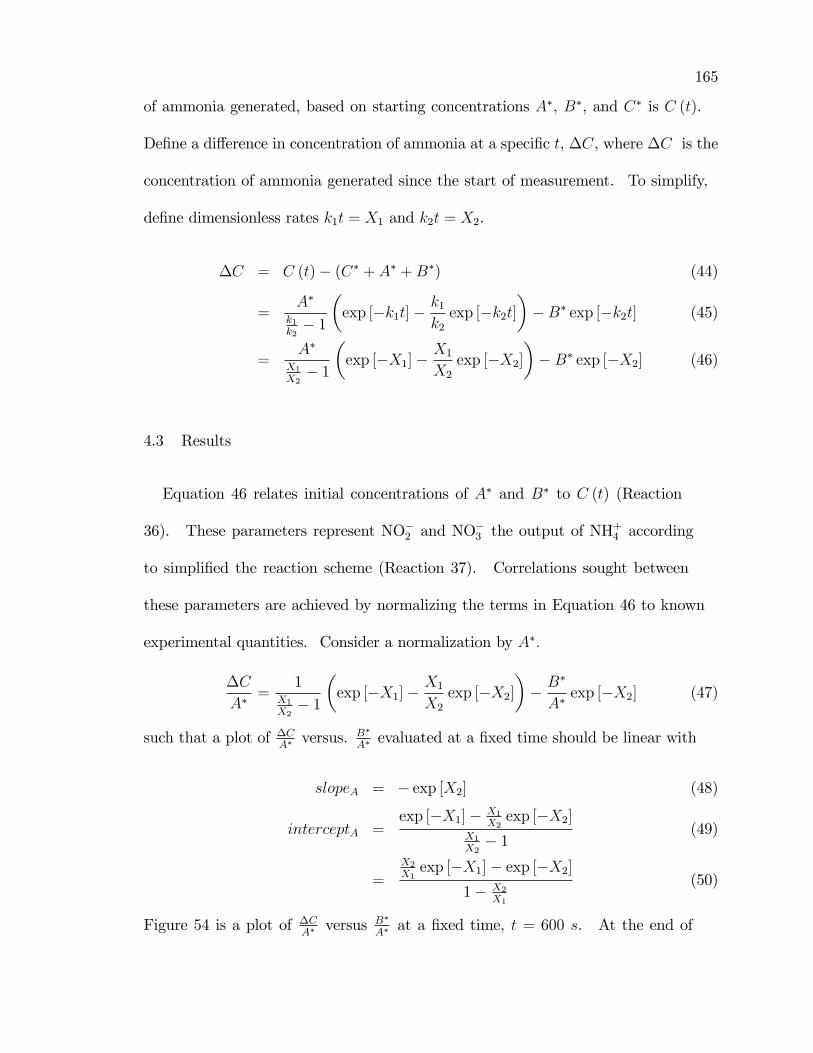
165
of ammonia generated, based on starting concentrations A�, B�, and C� is C (t).
De�ne a di¤erence in concentration of ammonia at a speci�c t, �C, where �C is the
concentration of ammonia generated since the start of measurement. To simplify,
de�ne dimensionless rates k1t = X1 and k2t = X2.
�C = C (t)� (C� + A� +B�) (44)
=A�
k1k2� 1
�exp [�k1t]�
k1k2exp [�k2t]
��B� exp [�k2t] (45)
=A�
X1X2� 1
�exp [�X1]�
X1
X2
exp [�X2]��B� exp [�X2] (46)
4.3 Results
Equation 46 relates initial concentrations of A� and B� to C (t) (Reaction
36). These parameters represent NO�2 and NO�3 the output of NH
+4 according
to simpli�ed the reaction scheme (Reaction 37). Correlations sought between
these parameters are achieved by normalizing the terms in Equation 46 to known
experimental quantities. Consider a normalization by A�:
�C
A�=
1X1X2� 1
�exp [�X1]�
X1
X2
exp [�X2]�� B
�
A�exp [�X2] (47)
such that a plot of �CA� versus.
B�
A� evaluated at a �xed time should be linear with
slopeA = � exp [X2] (48)
interceptA =exp [�X1]� X1
X2exp [�X2]
X1X2� 1
(49)
=X2X1exp [�X1]� exp [�X2]
1� X2X1
(50)
Figure 54 is a plot of �CA� versus
B�
A� at a �xed time, t = 600 s. At the end of
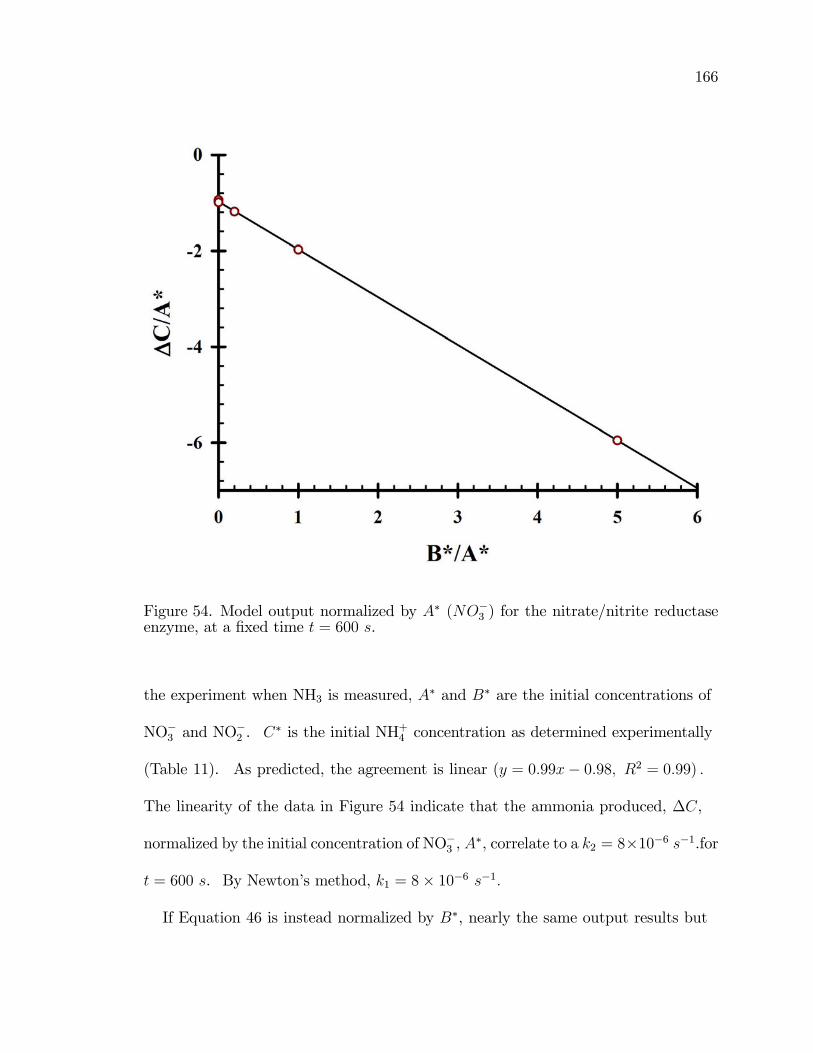
166
Figure 54. Model output normalized by A� (NO�3 ) for the nitrate/nitrite reductaseenzyme, at a �xed time t = 600 s.
the experiment when NH3 is measured, A� and B� are the initial concentrations of
NO�3 and NO�2 . C
� is the initial NH+4 concentration as determined experimentally
(Table 11). As predicted, the agreement is linear (y = 0:99x� 0:98; R2 = 0:99) :
The linearity of the data in Figure 54 indicate that the ammonia produced, �C,
normalized by the initial concentration of NO�3 , A�, correlate to a k2 = 8�10�6 s�1.for
t = 600 s. By Newton�s method, k1 = 8� 10�6 s�1:
If Equation 46 is instead normalized by B�, nearly the same output results but
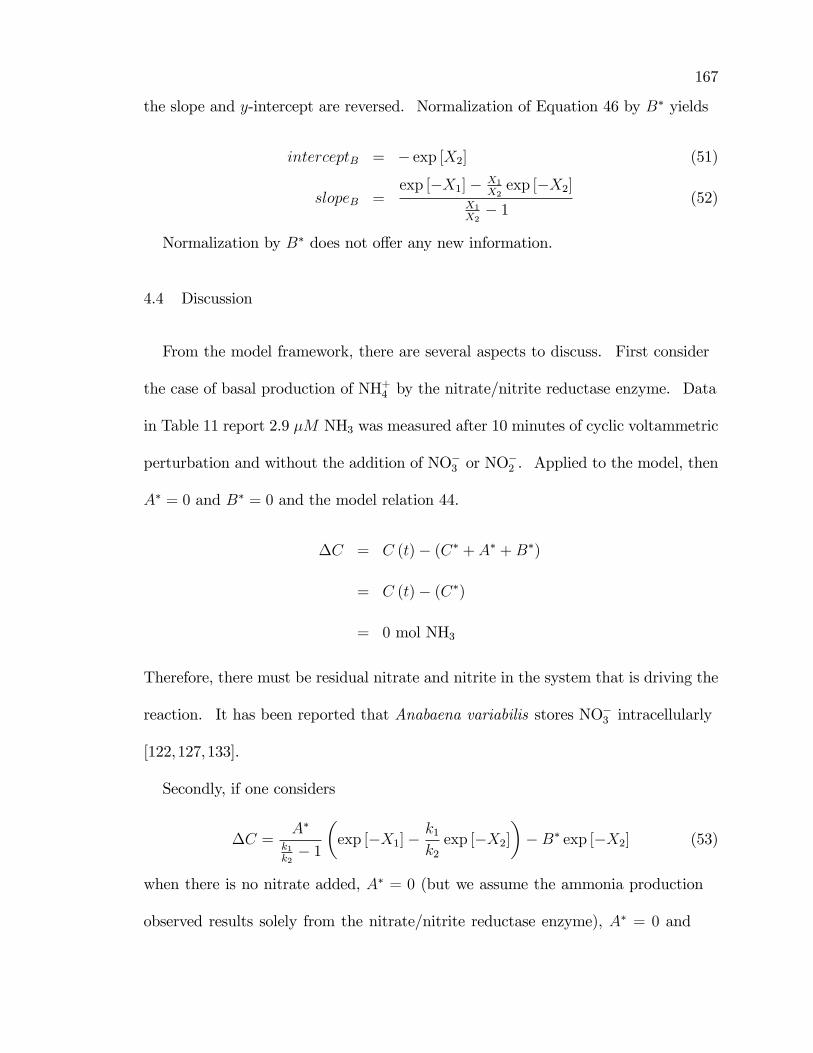
167
the slope and y-intercept are reversed. Normalization of Equation 46 by B� yields
interceptB = � exp [X2] (51)
slopeB =exp [�X1]� X1
X2exp [�X2]
X1X2� 1
(52)
Normalization by B� does not o¤er any new information.
4.4 Discussion
From the model framework, there are several aspects to discuss. First consider
the case of basal production of NH+4 by the nitrate/nitrite reductase enzyme. Data
in Table 11 report 2.9 �M NH3 was measured after 10 minutes of cyclic voltammetric
perturbation and without the addition of NO�3 or NO�2 . Applied to the model, then
A� = 0 and B� = 0 and the model relation 44.
�C = C (t)� (C� + A� +B�)
= C (t)� (C�)
= 0 mol NH3
Therefore, there must be residual nitrate and nitrite in the system that is driving the
reaction. It has been reported that Anabaena variabilis stores NO�3 intracellularly
[122,127,133].
Secondly, if one considers
�C =A�
k1k2� 1
�exp [�X1]�
k1k2exp [�X2]
��B� exp [�X2] (53)
when there is no nitrate added, A� = 0 (but we assume the ammonia production
observed results solely from the nitrate/nitrite reductase enzyme), A� = 0 and
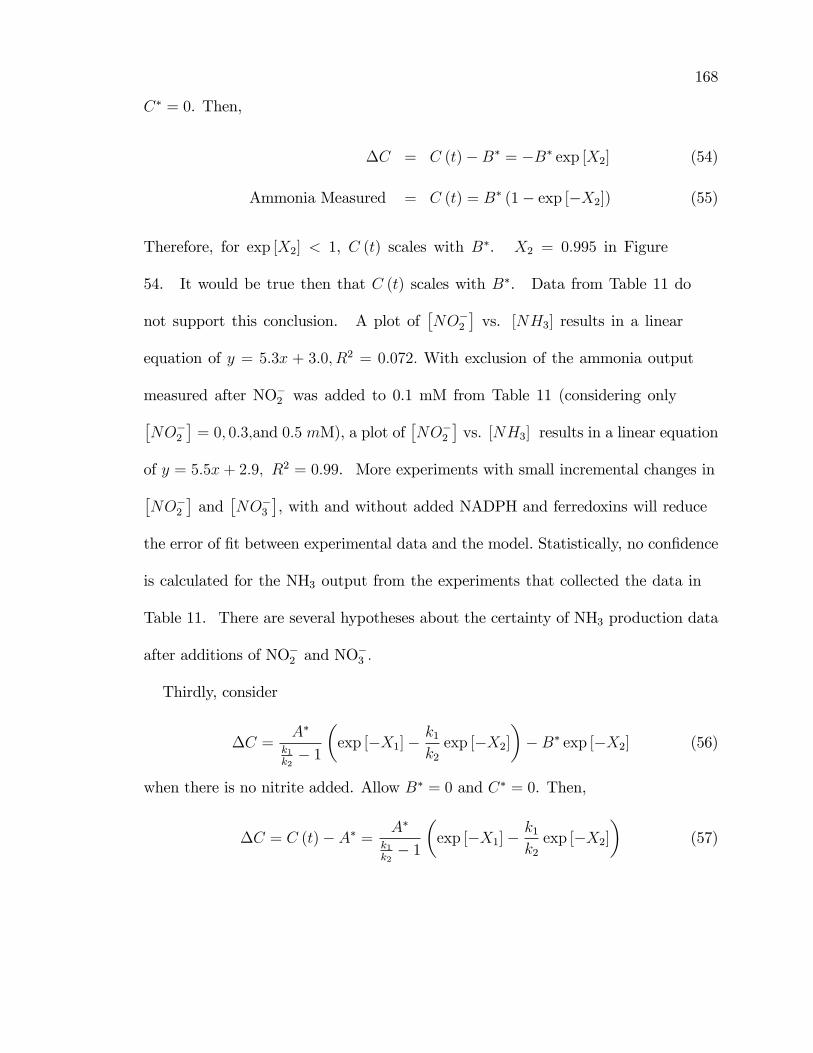
168
C� = 0. Then,
�C = C (t)�B� = �B� exp [X2] (54)
Ammonia Measured = C (t) = B� (1� exp [�X2]) (55)
Therefore, for exp [X2] < 1, C (t) scales with B�. X2 = 0:995 in Figure
54. It would be true then that C (t) scales with B�. Data from Table 11 do
not support this conclusion. A plot of�NO�2
�vs. [NH3] results in a linear
equation of y = 5:3x + 3:0; R2 = 0:072: With exclusion of the ammonia output
measured after NO�2 was added to 0.1 mM from Table 11 (considering only�NO�2
�= 0; 0:3;and 0:5 mM), a plot of
�NO�2
�vs. [NH3] results in a linear equation
of y = 5:5x+ 2:9; R2 = 0:99. More experiments with small incremental changes in�NO�2
�and
�NO�3
�, with and without added NADPH and ferredoxins will reduce
the error of �t between experimental data and the model. Statistically, no con�dence
is calculated for the NH3 output from the experiments that collected the data in
Table 11. There are several hypotheses about the certainty of NH3 production data
after additions of NO�2 and NO�3 :
Thirdly, consider
�C =A�
k1k2� 1
�exp [�X1]�
k1k2exp [�X2]
��B� exp [�X2] (56)
when there is no nitrite added. Allow B� = 0 and C� = 0. Then,
�C = C (t)� A� = A�
k1k2� 1
�exp [�X1]�
k1k2exp [�X2]
�(57)
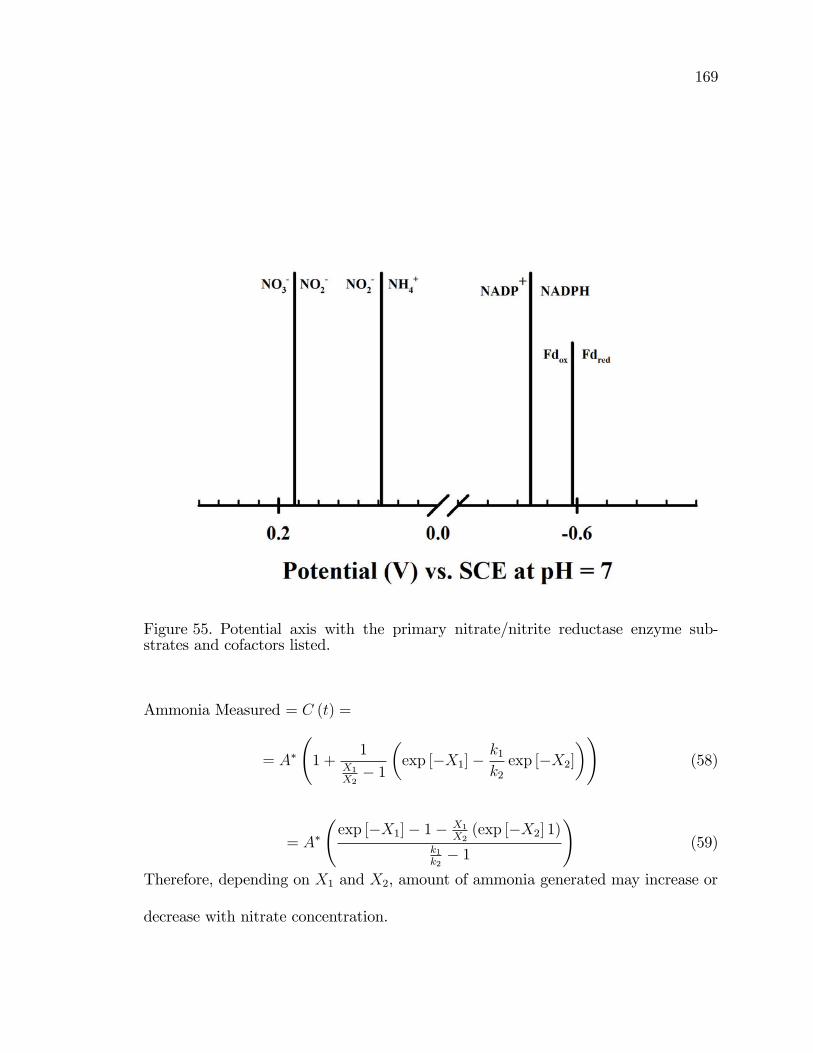
169
Figure 55. Potential axis with the primary nitrate/nitrite reductase enzyme sub-strates and cofactors listed.
Ammonia Measured = C (t) =
= A�
1 +
1X1X2� 1
�exp [�X1]�
k1k2exp [�X2]
�!(58)
= A�
exp [�X1]� 1� X1
X2(exp [�X2] 1)
k1k2� 1
!(59)
Therefore, depending on X1 and X2, amount of ammonia generated may increase or
decrease with nitrate concentration.
170
In consideration of the model and�NO�2
�,�NO�3
�; [NADPH] ;and [ferredoxins]
mediator and substrate additions in Table 11, there are several observations made.
The following discussion references Figure 55. The potential axis in Figure 55 is a
simpli�ed plot from the reactions listed in Tables 13, 14, and 15. The potential
axis aids in visualizing thermodynamic reaction possibilities such as spontaneous
reactions. The oxidized form of one redox couple can be electrolyzed by the reduced
form of another redox couple further down the axis, as explained with Figure 49.
Several observations make clear that the most likely redox reactions involved
in increased production of NH3 from immobilized A. var. under applied driving
force are those involved in the nitrate/nitrite reductase enzyme path. The model
framework has also been constructed for the same enzyme, thus, qualitative analysis
of the data from Table 11 lead to mapping of reaction pathways. The following
discussion topics suggest mechanistic routes of ammonia production by nitrate/nitrite
reductase at cyanobacteria modi�ed electrodes. The following discussions illustrate
how to organize the data and how they contribute to the mechanistic framework.
Not all statements in this discussion have been experimentally veri�ed.
A 0.01 mg/mL ferredoxins in 0.1 M Na2SO4 background electrolyte.
Low ammonia output (3.6 �M) results when NO�3 and NO�2 were added. Ferredoxins
are not limiting or needed in the cell. The cells have su¢ cient ferredoxins available
to catalyze the reduction of the inherent levels NO�2 and NO�3 : Also, spontaneous
oxidation of the ferredoxin from the Fe2+ to Fe3+ would diminish the ability of
ferredoxin to e¤ectively donate electrons to nitrate/nitrite reductase. Solutions from
which data are correlated were not sparged of dissolved O2. High ammonia output
171
(29.9 �M) results when only NO�3 was added. Ferredoxins are diverted rapidly to
the nitrate to nitrite conversion step in the enzyme. Remaining ferredoxins available
to reduce NO�2 to ammonia. The potentials are properly poised if the catalysis is
not kinetically limited.
A 1 mM NADPH in 0.1 M Na2SO4 background electrolyte. The highest
ammonia output (37.8 �M) was measured without NO�2 or NO�3 addition. NADPH
is a cofactor for nitrate reductase (Figure 6). A. var. can store NO�3 in the cytosol.
Provision of reduced NADPH, if limiting intracellularly, increased enzyme turnover
of stored NO�3 to produce a high amount of NO�2 . Assumes su¢ cient reduced
ferredoxins present in the cytosol provide electrons to nitrite reductase, NO�2 in
excess by high turnover of NO�3 to NO�2 . This results in high amount output. High
ammonia output (26.3 �M) was measured with NO�2 or NO�3 addition. NH+4 and
NO�3 can react spontaneously to produce NO�2 . Increased NO�2 depends on �xed
availability of reduced ferredoxins, no supplied additionally. Thus, NH3 output
not as high as without NO�2 and NO�3 due to loss of NH
+4 and limiting ferredoxins.
Until supplies exhausted, high enzyme turnover results in high ammonia output.
Ferredoxins to 0.01 mg/mL plus NADPH to 1 mM in 0.1 M Na2SO4
background electrolyte. NADP+jNADPH and Fd(Fe3+)jFd(Fe2+) reactions have
nearly the same formal potential. When added to solution simultaneously, the
fraction of oxidized and reduced forms readily changes based on local pH. Non zero
fraction of NO�3 /NO�2 additions result in statistically similar ammonia output. High
ammonia output (21.5 �M) was measured without NO�2 or NO�3 addition. Lower
ammonia output than observed when NADPH and Fd(Fe2+) were added separately.
172
Suggests neither NO�2 nor NO�3 are limiting. High ammonia output (19.1 �M) was
measured with NO�3 addition. NADPH spontaneous reduction of NO�3 to a product
other than NO�2 away from nitrate reductase, thus NO�2 produced. Addition of
NO�3 did not directly increase ammonia production suggest that NO�3 is not limiting.
High ammonia output (21.6 �M) was measured with NO�2 addition. Similar to 3b,
addition of NO�2 did not directly increase ammonia production suggest that NO�2
is not limiting. Moderate ammonia output (13.7 �M) was measured with NO�3
and NO�2 addition. Insu¢ cient cofactor present to catalyze reduction of increased
substrates.
There are other types of observations to be made from these data. The framework
model presents a foundation for a deeper mechanistic understanding of the A. var.
production of NH3.
173
CHAPTER 5
CONCLUSIONS
The major conclusions of this research are presented here categorically. Overall,
the goal of the research was to identify and construct a system to produce ammonia
in a renewable manner. This goal was achieved and at ambient temperatures and
pressure. A catalyst is still required, as in the commercial Haber Bosch synthesis,
however it is sourced from immobilized cyanobacteria. Thus, the system developed
in this research produces ammonia from a renewable source with minimal energy
input and at ambient temperature and pressure. Overall, the e¢ ciency of the
bioelectrocatalytic device as compared to the e¢ ciency of unaltered cyanobacteria
in nature has not been calculated or estimated.
5.1 Increased Ammonia Production Depends onElectrode Polarization
As discussed in Chapter 3, without the application of cyclic voltammetry to the
cells, ammonia output does not increase above basal output. This suggests that
the electrochemical reactions between cells and the electrode respond to an applied
potential for the purpose of ammonia production. Cells that were subjected to
cycled potential produced a ten-fold increase in NH3, all other parameters and
conditions equal. Ammonia production by the bioelectrocatalytic device requires an
externally applied driving force. Therefore, both the electrode and applied potential
are key components to ammonia production from immobilized cyanobacteria. In
174
this research, small potential perturbation is su¢ cient for NH3 production by cells
immobilized to an electrode surface. Cyclic voltammetry was used to polarize the
electrode from 0.8 V to -0.3 V and then potential cycled back to 1.1 V vs SCE.
While a speci�c electrolysis potential was not identi�ed, it must fall within this
potential range employed in this research. The free energy barrier (�G) to produce
ammonia from nitrogenase is -3.3 kJ and from nitrate/nitrite reductase is -17.4 kJ
for NO�3 to NO�2 and -6.9 kJ for NO
�2 to NH
+4 . Thus, when the electrode is polarized
at 1 V, �G = �96 kJ for a one electron transfer. Thus, from an thermodynamic
treatment, this system is energetically e¢ cient. The energy available to drive
the enzyme catalysis is more than su¢ cient to drive each step in the conversion
process. There are kinetic, concentration, and access considerations that alter the
thermodynamic e¢ ciency of this system, however they are not yet fully understood
so such a calculation is not presented.
5.2 Ammonia Production at AmbientTemperature and Pressure
Low basal levels of ammonia production by batch (125 mL) cultures of A. var.
have been measured with an ammonia ion selective electrode. This measurement
represents the in vivo output of NH3. This basal output of ammonia from 15 mL
samples of well mixed cultures (where cells and debris are removed) is 2.8 � 0.4 �M:
After voltammetric perturbation of the same density of cells immobilized to the
electrodes at various scan rates, average ammonia production for select experimental
conditions increased in the range of 5 to 30 �M; depending on the concentrations of
175
substrate and cofactor species. Signi�cant energy is required to raise temperature
and pressure. Any system that can achieve e¢ cient production, even if not at 100%
theoretical e¢ ciency, without the added cost of increasing temperature and pressure
and desirable.
5.3 Nitrate/Nitrite Reductase EnzymeElectrochemically Accessible
Alternative enzyme pathways that produce ammonia are present in Anabaena
variabilis such as the nitrite/nitrate reductase enzyme. The data are more consistent
with this enzyme than nitrogenase. Data analyzed do not con�ict with known
biochemistry of nitrate/nitrite reductase. From the data, a linear relationship
exists between the observed faradaic current response from cells immobilized to an
electrode and the density of ammonia produced. Electrochemical perturbation is
necessary to increase NH3 produced. Cells immobilized to an electrode and left
in the electrochemical cell do not produce increased ammonia unless a potential is
applied, as in cyclic voltammetry. After voltammetry is completed, the electrodes
that contain cells are more di¢ cult to clean. This suggests that cells are speci�cally
adsorbed to the surface of the electrode during polarization. Mechanistically,
this e¤ect is not well de�ned, but it is believed to be related to alteration of
cell membrane permeability. Under polarization, cells interface directly with the
electrode, where electron transfer between nitrate/nitrite reductase is enhanced due
to a reduction in the physical barrier. There are likely mediating species involved
in this system, such as NO, however additions of NO�2 and NO�3 have a signi�cant
176
e¤ects on ammonia production and faradaic current responses (from Chapter 4).
5.4 Mechanistic Framework Model
Initial model output suggest that in a simpli�ed system considering only the
reduction of NO�3 to NO�2 to NH3 by the nitrate/nitrite reductase enzyme, the kinetic
rate for NO�3 to NO�2 is either very fast and not observed at cyclic voltammetric
scan rates, or is in fact the same as the kinetic rate of NO�2 to NH3. Plotting�NO�2
�,�NO�3
�; [NADPH] ;and [ferredoxins] on a single potential axis shows that
electrochemically it is di¢ cult to distinguish between NADPH and ferredoxins
because they have nearly the same formal potentials. Both NADPH and ferredoxins
have been implicated in either step of nitrate/nitrite reductase. Comparison of
ammonia output to tested variables suggest several possibilities about limiting
reactants and rates for the enzyme under voltametric perturbation. Model output
shows linear agreements, yet the kinetic output does not re�ect known biochemistry.
The model lacks complex levels of feedback and thus, does not accurately re�ect
known electrochemical or biological steps.
From the data, the mechanism of ammonia production is likely mediated at an
electrode surface. From the reaction possibilities plotted in Figures 52 and 51,
NO and N2O are likely candidates for enzymejelectrode mediation. With proper
identi�cation of the mediator and any intermediate productions involved in the
electrode polarization dependent nitrate/nitrite reductase production of ammonia,
the kinetics of the mediator will fold into the framework to o¤er a more exact
description of the observed behavior.
177
5.5 Possible Impacts and Signi�cance
Here, the feasibility of ammonia produced by the method developed in this
research is considered. Ammonia output from the bioelectrocatalytic device was
never expected to compete directly with the commercial synthesis. However,
there is utility in comparison of the two methods. It is important to note several
assumptions and limitations of the bioelectrocatalytic device.
The bioelectrocatalytic device contains living photosynthetic cyanobacteria.
With light/dark cycles on earth, high rates of NH3 production are limited to hours
of daylight. This is especially true for a system that obtains its power from a solar
device such as a large photovoltaic panel, as suggested in Figure 56. While even
photosynthetic organisms have dark reactions that complete respiration cycles in the
absence of sunlight, the cells used in this research are illuminated 24 hours a day.
After immobilization, cyclic voltammetry with cell modi�ed electrodes is performed
in a relatively dark location and in the absence of any applied light. Thus, it is
reasonable to conclude there would still be ammonia production by system even
during times of darkness. The calculations presented do not include ammonia
produced in the dark.
The most e¢ cient use of the produced ammonia by this device would be as a
fertilizer. Most notably, the bioelectrocatalytic device has a very small environmental
footprint and demonstrates a sound ecological system that consumes wastes to
generate fuel. The comparison below does not consider the e¤ort or cost of
harvesting aqueous NH+4 produced by the cells but could conceivably be applied
178
physical footprint.
5.6 Comparison to Haber Bosch Commercial Synthesisand Research Signi�cance
The research results described in this dissertation show that common animal
wastes, NO�2 and NO�3 , are substrates for nitrate/nitrite reductase. Nitrate/nitrite
reductase, found in common cyanobacteria, are subjected to a potential gradient by
immobilization to an electrode that itself is polarized with minimal energetic input
(1 V). Currently, there are no systems reported or commercially available that can
achieve ammonia production from animal waste products at ambient temperature
and pressure with a minimal dependence on the environment. While the mechanisms
and substrate for N2 reduction to NH3 by nitrogenase is a distinct manner by which
to generate ammonia in cyanobacteria, it is also the most commonly employed
commercial synthesis to produce ammonia. Thus, to understand the signi�cant
impacts and possible implications of the bioelectrocatalytic device, the ammonia
output and energetic input balance for the research here is compared to the
commercial Haber Bosch synthesis. It is important to note the distinct di¤erences
between the Haber Bosch synthesis of ammonia and the bioelectrocatalytic device
production of ammonia. They are not the same process; the Haber Bosch
catalytically reduced N2 to NH3 at high temperature and pressure, while the
bioelectrocatalytic device enzymatically produces ammonia from NO�2 and NO�3 at
polarized electrodes. Because the world is dependent upon commercially available
ammonia, the comparison between Haber Bosch and bioelectrocatalytic ammonia
179
serves only to illustrate the economic and environmental signi�cance of alternative
ammonia production.
In the laboratory, the electrode is connected to a potentiostat. The potentiostat
controls the potential drop between the cell immobilized working electrode and the
reference electrode. The potentiostat is an electrically powered instrument, but in
theory, it could be replaced by simple electronics and powered with a photovoltaic
device as shown in Figure 56:
As shown in Table 16; the bioelectrocatalytic device exhibits signi�cant energetic
and economic di¤erences as compared to the Haber Bosch synthesis. The data in
Table 16 are calculated based on production of 1 ton of NH3 per day. Several aspects
of the scaled up system must be considered. Certainly, a signi�cant portion of land
would need to be designated for the device area. The device data presented in Table
16 were extrapolated from small scale laboratory data and at a two dimensional
electroactive surface, but as mentioned previously, di¤erent electrode materials could
be used to construct a three dimensional electrode. Because the production rate
is slow compared to commercial syntheses, a large electroactive area with a high
density of cells must operate for extended periods. The area required to generate
1 ton NH3/day could likely be reduced by using a high surface area carbon mesh
electrode material. For example, woven carbon �ber, a suitable electrode material,
has much higher surface area than the �at non porous surface such as the electrodes
used in this research. With appropriate intercalation of larger densities of cells into
a higher surface area electrode, the footprint area of the electrode can be reduced
proportional to the gain in surface area of the electrode material. Thus, a 31 acre
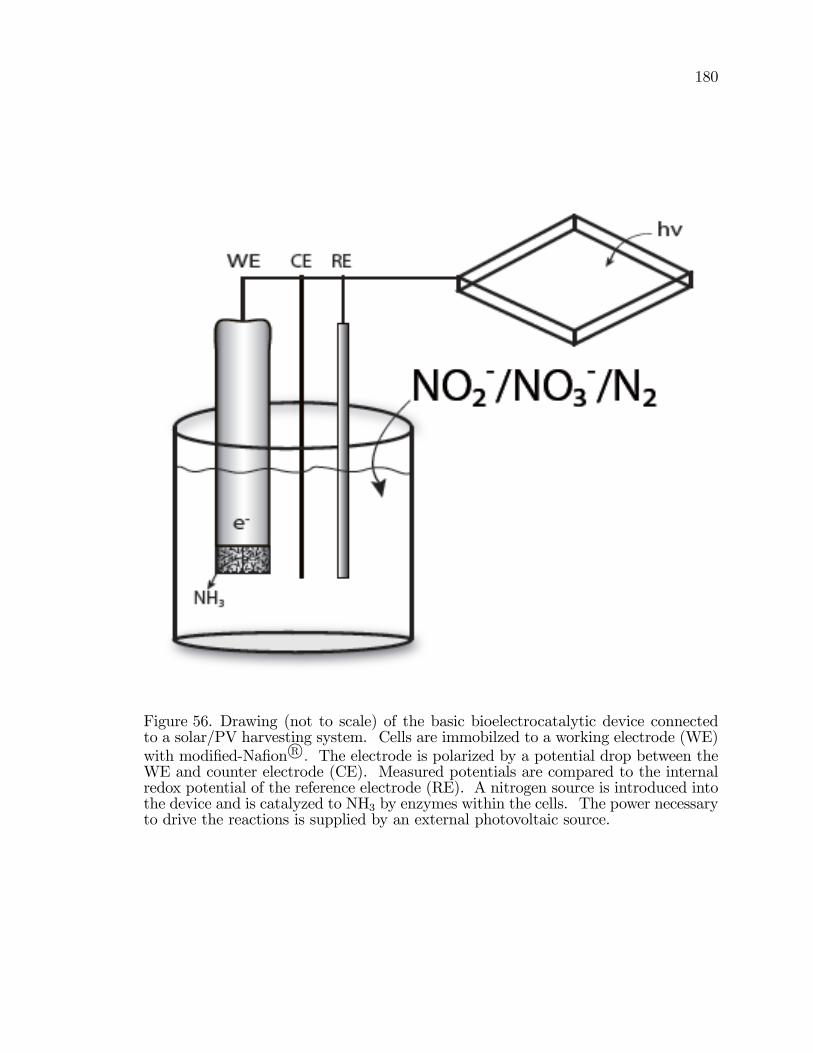
180
Figure 56. Drawing (not to scale) of the basic bioelectrocatalytic device connectedto a solar/PV harvesting system. Cells are immobilzed to a working electrode (WE)with modi�ed-Na�on R : The electrode is polarized by a potential drop between theWE and counter electrode (CE). Measured potentials are compared to the internalredox potential of the reference electrode (RE). A nitrogen source is introduced intothe device and is catalyzed to NH3 by enzymes within the cells. The power necessaryto drive the reactions is supplied by an external photovoltaic source.
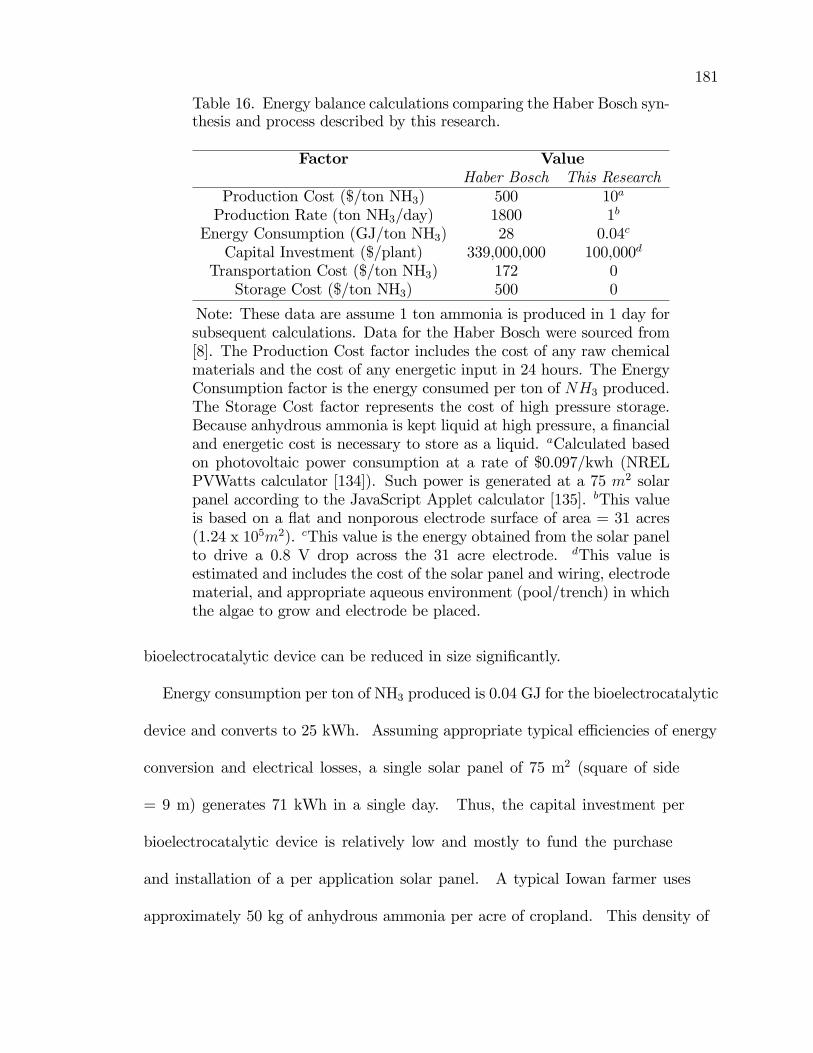
181
Table 16. Energy balance calculations comparing the Haber Bosch syn-thesis and process described by this research.
Factor ValueHaber Bosch This Research
Production Cost ($/ton NH3) 500 10a
Production Rate (ton NH3/day) 1800 1b
Energy Consumption (GJ/ton NH3) 28 0.04c
Capital Investment ($/plant) 339,000,000 100,000d
Transportation Cost ($/ton NH3) 172 0Storage Cost ($/ton NH3) 500 0
Note: These data are assume 1 ton ammonia is produced in 1 day forsubsequent calculations. Data for the Haber Bosch were sourced from[8]. The Production Cost factor includes the cost of any raw chemicalmaterials and the cost of any energetic input in 24 hours. The EnergyConsumption factor is the energy consumed per ton of NH3 produced.The Storage Cost factor represents the cost of high pressure storage.Because anhydrous ammonia is kept liquid at high pressure, a �nancialand energetic cost is necessary to store as a liquid. aCalculated basedon photovoltaic power consumption at a rate of $0.097/kwh (NRELPVWatts calculator [134]). Such power is generated at a 75 m2 solarpanel according to the JavaScript Applet calculator [135]. bThis valueis based on a �at and nonporous electrode surface of area = 31 acres(1.24 x 10⁵m2). cThis value is the energy obtained from the solar panelto drive a 0.8 V drop across the 31 acre electrode. dThis value isestimated and includes the cost of the solar panel and wiring, electrodematerial, and appropriate aqueous environment (pool/trench) in whichthe algae to grow and electrode be placed.
bioelectrocatalytic device can be reduced in size signi�cantly.
Energy consumption per ton of NH3 produced is 0.04 GJ for the bioelectrocatalytic
device and converts to 25 kWh. Assuming appropriate typical e¢ ciencies of energy
conversion and electrical losses, a single solar panel of 75 m2 (square of side
= 9 m) generates 71 kWh in a single day. Thus, the capital investment per
bioelectrocatalytic device is relatively low and mostly to fund the purchase
and installation of a per application solar panel. A typical Iowan farmer uses
approximately 50 kg of anhydrous ammonia per acre of cropland. This density of
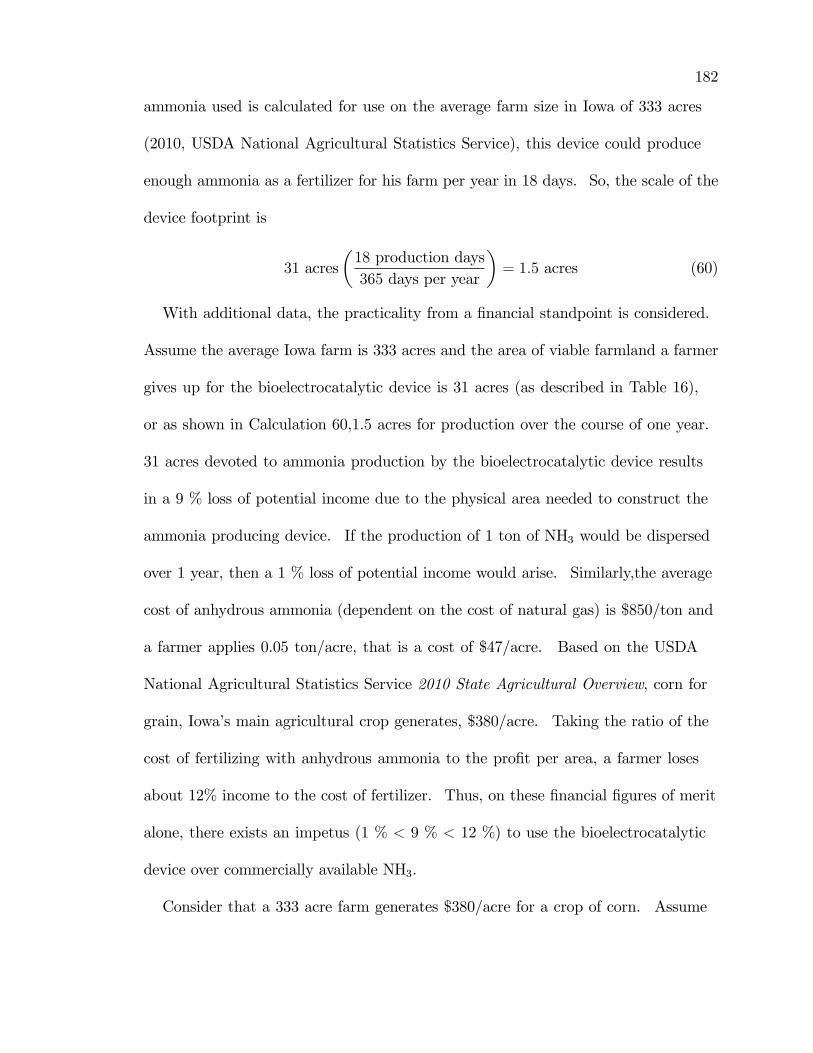
182
ammonia used is calculated for use on the average farm size in Iowa of 333 acres
(2010, USDA National Agricultural Statistics Service), this device could produce
enough ammonia as a fertilizer for his farm per year in 18 days. So, the scale of the
device footprint is
31 acres�18 production days365 days per year
�= 1:5 acres (60)
With additional data, the practicality from a �nancial standpoint is considered.
Assume the average Iowa farm is 333 acres and the area of viable farmland a farmer
gives up for the bioelectrocatalytic device is 31 acres (as described in Table 16),
or as shown in Calculation 60,1.5 acres for production over the course of one year.
31 acres devoted to ammonia production by the bioelectrocatalytic device results
in a 9 % loss of potential income due to the physical area needed to construct the
ammonia producing device. If the production of 1 ton of NH3 would be dispersed
over 1 year, then a 1 % loss of potential income would arise. Similarly,the average
cost of anhydrous ammonia (dependent on the cost of natural gas) is $850/ton and
a farmer applies 0.05 ton/acre, that is a cost of $47/acre. Based on the USDA
National Agricultural Statistics Service 2010 State Agricultural Overview, corn for
grain, Iowa�s main agricultural crop generates, $380/acre. Taking the ratio of the
cost of fertilizing with anhydrous ammonia to the pro�t per area, a farmer loses
about 12% income to the cost of fertilizer. Thus, on these �nancial �gures of merit
alone, there exists an impetus (1 % < 9 % < 12 %) to use the bioelectrocatalytic
device over commercially available NH3.
Consider that a 333 acre farm generates $380/acre for a crop of corn. Assume
183
the farmer spends $47/acre on Haber Bosch produced NH3. The crop pro�tability,
pro�t - cost of ammonia fertilizer, is $110,889. Compare to a 333 acre farm that
produces their own NH3 by the bioelectrocatalytic device for $0/acre, but loses 31
acres of land to construct and operate the device. The crop pro�tability in this case
is $114,760. Thus, the loss of land does not a¤ect the pro�t of a crop. The savings
provided by on site ammonia production by the bioelectrocatalytic device is greater
than the lost pro�t from a smaller crop. There are many types of these calculations
that support the �nancial, energetic, and environmental signi�cance of the research
presented here.
Again, it is important to point out that while these calculations o¤er an impressive
future for bioelectrocatalytic produced ammonia from animal wastes NO�3 and NO�2 ,
they have been compared to the Haber Bosch synthesis. The calculations serve
only as an impetus to suggest future study in the area of bioelectrocatalytically
produced ammonia has the potential to signi�cantly o¤set world dependence on the
environmentally and economically expensive Haber Bosch ammonia.
184
CHAPTER 6
FUTURE WORK
Overall, the primary goal to generate ammonia at ambient temperature and
pressure was achieved. Decoupling the complex network of reactions, feedback,
mediators, and analytical correlations has proven complex. The future successes
of this research will require division of the project into several smaller research
domains. Device construction and testing outside of the laboratory is eventually
necessary.
Current cyanobacterial biotechnology research primarily studies hydrogen
production and biomass feedstock development. Simultaneously, many study
protein and enzyme interactions with electrodes in electroanalytical systems. Yet
a third distinct area of cyanobacterial research explores enzyme catalysis in power
systems such as fuel cells. The research described here draws from these distinct
areas of modern research and establishes an interdisciplinary approach the use of
cyanobacteria in a device that produces ammonia at ambient temperature and
pressure. While this research describes a system that achieves ammonia production
with minimal energy input, the thermodynamics, kinetics, and correlation of the
electroanalytical and biological data require additional research and should be the
focus of future work.
In all future work, it is imperative to obtain the following data for every
experiment: 1) some value of cell density like [chlorophyll a] or [total protein]; 2)
ammonia concentration before and after alteration of variables; and 3) bulk and
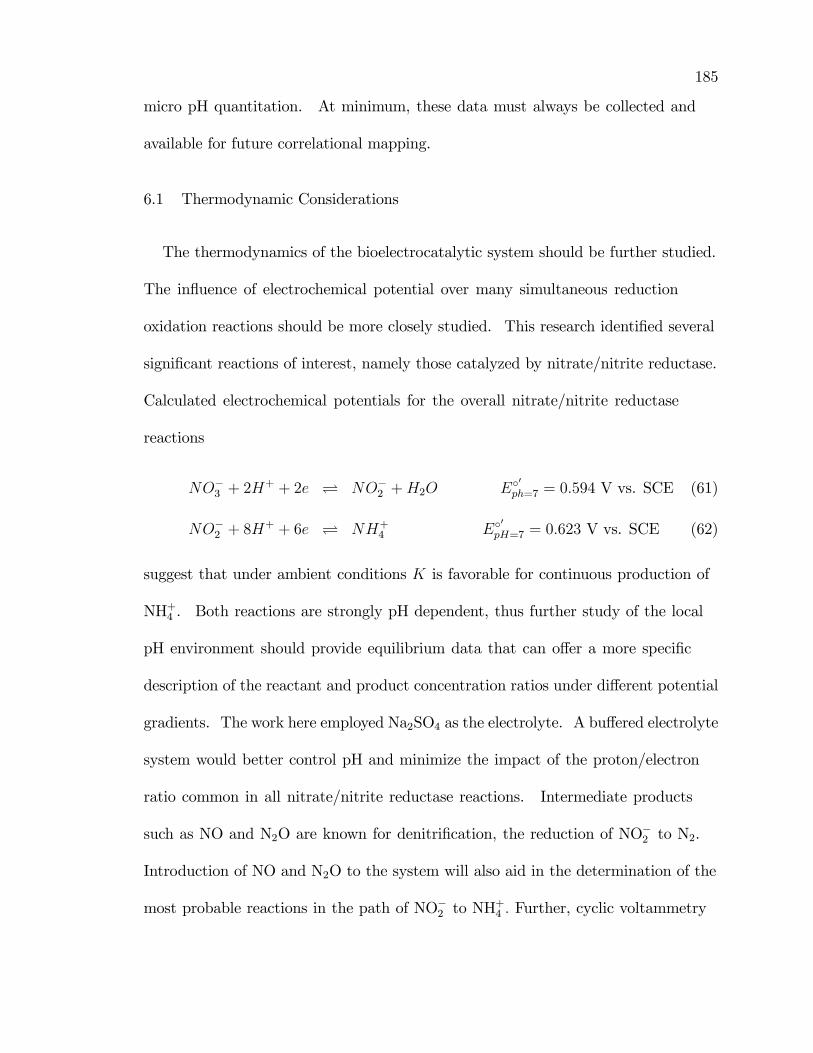
185
micro pH quantitation. At minimum, these data must always be collected and
available for future correlational mapping.
6.1 Thermodynamic Considerations
The thermodynamics of the bioelectrocatalytic system should be further studied.
The in�uence of electrochemical potential over many simultaneous reduction
oxidation reactions should be more closely studied. This research identi�ed several
signi�cant reactions of interest, namely those catalyzed by nitrate/nitrite reductase.
Calculated electrochemical potentials for the overall nitrate/nitrite reductase
reactions
NO�3 + 2H+ + 2e NO�2 +H2O E�
0
ph=7 = 0:594 V vs. SCE (61)
NO�2 + 8H+ + 6e NH+
4 E�0
pH=7 = 0:623 V vs. SCE (62)
suggest that under ambient conditions K is favorable for continuous production of
NH+4 . Both reactions are strongly pH dependent, thus further study of the local
pH environment should provide equilibrium data that can o¤er a more speci�c
description of the reactant and product concentration ratios under di¤erent potential
gradients. The work here employed Na2SO4 as the electrolyte. A bu¤ered electrolyte
system would better control pH and minimize the impact of the proton/electron
ratio common in all nitrate/nitrite reductase reactions. Intermediate products
such as NO and N2O are known for denitri�cation, the reduction of NO�2 to N2.
Introduction of NO and N2O to the system will also aid in the determination of the
most probable reactions in the path of NO�2 to NH+4 : Further, cyclic voltammetry
186
was the most used electroanalytical technique. Cycled potentials limit the ability
to calculate speci�c overpotential required to facilitate ideal enzyme optimization
and enhanced reaction kinetics. Cyclic voltammetry provides a good spectrum of
responses but other voltammetric methods may allow more ready quanti�cation of
electroactive materials.
From the reaction possibilities listed in Chapter 4, pH clearly has a signi�cant
e¤ect. Nearly all the electrochemical reaction possibilities consume protons.
Thus, in addition to the biological signi�cance of bulk vs. micro pH, there are
electrochemical interests as well. Tools and methods should be employed to carefully
monitor the e¤ect of pH on ammonia production. Micro and nano probes are
commercially available to follow pH.
6.2 Further Kinetic Evaluation
Production of NH+4 by nitrogenase or nitrate/nitrite reductase are kinetically
challenging tasks. The present kinetic framework for the reactions necessary to
accomplish e¢ cient enzyme catalysis is overly simpli�ed. It assumes all reactions
are �rst order and does not include redox mediator or cofactor reaction kinetics. As
this research has shown, ammonia production by immobilized whole cell �laments
of A. var. is signi�cantly more complicated than the model framework suggest.
While data veri�ed against the model show good agreement, they are not inclusive
of known electron donating reactions such as those of ferredoxin and NADPH.
187
6.3 Biological Considerations
From the data, enzymatic production of NH+4 as compared to known biochemistry
of Anabaena variabilis. Electron transfer across the cell membrane has not been
reported, thus the possibility exists the increased ammonia production related to
a biophysical interaction between cell or cell product and the electrode. Future
work should study cell lysate as has been done for whole cells. A whole cell lysate
preparation disrupts cells and removes of all cellular debris. The resultant solution
contains cytosolic components such as nitrogenase and nitrate/nitrite reductase.
This enzyme containing solution can be equilibrated into an electrode �lm and
studied as this research has. Such research would delineate between cellular and
enzymatic processes.
NADPH introduction to the external media has a signi�cant e¤ect on both
ammonia production and voltammetry. Some of these e¤ects are likely due to
the bu¤ering capacity of NADPH/NADP+: Commercial preparations of reduced
NADPH are expensive. For the system described here, studies should be conducted
with the redox active moiety of NADPH, nicotinamide. Nicotinamide is inexpensive
and can be electrochemically reduced. Nicotinamide could be a electron shuttle
for nitrogenase and nitrate/nitrite reductase. Further, the redox state of biological
cells is often measured by the ratio between reduced and oxidized forms of
NADP+:NADPH. Commercial assay kits are readily available to measure and
quantify this ratio. Measurement of the ratio between the oxidized and reduced
forms at di¤erent stages of voltammetric perturbation can be correlated to ammonia
188
production. These type of data can be used to expand the model framework to
include mediating and cofactor species.
To deconvolute the complex layers of chemical, biological, and electrochemical
feedback, biological inhibitors should be employed. For example, as shown in
Chapter 3, methionine D,L-sulfoximine (MSX) e¤ectively blocks glutamine sythetase
reuptake of NH+4 . In the future, use of MSX in experiments directly focused on
nitrate/nitrite reductase produced ammonia may eliminate several layers of feedback.
In measurements from bulk culture, the highest ammonia output was measured from
cells that were cultured in BG-110 media supplemented with both NO�2 and MSX.
Another area of future work in the biological realm would be to coordinate
with biologists and explore �ne level protein control through adequate analytical
understanding of the proteins present. Whole cell systems are complicated because
there are so many proteins present. It is not clear from the research described here
what the most prominent proteins are in the measurement of redox reactions related
to the enzymatic production of NH3. A Western Blot is the separation of proteins
through antibody/antigen binding. Higher level identi�cation of the proteins present
would limit the redox reaction possibilities and aid in further development of the
kinetic model to describe the e¤ect of electrode polarization on ammonia production.
6.4 Experimental Considerations
From an experimental basis, there are several parameters that should be
determined and optimized. A signi�cant focus should be placed on localization of
the electrochemical reactions that are measured by the electrode. As discussed
189
in Chapter 4, several prominent reaction possibilities are apparent based on data
obtained thus far. Careful construction of experiments with mediators such as NO
and N2O may limit reaction possibilities to only several as compared to thirty or
more.
As discussed and shown in Chapters 3 and 4, electrode polarization is necessary
to drive the catalytic production of NH+4 from NO�2 and NO�3 . From the data, it
is not yet clear whether a speci�c potential exists that would e¢ ciently support
nitrate/nitrite reductase produced ammonia. Instead of cyclic voltammetry,
attention should be given to discreet potentials as in bulk electrolysis. There may be
a speci�c potential necessary to optimally interface between electrode and enzyme.
One can envision the bioelectrocatalytic device operation at this speci�c potential
for sustained periods of time where ammonia production may be higher, barring any
kinetic of chemical substrate limitations.
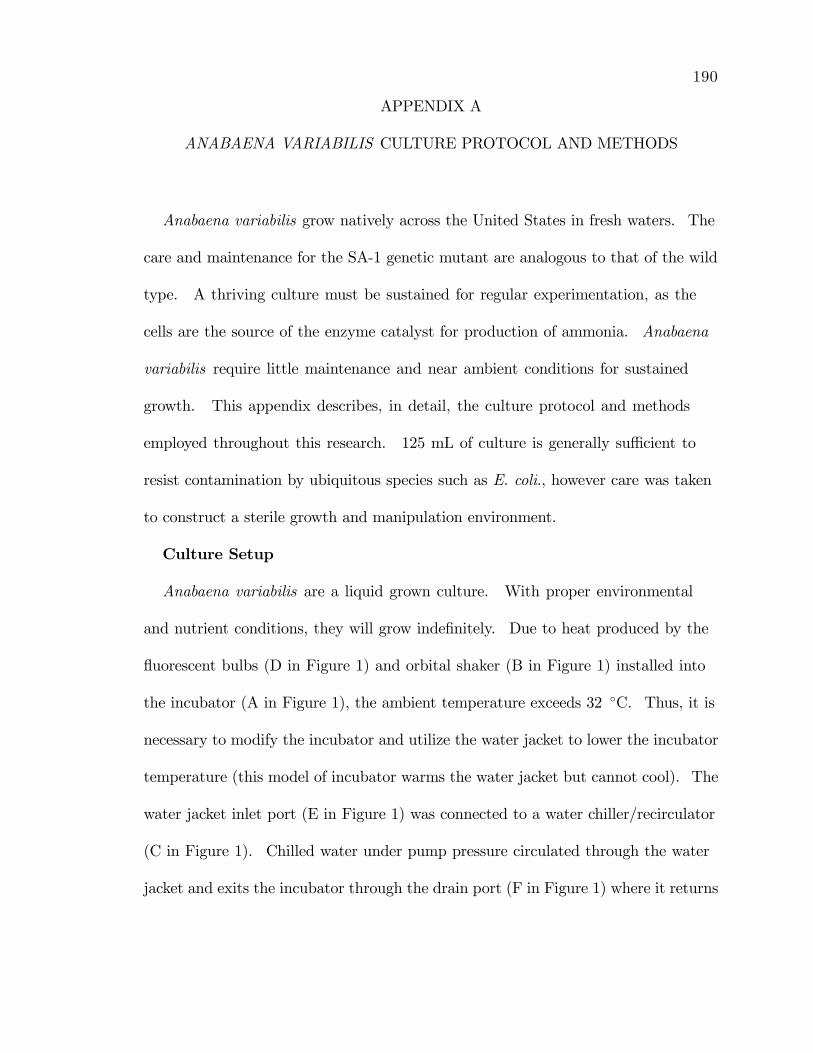
190
APPENDIX A
ANABAENA VARIABILIS CULTURE PROTOCOL AND METHODS
Anabaena variabilis grow natively across the United States in fresh waters. The
care and maintenance for the SA-1 genetic mutant are analogous to that of the wild
type. A thriving culture must be sustained for regular experimentation, as the
cells are the source of the enzyme catalyst for production of ammonia. Anabaena
variabilis require little maintenance and near ambient conditions for sustained
growth. This appendix describes, in detail, the culture protocol and methods
employed throughout this research. 125 mL of culture is generally su¢ cient to
resist contamination by ubiquitous species such as E. coli., however care was taken
to construct a sterile growth and manipulation environment.
Culture Setup
Anabaena variabilis are a liquid grown culture. With proper environmental
and nutrient conditions, they will grow inde�nitely. Due to heat produced by the
�uorescent bulbs (D in Figure 1) and orbital shaker (B in Figure 1) installed into
the incubator (A in Figure 1), the ambient temperature exceeds 32 �C. Thus, it is
necessary to modify the incubator and utilize the water jacket to lower the incubator
temperature (this model of incubator warms the water jacket but cannot cool). The
water jacket inlet port (E in Figure 1) was connected to a water chiller/recirculator
(C in Figure 1). Chilled water under pump pressure circulated through the water
jacket and exits the incubator through the drain port (F in Figure 1) where it returns
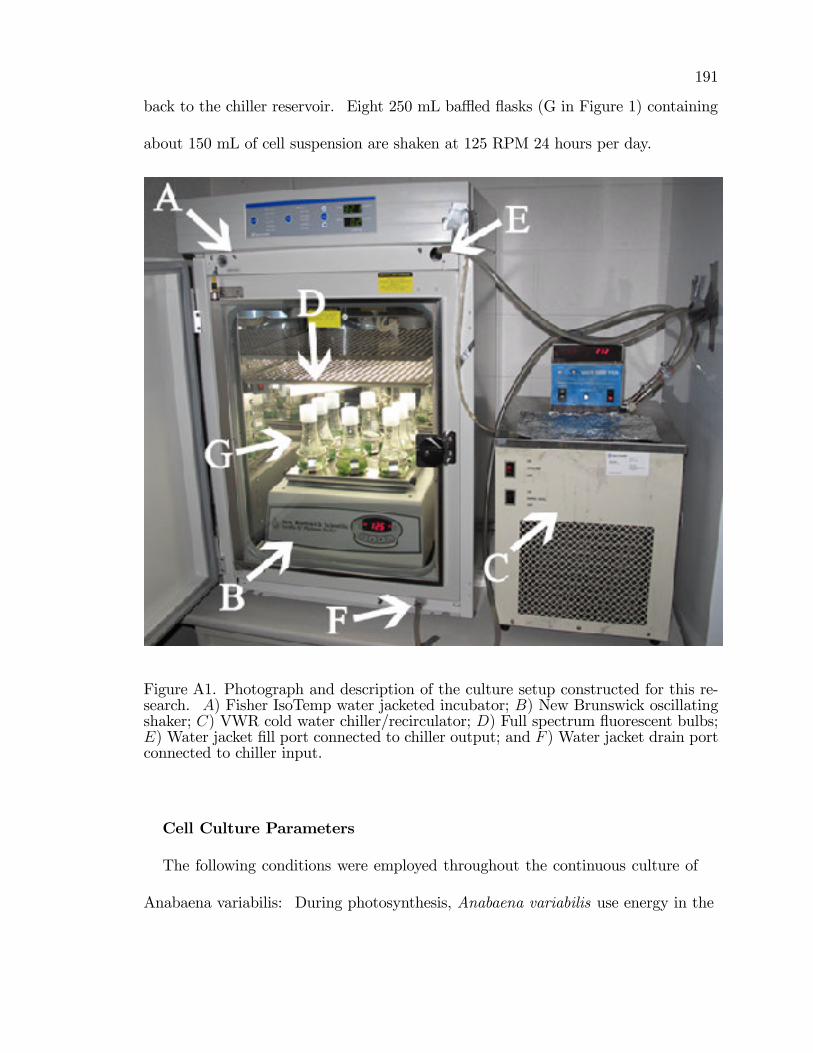
191
back to the chiller reservoir. Eight 250 mL ba ed �asks (G in Figure 1) containing
about 150 mL of cell suspension are shaken at 125 RPM 24 hours per day.
Figure A1. Photograph and description of the culture setup constructed for this re-search. A) Fisher IsoTemp water jacketed incubator; B) New Brunswick oscillatingshaker; C) VWR cold water chiller/recirculator; D) Full spectrum �uorescent bulbs;E)Water jacket �ll port connected to chiller output; and F )Water jacket drain portconnected to chiller input.
Cell Culture Parameters
The following conditions were employed throughout the continuous culture of
Anabaena variabilis: During photosynthesis, Anabaena variabilis use energy in the
192
region of the electromagnetic spectrum from 400 700 nm. The radiation in this
range, referred to as Photosynthetically Active Radiation (PAR), is measured as
Photosynthetic Photon Flux Density (PPFD), which has units of quanta (photons)
per unit time per unit surface area. The units most commonly used are micromoles
of quanta per second per square meter. An Einstein (E) is a unit de�ned as one
mole (6:022� 1023) of photons.
� Culture volume: 175 mL of cell suspension in 250 mL ba ed culture �asks
� Temperature: 32 � 2 �C
� Illumination: Two 14w Octron (Phillips) 20" full spectrum (400-700 nm)�uorescent lamps installed 20 cm above the top of the culture �asks. Thesebulbs were illuminated 24 hours a day and provided 31.8 � 1:6 �E �m�2s�1 asmeasured at the base of the culture �ask. The PFFD was measured with aLI 190 Quantum Sensor (Li-Cor).
� Media is changed every two weeks or more frequently as needed.
� The air environment in the incubator has been challenging to determine.Several report the necessity to provide CO2 for respiration purposes, but thisresearch determined ambient CO2 levels su¢ cient. 0.1 % CO2 has been usedfor cultures that did not appear to be growing.
Cell Lines
Two strains of Anabaena variabilis are cultured simultaneously. In initial
inoculate, Anabaena variabilis Kutz, was purchased from the American Type
Culture Collection (ATCC) in May, 2009. A genetic mutant, the SA-1 strain, was
obtained from K.T. Shanmugam of the University of Florida. Samples of each have
been frozen for future subculture.
Media Preparation
Anabaena variabilis are grown on BG-110, a freshwater algae medium. Media is
made in the laboratory as needed. To prepare 1 L of BG-110 media:

193
1. Obtain clean 1 L media bottles (pyrex, orange caps) which have been thoroughly
rinsed with DI water and are free of debris.
2. Add the appropriate Standard Reagents shown in Table 1 to 1 L DI water and
thoroughly mix. Some agitation or light sonication may be necessary to fully
dissolve the chemicals.
3. With a 3 point calibrated pH probe, adjust the pH of the solution to 7.1 using
HCl and NaOH as necessary.
4. Place the media bottles in the sterilizer with loosely placed caps. Sterilize the
media by selecting the liquids cycle (115 �C for 15 minutes).
5. Prepare 1 L of Trace Metals Mix by adding the appropriate masses of chemicals
shown in Table 2. Store this solution in a refrigerator at 2 �C. It has a shelf
life of 2 months providing it is clear of bacterial or fungal contamination.
6. Once sterilized BG-110 containing Standard Reagents is cooled, add 1 mL of the
Trace Metals Mix solution to the media and mix well.
7. Store BG-110 in the refrigerator at 2 �C for up to two weeks.
Media Change Protocol
Anabaena variabilis media should be changed every two weeks at minimum.
If the media contains a �xed source of nitrogen (NO�2 or NO�3 for example), the
media may have to be changed more frequently due to a higher dependence on �xed
nitrogen and a decline in growth following its consumption.
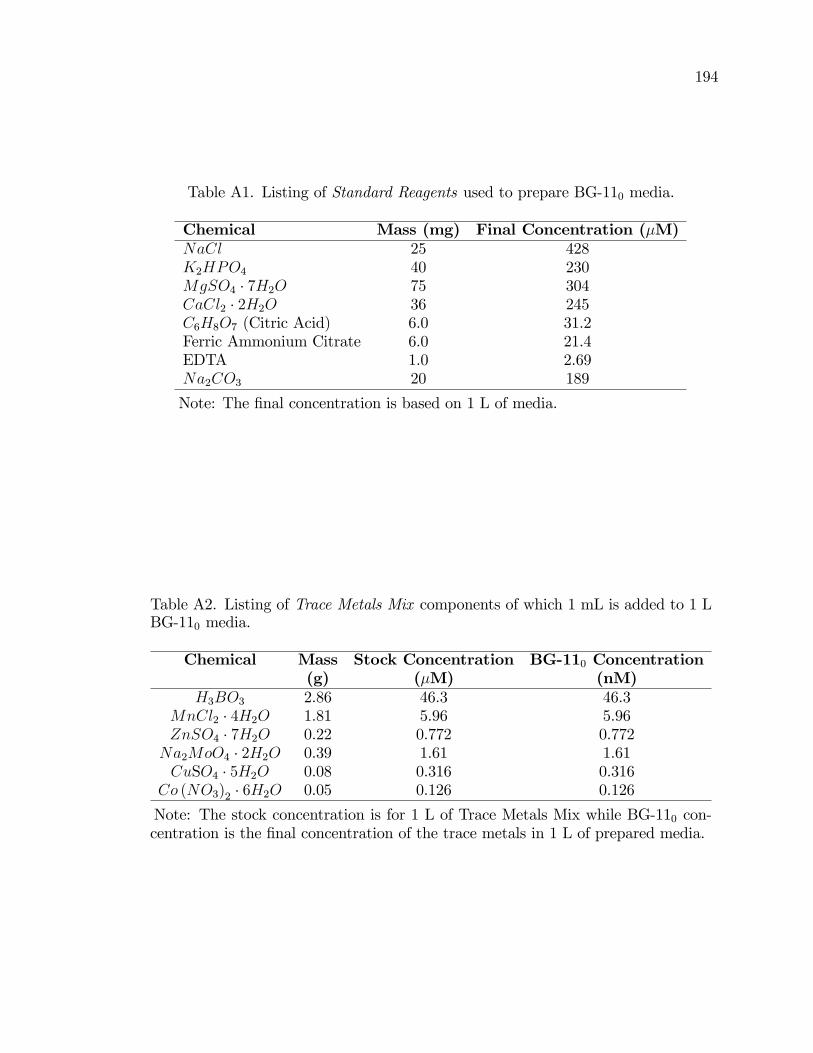
194
Table A1. Listing of Standard Reagents used to prepare BG-110 media.
Chemical Mass (mg) Final Concentration (�M)NaCl 25 428K2HPO4 40 230MgSO4 � 7H2O 75 304CaCl2 � 2H2O 36 245C6H8O7 (Citric Acid) 6.0 31.2Ferric Ammonium Citrate 6.0 21.4EDTA 1.0 2.69Na2CO3 20 189
Note: The �nal concentration is based on 1 L of media.
Table A2. Listing of Trace Metals Mix components of which 1 mL is added to 1 LBG-110 media.
Chemical Mass Stock Concentration BG-110 Concentration(g) (�M) (nM)
H3BO3 2.86 46.3 46.3MnCl2 � 4H2O 1.81 5.96 5.96ZnSO4 � 7H2O 0.22 0.772 0.772Na2MoO4 � 2H2O 0.39 1.61 1.61CuSO4 � 5H2O 0.08 0.316 0.316
Co (NO3)2 � 6H2O 0.05 0.126 0.126
Note: The stock concentration is for 1 L of Trace Metals Mix while BG-110 con-centration is the �nal concentration of the trace metals in 1 L of prepared media.
195
1. Bring the media to room temperature. In a sterile fashion, transfer the media
bottle to the biological safety cabinet and keep capped until ready to use. Do
this about 30 minutes before expected use.
2. Obtain a culture �ask from the incubator. Shake the contents to break up any
cell aggregates.
3. Transfer the entire contents of the �ask to the 50 mL conical vials. We culture
with about 150 mL of media, so you will likely need three vials.
4. Spin out the cells in the centrifuge at 2.5�1000g for 2.5 minutes.
5. If necessary, obtain a freshly autoclaved �ask for the cells.
6. Remove the vials from the centrifuge and decant the media. Keep about 5 10 mL
of old media with the cell pellet. Remember if you wish to perform an analysis
on the spent media, transfer it to centrifuge vials and label.
7. Transfer the cells to the �ask.
8. Add approximately 150 mL of fresh media to the �ask.
9. Cap and put back into the incubator.
Spent media, if not being saved for analysis, can be sterilized by the addition of
10% commercial bleach. Following this sterilization, it can be discarded down the
drain.
Cell Storage and Freezing Protocol
The protocol described here was adapted from a document entitled Cryopreser-
vation of Cyanobacteria, provided by J.J. Brand in the Botany Department at the
196
University of Texas at Austin. Cells were frozen early in this research to ensure
a stock of culture was available had the cultures su¤ered bacterial contamination.
Further, frozen cells allow for temporary suspension of cyanobacteria culture for ini-
tiation again at a later date. Samples were obtained from all �asks every 6 months
and frozen by the procedure described below.
Cryopreservation refers to the storage of a living organism at ultra low temperature
such that it can be revived and restored to the same living state as before it was
stored. Cyanobacteria su¤er severe osmotic stress and/or ice crystal damage during
the freezing and thawing processes. The most e¤ective known ways to minimize
these potentially lethal e¤ects are to add a cryoprotective compound to the culture
prior to its freezing for storage, and to control the transient cooling and warming
rates during preservation.
The steps to preserve Anabaena variabilis are as follows:
1. Transfer 3 mL of cyanobacterial liquid culture into a 5 mL cryovial.
2. Pellet the cells by centrifuging the cryovials at 4,400� for 5 minutes. Discard
the supernatant after the cells have been pelleted.
3. Add cryoprotective solution containing 1.0 ml of BG-110 that contains 8 %
DMSO to the pelleted cells (80 �L). Cells are killed by exposure to bright light
when in cryoprotective solution. Keep the culture in subdued room light while
handling, and in complete darkness at other times.
4. Label all culture vials and note on the master control sheet. Place the cryovials
into a cryovial freezer segmented box.
197
5. Place the box of cells in the -80 �C freezer in the Kohen lab on the second shelf.
Frozen Cell Recovery Protocol
To recover a frozen culture, follow the following steps:
1. Cultures to be revived are removed from storage in the 80 �C freezer and
warmed rapidly to room temperature in a heated water bath. Be sure vials are
well sealed to prevent bacterial contamination.
2. Pellet the cells at 4,400� for 5 minutes. Discard the supernatant.
3. Add 1 mL of fresh BG-110 to resuspend the pellet.
4. Loosen the cryovial lid to allow gas exchange. Keep the contents of the vial in
complete darkness for 1 2 days.
5. Transfer the cells to 250 mL ba ed �ask and add approximately 200 mL BG-110
media. After 1 2 days in the illuminated incubator, the cells should begin
normal growth.
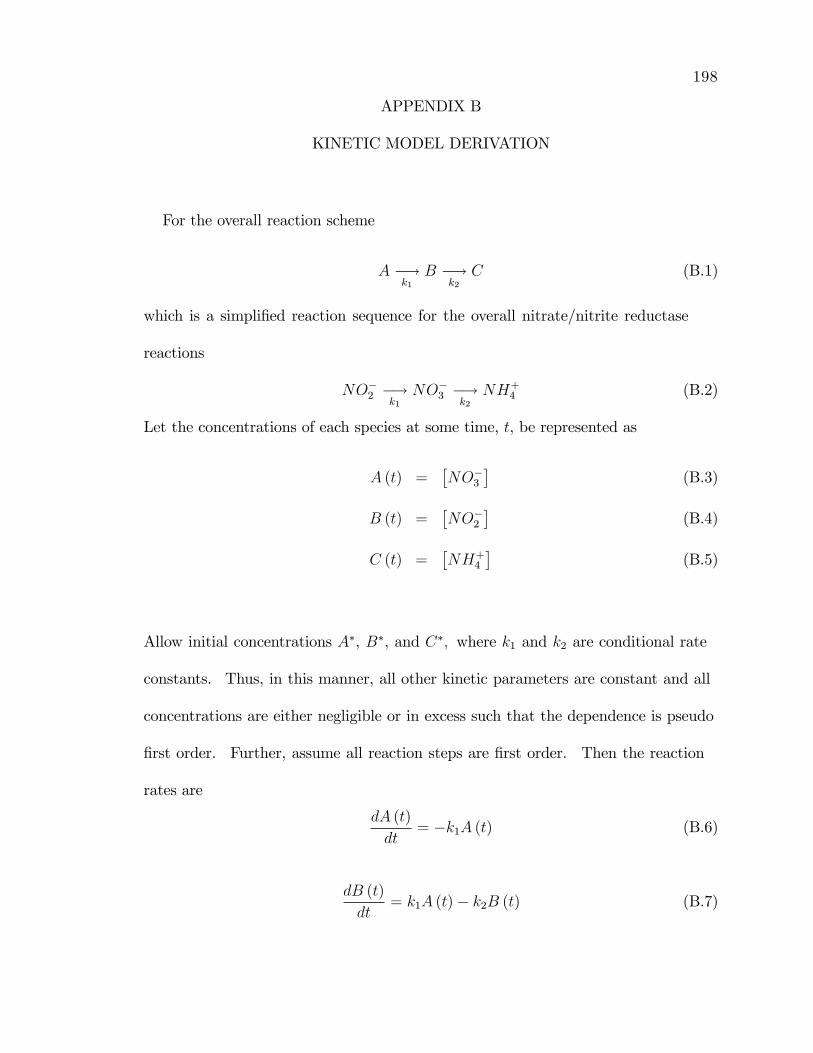
198
APPENDIX B
KINETIC MODEL DERIVATION
For the overall reaction scheme
A �!k1B �!
k2C (B.1)
which is a simpli�ed reaction sequence for the overall nitrate/nitrite reductase
reactions
NO�2 �!k1NO�3 �!
k2NH+
4 (B.2)
Let the concentrations of each species at some time, t, be represented as
A (t) =�NO�3
�(B.3)
B (t) =�NO�2
�(B.4)
C (t) =�NH+
4
�(B.5)
Allow initial concentrations A�, B�, and C�; where k1 and k2 are conditional rate
constants. Thus, in this manner, all other kinetic parameters are constant and all
concentrations are either negligible or in excess such that the dependence is pseudo
�rst order. Further, assume all reaction steps are �rst order. Then the reaction
rates are
dA (t)
dt= �k1A (t) (B.6)
dB (t)
dt= k1A (t)� k2B (t) (B.7)
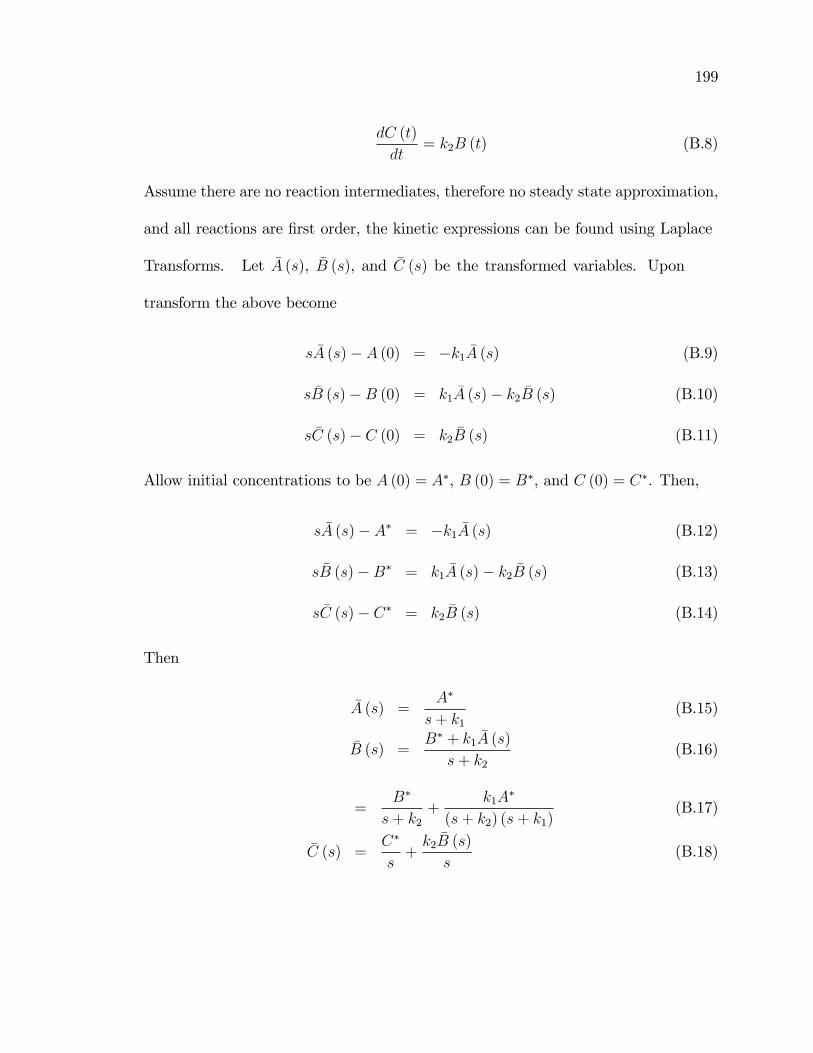
199
dC (t)
dt= k2B (t) (B.8)
Assume there are no reaction intermediates, therefore no steady state approximation,
and all reactions are �rst order, the kinetic expressions can be found using Laplace
Transforms. Let �A (s), �B (s), and �C (s) be the transformed variables. Upon
transform the above become
s �A (s)� A (0) = �k1 �A (s) (B.9)
s �B (s)�B (0) = k1 �A (s)� k2 �B (s) (B.10)
s �C (s)� C (0) = k2 �B (s) (B.11)
Allow initial concentrations to be A (0) = A�, B (0) = B�, and C (0) = C�. Then,
s �A (s)� A� = �k1 �A (s) (B.12)
s �B (s)�B� = k1 �A (s)� k2 �B (s) (B.13)
s �C (s)� C� = k2 �B (s) (B.14)
Then
�A (s) =A�
s+ k1(B.15)
�B (s) =B� + k1 �A (s)
s+ k2(B.16)
=B�
s+ k2+
k1A�
(s+ k2) (s+ k1)(B.17)
�C (s) =C�
s+k2 �B (s)
s(B.18)
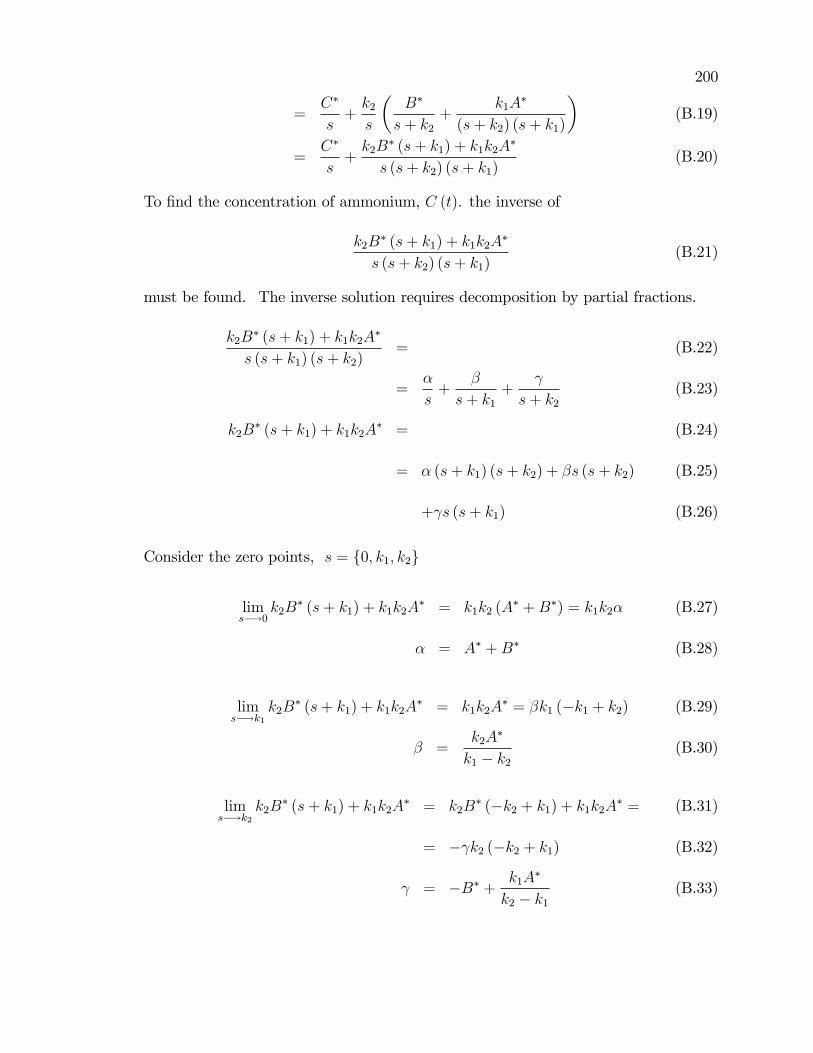
200
=C�
s+k2s
�B�
s+ k2+
k1A�
(s+ k2) (s+ k1)
�(B.19)
=C�
s+k2B
� (s+ k1) + k1k2A�
s (s+ k2) (s+ k1)(B.20)
To �nd the concentration of ammonium, C (t). the inverse of
k2B� (s+ k1) + k1k2A
�
s (s+ k2) (s+ k1)(B.21)
must be found. The inverse solution requires decomposition by partial fractions.
k2B� (s+ k1) + k1k2A
�
s (s+ k1) (s+ k2)= (B.22)
=�
s+
�
s+ k1+
s+ k2(B.23)
k2B� (s+ k1) + k1k2A
� = (B.24)
= � (s+ k1) (s+ k2) + �s (s+ k2) (B.25)
+ s (s+ k1) (B.26)
Consider the zero points, s = f0; k1; k2g
lims�!0
k2B� (s+ k1) + k1k2A
� = k1k2 (A� +B�) = k1k2� (B.27)
� = A� +B� (B.28)
lims�!k1
k2B� (s+ k1) + k1k2A
� = k1k2A� = �k1 (�k1 + k2) (B.29)
� =k2A
�
k1 � k2(B.30)
lims�!k2
k2B� (s+ k1) + k1k2A
� = k2B� (�k2 + k1) + k1k2A� = (B.31)
= � k2 (�k2 + k1) (B.32)
= �B� + k1A�
k2 � k1(B.33)
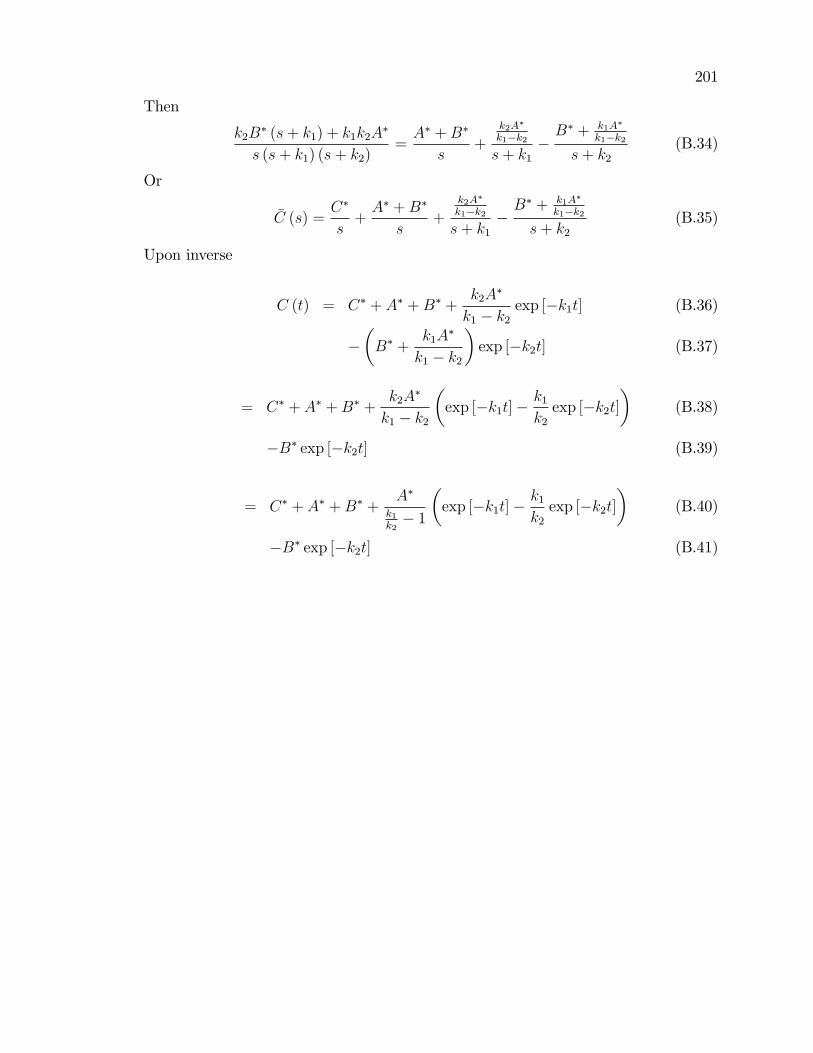
201
Then
k2B� (s+ k1) + k1k2A
�
s (s+ k1) (s+ k2)=A� +B�
s+
k2A�
k1�k2s+ k1
�B� + k1A�
k1�k2s+ k2
(B.34)
Or
�C (s) =C�
s+A� +B�
s+
k2A�
k1�k2s+ k1
�B� + k1A�
k1�k2s+ k2
(B.35)
Upon inverse
C (t) = C� + A� +B� +k2A
�
k1 � k2exp [�k1t] (B.36)
��B� +
k1A�
k1 � k2
�exp [�k2t] (B.37)
= C� + A� +B� +k2A
�
k1 � k2
�exp [�k1t]�
k1k2exp [�k2t]
�(B.38)
�B� exp [�k2t] (B.39)
= C� + A� +B� +A�
k1k2� 1
�exp [�k1t]�
k1k2exp [�k2t]
�(B.40)
�B� exp [�k2t] (B.41)
202
REFERENCES
[1] Dincer, I. Renewable and Sustainable Energy Reviews 2000, 4, 157-175.
[2] Bryant, D.; Frigaard, N.-U. Trends Microbiol. 2006, 14, 488-496.
[3] State of Iowa, State of Iowa Government, Iowa Plan for Energy Independence,Charting Iowa�s Course in the New Energy Economy, 2007.
[4] United States Department of Energy, National Energy Information Center,Annual Energy Review 2010, 2010.
[5] Bridgwater, A. V. Chemical Engineering Journal 2003, 91, 87-102.
[6] Turner, J. A. Science 2004, 305, 972-974.
[7] Ni, M.; Leung, D. Y. C.; Leung, M. K. H. Int. J. Hydrogen Energy 2007, 32,3238-3247.
[8] Pate, M.; Bartels, J. �A feasibility study of implementing an AmmoniaEconomy�, Technical Report 07S-01, Iowa State University, 2008.
[9] Hubbell, D.; Kidder, G. University of Florida Institute of Food and AgriculturalSciences, Biological Nitrogen Fixation (SL16), 2003.
[10] McClintock, J.; Holbrook, J. National Defense 2008, August 2008,.
[11] Ramos, J. L.; Guerrero, M. G.; Losada, M. Appl. and Environ. Microbiol.1984, 48, 114-118.
[12] Zam�rescu, C.; Dincer, I. J. Power Sources 2008, 185, 459-465.
[13] Cooper, M.; Botte, G. G. J. Electrochem. Soc. 2006, 153, A1894.
[14] Vitse, F.; Cooper, M.; Botte, G. G. J. Power Sources 2005, 14, 18-26.
[15] Schrock, R. R. Proc. Natl. Acad. Sci. 2006, 103, 17087.
[16] Smil, V. Enriching the earth: Fritz Haber, Carl Bosch, and the transformationof world food production; Cambridge: London, 1 ed.; 2004.
[17] United States Geological Survey, Mineral commodity summaries 2011, 2011.
[18] Galvez, H. M.; Steinfeld, A. Ind. Eng. Chem. Res. 2007, 46, 2042-2046.
203
[19] Howard, J. B.; Rees, D. C. Chem. Rev. 1996, 96, 2965-2982.
[20] Ertl, G. J. Vac. Sci. Technol. A 1983, 1, 1247.
[21] Modak, J. M. Resonance 2002, 7, 69-77.
[22] Schlogl, R. Agnew. Chem. Int. Ed. 2004, 42, 2004-2008.
[23] Postgate, J. The Fundamentals of Nitrogen Fixation; Cambridge UniversityPress: Cambridge, 1982.
[24] Stewart, W. Phil. Trans. R. Soc. Lond. 1976, 274, 341-358.
[25] Gallon, J.; Chaplin, A. An Introduction to Nitrogen Fixation; CassellEducational Limited: London, 1987.
[26] Galloway, J. N.; Dentener, F. J.; Capone, D. G.; Boyer, E. W.; Howarth, R. W.;Seitzinger, S. P.; Asner, G. P.; Cleveland, C. C.; Green, P. A.; Holland, E. A.;Karl, D. M.; Michaels, A. F.; Porter, J. H.; Townsend, A. R.; Voosmarty, C. J.Biogeochem. 2004, 70, 153-226.
[27] Smith, B. E. Science 2002, 297, 1654-1655.
[28] Schrock, R. Tech. Rev. 2006, .
[29] Swamy, B. E. K.; Venton, B. J. Anal. Chem. 2006, 79, 744-750.
[30] Allen, P. M.; Bowen, W. R. Trends in Biotech. 1985, 3, 145-149.
[31] Dixon, R.; Kahn, D. Nature Rev. Microbiol. 2004, 2, 621-631.
[32] Burgess, B. K.; Lowe, D. J. Chem. Rev. 1996, 96, 2983-3012.
[33] Haaker, H.; Veeger, C. Trends in Biochem. Sci. 1984, 9, 188.
[34] Halbelb, C. M.; Ludden, P. W. J. Nutr. 2000, 130, 1081-1084.
[35] Haaker, H.; Klugkist, J. FEMS Microbiol.Lett. 1987, 46, 57.
[36] Duyvis, M. G.; Wassink, H.; Haaker, H. Biochem. 1998, 37, 17345-17354.
[37] Braaksma, A.; Haaker, H.; Grande, H. J.; Veeger, C. Eur. J. Biochem. 1982,121, 483-491.
[38] Schrautmeier, B.; Bohme, H.; Boger, P. Arch. Microbiol. 1984, 137, 14-20.
[39] Crane, B.; Getzo¤, E. Curr. Opin. Struct. Biol. 1996, 6, 744-756.
204
[40] Dose, M.; Hirasawa, M.; Kleis-SanFrancisco, S.; Lew, E.; Kna¤, D. PlantPhysiol. 1997, 114, 1047-1053.
[41] Suzuki, S.; Kataoka, K.; Yamaguchi, K. Acc. Chem. Res. 2000, 33, 728-735.
[42] Sakurai, T.; Ikeda, O.; Suzuki, S. Inorg. Chem. 1990, 29, 4715-4718.
[43] Sancho, J.; Peleato, M. L.; Gomez-Moreno, C.; Edmondson, D. E. Arch.Biochem. Biophys. 1988, 260, 200-207.
[44] Barbara, K. Enzyme and Microbial Technology 2004, 35, 126-139.
[45] Clark, D. S. Trends Biotech. 1994, 12, 439-443.
[46] Cosnier, S. Biosensors and Bioelec. 1999, 14, 443-456.
[47] Mateo, C.; Palomo, J. M.; Fernandez-Lorente, G.; Guisan, J. M.;Fernandez-Lafuente, R. Enzyme and Microbial Tech. 2007, 40, 1451-1463.
[48] Klotzbach, T. L.; Watt, M.; Ansari, Y.; Minteer, S. D. J. Membr. Sci. 2008,311, 81.
[49] Arechederra, R.; Minteer, S. D. Electrochim. Acta 2008, 53, 6698.
[50] Leger, C.; Elliot, S. J.; Hoke, K. R.; Jeuken, L. J.; Jones, A. K.;Armstrong, F. A. Biochem. 2003, 42, 8653-8662.
[51] Flexer, V.; Ielmini, M. V.; Calvo, E. J.; Bartlett, P. N. Bioelectrochemistry2008, 74, 201-209.
[52] Evans, M.; Albrecht, S. Biochem. Biophys. Res. Commun. 1974, 61, 1187-1192.
[53] Bohme, H.; Schrautmeier, B. Biochim. Biophys. Acta 1987, 891, 115-120.
[54] Neuer, G.; Bothe, H. Arch. Microbiol. 1985, 143, 185-191.
[55] Schultz, F. A.; Gheller, S. F.; Burgess, B. K.; Lough, S.; Newton, W. E. J.Am. Chem. Soc. 1985, 107, 5364-5368.
[56] Watt, G.; Huang, H.; Reddy, K. Redox Properties of the Nitrogenase Proteinsfrom Azobacter vinelandii; Molybdenum Enzyme, Cofactors, and Model SystemsAmerican Chemical Saociety: Washington, D.C., 1993.
[57] Smith, R. V.; Noy, R. J.; Evans, M. C. W. Biochimica et Biophysica Acta1971, 253, 104-109.
[58] Tel-Or, E.; Stewart, W. D. P. Biochimica et Biophysica Acta 1976, 423,
205
189-195.
[59] Deistung, J.; Thorneley, R. N. F. Biochem. J. 1986, 239, 69-75.
[60] Tsygankov, A. A. Appl. Biochem. Microbiol. 2007, 43, 250-259.
[61] Fricke, K.; Harnisch, F.; Schroder, U. Energy Env. Sci. 2008, 1, 144-147.
[62] Yoon, J. H.; Sim, S. J.; Kim, M.-S.; Park, T. H. Int. J. Hydrogen Energy2002, 27, 1265.
[63] Spiller, H.; Gunasekaran, M. Appl. Microbiol. Biotechnol. 1990, 33, 477-480.
[64] Kerby, N. W.; Musgrave, S. C.; Rowell, P.; Shestakov, S. V.; Stewart, W.D. P. Appl. Microbiol. Biotechnol. 1986, 24, 42.
[65] Jensen, B. B.; Cox, R. P.; Burris, R. H. Arch. Microbiol. 1986, 145, 241-247.
[66] Kannaiyan, S.; Aruna, S.; Kumari, S. M. P.; Hall, D. J. Appl. Phyc. 1997, 9,167-174.
[67] Thiel, T.; Pratte, B. J. Bacteriol. 2001, 183, 280-286.
[68] Sveshnikov, D.; Sveshnikova, N.; Rao, K.; Hall, D. O. FEMS Microbiol. Lett.1997, 147, 197-301.
[69] Borodin, V.; Tsygankov, A.; Rao, K.; Hall, D. O. Biotechnol. Bioeng. 2000,69, 478-485.
[70] Spiller, H.; Bookjans, G.; Shanmugam, K. J. Bacteriol. 1983, 155, 129-137.
[71] Shanmugam, K. T.; Valentine, R. Proc. Natl. Acad. Sci. 1975, 72, 136-139.
[72] Andersen, K.; Shanmugam, K. J. Gen. Microbiol. 1977, 103, 107-122.
[73] Latorre, C.; Lee, J. H.; Spiller, H.; Shanmugam, K. T. Biotecnol. Lett. 1986,8, 507-512.
[74] Spiller, H.; Latorre, C.; Hasan, M.; Shanmugam, K. T. Word J. Microbiol.Biotech. 1994, 10, 55-58.
[75] Champe, P. C.; Harvey, R. A.; Ferrier, D. R. Lippincott�s Illustrated Reviews2005, .
[76] Kumar, A.; Tabita, F. R.; Baalen, C. V. J. Bacteriol. 1983, 155, 493-497.
[77] Kumar, A.; Tabita, F. R.; Baalen, C. V. Arch. Microbiol. 1982, 133, 103-109.
206
[78] Musgrave, S. C.; Kerby, N. W.; Codd, G. A.; Stewart, W. D. Biotechnol. Lett.1982, 4, 647-652.
[79] Ramos, J. L.; Madueno, F.; Guerrero, M. G. Arch. Microbiol. 1985, 141, 105.
[80] Mackinney, G. J. Biol. Chem. 1941, 140, 315-322.
[81] Bradford, M. Anal. Biochem. 1976, 72, 248-254.
[82] Sedmak, J.; Grossberg, S. Anal. Biochem. 1977, 79, 544-552.
[83] Atanassov, P.; Apblett, C.; Banta, S.; Brozik, S.; Barton, S. C.; Cooney, M.;Liaw, B. Y.; Mukerjee, S.; Minteer, S. D. Interface 2007, Summer, 28-31.
[84] Mauritz, K. A.; Moore, R. B. Chem. Rev. 2004, 104, 4535-4586.
[85] Moore, C. M.; Akers, N. L.; Hill, A. D.; Johnson, Z. C.; Minteer, S. D.Biomacromol. 2004, 5, 1241-1247.
[86] Klotzbach, T.; Watt, M.; Ansari, Y.; Minteer, S. D. J. Membr. Sci. 2006,282, 276-283.
[87] Akers, N. L.; Moore, C. M.; Minteer, S. D. Electrochim. Acta 2005, 50, 2521.
[88] Schrenk, M. J.; Villigram, R. E.; Torrence, N. J.; Brancato, S. J.; Minteer, S. D.J. Membr. Sci. 2002, 205, 3-10.
[89] Moore, C. M.; Hackman, S.; Brennan, T.; Minteer, S. D. J. Membr. Sci. 2005,255, 233-238.
[90] Bard, A.; Faulkner, L. Electrochemical Methods; John Wiley & Sons, Inc.: NewYork, Second ed.; 2001.
[91] Solorzano, L. J. Limnol. Oceanogr. 1969, 14, 799-801.
[92] Reich, S.; Almon, H.; Boger, P. FEMS Microbiol. Lett. 1986, 34, 53-56.
[93] Jean�ls, J.; Loudeche, R. Biotechnol. Lett. 1986, 8, 265.
[94] Matsunaga, T.; Namba, Y. Anal. Chem. 1984, 56, 798-801.
[95] Salamon, Z.; Tollin, G. Arch. Biochem. Biophys. 1992, 294, 382-387.
[96] Salamon, Z.; Tollin, G. J. Electroanal. Chem. 1992, 342, 381-391.
[97] McLeod, D. D. N.; Freeman, H. C.; Harvey, I.; Lay, P. A.; Bond, A. M. Inorg.Chem. 1996, 35, 7156-7165.
207
[98] Verhagen, M. F. J. M.; Link, T. A.; Hagen, W. R. FEBS Lett. 1995, 361,75-78.
[99] Guilbault, G. G. Analytical uses of immobilized enzymes; Modern Monographsin Analytical Chemistry Marcek Dekker, Inc.: New York, 1984.
[100] Kim, J.; Jia, H.; Wang, P. Biotech. Adv. 2006, 24, 296.
[101] Serebryakova, L.; Medina, M.; Zorin, N. A.; Gogotov, I. N.; Cammack, R.FEBS Lett. 1996, 383, 79-82.
[102] Madoz, J.; Rernandez-Recio, J.; Gomez-Moreno, C.; Fernandez, V. M.Bioelectrochem. Bioenerg. 1998, 47, 179-183.
[103] Armstrong, F. A.; Hill, H. A. O.; Walton, N. J. Acc. Chem. Res. 1988, 21,407-413.
[104] Aliverti, A.; Hagen, W. R.; Zanetti, G. FEBS Lett. 1995, 368, 220-224.
[105] Haystead, A.; Stewart, W. D. P. Arch. Microbiol. 1972, 82, 325.
[106] Bohme, H.; Schrautmeier, B. Biochim. Biophys. Acta 1987, 891, 1-7.
[107] Schrautmeier, B.; Býuhme, H. FEBS Lett. 1985, 184, 304-308.
[108] Tagawa, K.; Arnon, D. I. Nature 1962, 195, 537-543.
[109] Im, S.-C.; Kohzuma, T.; McFarlane, W.; Gaillard, J.; Sykes, A. G. Inorg.Chem. 1997, 36, 1388-1396.
[110] Landrum, H. L.; Salmon, R. T.; Hawkridge, F. M. J. Am. Chem. Soc. 1977,99, 3154-3158.
[111] Greiner, L.; Schroder, I.; Muller, D. H.; Liese, A. Green Chem. 2003, 5,697-700.
[112] de Lacey, A. L.; Bes, M. T.; Gomez-Moreno, C.; Fernandez, V. M. J.Electroanal. Chem. 1995, 390, 69-76.
[113] Zhou, R.; Wolk, C. P. J. Bacteriol. 2002, 184, 2529-2532.
[114] Peterson, R. B.; Wolk, C. P. Proc. Natl. Acad. Sci. 1978, 75, 6271-6275.
[115] Fay, P.; San, P. A. 73 Heterocyst isolation, in Methods in Enzymology, Vol. 69;Academic Press: New York, 1980 pages 801�812.
[116] Peterson, R.; Burris, R. Arch. Microbiol. 1976, 108, 35-40.
208
[117] Lynn, M.; Ownby, J. Arch. Microbiol. 1987, 148, 115-120.
[118] Peterson, R.; Burris, R. Arch. Microbiol. 1978, 116, 125-132.
[119] Fay, P.; Stewart, W.; Walsby, A.; Fogg, G. Nature 1968, 220, 810-812.
[120] Haselkorn, R. Ann. Rev. Plant Physiol. 1978, 29, 319-344.
[121] Stewart, W. D.; Rowell, P. Biochem. Biophys. Res. Commun. 1975, 65,846-856.
[122] Guerrero, M. G.; Vega, J. M.; Losada, M. Ann. Rev. Plant Physiol. 1981, 32,169-204.
[123] Herrero, A.; Flores, E.; Guerrero, M. G. J. Bacteriol. 1981, 145, 175-180.
[124] Herrero, A.; Flores, E.; Guerrero, M. G. FEMS Microbiol. Lett. 1985, 26,21-25.
[125] Herrero, A.; Guerrero, M. G. J. Gen. Microbiol. 1986, 132, 2463-2468.
[126] Frias, J. E.; Flores, E.; Herrero, A. J. Bacteriol. 1997, 179, 477-486.
[127] Ohashi, Y.; Shi, W.; Takatani, N.; Aichi, M.; ichi Maeda, S.; Watanabe, S.;Yoshikawa, H.; Omata, T. J. Exp. Bot. 2011, 62, 1411-1424.
[128] Flores, E.; Frias, J. E.; Rubio, L. M.; Herrero, A. Photosyn. Res. 2005, 83,117-133.
[129] Ramos, J. L.; Guerrero, M. G. Arch. Microbiol. 1983, 136, 81-83.
[130] Salome, J. P.; Amutha, R.; Jagannathan, P.; Josiah, J. J. M.; Berchmans, S.;Yegnaraman, V. Biosensors and Bioelec. 2009, 24, 3487-3491.
[131] Maloy, J. Nitrogen, Phosphorous, Arsenic, Antimony, and Bismuth, in StandardPotentials in Aqueous Solutions; Bard, A. J.; Parsons, R.; Jordan, J., Eds.;CRC Press: New York, 1985 pages 127�139.
[132] Martin-Nieto, J.; Flores, E.; Herrero, A. Plant Physiol. 1992, 100, 157-163.
[133] Martún-Nieto, J.; Herrero, A.; Flores, E. Arch. Microbiol. 1989, 151, 475-478.
[134] National Renewable Energy Laboratories, U.S. Department of Energy, NRELPVWatts Calculator, http://www.nrel.gov/rredc/pvwatts, 2012.
[135] Cronk, S. Solar and Wind Estimator, http://www.solar-estimate.org, 2012.