Embed Size (px)
Citation preview

Speaker Introduc/on • John J. Paschkewitz • Mr. Paschkewitz leads the Reliability and Test Team in the Technology
Development Organiza/on, Engineering Department at Watlow. He has over 39 years experience in product assurance, reliability and test in the U.S. Air Force and several companies across mul/ple industries from both an OEM and supplier perspec/ve. He holds a BSME from the University of Wisconsin-‐Madison and a MA in Business Management from Central Michigan University. He is a member of ASME, ASQ Senior Member, ASQ Reliability Division member, Cer/fied Reliability Engineer, and a member of SAE. He is a Registered Professional Engineer. He has presented at the ASQ World Conference, ASME IMECE, Interna/onal Applied Reliability Symposium, and RAMS.

Applying Accelerated Tes/ng in Lean Product Development
John J. Paschkewitz, P.E., CRE
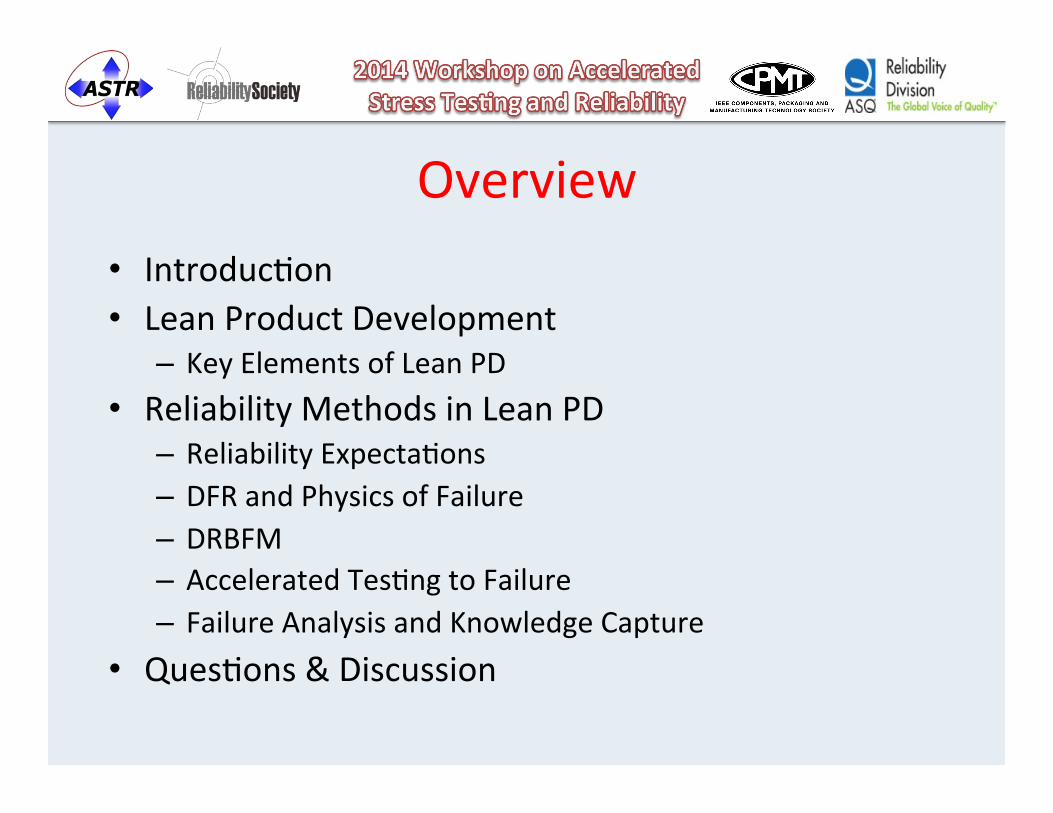
Overview • Introduc/on • Lean Product Development
– Key Elements of Lean PD • Reliability Methods in Lean PD
– Reliability Expecta/ons – DFR and Physics of Failure – DRBFM – Accelerated Tes/ng to Failure – Failure Analysis and Knowledge Capture
• Ques/ons & Discussion

Lean NPD Characteris/cs • Knowledge Based – Learning Unknowns
– Build on Knowledge Base – Concentrate on Changes and Unknowns
• Focused on Value Customer Pays For – Understanding Customer Needs
• Eliminate Waste – Fewer Reviews, Key Integra/on Points – Keeps Team Members Focused on Cri/cal Work
• More Up Front Learning to Make BeXer Decisions and Eliminate Rework and Redesign
• Team Rooms with Visual Status Replace Review Mee/ngs
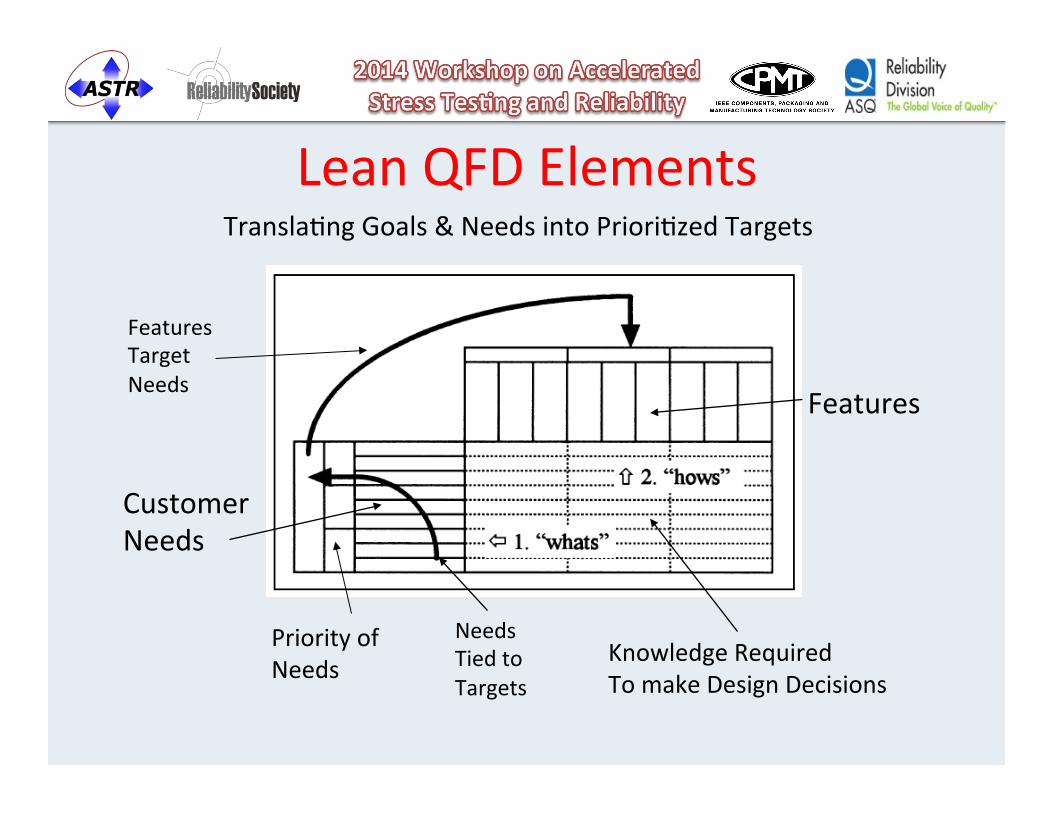
Lean QFD Elements
Features
Customer Needs
Knowledge Required To make Design Decisions
Priority of Needs
Transla/ng Goals & Needs into Priori/zed Targets
Features Target Needs
Needs Tied to Targets
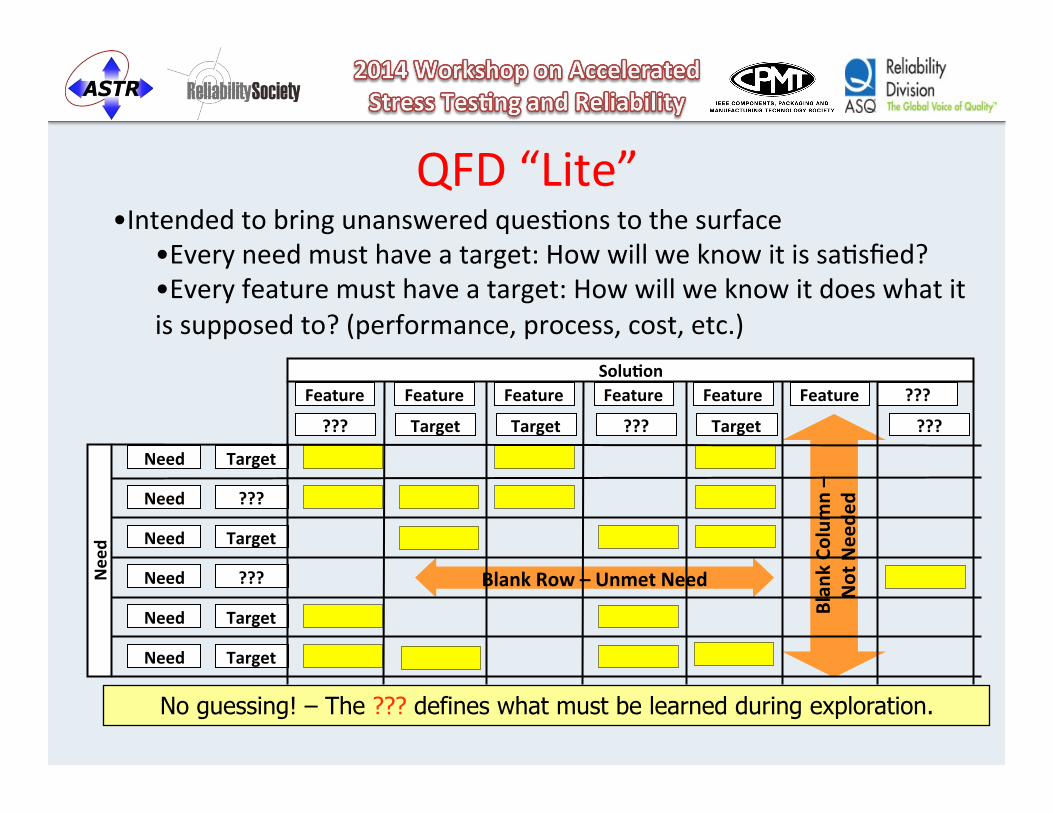
QFD “Lite”
No guessing! – The ??? defines what must be learned during exploration.
Feature Feature Feature Feature Feature Feature ???
??? Target Target ??? Target ???
Need
Need
Need
Need
Need
Need
Target
???
Target
???
Target
Target
Blank Row – Unmet Need
Blan
k Co
lumn –
Not Neede
d
SoluDon
Need
• Intended to bring unanswered ques/ons to the surface • Every need must have a target: How will we know it is sa/sfied? • Every feature must have a target: How will we know it does what it is supposed to? (performance, process, cost, etc.)

If you want to change the results, you have to change the thinking
DEFINE REQUIREMENTS
LIVE WITH IT DESIGN SOLUTION
FIND OUT IT DOESN’T WORK
OUT OF TIME OR MONEY?
NOT YET
YES
The tradiDonal process:
TIME
DESIGN ALTER
NAT
IVES
TRADITIONAL
COST OF ALTERNATIVE
LEAN NPD
TIME
NPD
RESOURC
ES
TRADITIONAL
LEAN NPD
TIME
RISK
Learning-‐First Product Development The cost of doing product development well is clear and obvious. The cost of doing product development poorly is vague and distant.
TRY AGAIN
KNOWLEDGE
LAUNCH
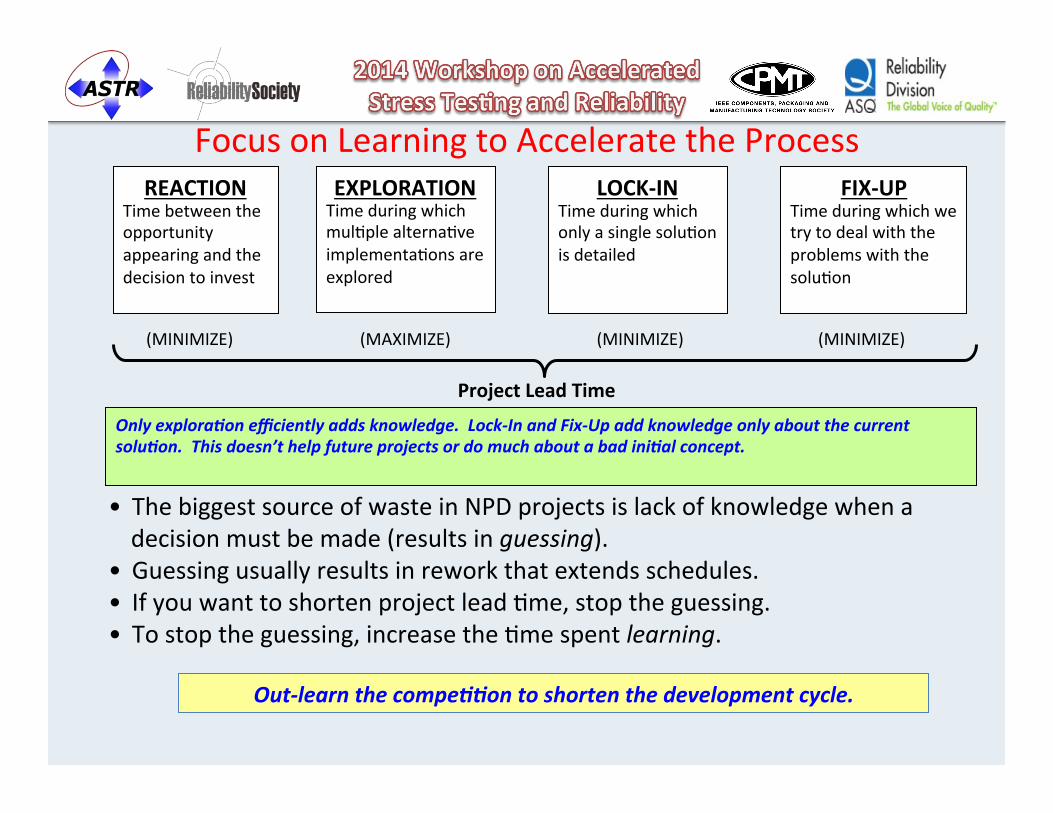
Focus on Learning to Accelerate the Process
Out-‐learn the compe00on to shorten the development cycle.
Project Lead Time
Only explora0on efficiently adds knowledge. Lock-‐In and Fix-‐Up add knowledge only about the current solu0on. This doesn’t help future projects or do much about a bad ini0al concept.
(MINIMIZE) (MAXIMIZE) (MINIMIZE) (MINIMIZE)
REACTION Time between the opportunity appearing and the decision to invest
EXPLORATION Time during which mul/ple alterna/ve implementa/ons are explored
LOCK-‐IN Time during which only a single solu/on is detailed
FIX-‐UP Time during which we try to deal with the problems with the solu/on
• The biggest source of waste in NPD projects is lack of knowledge when a decision must be made (results in guessing).
• Guessing usually results in rework that extends schedules. • If you want to shorten project lead /me, stop the guessing. • To stop the guessing, increase the /me spent learning.

Decision Making Process • Use Lean QFD Matrix to Help Iden/fy:
– Decisions Required to Develop Required Features – Knowledge Needed to Make Decisions – Timing Required for Decisions
• Determine How Missing Knowledge will be Acquired Through Analysis and Tes/ng
• Integra/on Events Where Knowledge is Required to Make Decisions
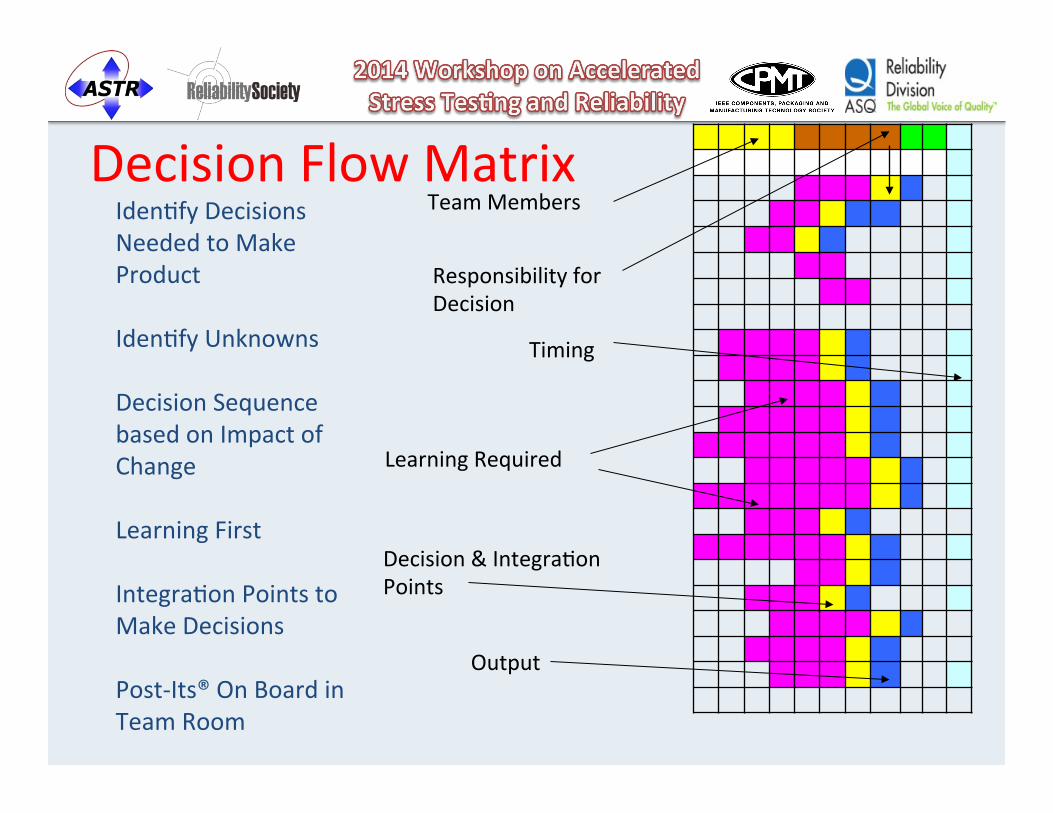
Decision Flow Matrix
Team Members
Responsibility for Decision
Learning Required
Decision & Integra/on Points
Output
Timing
Iden/fy Decisions Needed to Make Product Iden/fy Unknowns Decision Sequence based on Impact of Change Learning First Integra/on Points to Make Decisions Post-‐Its® On Board in Team Room
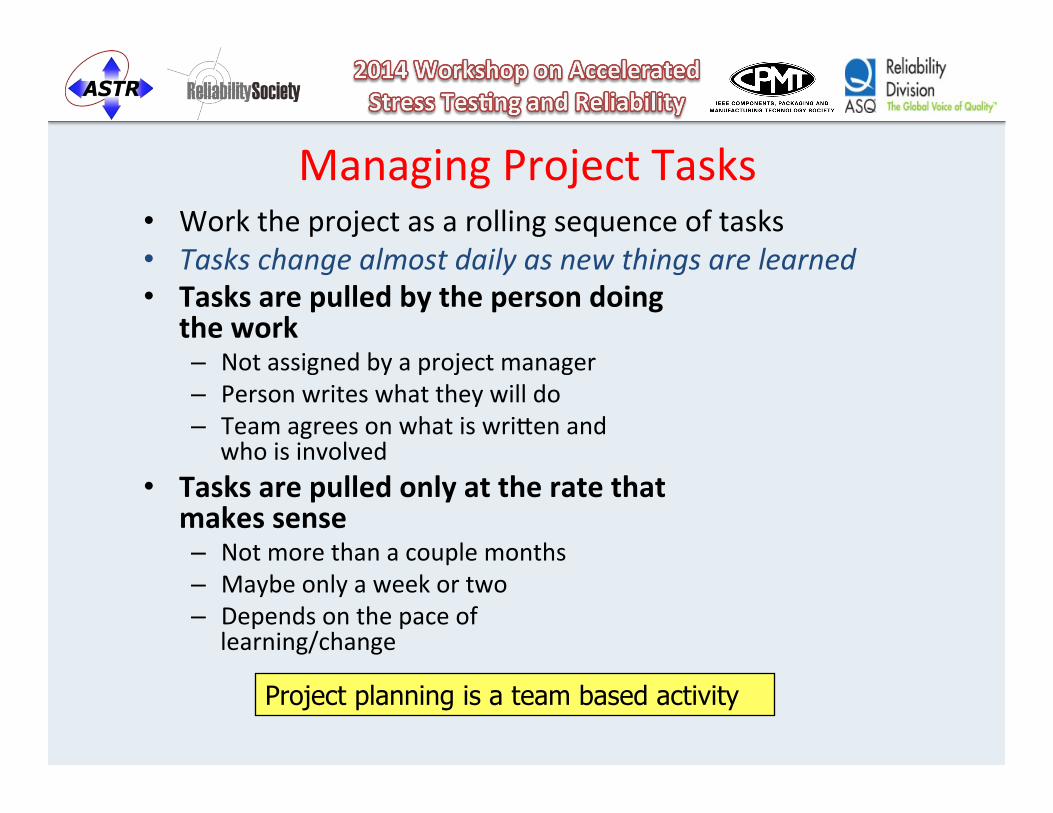
Managing Project Tasks • Work the project as a rolling sequence of tasks • Tasks change almost daily as new things are learned • Tasks are pulled by the person doing
the work – Not assigned by a project manager – Person writes what they will do – Team agrees on what is wriXen and
who is involved • Tasks are pulled only at the rate that
makes sense – Not more than a couple months – Maybe only a week or two – Depends on the pace of
learning/change
Project planning is a team based activity
Key Takeaways for Reliability • Up Front Learning Phase in Lean NPD Provides Opportunity for: – Understanding Customer Reliability Expecta/ons – Robust Design for Reliability – DOE and Accelerated TesDng for Learning – Correc/ve Ac/on for Highest Reliability Risks
• Essen/al for Reliability Engineering to Par/cipate in Team Planning & Ac/ons
Reliability Methods in Lean NPD • DRBFM – DRBTR > An/cipate, Prevent Problems • Focus on Changes and Unknowns • Design for Reliability – Physics of Failure • Accelerated TesDng • Test to Failure – Understand failure mechanisms • Capture knowledge / learning for re-‐use

Problem Preven/on – GD3
• Good Design = Robust Design – Design for Reliability (DFR) – Design for Six Sigma (DFSS)
• Good Discussion = Minimize Risk – Apply Design Review Based on Failure Modes (DRBFM) to iden/fy problems and develop countermeasures or correc/ons
• Good DissecDon = EffecDve ValidaDon – Apply Design Review Based on Test Results (DRBTR) to Evaluate Effec/veness. Test to Failure & Analysis of Test Failures is Cri/cal
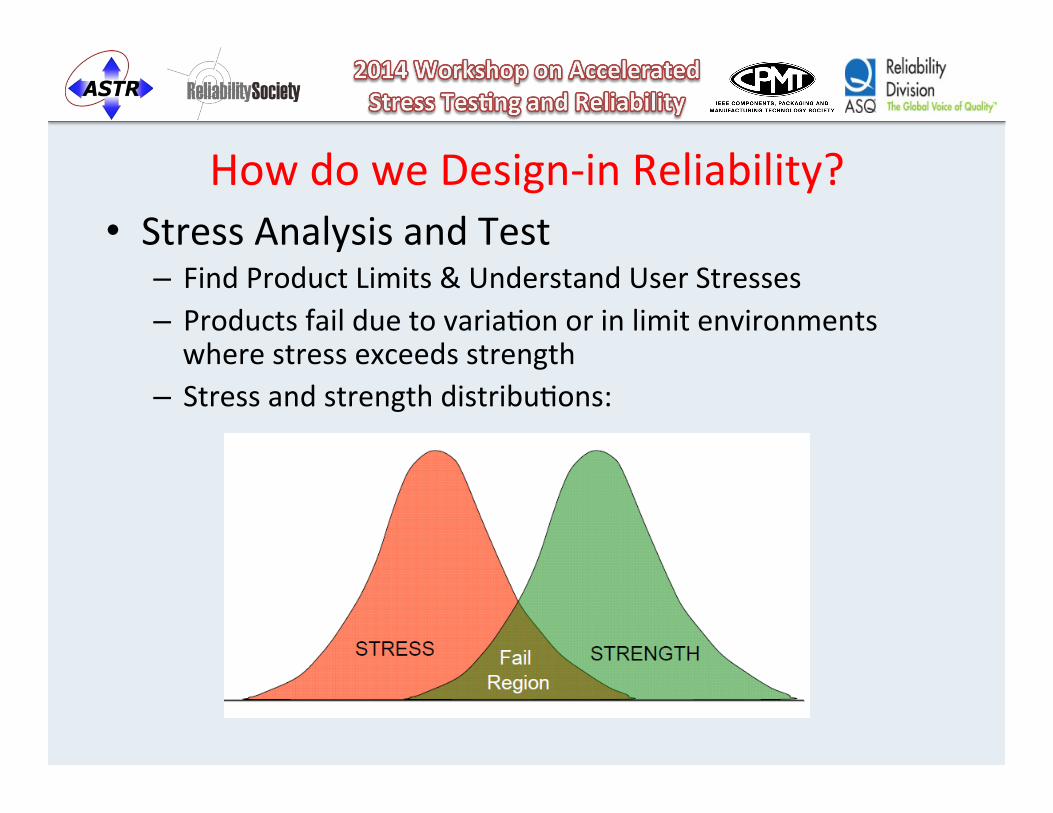
How do we Design-‐in Reliability? • Stress Analysis and Test
– Find Product Limits & Understand User Stresses – Products fail due to varia/on or in limit environments where stress exceeds strength
– Stress and strength distribu/ons:

Elements of Probabilis/c Design • Understand physics of failure and stresses that precipitate failure
• Use predic/ve modeling (life-‐stress rela/onships) and accelerated test to failure to es/mate probability of failure
• Consider variability of applied stresses and variability of product strength
• Eliminate stress-‐strength interference
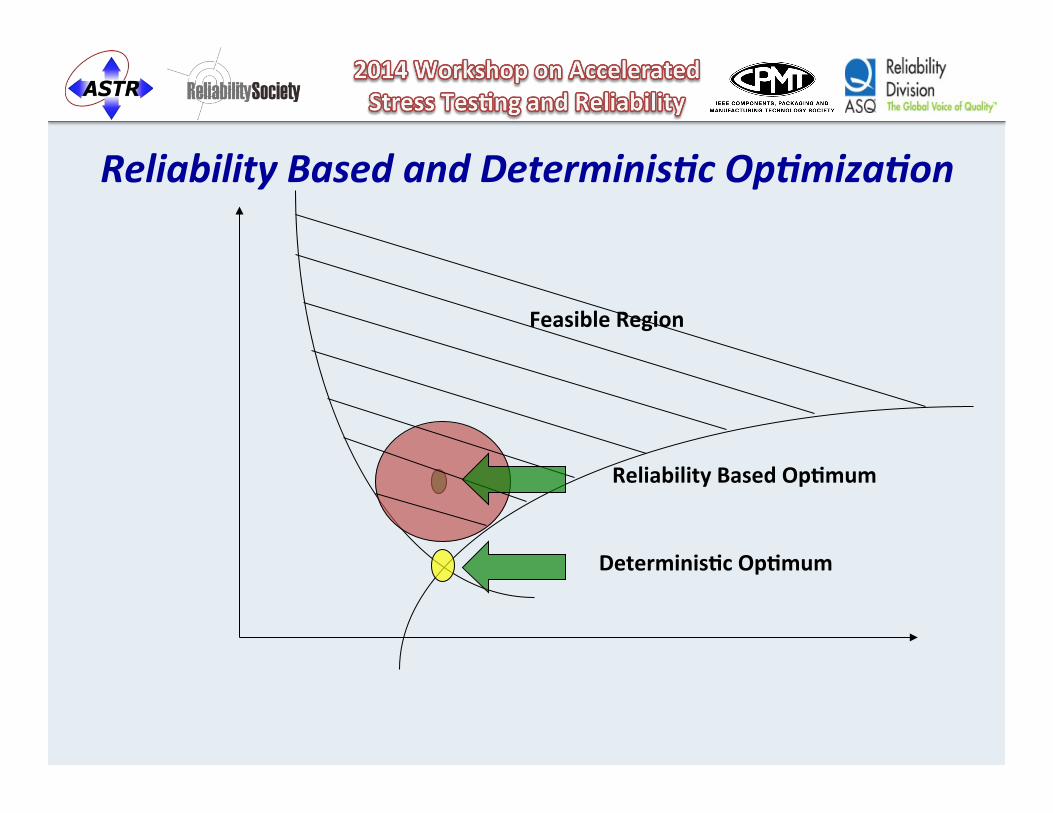
Reliability Based and Determinis0c Op0miza0on
DeterminisDc OpDmum
Reliability Based OpDmum
Feasible Region

Understand Physics of Failure
• What physical phenomenon in the part is caused by the stresses applied?
• If we understand the root cause, we can improve strength or reduce variability to prevent or mi/gate the failure.
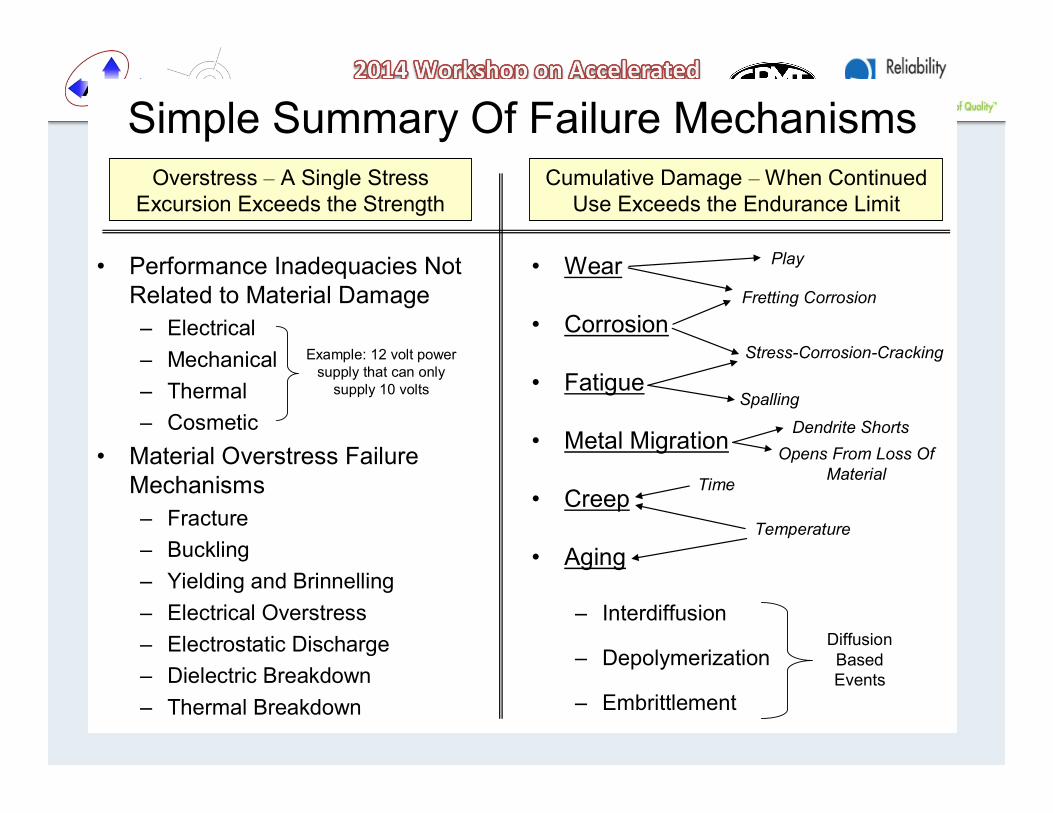
Simple Summary Of Failure Mechanisms
• Performance Inadequacies Not Related to Material Damage– Electrical– Mechanical– Thermal– Cosmetic
• Material Overstress Failure Mechanisms– Fracture– Buckling– Yielding and Brinnelling– Electrical Overstress– Electrostatic Discharge– Dielectric Breakdown– Thermal Breakdown
• Wear
• Corrosion
• Fatigue
• Metal Migration
• Creep
• Aging
– Interdiffusion
– Depolymerization
– Embrittlement
Overstress – A Single Stress Excursion Exceeds the Strength
Cumulative Damage –When Continued Use Exceeds the Endurance Limit
Fretting Corrosion
Stress-Corrosion-Cracking
Time
Temperature
Example: 12 volt power supply that can only
supply 10 volts
Diffusion Based Events
Spalling
Dendrite ShortsOpens From Loss Of
Material
Play

Key is Understanding • Methods Build Knowledge of Alterna/ves
– Physics of Failure – Design of Experiments – Design for Robustness and Reliability
• Learning in Lean NPD is focused on evalua/ng alterna/ves:
– Materials, Components, Processes – Interfaces, Subsystems, Configura/ons….
• Enable BeXer Design Decisions • Eliminate Redesign Waste

Risk Assessment in Lean NPD • Use “Missing Knowledge” in Decision Flow from Lean QFD as star/ng point
• Can be Applied at System, Module, Component and Produc/on Readiness Levels
• These unknowns and known changes from current technology or design are the greatest risks
• Focus DRBFM on these unknown and changed areas during Convergence Events / Integra/on Points

Change Point Analysis • Understand Risks Qualita/vely
– What has Changed? Why? Priori/ze Ac/ons – New Design or Technology – Supplier – New, Alternate, Process Change – Environment: New Stresses, New Opera/ng Envelope, Standards Changes
– Customer: Applica/on Change, Expecta/ons Raised, Compe//on has Changed, Market Changes
– Consequences of Failure Changed: Warran/es, Regulatory Compliance
• Impact on Product and Design, Focus Resources on Changes Needed

Design Review Based on Failure Modes (DRBFM)
• Integrates elements of Design Review with elements of FMEA
• Focused on Risks Resul/ng from Changes and Unknowns
• Emphasizes a Process not a Form to Fill Out
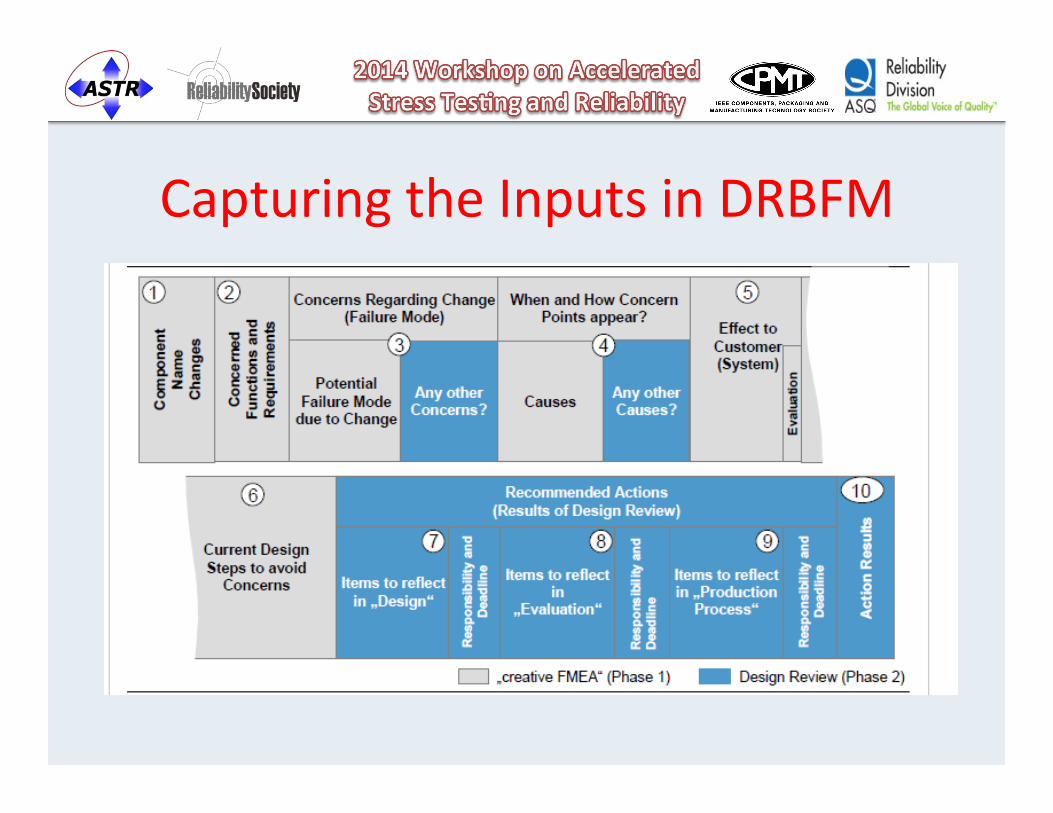
Capturing the Inputs in DRBFM

When to Do DRBFM
Source: A Guide to GD3 Ac/vi/es and DRBFM Technique to Prevent Trouble, Kano & Shimizu, Toyota 2001
Product DRBFM (System, Parts, interfaces)
DRBTR
Process DRBFM
DRBTR Design Review of Test Results
Design Review of Produc/on Process

Impact of Lean Focused DRBFM
• Alloca/on of Resources Targeted to Reduce Highest Risks and Unknowns
• Impact Product and Process Design • Drive Test Planning and Analysis to Resolve Issues and Understand Unknowns
• Verify Correc/ve Ac/on Effec/veness • Cri/cal Characteris/cs and Process Measurement / Control

Design of Experiments (DOE) • Tool to Evaluate Design Alterna/ves • Determine Factors and Response • May need Two Phased DOE Approach
– Frac/onal Design to Find Main Factors – Full Factorial Design to Evaluate Effects and Interac/ons on Reduced Set of Factors
– Consider Time and Cost – Factors can Be Tested in Accelerated CondiDons
• Analysis of Results and Op/miza/on of Solu/on

Itera/ve DOE Process Phase 1 Screening
Phase 2 Op/miza/on
Phase 3 Valida/on
Iden/fy Factors that Most Effect Key Responses
Understand Interac/ons and Op/mize Solu/on by Evalua/ng Mul/ple Levels of Selected Factors
Validate Design Solu/on by Measuring Performance when Exposed to Appropriate Stresses
Key Factors
Levels & Interac/ons
Validated Product & Process
Build Knowledge While SelecDng OpDmum Materials & Components
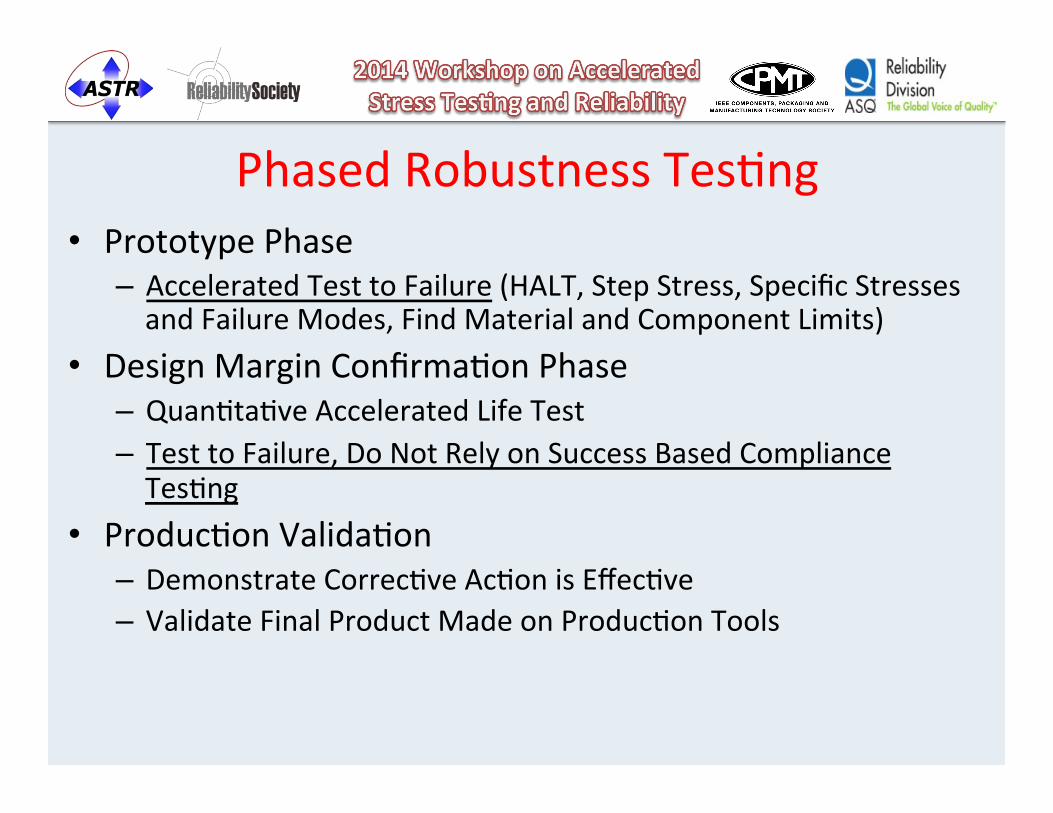
Phased Robustness Tes/ng • Prototype Phase
– Accelerated Test to Failure (HALT, Step Stress, Specific Stresses and Failure Modes, Find Material and Component Limits)
• Design Margin Confirma/on Phase – Quan/ta/ve Accelerated Life Test – Test to Failure, Do Not Rely on Success Based Compliance Tes/ng
• Produc/on Valida/on – Demonstrate Correc/ve Ac/on is Effec/ve – Validate Final Product Made on Produc/on Tools

Robustness Indicator Figure
Factors (Temperature, Vibra/on, Humidity, Power, etc) Analysis & Test Results for
Each Factor on current or new product
Target or Specifica/on Margin or
Robustness of Design Factor
(Can be Created in Excel using Radar Chart)
If Test Result has Small Margin, Design is Not Robust
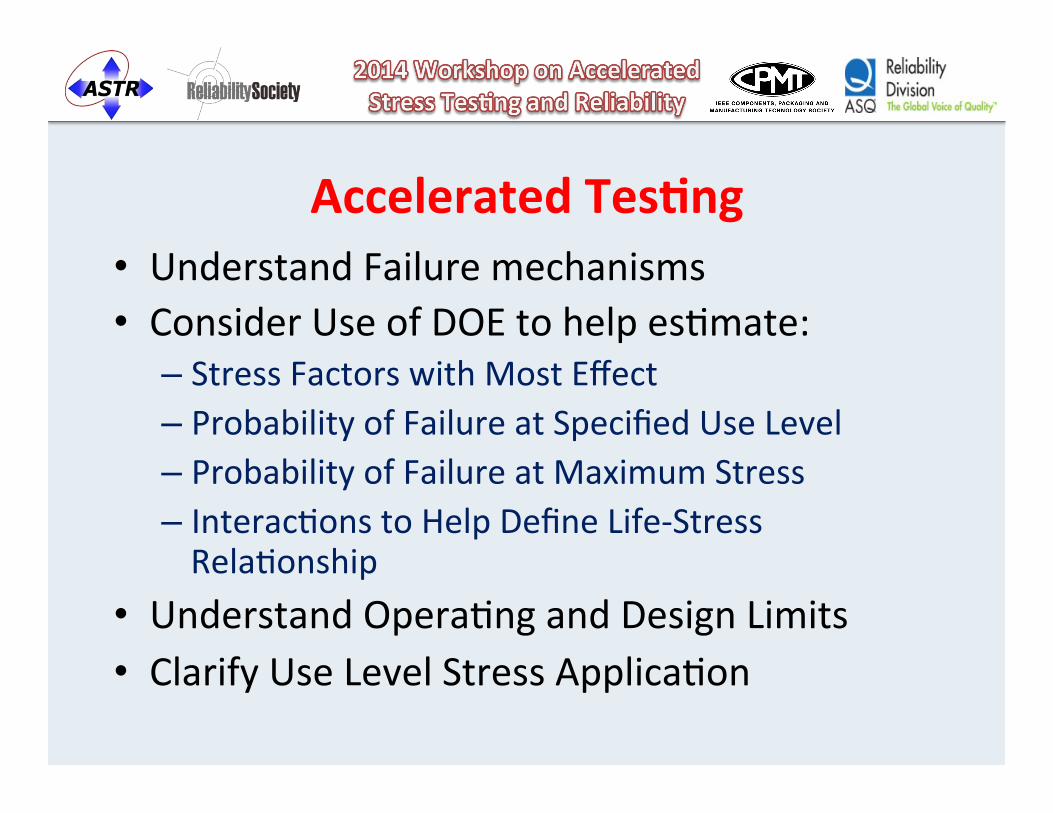
Accelerated TesDng • Understand Failure mechanisms • Consider Use of DOE to help es/mate:
– Stress Factors with Most Effect – Probability of Failure at Specified Use Level – Probability of Failure at Maximum Stress – Interac/ons to Help Define Life-‐Stress Rela/onship
• Understand Opera/ng and Design Limits • Clarify Use Level Stress Applica/on

Approach to Accelerated Test
• Conduct Accelerated Stress Test like HALT or step-‐stress tests to define product limits and failure modes, eliminate weaknesses
• Conduct Quan/ta/ve ALT to extrapolate life at use level condi/ons – Times to Failure at Accelerated Stress Levels – Use life-‐stress rela/onships and distribu/ons

Ac/ve Sensor Limit Test
100 105 110 115 120 125 130 135 140 145 150 155 160 165 170 175
0 60
120
180
240
300
360
420
480
540
600
660
720
780
840
900
960
1020
1080
1140
1200
1260
1320
1380
1440
1500
1560
1620
Tem
p (d
egC
)
Time (minutes)
Temp (degC) Transition times are subject to chamber capability Ramp up 15 min, ramp down 60 min.
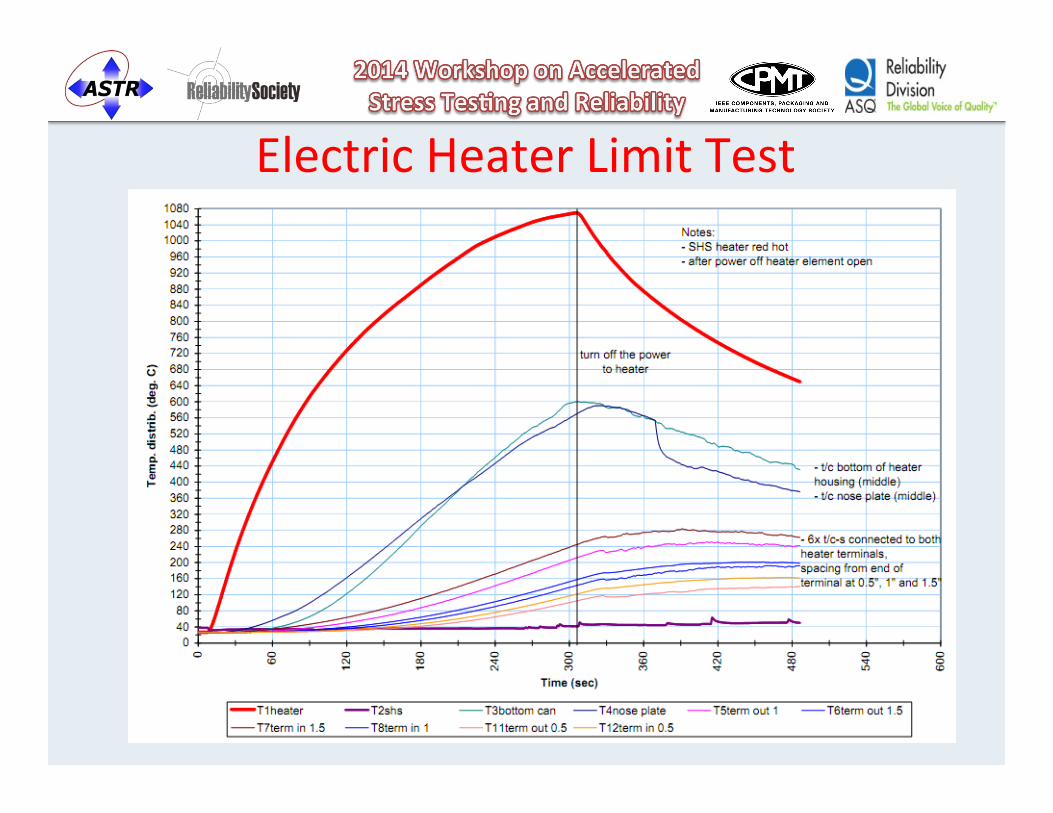
Electric Heater Limit Test

Highly Accelerated Life Test (HALT) – Qualita/ve ALT 1. Improve Reliability by Finding
Weaknesses and Correc/ng Them Early.
2. Establish Upper and Lower Opera/ng Limits of ALL Environmental Stressors
• Design Limits
• Endurance Limits
3. Typically done in Temperature & Vibra/on Chamber for Electronics & Electromechanical Products
4. Concept can be Applied to Other Stressors (Power, Voltage, on-‐off, mechanical loads, etc.)
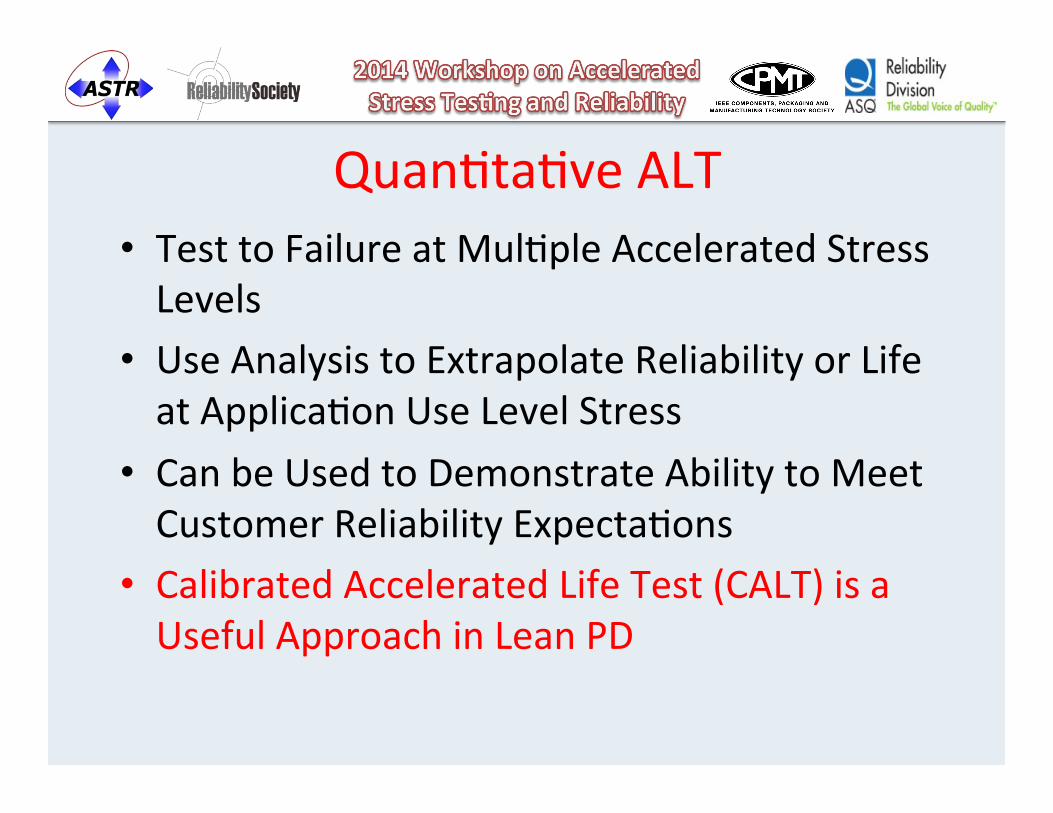
Quan/ta/ve ALT • Test to Failure at Mul/ple Accelerated Stress Levels
• Use Analysis to Extrapolate Reliability or Life at Applica/on Use Level Stress
• Can be Used to Demonstrate Ability to Meet Customer Reliability Expecta/ons
• Calibrated Accelerated Life Test (CALT) is a Useful Approach in Lean PD

Explana/on of CALT Process ReliaSoft ALTA 7 - www.Re liaSof t. com
Beta=3.9834; K=1.1189E-14; n=4.9212
Lif
e
100.000 300.00010.000
100000.000
100.000
1000.000
10000.000
Life
Data 1Inv erse Power LawWeibull100F=6 | S=0
Eta Line200
Stress Lev el PointsEta PointImposed Pdf
243Stress Lev el PointsEta PointImposed Pdf
270Stress Lev el PointsEta PointImposed Pdf
Third Stress Level Identified
AvailableTest T ime
Test Two or More Samples
Required Life Test Two
Test Two
StressNormal Stress Level Upper Limit Stress
Extrapolated Life
Graphical Explanation of the CALT Process
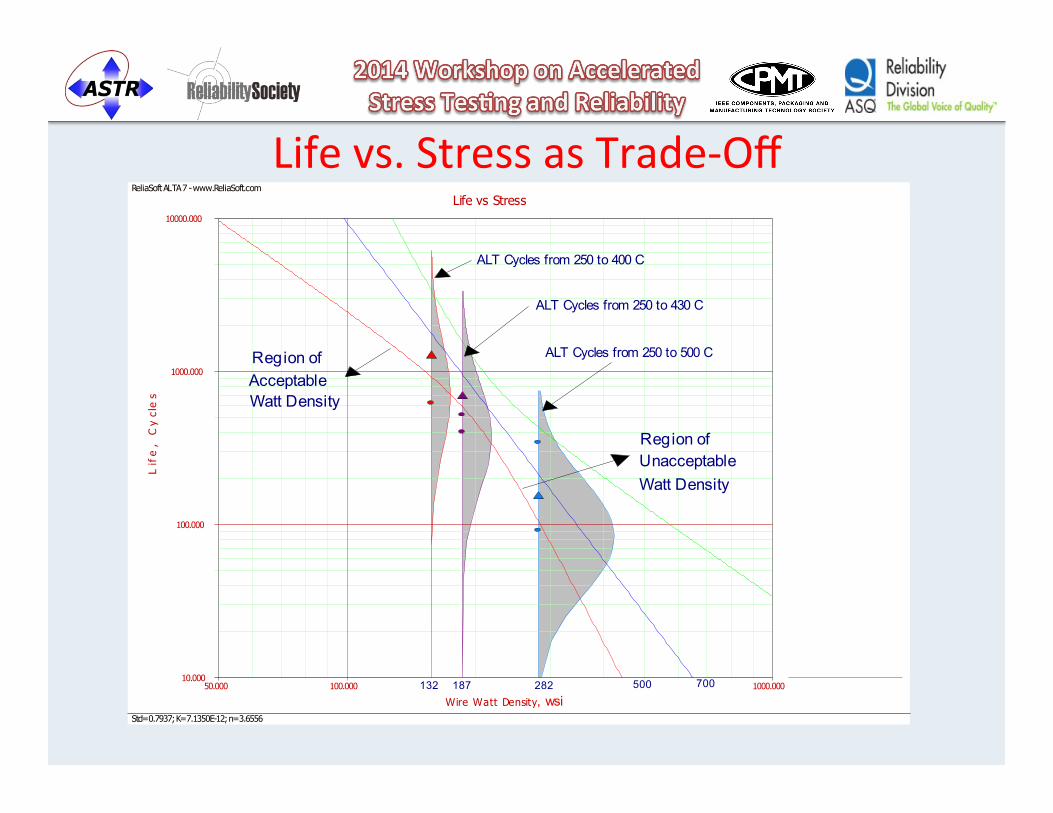
Life vs. Stress as Trade-‐Off ReliaSoft ALTA 7 - www.ReliaSoft.com
Life vs Stress
Std=0.7937; K=7.1350E-12; n=3.6556
Wire Watt Density
Lif
e,
Cy
cle
s
50.000 1000.000100.00010.000
10000.000
100.000
1000.000
LifeCB@90% 1-Sided TB
Axcelis ALT NiCr WWD L-SInverse Power LawLognormal132.4F=5 | S=1
Mean Life LineTop CB MeanBottom CB Mean
157.8Stress Level PointsMedian PointImposed Pdf
186.7Stress Level PointsMedian PointImposed Pdf
281.6Stress Level PointsMedian PointImposed Pdf
John PaschkewitzWatlow Electric Mfg Co10/8/20093:06:05 PM
132 187 282 500 700
Region ofUnacceptableWatt Density
, wsi
Region ofAcceptableWatt Density
ALT Cycles from 250 to 400 C
ALT Cycles from 250 to 430 C
ALT Cycles from 250 to 500 C
0.168" dia sheath.021" dia PC NiCrwire cycled usingcontrolled duty cycleramp over 78 minute cycle
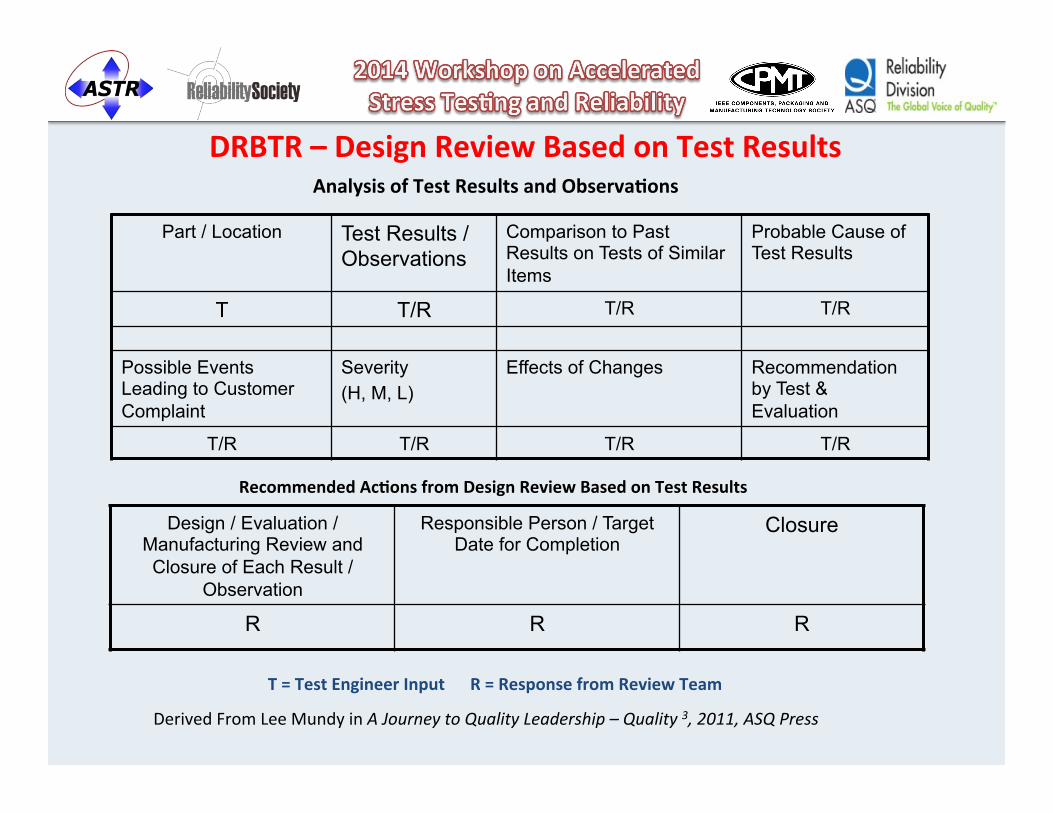
DRBTR – Design Review Based on Test Results
Part / Location Test Results / Observations
Comparison to Past Results on Tests of Similar Items
Probable Cause of Test Results
T T/R T/R T/R
Possible Events Leading to Customer Complaint
Severity (H, M, L)
Effects of Changes Recommendation by Test & Evaluation
T/R T/R T/R T/R
Design / Evaluation / Manufacturing Review and Closure of Each Result /
Observation
Responsible Person / Target Date for Completion
Closure
R R R
Recommended AcDons from Design Review Based on Test Results
Analysis of Test Results and ObservaDons
T = Test Engineer Input R = Response from Review Team
Derived From Lee Mundy in A Journey to Quality Leadership – Quality 3, 2011, ASQ Press

DRBTR Worksheet
AcDons:
Effects and Review Comments:
Test Results and Test Engineering Inputs:

Failure Analysis Process • Progressive Use of Tools from NDT to Dissec/on and Cross-‐Sec/on Exam
• Objec/ve is to Find Physical Evidence of Failure Mechanism
• Document with Photos and Analysis to Capture Knowledge Gained
• Update FMEA or DRBFM with FA Findings
Capturing FA Knowledge • Capture Failure Analysis Results (FAR) in Searchable Tool: – Ensure Data is: Correct, Findable, Applicable
• Key is Ability to Retrieve Knowledge with Minimal Search Effort
• Lean NPD is Knowledge Based – Key is Con/nually Adding to Accessible Knowledge – Next Development Starts with Review of FAR from similar previous products

Summary • Features of Lean PD for Reliability
– Front End Focus on Learning • Basis for BeXer Design Decisions
– Design for Robustness, Reliability – Understand Physics of Failure
• Tes/ng to Learn and Evaluate Alterna/ves – Test to Failure and Understand Causes – Accelerated Tes/ng is Essen/al
• Knowledge Capture for Future Re-‐use