Embed Size (px)
Citation preview
Ames II Mutagenicity Assay Technical Documentation
Table of Contents
1. Introduction
2. Principle of the Ames II Mutagenicity Assay
3. Strains used in the Ames II Mutagenicity Assay
4. Ames II Mutagenicity Assay Description
5. Ames II Mutagenicity Assay Test Kits
6. Automation of the Ames II Mutagenicity Assay
7. Validation Studies
a. Internal Validation Study
b. Multi Center Study
c. Comparison with DEREK
8. Advantages of the Ames II Mutagenicity Assay
9. Xenometrix Services
10. Literature
11. Product List

1. Introduction
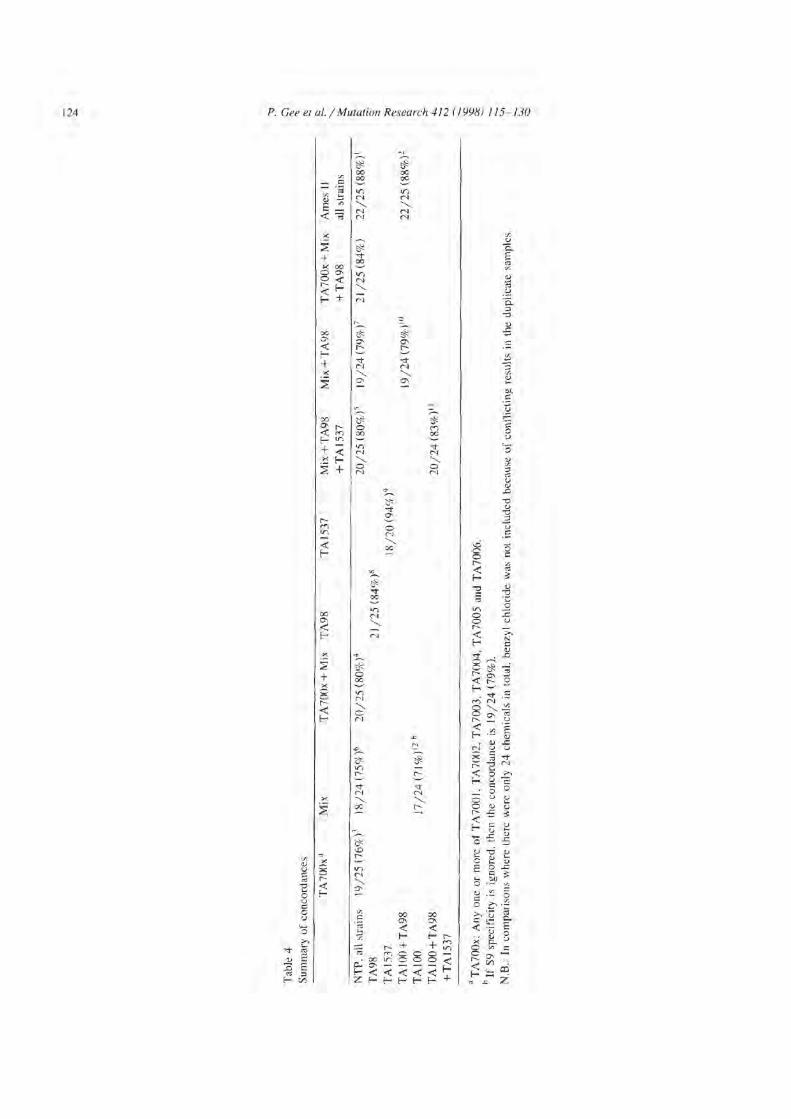
The traditional Ames plate incorporation test is one of the most commonly performed safety assays in the world, forming an important component of many regulatory submissions. However, with the increasing number of chemicals flowing through the drug development process, and the increasing demand for early indications of mutation and potential carcinogenesis, the number of Ames screening assays required is growing year by year. The traditional full-format Ames test cannot currently serve this market, since it requires too much chemical, labor and time to serve as a screening tool.
2. Principle of the Ames II Mutagenicity Assay
The traditional Ames plate incorporation test is the most generally used and validated bacterial reverse-mutation test. The test employs several mutant strains of Salmonella typhimurium, carrying mutations in the operon coding for histidine biosynthesis. When these bacteria are exposed to mutagenic agents, under certain conditions reverse mutation from histidine auxotrophy to histidine prototrophy occurs.
The increasing number of compounds to be screened and the fact, that new compounds are produced only in very small scale at this stage, were among the reasons to develop an alternative screening test to the traditional Ames test.
The Ames II Mutagenicity Assay, based on the same principle as the traditional test, sets a new standard for this type of testing, offering several advantages over the traditional Ames test.
The Ames II Mutagenicity Assay, available through Aniara, is a liquid microplate
modification of the Ames test which offers a higher speed format, new strains, colorimetry, easy handling and the possibility of automated plating and plate reading. The assay is fast and efficient, consumes a lower amount of test chemical, shows good correlation with the traditional assay and was developed in the Bruce Ames laboratory at U.C. Berkeley (1). Due to the possibility of automatization, hundreds of substances can be run within a month.
3. Strains used in the Ames II Mutagenicity Assay
The two strains provided in the Ames II test kit are the Ames II TAMix and TA98. The Ames II TAMix contains an equimolar mixture of the Ames II TA7001-TA7006 strains. Like the traditional strains, the genetic background of the TA700X series strains have been modified to improve the sensitivity of their reversion. Individually, these strains are designed to revert by only one specific base-pair substitution out of all possible changes. Thus, when mixed, all base pair substitution mutations can be represented in one culture. The TA98 strain is used for the detection of frameshift mutations (1).
4. Ames II Mutagenicity Assay Description
Approximately 107 bacteria are exposed to 6 concentrations of a test agent, as well as a positive and a negative control, for 90 minutes in medium containing sufficient histidine to support approximately two cell divisions. After 90 minutes, the exposure cultures are diluted in pH indicator medium lacking histidine, and aliquoted into 48 wells of a 384-well plate. Within two days, cells which have undergone the reversion to His will grow into colonies. Metabolism by the bacterial colonies reduces the pH of the medium, changing the colour of that well. This colour change can be detected visually or by microplate reader. The number of wells containing revertant colonies are counted for each dose and compared to a zero dose control. It is recommended to test each dose in triplicate.

An increase in the number of revertant colonies upon exposure to a test chemical relative to the zero-dose controls indicates that the chemical is mutagenic in the Ames II Mutagenicity Assay.
Genotypes of the Ames II TAMix & TA98 Salmonella typhimurium strains provided
Strain Mutation Type Target Cell Wall1 Repair2 pKM1013
TA98 hisD3052 Frameshift GC rfa uvrB yes
TAMix contains:
TA7001 hisG1775 b.p. sub. A:T>G:C rfa uvrB yes
TA7002 hisC9138 b.p. sub. T:A>A:T rfa uvrB yes
TA7003 hisG9074 b.p. sub. T:A>G:C rfa uvrB yes
TA7004 hisG9133 b.p. sub. G:C>A:T rfa uvrB yes
TA7005 hisG9130 b.p. sub. C:G>A:T rfa uvrB yes
TA7006 hisC9070 b.p. sub. C:G>G:C rfa uvrB yes
1 These mutations affect the lipopolysaccharide (LPS) component of the cell envelope. These strains have increased permeability for bulky molecules.
2 Strains carrying the uvrB mutation are deficient in excision repair of bulky lesions as measured by their lack of survival following UV254 irradiation.
3 This R factor plasmid carries the mucA and mucB genes to compensate for the weak mutagenic activities of the umu operon in Salmonella.
5. Ames II Mutagenicity Assay Test Kits
a. 1 Sample KitThis Manual System Kit or starter kit, contains all the consumable components ready-to-use and step-by-step “Instructions for Use”. It allows to test manually 1 sample in triplicate, 6 concentrations, positive and negative controls, with and without metabolic activation or 3 samples without replicate, 6 concentrations, positive and negative controls, in the absence and presence of metabolic activation.
b. 10 Samples Kit This kit is used for testing at least 10 compounds in triplicate, 6 concentrations, positive and negative controls, in the absence and presence of metabolic activation.
c. Design your own kit Any components and media necessary for the assay are available separately in any number.

6. Automation of the Ames II Mutagenicity Assay
The Ames II Mutagenicity Assay has been validated to combine the reliable experience of the standard Ames test with the high-throughput potential of the Ames II Mutagenicity Assay. A pipetting robot system with a needle and a disposable tip arm was used. It was concluded that the Ames II Mutagenicity Assay is a practicable test system for the purposes of lead optimization (2) (3).
7. Validation Studies a. Internal Validation Study of the Ames II Mutagenicity Assay
An Internal Validation Study has been performed with the goal to evaluate the ability of the Ames II Mutagenicity Assay and its TA700X series of Salmonella his- mutant tester strains to detect mutagens as classified by the National Toxicology Program (NTP) by the traditional tester strains (TA100, TA98, TA1535, TA1537, TA97, TA102).
Experts at the National Institute of Environmental Health Science (NIEHS) chose thirty coded chemicals which would serve as test articles in this study. At least 5 doses of each chemical were tested in triplicate, and repeat experiments were performed at least one week following the initial trial. The assay has been performed manually as well as in a high throughput system, using the a pipetting station. The high concordance with the standard plate incorporation test, and the reproducibility among the cultures and replicates demonstrated that the Ames II tester strains is an effective screen for identifying Salmonella mutagens (4).
One important component of this validation study was the proper recognition and adjustment for the various sources of statistical variability of the Ames II Mutagenicity Assay data. The statistical modeling of data obtained in the previous study are described in this report (5).
Further studies confirmed the conclusion, that the Ames II Mutagenicity Assay is a very effective alternative screening method to the standard plate incorporation test (6) (7).
b. Multi Center Study
The study had two goals, to corroborate the use of the Ames II Mutagenicity Assay as a suitable alternative screening assay to the traditional Ames plate incorporation method, and to test the Ames II Mutagenicity Assay system for its reproducibility among different laboratories. The following companies participated in this study: Aventis Pharma Deutschland GmbH, BASF AG, Boehringer Ingelheim, Johnson & Johnson Pharmaceutical Research & Development, Novartis Consumer Health, Schering AG, Servier Group, Federal Environmental Agency and Xenometrix. Nineteen coded chemicals were tested in these nine independent laboratories, for their mutagenic activity using the Ames II Mutagenicity Assay. The test compounds were selected from a published study with a large data set from the standard Ames plate incorporation test. The results of both assay systems were compared. The Ames II test results were all well reproducible among the different laboratories with a consistency of 89,5% and the sensitivity of both tests assays were comparable. The conclusion is, that the Ames II Mutagenicity Assay is an effective screening alternative to the standard Ames test, requiring less material and labor (8).
c. Comparison with DEREK
In a study performed by Aventis Pharma Germany, the results of the Ames II assay and the standard Ames test were compared with results predicted by DEREK. It could be shown, that the major number of compounds with DEREK alerts was identified with the Ames II assay (9).
8. Advantages of the Ames II Mutagenicity Assay
- Substantially lower amount of test chemicals than the traditional Ames test
Quality controlled S. typhimurium strains – no genotype analysis necessary
- Ready to use reagents, no media preparation, no autoclaving and sterility testing necessary
- Significantly reduced spontaneous reversion rates
- Easy handling, less hands-on-time than with the traditional Ames test
- Microplate format
- Automatable for high throughput screening
- Six-fold less plasticware, reduced disposal costs
9. Xenometrix Services
1) Training Program Training how to perform the Ames II Mutagenicity Assay in our/your facility, support of the evaluation setup in your own laboratory.
2) Client Research Laboratory Xenometrix has, at its Allschwil facility, a fully staffed and equipped laboratory for the purpose of performing an optimal Ames II Mutagenicity Assay and reporting work for customers. Xenometrix offers to perform assays, interpret data and produce detailed reports. The Client Research Laboratory staff is trained in all aspects of the Ames II Mutagenicity Assay, making for a very efficient and cost-effective process. Depending upon answers to a clients questionnaire, detailed reports are likely to be completed within 7 days. Data can also be communicated immediately upon assay completion (3 days).
10. Literature
(1) P Gee, DM Maron, and BN Ames; Detection and classification of mutagens: A set of base-specific Salmonella tester strains; Proc Nat Acad Sci USA (1994) 91, 11606-11610.
(2) K Braun; Automation of the Ames II Assay: High Through-put screening of mutagenic substances; Aventis Pharma Deutschland GmbH, DI & A, Lead Optimization, Drug Safety Evaluation, MipTec ICAR (2001).
(3) M Crook; Automation of the Ames II toxicology test; MipTec-ICAR (2000) P07.
(4) P Gee, CH Sommers, AS Melick, XM Gidrol, MD Todd, RB Burris, ME Nelson, RC Klemm, E Zeiger; Comparison of responses of base-specific Salmonella tester strains with the traditional strains for identifying mutagens: The results of a validation study; Mutation Res (1998) 412, 115-130.
(5) WW Piegorsch, SJ Simmons, BH Margolin, E Zeiger, XM Gidrol, P Gee; Statistical modeling and analyses of a base-specific Salmonella mutagenicity assay; Mutation Res (2000) 467, 11-19.
(6) G Engelhardt, E Jacob, R Jäckh; Ames II assay: results of a validation study; Naunyn-Schmiedeberg’s Arch Pharmacol (1999) 359, 179.
(7) V Gervais, D Bijot, N Claude; Assessment of a screening experience with the Ames II test and future prospects; European Environmental Mutagen Society Annual Meeting: From Hazard to risk, Aberdeen Scotland (UK) (2003) P120.
(8) S Flückiger-Isler, M Baumeister, K Braun, V Gervais, N Hasler-Nguyen, R Reimann, J van Gompel, H-G Wunderlich, G Engelhardt; Assessment of the performance of the Ames II assay: A collaborative study with 19 coded compounds; Mutation Res (2004) 558, 181-197.
(9) K. Braun, H.-P. Spirkl, A. Czich, I. Stammberger, A. Amberg , Comparison of DEREK, Ames and Ames II, Gesellschaft für Umwelt-Mutationsforschung e.V., 21. GUM-Tagung, Würzburg (D), 2004.
Product Art. No. Content
AMES II MUTAGENICITY ASSAY SYSTEMSAmes II TA225 Manual System Kit (Liquid/Frozen) AE01-213 1 sample kit
Ames II TA225 - 1 Sample Kit-Incl. Pos. Controls (Liquid/Frozen) AE01-213-S1-P 1 sample kit
Ames II TA225 - 1 Sample Kit - Pos.Contr. S2 (Liquid/Frozen) AE01-213-S2-P 1 sample kit
Ames II TA220 Automated System for High Throughput (Liquid/Frozen) AE10-213 10 samples kit
Ames II TA220 - 10 Sample Kit-Incl. Pos. Controls S1 (Liquid/Frozen) AE10-213-S1-P 10 samples kit
Ames II TA220 - 10 Sample Kit - Pos.Contr. S2 (Liquid/Frozen) AE10-213-S2-P 10 samples kit
AMES II AQUA TESTINGAmes II Aqua - 1 Sample Kit - 48 Measuring Points/Strain AL01-213 1 sample kit
Ames II Aqua - 1 Sample Kit - 48 Measuring Points/Strain-Rat Liver S9-Pos. Controls AL01-213-S1-P 1 sample kit
Ames II Aqua - 1 Sample Kit - 48 Measuring Points - Lyophilized Rat Liver S9 - Pos. Controls S2 AL01-213-S2-P 1 sample kit
Ames II Aqua - 5 Sample Kit - 240 Measuring Points/Strain AL05-213 5 samples kit
Ames II Aqua - 5 Sample Kit - 240 Measuring Points/Strain-Rat Liver S9-Pos. Controls AL05-213-S1-P 5 samples kit
Ames II Aqua - 5 Sample Kit - 240 Measuring Points - Lyophilized Rat Liver S9 - Pos. Controls S2 AL05-213-S2-P 5 samples kit
AMES II MEDIAAmes II Salmonella Exposure Medium (RT) (Liquid/Frozen) (100 ml) APMA-EM41 100 ml
Ames II Salmonella Exposure Medium (RT) (Liquid/Frozen) (50 ml) APMA-EM42 50 ml
Ames MPF, Ames II & E.coli 50 ml Growth Medium (RT) (Liquid/Frozen) APMM-GM00 50 ml
Ames II Salmonella Reversion Indicator Medium (RT) (Liquid/Frozen) (550 ml) APMA-IM51 550 ml
Ames II Salmonella Reversion Indicator Medium (RT) (Liquid/Frozen) (100 ml) APMA-IM52 100 ml
Ames II StrainsAmes Ampicillin APAM-0001 1 vial
Ames TA98 S. typhimurium Strain (Liquid/Frozen) APLI-0110 50 µl
Ames TAMix S. typhimurium Strain (Liquid/Frozen) APLI-0114 50 µl
Additional Xenometrix Products
Cytotoxicity Test Kits
Product Product Size Art. No.
One Parameter
CVDE Crystal Violet Dye Elution (1200) 1200 tests without microplates AKCV96-1200
CVDE Crystal Violet Dye Elution (1210) 1200 tests with 16 microplates, 40 reservoirs AKCV96-1210
CVDE Crystal Violet Dye Elution (300) 300 tests without microplates AKCV96-300
CVDE Crystal Violet Dye Elution (310) 300 tests with 4 microplates, 10 reservoirs AKCV96-310
CVDE Crystal Violet Dye Elution (9600) 9600 tests without microplates (2.5 g) AKCV96-9600
GLU Glucose (1200) 1200 tests without microplates AKGLU96-1200
GLU Glucose (1210) 1200 tests with 32 microplates, 24 reservoirs AKGLU96-1210
GLU Glucose (400) 400 tests without microplates AKGLU96-400
GLU Glucose (410) 400 tests with 10 microplates, 9 reservoirs AKGLU96-410
LDHe Extracellular Lactate Dehydrogenase (310) 300 tests with 8 microplates, 4 reservoirs AKLE96-310
LDHe Extracellular Lactate Dehydrogenase (1210) 1200 tests with 32 microplates, 16 reservoirs AKLE96-1210
LDHe Extracellular Lactate Dehydrogenase (1200) 1200 tests without microplates AKLE96-1200
LDHe Extracellular Lactate Dehydrogenase (2400) 2400 tests without microplates AKLE96-2400
LDHe Extracellular Lactate Dehydrogenase (300) 300 tests without microplates AKLE96-300
MTT Diphenyltetrazolium Bromide (1200) 1200 tests without microplates AKMT96-1200
MTT Diphenyltetrazolium Bromide (1210) 1200 tests with 16 microplates, 40 reservoirs AKMT96-1210
MTT Diphenyltetrazolium Bromide (300) 300 tests without microplates AKMT96-300
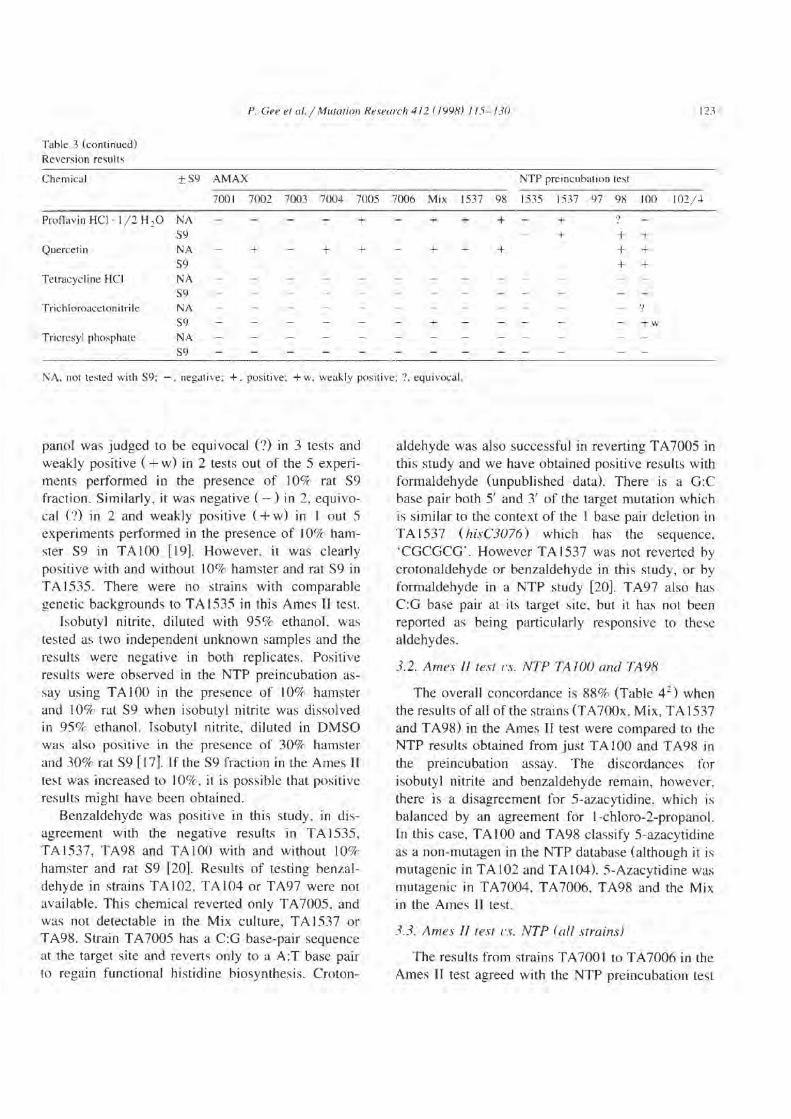
MTT Diphenyltetrazolium Bromide (310) 300 tests with 4 microplates, 10 reservoirs AKMT96-310
MTT Diphenyltetrazolium Bromide (9600) 9600 tests without microplates (500 mg) AKMT96-9600
NR Neutral Red (1200) 1200 tests without microplates AKRN96-1200
NR Neutral Red (1210) 1200 tests with 16 microplates, 40 reservoirs AKRN96-1210
NR Neutral Red (2400) 2400 tests without microplates AKRN96-2400
NR Neutral Red (300) 300 tests without microplates AKRN96-300
NR Neutral Red (310) 300 tests with 4 microplates, 10 reservoirs AKRN96-310
NR Neutral Red (9600) 9600 tests without microplates (400 ml, 1:300 solution) AKRN96-9600
PAC Acid Phosphatase (1200) 1200 tests without microplates AKPA96-1200
PAC Acid Phosphatase (1210) 1200 tests with 16 microplates, 32 reservoirs AKPA96-1210
PAC Acid Phosphatase (300) 300 tests without microplates AKPA96-300
Product Product Size Art. No.
PAC Acid Phosphatase (310) 300 tests with 4 microplates, 8 reservoirs AKPA96-310
SRB Sulforhodamine B (1200) 1200 tests without microplates AKSR96-1200
SRB Sulforhodamine B (1210) 1200 tests with 16 microplates, 56 reservoirs AKSR96-1210
SRB Sulforhodamine B (300) 300 tests without microplates AKSR96-300
SRB Sulforhodamine B (310) 300 tests with 4 microplates, 14 reservoirs AKSR96-310
SRB Sulforhodamine B (9600) 9600 tests without microplates (2 g) AKSR96-9600
XTT Tetrazolium Hydroxide (1200) 1200 tests without microplates AKXT96-1200
XTT Tetrazolium Hydroxide (1210) 1200 tests with 16 microplates, 32 reservoir AKXT96-1210
XTT Tetrazolium hydroxide (2400) 2400 tests without microplates AKXT96-2400
XTT Tetrazolium Hydroxide (300) 300 tests without microplates AKXT96-300
XTT Tetrazolium Hydroxide (310) 300 tests with 4 microplates, 8 reservoirs AKXT96-310
XTT Tetrazolium Hydroxide (9600) 9600 tests without microplates (500 mg) AKXT96-9600
Two Parameter
LDHE-XTT (1200) 2 x 1200 tests without microplates AKLEX96-1200
LDHE-XTT (1210) 2 x 1200 tests with 32 microplates, 40 reservoirs AKLEX96-1210
LDHE-XTT (300) 2 x 300 tests without microplates AKLEX96-300
LDHE-XTT (310) 2 x 300 tests with 8 microplates, 10 reservoirs AKLEX96-310
NR - CVDE (1200) 2 x 1200 tests without microplates AKRCV96-1200
NR - CVDE (1210) 2 x 1200 tests with 16 microplates, 72 reservoirs AKRCV96-1210
NR - CVDE (300) 2 x 300 tests without microplates AKRCV96-300
NR - CVDE (310) 2 x 300 tests with 4 microplates, 18 reservoirs AKRCV96-310
NR - SRB (1200) 2 x 1200 tests without microplates AKRSR96-1200
NR - SRB (1210) 2 x 1200 tests with 16 microplates, 88 reservoirs AKRSR96-1210
NR - SRB (300) 2 x 300 tests without microplates AKRSR96-300
NR - SRB (310) 2 x 300 tests with 4 microplates, 22 reservoirs AKRSR96-310
SRB - CVDE (1200) 2 x 1200 tests without microplates AKSRCV96-1200
SRB - CVDE (1210) 2 x 1200 tests with 16 microplates, 88 reservoirs AKSRCV96-1210
SRB - CVDE (300) 2 x 300 tests without microplates AKSRCV96-300
SRB - CVDE (310) 2 x 300 tests with 4 microplates, 22 reservoirs AKSRCV96-310
XTT - CVDE (300) 2 x 300 tests without microplates AKXCV96-300
XTT - CVDE (1200) 2 x 1200 tests without microplates AKXCV96-1200
Product Product Size Art. No.
XTT - CVDE (1210) 2 x 1200 tests with 16 microplates, 64 reservoirs AKXCV96-1210
XTT - CVDE (310) 2 x 300 tests with 4 microplates, 16 reservoirs AKXCV96-310
XTT - PAC (1200) 2 x 1200 tests without microplates AKXPAC96-1200
XTT - PAC (1210) 2 x 1200 tests with 16 microplates, 56 reservoirs AKXPAC96-1210
XTT - PAC (300) 2 x 300 tests without microplates AKXPAC96-300
XTT - PAC (310) 2 x 300 tests with 4 microplates, 14 reservoirs AKXPAC96-310
XTT - SRB (1200) 2 x 1200 tests without microplates AKXSR96-1200
XTT - SRB (1210) 2 x 1200 tests with 16 microplates, 80 reservoirs AKXSR96-1210
XTT - SRB (300) 2 x 300 tests without microplates AKXSR96-300
XTT - SRB (310) 2 x 300 tests with 4 microplates, 20 reservoirs AKXSR96-310
XTT-NR (1200) 2 x 1200 tests without microplates AKXN96-1200
XTT-NR (1210) 2 x 1200 tests with 16 microplates, 48 reservoirs AKXN96-1210
XTT-NR (300) 2 x 300 tests without microplates AKXN96-300
XTT-NR (310) 2 x 300 tests with 4 microplates, 9 reservoirs AKXN96-310
Three Parameter
GLU-XTT-CVDE (1200) 1200 tests without microplates AKGXCV96-1200
GLU-XTT-CVDE (1210) 1200 tests with 32 microplates, 80 reservoirs AKGXCV96-1210
GLU-XTT-CVDE (300) 300 tests without microplates AKGXCV96-300
GLU-XTT-CVDE (310) 300 tests with 8 microplates, 20 reservoirs AKGXCV96-310
LDHe-XTT-NR (1200) 3 x 1200 tests without microplates AKLEXR96-1200
LDHe-XTT-NR (1210) 3 x 1200 tests with 32 microplates, 72 reservoirs AKLEXR96-1210
LDHe-XTT-NR (300) 3 x 300 tests without microplates AKLEXR96-300
LDHe-XTT-NR (310) 3 x 300 tests with 8 microplates, 18 reservoirs AKLEXR96-310
LDHe-XTT-SRB (1200) 3 x 1200 tests without microplates AKLEXSR96-1200
LDHe-XTT-SRB (1210) 3 x 1200 tests with 32 microplates, 88 reservoirs AKLEXSR96-1210
LDHe-XTT-SRB (300) 3 x 300 tests without microplates AKLEXSR96-300
LDHe-XTT-SRB (310) 3 x 300 tests with 8 microplates, 22 reservoirs AKLEXSR96-310
XTT-NR-CVDE (1200) 3 x 1200 tests without microplates AKXTRCV96-1200
XTT-NR-CVDE (1210) 3 x 1200 tests with 16 microplates, 96 reservoirs AKXTRCV96-1210
XTT-NR-CVDE (2400) 2400 tests without microplates AKXTRCV96-2400
XTT-NR-CVDE (300) 3 x 300 tests without microplates AKXTRCV96-300
Product Product Size Art. No.
XTT-NR-CVDE (310) 3x300 tests with 4 microplates, 24 reservoirs AKXTRCV96-310
XTT-NR-SRB (1200) 3 x 1200 tests without microplates AKXTRS96-1200
XTT-NR-SRB (1210) 3 x 1200 tests with 32 microplates, 112 reservoirs AKXTRS96-1210
XTT-NR-SRB (300) 3 x 300 tests without microplates AKXTRS96-300
XTT-NR-SRB (310) 3 x 300 tests with 8 microplates, 28 reservoirs AKXTRS96-310
XTT-SRB-CVDE (1200) 3 x 1200 tests without microplates AKXTSCV96-1200
XTT-SRB-CVDE (1210) 3 x 1200 tests with 32 microplates, 112 reservoirs AKXTSCV96-1210
XTT-SRB-CVDE (300) 3 x 300 tests without microplates AKXTSCV96-300
XTT-SRB-CVDE (310) 3 x 300 tests with 8 microplates, 28 reservoirs AKXTSCV96-310
Four Parameter
LDHE-GLU-XTT-PAC (1200) 4 x 1200 tests without microplates AKLGXP96-1200
LDHE-GLU-XTT-PAC (1210) 4 x 1200 tests with 48 microplates, 80 reservoirs AKLGXP96-1210
LDHE-GLU-XTT-PAC (300) 4 x 300 tests without microplates AKLGXP96-300
LDHE-GLU-XTT-PAC (310) 4 x 300 tests with 12 microplates, 20 reservoirs AKLGXP96-310
LDHE-GLU-XTT-SRB (1200) 4 x 1200 tests without microplates AKLGXS96-1200
LDHE-GLU-XTT-SRB (1210) 4 x 1200 tests with 48 microplates, 104 reservoirs AKLGXS96-1210
LDHE-GLU-XTT-SRB (300) 4 x 300 tests without microplates AKLGXS96-300
LDHE-GLU-XTT-SRB (310) 4 x 300 tests with 12 microplates, 26 reservoirs AKLGXS96-310
LDHE-XTT-NR-SRB (1200) 4 x 1200 tests without microplates APANI96-1200
LDHE-XTT-NR-SRB (1210) 4 x 1200 tests with 48 microplates, 120 reservoirs APANI96-1210
LDHE-XTT-NR-SRB (300) 4 x 300 tests without microplates APANI96-300
LDHE-XTT-NR-SRB (310) 4 x 300 tests with 12 microplates, 30 reservoirs APANI96-310
Ames II Assay
Culture
Stored at –80°C
Test Compound
OvernightCulture
Assay Preparation
37°C, 12 –17-h250 rpm
OD600
Exposure Culture
24-Well Plate
37°C, 90 min, 250 rpm
Bacteria Culture
S9-Mix
Exposure Medium
TAMix
A
B
C
D
C-
D1
D2
D3
D4
D5
D6
C+
TA
Mix
TA
Mix
Indicator
Medium
C-
D1
D2
D3
D4
D5
D6
C+
A
B
C
D
C-
D1
D2
D3
D4
D5
D6
C+
384-Well Plate
48 h
37 Co
What are the Advantages
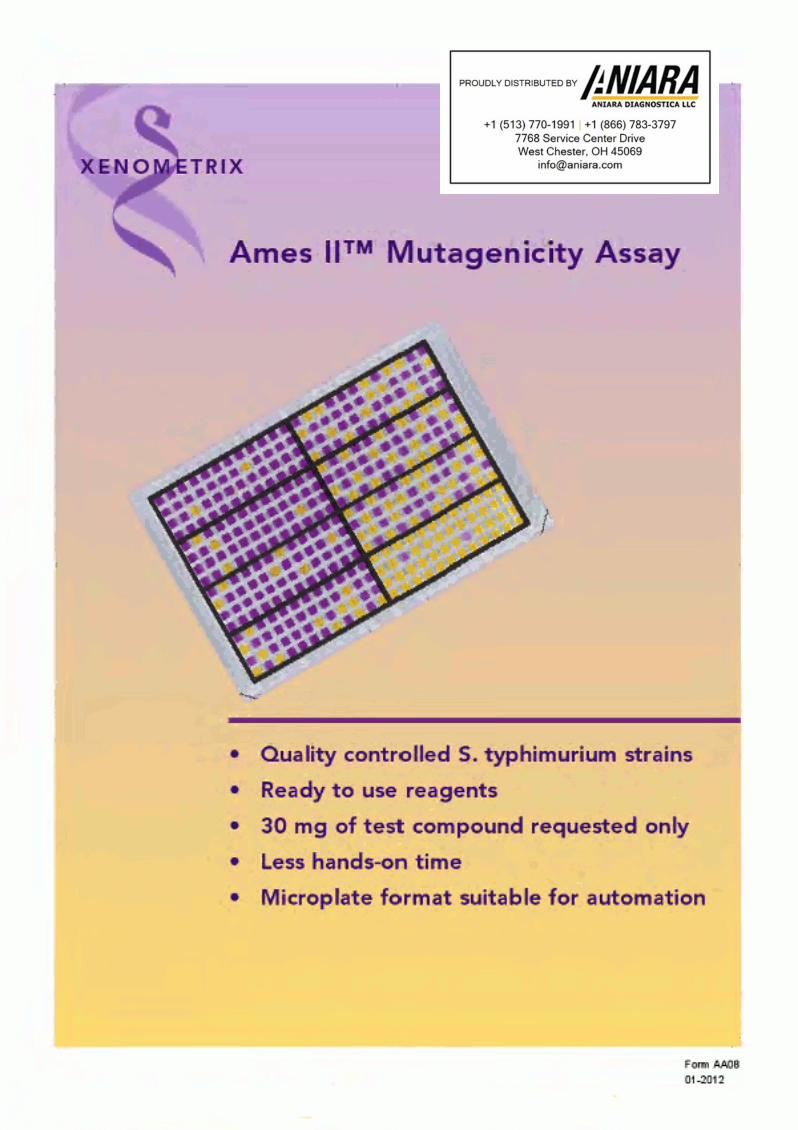
• 30 mg of test compound requested only
• Quality controlled S. typhimurium strains – no genotype
analysis necessary
• Ready to use reagents
• Less hands-on time
• Microplate format
• Automatable for high throughput screening
• Six times less plastic ware, reduced disposal costs
XENOMETRIX by Endotell

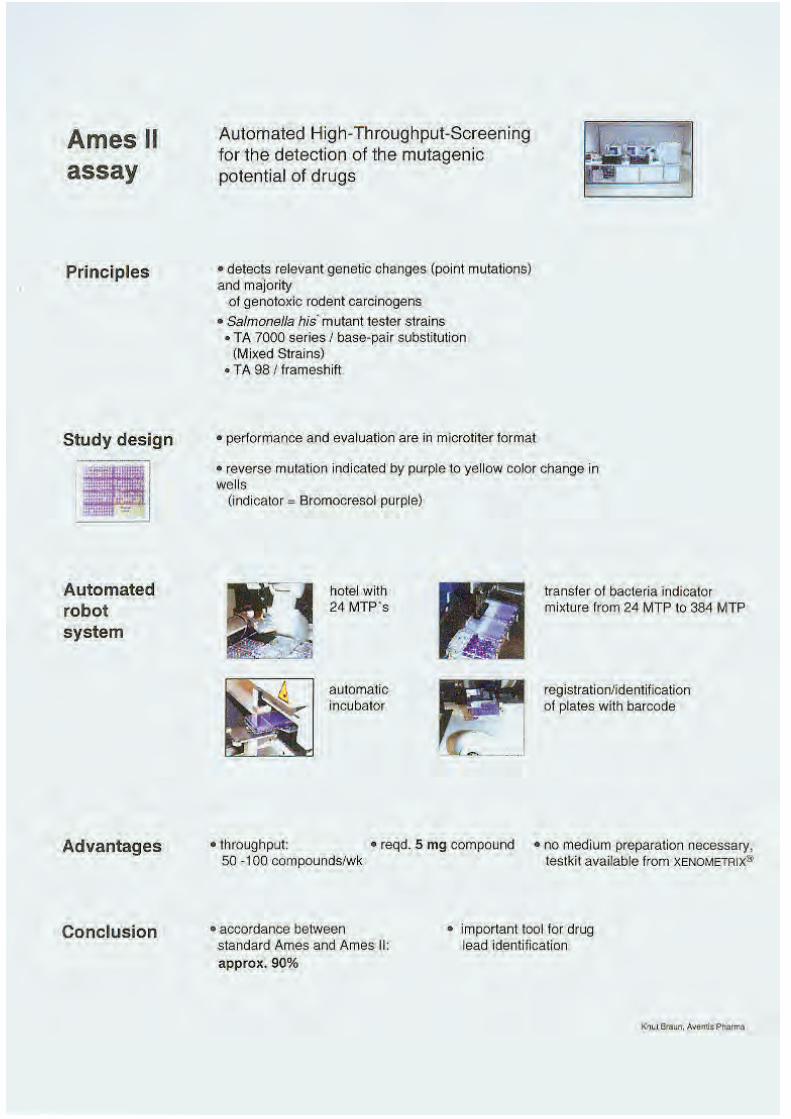
Automation of the AMES II-Assay: High-Throughput Screening of Mutagenic Substances
Background
A new version of the AMES Assay has been developed to identify base-repair substitution mutations upon detection of mutagens. Six Salmonella typhimurium strains have been constructed, each of which carries a different missense mutation in the histidine operon that is designed to revert uniquely to one of the six possible base substitutions. Reversion via the base substitution unique to each strain was verified by sequence analyses of more that 800 independent revertants induced by a variety of mutagens. AMES II permits identification of missense mutations caused by mutagens without the need to sequence by spectrophotometric analysis. AMES II strains can be combined and used as a single mixture for rapid screening due to minimal complementation among the 6 strains. Lower spontaneous reversion frequencies allow the detection of mutagens at lower concentrations without loss of sensitivity to a large range of doses. Liquid format in microtiter plates leads to increased sensitivity and easy automation.
The original Ames assay is a well established system in Aventis Pharma for mutagenicity testing during the development of compounds; the Ames II assay has been be validated also in Aventis Pharma to combine the reliable experience of the original test with the high-throughput potential of the Ames II assay. Ames II mutagenicity Assays is available in suspension culture form with
combined strains for HTS configuration. This kit is sold by Aniara (AMAX automated system).
It can be used to replace or complement classical Ames test approaches. A workstation would provide the throughput needed.
Technical Requirements
• Expertise in AMES test analysis.
• An automated workstation with format versatility to provide 384-well configuration of plate formats.
• Test kits are on sale by Aniara.
Impact
• The assay detects the pointmutagenic endpoint of a substance which should be considered as a “red flag” for the mutagenic and carcinogenic properties of a compound.
• The objective for these assays is to rank about 100 compounds per week.
• The approach would help in the early selection of compound for progression in the critical path and impact the design of new compound libraries as well.
• The compound consumption for one test is only five milligrams.
Conclusion
The AMES II-Test makes it possible to make a rapid statement about the mutagenicity of a substance, using a very small amount of substance. Comparability of studies as against the standard Ames-Test lies around 90 %. The AMES II-Test is thus a practicable test system for the purposes of lead optimization.
Knut Braun Aventis Pharma Deutschland GmbH DI & A, Lead Optimization Drug Safety Evaluation Mainzer Landstraße 500 D-65795 Hattersheim Tel.: ++49 (0) 6190 - 807 - 300 Fax: ++49 (0) 69 - 305 88491 E-Mail: [email protected]


Ž .Mutation Research 467 2000 11–19
www.elsevier.comrlocatergentox
Community address: www.elsevier.comrlocatermutres
Statistical modeling and analyses of a base-specific Salmonella
mutagenicity assay
Walter W. Piegorsch a,), Susan J. Simmons a, Barry H. Margolin b, Errol Zeiger c,Xavier M. Gidrol d, Pauline Gee d
aDepartment of Statistics, UniÕersity of South Carolina, 216 LeConte College, Columbia, SC 29208, USA
bDepartment of Biostatistics, UniÕersity of North Carolina, Chapel Hill, NC 27599, USA
cNational Institute of EnÕironmental Health Sciences, Research Triangle Park, NC 27709, USA
dXenometrix, Inc., Boulder, CO 80301, USA
Received 6 October 1999; received in revised form 11 January 2000; accepted 3 February 2000
Abstract
Statistical features of a base-specific Salmonella mutagenicity assay are considered in detail, following up on a previousŽ .report comparing responses of base-specific Salmonella Ames IIe strains with those of traditional tester strains. In
addition to using different Salmonella strains, the new procedure also differs in that it is performed as a microwell
fluctuation test, as opposed to the standard plate or preincubation test. This report describes the statistical modeling of data
obtained from the use of these new strains in the microwell test procedure. We emphasize how to assess any significant
interactions between replicate cultures and exposure doses, and how to identify a significant increase in the mutagenic
response to a series of concentrations of a test substance. q 2000 Elsevier Science B.V. All rights reserved.
Keywords: Ames II strains; Salmonella typhimurium; Complementary log–log link function; Culture-by-dose interaction; Fluctuation test;
Generalized linear model; Hisy mutant tester strains; Many-to-one testing; Multiple comparisons with a control; Statistical methods
1. Introduction
The Salmonellarmicrosome reversion assay has
been used extensively in genetic toxicology testingw x1–4 . The procedure employs bacterial tester strains
that identify the reversions of missense and small
frameshift mutations in the his operon. Despite the
widespread acceptance of this test, new Salmonella
)
Corresponding author. Tel.: q1-803-777-7800; fax: q1-803-
777-4048.Ž .E-mail address: [email protected] W.W. Piegorsch .
tester strains are constantly being developed andw xstudied. In a previous report 5 , we discussed the
use and validity of a series of six new hisy mutantŽstrains TA7001, TA7002, TA7003, TA7004,
.TA7005 and TA7006 , each of which was designed
to revert to his independence by unique base-pairw xsubstitutions 6 . The TA700X series of tester strains
Žhas been designated ‘‘Ames IIe’’ Xenometrix,.Boulder, CO, USA .
In order to help automate the data collection
process, and to allow the assay to be adapted to
high-throughput, robot-controlled procedures, a mod-w xified fluctuation protocol 7,8 has been developed
1383-5718r00r$ - see front matter q 2000 Elsevier Science B.V. All rights reserved.Ž .PII: S1383-5718 00 00019-X

( )W.W. Piegorsch et al.rMutation Research 467 2000 11–1912
Žfor use with the TA700X tester strains AMAXe:.Ames II Mutagenicity Assays by Xenometrix . In
our previous report on the AMAXe procedure, the
performance of these strains was compared with the
results obtained using the traditional Salmonellaw xtester strains in a preincubation procedure 4,5 .
ŽThirty coded chemicals five of which were dupli-.cates with different code numbers were tested in the
individual strains TA7001–TA7006 to identify muta-
gens that produced base-pair substitutions, in a mix-
ture of these six strains, and in the traditional strains
TA98 and TA1537 to detect frameshift mutagens.
All testings were done using a modified liquid fluc-
tuation test procedure as designated in the AMAXe
protocol. The results were compared to results ob-
tained previously using a preincubation protocol withŽ .strains TA98, TA100, TA1537 or TA97 and
w xTA1535 5 .
One important component of the validation effort
in this previous study was proper recognition and
adjustment for the various sources of statistical vari-
ability in the AMAXe data. However, the statistical
analysis of those data was conducted at an introduc-
tory level only. The current manuscript presents
more detailed statistical aspects of the AMAXe
assay, based on the data from the previous validation
study. The issues discussed include the aspects of the
sampling protocol, the possible interactions between
cultures and exposures to mutagens, and the identifi-
cation of exposure-related effects using a form of
generalized linear statistical model. Recommenda-
tions are made for statistical analysis of microwellŽ .fluctuation test e.g., AMAXe data from these
Salmonella strains.
2. Methods
2.1. AMAXe protocol and experiments
Eight individual Salmonella typhimurium strains
and a mixture of the base-specific strains were em-
ployed in our previous report, where the strains andw xtheir genotypes are described 5 . Each of the six
Ž .base-specific strains TA7001–TA7006 carries a
target missense mutation in the histidine operon,
which reverts to prototrophy by base-substitution
events unique to each strain. Strains TA7001,
TA7002 and TA7003 detect base substitutions at
A:T base pairs, while TA7004, TA7005 and TA7006
detect base changes at G:C base pairs.
The TA700X strains are not designed to identify
mutagens that induce only frameshift mutations.
Thus, routine tests of unknown chemicals must also
use one or two of the traditional strains that are
designed to detect frameshift mutations, viz. TA98
and TA1537. For the purposes of the previous studyw x5 , these two strains were used in the AMAXe
procedure along with the TA700X strains.
All 30 coded chemicals were studied without
exogenous metabolic activation. Those that appearedŽ .to be negative in the initial test 18 out of 30 using a
subjective, non-statistical assessment were also testedŽ .in the presence of S9 4.5% rat liver S9 fraction , in
order to allow for possible metabolic activation.
Protocols used to generate the data analyzed hereinw xwere detailed in our previous report 5 . Data were
collected for a positive control, five doses of eachŽ .test chemical including a zero-dose control , and for
a solvent control. Each culture was treated indepen-
dently with the test chemical in a total exposureŽ .volume Exposure Medium of 0.5 ml per dose, in
triplicate. Following exposure, 2.5 ml of selectiveŽ .medium Indicator Media was added and 50 ml
aliquots were dispensed into 48 wells of 384-well
microtiter plates, either manually or using a MLŽ .2200 pipeting station Hamilton, Reno, NV . Each
experiment was performed using three independent
cultures by one of two teams of experimenters on the
same day andror up to 3 weeks later. Each culture
was inoculated from separate frozen vials, although
each vial of cells used for the study was from the
same production lot. Each chemical was tested up to
5 mg, the maximal tolerated dose, or the limits of the
solubility, whichever was reached first.w xA concern noted previously 5 with this assay
system is that under otherwise-homogeneous prepa-
ration, a few cultures may exhibit an extreme re-
sponse, called jackpot mutations. Jackpots result
from reversion events that occur early in the growth
of the overnight culture, such that the wild-type
revertant population expands during the overnight
growth and pre-exists in the culture before exposure
to the test agent. High spontaneous counts are usu-
ally attributed to jackpot mutations, and may obscure
any increase in reversion events caused by the test
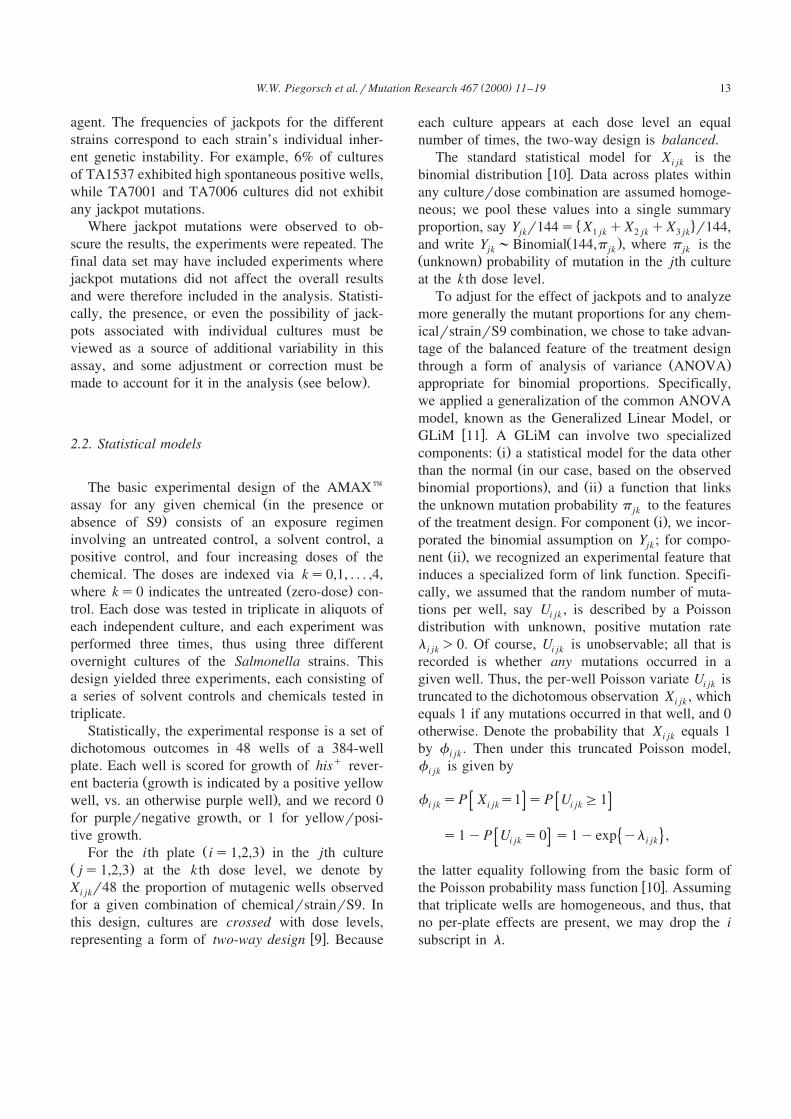
( )W.W. Piegorsch et al.rMutation Research 467 2000 11–19 13
agent. The frequencies of jackpots for the different
strains correspond to each strain’s individual inher-
ent genetic instability. For example, 6% of cultures
of TA1537 exhibited high spontaneous positive wells,
while TA7001 and TA7006 cultures did not exhibit
any jackpot mutations.
Where jackpot mutations were observed to ob-
scure the results, the experiments were repeated. The
final data set may have included experiments where
jackpot mutations did not affect the overall results
and were therefore included in the analysis. Statisti-
cally, the presence, or even the possibility of jack-
pots associated with individual cultures must be
viewed as a source of additional variability in this
assay, and some adjustment or correction must beŽ .made to account for it in the analysis see below .
2.2. Statistical models
The basic experimental design of the AMAXe
Žassay for any given chemical in the presence or.absence of S9 consists of an exposure regimen
involving an untreated control, a solvent control, a
positive control, and four increasing doses of the
chemical. The doses are indexed via ks0,1, . . . ,4,Ž .where ks0 indicates the untreated zero-dose con-
trol. Each dose was tested in triplicate in aliquots of
each independent culture, and each experiment was
performed three times, thus using three different
overnight cultures of the Salmonella strains. This
design yielded three experiments, each consisting of
a series of solvent controls and chemicals tested in
triplicate.
Statistically, the experimental response is a set of
dichotomous outcomes in 48 wells of a 384-well
plate. Each well is scored for growth of hisq rever-Žent bacteria growth is indicated by a positive yellow
.well, vs. an otherwise purple well , and we record 0
for purplernegative growth, or 1 for yellowrposi-
tive growth.Ž .For the ith plate is1,2,3 in the jth culture
Ž .js1,2,3 at the k th dose level, we denote by
X r48 the proportion of mutagenic wells observedi jk
for a given combination of chemicalrstrainrS9. In
this design, cultures are crossed with dose levels,w xrepresenting a form of two-way design 9 . Because
each culture appears at each dose level an equal
number of times, the two-way design is balanced.
The standard statistical model for X is thei jk
w xbinomial distribution 10 . Data across plates within
any culturerdose combination are assumed homoge-
neous; we pool these values into a single summary� 4proportion, say Y r144s X qX qX r144,jk 1 jk 2 jk 3 jk
Ž .and write Y ;Binomial 144,p , where p is thejk jk jk
Ž .unknown probability of mutation in the jth culture
at the k th dose level.
To adjust for the effect of jackpots and to analyze
more generally the mutant proportions for any chem-
icalrstrainrS9 combination, we chose to take advan-
tage of the balanced feature of the treatment designŽ .through a form of analysis of variance ANOVA
appropriate for binomial proportions. Specifically,
we applied a generalization of the common ANOVA
model, known as the Generalized Linear Model, orw xGLiM 11 . A GLiM can involve two specialized
Ž .components: i a statistical model for the data otherŽthan the normal in our case, based on the observed
. Ž .binomial proportions , and ii a function that links
the unknown mutation probability p to the featuresjk
Ž .of the treatment design. For component i , we incor-
porated the binomial assumption on Y ; for compo-jk
Ž .nent ii , we recognized an experimental feature that
induces a specialized form of link function. Specifi-
cally, we assumed that the random number of muta-
tions per well, say U , is described by a Poissoni jk
distribution with unknown, positive mutation rate
l )0. Of course, U is unobservable; all that isi jk i jk
recorded is whether any mutations occurred in a
given well. Thus, the per-well Poisson variate U isi jk
truncated to the dichotomous observation X , whichi jk
equals 1 if any mutations occurred in that well, and 0
otherwise. Denote the probability that X equals 1i jk
by f . Then under this truncated Poisson model,i jk
f is given byi jk
f sP X s1 sP U G1i jk i jk i jk
s1yP U s0 s1yexp yl ,� 4i jk i jk
the latter equality following from the basic form ofw xthe Poisson probability mass function 10 . Assuming
that triplicate wells are homogeneous, and thus, that
no per-plate effects are present, we may drop the i
subscript in l.

( )W.W. Piegorsch et al.rMutation Research 467 2000 11–1914
The usual ANOVA formulation for the mean
response under a two-way design is a linear combi-
nation of the unknown effect parameters:
mqg qd qc , 1Ž .j k jk
where for our setting, m is an overall effect parame-
ter, g is a term for the culture effect, d is a termj k
for the dose effect, and c represents a possiblejk
Ž .interaction between culture and dose. In Eq. 1 , gj
represents a ‘‘blocking’’ term that accounts for any
jackpot-related culture-to-culture variability.
In most ANOVA settings, the linear expression inŽ .Eq. 1 is set equal to the mean response and ana-
Ž .lyzed accordingly. Here, however, equating 1 to
the mean mutation rate l fails to account for thejk
constraint that l must be positive. To overcome this,
we can model l itself as an exponential form:jk
l sexp mqg qd qc . 2� 4 Ž .jk j k jk
Ž .Under Eq. 2 , l is guaranteed to be positive forjk
any realization of the linear effect parameters in Eq.Ž .1 .
Collecting all of these model components to-
gether, the resulting GLiM may be written as Y ;jk
Ž . � wBinomial 144,p , where p s1yexp yexp mqjk jk
x4g qd qc and Y is the sum over the threej k jk jk
replicate plates of the mutant wells at the jth cultureŽ . Ž .js1,2,3 and the k th dose ks0,1,2,3,4 for any
chemical compound being tested. Inverting this
model for p gives:
log ylog 1yp smqg qd qc , 3Ž .� 4Ž .jk j k jk
which is known as a complementary log–log GLiMw x10,11 .
2.3. Statistical analyses
Under the complementary log–log GLiM in Eq.Ž .3 , we can assess whether there is an effect due to
the dose after correcting for possible culture-to-cul-
ture variability. As is well known, however, it is
inappropriate to test for any main effects due to
individual factors, such as dose, in the presence of a
significant interaction. Indeed, P-values for testing
the main dose effect possess no sensible inter-
pretation if given in the presence of a significant in-Ž w x.teraction see Ref. 9 . Thus, before assessing the
dose-related effects for any chemicalrstrainrS9
com-bination under study, we first must test the null
hypothesis of no interaction. This translates to H :o
c s0 for each j,k, vs. an alternative hypothesisjk
that c /0 for some combination of j and k. Hjk o
may be assessed via a likelihood ratio test, which is
similar in form to the usual F-test for the interaction
in a block designrANOVA. Under our design, the
likelihood ratio statistic, G2, for the culture=dosec2 Ž .Ž .interaction is distributed as x with 5y1 3y1
Ž .s8 degrees of freedom df . Departure from H iso
w 2Ž . 2 xindicated if the P-value PsP x 8 GG dropsc
below a pre-assigned a-level.
The likelihood ratio computations must be per-
formed on a computer. We employ the SASw com-
puter package via its GLiM procedure Proc Genmodw x w12 . Sample SAS code for fitting the complemen-
Ž .tary log–log model under Eq. 3 is given in Fig. 1.
To identify the likelihood ratio statistic in Proc Gen-
mod, invoke the Type 1 option in the Model state-
ment, being sure to order the model components withxculture first, dose second, and culture)dose last.
If a particular chemicalrstrainrS9 combination
of interest tests negative for culture=dose interac-
tion, we can move directly to testing the main effect
due to dose. This translates to the null hypothesis
H : d sd sPPPsd . The alternative hypothesis,o 0 1 4
H , is that some departure from pure equality existsa
among the d s. The SAS output again provides ak
likelihood ratio statistic, G2, that is referenced to ad
x 2 distribution with 5y1s4 df ; the correspondingw 2Ž . 2 xP-value is PsP x 4 GG . When P drops be-d
low a pre-assigned a-level, there is a departure from
H , and hence, some dose effect is indicated.o
If significant, the dose effect can take on many
forms. Of interest in a mutagenicity testing setting is
the set of one-sided departures from the control, H :a k
Ž .d )d ks1, . . . ,4 . If any such alternative hy-k 0
pothesis is significant at the k th dose, it indicates a
significant, dose-related mutagenic effect. Notice that
we can also write H as H : d yd )0.a k a k k 0
To test against these one-sided alternatives, SAS’
Proc Genmod is particularly useful. First, refit the
model after removing the culture=dose interaction.
Then, under the Proc Genmod output for Analysis of
Parameter Estimates, find the point estimates of the
dose effect parameters. Information in these point
estimates is employed in testing against the alterna-
tives H : d yd )0.a k k 0

( )W.W. Piegorsch et al.rMutation Research 467 2000 11–19 15
Fig. 1. Sample SAS Proc Genmod complementary log–log GLiM code for fitting a two-way model with interaction terms.
Users are cautioned to proceed carefully, how-
ever, since the outputs from the Proc Genmod analy-
sis do not produce point estimates of each d . As isk
Ž .common with two-factor models such as Eq. 1 ,
there are certain identifiability constraints required tow xcomplete the fit 9 ; SAS defaults to a reference-cell
constraint, where the last d-parameter is set equal to
zero. As a result, the reported SAS ‘‘parameter
estimates’’ turn out to be estimates of the differences
d yd , ks0,1, . . . ,4. Admittedly, this SAS artifactk 4
can add confusion to the analysis, but it is a neces-
sary consequence of the two-factor model beingŽ .employed in Eq. 1 .
For testing against H , this differencing cana k
nonetheless be manipulated to our advantage. The
quantities we wish to study are differences from the
control, so if in the SAS input code, we enter and
code the dose levels such that the control level is
last — say, discard the ks0 subscript and relabel
the control as ks5 — the corresponding ‘‘parame-
ter estimates’’ will relate to the differences d yd ,1 5
d yd , . . . ,d yd . These are the precise differ-2 5 4 5
ences we wish to estimate.
Under this relabeled scheme, denote the SAS
estimates as d yd . The SAS output also suppliesk 5
w xstandard errors, se d yd , from which a Waldk 5
statistic for testing against H is calculated as W sa k k
Ž . w xd yd rse d yd . This is referenced in largek 5 k 5
samples to a standard normal distribution, with cor-Ž . wresponding one-sided P-value P s1yF W . Thek k
Ž .function F z is the cumulative distribution functionxof the standard normal. However, further caution is
advised here: the SAS output also reports P-values
under the heading Pr)Chi, but these are actually
two-sided P-values. To convert them to the one-sidedŽ .values we desire, use the following rule: i if the
output ‘‘parameter estimate’’ d yd is zero or posi-k 5
tive, divide SAS’ output P-value by two to find P ,k
Ž .or ii if the ‘‘parameter estimate’’ d yd is nega-k 5
tive, divide SAS’ output P-value by two and sub-
tract this from 1.0 to find P .k
It is important to recognize that in most cases, this
analysis of the dose-effect will be performed at all
non-zero dose levels. Thus, e.g., under our ks5
construction, there are four separate significance tests
being performed for the dose effect. Each is a com-
parison of a specific dose level against the control
level; hence this is often called a multiple compari-Žson with the control, or a ‘‘MCC.’’ Some authors.also call this a many-to-one analysis. Due to the
multiple comparisons being performed, however,
there will be an inflation in the false positive error
rate for testing the dose effect. One possible MCC
adjustment to account for error inflation that operates
well with binomial GLiMs is a simple Bonferroniw xcorrection 13 : this amounts to multiplying the raw
( )W.W. Piegorsch et al.rMutation Research 467 2000 11–1916
Fig. 2. Sample SAS Proc Genmod complementary log–log GLiM code for fitting a one-way model of only dose. Model assumes a
significant culture=dose interaction and consequently stratifies the analysis over levels of culture.
P-value by the number of individual comparisons
being made. In our case, the MCC-adjusted P-value) � Ž .4at each of the four dose levels is P s4 1yF W .k k
Reject in favor of the one-sided alternative H ifa k
P) drops below a .k
2.4. Statistical analysis under significant culture=
dose interaction
When a particular chemicalrstrainrS9 combina-
tion tests positive for culture=dose interaction, the
MCC analysis described above must be modified,
since we cannot make interpretable inferences about
the main dose effect in the presence of a significant
interaction. In this case, we are forced to assess the
possible dose effects at a simpler level. Specifically,
we test for a dose-related increase by assessing the
dose effect at each level of culture — under our
design this is at each js1,2,3. In effect, we stratify
the dose analysis over the levels of culture.
The computations for this stratified analysis are
no more complex than those for testing the main
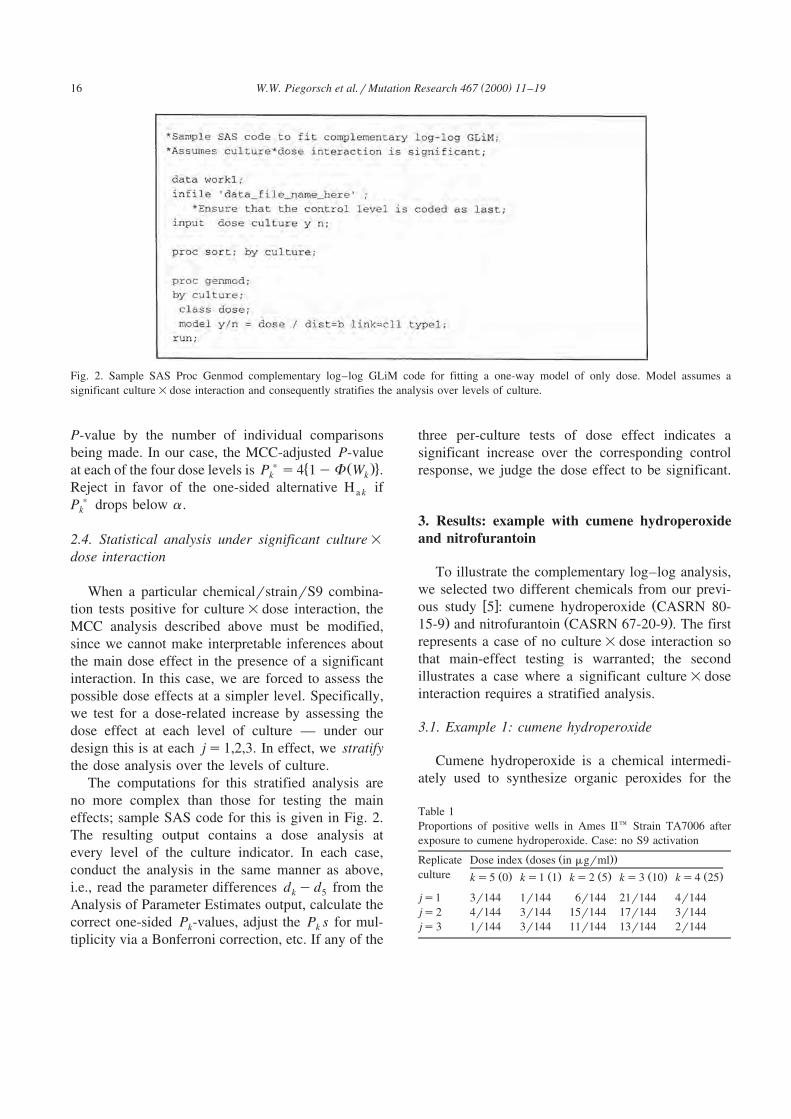
effects; sample SAS code for this is given in Fig. 2.
The resulting output contains a dose analysis at
every level of the culture indicator. In each case,
conduct the analysis in the same manner as above,
i.e., read the parameter differences d yd from thek 5
Analysis of Parameter Estimates output, calculate the
correct one-sided P -values, adjust the P s for mul-k k
tiplicity via a Bonferroni correction, etc. If any of the
three per-culture tests of dose effect indicates a
significant increase over the corresponding control
response, we judge the dose effect to be significant.
3. Results: example with cumene hydroperoxide
and nitrofurantoin
To illustrate the complementary log–log analysis,
we selected two different chemicals from our previ-w x Žous study 5 : cumene hydroperoxide CASRN 80-
. Ž .15-9 and nitrofurantoin CASRN 67-20-9 . The first
represents a case of no culture=dose interaction so
that main-effect testing is warranted; the second
illustrates a case where a significant culture=dose
interaction requires a stratified analysis.
3.1. Example 1: cumene hydroperoxide
Cumene hydroperoxide is a chemical intermedi-
ately used to synthesize organic peroxides for the
Table 1
Proportions of positive wells in Ames IIe Strain TA7006 after
exposure to cumene hydroperoxide. Case: no S9 activation
Ž Ž ..Replicate Dose index doses in mgrml
culture Ž . Ž . Ž . Ž . Ž .ks5 0 ks1 1 ks2 5 ks3 10 ks4 25
js1 3r144 1r144 6r144 21r144 4r144
js2 4r144 3r144 15r144 17r144 3r144
js3 1r144 3r144 11r144 13r144 2r144
( )W.W. Piegorsch et al.rMutation Research 467 2000 11–19 17
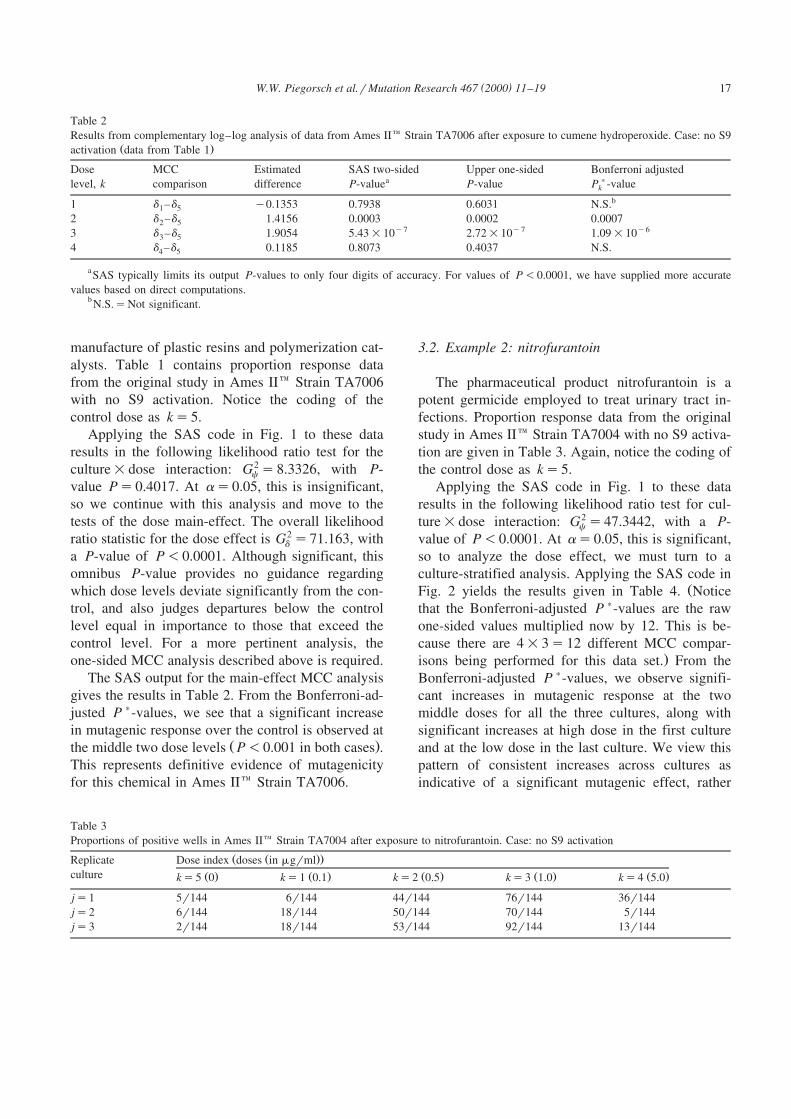
Table 2
Results from complementary log–log analysis of data from Ames IIe Strain TA7006 after exposure to cumene hydroperoxide. Case: no S9Ž .activation data from Table 1
Dose MCC Estimated SAS two-sided Upper one-sided Bonferroni adjusteda )level, k comparison difference P-value P-value P -valuek
b1 d –d y0.1353 0.7938 0.6031 N.S.1 5
2 d –d 1.4156 0.0003 0.0002 0.00072 5y7 y7 y63 d –d 1.9054 5.43=10 2.72=10 1.09=103 5
4 d –d 0.1185 0.8073 0.4037 N.S.4 5
aSAS typically limits its output P-values to only four digits of accuracy. For values of P-0.0001, we have supplied more accurate
values based on direct computations.bN.S.sNot significant.
manufacture of plastic resins and polymerization cat-
alysts. Table 1 contains proportion response data
from the original study in Ames IIe Strain TA7006
with no S9 activation. Notice the coding of the
control dose as ks5.
Applying the SAS code in Fig. 1 to these data
results in the following likelihood ratio test for the
culture=dose interaction: G2s8.3326, with P-c
value Ps0.4017. At as0.05, this is insignificant,
so we continue with this analysis and move to the
tests of the dose main-effect. The overall likelihood
ratio statistic for the dose effect is G2s71.163, withd
a P-value of P-0.0001. Although significant, this
omnibus P-value provides no guidance regarding
which dose levels deviate significantly from the con-
trol, and also judges departures below the control
level equal in importance to those that exceed the
control level. For a more pertinent analysis, the
one-sided MCC analysis described above is required.
The SAS output for the main-effect MCC analysis
gives the results in Table 2. From the Bonferroni-ad-
justed P)-values, we see that a significant increase
in mutagenic response over the control is observed atŽ .the middle two dose levels P-0.001 in both cases .
This represents definitive evidence of mutagenicity
for this chemical in Ames IIe Strain TA7006.
3.2. Example 2: nitrofurantoin
The pharmaceutical product nitrofurantoin is a
potent germicide employed to treat urinary tract in-
fections. Proportion response data from the original
study in Ames IIe Strain TA7004 with no S9 activa-
tion are given in Table 3. Again, notice the coding of
the control dose as ks5.
Applying the SAS code in Fig. 1 to these data
results in the following likelihood ratio test for cul-
ture=dose interaction: G2s47.3442, with a P-c
value of P-0.0001. At as0.05, this is significant,
so to analyze the dose effect, we must turn to a
culture-stratified analysis. Applying the SAS code inŽFig. 2 yields the results given in Table 4. Notice
that the Bonferroni-adjusted P)-values are the raw
one-sided values multiplied now by 12. This is be-
cause there are 4=3s12 different MCC compar-.isons being performed for this data set. From the
Bonferroni-adjusted P)-values, we observe signifi-
cant increases in mutagenic response at the two
middle doses for all the three cultures, along with
significant increases at high dose in the first culture
and at the low dose in the last culture. We view this
pattern of consistent increases across cultures as
indicative of a significant mutagenic effect, rather
Table 3
Proportions of positive wells in Ames IIe Strain TA7004 after exposure to nitrofurantoin. Case: no S9 activation
Ž Ž ..Replicate Dose index doses in mgrml
culture Ž . Ž . Ž . Ž . Ž .ks5 0 ks1 0.1 ks2 0.5 ks3 1.0 ks4 5.0
js1 5r144 6r144 44r144 76r144 36r144
js2 6r144 18r144 50r144 70r144 5r144
js3 2r144 18r144 53r144 92r144 13r144
( )W.W. Piegorsch et al.rMutation Research 467 2000 11–1918
Table 4
Results from a complementary log–log analysis, stratified by level of culture, of data from Ames IIe Strain TA7004 after exposure toŽ .nitrofurantoin. Case: no S9 activation data from Table 3
Dose level, k MCC Estimated SAS two-sided Upper one-sided Bonferroni adjusteda )comparison difference P-value P-value P -valuek
Culture: js1b1 d –d 0.1859 0.7588 0.3794 N.S.1 5
y7 y7 y62 d –d 2.3339 7.71=10 3.85=10 4.62=102 5y11 y11 y103 d –d 3.0555 3.90=10 1.95=10 2.23=103 5y6 y54 d –d 2.0969 5.63=10 1.13=10 0.00024 5
Culture: js2
1 d –d 1.1434 0.0153 0.0076 0.09181 5y8 y8 y72 d –d 2.3047 9.82=10 4.91=10 5.89=102 5y10 y11 y103 d –d 2.7500 1.08=10 5.40=10 6.48=103 5
4 d –d y0.1859 0.7588 0.6206 N.S.4 5
Culture: js3
1 d –d 2.2563 0.0025 0.0013 0.01501 5y6 y7 y62 d –d 3.4909 1.27=10 6.35=10 7.62=102 5y9 y9 y83 d –d 4.2881 2.05=10 1.02=10 1.23=103 5
4 d –d 1.9118 0.0118 0.0059 0.07084 5
aSAS typically limits its output P-values to only four digits of accuracy. For values of P-0.0001, we have supplied more accurate
values based on direct computations.bN.S.sNot significant.
than as a series of random jackpot increases. This
represents definitive evidence of mutagenicity for
this chemical.
4. Discussion
We find the complementary log–log GLiM to be
a useful model under which to test interaction and
MCC dose effects when presented with data in theŽform of proportions i.e., number of positive wells
.divided by total number of wells from the AMAXe
protocol. Facilitated by the use of simple SAS pro-
gramming code, the statistical methods can be easily
implemented. Using the SAS output, multiplicity-ad-
justed P)-values are straightforward to calculate and
can yield proper inferences on the ability of a chemi-
cal or environmental agent to induce mutagenesis in
these Ames IIe strains. The examples displayed
above were chosen to be representative of the larger
body of experimental results reported from our pre-w xvious, larger study of the AMAXe protocol 5 .
Both illustrate the methodology and show qualitative
agreement with our corresponding previous results.
It is interesting to note that in both examples, the
dose response is non-monotone, i.e., in both Tables 1
and 3, there is a consistent increasing-then-decreas-
ing trend in the response as dose increases. This isw xnot uncommon with Ames test data 14 , and we
were not surprised by the phenomenon here. The
MCC methods we apply to detect the increases
above the background response are designed to beŽunaffected by such downturns. Although this is at
the cost of some sensitivity to detect a monotone-in-
creasing trend over dose, if one did exist. If desired,
a trend test that accounts for the downturns may bew xuseful, such as that suggested in Ref. 15 or Ref.
w x16 . The issue of testing non-monotone trend specif-
ically with the proportion data is problematic, how-w xever 17,18 , and is open for further statistical re-.search.
One additional problem for further statistical study
concerns the small-sample properties of the Bonfer-
roni-adjusted MCC inferences that form the core ofw xour dose analysis. Previous research 13 has sug-
gested that the Bonferroni correction exhibits accept-
able false positive error properties for binomial-basedŽGLiMs under a simple one-way model say, with
( )W.W. Piegorsch et al.rMutation Research 467 2000 11–19 19
.only a single factor such as Dose . The correction is
generally conservative in that it protects against
false-positive errors too strenuously, but as the sam-
ple size increases, this conservative nature tends to
lessen somewhat. Whether this performance carries
over to the two-way setting with interaction, as
studied herein, is unclear. Clearly, more research is
required in this area.
References
w x1 D.M. Maron, B.N. Ames, Revised methods for the Salmonella
Ž .mutagenicity test, Mutat. Res. 113 1983 173–215.w x2 K. Mortelmans, S. Haworth, T. Lawlor, W. Speck, B. Tainer,
E. Zeiger, Salmonella mutagenicity tests: II. Results from theŽ .testing of 270 chemicals, Environ. Mutagen. 8 Suppl. 7
Ž .1986 1–119.w x3 E. Zeiger, B. Anderson, S. Haworth, T. Lawlor, K. Mortel-
mans, W. Speck, Salmonella mutagenicity tests: III. Results
from the testing of 255 chemicals, Environ. Mutagen. 9Ž . Ž .Suppl. 9 1987 1–109.
w x4 E. Zeiger, B. Anderson, S. Haworth, T. Lawlor, Salmonella
mutagenicity tests: IV. Results from the testing of 300 chem-Ž . Ž .icals, Environ. Mutagen. 11 Suppl. 12 1988 1–158.
w x5 P. Gee, C.H. Sommers, A.S. Melick, X.M. Gidrol, M.D.
Todd, R.B. Burris, M.N. Nelson, R.C. Klemm, E. Zeiger,
Comparison of responses of base-specific Salmonella tester
strains with the traditional strains for identifying mutagens:Ž .the results of a validation study, Mutat. Res. 412 1998
115–130.w x6 P. Gee, D.M. Maron, B.N. Ames, Detection and classifica-
tion of mutagens: a set of base-specific Salmonella tester
Ž .strains, Proc. Natl. Acad. Sci. U.S.A. 91 1994 11606–
11610.w x7 M.H.L. Green, W.J. Muriel, B.A. Bridges, Use of a simpli-
fied fluctuation test to detect low levels of mutagens, Mutat.Ž .Res. 38 1976 33–42.
w x8 D.G. Gatehouse, G.F. Delow, The development of a ‘‘micro-
titrew ’’ fluctuation test for the development of indirect muta-
gens, and its use in the evaluation of mixed enzyme induc-Ž .tion of the liver, Mutat. Res. 60 1979 239–252.
w x9 J. Neter, M.H. Kutner, C.J. Nachtsheim, W. Wasserman,
Applied Linear Statistical Models, 4th edn., R.D. Irwin,
Chicago, IL, 1996.w x10 W.W. Piegorsch, A.J. Bailer, Statistics for Environmental
Biology and Toxicology, Chapman & HallrCRC Press, Boca
Raton, FL, 1997.w x11 P. McCullagh, J.A. Nelder, Generalized Linear Models, 2nd
edn., Chapman & Hall, London, 1989.w x w12 SAS Institute, SASrStat Software: Changes and Enhance-
ments through Release 6.12, SAS Institute, Cary, NC, 1989.w x13 W.W. Piegorsch, One-sided significance tests for generalized
linear models under dichotomous response, Biometrics 46Ž .1990 309–316.
w x14 B.S. Kim, B.H. Margolin, Statistical methods for the AmesŽ .Salmonella assay: a review, Mutat. Res. 436 1999 113–122.
w x15 D.G. Simpson, B.H. Margolin, Recursive nonparametric test-
ing for dose–response relationships subject to downturns atŽ .high doses, Biometrika 73 1986 589–596.
w x16 D.H. Lim, D.A. Wolfe, Nonparametric tests for comparing
umbrella pattern treatment effects with a control in a random-Ž .ized block design, Biometrics 53 1997 410–418.
w x17 N.-Z. Shi, Testing for umbrella order restrictions on multino-Ž .mial parameters, Sankhya Ser. B 51 1989 13–23.
w x18 A. Cohen, H.B. Sackrowitz, Inadmissibility of some tests forŽ .order-restricted alternatives, Stat. Probability Lett. 24 1995
153–156.
Correctly identified
+ = genotoxic - = non-genotoxic
Correctly identified
+ = carcinogenic - = non-carcinogenxic
Ames I Ames II
Ames I Ames II
11+ 2 -
6 + 2 -
6 + 0 -
5 + 2 -
44 + 16 -
30 + 9 -
6 13 60
REFERENCES
Gee, P., Maron, D.M., Ames B.N.Detection and classification of mutagens: A set ofbase-specific Salmonella tester strains.Proc. Nat. Acad. Sci USA, 91, 11606 - 11610 (1994)
Gee, P., Sommers, C.H., Malick, A.S., Gidrol, X.M.,Todd, M.D., Burris, R.B., Nelson, M.E., Klemm, R.C.,Zeiger, E.Comparison of responses of base-specific Salmonellatester strains with the traditional strains for identifyingmutagens: The results of a validation studyMut.Res. 412, 115 - 130 (1998)
Gee, P., Schneider, J., Engelhardt, G., Jacob. E.Evaluation of a screening assay using the Mix(TA7001, TA7002, TA7003, TA7004, TA7005 andTa7006) and TA98 for mutagenic potential ofcompounds.In preparation
B) AMES II ASSAY / VALIDATION STUDY
A) AMES II ASSAY / METHOD
AMES II ASSAY: RESULTS OF A VALIDATION STUDY Engelhardt G., Jacob E., Jäckh R. Department of Toxicology, BASF AG, DE-67056 Ludwigshafen/Rhein
Indicator
Medium
Test Compound
CultureStored at –80°C
OvernightCulture
Assay Preparation
37°C, 12 –17 h250 rpm
OD600
Exposure Culture24-Well Plate
37°C, 90 min, 250 rpm
Bacteria Culture
S9-Mix
Exposure Medium
C-
D1
D2
D3
D4
D5
D6
C+
C-
D1
D2
D3
D4
D5
D6
C+
TAMix
A
B
C
D
C-
D1
D2
D3
D4
D5
D6
C+
A
B
C
D
C-
D1
D2
D3
D4
D5
D6
C+
TA
Mix
TA
Mix
37°C, 48 h
37Co384-Well Plate
AB
CDEF
2. COMPARISON OF THE RESULTS OF THE TWO AMES TEST SYSTEMS:
GENOTOXICITY DATA (95 COMPOUNDS)
AMES I ASSAY AMES II ASSAY
SENSITIVITY1)55/75 50/75
73.3% 66.7%
SPECIFICITY2)
18/20 16/20
90.0% 80.0%
ACCURACY3)
55+18 = 73/95 50+16 = 66/95
76.8% 69.5%
3. COMPARISON OF THE RESULTS OF THE TWO AMES TEST SYSTEMS:
CARCINOGENICITY DATA (70 COMPOUNDS)
AMES I ASSAY AMES II ASSAY
SENSITIVITY1)36/52 35/52
69.2% 67.3%
SPECIFICITY2)
11/18 11/18
61.1% 61.1%
ACCURACY3)
36+11 = 47/70 35+11 = 46/70
67.1% 65.7%
1) = correctly identified positive compounds
2) = correctly identified negative compounds3) = total percentage of correctly identified compounds
III. RESULTS
1. COMPARISON OF THE TWO AMES TEST SYSTEMS:
RESULTS OBTAINED WITH 127 COMPOUNDS
negative positive
negative 41 16
(32.3%) (12.6%)
AMES I
positive 16 54
(12.6%) (42.5%)
AGREEMENT ca. 75% AMES II ASSAY
ASSAY
I. AIM
Validation of a high throughput screening version (HTS) of theAmes II assay (= automated version � single experiment withoutreplicates) using selected genotoxic/non-genotoxic compounds.
Comparison with the classical Ames assay (Ames I assay) with regard to:
�Concordance of the results between the two test systems
�Sensitivity (percentage of correctly identified genotoxic/carcinogeniccompounds) and specificity (percentage of correctly identified
non-genotoxic/non-carcinogenic compounds) of the two test systems
I. TEST SYSTEM
The Ames II assay of Xenometrix is a liquid microtiter modification of the traditional Ames test for the detection of potential mutagens in Salmonella typhimurium.
� Media and tester strains, except S9-mix, are available as a kit
� The test is performed in microwell plates
� Mutagenicity (growth of bacteria) is measured colorimetrically from purple to yellow (pH change)
� The Ames II assay uses the so-called “mixed strains” (TAMix) � a mixture
of 6 newly developed base-pair strains of the TA7000 series for the detectionof base-pair mutations. Each strain will be reverted by only one specific
base-pair substitution.
� The Ames II assay is available in two versions:
� ”Manual kit” (benchtop version for routine analysis)� ”High throuput screening (HTS)” (automatable version)
IV: ADVANTAGES OF THE AMES II ASSAY
� Routine analysis � compound throughput is ~ 5 times higher with the “Ames II
Manual System” than with the traditional Ames test
� Screening (HTS) � ~ 1’000 compounds / year / robot / technician with a partly
automated version
V: LIMITATIONS
� At present not applicable for registrations/authorizations
of new chemicals/pesticides/drugs
� until now no existing guideline
� until now no acceptance by the authorities
II. TEST COMPOUNDS
�127 compounds (1st comparison) including different chemical classeswere selected according to the criteria listed below:
� negative in the traditional Ames assay, possibly positive in other,
non-bacterial genotoxicity tests
� positive in the Ames plate incorporation assay, partly in different tester strains� positive only when using a modification of the Ames assay
(e.g. pre-incubation test, prival modification, liquid suspension assay,addition of norharman etc.)
� For 95 compounds with different genotoxic profiles there are sufficient additional
in vitro- and/or in vivo data to allow an assessment for genotoxicity
(2nd comparison)
� For 70 compounds there are sufficient data to allow an assessment forcarcinogenicity (3rd comparison)
IV. CONCLUSIONS
�The percentage of correctly identified
�genotoxic/carcinogenic compounds (= sensitivity)�non-genotoxic/non-carcinogenic compounds (= specificity)
of the two Ames test versions is comparable
�About ¾ of all compounds are correctly identified by both assaysystems
�In addition, each assay system correctly detects different compounds (possible reasons: different methodology, different strains, differentconcentrations of S9-mix)
�The Ames II assay is therefore suitable for the screening ofmutagens/genotoxic carcinogens

Mutation Research 558 (2004) 181–197
Assessment of the performance of the Ames IITM assay:a collaborative study with 19 coded compounds
S. Flückiger-Isler a,∗, M. Baumeister b, K. Braun c, V. Gervais d, N. Hasler-Nguyen e,R. Reimann f, J. Van Gompel g, H.-G. Wunderlich h, G. Engelhardt i
a Xenometrix by Endotell GmbH, CH-4125 Allschwil, Switzerlandb Boehringer Ingelheim, Department of Non-Clinical Drug Safety, Boehringer Ingelheim Pharma KG & Co. KG,
D-88397 Biberach, Germanyc Aventis Pharma Deutschland GmbH, Drug Innovation & Approval, Lead Optimization, Drug Safety Evaluation,
D-65795 Hattersheim, Germanyd Servier Group, Drug Safety Assessment, F-45403 Orléans-Gidy, France
e Novartis Consumer Health, Toxicology, CH-1260 Nyon, Switzerlandf Schering AG, Experimental Toxicology, D-13342 Berlin, Germany
g Johnson&Johnson Pharmaceutical Research & Development, Department of ADME/Tox, B-2340 Beerse, Belgiumh Federal Environmental Agency, Department for Hygiene of Drinking and Swimming Pool Water, D-08645 Bad Elster, Germany
i BASF AG, Product Safety, Regulations, Toxicology and Ecology, D-67056 Ludwigshafen, Germany
Received 14 October 2003; received in revised form 1 December 2003; accepted 5 December 2003
Abstract
Nineteen coded chemicals were tested in an international collaborative study for their mutagenic activity. The assay system
employed was the Ames II Mutagenicity Assay, using the tester strains TA98 and TAMix (TA7001–7006). The test compounds
were selected from a published study with a large data set from the standard Ames plate-incorporation test. The follow-
ing test compounds including matched pairs were investigated: cyclophoshamide, 2-naphthylamine, benzo(a)pyrene, pyrene,
2-acetylaminofluorene, 4,4′-methylene-bis(2-chloroaniline), 9,10-dimethylanthracene, anthracene, 4-nitroquinoline-N-oxide,
diphenylnitrosamine, urethane, isopropyl-N(3-chlorophenyl)carbamate, benzidine, 3,3′-5,5′-tetramethylbenzidine, azoxyben-
zene, 3-aminotriazole, diethylstilbestrol, sucrose and methionine. The results of both assay systems were compared, and the
inter-laboratory consistency of the Ames II test was assessed. Of the eight mutagens selected, six were correctly identified
with the Ames II assay by all laboratories, one compound was judged positive by five of six investigators and one by four
of six laboratories. All seven non-mutagenic samples were consistently negative in the Ames II assay. Of the four chemicals
that gave inconsistent results in the traditional Ames test, three were uniformly classified as either positive or negative in the
present study, whereas one compound gave equivocal results. A comparison of the test outcome of the different investigators
resulted in an inter-laboratory consistency of 89.5%.
Owing to the high concordance between the two test systems, and the low inter-laboratory variability in the Ames II assay
results, the Ames II is an effective screening alternative to the standard Ames test, requiring less test material and labor.
© 2003 Elsevier B.V. All rights reserved.
Keywords: Ames II test; Salmonella mutagenicity test; Validation study
∗ Corresponding author. Tel.: +41-61-482-1434; fax: +41-61-482-2072.
E-mail address: [email protected] (S. Flückiger-Isler).
1383-5718/$ – see front matter © 2003 Elsevier B.V. All rights reserved.
doi:10.1016/j.mrgentox.2003.12.001

182 S. Flückiger-Isler et al. / Mutation Research 558 (2004) 181–197
1. Introduction
The value of the Salmonella mutagenicity assay has
been clearly confirmed as a suitable primary test for
the detection of potential mutagens and carcinogens,
and since the mid-seventies the Ames assay [1,2] is
used routinely as a screening assay to predict animal
carcinogens.
The Ames II assay is a liquid microtiter modifi-
cation of the Ames test and consists of the ‘strains’
TAMix and TA98. TAMix is a mixture of the
Salmonella typhimurium strains TA7001, TA7002,
TA7003, TA7004, TA7005 and TA7006 [3]. The ge-
netic complementation among the six TA700x strains
(where x = 1, 2, 3, 4, 5, and 6) is low enough such
they may be combined in a single assay to facili-
tate screening for mutagens. The strains in TAMix
(base-pair substitutions) are like TA98 (frameshift
mutation), histidine auxotrophs and mutagenesis
will cause reversion to histidine prototrophy. Like
the traditional strains, the genetic background of
the TA700x series of strains has been modified to
improve the sensitivity of their reversion by many
classes of compound. The uvrB gene that is involved
in excision repair has been deleted to allow lesions
in the DNA to accumulate. The selection pressure to
mutate or revert is facilitated so that less compound
is needed to see an effect. The galE503 mutation
reduces the effectiveness of epimerase responsi-
ble for the inter-conversion of UDP-galactose and
UDP-glucose. This inter-conversion is necessary for
the synthesis of a complete cell wall, thus the point
mutation in the epimerase allows a higher perme-
ability of larger compounds into the cell and gives a
population of cells which have a ‘rough’ phenotype
(rfa). The tester strains carry the plasmid pKM101,
which has the umuDC homologues, mucA/B and the
�-lactamase gene that confers ampicillin resistance.
These gene products increase the cell’s ability to
perform mutagenic lesion bypass repair during DNA
replication.
This study had two goals: (1) to corroborate the use
of the Ames II test as a suitable alternative screening
assay [4,5] to the traditional Ames plate-incorporation
method, and (2) to test the Ames II assay system for
its reproducibility among different laboratories. The
19 compounds included in this study were selected
on the basis of traditional Ames data published as a
report of the International Collaborative Program for
the Evaluation of Short-Term Tests for Carcinogens
(ICPESTTC study) [6]. The chemicals selected were
either Ames-positive, -negative or equivocal: among
the compounds that were positive in the traditional
Ames assay, weak and strong mutagens were chosen,
and the necessity of metabolic activation (S9 mix) for
a positive response as well as the target site (frameshift
mutation versus base-pair substitution) were consid-
ered. The equivocal chemicals that were chosen gave
either inconsistent results in the ICPESTTC study or
are known to be difficult to detect in bacterial muta-
genesis assays. Although the discrimination between
carcinogens and non-carcinogens played a secondary
role in the present study, some chemical ‘pairs’ (car-
cinogens and their non-carcinogenic analogs) were
included.
The 19 chemicals (Table 2) were coded at random
before being distributed among nine independent
laboratories, which allowed an opportunity for an
inter-laboratory comparison of the Ames II system.
Each compound was tested by 4–6 different investi-
gators. The following companies participated in this
study: Aventis Pharma Deutschland GmbH (Hatter-
sheim, DE), BASF AG (Ludwigshafen, DE), Boeh-
ringer Ingelheim (Biberach, DE), Johnson&Johnson
Pharmaceutical Research&Development (Beerse,
BE), Novartis Consumer Health (Nyon, CH), Scher-
ing AG (Berlin, DE), Servier Group (Orléans-Gidy,
FR), Federal Environmental Agency (Bad Elster, DE)
and Xenometrix by Endotell GmbH (Allschwil, CH).
2. Materials and methods
2.1. Bacterial strains
The Ames II test was performed with S. ty-
phimurium TA98 and TAMix [3]. TAMix consists of
the strains TA7001–7006 in equal proportions and
was treated as if it were an individual strain. The
tester strains are characterized in Table 1.
Freshly thawed frozen strains of 10 �l were in-
oculated in 10 ml of growth medium (Xenometrix
by Endotell GmbH) and the cultures were grown
overnight (12–17 h) at 37 ◦C in an environmental
shaker at 250 rpm in the presence of 50 �g/ml ampi-
cillin (Xenometrix by Endotell GmbH).
S. Flückiger-Isler et al. / Mutation Research 558 (2004) 181–197 183
Table 1
Bacterial strains used, and the mixture
Strain Genotypes Mutationa
TA98 hisD3052 ∆ara9 ∆chl008 (bio chl uvrb gal)rfa1004/pKM101 Frameshifts
TAMix TA7001, TA7002, TA7003, TA7004, TA7005, TA7006 Base-pair
TA7001 hisG1775 ∆ara9 ∆chl004 (bio chlD uvrb chlA)galE503 rfa1041/pKM101 A:T → G:C
TA7002 hisC9138 ∆ara9 ∆chl004 (bio chlD uvrb chlA)galE503 rfa1041/pKM101 T:A → A:T
TA7003 hisG9074 ∆ara9 ∆chl004 (bio chlD uvrb chlA)galE503 rfa1041/pKM101 T:A → G:C
TA7004 hisG9133 ∆ara9 ∆chl004 (bio chlD uvrb chlA)galE503 rfa1041/pKM101 G:C → A:T
TA7005 hisG9130 ∆ara9 ∆chl004 (bio chlD uvrb chlA)galE503 rfa1041/pKM101 C:G → A:T
TA7006 hisC9070 ∆ara9 ∆chl004 (bio chlD uvrb chlA)galE503 rfa1041/pKM101 C:G → G:C
a Mutation detected by this strain.
2.2. Test chemicals
Nineteen chemicals (Table 2) were selected for this
study from 42 compounds described in the ICPESTTC
report [6]. If possible, chemical pairs were chosen,
i.e. carcinogens and non-carcinogens with closely
related chemical structure. The structures of the test
compounds are given in Appendix A. Excluded were
chemicals that were not easily available, unstable,
gaseous or liquid.
The 19 chemicals selected included 11 carcinogens
and 8 non-carcinogens of which 8 were mutagenic, 7
Table 2
Chemicals tested
Chemical CAS no. MWa Carcinogenicityb Mutagenicityb Supplier Purity (%)
2-Acetylaminofluorene 53-96-3 223.3 + + Sigma Unknown
3-Amino-1,2,4-triazole 61-82-5 84.1 + − Sigma 95
Anthracene 120-12-7 176.2 − − Sigma 99+
Azoxybenzene 495-48-7 198.2 − ? Riedel-de Haën 99+
Benzidine 92-87-5 184.2 + + Riedel-de Haën 99+
Benzo(a)pyrene 50-32-8 252.3 + + Fluka 98
Cyclophosphamide 6055-19-2 279.1 + + Aldrich 98+
Diethylstilbestrol 56-53-1 268.3 + − Riedel-de Haën 99+
9,10-Dimethylanthracene 781-43-1 206.3 + + Fluka 99
Diphenylnitrosamine 86-30-6 198.2 − ? Fluka 97
Isopropyl-N(3-chlorophenyl) carbamate 101-21-3 213.7 − − Sigma 95
l-Methionine 63-68-3 149.2 − − Sigma 98
4,4-Methylene-bis(2-chloroaniline) 101-14-4 267.2 + + Fluka 99+
2-Naphthylamine 91-59-8 143.2 + + Sigma Unknown
4-Nitroquinoline-N-oxide 56-57-5 190.2 + + Aldrich 98
Pyrene 129-00-0 202.3 − ? Fluka 99
d-Sucrose 57-50-1 342.3 − − Sigma 99+
Tetramethylbenzidine 54827-17-7 240.5 − − Fluka 98
Urethane 51-79-6 89.1 + ? Aldrich 99
(+) Positive; (−) negative; (?) equivocal.a Molecular weight.b Assessment according to the ICPESTTC study.
non-mutagenic and 4 with conflicting responses in the
different laboratories of the ICPESTTC study using
the traditional Ames assay.
CAS numbers, carcinogenicity and mutagenicity
as classified in the ICPESTTC report, suppliers and
purity of the chemicals are listed in Table 2. The sam-
ples were coded at random by an independent person
at Xenometrix by Endotell GmbH prior to shipping to
the participating laboratories. With three exceptions,
the chemicals were shipped in the supplier vials after
the original labels had been removed. All partici-
pants received identical lot numbers. After receipt,

184 S. Flückiger-Isler et al. / Mutation Research 558 (2004) 181–197
Table 3
Positive control chemicals used in the Ames II assay
Ames II
strain
S9 Control chemical Concentration
(�g/ml)
TAMix − 4-Nitroquinoline-N-oxide 0.5
TA98 − 2-Nitrofluorene 2.0
TAMix and
TA98
+ 2-Aminoanthracene (2-AA) 5.0
the chemicals were stored according to the directions
on the label. Fresh, 25× concentrated stock solutions
were prepared in DMSO immediately before use by
each laboratory and then kept at −20 ◦C for poten-
tial repeat testing. The solvent was used at a final
concentration of 4% in the assay. The investigators
handled all compounds as if they were carcinogenic
and mutagenic.
2.3. Positive controls
All investigators included positive control chemi-
cals in each experiment. The following positive con-
trols were used in assessing the performance of the
Ames II assays (Table 3). Each participant prepared
his own positive control chemicals as a 25× stock in
DMSO.
2.4. Metabolic activation
The Ames II assays performed in this study were
carried out in the presence and absence of Aroclor
1254-induced rat liver S9 (Moltox, USA). The bio-
chemical and metabolic characterization of the S9
fraction used is available. The S9 mix stock prepara-
tion was made immediately prior to use, and stored on
ice during preparation. The final concentration in the
assay was 4.5%. S9 use and preparation are described
in the Ames II instruction manual.
2.5. Study design
The individual chemicals should be tested by the
different laboratories under as similar conditions as
possible. The investigators were asked to strictly fol-
low the Ames II instruction manual, and to use a
prescribed dosing protocol, if feasible. All partici-
pants received identical batches of strains, media, S9
and chemicals. Unless stated otherwise, all procedures
were performed manually.
2.5.1. Repeat testing
In general, experiments that gave clear positive or
negative results were not repeated. However, the large
majority of investigators repeated experiments with
weak or borderline result at least once. One labora-
tory tested all chemicals only once due to restricted
material.
2.5.2. Test concentrations
The test protocol was designed for a total of six
concentrations, plus a negative (solvent) control and
a positive control. Each culture had to be treated and
dispensed into microtiter plates in triplicate. For a first
screen, the compounds should be tested without any
determination for viability or optimization for dose.
The highest and the lowest dose level were 5000 and
4 �g/ml, respectively, and the intermediate doses were
spaced at two- to five-fold intervals.
Six of the nine investigators strictly followed the
protocol, and two used solubility limits to choose the
maximum test concentrations. One group (P1) per-
formed the Ames II assay manually as well as with
robotics. The robotic system required some protocol
changes, namely a different dose range, a lower top
dose (1000 �g/ml), and only two replicates per dose
and chemical. Another group (P4) used its own inter-
nally validated setup for an automated system which
differed from the prescribed protocol in that: (1) a 10
times lower top dose (500 �g/ml) was used, (2) the
triplicate values derived from three different overnight
cultures, (3) there was no agitation during the 90 min
of exposure (see Section 2.5.3 liquid exposure), and
(4) the plate scoring was performed through spec-
trophotometry.
2.5.3. Liquid exposure
Absence of S9 fraction: Into 1-well of a 24-well
plate (one well/strain/dose/replicate), 0.215 ml of Ex-
posure Medium (Xenometrix by Endotell GmbH) and
0.025 ml of culture were aliquoted.
Presence of S9 fraction: Into 1-well of a 24-well
plate (one well/strain/dose/replicate), 0.1775 ml of Ex-
posure Medium, 0.025 ml of culture and 0.0375 ml of
30% S9 mix were aliquoted. Both proceedings gave
a total volume of 0.240 ml. To each of these cultures,
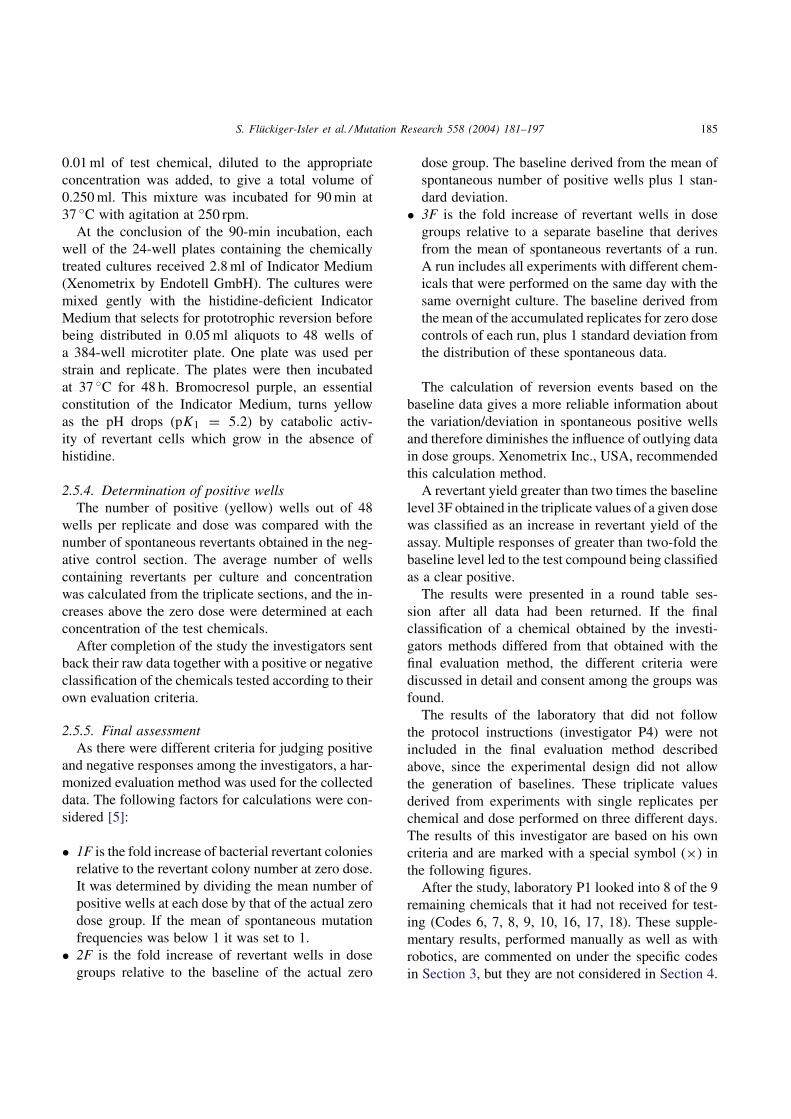
S. Flückiger-Isler et al. / Mutation Research 558 (2004) 181–197 185
0.01 ml of test chemical, diluted to the appropriate
concentration was added, to give a total volume of
0.250 ml. This mixture was incubated for 90 min at
37 ◦C with agitation at 250 rpm.
At the conclusion of the 90-min incubation, each
well of the 24-well plates containing the chemically
treated cultures received 2.8 ml of Indicator Medium
(Xenometrix by Endotell GmbH). The cultures were
mixed gently with the histidine-deficient Indicator
Medium that selects for prototrophic reversion before
being distributed in 0.05 ml aliquots to 48 wells of
a 384-well microtiter plate. One plate was used per
strain and replicate. The plates were then incubated
at 37 ◦C for 48 h. Bromocresol purple, an essential
constitution of the Indicator Medium, turns yellow
as the pH drops (pK1 = 5.2) by catabolic activ-
ity of revertant cells which grow in the absence of
histidine.
2.5.4. Determination of positive wells
The number of positive (yellow) wells out of 48
wells per replicate and dose was compared with the
number of spontaneous revertants obtained in the neg-
ative control section. The average number of wells
containing revertants per culture and concentration
was calculated from the triplicate sections, and the in-
creases above the zero dose were determined at each
concentration of the test chemicals.
After completion of the study the investigators sent
back their raw data together with a positive or negative
classification of the chemicals tested according to their
own evaluation criteria.
2.5.5. Final assessment
As there were different criteria for judging positive
and negative responses among the investigators, a har-
monized evaluation method was used for the collected
data. The following factors for calculations were con-
sidered [5]:
• 1F is the fold increase of bacterial revertant colonies
relative to the revertant colony number at zero dose.
It was determined by dividing the mean number of
positive wells at each dose by that of the actual zero
dose group. If the mean of spontaneous mutation
frequencies was below 1 it was set to 1.
• 2F is the fold increase of revertant wells in dose
groups relative to the baseline of the actual zero
dose group. The baseline derived from the mean of
spontaneous number of positive wells plus 1 stan-
dard deviation.
• 3F is the fold increase of revertant wells in dose
groups relative to a separate baseline that derives
from the mean of spontaneous revertants of a run.
A run includes all experiments with different chem-
icals that were performed on the same day with the
same overnight culture. The baseline derived from
the mean of the accumulated replicates for zero dose
controls of each run, plus 1 standard deviation from
the distribution of these spontaneous data.
The calculation of reversion events based on the
baseline data gives a more reliable information about
the variation/deviation in spontaneous positive wells
and therefore diminishes the influence of outlying data
in dose groups. Xenometrix Inc., USA, recommended
this calculation method.
A revertant yield greater than two times the baseline
level 3F obtained in the triplicate values of a given dose
was classified as an increase in revertant yield of the
assay. Multiple responses of greater than two-fold the
baseline level led to the test compound being classified
as a clear positive.
The results were presented in a round table ses-
sion after all data had been returned. If the final
classification of a chemical obtained by the investi-
gators methods differed from that obtained with the
final evaluation method, the different criteria were
discussed in detail and consent among the groups was
found.
The results of the laboratory that did not follow
the protocol instructions (investigator P4) were not
included in the final evaluation method described
above, since the experimental design did not allow
the generation of baselines. These triplicate values
derived from experiments with single replicates per
chemical and dose performed on three different days.
The results of this investigator are based on his own
criteria and are marked with a special symbol (×) in
the following figures.
After the study, laboratory P1 looked into 8 of the 9
remaining chemicals that it had not received for test-
ing (Codes 6, 7, 8, 9, 10, 16, 17, 18). These supple-
mentary results, performed manually as well as with
robotics, are commented on under the specific codes
in Section 3, but they are not considered in Section 4.
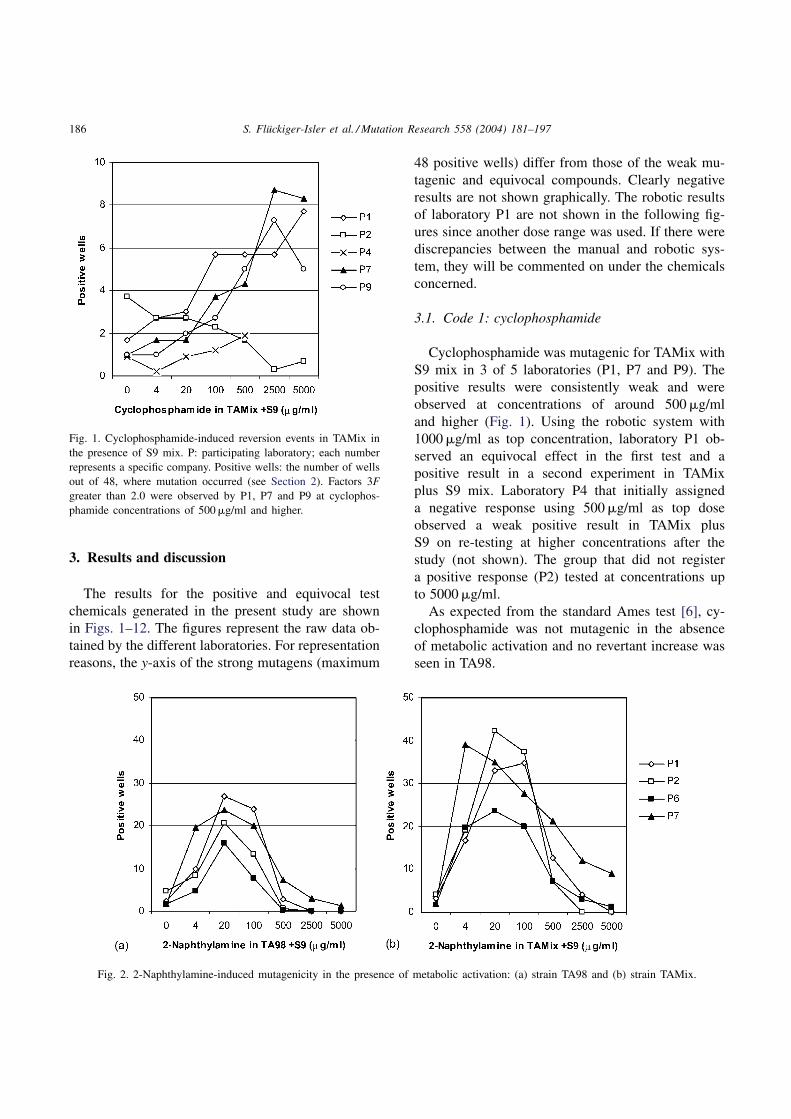
186 S. Flückiger-Isler et al. / Mutation Research 558 (2004) 181–197
Fig. 1. Cyclophosphamide-induced reversion events in TAMix in
the presence of S9 mix. P: participating laboratory; each number
represents a specific company. Positive wells: the number of wells
out of 48, where mutation occurred (see Section 2). Factors 3F
greater than 2.0 were observed by P1, P7 and P9 at cyclophos-
phamide concentrations of 500 �g/ml and higher.
3. Results and discussion
The results for the positive and equivocal test
chemicals generated in the present study are shown
in Figs. 1–12. The figures represent the raw data ob-
tained by the different laboratories. For representation
reasons, the y-axis of the strong mutagens (maximum
Fig. 2. 2-Naphthylamine-induced mutagenicity in the presence of metabolic activation: (a) strain TA98 and (b) strain TAMix.
48 positive wells) differ from those of the weak mu-
tagenic and equivocal compounds. Clearly negative
results are not shown graphically. The robotic results
of laboratory P1 are not shown in the following fig-
ures since another dose range was used. If there were
discrepancies between the manual and robotic sys-
tem, they will be commented on under the chemicals
concerned.
3.1. Code 1: cyclophosphamide
Cyclophosphamide was mutagenic for TAMix with
S9 mix in 3 of 5 laboratories (P1, P7 and P9). The
positive results were consistently weak and were
observed at concentrations of around 500 �g/ml
and higher (Fig. 1). Using the robotic system with
1000 �g/ml as top concentration, laboratory P1 ob-
served an equivocal effect in the first test and a
positive result in a second experiment in TAMix
plus S9 mix. Laboratory P4 that initially assigned
a negative response using 500 �g/ml as top dose
observed a weak positive result in TAMix plus
S9 on re-testing at higher concentrations after the
study (not shown). The group that did not register
a positive response (P2) tested at concentrations up
to 5000 �g/ml.
As expected from the standard Ames test [6], cy-
clophosphamide was not mutagenic in the absence
of metabolic activation and no revertant increase was
seen in TA98.
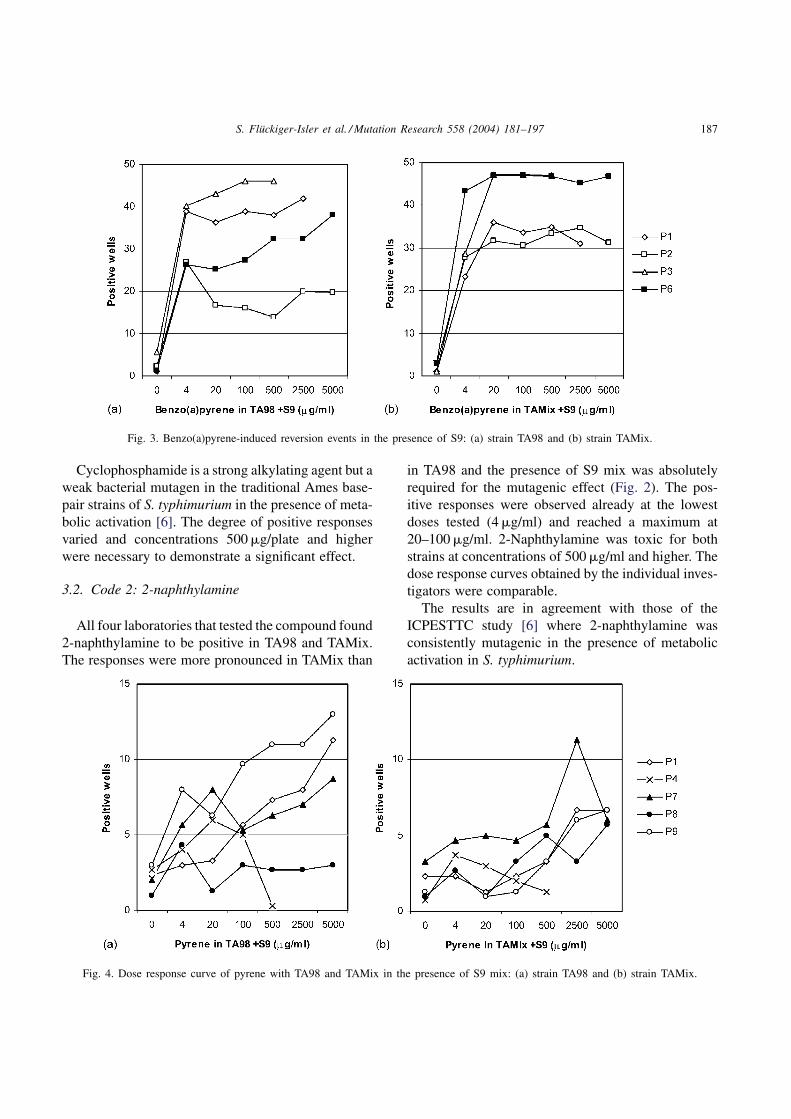
S. Flückiger-Isler et al. / Mutation Research 558 (2004) 181–197 187
Fig. 3. Benzo(a)pyrene-induced reversion events in the presence of S9: (a) strain TA98 and (b) strain TAMix.
Cyclophosphamide is a strong alkylating agent but a
weak bacterial mutagen in the traditional Ames base-
pair strains of S. typhimurium in the presence of meta-
bolic activation [6]. The degree of positive responses
varied and concentrations 500 �g/plate and higher
were necessary to demonstrate a significant effect.
3.2. Code 2: 2-naphthylamine
All four laboratories that tested the compound found
2-naphthylamine to be positive in TA98 and TAMix.
The responses were more pronounced in TAMix than
Fig. 4. Dose response curve of pyrene with TA98 and TAMix in the presence of S9 mix: (a) strain TA98 and (b) strain TAMix.
in TA98 and the presence of S9 mix was absolutely
required for the mutagenic effect (Fig. 2). The pos-
itive responses were observed already at the lowest
doses tested (4 �g/ml) and reached a maximum at
20–100 �g/ml. 2-Naphthylamine was toxic for both
strains at concentrations of 500 �g/ml and higher. The
dose response curves obtained by the individual inves-
tigators were comparable.
The results are in agreement with those of the
ICPESTTC study [6] where 2-naphthylamine was
consistently mutagenic in the presence of metabolic
activation in S. typhimurium.
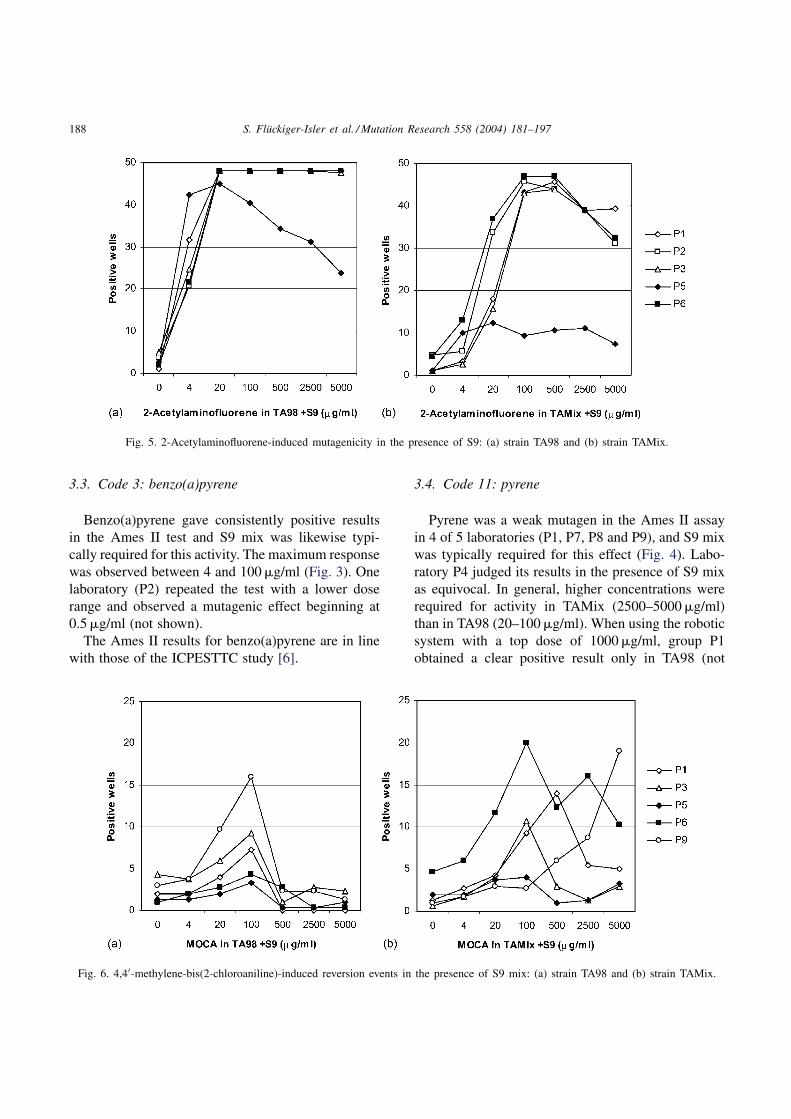
188 S. Flückiger-Isler et al. / Mutation Research 558 (2004) 181–197
Fig. 5. 2-Acetylaminofluorene-induced mutagenicity in the presence of S9: (a) strain TA98 and (b) strain TAMix.
3.3. Code 3: benzo(a)pyrene
Benzo(a)pyrene gave consistently positive results
in the Ames II test and S9 mix was likewise typi-
cally required for this activity. The maximum response
was observed between 4 and 100 �g/ml (Fig. 3). One
laboratory (P2) repeated the test with a lower dose
range and observed a mutagenic effect beginning at
0.5 �g/ml (not shown).
The Ames II results for benzo(a)pyrene are in line
with those of the ICPESTTC study [6].
Fig. 6. 4,4′-methylene-bis(2-chloroaniline)-induced reversion events in the presence of S9 mix: (a) strain TA98 and (b) strain TAMix.
3.4. Code 11: pyrene
Pyrene was a weak mutagen in the Ames II assay
in 4 of 5 laboratories (P1, P7, P8 and P9), and S9 mix
was typically required for this effect (Fig. 4). Labo-
ratory P4 judged its results in the presence of S9 mix
as equivocal. In general, higher concentrations were
required for activity in TAMix (2500–5000 �g/ml)
than in TA98 (20–100 �g/ml). When using the robotic
system with a top dose of 1000 �g/ml, group P1
obtained a clear positive result only in TA98 (not
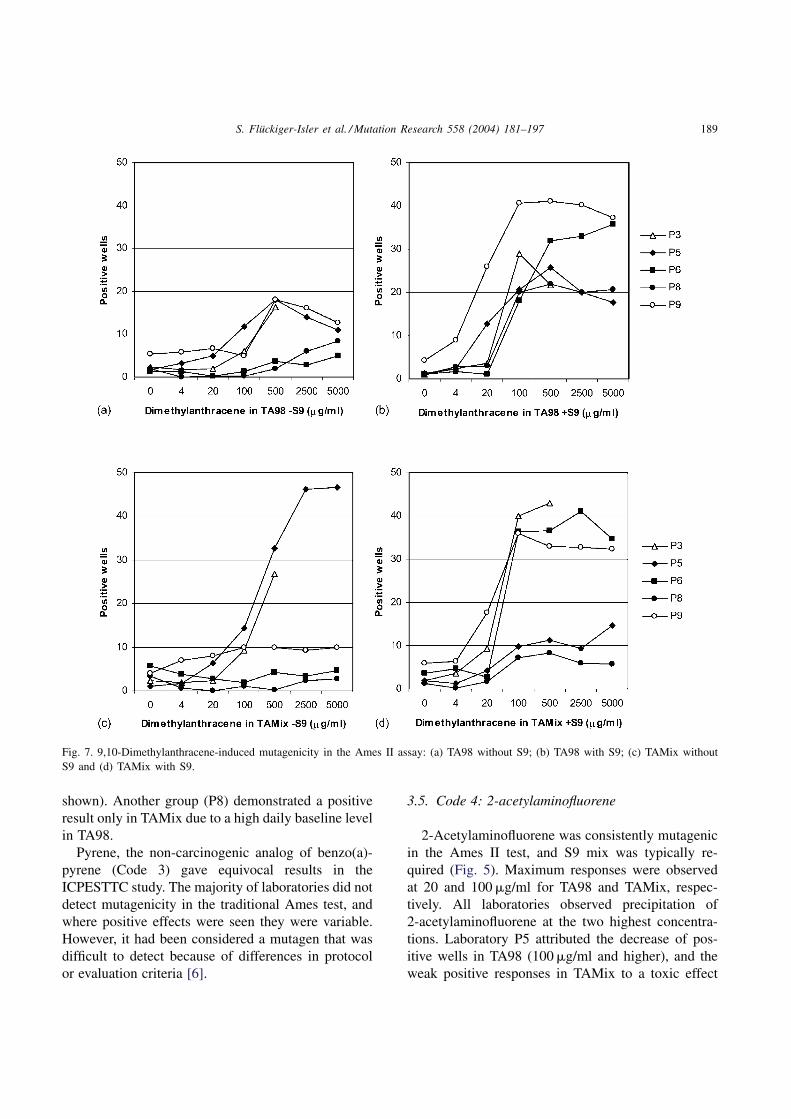
S. Flückiger-Isler et al. / Mutation Research 558 (2004) 181–197 189
Fig. 7. 9,10-Dimethylanthracene-induced mutagenicity in the Ames II assay: (a) TA98 without S9; (b) TA98 with S9; (c) TAMix without
S9 and (d) TAMix with S9.
shown). Another group (P8) demonstrated a positive
result only in TAMix due to a high daily baseline level
in TA98.
Pyrene, the non-carcinogenic analog of benzo(a)-
pyrene (Code 3) gave equivocal results in the
ICPESTTC study. The majority of laboratories did not
detect mutagenicity in the traditional Ames test, and
where positive effects were seen they were variable.
However, it had been considered a mutagen that was
difficult to detect because of differences in protocol
or evaluation criteria [6].
3.5. Code 4: 2-acetylaminofluorene
2-Acetylaminofluorene was consistently mutagenic
in the Ames II test, and S9 mix was typically re-
quired (Fig. 5). Maximum responses were observed
at 20 and 100 �g/ml for TA98 and TAMix, respec-
tively. All laboratories observed precipitation of
2-acetylaminofluorene at the two highest concentra-
tions. Laboratory P5 attributed the decrease of pos-
itive wells in TA98 (100 �g/ml and higher), and the
weak positive responses in TAMix to a toxic effect
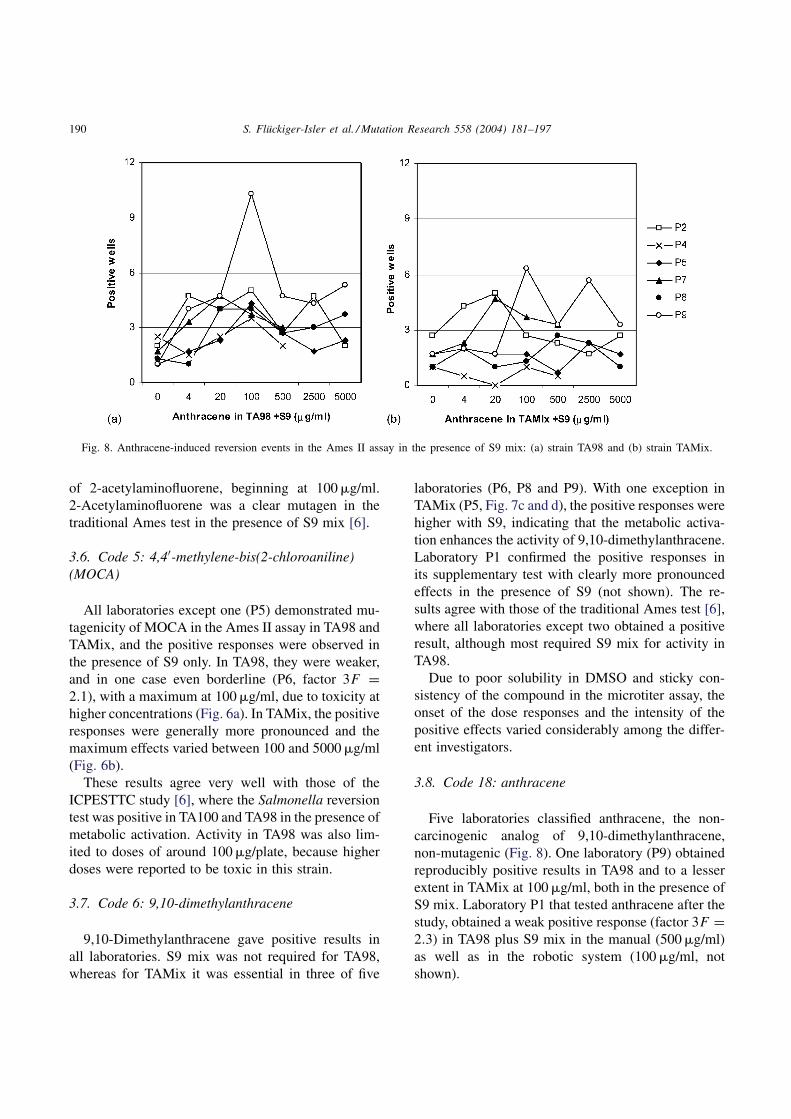
190 S. Flückiger-Isler et al. / Mutation Research 558 (2004) 181–197
Fig. 8. Anthracene-induced reversion events in the Ames II assay in the presence of S9 mix: (a) strain TA98 and (b) strain TAMix.
of 2-acetylaminofluorene, beginning at 100 �g/ml.
2-Acetylaminofluorene was a clear mutagen in the
traditional Ames test in the presence of S9 mix [6].
3.6. Code 5: 4,4′-methylene-bis(2-chloroaniline)
(MOCA)
All laboratories except one (P5) demonstrated mu-
tagenicity of MOCA in the Ames II assay in TA98 and
TAMix, and the positive responses were observed in
the presence of S9 only. In TA98, they were weaker,
and in one case even borderline (P6, factor 3F =
2.1), with a maximum at 100 �g/ml, due to toxicity at
higher concentrations (Fig. 6a). In TAMix, the positive
responses were generally more pronounced and the
maximum effects varied between 100 and 5000 �g/ml
(Fig. 6b).
These results agree very well with those of the
ICPESTTC study [6], where the Salmonella reversion
test was positive in TA100 and TA98 in the presence of
metabolic activation. Activity in TA98 was also lim-
ited to doses of around 100 �g/plate, because higher
doses were reported to be toxic in this strain.
3.7. Code 6: 9,10-dimethylanthracene
9,10-Dimethylanthracene gave positive results in
all laboratories. S9 mix was not required for TA98,
whereas for TAMix it was essential in three of five
laboratories (P6, P8 and P9). With one exception in
TAMix (P5, Fig. 7c and d), the positive responses were
higher with S9, indicating that the metabolic activa-
tion enhances the activity of 9,10-dimethylanthracene.
Laboratory P1 confirmed the positive responses in
its supplementary test with clearly more pronounced
effects in the presence of S9 (not shown). The re-
sults agree with those of the traditional Ames test [6],
where all laboratories except two obtained a positive
result, although most required S9 mix for activity in
TA98.
Due to poor solubility in DMSO and sticky con-
sistency of the compound in the microtiter assay, the
onset of the dose responses and the intensity of the
positive effects varied considerably among the differ-
ent investigators.
3.8. Code 18: anthracene
Five laboratories classified anthracene, the non-
carcinogenic analog of 9,10-dimethylanthracene,
non-mutagenic (Fig. 8). One laboratory (P9) obtained
reproducibly positive results in TA98 and to a lesser
extent in TAMix at 100 �g/ml, both in the presence of
S9 mix. Laboratory P1 that tested anthracene after the
study, obtained a weak positive response (factor 3F =
2.3) in TA98 plus S9 mix in the manual (500 �g/ml)
as well as in the robotic system (100 �g/ml, not
shown).

S. Flückiger-Isler et al. / Mutation Research 558 (2004) 181–197 191
Fig. 9. 4-NQO-induced mutagenicity in the presence and absence of S9 mix: (a) TA98 without S9; (b) TA98 with S9; (c) TAMix without
S9 and (d) TAMix with S9.
The overall consensus was that anthracene is not
mutagenic, as it was in the traditional Ames test [6],
where only 2 out of 15 participants obtained a positive
result.
3.9. Code 7: 4-nitroquinoline-N-oxide (4-NQO)
4-NQO was highly mutagenic in the Ames II test
for both TA98 and TAMix in all laboratories that
tested the chemical, and there was no requirement
for metabolic activation (Fig. 9). The doses chosen
in this study were extremely toxic; without S9 tox-
icity started at 20 �g/ml and with S9 at 100 �g/ml.
Higher concentrations caused cell death. These results
were confirmed by laboratory P1 after the study (not
shown). One laboratory (P9) repeated the test with
a lower dose range in which mutagenicity started at
0.16 and 0.8 �g/ml in the absence and presence of
S9, respectively (not shown). In the traditional Ames
assay [6], TA98 and TA100 were the most useful
strains for detecting 4-NQO activity, and S9 mix was,
in general, not necessary for a mutagenic effect.
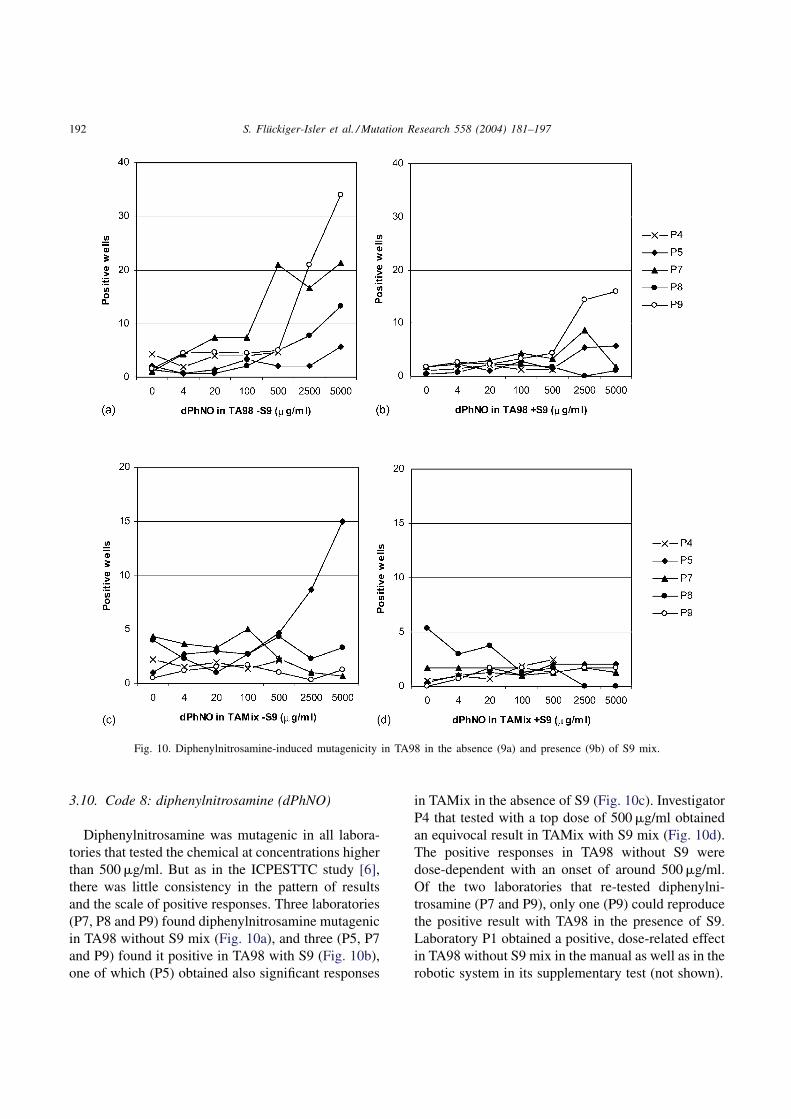
192 S. Flückiger-Isler et al. / Mutation Research 558 (2004) 181–197
Fig. 10. Diphenylnitrosamine-induced mutagenicity in TA98 in the absence (9a) and presence (9b) of S9 mix.
3.10. Code 8: diphenylnitrosamine (dPhNO)
Diphenylnitrosamine was mutagenic in all labora-
tories that tested the chemical at concentrations higher
than 500 �g/ml. But as in the ICPESTTC study [6],
there was little consistency in the pattern of results
and the scale of positive responses. Three laboratories
(P7, P8 and P9) found diphenylnitrosamine mutagenic
in TA98 without S9 mix (Fig. 10a), and three (P5, P7
and P9) found it positive in TA98 with S9 (Fig. 10b),
one of which (P5) obtained also significant responses
in TAMix in the absence of S9 (Fig. 10c). Investigator
P4 that tested with a top dose of 500 �g/ml obtained
an equivocal result in TAMix with S9 mix (Fig. 10d).
The positive responses in TA98 without S9 were
dose-dependent with an onset of around 500 �g/ml.
Of the two laboratories that re-tested diphenylni-
trosamine (P7 and P9), only one (P9) could reproduce
the positive result with TA98 in the presence of S9.
Laboratory P1 obtained a positive, dose-related effect
in TA98 without S9 mix in the manual as well as in the
robotic system in its supplementary test (not shown).
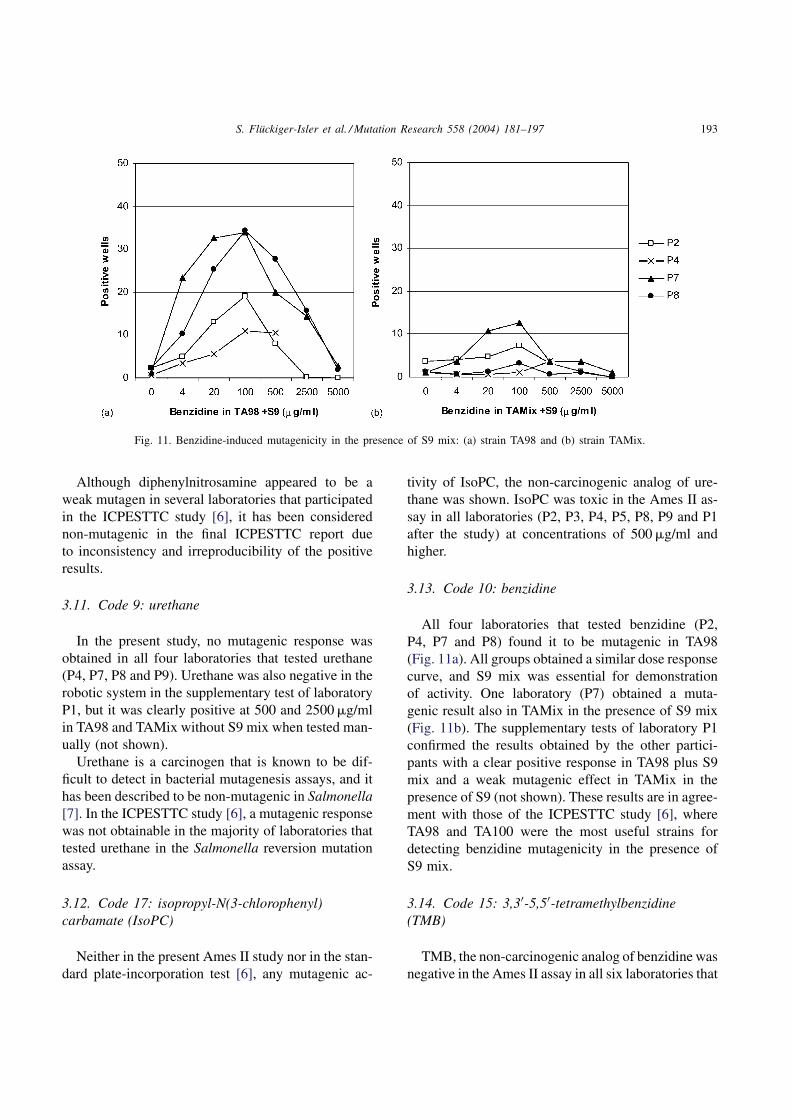
S. Flückiger-Isler et al. / Mutation Research 558 (2004) 181–197 193
Fig. 11. Benzidine-induced mutagenicity in the presence of S9 mix: (a) strain TA98 and (b) strain TAMix.
Although diphenylnitrosamine appeared to be a
weak mutagen in several laboratories that participated
in the ICPESTTC study [6], it has been considered
non-mutagenic in the final ICPESTTC report due
to inconsistency and irreproducibility of the positive
results.
3.11. Code 9: urethane
In the present study, no mutagenic response was
obtained in all four laboratories that tested urethane
(P4, P7, P8 and P9). Urethane was also negative in the
robotic system in the supplementary test of laboratory
P1, but it was clearly positive at 500 and 2500 �g/ml
in TA98 and TAMix without S9 mix when tested man-
ually (not shown).
Urethane is a carcinogen that is known to be dif-
ficult to detect in bacterial mutagenesis assays, and it
has been described to be non-mutagenic in Salmonella
[7]. In the ICPESTTC study [6], a mutagenic response
was not obtainable in the majority of laboratories that
tested urethane in the Salmonella reversion mutation
assay.
3.12. Code 17: isopropyl-N(3-chlorophenyl)
carbamate (IsoPC)
Neither in the present Ames II study nor in the stan-
dard plate-incorporation test [6], any mutagenic ac-
tivity of IsoPC, the non-carcinogenic analog of ure-
thane was shown. IsoPC was toxic in the Ames II as-
say in all laboratories (P2, P3, P4, P5, P8, P9 and P1
after the study) at concentrations of 500 �g/ml and
higher.
3.13. Code 10: benzidine
All four laboratories that tested benzidine (P2,
P4, P7 and P8) found it to be mutagenic in TA98
(Fig. 11a). All groups obtained a similar dose response
curve, and S9 mix was essential for demonstration
of activity. One laboratory (P7) obtained a muta-
genic result also in TAMix in the presence of S9 mix
(Fig. 11b). The supplementary tests of laboratory P1
confirmed the results obtained by the other partici-
pants with a clear positive response in TA98 plus S9
mix and a weak mutagenic effect in TAMix in the
presence of S9 (not shown). These results are in agree-
ment with those of the ICPESTTC study [6], where
TA98 and TA100 were the most useful strains for
detecting benzidine mutagenicity in the presence of
S9 mix.
3.14. Code 15: 3,3′-5,5′-tetramethylbenzidine
(TMB)
TMB, the non-carcinogenic analog of benzidine was
negative in the Ames II assay in all six laboratories that
194 S. Flückiger-Isler et al. / Mutation Research 558 (2004) 181–197
tested the chemical (P1, P2, P3, P5, P6 and P8). It was
also considered to be non-mutagenic in the traditional
Ames assay [6].
3.15. Code 12: azoxybenzene
Azoxybenzene did not result in significant re-
sponses in three groups out of five that tested the
chemical (Fig. 12). Two groups (P1 and P7) obtained
a positive response in TA98 in the presence of S9
mix. One of them (P1) had a weak mutagenic effect
at 100 �g/ml in the manual but not in the robotic
system, and the other (P7) at 20 and 100 �g/ml.
The latter positive result was confirmed upon re-
peating the test after the study with a dose response
from 20 to 500 �g/ml. Laboratory P4 judged azoxy-
benzene negative according to its proper evaluation
criteria.
Azoxybenzene gave equivocal results in the
ICPESTTC study [6]. In those laboratories where a
mutagenic effect was observed, S9 mix was essential.
It has therefore been suggested that the capacity of
S9 mix may be critical for demonstration of azoxy-
benzene mutagenicity. In the present study, it was
mainly negative. The concentration of S9 mix in the
Ames II test is 4.5% and therefore considerably lower
than the 10 and 30% used in the traditional Ames
assay. The lower S9 concentration may have been
the reason that the majority of the laboratories in
Fig. 12. Azoxybenzene-induced reversion events in TA98 with S9
mix.
the present study did not identify azoxybenzene as a
mutagen.
3.16. Code 13: 3-aminotriazole
3-Aminotriazole is a carcinogen that was not found
to be mutagenic in the Ames II assay, tested by five
laboratories (P1, P3, P6, P7 and P9). One group (P7)
obtained a weak positive result with a fold induction
of 2.1 over the baseline (factor 3F) at the highest dose
(5000 �g/ml), and this result was confirmed (factor
3F = 2.6) upon re-testing after the study. Based on
the calculation criteria used in this study, the amino-
triazole result of this laboratory was judged equivocal.
It has also been concluded in the ICPESTTC study [6]
that the carcinogen 3-aminotriazole was negative in S.
Typhimurium.
3.17. Code 14: diethylstilbestrol (DES)
Diethylstilbestrol was consistently non-mutagenic
in the Ames II assay, tested by P1, P2, P3, P5
and P9, which is in agreement with the results ob-
tained with the traditional Ames test [6]. Diethyl-
stilbestrol is a carcinogen acting by a mechanism
not involving DNA damage, and is therefore diffi-
cult to be detected in bacterial mutagenesis assays
[7].
3.18. Code 16: sucrose
Sucrose was consistently negative in the Ames II
test performed by the laboratories P2, P3, P5, P6, P8,
and P1 after the study, which corresponds to the stan-
dard Ames test [6].
3.19. Code 19: methionine
None of the laboratories (P2, P4, P7 and P8) ob-
tained a mutagenic effect with methionine, confirming
the results of the ICPESTTC study [6].
4. Conclusions
The present Ames II study revealed an overall agree-
ment of 84.2% (16 of 19 compounds, Fig. 13a–p) with
S. Flückiger-Isler et al. / Mutation Research 558 (2004) 181–197 195
Fig. 13. Relative performances of the traditional Ames (light bars) and the Ames II (black bars) assays. Responses have been nor-
malized (%) because of different group sizes. Questionable responses have been ignored. (a) benzo(a)pyrene; (b) 2-acetylaminofluorene;
(c) 4-nitroquinoline-N-oxide; (d) benzidine; (e) 2-naphthylamine; (f) 9,10-dimethylanthracene; (g) 4,4-methylene-bis(2-chloroaniline);
(h) cyclophosphamide; (i) diethylstilbestrol; (j) urethane; (k) aminotriazole; (l) 3,3′-5,5′-tetramethylbenzidine; (m) sucrose; (n)
isopropyl-N(3-chlorophenyl)carbamate; (o) methionine; (p) anthracene; (q) azoxybenzene; (r) diphenylnitrosamine; (s) pyrene. (a–h) mu-
tagenic in the traditional Ames (ICPESTTC study); (i and k–p) negative in the traditional Ames; (j and q–s) equivocal in the traditional
Ames; (a–k) carcinogenic compounds; (l–s) non-carcinogenic compounds.
the standard Ames results of the ICPESTTC study [6].
All eight mutagenic chemicals that were selected from
the ICPESTTC report (Fig. 12a–h) were also posi-
tive in the Ames II test, except cyclophosphamide (h)
Table 4
Inter-laboratory consistency
Participant Code no.
1 2 3 4 5 6 7 8 9 10 11 12 13 14 15 16 17 18 19
P1 + + + + + + ? − − −
P2 − + + + + − − − − −
P3 + + + + + − − − − −
P5 + − + + + − − − − −
P6 + + + + + − − − − −
P7 + + + − + + + ? − −
P8 + + + − + + − − − −
P9 + + + + + − + − − − +
P1 (Robot) + + + + + + − − − −
P4 (Robot) − + ? − + ? − − − −
Consent + + + + + + + + − + + − − − − − − − −
% agreement 67 100 100 100 83 100 100 100 100 100 100 75 100 100 100 100 100 83 100
(P) participating laboratories 1–9; (+) positive; (−) negative; (?) questionable. The test chemicals are listed by code numbers.
which was found to be positive in 4 of 6 laboratories
in the present study. All seven Ames-negative com-
pounds were also clearly negative in the Ames II test
(Fig. 13i and k–p).
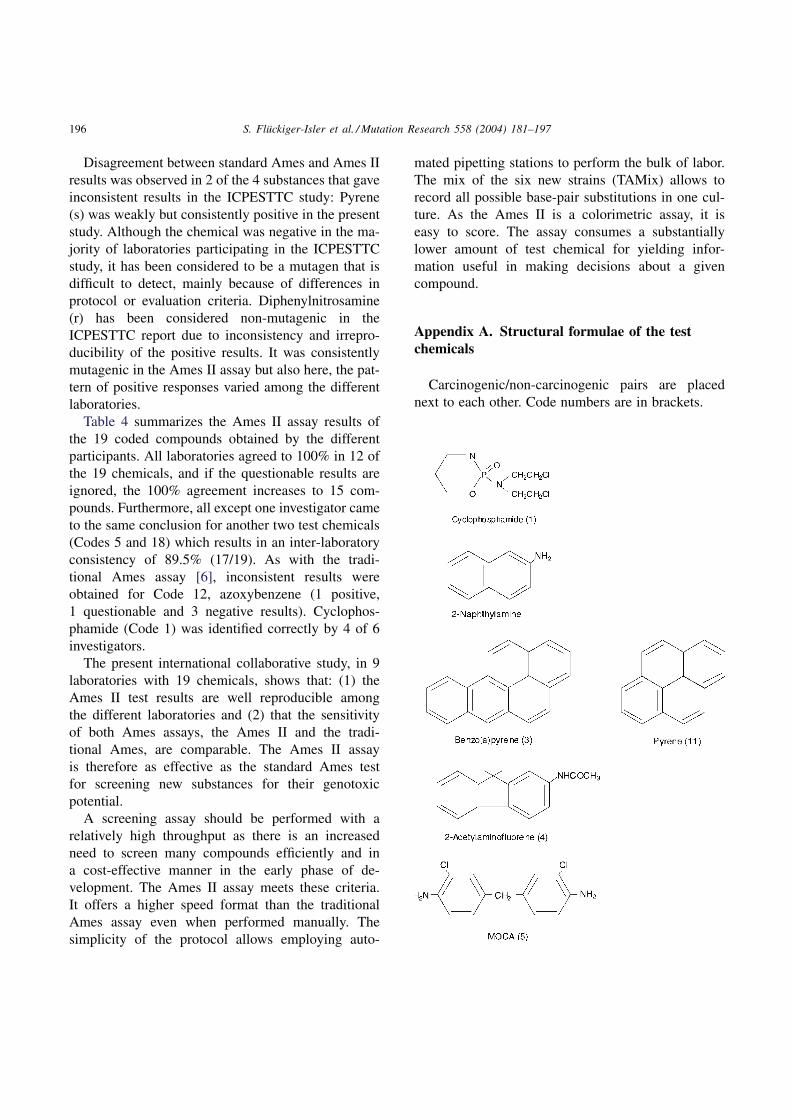
196 S. Flückiger-Isler et al. / Mutation Research 558 (2004) 181–197
Disagreement between standard Ames and Ames II
results was observed in 2 of the 4 substances that gave
inconsistent results in the ICPESTTC study: Pyrene
(s) was weakly but consistently positive in the present
study. Although the chemical was negative in the ma-
jority of laboratories participating in the ICPESTTC
study, it has been considered to be a mutagen that is
difficult to detect, mainly because of differences in
protocol or evaluation criteria. Diphenylnitrosamine
(r) has been considered non-mutagenic in the
ICPESTTC report due to inconsistency and irrepro-
ducibility of the positive results. It was consistently
mutagenic in the Ames II assay but also here, the pat-
tern of positive responses varied among the different
laboratories.
Table 4 summarizes the Ames II assay results of
the 19 coded compounds obtained by the different
participants. All laboratories agreed to 100% in 12 of
the 19 chemicals, and if the questionable results are
ignored, the 100% agreement increases to 15 com-
pounds. Furthermore, all except one investigator came
to the same conclusion for another two test chemicals
(Codes 5 and 18) which results in an inter-laboratory
consistency of 89.5% (17/19). As with the tradi-
tional Ames assay [6], inconsistent results were
obtained for Code 12, azoxybenzene (1 positive,
1 questionable and 3 negative results). Cyclophos-
phamide (Code 1) was identified correctly by 4 of 6
investigators.
The present international collaborative study, in 9
laboratories with 19 chemicals, shows that: (1) the
Ames II test results are well reproducible among
the different laboratories and (2) that the sensitivity
of both Ames assays, the Ames II and the tradi-
tional Ames, are comparable. The Ames II assay
is therefore as effective as the standard Ames test
for screening new substances for their genotoxic
potential.
A screening assay should be performed with a
relatively high throughput as there is an increased
need to screen many compounds efficiently and in
a cost-effective manner in the early phase of de-
velopment. The Ames II assay meets these criteria.
It offers a higher speed format than the traditional
Ames assay even when performed manually. The
simplicity of the protocol allows employing auto-
mated pipetting stations to perform the bulk of labor.
The mix of the six new strains (TAMix) allows to
record all possible base-pair substitutions in one cul-
ture. As the Ames II is a colorimetric assay, it is
easy to score. The assay consumes a substantially
lower amount of test chemical for yielding infor-
mation useful in making decisions about a given
compound.
Appendix A. Structural formulae of the test
chemicals
Carcinogenic/non-carcinogenic pairs are placed
next to each other. Code numbers are in brackets.

S. Flückiger-Isler et al. / Mutation Research 558 (2004) 181–197 197
References
[1] B.N. Ames, J. McCann, E. Yamasaki, Methods for
detecting carcinogens and mutagens with the Salmonella/
mammalian-microsome mutagenicity test, Mutation Res. 31
(1975) 217–233.
[2] D.M. Maron, B.N. Ames, Revised methods for the Salmonella
mutagenicity test, Mutation Res. 113 (1983) 173–215.
[3] P. Gee, D.M. Maron, B.N. Ames, Detection and classification
of mutagens: a set of base-specific Salmonella tester
strains, Proc. Natl. Acad. Sci. U.S.A. 91 (1994) 11606–
11610.
[4] P. Gee, C.H. Sommers, A.S. Melick, X.M. Gidrol, M.D. Todd,
R.B. Burris, M.E. Nelson, R.C. Klemm, E. Zeiger, Comparison
of responses of base-specific Salmonella tester strains with
the traditional strains for identifying mutagens: the result of a
validation study, Mutation Res. 412 (1998) 115–130.
[5] G. Engelhardt, E. Jacob, R. Jäckh, Ames II assay: results of
a validation study, Naunyn-Schmiedeberg’s Arch. Pharmacol.
359 (1999) 179.
[6] B.A. Bridges, D. MacGregor, E. Zeiger, Summary report on the
performance of bacterial mutation assays, in: F.J. de Serres, J.
Ashby (Eds.), Progress in Mutation Research, vol. 1, Evaluation
of Short-term Tests for Carcinogens, Report of the International
Collaborative Program, Elsevier, Amsterdam, The Netherlands,
1981, pp. 49–67.
[7] I. Rowland, B. Severn, Mutagenicity of carcinogens and
noncarcinogens in the Salmonella/microsome test, in: F.J. de
Serres, J. Ashby (Eds.) Progress in Mutation Research, vol. 1,
Evaluation of Short-term Tests for Carcinogenesis, Report of
the International Collaborative Program, Elsevier, Amsterdam,
The Netherlands, 1981, pp. 323–332.
XENOMETRIXby Endotell
References
[1] P. Gee, D.M. Maron, B.N. Ames. Detection and classification of mutagens:
a set of base-specific Salmonella tester strains. Proc. Natl. Acad. Sci. U.S.A 91
(1994) 11606–1161
[2] B.A. Bridges, D. MacGregor, E. Zeiger. Summary report on the performance
of bacterial mutation assays. In: Progress in mutation research Vol. 1. Evaluation of
short-term tests for carcinogenesis. Report of the international collaborative
program, F.J de Serres, J. Ashby (Eds.). Elsevier/North Holland (1981) pp. 49–67
Conclusion
This study shows that the Ames II™ Assay is a well reproducible test alternative to the traditional Ames test
(Ames I) and that the sensitivity of both test systems (Ames I and AmesII) is comparable, making the Ames IIMutagenicity™ Assay a cost-effective pre-regulatory screening test.
Advantages of Ames II over Ames I:
• Higher speed format – Microplate format - Automatable
• TAMix allows to record all possible base-pair substitutions in one culture
• Ready to use reagents – Less hands on time
• Colorimetric assay
• Substantially lower consumption of test chemical and plasticware
The AMES II™ Mutagenicity Assay:
An International Validation Study Performed With Nineteen Coded CompoundsS. Flückiger-Isler1, M. Baumeister2, K. Braunc, V. Gervaisd, N. Hasler-Nguyene, R. Reimannf, J. Van Gompelg, H.-G. Wunderlichh, G. Engelhardti
1Xenometrix by Endotell GmbH, CH-4125 Allschwil, Switzerland, 2Boehringer Ingelheim Pharma KG & Co. KG, Dept. Non-Clinical Drug Safety, D-88397 Biberach, Germany, 3Aventis Pharma Deutschland GmbH, Drug Innovation & Approval, Lead Optimization, Drug Safety Evaluation, D-65795 Hattersheim, Germany, 4Servier Group,
Drug Safety Assessment, F-45403 Orléans-Gidy, France, 5Novartis Consumer Health, Toxicology, CH-1260 Nyon, Switzerland. 6Schering AG, Experimental Toxicology, D-13342 Berlin, Germany, 7Johnson&Johnson Pharmaceutical Research&Development, Dept. ADME/Tox, B-2340 Beerse, Belgium, 8Federal Environmental Agency,
Dept. for Hygiene of Drinking and Swimming Pool Water, D-08645 Bad Elster, Germany ,9BASF AG, Product Safety, Regulations, Toxicology and Ecology, D-67056 Ludwigshafen, Germany
IntroductionThe Ames II™ assay, a liquid microtiter modification of the standard Ames plate incorporation test («Ames I»), was used for an international col-laborative study with nineteen coded chemicals. The goal of this study was to (1) validate the Ames II as a suitable alternative screening assay tothe Ames I test, and (2) to test the Ames II™ assay system for its reproducibility among 9 different laboratories.
Test Method
The Ames II™ assay is performed with the histidine auxotroph
Salmonella typhimurium tester strains TA98 (frameshift mutations) and
TAMix (base-pair substitutions). TAMix is a mixture of six base-pair
strains, TA7001-TA7006 in equal proportions, each of which reverts by
only one specific base substitution (Ref.1).
The test is performed in microtiter plates. Tester strains and media are
available at Xenometrix by Endotell GmbH. Chemical treatment is perfor-
The Chemicals
• The 19 chemicals selected from the literature (Ref. 2) included known
mutagens, non-mutagens and compounds producing conflicting
results in the standard Ames plate incorporation test. If possible, che-
mical pairs were chosen, i.e. carcinogens and non-carcinogens with
closely related chemical structure (Table 1).
• The chemicals were coded at random and distributed among nine
independent laboratories to allow for an inter-laboratory comparison
of the Ames II test system.
• Each chemical was tested by 4-6 investigators.
Table 1 Test Chemicals
Code No. Chemical Abbreviation CAS No. MWa Mutagenicityb
4 2-Acetylaminofluorene 2AAF 53-96-3 223.3 +
13 3-Amino-1,2,4-triazole Atrz 61-82-5 84.1 -
18 Anthracene Anth 120-12-7 176.2 -
12 Azoxybenzene AzoxB 495-48-7 198.2 ?
10 Benzidine Bzd 92-87-5 184.2 +
3 Benzo(a)pyrene B(a)P 50-32-8 252.3 +
1 Cyclophosphamide Cphos 6055-19-2 279.1 +
14 Diethylstilbestrol DES 56-53-1 268.3 -
6 9,10-Dimethylanthracene DMAnth 781-43-1 206.3 +
8 Diphenylnitrosamine DphNO 86-30-6 198.2 ?
17 Isopropyl N(3-chlorophenyl) carbamate IsoPC 101-21-3 213.7 -
19 L-Methionine Met 63-68-3 149.2 -
5 4,4-Methylene-bis(2-chloroaniline) MOCA 101-14-4 267.2 +
2 2-Naphthylamine 2Naph 91-59-8 143.2 +
7 4-Nitroquinoline-N-oxide 4NQO 56-57-5 190.2 +
11 Pyrene Pyr 129-00-0 202.3 ?
16 D-Sucrose Sacch 57-50-1 342.3 -
15 Tetramethylbenzidine TMB 54827-17-7 240.4 -
9 Urethane Urthne 51-79-6 89.1 ?
a, molecular weight
b, assessment according to the ICPESTTC study (Ref. 2)
+, positive; -, negative; ?, equivocal
ResultsThe present Ames II study revealed an overall agreement of 84% with
the standard Ames plate incorporation test (Ames I, Fig. 2).
• No false positive results were obtained
• All mutagenic chemicals selected were correctly identified with the
Ames II™ assay (e.g. Fig. 3), except cyclophosphamide (Cphos)
which was Ames II positive in only 4 of 6 laboratories.
• Two of the compounds with equivocal results in the Ames I test (pyre-
ne, Pyr and diphenylnitrosamine, dPhNO) were weakly but consi-
stently positive in the Ames II test, whereas one (azoxybenzene,
AzoxB) produced also conflicting results in the Ames II test.
Table 2 summarizes the Ames II results obtained by the different par-
ticipating laboratories.
• All laboratories agreed to 100% in 15 of 19 chemicals (individual que-
stionable results are ignored). Furthermore, all except one laboratory
came to the same conclusion for 17 out of 19 test compounds which
results in an inter-laboratory consistency of 89.5%.
0
25
50
75
100
25
50
75
100
% o
f p
osi
tive r
esp
onse
s%
of
neg
ati
ve r
esp
onse
s
Ames I
Ames II
B(a)P 2AAF 4NQO Bzd DMAnth
MOCACphos
Urthne
DES
3Atrz TMB IsoPCSacch
MetAnth
AzoxB
dPhNO Pyr2Naph
1 2 3 4 5 6 7 8 9 10 12 13 14 15 16 17 18 19
1 2 3 4 5 6 7 8 9 10 11 12 13 14 15 16 17 18 19
med in 24-well plates (6 concentrations in triplicate, concurrently with
solvent and positive controls) in the absence and presence of S9 mix.
After treatment, a medium containing a pH indicator and lacking histidi-
ne is added. Each well of the 24-well plate is then aliquoted into 48 wells
of a 384 well-plate and incubated for two days to allow revertant bacte-
ria to form colonies. Mutagenicity (bacterial growth) is measured colori-
metrically by a color change (pH drop) from purple to yellow (Fig. 1).
Table 2: Inter-laboratory Consistency
Participant CODE #1 2 3 4 5 6 7 8 9 10 11 12 13 14 15 16 17 18 19
P1 pos pos pos pos pos pos equ neg neg neg
P2 neg pos pos pos pos neg neg neg neg neg
P3 pos pos pos pos pos neg neg neg neg neg
P5 pos neg pos pos pos neg neg neg neg neg
P6 pos pos pos pos pos neg neg neg neg neg
P7 pos pos pos neg pos pos pos equ neg neg
P8 pos pos pos neg pos pos neg neg neg neg
P9 pos pos pos pos pos neg pos neg neg neg pos
P1 (Robot) pos pos pos pos pos pos neg neg neg neg
P4 (Robot) neg pos equ neg pos equ neg neg neg neg
Ames I pos pos pos pos pos pos pos equ equ pos equ equ neg neg neg neg neg neg neg
Literature
P = Participating company; pos = positive result; neg = negative result; equ = equivalent result
Fig 2: Relative Performances of the Ames I and the Ames II responses have been normalized (%) because of different group sizes; questionnable response has been ignored
Fig. 3: Ames II test results with 2-naphthylamine
50
40
30
20
10
0
2-Naphthylamine in TA98 +S9 (µg/ml)
Po
siti
ve w
ells
0 4 20 100 500 2500 5000
50
40
30
20
10
0
2-Naphthylamine in TAMix +S9 (µg/ml)
Po
siti
ve w
ells
0 4 20 100 500 2500 5000
P1
P2
P6
P7
carcinogenic compounds non-carcinogenic compounds
A
B
C
D
A
B
C
D
TAMix
ABCDEF
50 lm
Fig. 1: Ames II Assay Procedure
CultureStored at -80º C
OvernightCulture
OD600TAMix
TAM
ix
37° C, 12–17 h250 rpm
IndicatorMedium
384-Well Plate
37° C, 48 h
D4
D5
D6
C+
C-
D1
D2
D3
Test Compound
Bacteria Culture
S9 Mix
Exposure Medium
37° C, 90 Min, 250 rpm
37°C
C D4
C- D4
D1 D5
D2 D6
D3 C+
D1 D5
D2 D6
D3 C+
Assay Preparation Exposure Culture24-Well Plate

Comparison of DEREK, Ames and Ames IIComparisonComparison of DEREK, of DEREK, AmesAmes andand AmesAmes IIII
Knut Braun, Hans-Peter Spirkl, Andreas Czich, Ingo Stammberger, Alexander Amberg
Aventis Pharma Germany GmbH, Drug Safety Evaluation, Exploratory Safety & Genetic Toxicology,
65795 Hattersheim, Germany
KnutKnut Braun,Braun, HansHans--PeterPeter SpirklSpirkl, Andreas, Andreas CzichCzich, Ingo , Ingo StammbergerStammberger, Alexander , Alexander AmbergAmberg
AventisAventis PharmaPharma Germany GmbH, Drug Safety Evaluation, Exploratory Safety & GeneGermany GmbH, Drug Safety Evaluation, Exploratory Safety & Genetic Toxicology,tic Toxicology,
65795 65795 HattersheimHattersheim, Germany, Germany
ConclusionsConclusionsConclusions
DiscussionDiscussionDiscussion
PurposePurposePurpose
Material and MethodsMaterial and MethodsMethods
ResultsResultsResults
IntroductionIntroductionIntroduction Results - con’tResultsResults -- con’tcon’t
The Ames II™ assay is performed with thehistidine auxotroph Salmonella typhimuriumtester strains TA98 (frameshift mutations) and TAMix (base-pair substitutions). TAMixis a mixture of six base-pair strains, TA7001-TA7006 in equal proportions, each of which reverts by only one specific base substitution
The Ames II test is an valuable screening tool in early drug development due to the low amount of compound needed (5 mg), the higher throughput and its supposed predictivity for the Standard Ames Test. The aim of this work was to compare the results of the AmesII assay with results predicted in DEREK in comparison to data from literature for the standard Ames protocol. 16 different chemicals revealing 9 different DEREK alerts and known results in the standard Ames were selected for testing in the Ames II assay with and without S9 mix.
.
The Ames II™ assay is performed with thehistidine auxotroph Salmonella typhimuriumtester strains TA98 (frameshift mutations) andTAMix (base-pair substitutions). TAMix is a mixture of six base-pair strains, TA7001-TA7006 in equal proportions, each of which reverts by only one specific base substitution (Ref.1).
The test is performed in microtiter plates. Tester strains and media are available at
Aniara. Chemical treatment is
performed in 24-well plates (6 concentrations in triplicate, concurrently with solvent and positive controls) in the absence and presence of S9 mix. After treatment, a medium containing a pH indicator and lackinghistidine is added. Each well of the 24-well plate is then aliquoted into 48 wells of a 384 well-plate and incubated for two days to allowrevertant bacteria to form colonies.Mutagenicity (bacterial growth) is measuredcolorimetrically by a color change (pH drop) from purple to yellow (Fig. 1).
The Ames II™ assay, a liquid microtiter
modification of the standard Ames plate
incorporation test (“Ames I”), was used for
an internal study with sixteen coded
chemicals. The goal of this study was to 1)
compare the Ames II with data from
literature with reference chemicals and 2) to
identify DEREK alerts which were not
recognized by the Ames II assay. For this
purpose, 16 compounds revealing different
DEREK alerts were investigated
It could be shown that the major number of compounds with DEREK alerts was identified with the Ames II assay. For some classes ofcompounds further investigations seem to be necessary to improve the meaningfulness of this assay.
However, the Ames II is a valuable screening tool for the prediction of the outcome of the standard Ames assay.
Fig. 1 : Ames II Assay Procedure
Indicator
Medium
Test Compound
Culture
Stored at –80°C
Overnight
CultureAssay Preparation
37°C, 12 –17 h
250 rpm
OD600
Exposure Culture
24-Well Plate
37°C, 90 min, 250 rpm
Ba cteria Culture
S9-Mix
Exposure Medium
C-
D1
D2
D3
D4
D5
D6
C+
C-
D1
D2
D3
D4
D5
D6
C+
TAMix
C-
D1
D2
D3
D4
D5
D6
C+
C-
D1
D2
D3
D4
D5
D6
C+
TA
Mix
TA
Mix
37°C, 48 h
384-Well Plate
It could be demonstrated that 12 out of 16 compounds of different structural classes showed congruent results between the Ames II and standard Ames. 3 compounds were found to be negative in the Ames II, but positive in the standard Ames (5-Amino-4-imidazolecarboxamide, N,N-Dimethylnitros-amine and Glutaraldehyde). All these compounds were detected in the standard protocol in the strains detecting base pair substitutions. One of the compounds (N-Hydroxymethylacrylamide) was found to be positive in the Ames II but not in the standard Ames.
Compared with the the mutagenic alerts predicted by DEREK 5 compounds out of 16 were found to be negative in the Ames II. For DEREK alert M311 two Acrylamideswere selected which were known to be negative in procaryotic mutagenicity assays.
Since a 100 % correlation between standard Ames and Ames II is not expected, the purpose of this investigations was to identify classes of compounds that gave controversial results. Although a selection of two compounds per alert is not sufficient to completely estimate the two screening methods, this approach was used as a first step for further investigations.
We identified three classes of compounds for which further investigations should be conducted to improve the predictivity of the Ames II. In conjunction with DEREK analysis it seems to be possible to provide differentiated alerts for a mutagenic potential of a drug candidate.
ASSESSMENT OF A SCREENING EXPERIENCE WITH THE AMES IITM TEST AND FUTURE PROSPECTS
V. GERVAIS1, D. BIJOT1 and N. CLAUDE2
1 Drug Safety Assessment, Servier, Orléans-Gidy, France, 2 IRIS, Servier, Coubevoie, France
INTRODUCTIONINTRODUCTION
The Ames II test, a liquid fluctuation version of the Salmonella mutagenicity assay, provided by Xenometrix GmbH, was used for an early compound selection in the discovery process. The aim of this work was to validate the Ames II compared to the standard Ames test and to explore a way to reduce the required compound quantity without lowering the predictability of the test.
This test is composed of a mixture of 6 Salmonella
typhimurium strains: TA7001, TA7002, TA7003,
TA7004, TA7005 and TA7006, which revert to histidine autotrophy by a specific base substitutionin the histidine operon. This “mix” is used as a single strain. In addition, the frameshift tester strain TA98 is used. The mix and TA98 strains are inoculated in the medium for growth overnight at 37°C. The treatment, performed in 24-wells microtiter plates, allows partial automation and consequently requires about 60-fold less compound (50 mg) than the standard Ames. min-
incubation treatment with or without Aroclor-induced S9 mix, concurrently with solvent and positive controls, an indicator medium lacking histidine is added to each well. Each well is then aliquoted into 48 wells of a 384-well plate. Within two days, revertants to His grow into colonies. The metabolism of the bacterial colony reduces the pH of the medium, changing the colour of the wells. The number of discoloured wells are counted for each concentration and compared to the solvent control (Fig.1). Each concentration is evaluated intriplicate to allow statistical analysis. 350 compounds were tested and three modified conditions were also evaluated to reduce the compound use, namely: test with one strain only, with S9 mix only or with lower concentrations.
MATERIALS MATERIALS andand METHODSMETHODS
350 compounds were tested, including molecules issued from our own research, known non- or genotoxicants, or molecules producing equivocal results. The concordance between the results achieved in this
Ames II test and those reported in the literature or in the standard Ames test ranged from 79 (Ref.1) to 83% (Tab.2). The concordance reached 89% in a collaborative study (Tab.1). No false positive results were obtained with known non-mutagenic substances. False negative results may arise when chemicals revert only specific strains like TA1535 or E. coli WP2 uvrA
(pKM101) which meet no equivalent in the “mix”.
The positive responses were randomly distributed among the strains or the concentration range (Fig.2 and 3). In contrast, only 11% of positive results emerged specifically in the absence of S9 (Fig.4), while 89% of genotoxicants should be detected using S9 mix as theonly treatment condition.
RESULTSRESULTS
REFERENCESREFERENCES1. Gee P. et al. (1998). Mutat. Res., 412: 115-130
350 compounds were tested, including molecules issued from our own research, known non- or genotoxicants, or molecules producing equivocal results. The concordance between the results achieved in this
Ames II test and those reported in the literature or in the standard Ames test ranged from 79 (Ref.1) to 83% (Tab.2). The concordance reached 89% in a collaborative study (Tab.1). No false positive results were obtained with known non-mutagenic substances. False negative results may arise when chemicals revert only specific strains like TA1535 or E. coli WP2 uvrA
(pKM101) which meet no equivalent in the “mix”.
The positive responses were randomly distributed among the strains or the concentration range (Fig.2 and 3). In contrast, only 11% of positive results emerged specifically in the absence of S9 (Fig.4), while 89% of genotoxicants should be detected using S9 mix as theonly treatment condition.
RESULTSRESULTS
REFERENCESREFERENCES1. Gee P. et al. (1998). Mutat. Res., 412: 115-130
DISCUSSION DISCUSSION -- CONCLUSIONCONCLUSION
Based on the acquired experience on a large number of compounds, the Ames IITM test is a reliable screening tool. When used with the recommended conditions by the supplier, it allows an early identification of genotoxicants, otherwise likely discarded at a later stage of development. The two proposed strains (mix and TA98) as well as a high level of tested concentrations are essential to keep an acceptable level of predictability. However, as the compound availability is always of high concern at a screening stage, it is possible to reduce by half the required quantity to be tested (i.e. 25 mg) when performed with the metabolic activation as a unique treatment condition. In that case, the number of false negative would be increased by only 2% (decreased specificity).
* 6/7 compounds revert specifically E. coli or TA1535.
Sensibility : 50 % Specificity : 100 %
Concordance : 83 %
Tab.2: Comparative results between Tab.2: Comparative results between
Ames II and Ames I tests Ames II and Ames I tests
(42 proprietary compounds)(42 proprietary compounds)
Test compounds Ames I Ames IITM
28 - -
6 + +
1 +/- +
7* + -
Test compounds Ames I Ames IITM
28 - -
6 + +
1 +/- +
7* + -
Test compoundsTest compounds Ames IAmes I Ames IITMAmes IITM
2828 -- --
66 ++ ++
11 +/-+/- ++
7*7* ++ --
without revertant coloniesFig.1: 384Fig.1: 384-- plateplate with revertant colonies
Positive controls0
2
4
6
8
1 0
1 2
1 4
1 6
1 8
Pe
rce
nt
(%)
5 0 0 0 4 0 0 0 3 0 0 0 2 0 0 0 1 0 0 0 5 0 0 2 5 0 2 0 0 1 5 0 1 0 0 5 0 2 0 1 0 2
c o n c e n tra t i o n ( µ g /m l)
Fig.3: Distribution of 56 positiveFig.3: Distribution of 56 positive
responses responses vsvs concentration concentration
0
2
4
6
8
1 0
1 2
1 4
1 6
1 8
Pe
rce
nt
(%)
5 0 0 0 4 0 0 0 3 0 0 0 2 0 0 0 1 0 0 0 5 0 0 2 5 0 2 0 0 1 5 0 1 0 0 5 0 2 0 1 0 2
c o n c e n tra t i o n ( µ g /m l)
Fig.3: Distribution of 56 positiveFig.3: Distribution of 56 positive
responses responses vsvs concentration concentration
45 %
Concordance : 89%nb true predictions/total nb compounds
Tab.1: Tab.1: ResultsResults of a of a collaborative study collaborative study by Xenometrix GmbH (March 2003)by Xenometrix GmbH (March 2003)
N: Negative; P: Positive; E: Equivocal
C o m p a n y 1 2 3 4 5 6 7 8 9 1 0 1 1 1 2 1 3 1 4 1 5 1 6 1 7 1 8 1 9
C 1 P P P P P - - - - - P N N N N - - - -
C 1 ( R o b o t ) P P P P P - - - - - P N N N N - - - -
C 2 N P P P - - - - - P - - - - N N N N N
C 3 - - P P P P P - - - - - N N N N N - -
C 4 ( R o b o t ) N - - - - - P E N P E N - - - - N N N
C 5 - - - P N P P P - - - - - N N N N N -
C 6 - P P P P P - - - - - N N N N N - - -
C 7 P P - - - - - P N P P N N - - - - N N
C 8 - - - - - P P P N P P - - - - N N P N
C 9 P - - - P P P P N - P - - N N - N E -
R e s u l t ? P P P P P P P N P P N N N N N N N N
A m e s I P P P P P P P ? ? P ? ? N N N N N N N
C o m p o u n d N u m b e r
Sensibility : 83 %nb true positive/total nb positive compounds
Specificity : 100 %nb true negative/total nb negative compounds
Fig.2: Distribution of 56 positive Fig.2: Distribution of 56 positive
responses among strains:responses among strains:
0
10
20
30
40
50
pe
rce
nt
(%)
Mix only TA98 only Mix and TA98
Fig.2: Distribution of 56 positive Fig.2: Distribution of 56 positive
responses among strains:responses among strains:
0
10
20
30
40
50
pe
rce
nt
(%)
Mix only TA98 only Mix and TA98
Fig.4: Distribution of 56 positive Fig.4: Distribution of 56 positive
responses responses vsvs metabolic activationmetabolic activation
0
10
20
30
40
50
pe
rce
nt
(%)
+ S 9 on ly - S 9 on ly + a nd - S9
Fig.4: Distribution of 56 positive Fig.4: Distribution of 56 positive
responses responses vsvs metabolic activationmetabolic activation
0
10
20
30
40
50
pe
rce
nt
(%)
+ S 9 on ly - S 9 on ly + a nd - S9
25 %25 %
32 %32 %
43 %43 %
43 %43 %


![IIIIIIIIIIIIIIlfflfflf HEELl]////, · 2014. 9. 27. · The Ames Salmonella/Mammalian Microsome Mutagenicity Test is one of a standard bank of tests used by our laboratory for the](https://img.pdfslide.us/doc/110x75/606d079667e9f4057e20d58e/iiiiiiiiiiiiiilfflfflf-heell-2014-9-27-the-ames-salmonellamammalian.jpg)