Embed Size (px)
Citation preview
Socioeconomic Status and theIncreased Prevalence ofAutism in California
Marissa D. Kinga and Peter S. Bearmanb
Abstract
The prevalence of autism has increased precipitously—roughly 10-fold in the past 40years—yet no one knows exactly what caused this dramatic rise. Using a large and represen-tative dataset that spans the California birth cohorts from 1992 through 2000, we examineindividual and community resources associated with the likelihood of an autism diagnosisover time. This allows us to identify key social factors that have contributed to increasedautism prevalence. While individual-level factors, such as birth weight and parental educa-tion, have had a fairly constant effect on likelihood of diagnosis over time, we find that com-munity-level resources drive increased prevalence. This study suggests that neighborhoodsdynamically interact with the people living in them in different ways at different times toshape health outcomes. By treating neighborhoods as dynamic, we can better understandthe changing socioeconomic gradient of autism and the increase in prevalence.
Keywords
neighborhoods, health gradient, autism, socioeconomic status, inequality
Autism is a disorder characterized by impair-
ments in communication, social interaction,
and repetitive behaviors. Over the past 40
years, the measured prevalence of autism
has multiplied roughly 10-fold. While
progress has been made in understanding
some of the factors associated with increased
risk and rising prevalence, no one knows
with certainty what causes autism or what
caused autism prevalence to rise so precipi-
tously. There is, however, a growing aware-
ness among scholars that focusing solely on
individual risk factors such as exposure toxi-
cants, prenatal complications, or parental
education is insufficient to explain why
autism prevalence rates have increased so
stunningly. Social and institutional processes
likely play an important role. For example,
changes in diagnostic criteria and an influx
of resources dedicated to autism diagnosis
may be critical to understanding why preva-
lence rates have risen. Increased awareness
and social influence have been implicated
in the rise of autism and a variety of compa-
rable disorders, where social processes
mimic the effects of contagion (Christakis
and Fowler 2007; Liu, King, and Bearman
2010; Pescosolido and Levy 2002). Studies
aYale UniversitybColumbia University
Corresponding Author:Peter Bearman, Paul F. Lazarsfeld Center for the
Social Sciences, CB3355, Columbia University,
New York, NY 10027
E-mail: [email protected]
American Sociological Review76(2) 320–346� American SociologicalAssociation 2011DOI: 10.1177/0003122411399389http://asr.sagepub.com
have examined the contribution of changes in
diagnostic criteria and diagnostic substitution
to rising autism prevalence rates, but the
importance of institutional factors, resources
for diagnosis, and greater awareness have not
been systematically assessed. The sociological
literature on health and inequality, however,
provides substantial motivation for exploring
how individual- and community-level effects
operate to shape the likelihood of an autism
diagnosis.
This article examines why autism preva-
lence has increased in the aggregate by
exploring why autism prevalence has histori-
cally been uneven across different communi-
ties. Three processes could explain these
phenomena, both the unevenness and the
increase. First, the risk associated with a spe-
cific factor could increase over time. If this
were the case, the size of the population at
risk would remain constant but an increase
in risk would drive the increase in prevalence.
Second, risk factors could contribute to
increased prevalence by becoming more prev-
alent in the population. Third, the characteris-
tics of places could drive the rate of autism
diagnoses. Put another way, otherwise similar
children living in different areas could be at
significantly different risk for autism, not
because of their own characteristics, but
because of the characteristics of the communi-
ties in which they reside. If sociologically
salient community characteristics matter for
autism diagnosis, we should observe a strong
temporal patterning of risk at the community
level, such that increases and decreases in
risk associated with community characteristics
map onto changing prevalence rates. In this
article, we use a large geographically and tem-
porally sensitive multilevel data structure to
understand dynamics underlying the increased
prevalence of autism by examining changes in
patterns of risk over nine birth cohorts.
This study makes two contributions to the
empirical literature on autism by providing
the first multilevel analysis of risk factors
for autism and by identifying critical social
factors that map onto changes in prevalence
rates. In doing so, we present a more
dynamic framework for understanding the
way in which individual and neighborhood
characteristics interact over time to shape
health outcomes. The majority of studies
that examine how neighborhoods and institu-
tions shape inequalities in health are static
(Diez Roux and Mair 2010; Freese and Lut-
fey forthcoming; Sharkey 2008). Here, we
demonstrate that communities and institu-
tions do not passively exert the same influ-
ence over time; rather, neighborhoods have
different effects on different individuals and
different effects at different moments in the
autism epidemic. Paying closer attention to
temporality when trying to understand health
inequalities can provide important insight
into factors that may mitigate or exacerbate
the relationship between socioeconomic sta-
tus and health outcomes. By showing that
the socioeconomic gradient for autism
changed in the course of a decade, this
work suggests that socioeconomic health gra-
dients can and do change.
Socioeconomic Status,
Fundamental Cause, and Health
Gradients
It is a sociological truism that social status
affects one’s life chances, including one’s
health. The more resources people have, the
less likely they are to experience disease or
early mortality. This generates the negative
socioeconomic (SES) health gradients that
have been identified for a broad array of
conditions ranging from infant mortality to
heart disease (Pamuk et al. 1998). The per-
sistence of health gradients across time
and in different contexts has given rise to
the idea that SES status itself is a fundamen-
tal cause of health (Link et al. 1998; Link
and Phelan 1995). Within this framework,
gradients are thought to be robust because
they operate through a multitude of
micro-mechanisms (Link and Phelan 2002;
Lutfey and Freese 2005), such that if access
King and Bearman 321
to one health resource becomes saturated or
blocked, numerous other pathways are
available through which the SES health gra-
dient can be expressed. Health gradients are
believed to arise and persist because actors
with more resources can devote more of
those resources to their health. When tech-
nological and medical advances create
opportunities for better health, educated
and wealthy individuals are disproportion-
ately able to exploit those opportunities.
Therefore, much of fundamental cause the-
ory relies on purposive agents’ use of
resources (Freese and Lutfey forthcoming).
Progress in understanding how health dis-
parities can change has been stymied by an
incomplete conceptualization of the mecha-
nisms by which social and environmental
contexts shape health outcomes and how
these can change over time. With regard to
the fundamental cause literature, the bulk of
attention has been devoted to theorizing
about how and why health gradients should
endure. Relatively little attention has been
given to empirically assessing whether, and
under what conditions, health gradients can
change. However, the advent and diffusion
of new technologies has transformed socio-
economic gradients for cholesterol (Chang
and Lauderdale 2009) and cancer screening
(Link et al. 1998). Autism is a particularly
important case in this regard because there
has not been a technological innovation in
the autism realm akin to cholesterol lowering
statins or cancer identifying mammograms.1
Autism diagnoses have always been based
solely on presentation. Because technological
change has had no impact, if we identify
changes in the autism gradient, broader
social processes are likely implicated.
Socioeconomic Status,
Neighborhoods, and Health
Gradients
It is well established that where people live
has an important effect on their health.
Neighborhood context, independent of the
individuals composing the neighborhood, is
associated with all-cause mortality and
a host of negative health outcomes (Kawachi
and Berkman 2003).2 Neighborhoods can
influence health, independent of the individ-
uals who compose them, through the physical
environment, the social environment, and by
structuring access to medical care and serv-
ices (Adler and Newman 2002; Roberts
1997). The physical environment can affect
health directly and indirectly. Directly, it
can expose residents to toxicants. Indirectly,
it can structure opportunities to engage in
healthy behaviors, for instance by providing
access to parks and playgrounds (for a review,
see Kaczynski and Henderson 2008). Studies
exploring how the social environment may
affect health outcomes have examined fac-
tors such as a lack of social cohesion or dis-
organization, which tend to increase stress
and isolation, thereby adversely impacting
inhabitants’ health and well-being (Sampson,
Morenoff, and Gannon-Rowley 2002). Aside
from stress-mediated mechanisms, networks
can influence health outcomes by shaping
how individuals identify and treat (or do
not treat) health problems (Pescosolido
1992). By structuring opportunities for social
interaction through architecture or the quality
of their institutions, neighborhoods can affect
health outcomes through network-based
mechanisms. Finally, neighborhoods provide
differential access to health-related services,
such as sanitation, hospitals, and primary-
care providers (Matteson, Burr, and Marshall
1998).
To date, research examining the role of
neighborhoods and social context in shaping
health outcomes has been largely static and
devoid of adequate mechanisms. Yet, neigh-
borhoods and institutions can interact with,
exacerbate, and mitigate the relationship
between individual SES and health over
time (Auchincloss and Diez Roux 2009;
Freese and Lutfey forthcoming). Inert con-
ceptualizations of the role of neighborhoods
are not confined to studies of health
322 American Sociological Review 76(2)
outcomes, but pose a problem for under-
standing stratification processes more
generally (Sharkey 2008). While a few lon-
gitudinal studies examine how individual
health outcomes are shaped by neighbor-
hoods over the life course (Carson et al.
2007; Pollitt et al. 2008), little research ana-
lyzes how neighborhoods themselves may
have different effects over time. This study
contributes to efforts to address this short-
coming in the literature by allowing the
effects of neighborhoods to vary across
cohorts. By dynamically conceptualizing
how neighborhoods shape health outcomes
and tracking them over time and space, we
gain insight into the changing socioeco-
nomic gradient for autism and rising autism
prevalence rates.
Roadblocks and a Roadmap
It follows that combining insights from per-
spectives emphasizing the role of individual
resources in inducing health inequalities
with a dynamic conceptualization of the
way that neighborhoods influence health out-
comes increases our ability to understand
how gradients arise, persist, and change.
We examine how the socioeconomic gradient
for autism changes over time. We then turn
to the mechanisms that might account for
the gradient. Rather than focusing on tech-
nology, we examine differences in the
expression of SES across the autism spec-
trum.3 If ascertainment accounts for the
autism gradient, a positive SES gradient
should be strongest for less severe cases.
This follows from the idea that less severe
cases are harder to identify and diagnose,
because the symptoms on which a diagnosis
is based are less prominent. Because a dispro-
portionate share of the increased caseload in
California arises from the high-functioning
tail of the distribution (Liu, King, and
Bearman 2010), a stronger SES effect for
less severe cases, which have disproportion-
ately contributed to the increase, would allow
us to link changing patterns of identification
and treatment to rising prevalence rates. We
discover that over the course of a decade,
a positive SES gradient for autism appears
and then begins to reverse, a transformation
driven by changing patterns of identification
and treatment. Before we take these
steps, however, we first consider what we
know—and do not know—about the causes
of rising autism prevalence.
AN INTRODUCTION TO THEDETERMINANTS OF AUTISM
Despite a growing body of research, the eti-
ology of autism remains unknown and highly
uncertain. At the biological level, studies
examining parental, prenatal, perinatal, and
obstetric risk factors have identified a host
of conditions associated with an increased
risk of autism. Prenatal and perinatal factors
associated with an increased risk of autism
include parental age (King et al. 2009), low
birth weight (Eaton et al. 2001), low Apgar
score (Eaton et al. 2001), fetal distress
(Glasson et al. 2004), multiple births (Croen,
Grether, and Selvin 2002), small for gesta-
tional age (Hultman and Sparen 2004; Lars-
son et al. 2005), and birth order (Durkin
et al. 2008). However, there is considerable
inconsistency across studies, casting doubt
on which of these factors are truly associated
with increased autism risk (for a review, see
Kolevzon, Gross, and Reichenberg 2007).
Autism surely has a genetic component,
although how important it is remains unclear.
On one hand, the largest twin study to date
estimates a concordance rate of 47.5 (95 per-
cent CI: 41.6–53.4), so there is indirect evi-
dence of substantial heritability (Liu, Zeruba-
vel, and Bearman 2010). On the other hand,
molecular genetic research has not yet identi-
fied genetic causes for the vast majority (85
to 98 percent) of all autism cases (Abrahams
and Geschwin 2008).
Environmental toxicants have also been
highlighted as a potential cause. Currently,
King and Bearman 323
five chemicals are known to cause neuro-
developmental disorders, including autism.
Additionally, another 200 chemicals are
known to have neuro-toxic effects in adults
(Grandjean and Landrigan 2006). Thus, there
is strong reason to believe that chemical
exposure might be implicated in the autism
epidemic. However, empirical studies inves-
tigating the role of environmental toxicants
have been limited, and the two ecological
studies that do exist (Palmer et al. 2005;
Windham et al. 2006) cannot causally disen-
tangle aggregated and individual exposures
or directly assess exposure.4
Turning to potential social sources of the
epidemic, autism is difficult to diagnose
because there are no known biological
markers and the symptoms are hard to
assess, especially among persons with cog-
nitive impairments. Diagnoses are based
solely on clinical presentation and parental
interviews. This fact has led some scholars
to suggest that diagnostic substitution plays
a significant role in the increasing preva-
lence of autism (Shattuck 2006; Wing and
Potter 2002). Evidence in support of the
diagnostic substitution hypothesis arises
from a few recent studies that show
increased autism rates accompanied by con-
current declines in the prevalence of mental
retardation and other developmental disabil-
ities (Bishop et al. 2008; Coo et al. 2008;
Shattuck 2006).
Independent of diagnostic substitution,
some scholars argue that changes in diagnos-
tic practices lie behind the increased preva-
lence of autism. Of course, these scholars
note that changing diagnostic practices and
procedures accompany and are implicated
in a process of diagnostic substitution. Since
Kanner first described autism in 1943, diag-
nostic standards, practices, and procedures
have changed considerably (Fombonne
2001). Research shows that changes in diag-
nostic criteria prompt changes in diagnostic
status, specifically from a sole diagnosis of
MR to a diagnosis of autism-MR (King and
Bearman 2009). Drawing on a dataset of
persons diagnosed with autism in California,
King and Bearman estimate that diagnostic
accretion and substitution may account for
close to one-quarter of the increase in the
California caseload. Hence, there is some
evidence that changes in diagnostic standards
and diagnostic substitution are driving some
component of the observed increase in
autism prevalence.
Scholars have also investigated parental
social characteristics, such as socioeconomic
status, education, and occupation for possible
correlations with autism. This literature is
largely inconclusive (Croen, Grether, and
Selvin 2002; Larsson et al. 2005; Palmer
et al. 2005). Early studies identified consis-
tent associations between parental education
or socioeconomic status and autism (Finegan
and Quarrington 1979), while more current
studies tend to find little to no association
between parental education, income, or
wealth and autism (Larsson et al. 2005).
However, a recent study by Durkin and col-
leagues (2010) using area-based measures
of socioeconomic status found that preva-
lence of autism increased with SES in
a dose-response manner.
Resources may matter because obtaining
an autism diagnosis can be extremely
difficult. In obtaining a diagnosis and
services for their children, parents often
confront a dizzying institutional maze and
spend considerable resources navigating
through it. Some communities do not
have qualified diagnosticians. Accordingly,
community resources—including screening
resources, service availability, educational
spending levels, the number of school-based
health centers, and the number of pediatri-
cians in a community—have been tied to
autism (Barbaresi et al. 2005; Mandell and
Palmer 2005; Palmer et al. 2005). As with
studies of potential environmental toxicity,
the absence of a multilevel design makes it
impossible to disentangle whether commu-
nity resources have an independent effect
or are acting as proxies for aggregated
individual-level effects.
324 American Sociological Review 76(2)
The growth in attention and resources
devoted to autism has been almost as
astounding as the rising prevalence rates.
Autism was the first specific disorder to
have a Senate hearing focused exclusively
on it (Insel 2007). Between 1997 and 2006,
funding for autism research by the National
Institutes of Health increased five-fold from
$22 million to $108 million (Singh et al.
2009). The Centers for Disease Control and
Prevention’s funding of autism activities
increased from $2.1 million in 2000 to about
$16.7 million in 2005 (Government Account-
ability Office 2006). And an additional $1
billion was committed to autism with the
signing of the Combating Autism Act in
2006. The increase in resources devoted to
autism research and treatment has far out-
paced increasing prevalence rates. Between
1994 and 2004 in California, expenditures
by the Department of Developmental Serv-
ices (DDS), the agency responsible for serv-
ing persons with developmental disabilities
in California, increased 160 percent. During
the same period, the agency’s caseload
increased by 61 percent (DDS 2007). In Cal-
ifornia, as in the rest of the country, there has
been a dramatic increase in resources avail-
able to screen for and to treat autism.
What effect, if any, this influx of resour-
ces has had on prevalence rates remains
unknown. More basic questions about the
importance of parental and community
resources for autism diagnoses remain unan-
swered. The literature continues to debate
whether autism has a socioeconomic gradi-
ent. Accordingly, whether infusions of
resources into communities to diagnose and
treat autism have coincided with changes in
the autism gradient and how, if at all, this
may relate to prevalence rates present an
important unsolved puzzle.
DATA AND METHODS
To make progress in answering these ques-
tions, we need to work with population-based
data that allow us to simultaneously model
individual and social contextual factors over
time. This study examines birth and diagnos-
tic records for all children born in California
between 1992 and 2000. We analyzed
4,906,926 birth records from this period. Of
these, we could match 18,731 to children
with a diagnosis of autism. To identify
autism cases, we combined birth records
obtained from the California Birth Master
Files and the California Department of
Developmental Services. The DDS coordi-
nates diagnoses, services, and support for
persons with developmental disabilities liv-
ing in California. The agency provides
services to patients with autistic disorder
(ICD-9-CM code 299.0).
Our goal is to estimate a series of multi-
level models examining the association
between individual- and community-level
SES measures and the probability of an
autism diagnosis across consecutive birth
cohorts. The analysis begins with the birth
cohort of 1992, the first year the DDS began
maintaining electronic records. To ensure
that all children had ample time for case
ascertainment, the analyses end with the birth
cohort of 2000. All children were followed
from the time of birth until June 2006. We
allowed differential ascertainment times
because the age of diagnosis for autism has
been consistently falling, from a mean of
5.9 years (6 2.9) among the 1992 birth
cohort to 3.8 years (6 .9) for the birth cohort
of 2000.5
Individual-Level Variables
To obtain demographic, prenatal, and perina-
tal information for persons with and without
autism, we electronically linked records from
the DDS and Birth Master Files using proba-
bilistic and deterministic matching algo-
rithms developed by Campbell (2004).
Matches were made based on first, middle,
and last name; date of birth; race; zip code
at birth; and sex. We manually reviewed
King and Bearman 325
uncertain matches. On average, 81 percent of
DDS files were linked to birth records. The
linkage rate increased over time from 79 per-
cent (1992) to 86 percent (2000).6
We extracted data on parental education
and whether a child’s birth was paid for
with Medi-Cal (California’s Medicaid pro-
gram) from the matched files. These varia-
bles serve as proxies for socioeconomic sta-
tus. Roughly 40 percent of births in
California are paid for with Medi-Cal, so
the program serves a considerable portion
of the population. Data on paternal education
was missing for approximately 8 percent of
birth records. Maternal education was rarely
missing. To avoid potential biases arising
from missing data, we used the maximum
education level of either parent as the child’s
parental education. To assess whether having
missing data on the father has any association
with risk of autism, we included a dummy
variable for missing paternal information.
From the birth certificates, we also
obtained the following variables: birth
weight, parental age, duration of gestation,
whether the child was admitted to the neona-
tal intensive care unit (NICU), and parity.
We calculated parental age similarly to
parental education to avoid problems arising
from missing data. We examined birth
weight categorically, with birth weight
greater than or equal to 2,500 grams consid-
ered normal. Gestational age of fewer than
35 weeks was considered pre-term. If a new-
born had a normal birth weight and gesta-
tional age but was admitted to the NICU,
the baby likely had poor presentation at birth.
When these conditions were met, we
recorded ‘‘low Apgar proxy’’ as 1, otherwise
zero. We used parity to generate a dummy
variable for first live birth.
Community-Level Data
The birth data files contain the zip code for
residence at birth, which makes it possible
to nest individuals within the communities
in which they were born. California had
1,620 zip codes in 1992, this rose to 1,677
numerical zip codes in 2000. We eliminated
zip codes with fewer than 10 births per
year because neighborhood estimates based
on small numbers of residents may be unreli-
able.7 To examine the importance of commu-
nity resources for autism diagnoses, we con-
structed five community-level variables
using zip codes as the unit of analysis. (See
Table A1 in the Appendix for a more detailed
list.) From the 1990 and 2000 Censuses, we
extracted the median property value of the
zip code (logged) and the educational attain-
ment for persons over 25 years. We catego-
rized educational attainment as the percent
of persons in the zip code with a college
degree or higher. We used linear interpola-
tion to obtain data for intermediate years.
Average property value and educational
attainment correlate at r \ .35; it is thus
unlikely that problems arise from
multicollinearity.
To test for other community factors that
might influence the likelihood of an autism
diagnosis, we aggregated data on the number
of autism advocacy organizations, the num-
ber of pediatricians, and the number of child
psychiatrists operating in a zip code at the
time of the cohort’s birth. To obtain data on
the number of autism advocacy organiza-
tions, we searched Guidestar’s tax records
for all organizations that identified ‘‘autism’’
as their primary code under the National Tax-
onomy of Exempt Entities. Research organi-
zations have a different classificatory status.
To identify less formal organizations, which
may not request 501(c)3 status, we conducted
exhaustive Internet searches. For organiza-
tions with local chapters, we recorded each
chapter as its own entity. For each organiza-
tion, we recorded a founding date, a dissolu-
tion date if applicable, and an address. We
obtained data on the number of pediatricians
and child psychologists in a zip code from
Medical Marketing Services, who license
data from the American Medical Associa-
tion. We measured all variables at the time
326 American Sociological Review 76(2)
of a cohort’s birth to mitigate problems aris-
ing from endogeneity.
Severity
To compare how risk is shaped by severity at
first diagnosis, we constructed severity meas-
ures using social and communication scores
that are contained within the DDS’s Client
Development and Evaluation Report. We
additively converted nine items into an
index, with each item equally weighted:
peer interaction, non-peer interaction, friend-
ship formation and maintenance, participa-
tion in social activities, unacceptable social
behaviors, word usage, receptive language,
and expressive language.8 Cronbach’s alpha
for these items exceeds .75. Severe cases
are those above the mean evaluation score,
less severe cases are those below the mean.
The distribution of severity scores is fairly
symmetrical. Accordingly, the number of
severe and less severe cases is roughly equal.
The severity score is the score at time of
entry into the DDS. Because a person enter-
ing the DDS at age 3 years will have a lower
score than someone entering at age 5 years—
all else being equal, 5-year-olds are more
developed than 3-years-olds—we mean-cen-
tered severity scores by birth year and age
at entry.
Multilevel Analysis
To simultaneously consider the association
between individual- and community-level
factors over time, we ran a multilevel model
for each birth cohort in HLM 6 (Raudenbush,
Bryk, and Congdon 2004). The dependent
variable in the logistic regression is whether
a child received an autism diagnosis.
Multilevel models take into account the hier-
archical nature of the social world. Here we
consider individuals nested within neighbor-
hoods, captured by zip code. All of the
individual-level variables are grand mean
centered, except parental education, which
is group mean centered because there is sys-
tematic variation in the mean parental educa-
tional level across zip codes. All level-two,
or community, variables are grand mean cen-
tered. We include two cross-level interac-
tions to understand how the risk associated
with an individual-level variable varies
depending on the nature of the characteristics
of the community in which the individual
lives. We examine how the association
between parental education and autism varies
depending on the percent of college gradu-
ates in the community, as well as how the
effect of being a Medi-Cal beneficiary on
autism varies depending on the median prop-
erty value in a community. In summary, the
modeling strategy allows us to examine
how individual- and community-level risk
factors for autism vary across time and with
each other. The multilevel models use an
unstructured covariance matrix. Because an
unstructured covariance matrix does not
impose any constraints and we have suffi-
cient statistical power, this is the most con-
servative choice. We calculated predicted
probabilities of diagnosis from the models
in HLM. After reporting findings from anal-
yses by birth cohort, with an autism diagnosis
as the dependent variable, we then focus on
level of severity.
RESULTS
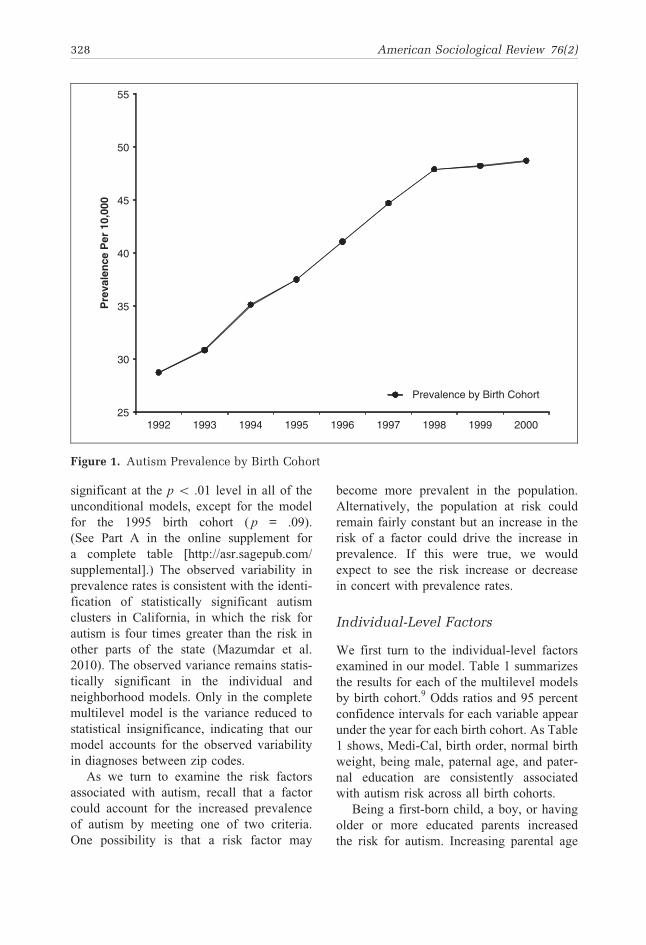
The prevalence of autism among the 1992
through 2000 California birth cohorts
increased considerably, from 29 per 10,000
in 1992 to 49 per 10,000 in 2000. Figure 1
shows this trend: rapid growth and then satu-
ration. Note that the x-axis reports birth
cohorts. Children born in 1992 are largely
diagnosed by 1998, whereas children born
in 2000 are largely diagnosed by 2005.
Just as there is significant variation in the
probability of diagnosis over time, we also
observe significant variability in the proba-
bility of diagnosis between zip codes. The
estimated variance of b0k, t00, is statistically
King and Bearman 327
significant at the p \ .01 level in all of the
unconditional models, except for the model
for the 1995 birth cohort ( p = .09).
(See Part A in the online supplement for
a complete table [http://asr.sagepub.com/
supplemental].) The observed variability in
prevalence rates is consistent with the identi-
fication of statistically significant autism
clusters in California, in which the risk for
autism is four times greater than the risk in
other parts of the state (Mazumdar et al.
2010). The observed variance remains statis-
tically significant in the individual and
neighborhood models. Only in the complete
multilevel model is the variance reduced to
statistical insignificance, indicating that our
model accounts for the observed variability
in diagnoses between zip codes.
As we turn to examine the risk factors
associated with autism, recall that a factor
could account for the increased prevalence
of autism by meeting one of two criteria.
One possibility is that a risk factor may
become more prevalent in the population.
Alternatively, the population at risk could
remain fairly constant but an increase in the
risk of a factor could drive the increase in
prevalence. If this were true, we would
expect to see the risk increase or decrease
in concert with prevalence rates.
Individual-Level Factors
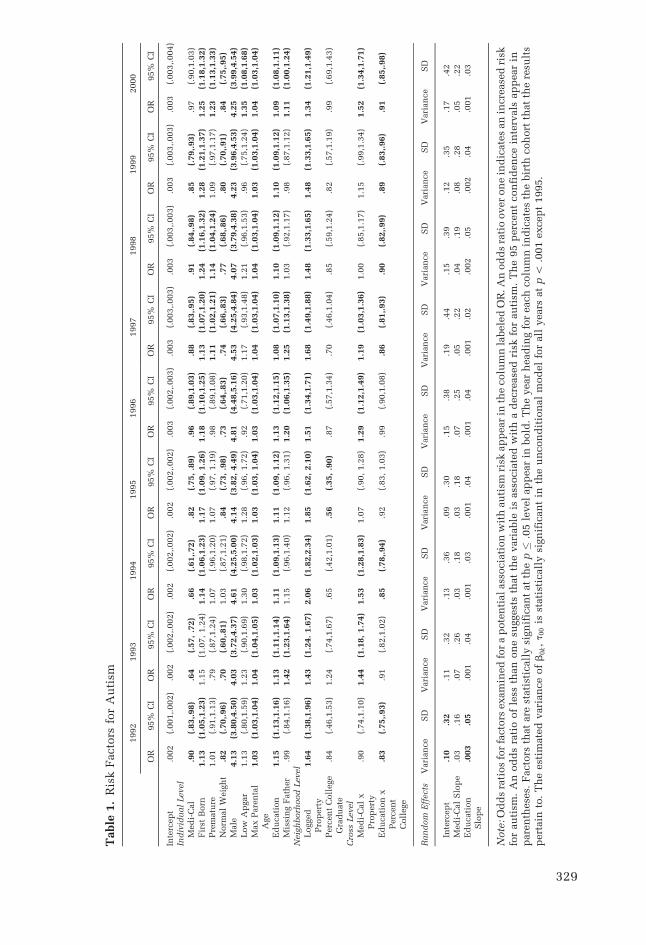
We first turn to the individual-level factors
examined in our model. Table 1 summarizes
the results for each of the multilevel models
by birth cohort.9 Odds ratios and 95 percent
confidence intervals for each variable appear
under the year for each birth cohort. As Table
1 shows, Medi-Cal, birth order, normal birth
weight, being male, paternal age, and pater-
nal education are consistently associated
with autism risk across all birth cohorts.
Being a first-born child, a boy, or having
older or more educated parents increased
the risk for autism. Increasing parental age
25
30
35
40
45
50
55
1992 1993 1994 1995 1996 1997 1998 1999 2000
Pre
vale
nce
Per
10,
000
Prevalence by Birth Cohort
Figure 1. Autism Prevalence by Birth Cohort
328 American Sociological Review 76(2)
Table
1.
Ris
kF
acto
rsfo
rA
uti
sm
1992
1993
1994
1995
1996
1997
1998
1999
2000
OR
95%
CI
OR
95%
CI
OR
95%
CI
OR
95%
CI
OR
95%
CI
OR
95%
CI
OR
95%
CI
OR
95%
CI
OR
95%
CI
Inte
rcep
t.0
02
(.001,.
002)
.002
(.002,.
002)
.002
(.002,.
002)
.002
(.002,.
002)
.003
(.002,.
003)
.003
(.003,.
003)
.003
(.003,.
003)
.003
(.003,.
003)
.003
(.003,.
004)
Ind
ivid
ual
Level
Med
i-C
al
.90
(.83,.
98)
.64
(.57,
.72)
.66
(.61,.
72)
.82
(.75,
.89)
.96
(.89,1
.03)
.88
(.83,.
95)
.91
(.84,.
98)
.85
(.79,.
93)
.97
(.90,1
.03)
Fir
stB
orn
1.1
3(1
.05,1
.23)
1.1
5(1
.07,
1.2
4)
1.1
4(1
.06,1
.23)
1.1
7(1
.09,
1.2
6)
1.1
8(1
.10,1
.25)
1.1
3(1
.07,1
.20)
1.2
4(1
.16,1
.32)
1.2
8(1
.21,1
.37)
1.2
5(1
.18,1
.32)
Pre
matu
re1.0
1(.
91,1
.13)
.79
(.87,1
.24)
1.0
7(.
96,1
.20)
1.0
7(.
97,
1.1
9)
.98
(.89,1
.08)
1.1
1(1
.02,1
.21)
1.1
4(1
.04,1
.24)
1.0
9(.
97,1
.17)
1.2
3(1
.13,1
.33)
Norm
al
Weig
ht
.82
(.70,.
96)
.70
(.60,.
81)
1.0
3(.
87,1
.21)
.84
(.73,
.98)
.73
(.64,.
83)
.74
(.66,.
83)
.77
(.68,.
86)
.80
(.70,.
91)
.84
(.75,.
95)
Male
4.1
3(3
.80,4
.50)
4.0
3(3
.72,4
.37)
4.6
1(4
.25,5
.00)
4.1
4(3
.82,
4.4
9)
4.8
1(4
.48,5
.16)
4.5
3(4
.25,4
.84)
4.0
7(3
.79,4
.38)
4.2
3(3
.96,4
.53)
4.2
5(3
.99,4
.54)
Low
Ap
gar
1.1
3(.
80,1
.59)
1.2
3(.
90,1
.69)
1.3
0(.
98,1
.72)
1.2
8(.
96,
1.7
2)
.92
(.71,1
.20)
1.1
7(.
93,1
.48)
1.2
1(.
96,1
.53)
.96
(.75,1
.24)
1.3
5(1
.08,1
.68)
Max
Pare
nta
lA
ge
1.0
3(1
.03,1
.04)
1.0
4(1
.04,1
.05)
1.0
3(1
.02,1
.03)
1.0
3(1
.03,
1.0
4)
1.0
3(1
.03,1
.04)
1.0
4(1
.03,1
.04)
1.0
4(1
.03,1
.04)
1.0
3(1
.03,1
.04)
1.0
4(1
.03,1
.04)
Ed
ucati
on
1.1
5(1
.13,1
.16)
1.1
3(1
.11,1
.14)
1.1
1(1
.09,1
.13)
1.1
1(1
.09,
1.1
2)
1.1
3(1
.12,1
.15)
1.0
8(1
.07,1
.10)
1.1
0(1
.09,1
.12)
1.1
0(1
.09,1
.12)
1.0
9(1
.08,1
.11)
Mis
sin
gF
ath
er
.99
(.84,1
.16)
1.4
2(1
.23,1
.64)
1.1
5(.
96,1
.40)
1.1
2(.
96,
1.3
1)
1.2
0(1
.06,1
.35)
1.2
5(1
.13,1
.38)
1.0
3(.
92,1
.17)
.98
(.87,1
.12)
1.1
1(1
.00,1
.24)
Neig
hborh
ood
Level
Logged
Pro
pert
y1.6
4(1
.38,1
.96)
1.4
3(1
.24.
1.6
7)
2.0
6(1
.82,2
.34)
1.8
5(1
.62,
2.1
0)
1.5
1(1
.34,1
.71)
1.6
8(1
.49,1
.88)
1.4
8(1
.33,1
.65)
1.4
8(1
.33,1
.65)
1.3
4(1
.21,1
.49)
Perc
en
tC
oll
ege
Gra
du
ate
.84
(.46,1
.53)
1.2
4(.
74,1
.67)
.65
(.42,1
.01)
.56
(.35,
.90)
.87
(.57,1
.34)
.70
(.46,1
.04)
.85
(.59,1
.24)
.82
(.57,1
.19)
.99
(.69,1
.43)
Cro
ssLevel
Med
i-C
al
xP
rop
ert
y.9
0(.
74,1
.10)
1.4
4(1
.18,
1.7
4)
1.5
3(1
.28,1
.83)
1.0
7(.
90,
1.2
8)
1.2
9(1
.12,1
.49)
1.1
9(1
.03,1
.36)
1.0
0(.
85,1
.17)
1.1
5(.
99,1
.34)
1.5
2(1
.34,1
.71)
Ed
ucati
on
xP
erc
en
tC
oll
ege
.83
(.75,.
93)
.91
(.82,1
.02)
.85
(.78,.
94)
.92
(.83,
1.0
3)
.99
(.90,1
.08)
.86
(.81,.
93)
.90
(.82,.
99)
.89
(.83,.
96)
.91
(.85,.
98)
Ran
dom
Eff
ects
Vari
an
ce
SD
Vari
an
ce
SD
Vari
an
ce
SD
Vari
an
ce
SD
Vari
an
ce
SD
Vari
an
ce
SD
Vari
an
ce
SD
Vari
an
ce
SD
Vari
an
ce
SD
Inte
rcep
t.1
0.3
2.1
1.3
2.1
3.3
6.0
9.3
0.1
5.3
8.1
9.4
4.1
5.3
9.1
2.3
5.1
7.4
2M
ed
i-C
al
Slo
pe
.03
.16
.07
.26
.03
.18
.03
.18
.07
.25
.05
.22
.04
.19
.08
.28
.05
.22
Ed
ucati
on
Slo
pe
.003
.05
.001
.04
.001
.03
.001
.04
.001
.04
.001
.02
.002
.05
.002
.04
.001
.03
Note
:O
dd
sra
tios
for
facto
rsexam
ined
for
ap
ote
nti
al
ass
ocia
tion
wit
hau
tism
risk
ap
pear
inth
ecolu
mn
labele
dO
R.A
nod
ds
rati
oover
on
ein
dic
ate
san
incre
ase
dri
skfo
rau
tism
.A
nod
ds
rati
oof
less
than
on
esu
ggest
sth
at
the
vari
able
isass
ocia
ted
wit
ha
decre
ase
dri
skfo
rau
tism
.T
he
95
perc
en
tcon
fid
en
ce
inte
rvals
ap
pear
inp
are
nth
ese
s.F
acto
rsth
at
are
stati
stic
all
ysi
gn
ific
an
tat
the
p�
.05
level
ap
pear
inbold
.T
he
year
head
ing
for
each
colu
mn
ind
icate
sth
ebir
thcoh
ort
that
the
resu
lts
pert
ain
to.
Th
eest
imate
dvari
an
ce
of
b0k,
t 00
isst
ati
stic
all
ysi
gn
ific
an
tin
the
un
con
dit
ion
al
mod
el
for
all
years
at
p\
.001
excep
t1995.
329
may increase risk of autism as a result of the
increasing likelihood of de novo mutations
that occur with age (Liu, Zerubavel, and
Bearman 2010). Alternatively, parental age
could be an indirect proxy for elements of
socioeconomic status not captured by educa-
tion and property values, as parents of higher
SES tend to delay childbirth (Baldwin and
Nord 1984). Conversely, being on Medi-
Cal, our measure of income status, is associ-
ated with a decreased risk of an autism diag-
nosis. Being male is associated with a four-
fold greater risk of autism diagnosis. The
gender gap in autism prevalence (mirrored
in ADHD) remains unexplained (Baron-
Cohen, Knickmeyer, and Belmonte 2005).10
Birth weight in excess of 2,500 grams reduced
the likelihood of an autism diagnosis in the
majority of cohorts, suggesting that low birth
weight increases risk for autism. Premature
birth, in which the gestational age was fewer
than 35 weeks, is associated with increased
risk of autism in three out of nine years, reach-
ing statistical significance only in later years.
This could be due to the increased survival
rate among premature births. The consistent
birth-order effect indicates that first-born chil-
dren are at greater risk for autism. Possible
mechanisms to account for this finding
involve the concentration of fat-soluble chem-
icals in maternal milk and tissue, slower
development of immune systems due to fewer
exposures to infections, and the statistical
effect of parents who stop having children
after having a child with autism (Durkin
et al. 2008).
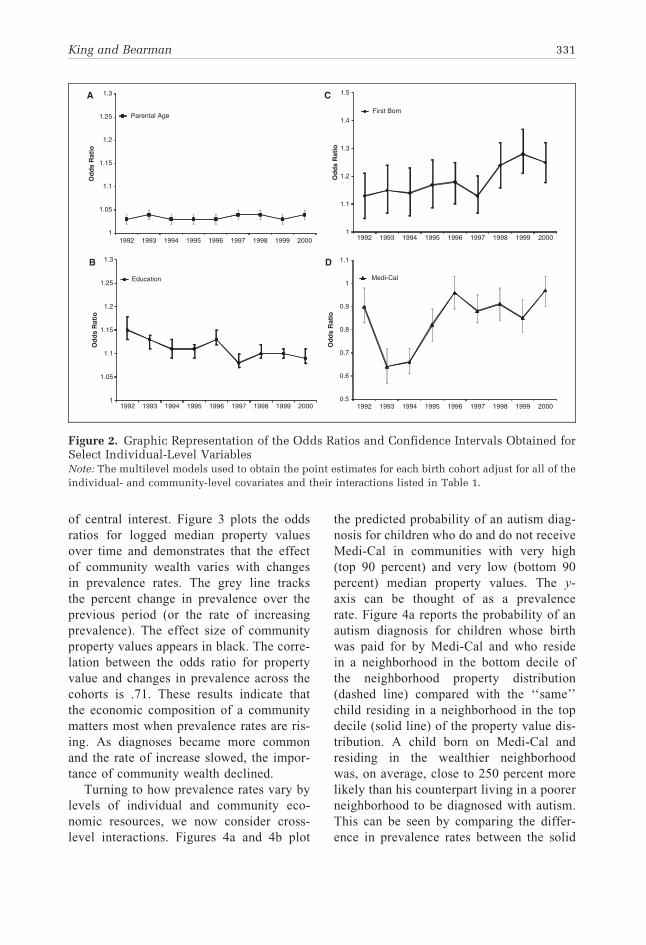
Turning to the temporal variability and peri-
odicity of individual risk factors, we observe
that the majority of individual-level factors
have a consistent effect size. As Figure 2 dem-
onstrates, the odds ratios for parental age are
largely invariant across birth cohorts, ranging
from 1.03 (95 percent CI: 1.03, 1.04) to 1.04
(95 percent CI: 1.03, 1.05). Parental education
is similarly stable, varying from a high of
1.15 (95 percent CI: 1.13, 1.16) to a low of
1.08 (1.07, 1.10). Recall that parental education
is group mean centered; therefore, odds ratios
represent the effect of parental education rela-
tive to the average level of parental education
within a child’s neighborhood. Having more
education relative to one’s neighbors is associ-
ated with an increased risk of autism diagnosis.
Only the effects of Medi-Cal reveal mean-
ingful periodicity. Among the birth cohorts of
1993 until 1995, Medi-Cal receipt reduced the
odds of an autism diagnosis by roughly 20 to
40 percent. Accordingly, autism had a positive
socioeconomic gradient. Individuals with
greater resources were more likely to receive
an autism diagnosis. Early in the epidemic,
individuals relying on Medi-Cal for health
care likely did not have the resources neces-
sary to acquire an autism diagnosis. Note
that the strength of the positive SES gradient
waned among later cohorts as diagnoses
became increasingly prevalent and knowledge
about the disorder diffused widely. By the
2000 birth cohort, the odds ratio for Medi-
Cal was .97 (.90, 1.03), suggesting that the
positive socioeconomic gradient was disap-
pearing. With the exception of Medi-Cal, the
individual-level variables in our model do
not exhibit periodicity in risk consistent with
changing prevalence rates.
Similarly, there is little variation in the
prevalence of any of the risk factors in the
population. While average parental age and
the proportion of births that were premature
or had poor presentation all increased, these
increases are not large enough to make
even a minimal contribution to increases in
autism prevalence. (See Table A1 in the
Appendix for a summary of demographic
changes across cohorts.) Accordingly, it is
unlikely that the increasing prevalence of
an individual-level risk factor in the popula-
tion accounts for the observed increase in
autism prevalence.
Neighborhood Wealth and Autism
The effect of community wealth on the
chance of acquiring an autism diagnosis is
330 American Sociological Review 76(2)
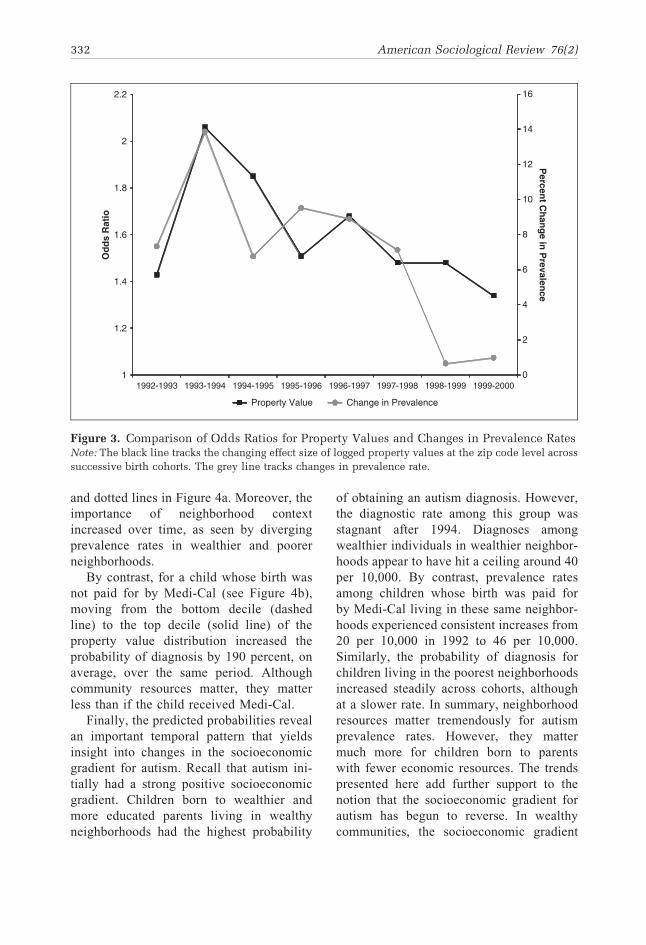
of central interest. Figure 3 plots the odds
ratios for logged median property values
over time and demonstrates that the effect
of community wealth varies with changes
in prevalence rates. The grey line tracks
the percent change in prevalence over the
previous period (or the rate of increasing
prevalence). The effect size of community
property values appears in black. The corre-
lation between the odds ratio for property
value and changes in prevalence across the
cohorts is .71. These results indicate that
the economic composition of a community
matters most when prevalence rates are ris-
ing. As diagnoses became more common
and the rate of increase slowed, the impor-
tance of community wealth declined.
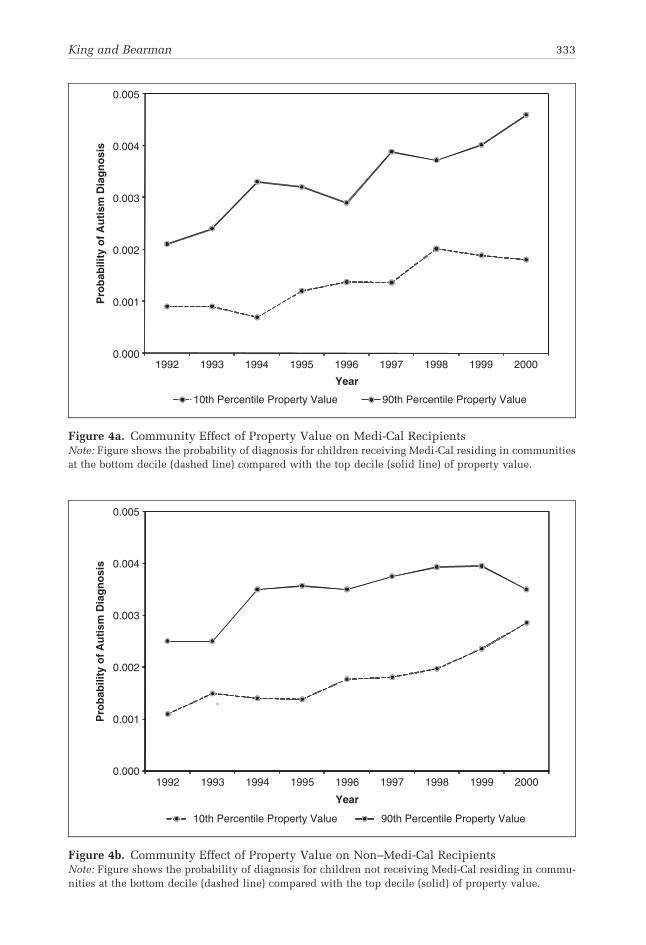
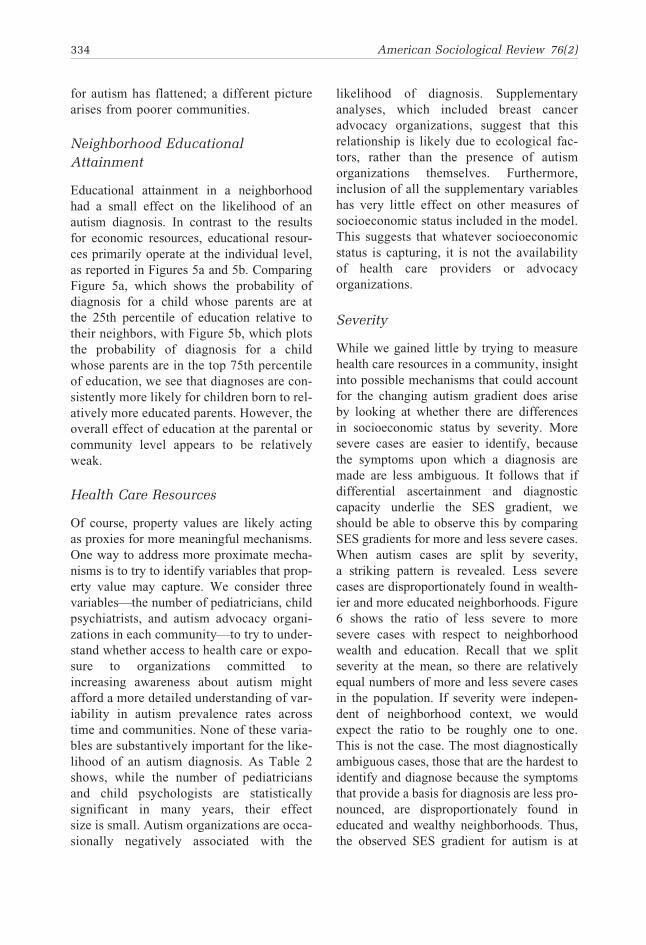
Turning to how prevalence rates vary by
levels of individual and community eco-
nomic resources, we now consider cross-
level interactions. Figures 4a and 4b plot
the predicted probability of an autism diag-
nosis for children who do and do not receive
Medi-Cal in communities with very high
(top 90 percent) and very low (bottom 90
percent) median property values. The y-
axis can be thought of as a prevalence
rate. Figure 4a reports the probability of an
autism diagnosis for children whose birth
was paid for by Medi-Cal and who reside
in a neighborhood in the bottom decile of
the neighborhood property distribution
(dashed line) compared with the ‘‘same’’
child residing in a neighborhood in the top
decile (solid line) of the property value dis-
tribution. A child born on Medi-Cal and
residing in the wealthier neighborhood
was, on average, close to 250 percent more
likely than his counterpart living in a poorer
neighborhood to be diagnosed with autism.
This can be seen by comparing the differ-
ence in prevalence rates between the solid
1
1.05
1.1
1.15
1.2
1.25
1.3
1992 1993 1994 1995 1996 1997 1998 1999 2000
Od
ds
Rat
io
Parental Age
1
1.05
1.1
1.15
1.2
1.25
1.3
1992 1993 1994 1995 1996 1997 1998 1999 2000
Od
ds
Rat
io
Education
0.5
0.6
0.7
0.8
0.9
1
1.1
1992 1993 1994 1995 1996 1997 1998 1999 2000
Od
ds
Rat
io
Medi-Cal
A
B
1
1.1
1.2
1.3
1.4
1.5
1992 1993 1994 1995 1996 1997 1998 1999 2000
Od
ds
Rat
io
First Born
C
D
Figure 2. Graphic Representation of the Odds Ratios and Confidence Intervals Obtained forSelect Individual-Level VariablesNote: The multilevel models used to obtain the point estimates for each birth cohort adjust for all of the
individual- and community-level covariates and their interactions listed in Table 1.
King and Bearman 331
and dotted lines in Figure 4a. Moreover, the
importance of neighborhood context
increased over time, as seen by diverging
prevalence rates in wealthier and poorer
neighborhoods.
By contrast, for a child whose birth was
not paid for by Medi-Cal (see Figure 4b),
moving from the bottom decile (dashed
line) to the top decile (solid line) of the
property value distribution increased the
probability of diagnosis by 190 percent, on
average, over the same period. Although
community resources matter, they matter
less than if the child received Medi-Cal.
Finally, the predicted probabilities reveal
an important temporal pattern that yields
insight into changes in the socioeconomic
gradient for autism. Recall that autism ini-
tially had a strong positive socioeconomic
gradient. Children born to wealthier and
more educated parents living in wealthy
neighborhoods had the highest probability
of obtaining an autism diagnosis. However,
the diagnostic rate among this group was
stagnant after 1994. Diagnoses among
wealthier individuals in wealthier neighbor-
hoods appear to have hit a ceiling around 40
per 10,000. By contrast, prevalence rates
among children whose birth was paid for
by Medi-Cal living in these same neighbor-
hoods experienced consistent increases from
20 per 10,000 in 1992 to 46 per 10,000.
Similarly, the probability of diagnosis for
children living in the poorest neighborhoods
increased steadily across cohorts, although
at a slower rate. In summary, neighborhood
resources matter tremendously for autism
prevalence rates. However, they matter
much more for children born to parents
with fewer economic resources. The trends
presented here add further support to the
notion that the socioeconomic gradient for
autism has begun to reverse. In wealthy
communities, the socioeconomic gradient
0
2
4
6
8
10
12
14
16
1
1.2
1.4
1.6
1.8
2
2.2P
ercent C
han
ge in
Prevalen
ceO
dd
s R
atio
Property Value Change in Prevalence
1999-20001998-19991997-19981996-19971995-19961994-19951993-19941992-1993
Figure 3. Comparison of Odds Ratios for Property Values and Changes in Prevalence RatesNote: The black line tracks the changing effect size of logged property values at the zip code level across
successive birth cohorts. The grey line tracks changes in prevalence rate.
332 American Sociological Review 76(2)
0.000
0.001
0.002
0.003
0.004
0.005
1992 1993 1994 1995 1996 1997 1998 1999 2000
Pro
bab
ility
of
Au
tism
Dia
gn
osi
s
Year
10th Percentile Property Value 90th Percentile Property Value
Figure 4b. Community Effect of Property Value on Non–Medi-Cal RecipientsNote: Figure shows the probability of diagnosis for children not receiving Medi-Cal residing in commu-
nities at the bottom decile (dashed line) compared with the top decile (solid) of property value.
0.000
0.001
0.002
0.003
0.004
0.005
1992 1993 1994 1995 1996 1997 1998 1999 2000
Pro
bab
ility
of
Au
tism
Dia
gn
osi
s
Year
10th Percentile Property Value 90th Percentile Property Value
Figure 4a. Community Effect of Property Value on Medi-Cal RecipientsNote: Figure shows the probability of diagnosis for children receiving Medi-Cal residing in communities
at the bottom decile (dashed line) compared with the top decile (solid line) of property value.
King and Bearman 333
for autism has flattened; a different picture
arises from poorer communities.
Neighborhood Educational
Attainment
Educational attainment in a neighborhood
had a small effect on the likelihood of an
autism diagnosis. In contrast to the results
for economic resources, educational resour-
ces primarily operate at the individual level,
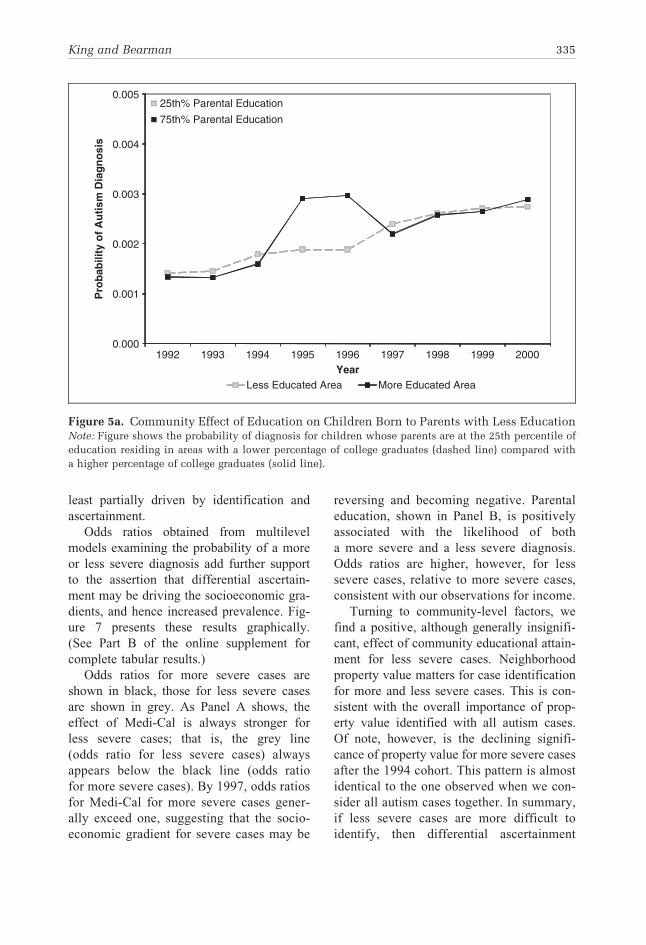
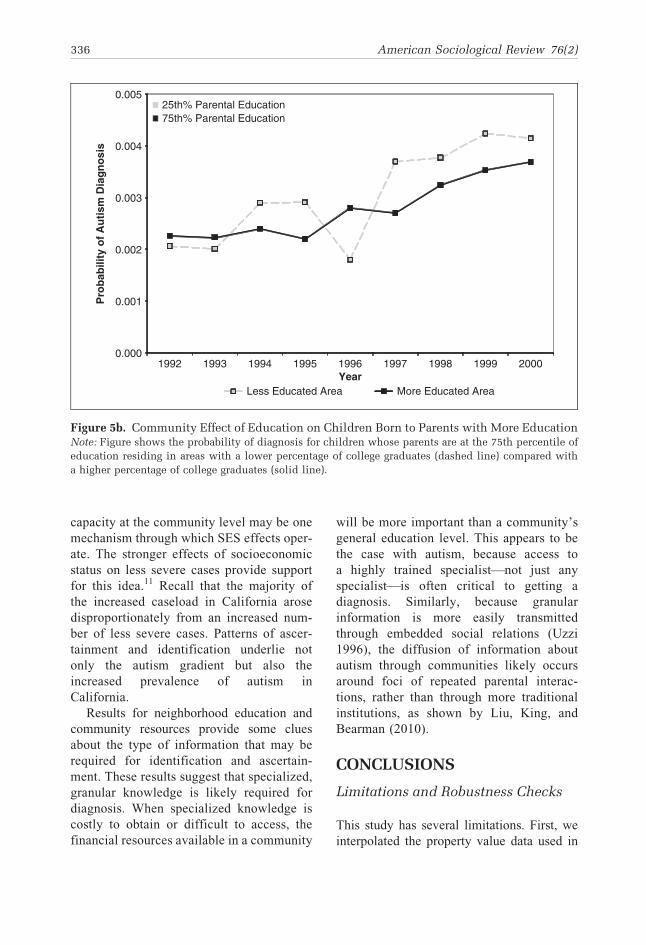
as reported in Figures 5a and 5b. Comparing
Figure 5a, which shows the probability of
diagnosis for a child whose parents are at
the 25th percentile of education relative to
their neighbors, with Figure 5b, which plots
the probability of diagnosis for a child
whose parents are in the top 75th percentile
of education, we see that diagnoses are con-
sistently more likely for children born to rel-
atively more educated parents. However, the
overall effect of education at the parental or
community level appears to be relatively
weak.
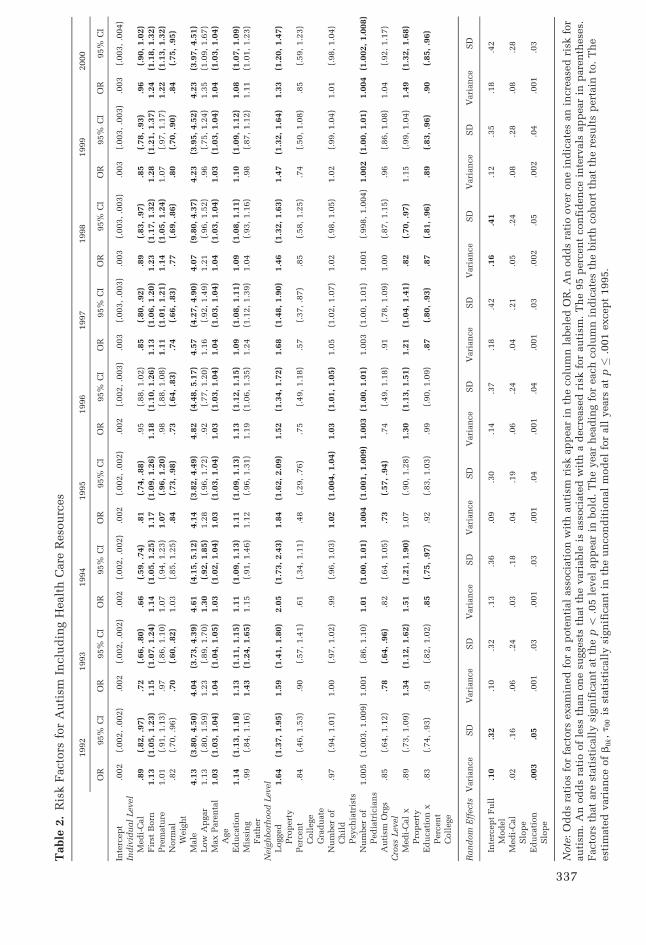
Health Care Resources
Of course, property values are likely acting
as proxies for more meaningful mechanisms.
One way to address more proximate mecha-
nisms is to try to identify variables that prop-
erty value may capture. We consider three
variables—the number of pediatricians, child
psychiatrists, and autism advocacy organi-
zations in each community—to try to under-
stand whether access to health care or expo-
sure to organizations committed to
increasing awareness about autism might
afford a more detailed understanding of var-
iability in autism prevalence rates across
time and communities. None of these varia-
bles are substantively important for the like-
lihood of an autism diagnosis. As Table 2
shows, while the number of pediatricians
and child psychologists are statistically
significant in many years, their effect
size is small. Autism organizations are occa-
sionally negatively associated with the
likelihood of diagnosis. Supplementary
analyses, which included breast cancer
advocacy organizations, suggest that this
relationship is likely due to ecological fac-
tors, rather than the presence of autism
organizations themselves. Furthermore,
inclusion of all the supplementary variables
has very little effect on other measures of
socioeconomic status included in the model.
This suggests that whatever socioeconomic
status is capturing, it is not the availability
of health care providers or advocacy
organizations.
Severity
While we gained little by trying to measure
health care resources in a community, insight
into possible mechanisms that could account
for the changing autism gradient does arise
by looking at whether there are differences
in socioeconomic status by severity. More
severe cases are easier to identify, because
the symptoms upon which a diagnosis are
made are less ambiguous. It follows that if
differential ascertainment and diagnostic
capacity underlie the SES gradient, we
should be able to observe this by comparing
SES gradients for more and less severe cases.
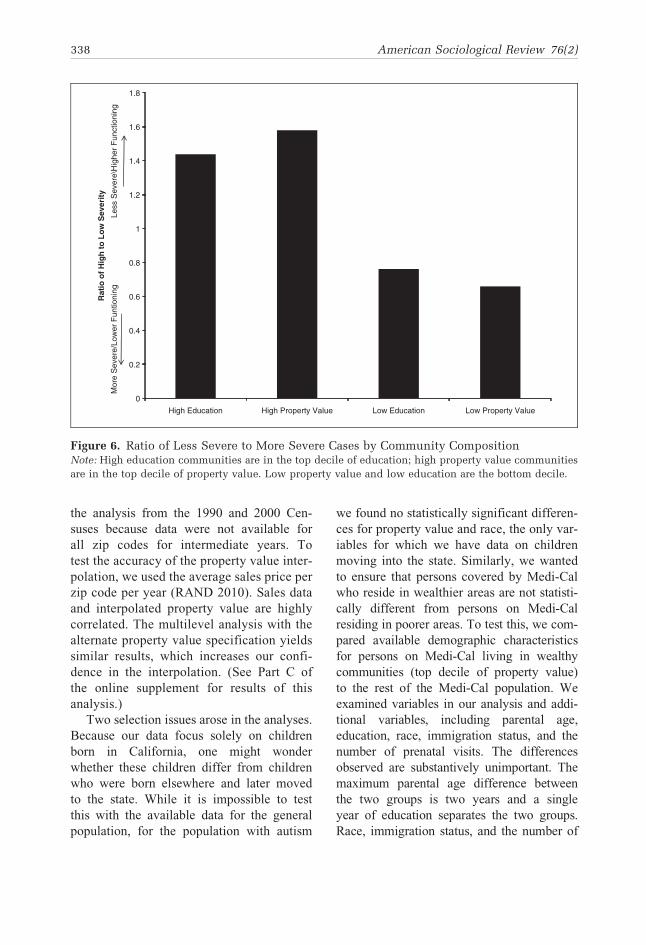
When autism cases are split by severity,
a striking pattern is revealed. Less severe
cases are disproportionately found in wealth-
ier and more educated neighborhoods. Figure
6 shows the ratio of less severe to more
severe cases with respect to neighborhood
wealth and education. Recall that we split
severity at the mean, so there are relatively
equal numbers of more and less severe cases
in the population. If severity were indepen-
dent of neighborhood context, we would
expect the ratio to be roughly one to one.
This is not the case. The most diagnostically
ambiguous cases, those that are the hardest to
identify and diagnose because the symptoms
that provide a basis for diagnosis are less pro-
nounced, are disproportionately found in
educated and wealthy neighborhoods. Thus,
the observed SES gradient for autism is at
334 American Sociological Review 76(2)
least partially driven by identification and
ascertainment.
Odds ratios obtained from multilevel
models examining the probability of a more
or less severe diagnosis add further support
to the assertion that differential ascertain-
ment may be driving the socioeconomic gra-
dients, and hence increased prevalence. Fig-
ure 7 presents these results graphically.
(See Part B of the online supplement for
complete tabular results.)
Odds ratios for more severe cases are
shown in black, those for less severe cases
are shown in grey. As Panel A shows, the
effect of Medi-Cal is always stronger for
less severe cases; that is, the grey line
(odds ratio for less severe cases) always
appears below the black line (odds ratio
for more severe cases). By 1997, odds ratios
for Medi-Cal for more severe cases gener-
ally exceed one, suggesting that the socio-
economic gradient for severe cases may be
reversing and becoming negative. Parental
education, shown in Panel B, is positively
associated with the likelihood of both
a more severe and a less severe diagnosis.
Odds ratios are higher, however, for less
severe cases, relative to more severe cases,
consistent with our observations for income.
Turning to community-level factors, we
find a positive, although generally insignifi-
cant, effect of community educational attain-
ment for less severe cases. Neighborhood
property value matters for case identification
for more and less severe cases. This is con-
sistent with the overall importance of prop-
erty value identified with all autism cases.
Of note, however, is the declining signifi-
cance of property value for more severe cases
after the 1994 cohort. This pattern is almost
identical to the one observed when we con-
sider all autism cases together. In summary,
if less severe cases are more difficult to
identify, then differential ascertainment
0.000
0.001
0.002
0.003
0.004
0.005
1992 1993 1994 1995 1996 1997 1998 1999 2000
Pro
bab
ility
of
Au
tism
Dia
gn
osi
s
YearLess Educated Area More Educated Area
25th% Parental Education
75th% Parental Education
Figure 5a. Community Effect of Education on Children Born to Parents with Less EducationNote: Figure shows the probability of diagnosis for children whose parents are at the 25th percentile of
education residing in areas with a lower percentage of college graduates (dashed line) compared with
a higher percentage of college graduates (solid line).
King and Bearman 335
capacity at the community level may be one
mechanism through which SES effects oper-
ate. The stronger effects of socioeconomic
status on less severe cases provide support
for this idea.11 Recall that the majority of
the increased caseload in California arose
disproportionately from an increased num-
ber of less severe cases. Patterns of ascer-
tainment and identification underlie not
only the autism gradient but also the
increased prevalence of autism in
California.
Results for neighborhood education and
community resources provide some clues
about the type of information that may be
required for identification and ascertain-
ment. These results suggest that specialized,
granular knowledge is likely required for
diagnosis. When specialized knowledge is
costly to obtain or difficult to access, the
financial resources available in a community
will be more important than a community’s
general education level. This appears to be
the case with autism, because access to
a highly trained specialist—not just any
specialist—is often critical to getting a
diagnosis. Similarly, because granular
information is more easily transmitted
through embedded social relations (Uzzi
1996), the diffusion of information about
autism through communities likely occurs
around foci of repeated parental interac-
tions, rather than through more traditional
institutions, as shown by Liu, King, and
Bearman (2010).
CONCLUSIONS
Limitations and Robustness Checks
This study has several limitations. First, we
interpolated the property value data used in
0.000
0.001
0.002
0.003
0.004
0.005
1992 1993 1994 1995 1996 1997 1998 1999 2000
Pro
bab
ility
of
Au
tism
Dia
gn
osi
s
YearLess Educated Area More Educated Area
25th% Parental Education75th% Parental Education
Figure 5b. Community Effect of Education on Children Born to Parents with More EducationNote: Figure shows the probability of diagnosis for children whose parents are at the 75th percentile of
education residing in areas with a lower percentage of college graduates (dashed line) compared with
a higher percentage of college graduates (solid line).
336 American Sociological Review 76(2)
Table
2.
Ris
kF
acto
rsfo
rA
uti
smIn
clu
din
gH
ealt
hC
are
Reso
urc
es
1992
1993
1994
1995
1996
1997
1998
1999
2000
OR
95%
CI
OR
95%
CI
OR
95%
CI
OR
95%
CI
OR
95%
CI
OR
95%
CI
OR
95%
CI
OR
95%
CI
OR
95%
CI
Inte
rcep
t.0
02
(.002,
.002)
.002
(.002,
.002)
.002
(.002,
.002)
.002
(.002,
.002)
.002
(.002,
.003)
.003
(.003,
.003)
.003
(.003,
.003)
.003
(.003,
.003)
.003
(.003,
.004)
Ind
ivid
ual
Level
Med
i-C
al
.89
(.82,
.97)
.72
(.66,
.80)
.66
(.59,
.74)
.81
(.74,
.88)
.95
(.88,
1.0
2)
.85
(.80,
.92)
.89
(.83,
.97)
.85
(.78,
.93)
.96
(.90,
1.0
2)
Fir
stB
orn
1.1
3(1
.05,
1.2
3)
1.1
5(1
.07,
1.2
4)
1.1
4(1
.05,
1.2
5)
1.1
7(1
.09,
1.2
6)
1.1
8(1
.10,
1.2
6)
1.1
3(1
.06,
1.2
0)
1.2
3(1
.17,
1.3
2)
1.2
8(1
.21,
1.3
7)
1.2
4(1
.18,
1.3
2)
Pre
matu
re1.0
1(.
91,
1.1
3)
.97
(.86,
1.1
0)
1.0
7(.
94,
1.2
3)
1.0
7(.
96,
1.2
0)
.98
(.88,
1.0
8)
1.1
1(1
.01,
1.2
1)
1.1
4(1
.05,
1.2
4)
1.0
7(.
97,
1.1
7)
1.2
2(1
.13,
1.3
2)
Norm
al
Weig
ht
.82
(.70,
.96)
.70
(.60,
.82)
1.0
3(.
85,
1.2
5)
.84
(.73,
.98)
.73
(.64,
.83)
.74
(.66,
.83)
.77
(.69,
.86)
.80
(.70,
.90)
.84
(.75,
.95)
Male
4.1
3(3
.80,
4.5
0)
4.0
4(3
.73,
4.3
9)
4.6
1(4
.15,
5.1
2)
4.1
4(3
.82,
4.4
9)
4.8
2(4
.48,
5.1
7)
4.5
7(4
.27,
4.9
0)
4.0
7(9
.80,
4.3
7)
4.2
3(3
.95,
4.5
2)
4.2
3(3
.97,
4.5
1)
Low
Ap
gar
1.1
3(.
80,
1.5
9)
1.2
3(.
89,
1.7
0)
1.3
0(.
92,
1.8
5)
1.2
8(.
96,
1.7
2)
.92
(.77,
1.2
0)
1.1
6(.
92,
1.4
9)
1.2
1(.
96,
1.5
2)
.96
(.75,
1.2
4)
1.3
5(1
.09,
1.6
7)
Max
Pare
nta
lA
ge
1.0
3(1
.03,
1.0
4)
1.0
4(1
.04,
1.0
5)
1.0
3(1
.02,
1.0
4)
1.0
3(1
.03,
1.0
4)
1.0
3(1
.03,
1.0
4)
1.0
4(1
.03,
1.0
4)
1.0
4(1
.03,
1.0
4)
1.0
3(1
.03,
1.0
4)
1.0
4(1
.03,
1.0
4)
Ed
ucati
on
1.1
4(1
.13,
1.1
6)
1.1
3(1
.11,
1.1
5)
1.1
1(1
.09,
1.1
3)
1.1
1(1
.09,
1.1
3)
1.1
3(1
.12,
1.1
5)
1.0
9(1
.08,
1.1
1)
1.0
9(1
.08,
1.1
1)
1.1
0(1
.09,
1.1
2)
1.0
8(1
.07,
1.0
9)
Mis
sin
gF
ath
er
.99
(.84,
1.1
6)
1.4
3(1
.24,
1.6
5)
1.1
5(.
91,
1.4
6)
1.1
2(.
96,
1.3
1)
1.1
9(1
.06,
1.3
5)
1.2
4(1
.12,
1.3
9)
1.0
4(.
93,
1.1
6)
.98
(.87,
1.1
2)
1.1
1(1
.01,
1.2
3)
Neig
hborh
ood
Level
Logged
Pro
pert
y1.6
4(1
.37,
1.9
5)
1.5
9(1
.41,
1.8
0)
2.0
5(1
.73,
2.4
3)
1.8
4(1
.62,
2.0
9)
1.5
2(1
.34,
1.7
2)
1.6
8(1
.48,
1.9
0)
1.4
6(1
.32,
1.6
3)
1.4
7(1
.32,
1.6
4)
1.3
3(1
.20,
1.4
7)
Perc
en
tC
oll
ege
Gra
du
ate
.84
(.46,
1.5
3)
.90
(.57,
1.4
1)
.61
(.34,
1.1
1)
.48
(.29,
.76)
.75
(.49,
1.1
8)
.57
(.37,
.87)
.85
(.58,
1.2
5)
.74
(.50,
1.0
8)
.85
(.59,
1.2
3)
Nu
mber
of
Ch
ild
Psy
ch
iatr
ists
.97
(.94,
1.0
1)
1.0
0(.
97,
1.0
2)
.99
(.96,
1.0
3)
1.0
2(1
.004,
1.0
4)
1.0
3(1
.01,
1.0
5)
1.0
5(1
.02,
1.0
7)
1.0
2(.
98,
1.0
5)
1.0
2(.
99,
1.0
4)
1.0
1(.
98,
1.0
4)
Nu
mber
of
Ped
iatr
icia
ns
1.0
05
(1.0
03,
1.0
09)
1.0
01
(.86,
1.1
0)
1.0
1(1
.00,
1.0
1)
1.0
04
(1.0
01,
1.0
09)
1.0
03
(1.0
0,
1.0
1)
1.0
03
(1.0
0,
1.0
1)
1.0
01
(.998,
1.0
04)
1.0
02
(1.0
0,
1.0
1)
1.0
04
(1.0
02,
1.0
08)
Au
tism
Org
s.8
5(.
64,
1.1
2)
.78
(.64,
.96)
.82
(.64,
1.0
5)
.73
(.57,
.94)
.74
(.49,
1.1
8)
.91
(.78,
1.0
9)
1.0
0(.
87,
1.1
5)
.96
(.86,
1.0
8)
1.0
4(.
92,
1.1
7)
Cro
ssLevel
Med
i-C
al
xP
rop
ert
y.8
9(.
73,
1.0
9)
1.3
4(1
.12,
1.6
2)
1.5
1(1
.21,
1.9
0)
1.0
7(.
90,
1.2
8)
1.3
0(1
.13,
1.5
1)
1.2
1(1
.04,
1.4
1)
.82
(.70,
.97)
1.1
5(.
99,
1.0
4)
1.4
9(1
.32,
1.6
8)
Ed
ucati
on
xP
erc
en
tC
oll
ege
.83
(.74,
.93)
.91
(.82,
1.0
2)
.85
(.75,
.97)
.92
(.83,
1.0
3)
.99
(.90,
1.0
9)
.87
(.80,
.93)
.87
(.81,
.96)
.89
(.83,
.96)
.90
(.85,
.96)
Ran
dom
Eff
ects
Vari
an
ce
SD
Vari
an
ce
SD
Vari
an
ce
SD
Vari
an
ce
SD
Vari
an
ce
SD
Vari
an
ce
SD
Vari
an
ce
SD
Vari
an
ce
SD
Vari
an
ce
SD
Inte
rcep
tF
ull
Mod
el
.10
.32
.10
.32
.13
.36
.09
.30
.14
.37
.18
.42
.16
.41
.12
.35
.18
.42
Med
i-C
al
Slo
pe
.02
.16
.06
.24
.03
.18
.04
.19
.06
.24
.04
.21
.05
.24
.08
.28
.08
.28
Ed
ucati
on
Slo
pe
.003
.05
.001
.03
.001
.03
.001
.04
.001
.04
.001
.03
.002
.05
.002
.04
.001
.03
Note
:O
dd
sra
tios
for
facto
rsexam
ined
for
ap
ote
nti
al
ass
ocia
tion
wit
hau
tism
risk
ap
pear
inth
ecolu
mn
labele
dO
R.
An
od
ds
rati
oover
on
ein
dic
ate
san
incre
ase
dri
skfo
rau
tism
.A
nod
ds
rati
oof
less
than
on
esu
ggest
sth
at
the
vari
able
isass
ocia
ted
wit
ha
decre
ase
dri
skfo
rau
tism
.T
he
95
perc
en
tcon
fid
en
ce
inte
rvals
ap
pear
inp
are
nth
ese
s.F
acto
rsth
at
are
stati
stic
all
ysi
gn
ific
an
tat
the
p\
.05
level
ap
pear
inbold
.T
he
year
head
ing
for
each
colu
mn
ind
icate
sth
ebir
thcoh
ort
that
the
resu
lts
pert
ain
to.
Th
eest
imate
dvari
an
ce
of
b0k,
t 00
isst
ati
stic
all
ysi
gn
ific
an
tin
the
un
con
dit
ion
al
mod
el
for
all
years
at
p�
.001
excep
t1995.
337
the analysis from the 1990 and 2000 Cen-
suses because data were not available for
all zip codes for intermediate years. To
test the accuracy of the property value inter-
polation, we used the average sales price per
zip code per year (RAND 2010). Sales data
and interpolated property value are highly
correlated. The multilevel analysis with the
alternate property value specification yields
similar results, which increases our confi-
dence in the interpolation. (See Part C of
the online supplement for results of this
analysis.)
Two selection issues arose in the analyses.
Because our data focus solely on children
born in California, one might wonder
whether these children differ from children
who were born elsewhere and later moved
to the state. While it is impossible to test
this with the available data for the general
population, for the population with autism
we found no statistically significant differen-
ces for property value and race, the only var-
iables for which we have data on children
moving into the state. Similarly, we wanted
to ensure that persons covered by Medi-Cal
who reside in wealthier areas are not statisti-
cally different from persons on Medi-Cal
residing in poorer areas. To test this, we com-
pared available demographic characteristics
for persons on Medi-Cal living in wealthy
communities (top decile of property value)
to the rest of the Medi-Cal population. We
examined variables in our analysis and addi-
tional variables, including parental age,
education, race, immigration status, and the
number of prenatal visits. The differences
observed are substantively unimportant. The
maximum parental age difference between
the two groups is two years and a single
year of education separates the two groups.
Race, immigration status, and the number of
0
0.2
0.4
0.6
0.8
1
1.2
1.4
1.6
1.8
High Education High Property Value Low Education Low Property Value
Rat
io o
f H
igh
to
Lo
w S
ever
ity
Less
Sev
ere\
Hig
her
Fun
ctio
ning
Mor
e S
ever
e/Lo
wer
Fun
tioni
ng
Figure 6. Ratio of Less Severe to More Severe Cases by Community CompositionNote: High education communities are in the top decile of education; high property value communities
are in the top decile of property value. Low property value and low education are the bottom decile.
338 American Sociological Review 76(2)
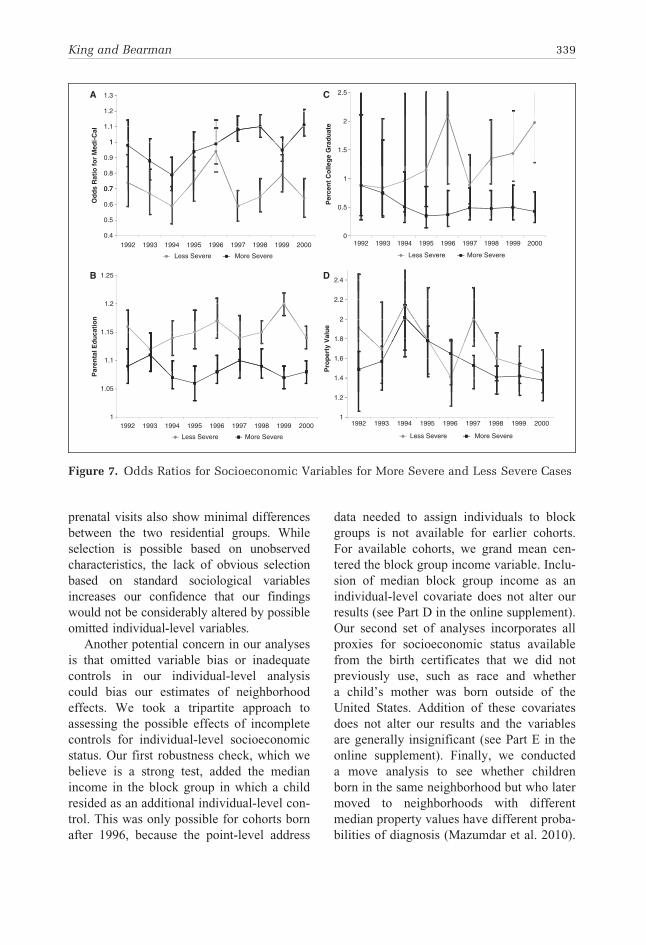
prenatal visits also show minimal differences
between the two residential groups. While
selection is possible based on unobserved
characteristics, the lack of obvious selection
based on standard sociological variables
increases our confidence that our findings
would not be considerably altered by possible
omitted individual-level variables.
Another potential concern in our analyses
is that omitted variable bias or inadequate
controls in our individual-level analysis
could bias our estimates of neighborhood
effects. We took a tripartite approach to
assessing the possible effects of incomplete
controls for individual-level socioeconomic
status. Our first robustness check, which we
believe is a strong test, added the median
income in the block group in which a child
resided as an additional individual-level con-
trol. This was only possible for cohorts born
after 1996, because the point-level address
data needed to assign individuals to block
groups is not available for earlier cohorts.
For available cohorts, we grand mean cen-
tered the block group income variable. Inclu-
sion of median block group income as an
individual-level covariate does not alter our
results (see Part D in the online supplement).
Our second set of analyses incorporates all
proxies for socioeconomic status available
from the birth certificates that we did not
previously use, such as race and whether
a child’s mother was born outside of the
United States. Addition of these covariates
does not alter our results and the variables
are generally insignificant (see Part E in the
online supplement). Finally, we conducted
a move analysis to see whether children
born in the same neighborhood but who later
moved to neighborhoods with different
median property values have different proba-
bilities of diagnosis (Mazumdar et al. 2010).
1
1.1
1.2
1.3A
0.7
0.8
0.9
1
0.4
0.5
0.6
0.7
Od
ds
Rat
io f
or
Med
i-C
al
1992
2.4D
1.8
2
2.2
1.4
1.6
Pro
per
ty V
alu
e
1
1.2
Less Severe More Severe
Less Severe More Severe
1993 1994 1995 1996 1997 1998 1999 2000
1.2
1.25B
1.1
1.15
1
1.05
Par
enta
l Ed
uca
tio
n
Less Severe More Severe
1992 1993 1994 1995 1996 1997 1998 1999 2000
2.5C
1.5
2
0.5
1
0
Per
cen
t C
olle
ge
Gra
du
ate
Less Severe More Severe
1992 1993 1994 1995 1996 1997 1998 1999 2000
1992 1993 1994 1995 1996 1997 1998 1999 2000
Figure 7. Odds Ratios for Socioeconomic Variables for More Severe and Less Severe Cases
King and Bearman 339
By using propensity score matching to match
on individual-level socioeconomic status and
neighborhood of origin, we observe that
upwardly mobile children were at higher
risk of diagnosis. If the analysis is stratified
by Medi-Cal receipt, the mobility effects
are stronger for children whose birth was
paid for with Medi-Cal. These results are
consistent with the results reported earlier
in our text (Mazumdar et al. 2010). Taken
together, these supplementary analyses indi-
cate that Medi-Cal enrollment, parental
education, and having a missing father
adequately control for individual-level
socioeconomic status and that our results
are robust.
Several additional limitations remain.
First, we calculated all community SES
measures using zip code of residence at birth.
While we know where a child diagnosed with
autism lived at the time of diagnosis, we do
not know residence at all times for all chil-
dren born in California. This makes an anal-
ysis comparable to the one based on resi-
dence at diagnosis impossible. However,
the birth clusters identified by Mazumdar
and colleagues (2010) overlap with diagnos-
tic clusters, suggesting that geographic
mobility does not present a large problem
for our analysis.
A second limitation is that our study is
restricted to the state of California. California
has a well-established agency through which
it provides diagnoses, services, and support
to persons with autism. As a result, one
may expect higher prevalence rates and
less inequality than in other states where
diagnostic capacity and autism awareness
may be lower. Against this background,
and given the striking inequality observed
here—especially during the height of the
epidemic—California may provide a conser-
vative case. Future research is needed to
determine whether a similar pattern of a wax-
ing and waning SES gradient can be identified
elsewhere. Just as community characteristics
within California are an important part of
the prevalence story, state-to-state variation
has also been shown to be significant (Shat-
tuck 2006); whether these variations are due
to factors examined in this study is an impor-
tant area for future research. Finally, while we
have assembled evidence that at least part of
the observed SES gradient for autism and
increased prevalence is due to changing pat-
terns of identification and treatment, we can-
not rule out the possibility that toxicants or
other factors may also be implicated. They
may be.
Comment
We find that the socioeconomic gradient for
autism has begun to reverse. It is reasonable
to ask whether this gradient—or the strong
positive relationship between community
resources and autism—fueled the epidemic.
As prevalence rates began to increase at
a slower rate and diagnoses became less
rare among groups with high socioeconomic
status, the community-level SES gradient
began to fade. Yet, the community gradient
did not weaken for all individuals. It per-
sisted among individuals with fewer eco-
nomic resources. Over time, however,
a lack of resources presented less of an obsta-
cle to diagnosis. Individuals who would have
been less likely in previous cohorts to be
diagnosed with autism due to their parents’
socioeconomic status or the communities in
which they lived became more likely to be
diagnosed.
This finding is consistent with the idea of
maximally maintained inequality, brought to
bear in the literature on socioeconomic
health gradients by Lutfey and Freese
(2005) and first introduced by Raftery and
Hout (1993) to explain class differentials in
educational attainment. Here, class differen-
ces in enrollment become less salient as
enrollment expands to the point at which
a system is able to be less selective. Applied
to the socioeconomic gradient for autism, we
find that it began to wane as knowledge
about the disorder and the capacity for
ascertainment saturated the entire population
340 American Sociological Review 76(2)
and enrollment expanded to the point
where the health care system became less
selective.
This article examines how, when, and why
resources matter for an autism diagnosis. We
show that individual and community resour-
ces mattered differently at different points
in the evolution of the disorder. Higher levels
of parental education and parental economic
resources were consistently associated with
an increase in the likelihood of diagnosis.
By contrast, economic resources within
a community mattered most when prevalence
rates were rapidly increasing. As the epi-
demic gained strength, a strong neighbor-
hood SES gradient appeared and then weak-
ened as prevalence rates stabilized. However,
neighborhood effects did not disappear for
everyone. At the end of our observation
period, neighborhood SES effects were negli-
gible for children born to educated parents
and children not receiving Medi-Cal. By con-
trast, neighborhood effects remained strong
for children born to parents with fewer eco-
nomic resources.
A comparison of more and less severe
cases provides insight into a mechanism
that might be driving the autism epidemic.
The expression of SES was strongly positive
for less severe cases. By contrast, the
strength of SES effects for more severe cases
was more moderate. The most likely expla-
nation is that the rapid upswing of measured
autism prevalence was driven by diagnostic
dynamics and knowledge diffusion in weal-
thy and highly educated communities. Over
time, these community effects spilled over
into less affluent areas. This finding, com-
bined with the importance of community
resources for rising autism prevalence, pro-
vides a framework for understanding the
autism epidemic as constituted, in significant
part, as an ‘‘epidemic of discovery’’ (Grinker
2007).
Within this framework, it is easy to see
how neighborhoods can dynamically shape
health outcomes. Rather than passively struc-
turing advantages and disadvantages for res-
idents in the same way, the importance of
neighborhood socioeconomic status changed
over time. The fingerprints left behind by
these changes point to the importance of
diagnostic resources and ascertainment
capacity for rising autism prevalence. By
devoting greater attention to temporal and
contextual variability in when and how
neighborhoods matter, future research might
uncover the conditions under which neigh-
borhoods are likely to exacerbate or mitigate
health inequalities.
King and Bearman 341
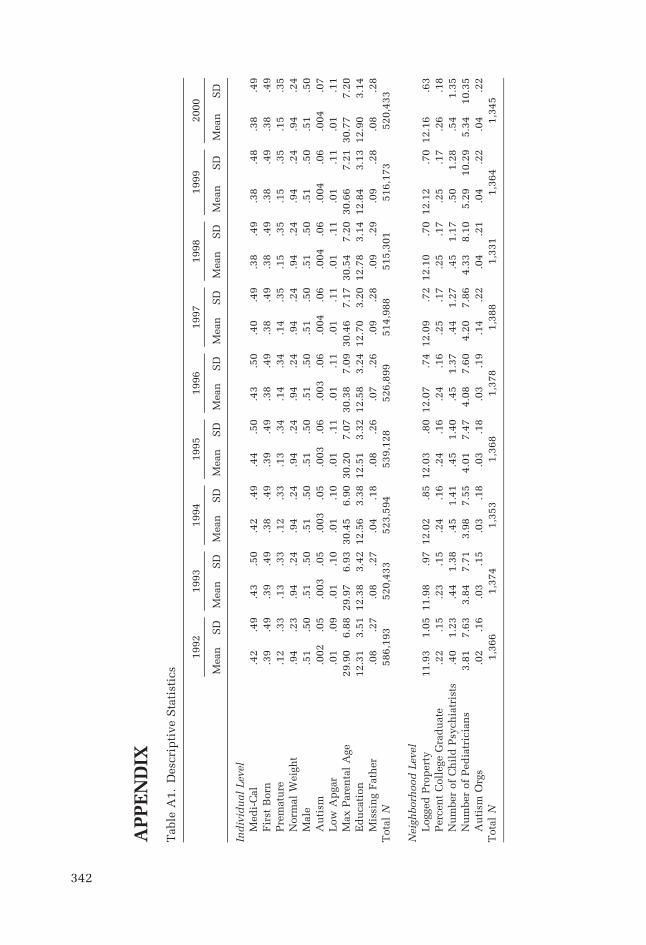
AP
PE
ND
IX
Table
A1.
Desc
rip
tive
Sta
tist
ics
1992
1993
1994
1995
1996
1997
1998
1999
2000
Mean
SD
Mean
SD
Mean
SD
Mean
SD
Mean
SD
Mean
SD
Mean
SD
Mean
SD
Mean
SD
Ind
ivid
ual
Level
Med
i-C
al
.42
.49
.43
.50
.42
.49
.44
.50
.43
.50
.40
.49
.38
.49
.38
.48
.38
.49
Fir
stB
orn
.39
.49
.39
.49
.38
.49
.39
.49
.38
.49
.38
.49
.38
.49
.38
.49
.38
.49
Pre
matu
re.1
2.3
3.1
3.3
3.1
2.3
3.1
3.3
4.1
4.3
4.1
4.3
5.1
5.3
5.1
5.3
5.1
5.3
5
Norm
al
Weig
ht
.94
.23
.94
.24
.94
.24
.94
.24
.94
.24
.94
.24
.94
.24
.94
.24
.94
.24
Male
.51
.50
.51
.50
.51
.50
.51
.50
.51
.50
.51
.50
.51
.50
.51
.50
.51
.50
Au
tism
.002
.05
.003
.05
.003
.05
.003
.06
.003
.06
.004
.06
.004
.06
.004
.06
.004
.07
Low
Ap
gar
.01
.09
.01
.10
.01
.10
.01
.11
.01
.11
.01
.11
.01
.11
.01
.11
.01
.11
Max
Pare
nta
lA
ge
29.9
06.8
829.9
76.9
330.4
56.9
030.2
07.0
730.3
87.0
930.4
67.1
730.5
47.2
030.6
67.2
130.7
77.2
0
Ed
ucati
on
12.3
13.5
112.3
83.4
212.5
63.3
812.5
13.3
212.5
83.2
412.7
03.2
012.7
83.1
412.8
43.1
312.9
03.1
4
Mis
sin
gF
ath
er
.08
.27
.08
.27
.04
.18
.08
.26
.07
.26
.09
.28
.09
.29
.09
.28
.08
.28
Tota
lN
586,1
93
520,4
33
523,5
94
539,1
28
526,8
99
514,9
88
515,3
01
516,1
73
520,4
33
Neig
hborh
ood
Level
Logged
Pro
pert
y11.9
31.0
511.9
8.9
712.0
2.8
512.0
3.8
012.0
7.7
412.0
9.7
212.1
0.7
012.1
2.7
012.1
6.6
3
Perc
en
tC
oll
ege
Gra
du
ate
.22
.15
.23
.15
.24
.16
.24
.16
.24
.16
.25
.17
.25
.17
.25
.17
.26
.18
Nu
mber
of
Ch
ild
Psy
ch
iatr
ists
.40
1.2
3.4
41.3
8.4
51.4
1.4
51.4
0.4
51.3
7.4
41.2
7.4
51.1
7.5
01.2
8.5
41.3
5
Nu
mber
of
Ped
iatr
icia
ns
3.8
17.6
33.8
47.7
13.9
87.5
54.0
17.4
74.0
87.6
04.2
07.8
64.3
38.1
05.2
910.2
95.3
410.3
5
Au
tism
Org
s.0
2.1
6.0
3.1
5.0
3.1
8.0
3.1
8.0
3.1
9.1
4.2
2.0
4.2
1.0
4.2
2.0
4.2
2
Tota
lN
1,3
66
1,3
74
1,3
53
1,3
68
1,3
78
1,3
88
1,3
31
1,3
64
1,3
45
342
Acknowledgments
We thank Christine Fountain, Noam Zerubavel, Ka-Yuet
Liu, Diana Dakhallah, Bruce Link, the editors of the
ASR, and the anonymous reviewers for helpful com-
ments on previous drafts.
Funding
This research is supported by the NIH Director’s Pioneer
Award program, part of the NIH Roadmap for Medical
Research, through grant number 1 DP1 OD003635-01.
Notes
1. However, see Eyal and colleagues (2010) for an
important historical analysis of the role of therapies
in the construction of the autism spectrum.
2. These outcomes include low birth weight, systolic
blood pressure and serum cholesterol, depression,
gonorrhea, and violence (see Kawachi and Berkman
[2003] for a summary of previous studies).
3. The diagnostic criteria for autistic disorder outlined
in the Diagnostic and Statistical Manual of Mental
Disorder (DSM) delineates 12 criteria in three
domains: (1) social interaction (e.g., lack of social
or emotional empathy), (2) communication (e.g.,
inability to initiate or sustain conversation), and (3)
restricted and stereotyped patterns of behavior (e.g.,
persistent preoccupation with parts of objects). For
an autism diagnosis, a minimum of two criteria
within the social interaction domain and one each
from communication and stereotyped behaviors
must be met. Additionally, symptoms must be pres-
ent before a child is 3 years old. Autism, however,
is part of a larger group of autism spectrum disorders
that includes Asperger’s Syndrome (AS) and Perva-
sive Developmental Disorder-Not Otherwise Speci-
fied (PDD-NOS). AS and PDD-NOS require fewer
symptoms to be present for a diagnosis. Social defi-
cits are common across the spectrum, although there
are large differences in symptomatic severity and
intensity. Persons with the most severe forms of
autism may lack speech and often have comorbid
intellectual disabilities. People with Asperger’s syn-
drome generally do not have speech or communica-
tion delays. PDD-NOS is a subthreshold diagnostic
category for children who do not meet the diagnostic
criteria for autism or Asperger’s Syndrome. (See
Johnson and colleagues [2007] for a more lengthy
description of parts of the spectrum.)
4. The idea that vaccines cause autism has been popu-
lar but is not substantiated in the scientific
literature.
5. The differential ascertainment times for each cohort
have no effect on our results or our estimates of
prevalence. As Palmer and colleagues (2005) and
Hertz-Picciotto and Delwiche (2009) demonstrate
in detail, by the 2000 cohort the vast majority of chil-
dren are diagnosed by age 6.5 years. In addition,
a series of robustness checks (available from the
authors upon request) further demonstrate that ascer-
tainment bias arising from a declining follow-up
period across cohorts do not affect our results.
6. Given the fairly exhaustive linking criteria and the
typical patterns of immigration into California,
DDS files that could not be linked likely belong
to children who were born outside of California
and later moved to the state.
7. We ran robustness checks to see if not excluding zip
codes or excluding zip codes with greater numbers of
births influences results. The results (available from
the authors upon request) show that inclusions and
exclusions do not significantly change our findings.
8. Because each item has a different range, we used
(P
((item score/maximum possible score)/(total
number of items)))*100 to calculate the severity
score.
9. We will return to the results presented in this table
throughout the following sections. The results will
also be depicted graphically section by section to
aid with interpretation.
10. There are many explanations for disproportionate
male incidence of autism; the most well known is
Baron-Cohen and colleagues’ (2005) argument
that autism is an extreme form of the male brain
that emphasizes systematizing functions over empa-
thetic functions. This explanation, and many others,
is largely a re-description of maleness and autism.
11. While environmental toxicants could be responsi-
ble, the toxicant would have to be differentially
associated with less severe symptoms and dispro-
portionately present in highly educated, wealthy
neighborhoods. This seems unlikely.
References
Abrahams, Brett and Daniel Geschwin. 2008. ‘‘Advan-
ces in Autism Genetics: On the Threshold of
a New Neurobiology.’’ Nature Reviews 9:341–55.
Adler, Nancy and Katherine Newman. 2002. ‘‘Socio-
economic Disparities in Health: Pathways and Poli-
cies.’’ Health Affairs 23:60–76.
Auchincloss, Amy and Ana Diez Roux. 2009. ‘‘A New
Tool for Epidemiology: The Usefulness of
Dynamic-Agent Models in Understanding Place
Effects on Health.’’ American Journal of Epidemiol-
ogy 168:1–8.
Baldwin, Wendy and Christine Nord. 1984. ‘‘Delayed
Childbearing in the U.S.: Facts and Fictions.’’ Popu-
lation Bulletin 39:1–42.
Barbaresi, William, Slavica Katusic, Robert Colligan,
Amy Weaver, and Steven Jacobsen. 2005. ‘‘The
King and Bearman 343
Incidence of Autism in Olmstead County, Minne-
sota, 1967–1997: Results from a Population Based
Study.’’ Archives of Pediatric and Adolescent Medi-
cine 159:37–44.
Baron-Cohen, Simon, Rebecca Knickmeyer, and
Matthew Belmonte. 2005. ‘‘Sex Differences in the
Brain: Implications for Explaining Autism.’’ Science
310:819–23.
Bishop, Dorothy, Andrew Whitehouse, Helen Watt, and
Elizabeth Line. 2008. ‘‘Autism and Diagnostic Sub-
stitution: Evidence from a Study of Adults with
a History of Developmental Language Disorder.’’
Developmental Medicine and Child Neurology
50:341–45.
Campbell, Kevin. 2004. ‘‘The Link King.’’ Camelot
Consulting (http://www.the-link-king.com/index
.html).
Carson, April P., Kathryn M. Rose, Diane J. Catellier,
Jay S. Kaufman, Sharon B. Wyatt, Ana V. Diez-
Roux, and Gerardo Heiss. 2007. ‘‘Cumulative Socio-
economic Status across the Life Course and Subclin-
ical Atherosclerosis.’’ Annals of Epidemiology
17:296–303.
Chang, Virginia and Diane Lauderdale. 2009. ‘‘Funda-
mental Cause Theory, Technological Innovation,
and Health Disparities: The Case of Cholesterol in
the Era of Statins.’’ Journal of Health and Social
Behavior 50:245–60.
Christakis, Nicholas and James Fowler. 2007. ‘‘The
Spread of Obesity in a Large Social Network over
32 Years.’’ New England Journal of Medicine
357:370–79.
Coo, Helen, Helene Ouellette-Kuntz, Jennifer Lloyd,
Liza Kasmara, Jeanette Holden, and Suzanne Lewis.
2008. ‘‘Trends in Autism Prevalence: Diagnostic
Substitution Revisited.’’ Journal of Autism and
Developmental Disorders 38:1036–1046.
Croen, Lisa, Judith Grether, Jenny Hoogstrate, and Steve
Selvin. 2002. ‘‘The Changing Prevalence of Autism
in California.’’ Journal of Autism and Developmen-
tal Disorders 32:207–215.
Croen, Lisa, Judith Grether, and Steve Selvin. 2002.
‘‘Descriptive Epidemiology of Autism in a California
Population: Who Is at Risk?’’ Journal of Autism and
Developmental Disorders 32:217–24.
Department of Developmental Services (DDS). 2007.
‘‘Department of Developmental Services Fact
Book.’’ Sacramento: California Department of
Developmental Services.
Diez Roux, Ana and Christina Mair. 2010. ‘‘Neighbor-
hoods and Health.’’ Annals of the New York Acad-
emy of Sciences 1186:125–45.
Durkin, Maureen S., Matthew J. Maenner, F. John
Meaney, Susan E. Levy, Carolyn DiGuiseppi, Joyce
S. Nicholas, Russell S. Kirby, Jennifer A. Pinto-
Martin, and Laura A. Schieve. 2010. ‘‘Socio-
economic Inequality in the Prevalence of Autism
Spectrum Disorder: Evidence from a U.S. Cross-
Sectional Study.’’ PLoS ONE 5(7): e11551. doi:
10.1371/journal.pone.0011551.
Durkin, Maureen S., Matthew J. Maenner, Craig J.
Newschaffer, Li-Ching Lee, Christopher M. Cunniff,
Julie L. Daniels, Russell S. Kirby, Lewis Leavitt,
Lisa Miller, Walter Zahorodny, and Laura A.
Schieve. 2008. ‘‘Advanced Parental Age and the
Risk of Autism Spectrum Disorder.’’ American Jour-
nal of Epidemiology 168:1268–76.
Eaton, William, Preben Mortensen, Per Hove Thomsen,
and Morten Frydenberg. 2001. ‘‘Obstetric Complica-
tions and Risk for Severe Psychopathology in Child-
hood.’’ Journal of Autism and Developmental Disor-
ders 31:279–85.
Eyal, Gil, Brendan Hart, Emine Oncular, Neta Oren, and
Natasha Rossi. 2010. The Social Origins of the
Autism Epidemic. Boston: Polity Press.
Finegan, Jo-Anne and Bruce Quarrington. 1979. ‘‘Pre-,
Peri-, and Neonatal Factors and Infantile Autism.’’
Journal of Child Psychology and Psychiatry
20:119–28.
Fombonne, Eric. 2001. ‘‘Is There an Autism Epidemic.’’
Pediatrics 107:411–12.
Freese, Jeremy and Karen Lutfey. Forthcoming. ‘‘Fun-
damental Causality: Challenges of an Animating
Concept for Medical Sociology.’’ In The Handbook
of the Sociology of Health, Illness, and Healing, edi-
ted by B. Pescosolido, J. Martin, J. McLeod, and A.
Rogers. New York: Springer Publishing.
Glasson, Emma J., Carol Bower, Beverly Petterson,
Gervase Chaney, and Joachim F. Hallmayer. 2004.
‘‘Perinatal Factors and the Development of Autism:
A Population Study.’’ Archives of General Psychia-
try 61:618–27.
Government Accountability Office. 2006. ‘‘Report to the
Majority Leader, U.S. Senate Federal Autism Activi-
ties Funding for Research Has Increased, but Agen-
cies Need to Resolve Surveillance Challenges.’’
Washington, DC: Government Accountability Office.
Grandjean, Phillipe and Philip Landrigan. 2006. ‘‘Devel-
opmental Neurotoxicity of Industrial Chemicals.’’
Lancet 368:2167–78.
Grinker, Roy Richard. 2007. Unstrange Minds: Remap-
ping the World of Autism. Cambridge, MA: Basic
Books.
Hertz-Picciotto, Irva and Lorna Delwiche. 2009. ‘‘The
Continuing Rise in Autism and the Role of Age at
Diagnosis.’’ Epidemiology 20:84–90.
Hultman, Christina M. and Par Sparen. 2004. ‘‘Autism:
Prenatal Insults or an Epiphenomenon of a Strongly
Genetic Disorder?’’ Lancet 364:485–87.
Insel, Tom. 2007. ‘‘The Combating Autism Act.’’ Pre-
sented at the International Meeting for Autism
Research, Seattle, WA.
Johnson, Chris Plauche, Scott Myers, and the Council on
Children with Disabilities. 2007. ‘‘Identification and
344 American Sociological Review 76(2)
Evaluation of Children with Autism Spectrum Disor-
ders.’’ Pediatrics 120:1183–1215.
Kaczynski, Andrew and Karla Henderson. 2008. ‘‘Parks
and Recreation Settings and Active Living: A
Review of Associations with Physical Activity Func-
tion and Intensity.’’ Journal of Physical Activity and
Health 5:619–32.
Kawachi, Ichiro and Lisa Berkman. 2003. ‘‘Introduc-
tion.’’ Pp. 1–20 in Neighborhoods and Health, edited
by I. Kawachi and L. Berkman. Oxford: Oxford Uni-
versity Press.
King, Marissa and Peter Bearman. 2009. ‘‘Diagnostic
Change and the Increased Prevalence of Autism.’’
International Journal of Epidemiology 38:1224–34.
King, Marissa, Christine Fountain, Diana Dakhlallah,
and Peter Bearman. 2009. ‘‘Estimated Autism Risk
and Older Reproductive Age.’’ American Journal
of Public Health 99:1673–79.
Kolevzon, Alexander, Raz Gross, and Abraham
Reichenberg. 2007. ‘‘Prenatal and Perinatal Risk
Factors for Autism: A Review and Integration of
Findings.’’ Archives of Pediatrics and Adolescent
Medicine 161:326–33.
Larsson, Heidi, William Eaton, Kreesten Madsen,
Mogens Vestergaard, Anne Olesen, Esben Agerbo,
Diana Schendel, Poul Thorsen, and Preben Morten-
sen. 2005. ‘‘Risk Factors for Autism: Perinatal Fac-
tors, Parental Psychiatric History, and Socioeconomic
Status.’’ American Journal of Epidemiology 161:916–
25; discussion 926–28.
Link, Bruce G., Mary E. Northridge, Jo C. Phelan, and
Michael L. Ganz. 1998. ‘‘Social Epidemiology and
the Fundamental Cause Concept: On the Structuring
of Effective Cancer Screens by Socioeconomic Sta-
tus.’’ Milbank Quarterly 76:375–402.
Link, Bruce G. and Jo Phelan. 1995. ‘‘Social Conditions
as Fundamental Causes of Disease.’’ Journal of
Health and Social Behavior 35:80–94.
Link, Bruce G. and Jo Phelan. 2002. ‘‘McKeown and the
Idea that Social Conditions Are Fundamental Causes
of Disease.’’ American Journal of Public Health
92:730–32.
Liu, Ka-Yuet, Marissa King, and Peter Bearman. 2010.
‘‘Social Influence and the Autism Epidemic.’’ Amer-
ican Journal of Sociology 115:1387–1434.
Liu, Ka-Yuet, Noam Zerubavel, and Peter Bearman.
2010. ‘‘Social Demographic Change and Autism.’’
Demography 47:327–43.
Lutfey, Karen and Jeremy Freese. 2005. ‘‘Toward Some
Fundamentals of Fundamental Causality: Socioeco-
nomic Status and Health in the Routine Clinic Visit
for Diabetes.’’ American Journal of Sociology
110:1326–72.
Mandell, David S. and Raymond Palmer. 2005. ‘‘Differ-
ences among States in the Identification of Autistic
Spectrum Disorders.’’ Archives of Pediatric and
Adolescent Medicine 159:266–69.
Matteson, Donald, Jeffrey Burr, and James Marshall.
1998. ‘‘Infant Mortality: A Multi-Level Analysis of
Individual and Community Risk Factors.’’ Social
Science and Medicine 47:1841–54.
Mazumdar, Soumya, Marissa King, Ka-Yuet Liu, Noam
Zerubavel, and Peter Bearman. 2010. ‘‘The Spatial
Structure of Autism in California, 1993–2001.’’
Health and Place 16:539–46.
Palmer, Raymond F., Stephen Blanchard, Carlos R.
Jean, and David S. Mandell. 2005. ‘‘School District
Resources and Identification of Children with Autis-
tic Disorder.’’ American Journal of Public Health
95:125–30.
Pamuk, E., D. Makuc, K. Heck, C. Reuben, and K.
Lochner. 1998. Socioeconomic Status and Health
Chartbook. Hyattsville, MD: Center for Health
Statistics.
Pescosolido, Bernice. 1992. ‘‘Beyond Rational Choice:
The Social Dynamics of How People Seek Help.’’
American Journal of Sociology 97:1096–1138.
Pescosolido, Bernice A. and Judith A. Levy, eds. 2002.
The Role of Social Networks in Health, Illness, Dis-
ease and Healing: The Accepting Present, the For-
gotten Past, and the Dangerous Potential for a Com-
placent Future. New York: JAI Press.
Pollitt, R. A., J. S. Kaufman, K. M. Rose, A. V. Diez-
Roux, D. Zeng, and G. Heiss. 2008. ‘‘Cumulative
Life Course and Adult Socioeconomic Status and
Markers of Inflammation in Adulthood.’’ Journal
of Epidemiology and Community Health 62:484–91.
Raftery, Adrian and Michael Hout. 1993. ‘‘Maximally
Maintained Inequality: Expansion, Reform and
Opportunity in Irish Education, 1921–1975.’’ Sociol-
ogy of Education 66:41–62.
RAND. 2010. ‘‘Residential Housing Sales Prices and
Number of Transactions.’’ (http://ca.rand.org/stats/
economics/houseprice_archive.html).
Raudenbush, Stephen, Anthony Bryk, and Richard
Congdon. 2004. ‘‘HLM 6.’’ Lincolnwood, IL: Scien-
tific Software International.
Roberts, Eric. 1997. ‘‘Neighborhood Social Environments
and the Distribution of Low Birthweight in Chicago.’’
American Journal of Public Health 87:597–603.
Sampson, Robert J., Jeffrey D. Morenoff, and Thomas
Gannon-Rowley. 2002. ‘‘Assessing Neighborhood
Effects: Social Processes and New Directions in
Research.’’ Annual Review of Sociology 28:443–78.
Sharkey, Pat. 2008. ‘‘The Intergenerational Transmis-
sion of Context.’’ American Journal of Sociology
113:931–69.
Shattuck, Paul. 2006. ‘‘Contribution of Diagnostic Sub-
stitution to the Growing Administrative Prevalence
of Autism.’’ Pediatrics 117:1028–37.
Singh, Jennifer, Judy Illes, Laura Lazzeroni, and
Joachim Hallmayer. 2009. ‘‘Trends in Autism
Research Funding.’’ Journal of Autism and Develop-
mental Disorders 39:788–95.
King and Bearman 345
Uzzi, Brian. 1996. ‘‘The Sources and Consequences of
Embeddedness for the Economic Performance of
Organizations: The Network Effect.’’ American
Sociological Review 61:674–98.
Windham, Gayle C., Lixia Zhang, Robert Gunier, Lisa
A. Croen, and Judith K. Grether. 2006. ‘‘Autism
Spectrum Disorders in Relation to the Distribution
of Hazardous Air Pollutants in the San Francisco
Bay Area.’’ Environmental Health Perspectives
114:1438–44.
Wing, Lorna and David Potter. 2002. ‘‘The
Epidemiology of Autism Spectrum Disorders: Is
Prevalence Rising.’’ Mental Retardation and
Developmental Disabilities Research Reviews
8:151–61.
Marissa D. King is Assistant Professor of Organiza-
tional Behavior at Yale University’s School of Manage-
ment. Her current research examines patterns of antide-
pressant, stimulant, and antipsychotic utilization. In
general, her research analyzes the spatial and temporal
dimensions of innovation and diffusion. To understand
how large-scale phenomena arise from local behavior,
she has studied cases ranging from the rise in autism
prevalence during the past decade to the organizational
foundations of the antislavery movement in the late-
nineteenth century.
Peter S. Bearman is the Cole Professor of the Social
Sciences at Columbia University and the Director of
the Paul F. Lazarsfeld Center for the Social Sciences.
346 American Sociological Review 76(2)