Embed Size (px)
DESCRIPTION
Socioeconomic Status and Health. Thom Walsh PhD, MS , MSPT The Dartmouth Center for Health Care Delivery Science & The Dartmouth Institute for Health Policy and Clinical Practice. Health & Health Care. Clinical training teaches us to link outcomes and exposures - PowerPoint PPT Presentation
Citation preview
Socioeconomic Status and Health
Thom Walsh PhD, MS, MSPT
The Dartmouth Center for Health Care Delivery Science &
The Dartmouth Institute for Health Policy and Clinical Practice
Health & Health Care
Clinical training teaches us to link outcomes and exposures
• Upper respiratory infection viruses• Cancer carcinogens• Obesity calories in/calories out
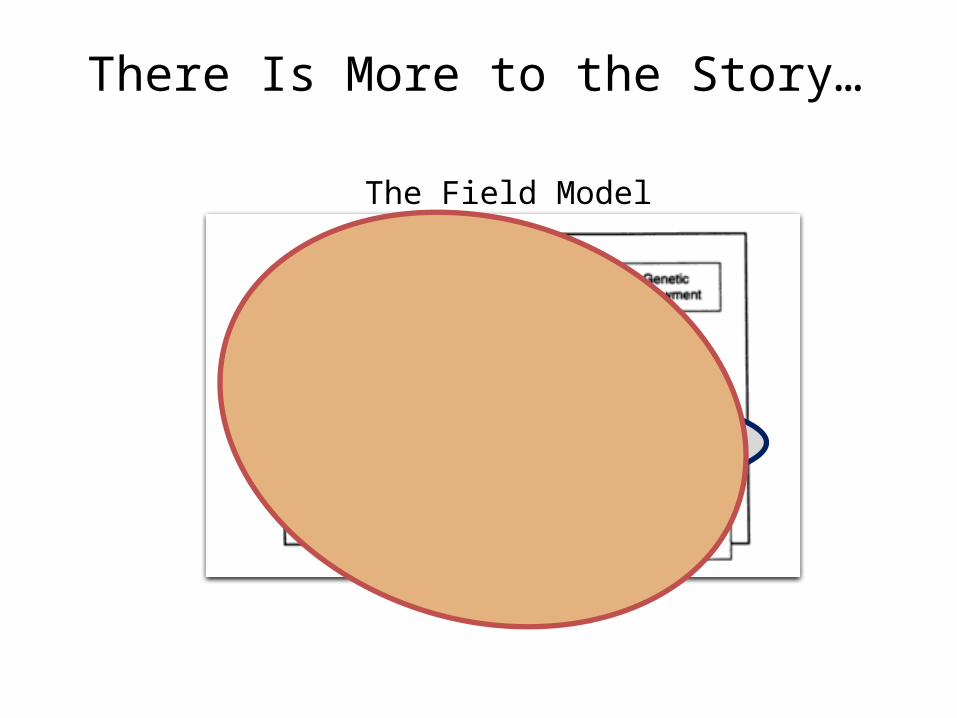
There Is More to the Story…
The Field Model
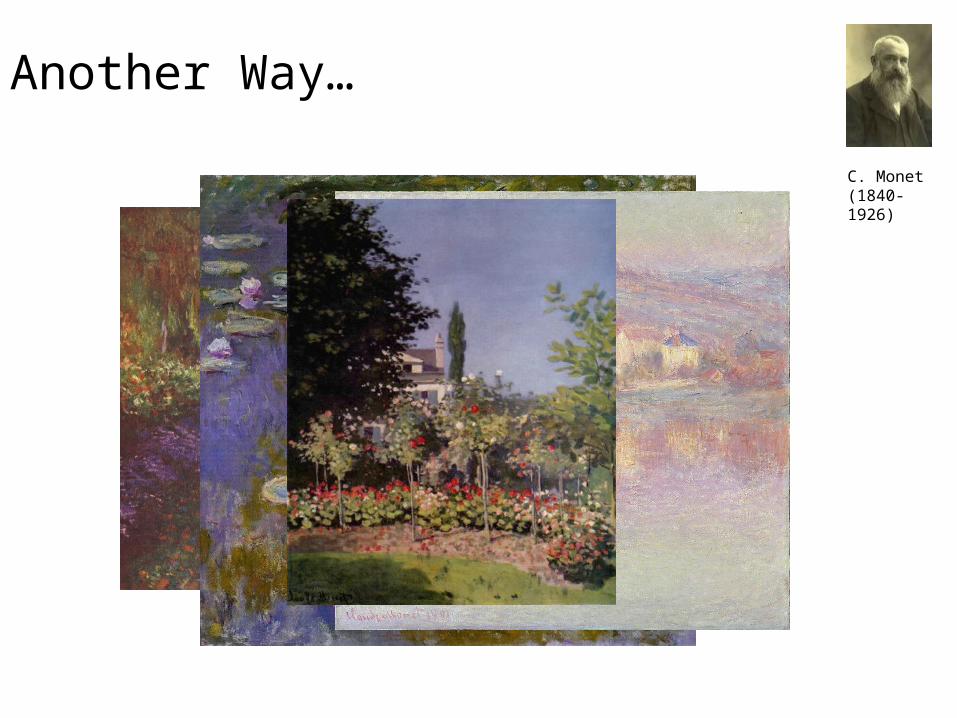
Another Way…
C. Monet (1840-1926)
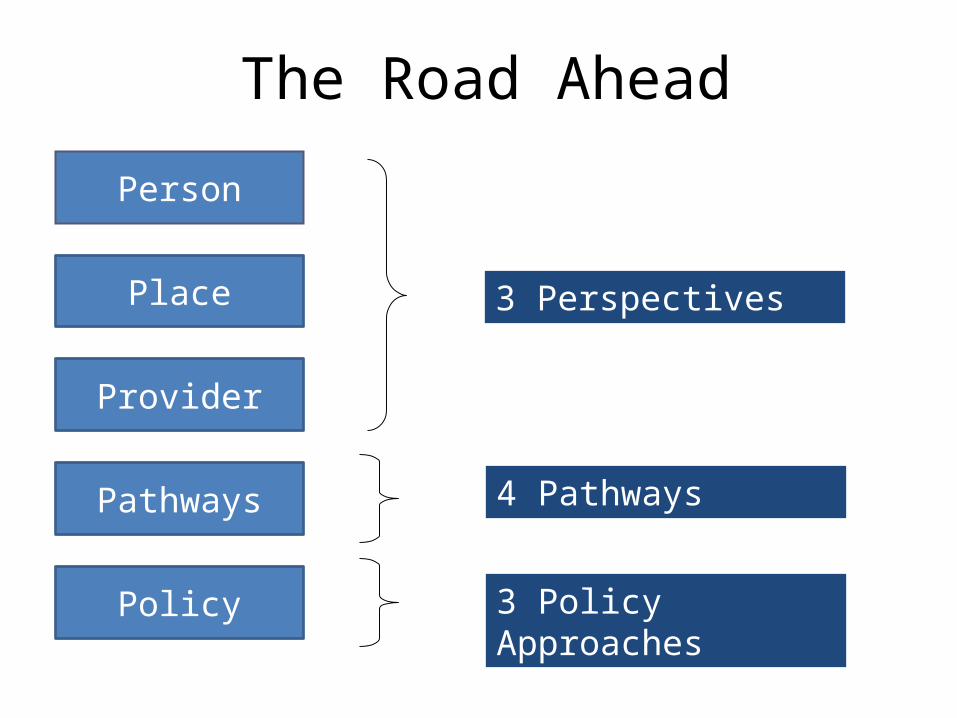
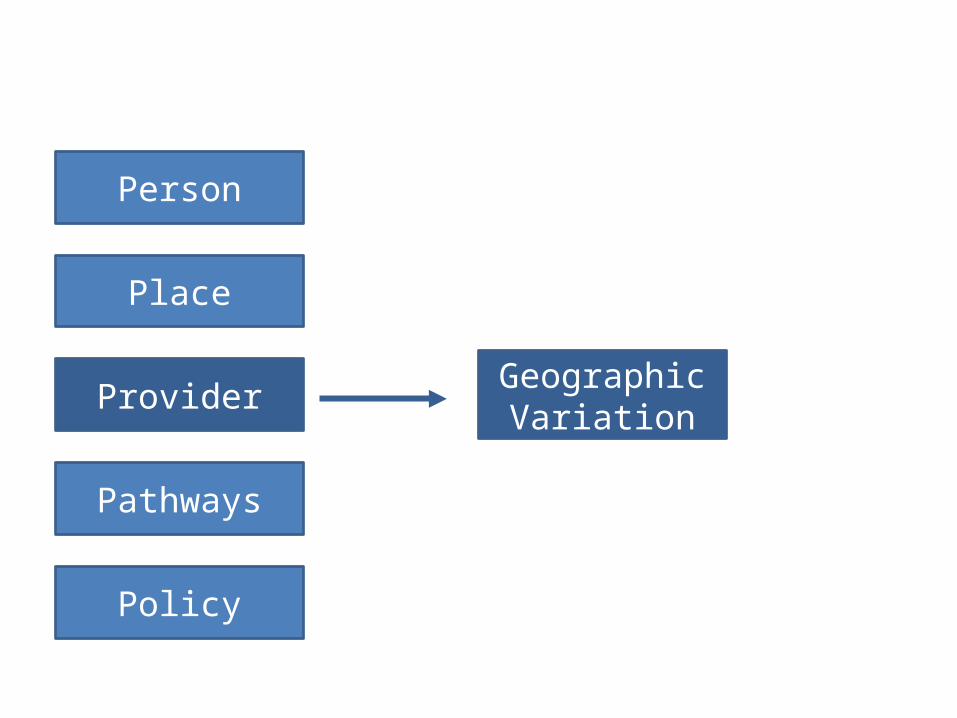
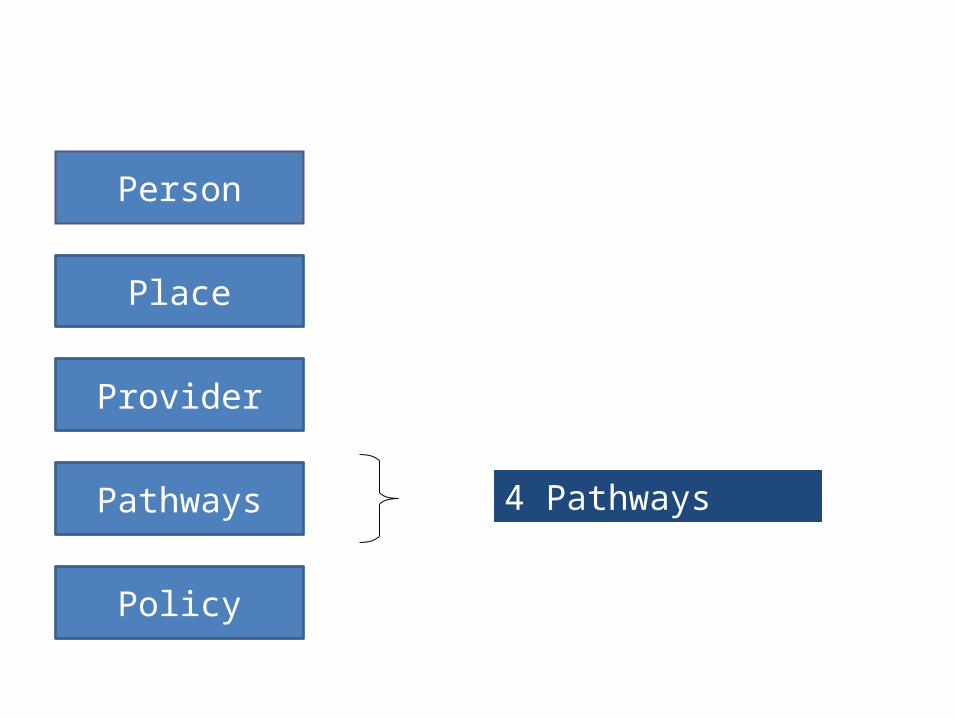
Person
Place
Provider
Pathways
Policy 3 Policy Approaches
4 Pathways
3 Perspectives
The Road Ahead
How to put coursework on SES in Perspective
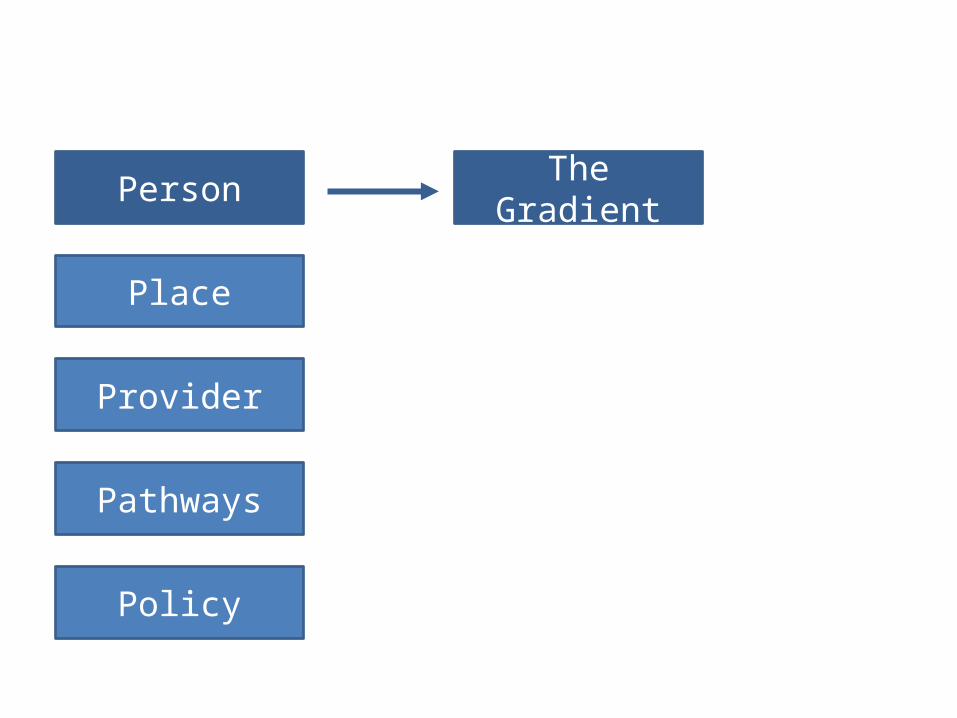
Person
Place
Provider
Pathways
Policy
The Gradient
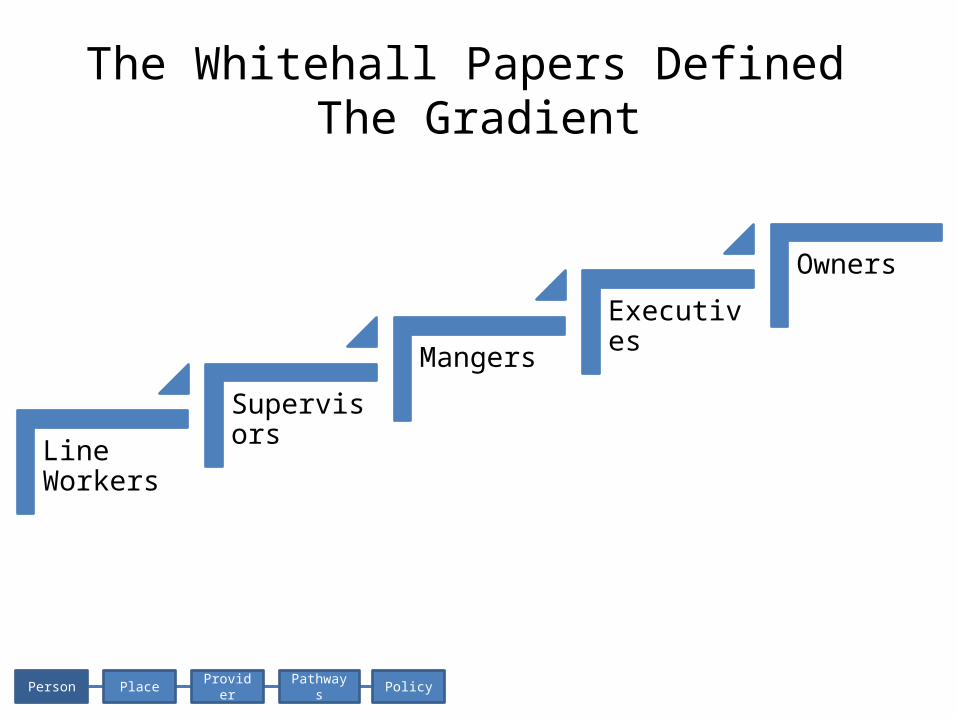
The Whitehall Papers Defined The Gradient
Person Place Provider Pathways Policy
Line Workers
Supervisors
Mangers
Executives
Owners
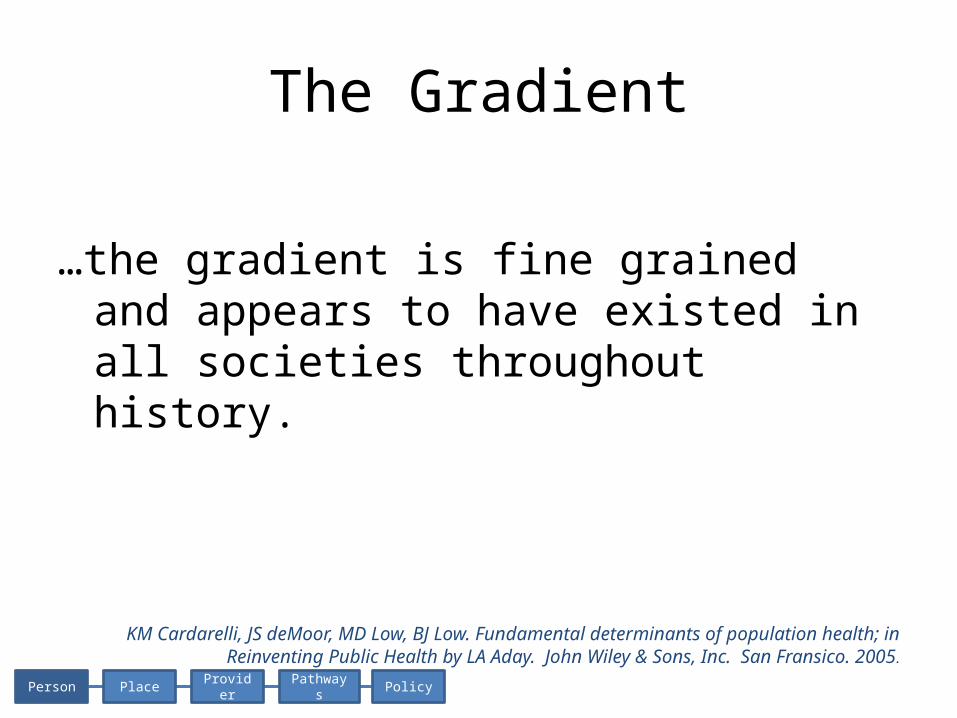
The Gradient
…the gradient is fine grained and appears to have existed in all societies throughout history.
KM Cardarelli, JS deMoor, MD Low, BJ Low. Fundamental determinants of population health; in Reinventing Public Health by LA Aday. John Wiley & Sons, Inc. San Fransico. 2005.
Person Place Provider Pathways Policy
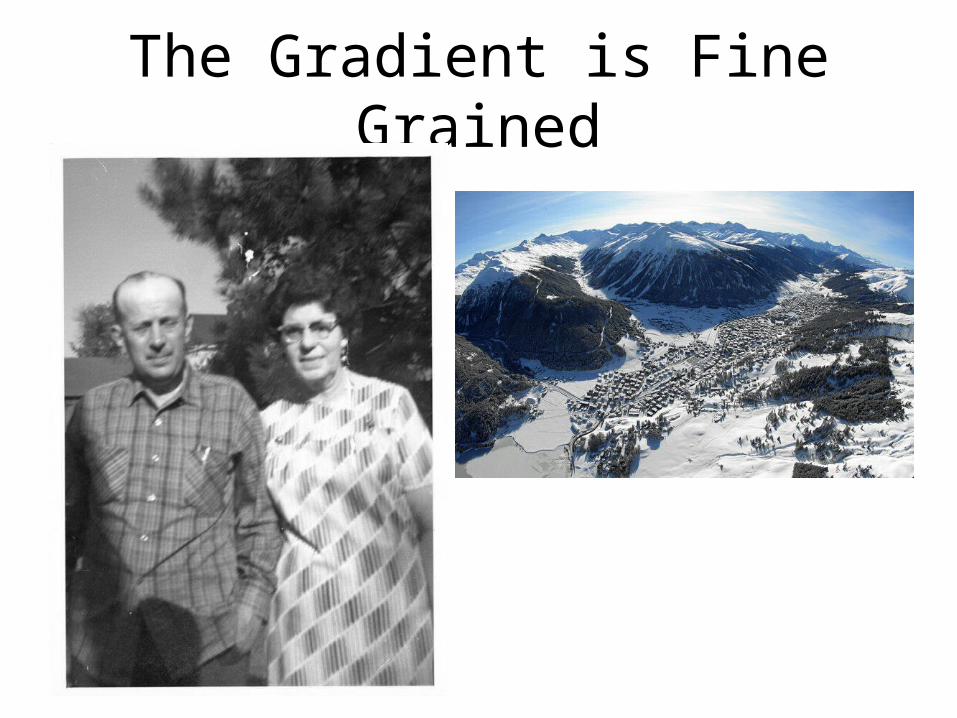
The Gradient is Fine Grained
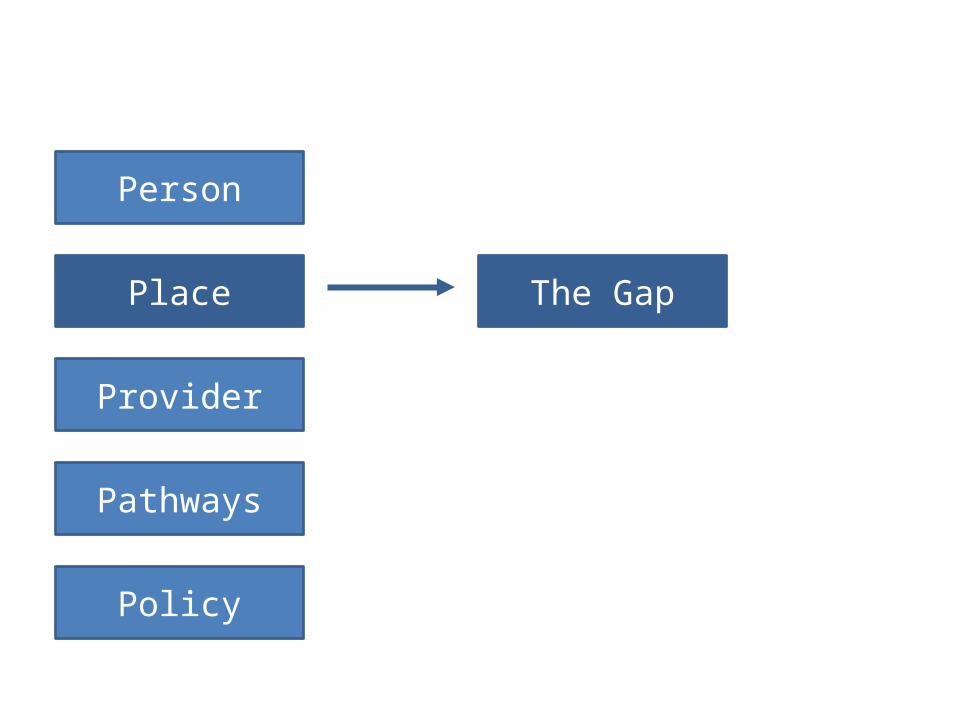
Person
Place
Provider
Pathways
Policy
The Gap
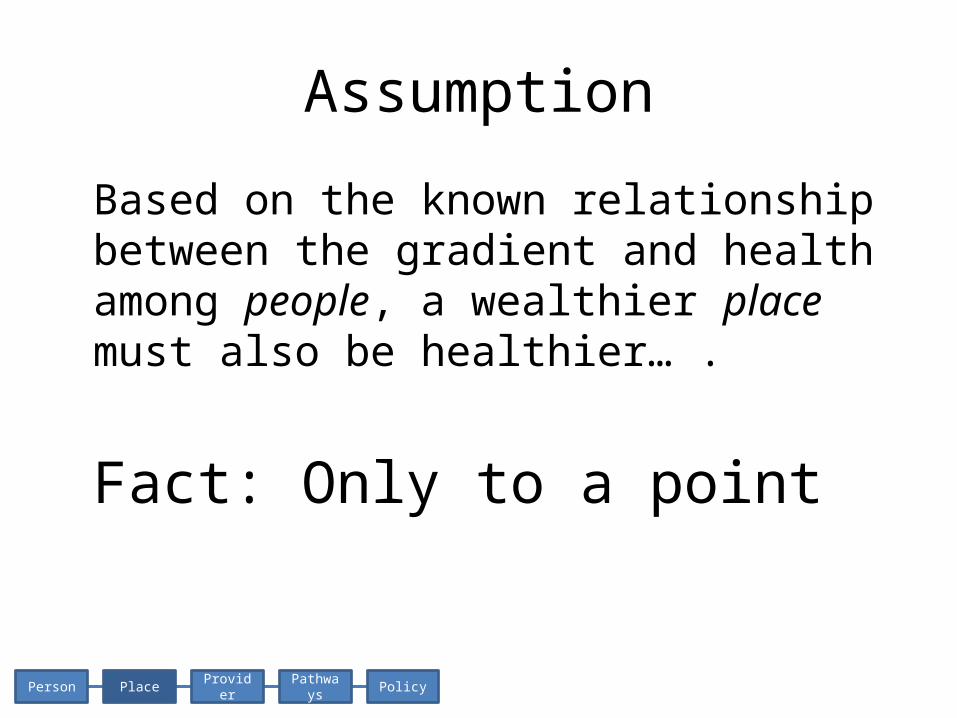
Assumption
Based on the known relationship between the gradient and health among people, a wealthier place must also be healthier… .
Fact: Only to a point
Person Place Provider Pathways Policy
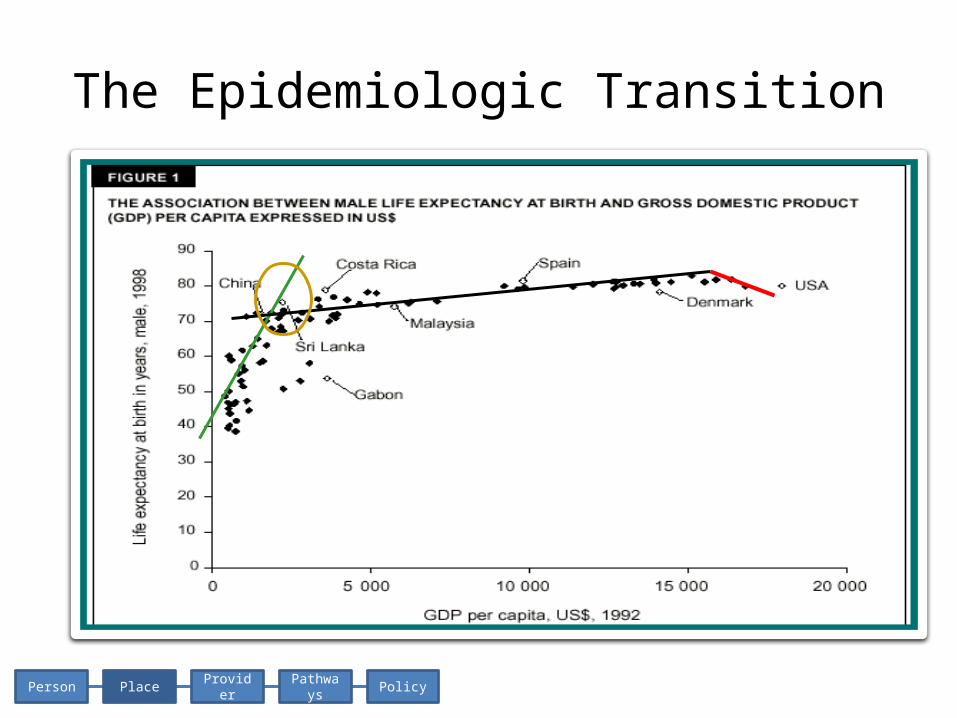
The Epidemiologic Transition
Person Place Provider Pathways Policy
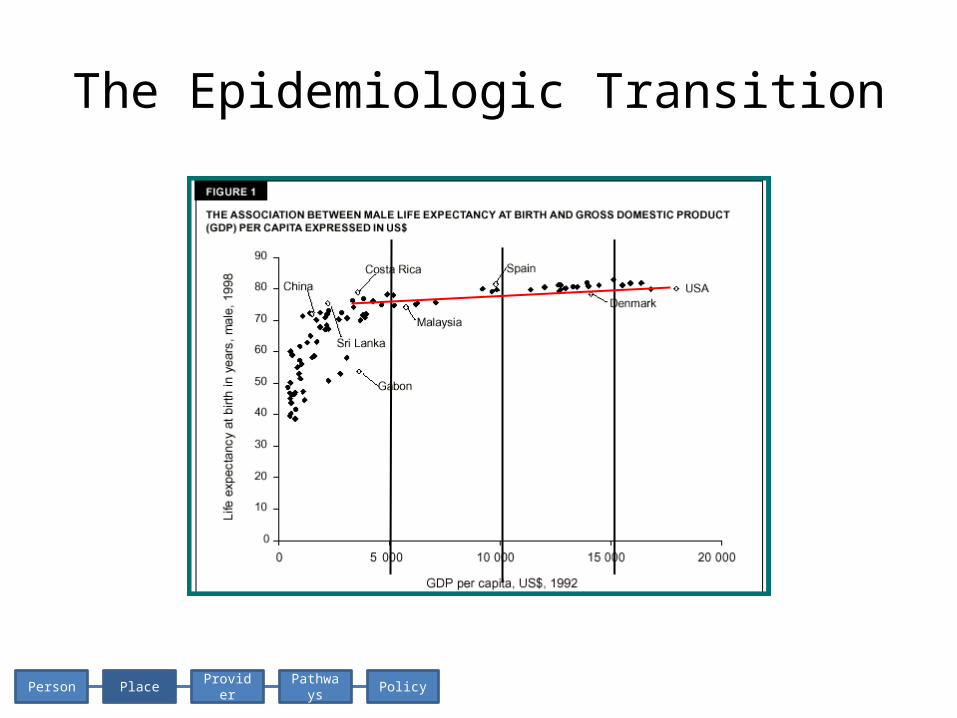
The Epidemiologic Transition
Person Place Provider Pathways Policy
What is poor?
Person Place Provider Pathways Policy
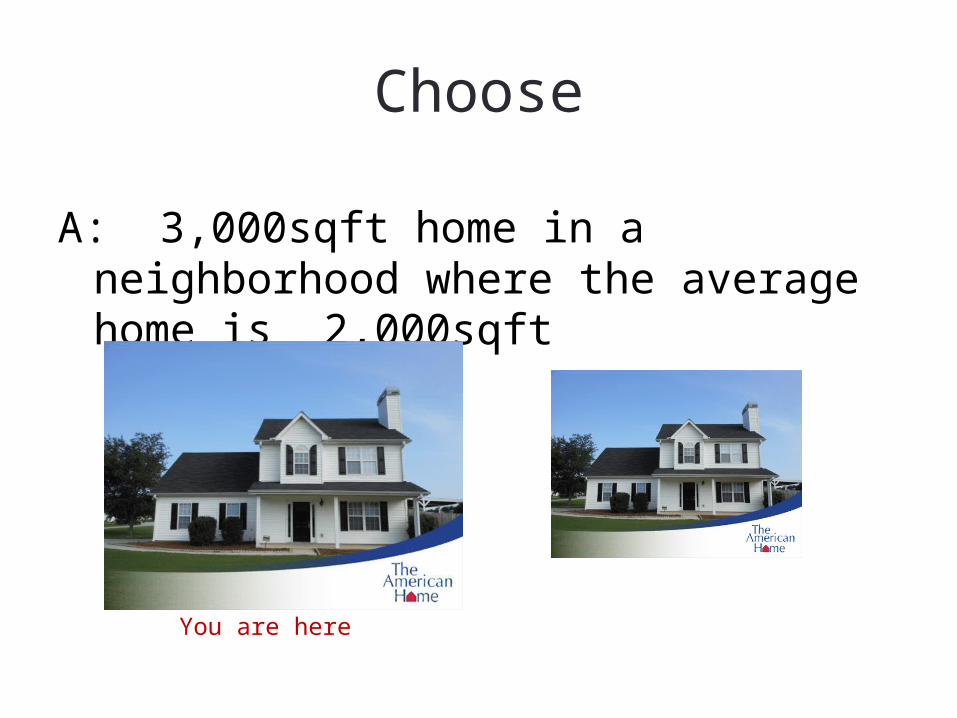
Choose
A: 3,000sqft home in a neighborhood where the average home is 2,000sqft
You are here
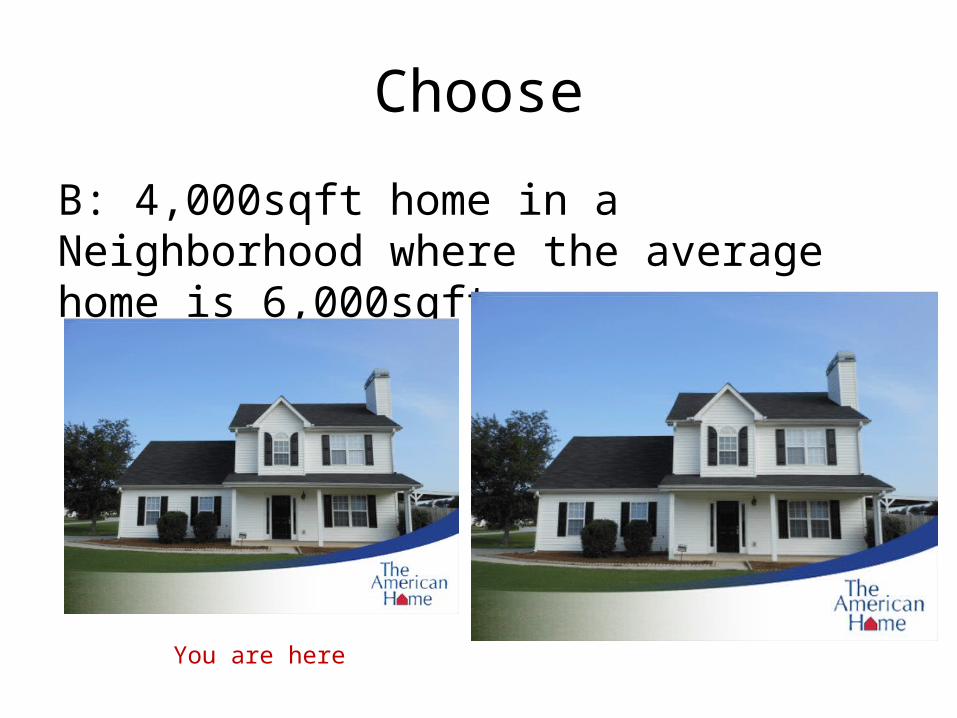
Choose
B: 4,000sqft home in a Neighborhood where the average home is 6,000sqft
You are here
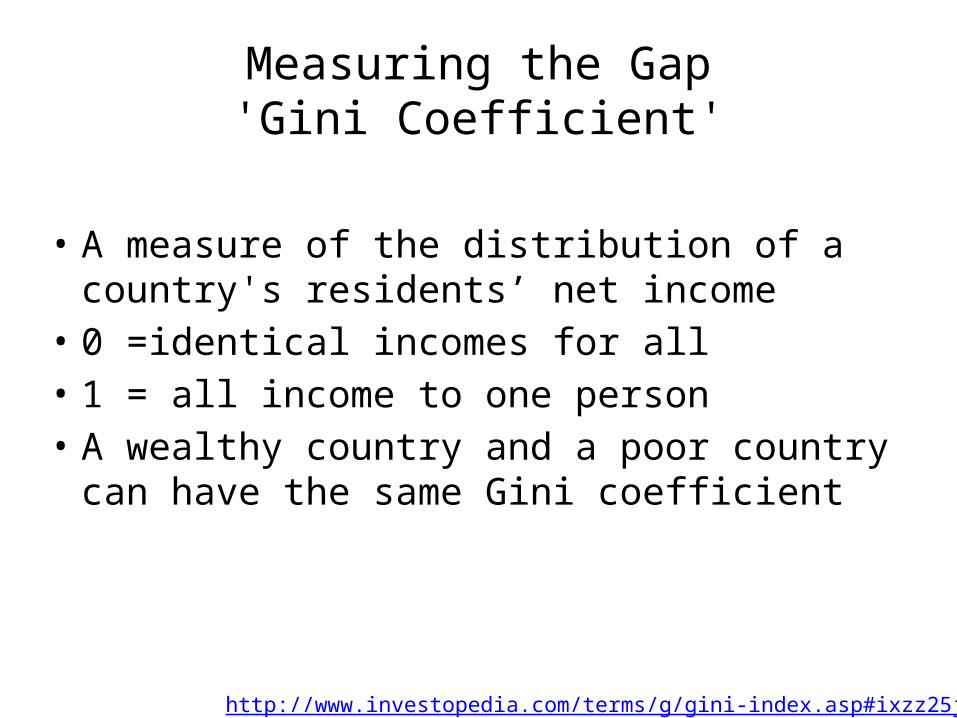
Measuring the Gap'Gini Coefficient'
• A measure of the distribution of a country's residents’ net income
• 0 =identical incomes for all• 1 = all income to one person • A wealthy country and a poor country can have
the same Gini coefficient
http://www.investopedia.com/terms/g/gini-index.asp#ixzz25jVc5wn4
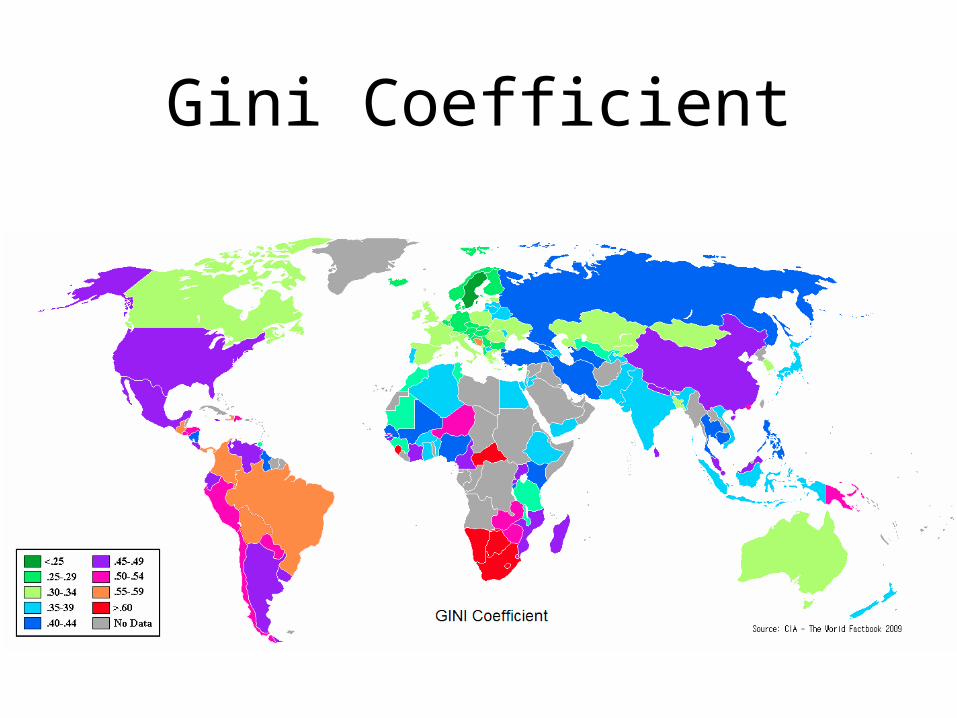
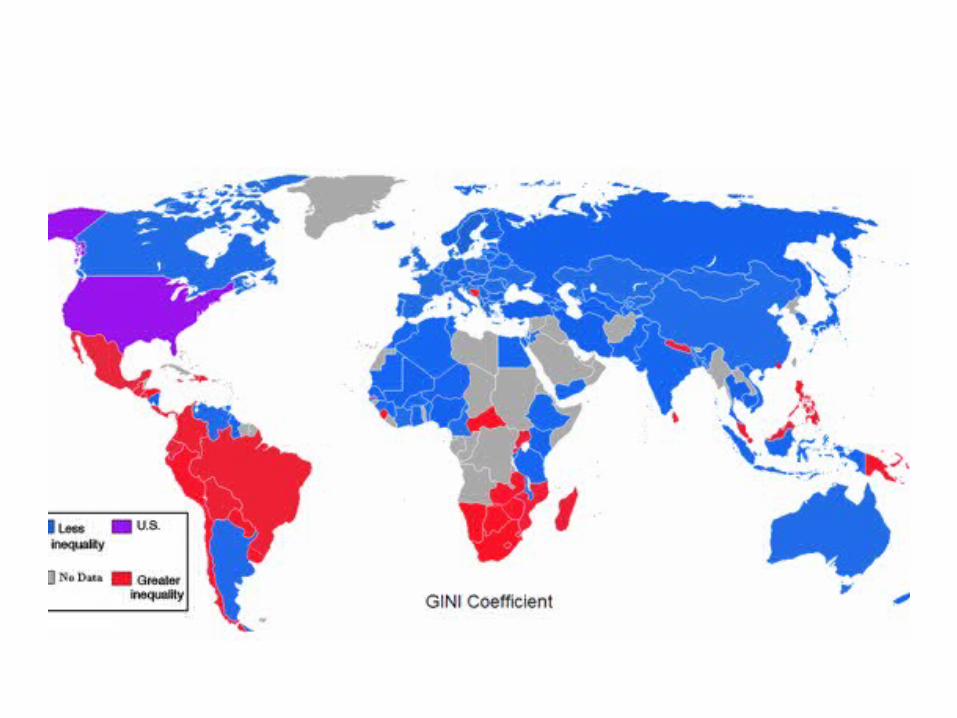
Gini Coefficient
Person
Place
Provider
Pathways
Policy
Geographic Variation
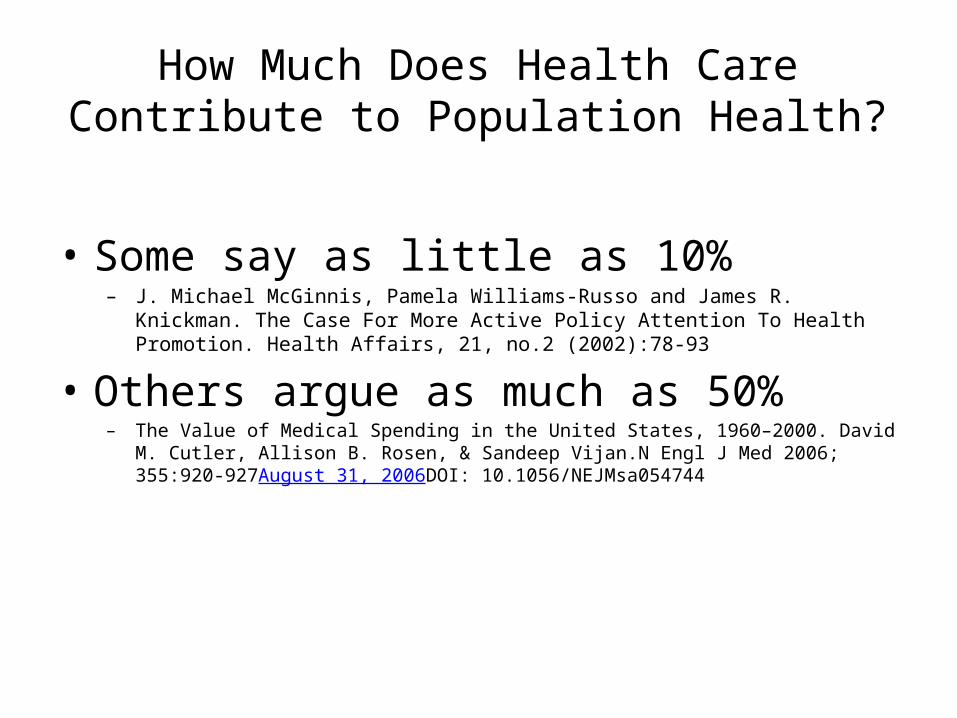
How Much Does Health Care Contribute to Population Health?
• Some say as little as 10%– J. Michael McGinnis, Pamela Williams-Russo and James R. Knickman. The Case For More
Active Policy Attention To Health Promotion. Health Affairs, 21, no.2 (2002):78-93
• Others argue as much as 50%– The Value of Medical Spending in the United States, 1960–2000. David M. Cutler, Allison B. Rosen, &
Sandeep Vijan.N Engl J Med 2006; 355:920-927August 31, 2006DOI: 10.1056/NEJMsa054744
Ask Yourself…
Would you expect to find an equal distribution of all races, incomes, and education-levels among the patients in every region of the US?
Person Place Provider Pathways Policy
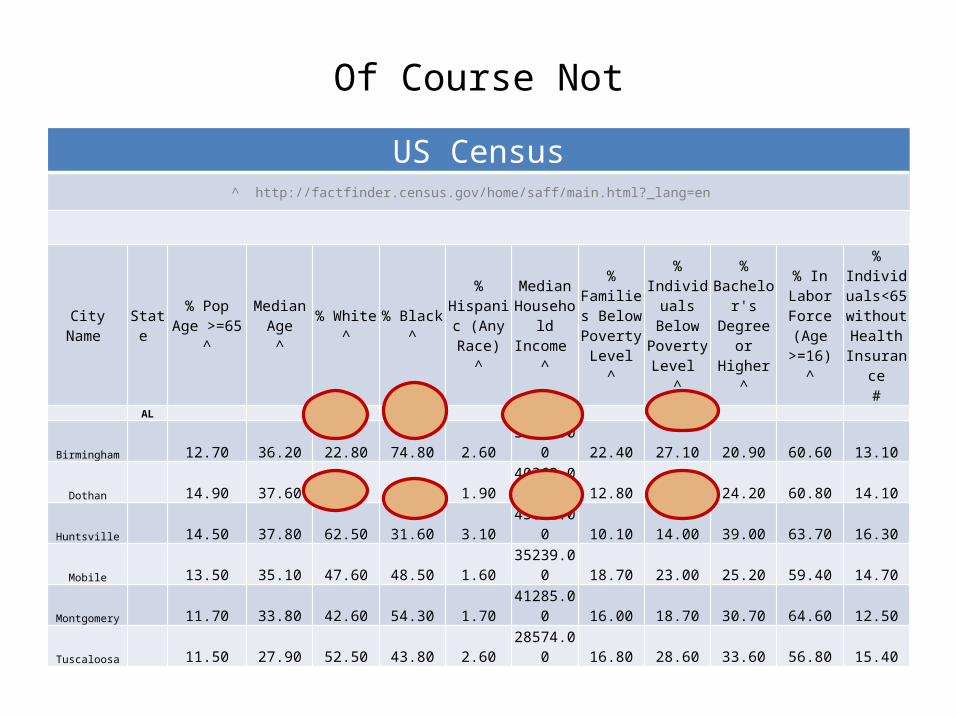
Of Course Not
US Census^ http://factfinder.census.gov/home/saff/main.html?_lang=en
City Name State % Pop Age
>=65 ^
Median Age
^% White
^% Black
^% Hispanic (Any Race)
^
Median Household
Income ^
% Families Below
Poverty Level
^
% Individuals
Below Poverty Level
^
% Bachelor's Degree or
Higher^
% In Labor Force (Age
>=16)^
% Individuals
<65 without Health
Insurance#
AL
Birmingham 12.70 36.20 22.80 74.80 2.60 30014.00 22.40 27.10 20.90 60.60 13.10
Dothan 14.90 37.60 66.00 30.90 1.90 40363.00 12.80 16.50 24.20 60.80 14.10
Huntsville 14.50 37.80 62.50 31.60 3.10 45851.00 10.10 14.00 39.00 63.70 16.30
Mobile 13.50 35.10 47.60 48.50 1.60 35239.00 18.70 23.00 25.20 59.40 14.70
Montgomery 11.70 33.80 42.60 54.30 1.70 41285.00 16.00 18.70 30.70 64.60 12.50
Tuscaloosa 11.50 27.90 52.50 43.80 2.60 28574.00 16.80 28.60 33.60 56.80 15.40
Geographic Variation
Some hospitals use effective care at higher rates than others
Hospital Quality And Intensity Of Spending: Is There An Association?Laura Yasaitis, Elliott S. Fisher, Jonathan S. Skinner, and Amitabh Chandra.
Health Affairs 28, no. 4 (2009): w566–w572
Person Place Provider Pathways Policy
Geographic Variation
Patient with lower SES tend to reside near and utilize hospitals that deliver lower quality care to ALL of their patients
Person Place Provider Pathways Policy
Key Insight from Geographic Variation Research #1
Because patients with lower SES are over represented in lower quality hospitals, the poor quality of the hospital will magnify the influence of SES on health status and longevity
Person Place Provider Pathways Policy
Key Insight from Geographic Variation Research #2
Policies designed to improve the quality of care delivered will have a positive impact on reducing SES disparities
Person Place Provider Pathways Policy
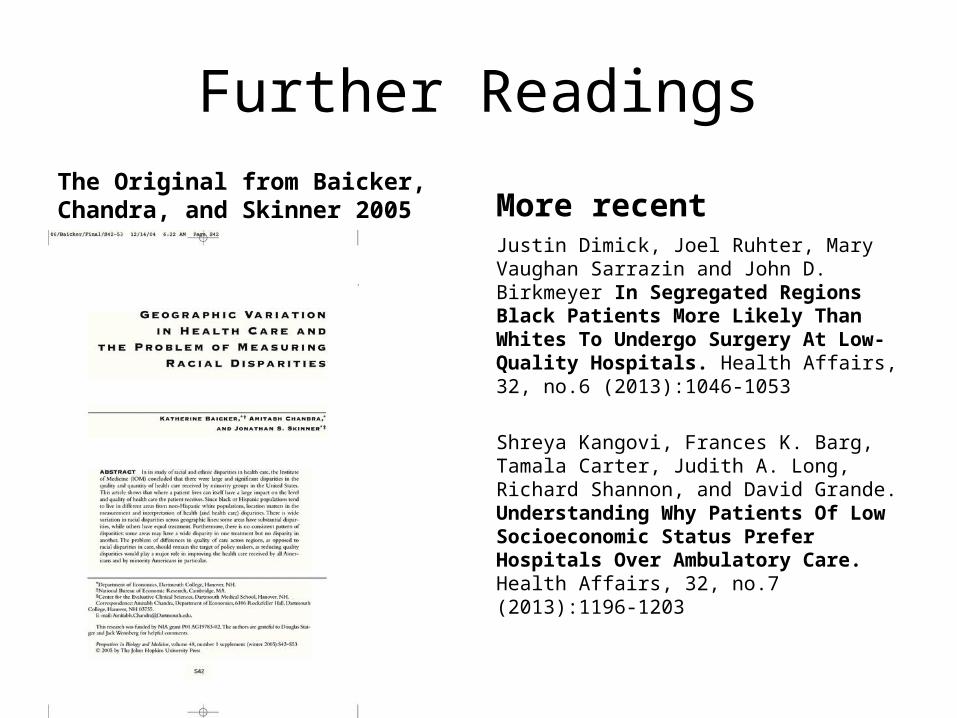
Further ReadingsThe Original from Baicker, Chandra, and Skinner 2005 More recent
Justin Dimick, Joel Ruhter, Mary Vaughan Sarrazin and John D. Birkmeyer In Segregated Regions Black Patients More Likely Than Whites To Undergo Surgery At Low-Quality Hospitals. Health Affairs, 32, no.6 (2013):1046-1053
Shreya Kangovi, Frances K. Barg, Tamala Carter, Judith A. Long, Richard Shannon, and David Grande. Understanding Why Patients Of Low Socioeconomic Status Prefer Hospitals Over Ambulatory Care. Health Affairs, 32, no.7 (2013):1196-1203
Remember
This type of analysis does NOT argue that all inequalities in health care are explained by geography.
Geography- the quality of the hospital where care is received- plays a role that should be considered
Person Place Provider Pathways Policy
How to put SES coursework in Perspective
Person
Place
Provider
Pathways
Policy
4 Pathways
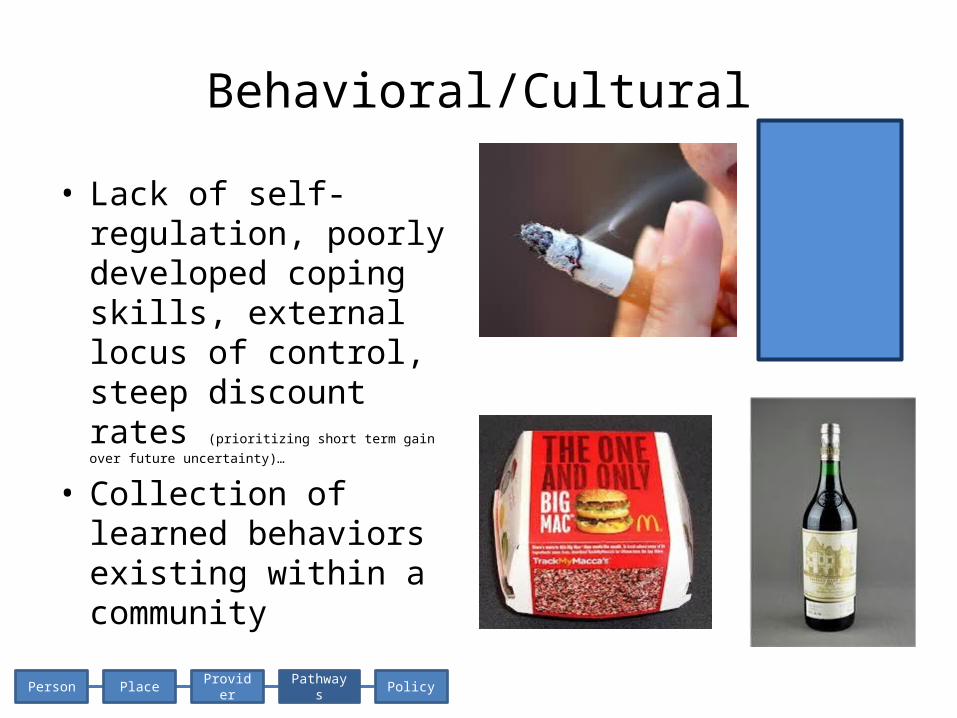
Behavioral/Cultural
• Lack of self-regulation, poorly developed coping skills, external locus of control, steep discount rates (prioritizing short term gain over future uncertainty)…
• Collection of learned behaviors existing within a community
Person Place Provider Pathways Policy
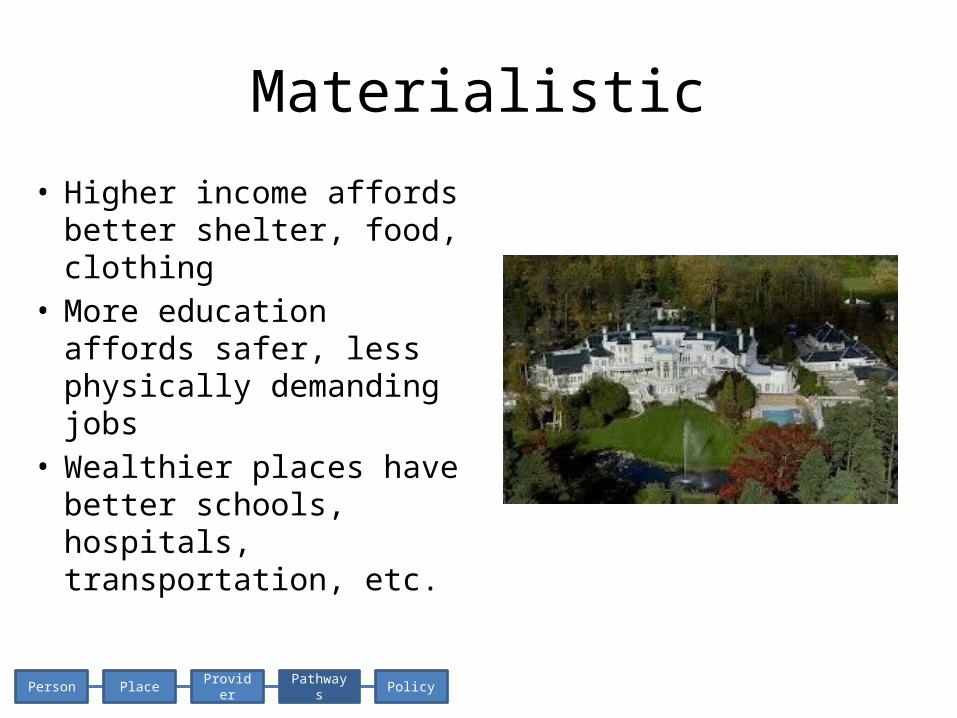
Materialistic
• Higher income affords better shelter, food, clothing
• More education affords safer, less physically demanding jobs
• Wealthier places have better schools, hospitals, transportation, etc.
Person Place Provider Pathways Policy
If behavioral or materialistic pathways fully explained inequalities….
But we don’t see this at all
Person Place Provider Pathways Policy
There is a fine gradient among people within a place.
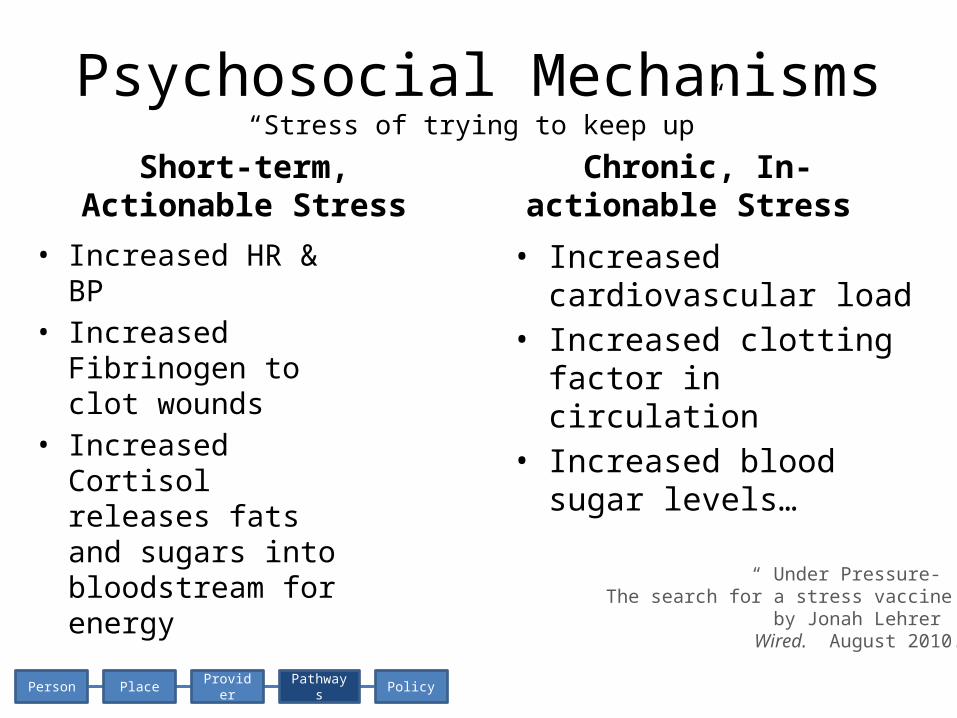
Psychosocial Mechanisms“Stress of trying to keep up”
Short-term, Actionable Stress
• Increased HR & BP • Increased Fibrinogen
to clot wounds• Increased Cortisol
releases fats and sugars into bloodstream for energy
Chronic, In-actionable Stress
• Increased cardiovascular load
• Increased clotting factor in circulation
• Increased blood sugar levels…
Person Place Provider Pathways Policy
“ Under Pressure- The search for a stress vaccine”
by Jonah Lehrer Wired. August 2010.
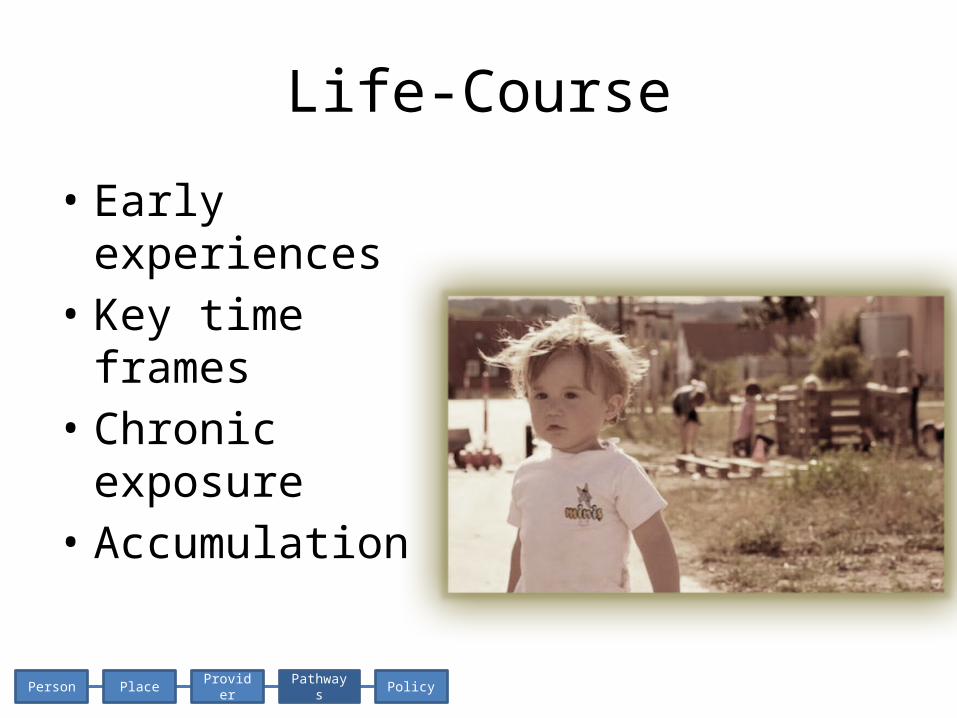
Life-Course
• Early experiences• Key time frames• Chronic exposure• Accumulation
Person Place Provider Pathways Policy
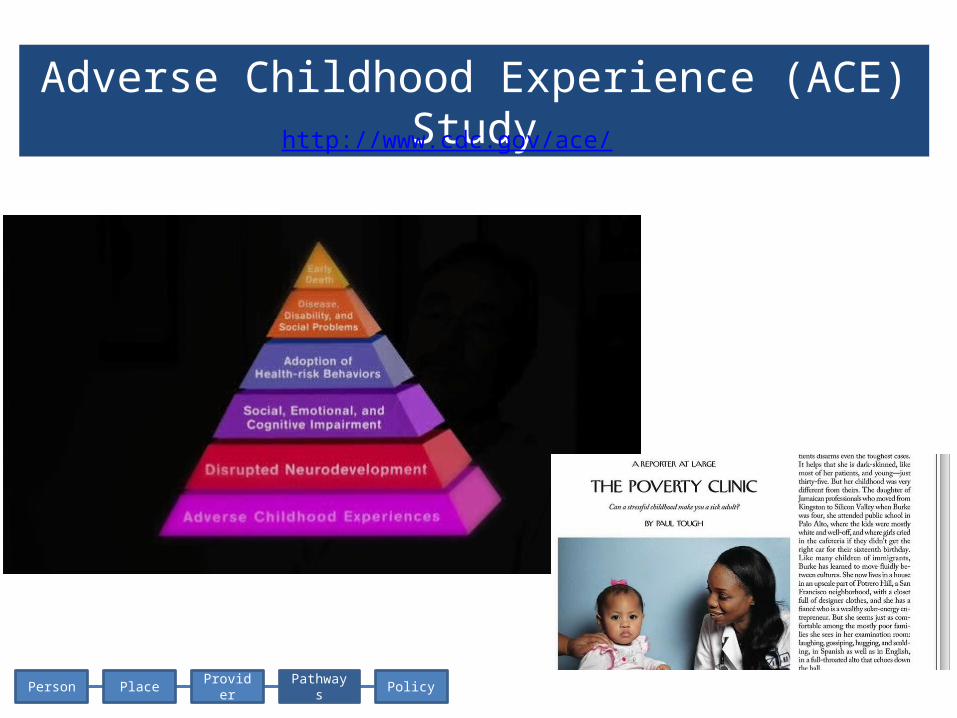
Person Place Provider Pathways Policy
Adverse Childhood Experience (ACE) Studyhttp://www.cdc.gov/ace/
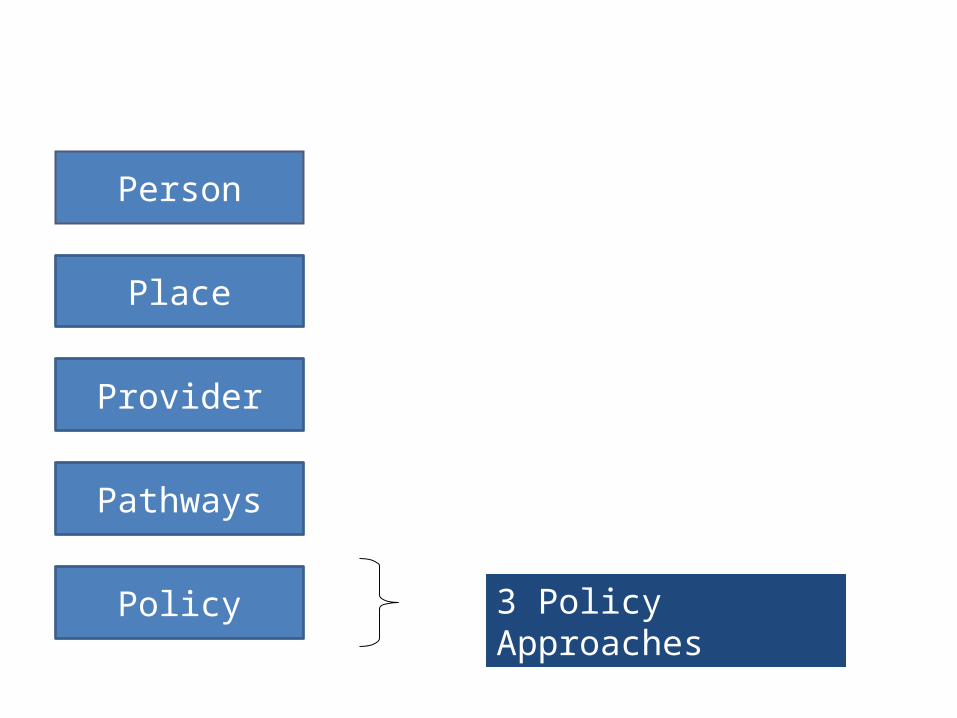
How to put SES coursework in Perspective
Person
Place
Provider
Pathways
Policy 3 Policy Approaches
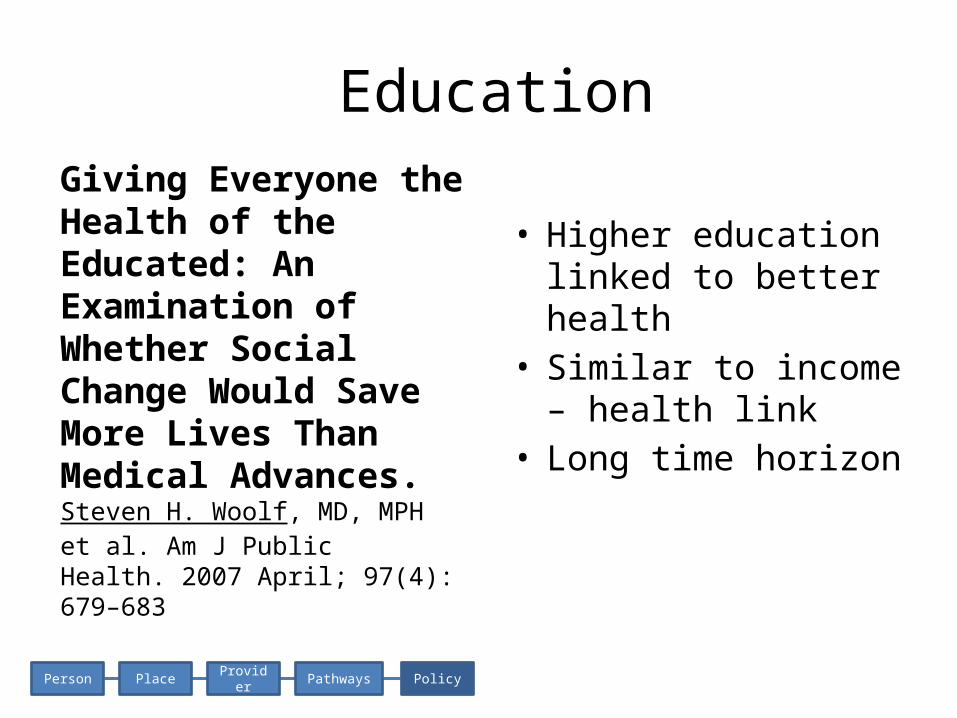
EducationGiving Everyone the Health of the Educated: An Examination of Whether Social Change Would Save More Lives Than Medical Advances. Steven H. Woolf, MD, MPH et al. Am J Public Health. 2007 April; 97(4): 679–683
• Higher education linked to better health
• Similar to income – health link
• Long time horizon
Person Place Provider Pathways Policy
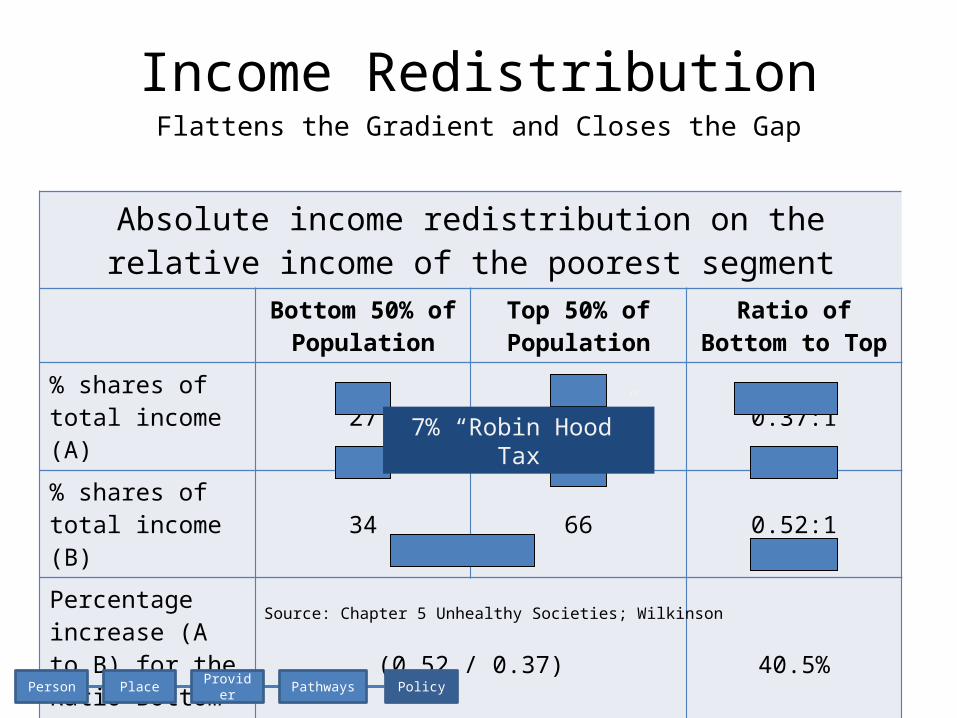
Absolute income redistribution on the relative income of the poorest segment
Bottom 50% of Population
Top 50% of Population
Ratio of Bottom to Top
% shares of total income (A) 27 73 0.37:1
% shares of total income (B) 34 66 0.52:1
Percentage increase (A to B) for the Ratio Bottom to Top
(0.52 / 0.37) 40.5%
Income RedistributionFlattens the Gradient and Closes the Gap
7% “Robin Hood” Tax
Person Place Provider Pathways Policy
Source: Chapter 5 Unhealthy Societies; Wilkinson
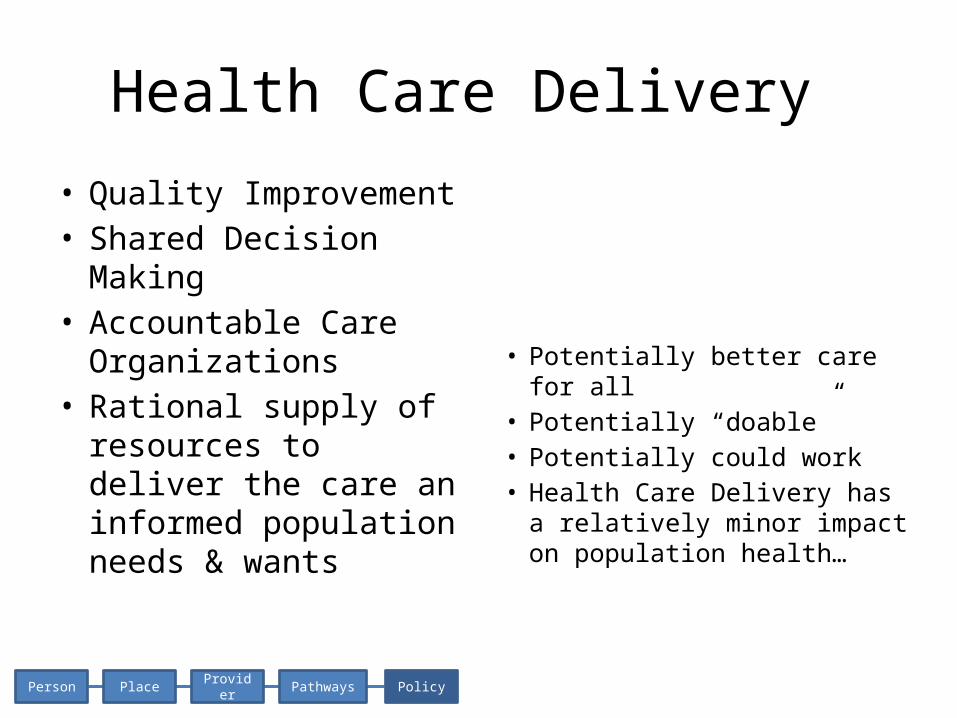
Health Care Delivery
• Quality Improvement• Shared Decision
Making• Accountable Care
Organizations• Rational supply of
resources to deliver the care an informed population needs & wants
• Potentially better care for all • Potentially “doable”• Potentially could work• Health Care Delivery has a
relatively minor impact on population health…
Person Place Provider Pathways Policy
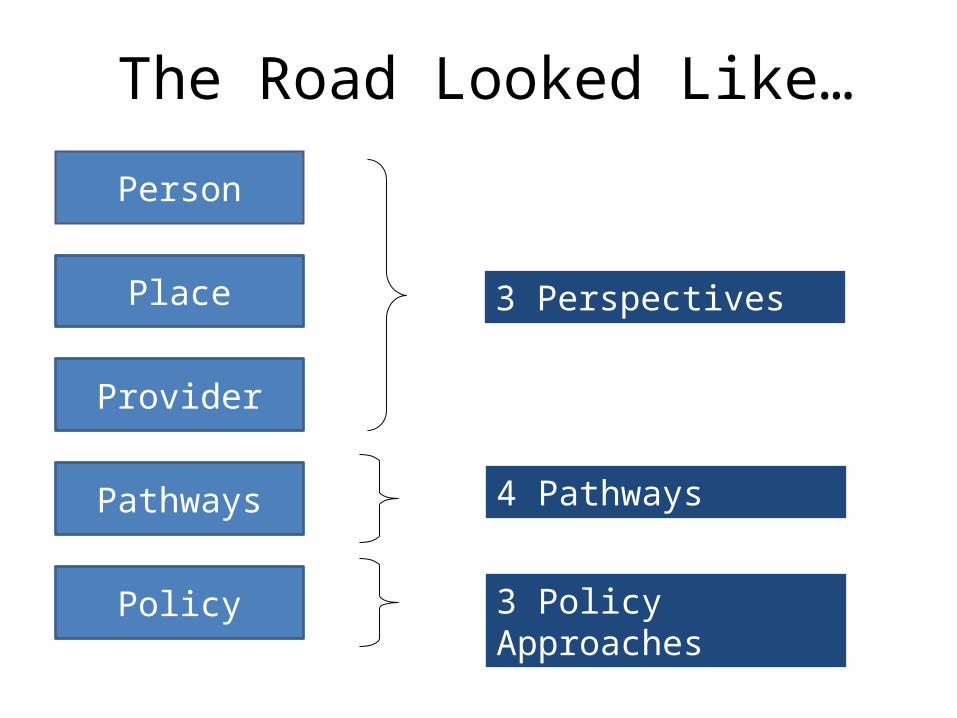
Person
Place
Provider
Pathways
Policy 3 Policy Approaches
4 Pathways
3 Perspectives
The Road Looked Like…
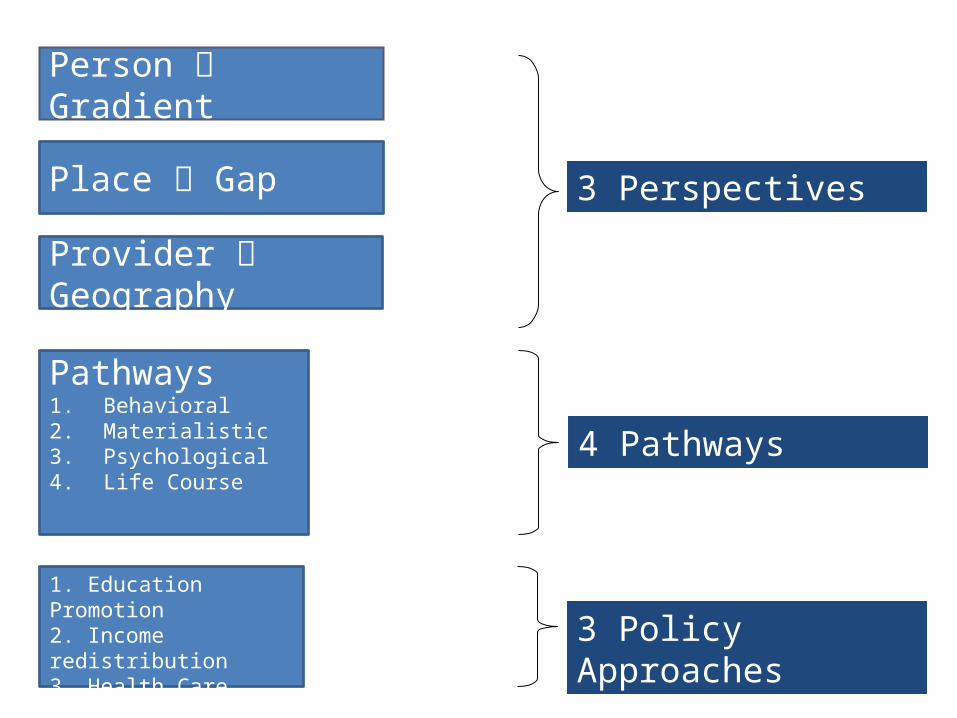
How to put SES coursework in Perspective Person Gradient
Place Gap
Provider Geography
Pathways1. Behavioral2. Materialistic3. Psychological4. Life Course
Policies1. Education Promotion2. Income redistribution3. Health Care Delivery
3 Policy Approaches
4 Pathways
3 Perspectives


![Socioeconomic Status Accounts for Rapidly Increasing ... · low socioeconomic status is a widespread predictor of poor health [19,20], and has been repeatedly linked to poor birth](https://img.pdfslide.us/doc/110x75/5e2de87a7443c340e9279f99/socioeconomic-status-accounts-for-rapidly-increasing-low-socioeconomic-status.jpg)