Embed Size (px)
Citation preview
American International Group, Inc.Quarterly Financial Supplement
Third Quarter 2016
All financial information in this document is unaudited. This report should be read in conjunction with AIG’s Quarterly Report on Form 10-Q for the quarter ended September 30, 2016, which will be filed with the Securities and Exchange Commission.
American International Group, Inc.Quarterly Financial Supplement
Contacts: InvestorsLiz Werner: (212) 770-7074; [email protected]
Fernando Melon: (212) 770-4630; [email protected]
Table of Contents Page(s) Cautionary Statement Regarding Forward-Looking Information ...................................1Non-GAAP Financial Measures ........................................................................................2-3Consolidated Results Consolidated Statement of Operations.................................................................................4 Earnings Per Share Computations .......................................................................................5 Reconciliations of Pre-tax and After-tax Operating Income ...............................................6 Return on Equity and Per Share Data ..................................................................................7 Selected Segment Data ........................................................................................................8 General Operating and Other Expenses...............................................................................9 Condensed Consolidated Balance Sheets .....................................................................10-12 Debt and Capital ................................................................................................................13 Notes.............................................................................................................................14-15Commercial Insurance ...................................................................................................16-19 Notes........................................................................................................................20-21
Consumer Insurance Operating Results ...........................................................................22 Retirement ...............................................................................................................23-24 Fixed Annuities....................................................................................................25-26 Retirement Income Solutions .............................................................................27-28 Group Retirement ................................................................................................29-31 Life ..........................................................................................................................32-33 Personal Insurance...................................................................................................34-37 Notes........................................................................................................................38-41Corporate and Other .....................................................................................................42-44 United Guaranty ......................................................................................................45-46 Institutional Markets................................................................................................47-48 Notes........................................................................................................................49-50Investments .....................................................................................................................51-54 Notes .............................................................................................................................55Appendix Supplemental Commercial Insurance Information ......................................................56 Acronyms......................................................................................................................57
1
American International Group, Inc.Cautionary Statement Regarding Forward-Looking Information
This Financial Supplement may include, and officers and representatives of American International Group, Inc. (AIG) may from time to time make, projections, goals, assumptions and statements that may constitute “forward-looking statements” within the meaning of the Private Securities Litigation Reform Act of 1995. These projections, goals, assumptions and statements are not historical facts but instead represent only AIG’s belief regarding future events, many of which, by their nature, are inherently uncertain and outside AIG’s control. These projections, goals, assumptions and statements include statements preceded by, followed by or including words such as “will,” “believe,” “anticipate,” “expect,” “intend,” “plan,” “focused on achieving,” “view,” “target,” “goal” or “estimate.” These projections, goals, assumptions and statements may address, among other things, AIG’s: exposures to subprime mortgages, monoline insurers, the residential and commercial real estate markets, state and municipal bond issuers, sovereign bond issuers, the energy sector and currency exchange rates; exposure to European governments and European financial institutions; strategy for risk management; sales of businesses; restructuring of business operations; generation of deployable capital; strategies to increase return on equity and earnings per common share; strategies to grow net investment income, efficiently manage capital, grow book value per common share, and reduce expenses; anticipated restructuring charges and annual cost savings; anticipated business or asset divestitures or monetizations; anticipated organizational and business changes; strategies for customer retention, growth, product development, market position, financial results and reserves; and subsidiaries’ revenues and combined ratios.
It is possible that AIG’s actual results and financial condition will differ, possibly materially, from the results and financial condition indicated in these projections, goals, assumptions and statements. Factors that could cause AIG’s actual results to differ, possibly materially, from those in the specific projections, goals, assumptions and statements include:
changes in market conditions;
negative impacts on customers, business partners and other stakeholders;
the occurrence of catastrophic events, both natural and man-made;
significant legal proceedings;
the timing and applicable requirements of any new regulatory framework to which AIG is subject as a nonbank systemically important financial institution and as a global
systemically important insurer;
concentrations in AIG’s investment portfolios;
actions by credit rating agencies;
judgments concerning casualty insurance underwriting and insurance liabilities;
AIG’s ability to successfully manage run-off insurance portfolios;
AIG’s ability to successfully reduce costs and expenses and make business and organizational changes without negatively impacting client relationships or its competitive
position;
AIG’s ability to successfully dispose of, or monetize, businesses or assets, including its ability to successfully consummate the sale of United Guaranty Corporation (UGC or
United Guaranty) and certain related affiliates to Arch Capital Group Ltd. (Arch);
judgments concerning the recognition of deferred tax assets;
judgments concerning estimated restructuring charges and estimated cost savings; and
such other factors discussed in Part I, Item 2. Management’s Discussion and Analysis of Financial Condition and Results of Operations (MD&A) in AIG’s Quarterly Report on Form 10-Q for the quarterly period ended September 30, 2016 (which will be filed with the Securities and Exchange Commission), Part I, Item 2. MD&A and Part II, Item 1A. Risk Factors in AIG’s Quarterly Report on Form 10-Q for the quarterly period ended June 30, 2016, Part I, Item 2. MD&A and Part II, Item 1A. Risk Factors in AIG’s Quarterly Report on Form 10-Q for the quarterly period ended March 31, 2016, and Part II, Item 7. MD&A and Part I, Item 1A. Risk Factors in AIG’s Annual Report on Form 10-K for the year ended December 31, 2015.
AIG is not under any obligation (and expressly disclaims any obligation) to update or alter any projections, goals, assumptions or other statements, whether written or oral, that may be made from time to time, whether as a result of new information, future events or otherwise.
2
American International Group, Inc.Non-GAAP Financial Measures
Throughout this Financial Supplement, we present our financial condition and results of operations in the way we believe will be most meaningful and representative of our business results. Some of the measurements we use are ‘‘non-GAAP financial measures’’ under Securities and Exchange Commission rules and regulations. GAAP is the acronym for ‘‘accounting principles generally accepted in the United States.’’ The non-GAAP financial measures we present may not be comparable to similarly-named measures reported by other companies.
Book Value Per Common Share Excluding Accumulated Other Comprehensive Income (AOCI) and Book Value Per Common Share Excluding AOCI and Deferred Tax Assets (DTA) are used to show the amount of our net worth on a per-share basis. We believe these measures are useful to investors because they eliminate items that can fluctuate significantly from period to period, including changes in fair value of our available for sale securities portfolio, foreign currency translation adjustments and U.S. tax attribute deferred tax assets. These measures also eliminate the asymmetrical impact resulting from changes in fair value of our available for sale securities portfolio wherein there is largely no offsetting impact for certain related insurance liabilities. We exclude deferred tax assets representing U.S. tax attributes related to net operating loss carryforwards and foreign tax credits as they have not yet been utilized. Amounts for interim periods are estimates based on projections of full-year attribute utilization. As net operating loss carryforwards and foreign tax credits are utilized, the portion of the DTA utilized is included in Book Value Per Common Share. Book Value Per Common Share Excluding AOCI is derived by dividing Total AIG shareholders’ equity, excluding AOCI, by Total common shares outstanding. Book Value Per Common Share Excluding AOCI and DTA is derived by dividing Total AIG shareholders’ equity, excluding AOCI and DTA, by Total common shares outstanding. The reconciliation to book value per common share, the most comparable GAAP measure, is presented on page 7 herein.
Return on Equity – After-tax Operating Income Excluding AOCI and Return on Equity – After-tax Operating Income Excluding AOCI and DTA are used to show the rate of return on shareholders’ equity. We believe these measures are useful to investors because they eliminate items that can fluctuate significantly from period to period, including changes in fair value of our available for sale securities portfolio, foreign currency translation adjustments and U.S. tax attribute deferred tax assets. These measures also eliminate the asymmetrical impact resulting from changes in fair value of our available for sale securities portfolio wherein there is largely no offsetting impact for certain related insurance liabilities. We exclude deferred tax assets representing U.S. tax attributes related to net operating loss carryforwards and foreign tax credits as they have not yet been utilized. Amounts for interim periods are estimates based on projections of full-year attribute utilization. As net operating loss carryforwards and foreign tax credits are utilized, the portion of the DTA utilized is included in Return on Equity. Return on Equity – After-tax Operating Income Excluding AOCI is derived by dividing actual or annualized after-tax operating income attributable to AIG by average AIG shareholders’ equity, excluding average AOCI. Return on Equity – After-tax Operating Income Excluding AOCI and DTA is derived by dividing actual or annualized after-tax operating income attributable to AIG by average AIG shareholders’ equity, excluding average AOCI and DTA. The reconciliation to return on equity, the most comparable GAAP measure, is presented on page 7 herein.
Normalized Return on Equity, Excluding AOCI and DTA further adjusts Return on Equity – After-tax Operating Income, excluding AOCI and DTA for the effects of certain volatile or market related items. We believe this measure is useful to investors because it presents the trends in our consolidated return on equity without the impact of certain items that can experience volatility in our short-term results. Normalized Return on Equity, Excluding AOCI and DTA is derived by excluding the following tax adjusted effects from Return on Equity – After-tax Operating Income, Excluding AOCI and DTA: the difference between actual and expected (i) catastrophe losses, (ii) alternative investment returns, and (iii) Direct Investment book (DIB) and Global Capital Markets (GCM) returns; fair value changes on PICC investments; update of actuarial assumptions; net reserve discount change; Life insurance incurred but not reported (IBNR) death claim charge; and prior year loss reserve development. The reconciliation to Return on Equity – After-tax Operating Income Excluding AOCI and DTA, is presented on page 14 herein.
We use the following operating performance measures because we believe they enhance the understanding of the underlying profitability of continuing operations and trends of our business segments. We believe they also allow for more meaningful comparisons with our insurance competitors. When we use these measures, reconciliations to the most comparable GAAP measure are provided on a consolidated basis.
After-tax operating income attributable to AIG is derived by excluding the following items from net income attributable to AIG. These items generally fall into one or more of the following broad categories: legacy matters having no relevance to our current businesses or operating performance; adjustments to enhance transparency to the underlying economics of transactions; and measures that we believe to be common to the industry. For example, certain ratios and other metrics described below exclude:
• deferred income tax valuation allowance releases and charges;• changes in fair value of securities used to hedge guaranteed living benefits;• changes in benefit reserves and deferred policy acquisition costs (DAC), value of business acquired
(VOBA), and sales inducement assets (SIA) related to net realized capital gains and losses;• other income and expense — net, related to Corporate and Other run-off insurance lines;• loss on extinguishment of debt;• net realized capital gains and losses;• non-qualifying derivative hedging activities, excluding net realized capital gains and losses;• income or loss from discontinued operations;
• income and loss from divested businesses, including: gain on the sale of International Lease Finance Corporation (ILFC); gain on the sale of NSM Insurance Group (NSM) and AIG Advisor Group; and certain post-acquisition transaction expenses incurred by AerCap Holdings N.V. (AerCap) in
connection with its acquisition of ILFC and the difference between expensing AerCap’s maintenance rights assets over the remaining lease term as compared to the remaining economic life of the related aircraft and related tax effects;
• legacy tax adjustments primarily related to certain changes in uncertain tax positions and other tax adjustments;
• non-operating litigation reserves and settlements;• reserve development related to non-operating run-off insurance business; and• restructuring and other costs related to initiatives designed to reduce operating expenses, improve
efficiency and simplify our organization.
Operating revenue excludes Net realized capital gains (losses), income from non-operating litigation settlements (included in Other income for GAAP purposes) and changes in fair value of securities used to hedge guaranteed living benefits (included in Net investment income for GAAP purposes).
3
American International Group, Inc.Non-GAAP Financial Measures (continued)
General operating expenses, operating basis, is derived by making the following adjustments to general operating and other expenses: include (i) certain loss adjustment expenses, reported as policyholder benefits and losses incurred and (ii) certain investment and other expenses reported as net investment income, and exclude (i) advisory fee expenses, (ii) non-deferrable insurance commissions, (iii) direct marketing and acquisition expenses, net of deferrals, (iv) non-operating litigation reserves and (v) other expense related to a retroactive reinsurance agreement. We use general operating expenses, operating basis, because we believe it provides a more meaningful indication of our ordinary course of business operating costs.
We use the following operating performance measures within our Commercial Insurance and Consumer Insurance reportable segments as well as Corporate and Other.
Commercial Insurance; Consumer Insurance: Personal Insurance; Corporate and Other: United Guaranty
• Pre-tax operating income: includes both underwriting income and loss and net investment income, but excludes net realized capital gains and losses, other income and expense — net, gain on the sale of NSM, and non-operating litigation reserves and settlements. Underwriting income and loss is derived by reducing net premiums earned by losses and loss adjustment expenses incurred, acquisition expenses and general operating expenses.
• Ratios: We, along with most property and casualty insurance companies, use the loss ratio, the expense ratio and the combined ratio as measures of underwriting performance. These ratios are relative measurements that describe, for every $100 of net premiums earned, the amount of losses and loss adjustment expenses, and the amount of other underwriting expenses that would be incurred. A combined ratio of less than 100 indicates underwriting income and a combined ratio of over 100 indicates an underwriting loss. Our ratios are calculated using the relevant information calculated under GAAP, and thus may not be comparable to similar ratios calculated for regulatory reporting purposes. The underwriting environment varies across countries and products, as does the degree of litigation activity, all of which affect such ratios. In addition, investment returns, local taxes, cost of capital, regulation, product type and competition can have an effect on pricing and consequently on profitability as reflected in underwriting income and associated ratios.
• Accident year loss and combined ratios, as adjusted: both the accident year loss and combined ratios, as adjusted, exclude catastrophe losses and related reinstatement premiums, prior year development, net of premium adjustments, and the impact of reserve discounting. Natural catastrophe losses are generally weather or seismic events having a net impact in excess of $10 million each. Catastrophes also include certain man-made events, such as terrorism and civil disorders, that meet the $10 million threshold. We believe the as adjusted ratios are meaningful measures of our underwriting results on an on-going basis as they exclude catastrophes and the impact of reserve discounting which are outside of management’s control. We also exclude prior year development to provide transparency related to current accident year results.
Consumer Insurance: Retirement and Life; Corporate and Other: Institutional Markets
• Pre-tax operating income is derived by excluding the following items from pre-tax income:
changes in fair value of securities used to hedge guaranteed living benefits; net realized capital gains and losses; gain on the sale of AIG Advisor Group; changes in benefit reserves and DAC, VOBA and SIA related to net realized capital gains and losses; and non-operating litigation reserves and settlements.
Premiums and deposits: includes direct and assumed amounts received and earned on traditional life insurance policies, group benefit policies and life-contingent payout annuities, as well as deposits received on universal life, investment-type annuity contracts and mutual funds.
Corporate and Other — Pre-tax operating income and loss is derived by excluding the following items from pre-tax income and loss:• loss on extinguishment of debt;• net realized capital gains and losses;• changes in benefit reserves and DAC, VOBA and SIA related to net realized capital
gains and losses;• income and loss from divested businesses, including Aircraft Leasing;
• net gain or loss on sale of divested businesses, including: gain on the sale of ILFC; and certain post-acquisition transaction expenses incurred by AerCap in connection with its
acquisition of ILFC and the difference between expensing AerCap’s maintenance rights assets over the remaining lease term as compared to the remaining economic life of the related aircraft and our share of AerCap’s income taxes;
• non-operating litigation reserves and settlements;• reserve development related to non-operating run-off insurance business; and• restructuring and other costs related to initiatives designed to reduce operating expenses,
improve efficiency and simplify our organization.
Results from discontinued operations are excluded from all of these measures.
4
American International Group, Inc.Consolidated Statement of Operations
Consolidated Results
Nine Months Ended(in millions) Quarterly September 30,
3Q16 2Q16 1Q16 4Q15 3Q15 2016 2015 Revenues:
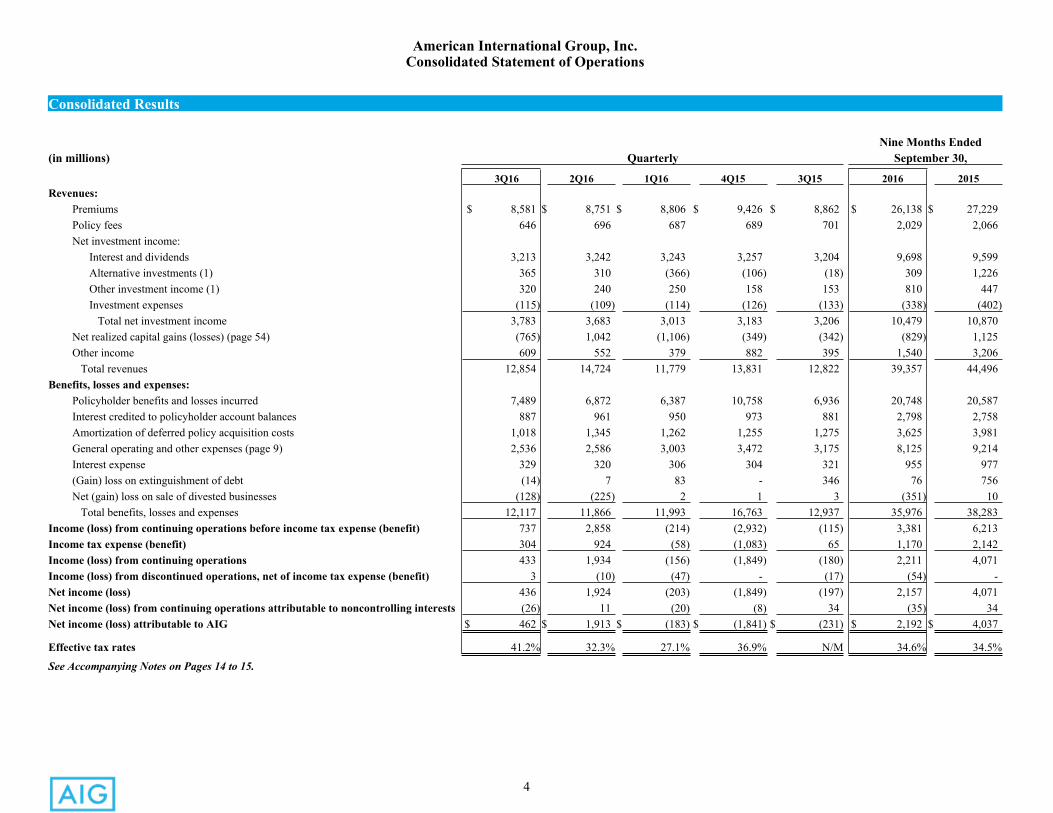
Premiums $ 8,581 $ 8,751 $ 8,806 $ 9,426 $ 8,862 $ 26,138 $ 27,229Policy fees 646 696 687 689 701 2,029 2,066Net investment income: Interest and dividends 3,213 3,242 3,243 3,257 3,204 9,698 9,599 Alternative investments (1) 365 310 (366) (106) (18) 309 1,226 Other investment income (1) 320 240 250 158 153 810 447 Investment expenses (115) (109) (114) (126) (133) (338) (402) Total net investment income 3,783 3,683 3,013 3,183 3,206 10,479 10,870Net realized capital gains (losses) (page 54) (765) 1,042 (1,106) (349) (342) (829) 1,125Other income 609 552 379 882 395 1,540 3,206 Total revenues 12,854 14,724 11,779 13,831 12,822 39,357 44,496
Benefits, losses and expenses: Policyholder benefits and losses incurred 7,489 6,872 6,387 10,758 6,936 20,748 20,587Interest credited to policyholder account balances 887 961 950 973 881 2,798 2,758Amortization of deferred policy acquisition costs 1,018 1,345 1,262 1,255 1,275 3,625 3,981General operating and other expenses (page 9) 2,536 2,586 3,003 3,472 3,175 8,125 9,214Interest expense 329 320 306 304 321 955 977(Gain) loss on extinguishment of debt (14) 7 83 - 346 76 756Net (gain) loss on sale of divested businesses (128) (225) 2 1 3 (351) 10 Total benefits, losses and expenses 12,117 11,866 11,993 16,763 12,937 35,976 38,283
Income (loss) from continuing operations before income tax expense (benefit) 737 2,858 (214) (2,932) (115) 3,381 6,213Income tax expense (benefit) 304 924 (58) (1,083) 65 1,170 2,142Income (loss) from continuing operations 433 1,934 (156) (1,849) (180) 2,211 4,071Income (loss) from discontinued operations, net of income tax expense (benefit) 3 (10) (47) - (17) (54) -Net income (loss) 436 1,924 (203) (1,849) (197) 2,157 4,071Net income (loss) from continuing operations attributable to noncontrolling interests (26) 11 (20) (8) 34 (35) 34Net income (loss) attributable to AIG $ 462 $ 1,913 $ (183) $ (1,841) $ (231) $ 2,192 $ 4,037
Effective tax rates 41.2% 32.3% 27.1% 36.9% N/M 34.6% 34.5%
See Accompanying Notes on Pages 14 to 15.
5
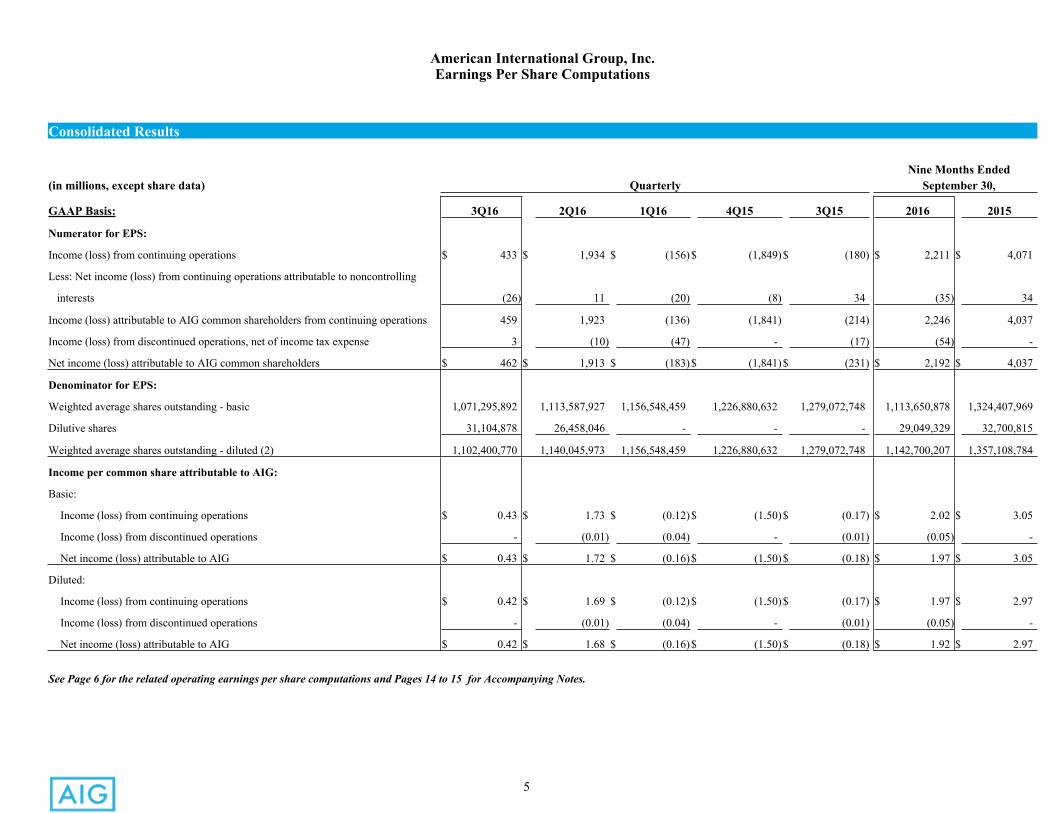
American International Group, Inc.Earnings Per Share Computations
Consolidated Results
Nine Months Ended(in millions, except share data) Quarterly September 30,
GAAP Basis: 3Q16 2Q16 1Q16 4Q15 3Q15 2016 2015
Numerator for EPS:
Income (loss) from continuing operations $ 433 $ 1,934 $ (156)$ (1,849)$ (180) $ 2,211 $ 4,071
Less: Net income (loss) from continuing operations attributable to noncontrolling
interests (26) 11 (20) (8) 34 (35) 34
Income (loss) attributable to AIG common shareholders from continuing operations 459 1,923 (136) (1,841) (214) 2,246 4,037
Income (loss) from discontinued operations, net of income tax expense 3 (10) (47) - (17) (54) -
Net income (loss) attributable to AIG common shareholders $ 462 $ 1,913 $ (183)$ (1,841)$ (231) $ 2,192 $ 4,037
Denominator for EPS:
Weighted average shares outstanding - basic 1,071,295,892 1,113,587,927 1,156,548,459 1,226,880,632 1,279,072,748 1,113,650,878 1,324,407,969
Dilutive shares 31,104,878 26,458,046 - - - 29,049,329 32,700,815
Weighted average shares outstanding - diluted (2) 1,102,400,770 1,140,045,973 1,156,548,459 1,226,880,632 1,279,072,748 1,142,700,207 1,357,108,784
Income per common share attributable to AIG:
Basic:
Income (loss) from continuing operations $ 0.43 $ 1.73 $ (0.12)$ (1.50)$ (0.17) $ 2.02 $ 3.05
Income (loss) from discontinued operations - (0.01) (0.04) - (0.01) (0.05) -
Net income (loss) attributable to AIG $ 0.43 $ 1.72 $ (0.16)$ (1.50)$ (0.18) $ 1.97 $ 3.05
Diluted:
Income (loss) from continuing operations $ 0.42 $ 1.69 $ (0.12)$ (1.50)$ (0.17) $ 1.97 $ 2.97
Income (loss) from discontinued operations - (0.01) (0.04) - (0.01) (0.05) -
Net income (loss) attributable to AIG $ 0.42 $ 1.68 $ (0.16)$ (1.50)$ (0.18) $ 1.92 $ 2.97
See Page 6 for the related operating earnings per share computations and Pages 14 to 15 for Accompanying Notes.
6
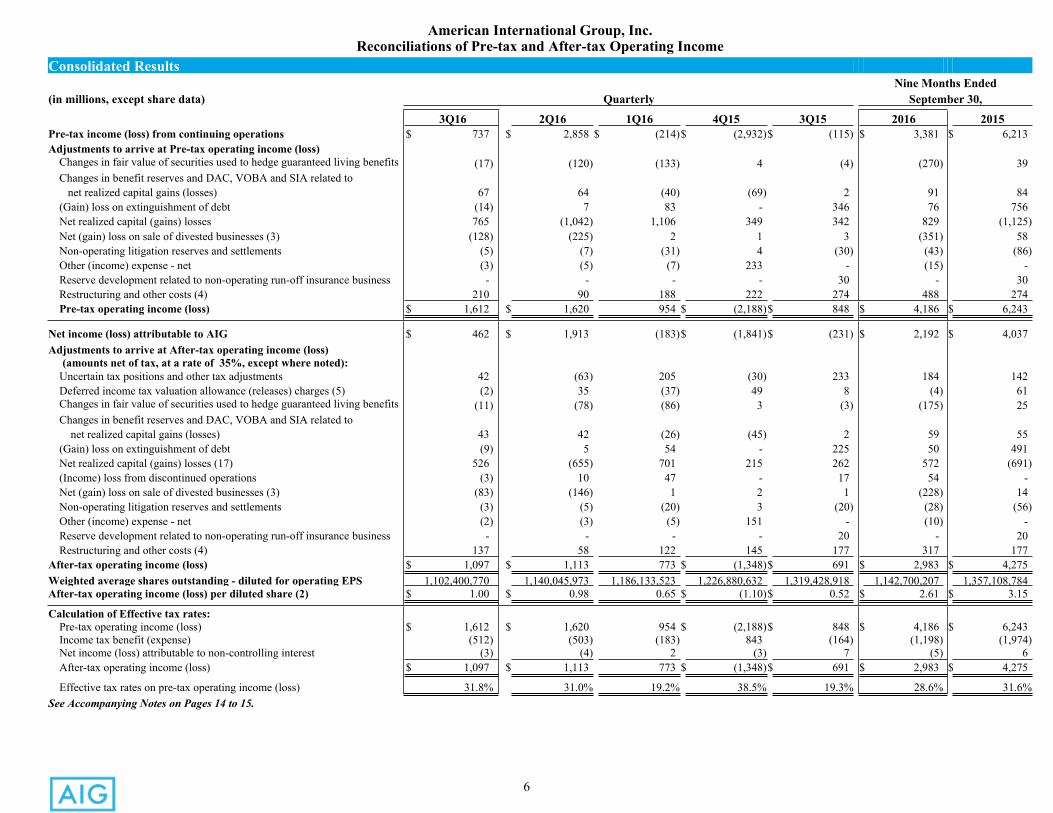
American International Group, Inc.Reconciliations of Pre-tax and After-tax Operating Income
Consolidated Results Nine Months Ended
(in millions, except share data) Quarterly September 30,
3Q16 2Q16 1Q16 4Q15 3Q15 2016 2015Pre-tax income (loss) from continuing operations $ 737 $ 2,858 $ (214)$ (2,932)$ (115) $ 3,381 $ 6,213Adjustments to arrive at Pre-tax operating income (loss)
Changes in fair value of securities used to hedge guaranteed living benefits (17) (120) (133) 4 (4) (270) 39Changes in benefit reserves and DAC, VOBA and SIA related to net realized capital gains (losses) 67 64 (40) (69) 2 91 84(Gain) loss on extinguishment of debt (14) 7 83 - 346 76 756Net realized capital (gains) losses 765 (1,042) 1,106 349 342 829 (1,125)Net (gain) loss on sale of divested businesses (3) (128) (225) 2 1 3 (351) 58Non-operating litigation reserves and settlements (5) (7) (31) 4 (30) (43) (86)Other (income) expense - net (3) (5) (7) 233 - (15) -Reserve development related to non-operating run-off insurance business - - - - 30 - 30Restructuring and other costs (4) 210 90 188 222 274 488 274Pre-tax operating income (loss) $ 1,612 $ 1,620 954 $ (2,188)$ 848 $ 4,186 $ 6,243
Net income (loss) attributable to AIG $ 462 $ 1,913 (183)$ (1,841)$ (231) $ 2,192 $ 4,037Adjustments to arrive at After-tax operating income (loss) (amounts net of tax, at a rate of 35%, except where noted):
Uncertain tax positions and other tax adjustments 42 (63) 205 (30) 233 184 142Deferred income tax valuation allowance (releases) charges (5) (2) 35 (37) 49 8 (4) 61Changes in fair value of securities used to hedge guaranteed living benefits (11) (78) (86) 3 (3) (175) 25Changes in benefit reserves and DAC, VOBA and SIA related to net realized capital gains (losses) 43 42 (26) (45) 2 59 55(Gain) loss on extinguishment of debt (9) 5 54 - 225 50 491Net realized capital (gains) losses (17) 526 (655) 701 215 262 572 (691)(Income) loss from discontinued operations (3) 10 47 - 17 54 -Net (gain) loss on sale of divested businesses (3) (83) (146) 1 2 1 (228) 14Non-operating litigation reserves and settlements (3) (5) (20) 3 (20) (28) (56)Other (income) expense - net (2) (3) (5) 151 - (10) -Reserve development related to non-operating run-off insurance business - - - - 20 - 20Restructuring and other costs (4) 137 58 122 145 177 317 177
After-tax operating income (loss) $ 1,097 $ 1,113 773 $ (1,348)$ 691 $ 2,983 $ 4,275Weighted average shares outstanding - diluted for operating EPS 1,102,400,770 1,140,045,973 1,186,133,523 1,226,880,632 1,319,428,918 1,142,700,207 1,357,108,784After-tax operating income (loss) per diluted share (2) $ 1.00 $ 0.98 0.65 $ (1.10)$ 0.52 $ 2.61 $ 3.15
Calculation of Effective tax rates:Pre-tax operating income (loss) $ 1,612 $ 1,620 954 $ (2,188)$ 848 $ 4,186 $ 6,243Income tax benefit (expense) (512) (503) (183) 843 (164) (1,198) (1,974)Net income (loss) attributable to non-controlling interest (3) (4) 2 (3) 7 (5) 6After-tax operating income (loss) $ 1,097 $ 1,113 773 $ (1,348)$ 691 $ 2,983 $ 4,275
Effective tax rates on pre-tax operating income (loss) 31.8% 31.0% 19.2% 38.5% 19.3% 28.6% 31.6%See Accompanying Notes on Pages 14 to 15.
7
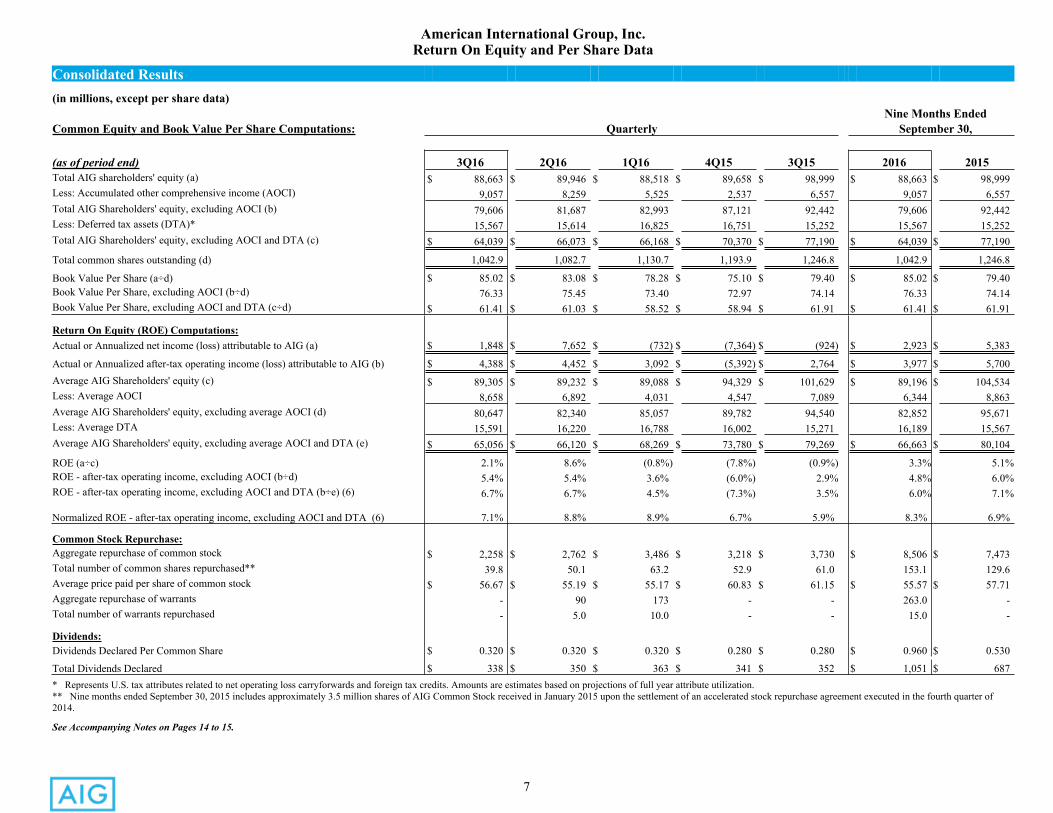
American International Group, Inc.Return On Equity and Per Share Data
Consolidated Results(in millions, except per share data)
Nine Months EndedCommon Equity and Book Value Per Share Computations: Quarterly September 30,
(as of period end) 3Q16 2Q16 1Q16 4Q15 3Q15 2016 2015Total AIG shareholders' equity (a) $ 88,663 $ 89,946 $ 88,518 $ 89,658 $ 98,999 $ 88,663 $ 98,999Less: Accumulated other comprehensive income (AOCI) 9,057 8,259 5,525 2,537 6,557 9,057 6,557Total AIG Shareholders' equity, excluding AOCI (b) 79,606 81,687 82,993 87,121 92,442 79,606 92,442Less: Deferred tax assets (DTA)* 15,567 15,614 16,825 16,751 15,252 15,567 15,252Total AIG Shareholders' equity, excluding AOCI and DTA (c) $ 64,039 $ 66,073 $ 66,168 $ 70,370 $ 77,190 $ 64,039 $ 77,190
Total common shares outstanding (d) 1,042.9 1,082.7 1,130.7 1,193.9 1,246.8 1,042.9 1,246.8
Book Value Per Share (a÷d) $ 85.02 $ 83.08 $ 78.28 $ 75.10 $ 79.40 $ 85.02 $ 79.40Book Value Per Share, excluding AOCI (b÷d) 76.33 75.45 73.40 72.97 74.14 76.33 74.14Book Value Per Share, excluding AOCI and DTA (c÷d) $ 61.41 $ 61.03 $ 58.52 $ 58.94 $ 61.91 $ 61.41 $ 61.91
Return On Equity (ROE) Computations:Actual or Annualized net income (loss) attributable to AIG (a) $ 1,848 $ 7,652 $ (732) $ (7,364) $ (924) $ 2,923 $ 5,383
Actual or Annualized after-tax operating income (loss) attributable to AIG (b) $ 4,388 $ 4,452 $ 3,092 $ (5,392) $ 2,764 $ 3,977 $ 5,700Average AIG Shareholders' equity (c) $ 89,305 $ 89,232 $ 89,088 $ 94,329 $ 101,629 $ 89,196 $ 104,534Less: Average AOCI 8,658 6,892 4,031 4,547 7,089 6,344 8,863Average AIG Shareholders' equity, excluding average AOCI (d) 80,647 82,340 85,057 89,782 94,540 82,852 95,671Less: Average DTA 15,591 16,220 16,788 16,002 15,271 16,189 15,567Average AIG Shareholders' equity, excluding average AOCI and DTA (e) $ 65,056 $ 66,120 $ 68,269 $ 73,780 $ 79,269 $ 66,663 $ 80,104
ROE (a÷c) 2.1% 8.6% (0.8%) (7.8%) (0.9%) 3.3% 5.1%ROE - after-tax operating income, excluding AOCI (b÷d) 5.4% 5.4% 3.6% (6.0%) 2.9% 4.8% 6.0%ROE - after-tax operating income, excluding AOCI and DTA (b÷e) (6) 6.7% 6.7% 4.5% (7.3%) 3.5% 6.0% 7.1%
Normalized ROE - after-tax operating income, excluding AOCI and DTA (6) 7.1% 8.8% 8.9% 6.7% 5.9% 8.3% 6.9%
Common Stock Repurchase:Aggregate repurchase of common stock $ 2,258 $ 2,762 $ 3,486 $ 3,218 $ 3,730 $ 8,506 $ 7,473Total number of common shares repurchased** 39.8 50.1 63.2 52.9 61.0 153.1 129.6Average price paid per share of common stock $ 56.67 $ 55.19 $ 55.17 $ 60.83 $ 61.15 $ 55.57 $ 57.71Aggregate repurchase of warrants - 90 173 - - 263.0 -Total number of warrants repurchased - 5.0 10.0 - - 15.0 -
Dividends:Dividends Declared Per Common Share $ 0.320 $ 0.320 $ 0.320 $ 0.280 $ 0.280 $ 0.960 $ 0.530
Total Dividends Declared $ 338 $ 350 $ 363 $ 341 $ 352 $ 1,051 $ 687* Represents U.S. tax attributes related to net operating loss carryforwards and foreign tax credits. Amounts are estimates based on projections of full year attribute utilization.** Nine months ended September 30, 2015 includes approximately 3.5 million shares of AIG Common Stock received in January 2015 upon the settlement of an accelerated stock repurchase agreement executed in the fourth quarter of 2014.
See Accompanying Notes on Pages 14 to 15.
8
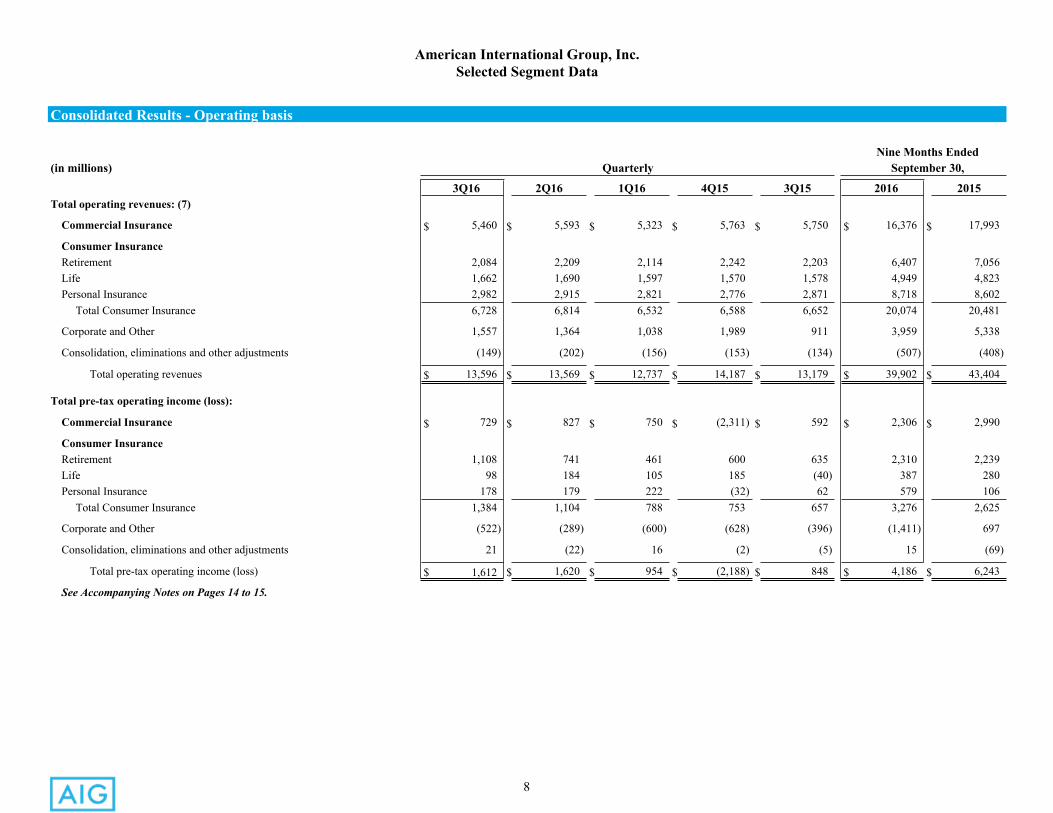
American International Group, Inc.Selected Segment Data
Consolidated Results - Operating basis
Nine Months Ended(in millions) Quarterly September 30,
3Q16 2Q16 1Q16 4Q15 3Q15 2016 2015Total operating revenues: (7)
Commercial Insurance $ 5,460 $ 5,593 $ 5,323 $ 5,763 $ 5,750 $ 16,376 $ 17,993
Consumer InsuranceRetirement 2,084 2,209 2,114 2,242 2,203 6,407 7,056Life 1,662 1,690 1,597 1,570 1,578 4,949 4,823Personal Insurance 2,982 2,915 2,821 2,776 2,871 8,718 8,602 Total Consumer Insurance 6,728 6,814 6,532 6,588 6,652 20,074 20,481
Corporate and Other 1,557 1,364 1,038 1,989 911 3,959 5,338
Consolidation, eliminations and other adjustments (149) (202) (156) (153) (134) (507) (408)
Total operating revenues $ 13,596 $ 13,569 $ 12,737 $ 14,187 $ 13,179 $ 39,902 $ 43,404
Total pre-tax operating income (loss):
Commercial Insurance $ 729 $ 827 $ 750 $ (2,311) $ 592 $ 2,306 $ 2,990
Consumer InsuranceRetirement 1,108 741 461 600 635 2,310 2,239Life 98 184 105 185 (40) 387 280Personal Insurance 178 179 222 (32) 62 579 106 Total Consumer Insurance 1,384 1,104 788 753 657 3,276 2,625
Corporate and Other (522) (289) (600) (628) (396) (1,411) 697
Consolidation, eliminations and other adjustments 21 (22) 16 (2) (5) 15 (69)
Total pre-tax operating income (loss) $ 1,612 $ 1,620 $ 954 $ (2,188) $ 848 $ 4,186 $ 6,243
See Accompanying Notes on Pages 14 to 15.
9
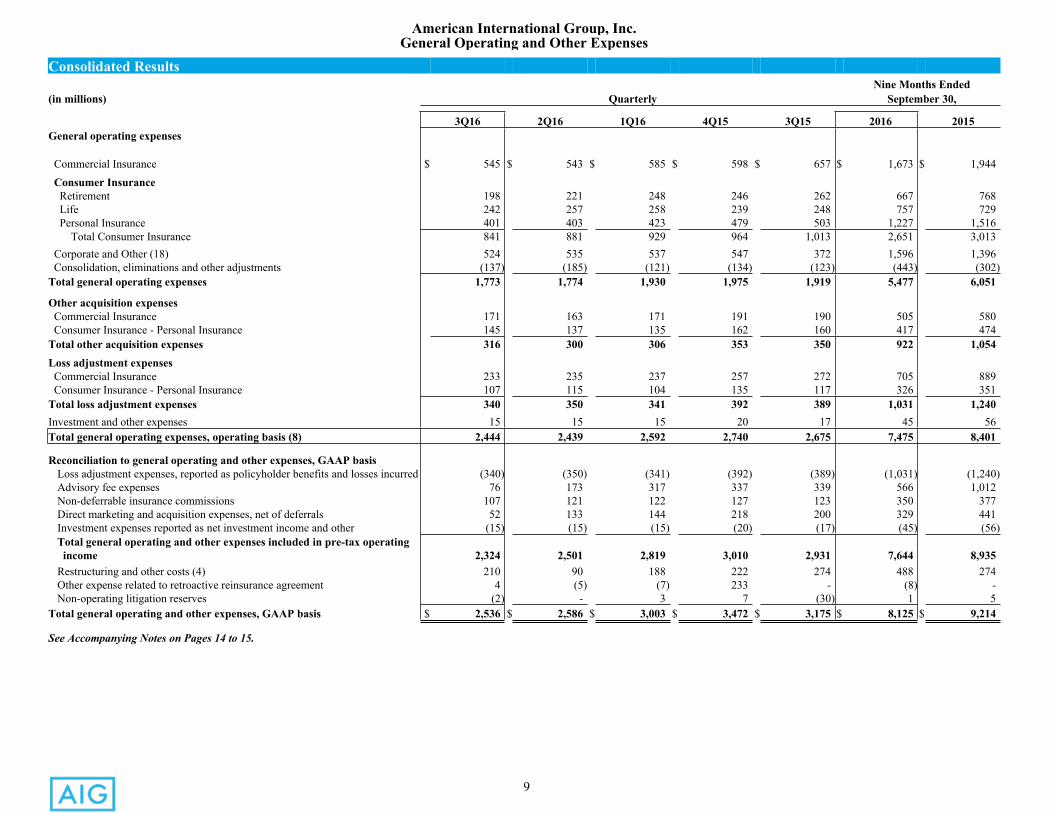
American International Group, Inc.General Operating and Other Expenses
Consolidated ResultsNine Months Ended
(in millions) Quarterly September 30,
3Q16 2Q16 1Q16 4Q15 3Q15 2016 2015General operating expenses
Commercial Insurance $ 545 $ 543 $ 585 $ 598 $ 657 $ 1,673 $ 1,944 Consumer Insurance Retirement 198 221 248 246 262 667 768 Life 242 257 258 239 248 757 729 Personal Insurance 401 403 423 479 503 1,227 1,516 Total Consumer Insurance 841 881 929 964 1,013 2,651 3,013 Corporate and Other (18) 524 535 537 547 372 1,596 1,396 Consolidation, eliminations and other adjustments (137) (185) (121) (134) (123) (443) (302)Total general operating expenses 1,773 1,774 1,930 1,975 1,919 5,477 6,051
Other acquisition expenses Commercial Insurance 171 163 171 191 190 505 580 Consumer Insurance - Personal Insurance 145 137 135 162 160 417 474Total other acquisition expenses 316 300 306 353 350 922 1,054Loss adjustment expenses Commercial Insurance 233 235 237 257 272 705 889 Consumer Insurance - Personal Insurance 107 115 104 135 117 326 351Total loss adjustment expenses 340 350 341 392 389 1,031 1,240Investment and other expenses 15 15 15 20 17 45 56Total general operating expenses, operating basis (8) 2,444 2,439 2,592 2,740 2,675 7,475 8,401
Reconciliation to general operating and other expenses, GAAP basisLoss adjustment expenses, reported as policyholder benefits and losses incurred (340) (350) (341) (392) (389) (1,031) (1,240)Advisory fee expenses 76 173 317 337 339 566 1,012Non-deferrable insurance commissions 107 121 122 127 123 350 377Direct marketing and acquisition expenses, net of deferrals 52 133 144 218 200 329 441Investment expenses reported as net investment income and other (15) (15) (15) (20) (17) (45) (56)Total general operating and other expenses included in pre-tax operating income 2,324 2,501 2,819 3,010 2,931 7,644 8,935Restructuring and other costs (4) 210 90 188 222 274 488 274Other expense related to retroactive reinsurance agreement 4 (5) (7) 233 - (8) -Non-operating litigation reserves (2) - 3 7 (30) 1 5
Total general operating and other expenses, GAAP basis $ 2,536 $ 2,586 $ 3,003 $ 3,472 $ 3,175 $ 8,125 $ 9,214
See Accompanying Notes on Pages 14 to 15.
10
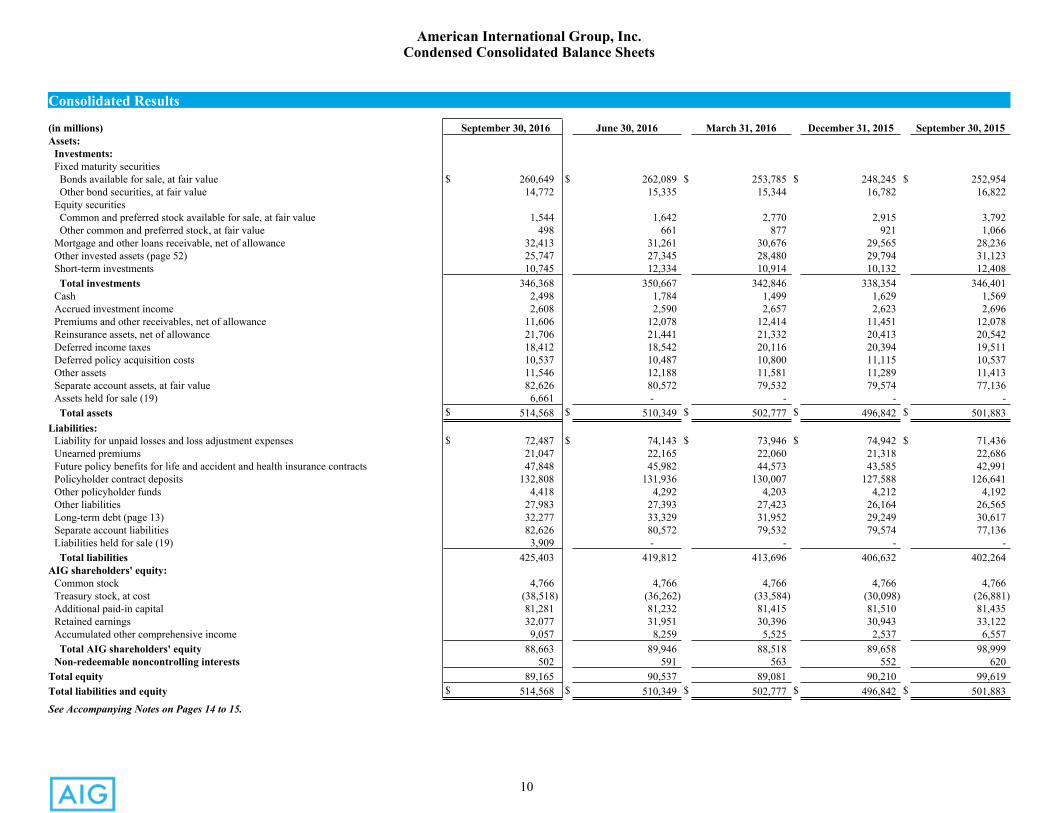
American International Group, Inc.Condensed Consolidated Balance Sheets
Consolidated Results
(in millions) September 30, 2016 June 30, 2016 March 31, 2016 December 31, 2015 September 30, 2015Assets:
Investments:Fixed maturity securities Bonds available for sale, at fair value $ 260,649 $ 262,089 $ 253,785 $ 248,245 $ 252,954 Other bond securities, at fair value 14,772 15,335 15,344 16,782 16,822Equity securities Common and preferred stock available for sale, at fair value 1,544 1,642 2,770 2,915 3,792 Other common and preferred stock, at fair value 498 661 877 921 1,066Mortgage and other loans receivable, net of allowance 32,413 31,261 30,676 29,565 28,236Other invested assets (page 52) 25,747 27,345 28,480 29,794 31,123Short-term investments 10,745 12,334 10,914 10,132 12,408 Total investments 346,368 350,667 342,846 338,354 346,401Cash 2,498 1,784 1,499 1,629 1,569Accrued investment income 2,608 2,590 2,657 2,623 2,696Premiums and other receivables, net of allowance 11,606 12,078 12,414 11,451 12,078Reinsurance assets, net of allowance 21,706 21,441 21,332 20,413 20,542Deferred income taxes 18,412 18,542 20,116 20,394 19,511Deferred policy acquisition costs 10,537 10,487 10,800 11,115 10,537Other assets 11,546 12,188 11,581 11,289 11,413Separate account assets, at fair value 82,626 80,572 79,532 79,574 77,136Assets held for sale (19) 6,661 - - - - Total assets $ 514,568 $ 510,349 $ 502,777 $ 496,842 $ 501,883
Liabilities:Liability for unpaid losses and loss adjustment expenses $ 72,487 $ 74,143 $ 73,946 $ 74,942 $ 71,436Unearned premiums 21,047 22,165 22,060 21,318 22,686Future policy benefits for life and accident and health insurance contracts 47,848 45,982 44,573 43,585 42,991Policyholder contract deposits 132,808 131,936 130,007 127,588 126,641Other policyholder funds 4,418 4,292 4,203 4,212 4,192Other liabilities 27,983 27,393 27,423 26,164 26,565Long-term debt (page 13) 32,277 33,329 31,952 29,249 30,617Separate account liabilities 82,626 80,572 79,532 79,574 77,136Liabilities held for sale (19) 3,909 - - - - Total liabilities 425,403 419,812 413,696 406,632 402,264
AIG shareholders' equity:Common stock 4,766 4,766 4,766 4,766 4,766Treasury stock, at cost (38,518) (36,262) (33,584) (30,098) (26,881)Additional paid-in capital 81,281 81,232 81,415 81,510 81,435Retained earnings 32,077 31,951 30,396 30,943 33,122Accumulated other comprehensive income 9,057 8,259 5,525 2,537 6,557 Total AIG shareholders' equity 88,663 89,946 88,518 89,658 98,999Non-redeemable noncontrolling interests 502 591 563 552 620
Total equity 89,165 90,537 89,081 90,210 99,619Total liabilities and equity $ 514,568 $ 510,349 $ 502,777 $ 496,842 $ 501,883
See Accompanying Notes on Pages 14 to 15.
11
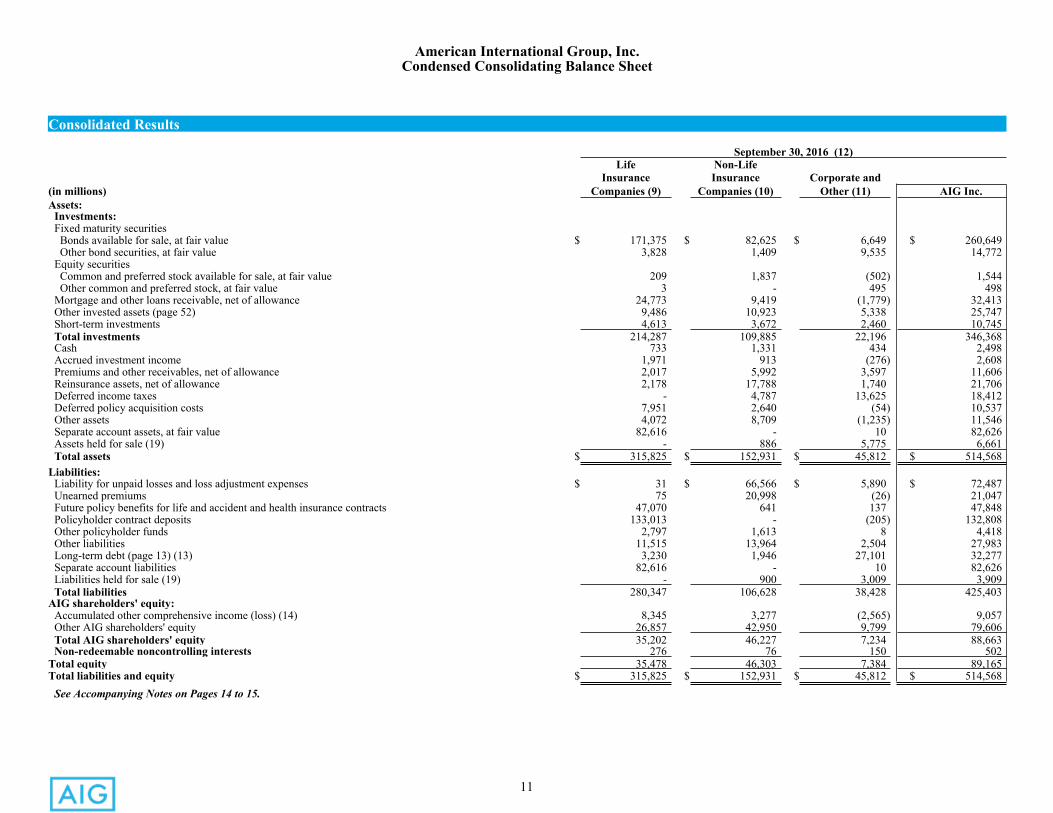
American International Group, Inc.Condensed Consolidating Balance Sheet
Consolidated Results
September 30, 2016 (12)Life Non-Life
Insurance Insurance Corporate and(in millions) Companies (9) Companies (10) Other (11) AIG Inc.Assets:
Investments:Fixed maturity securities Bonds available for sale, at fair value $ 171,375 $ 82,625 $ 6,649 $ 260,649 Other bond securities, at fair value 3,828 1,409 9,535 14,772Equity securities Common and preferred stock available for sale, at fair value 209 1,837 (502) 1,544 Other common and preferred stock, at fair value 3 - 495 498Mortgage and other loans receivable, net of allowance 24,773 9,419 (1,779) 32,413Other invested assets (page 52) 9,486 10,923 5,338 25,747Short-term investments 4,613 3,672 2,460 10,745Total investments 214,287 109,885 22,196 346,368Cash 733 1,331 434 2,498Accrued investment income 1,971 913 (276) 2,608Premiums and other receivables, net of allowance 2,017 5,992 3,597 11,606Reinsurance assets, net of allowance 2,178 17,788 1,740 21,706Deferred income taxes - 4,787 13,625 18,412Deferred policy acquisition costs 7,951 2,640 (54) 10,537Other assets 4,072 8,709 (1,235) 11,546Separate account assets, at fair value 82,616 - 10 82,626Assets held for sale (19) - 886 5,775 6,661Total assets $ 315,825 $ 152,931 $ 45,812 $ 514,568
Liabilities:Liability for unpaid losses and loss adjustment expenses $ 31 $ 66,566 $ 5,890 $ 72,487Unearned premiums 75 20,998 (26) 21,047Future policy benefits for life and accident and health insurance contracts 47,070 641 137 47,848Policyholder contract deposits 133,013 - (205) 132,808Other policyholder funds 2,797 1,613 8 4,418Other liabilities 11,515 13,964 2,504 27,983Long-term debt (page 13) (13) 3,230 1,946 27,101 32,277Separate account liabilities 82,616 - 10 82,626Liabilities held for sale (19) - 900 3,009 3,909Total liabilities 280,347 106,628 38,428 425,403
AIG shareholders' equity:Accumulated other comprehensive income (loss) (14) 8,345 3,277 (2,565) 9,057Other AIG shareholders' equity 26,857 42,950 9,799 79,606Total AIG shareholders' equity 35,202 46,227 7,234 88,663Non-redeemable noncontrolling interests 276 76 150 502
Total equity 35,478 46,303 7,384 89,165Total liabilities and equity $ 315,825 $ 152,931 $ 45,812 $ 514,568
See Accompanying Notes on Pages 14 to 15.
12
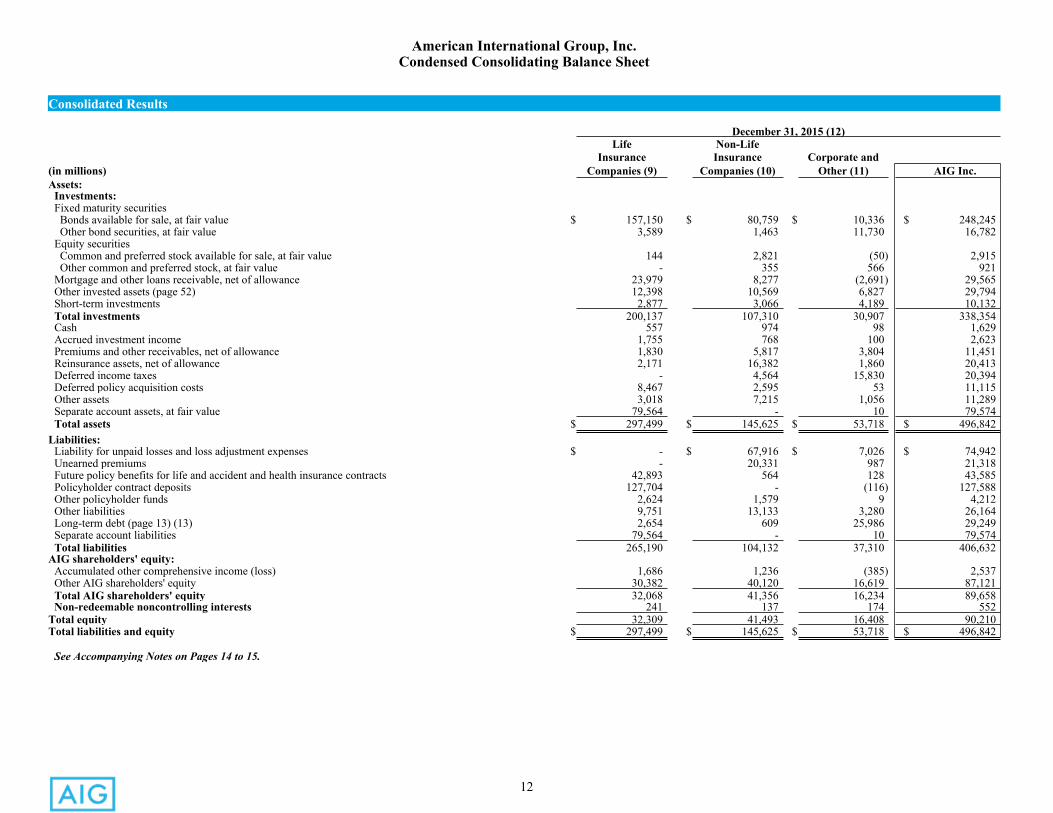
American International Group, Inc.Condensed Consolidating Balance Sheet
Consolidated Results
December 31, 2015 (12)Life Non-Life
Insurance Insurance Corporate and(in millions) Companies (9) Companies (10) Other (11) AIG Inc.Assets:
Investments:Fixed maturity securities Bonds available for sale, at fair value $ 157,150 $ 80,759 $ 10,336 $ 248,245 Other bond securities, at fair value 3,589 1,463 11,730 16,782Equity securities Common and preferred stock available for sale, at fair value 144 2,821 (50) 2,915 Other common and preferred stock, at fair value - 355 566 921Mortgage and other loans receivable, net of allowance 23,979 8,277 (2,691) 29,565Other invested assets (page 52) 12,398 10,569 6,827 29,794Short-term investments 2,877 3,066 4,189 10,132Total investments 200,137 107,310 30,907 338,354Cash 557 974 98 1,629Accrued investment income 1,755 768 100 2,623Premiums and other receivables, net of allowance 1,830 5,817 3,804 11,451Reinsurance assets, net of allowance 2,171 16,382 1,860 20,413Deferred income taxes - 4,564 15,830 20,394Deferred policy acquisition costs 8,467 2,595 53 11,115Other assets 3,018 7,215 1,056 11,289Separate account assets, at fair value 79,564 - 10 79,574Total assets $ 297,499 $ 145,625 $ 53,718 $ 496,842
Liabilities:Liability for unpaid losses and loss adjustment expenses $ - $ 67,916 $ 7,026 $ 74,942Unearned premiums - 20,331 987 21,318Future policy benefits for life and accident and health insurance contracts 42,893 564 128 43,585Policyholder contract deposits 127,704 - (116) 127,588Other policyholder funds 2,624 1,579 9 4,212Other liabilities 9,751 13,133 3,280 26,164Long-term debt (page 13) (13) 2,654 609 25,986 29,249Separate account liabilities 79,564 - 10 79,574Total liabilities 265,190 104,132 37,310 406,632
AIG shareholders' equity:Accumulated other comprehensive income (loss) 1,686 1,236 (385) 2,537Other AIG shareholders' equity 30,382 40,120 16,619 87,121Total AIG shareholders' equity 32,068 41,356 16,234 89,658Non-redeemable noncontrolling interests 241 137 174 552
Total equity 32,309 41,493 16,408 90,210Total liabilities and equity $ 297,499 $ 145,625 $ 53,718 $ 496,842
See Accompanying Notes on Pages 14 to 15.
13
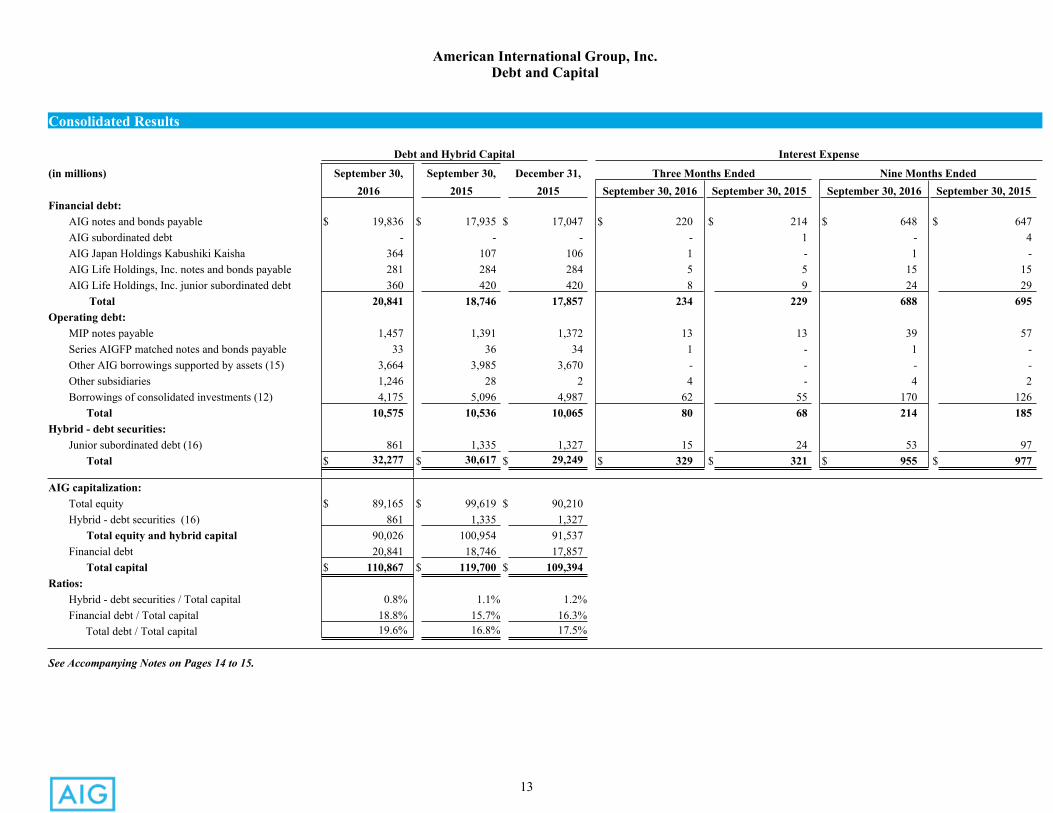
American International Group, Inc.Debt and Capital
Consolidated Results
Debt and Hybrid Capital Interest Expense
(in millions) September 30, September 30, December 31, Three Months Ended Nine Months Ended2016 2015 2015 September 30, 2016 September 30, 2015 September 30, 2016 September 30, 2015
Financial debt: AIG notes and bonds payable $ 19,836 $ 17,935 $ 17,047 $ 220 $ 214 $ 648 $ 647 AIG subordinated debt - - - - 1 - 4 AIG Japan Holdings Kabushiki Kaisha 364 107 106 1 - 1 - AIG Life Holdings, Inc. notes and bonds payable 281 284 284 5 5 15 15 AIG Life Holdings, Inc. junior subordinated debt 360 420 420 8 9 24 29
Total 20,841 18,746 17,857 234 229 688 695Operating debt:
MIP notes payable 1,457 1,391 1,372 13 13 39 57 Series AIGFP matched notes and bonds payable 33 36 34 1 - 1 - Other AIG borrowings supported by assets (15) 3,664 3,985 3,670 - - - - Other subsidiaries 1,246 28 2 4 - 4 2 Borrowings of consolidated investments (12) 4,175 5,096 4,987 62 55 170 126
Total 10,575 10,536 10,065 80 68 214 185Hybrid - debt securities:
Junior subordinated debt (16) 861 1,335 1,327 15 24 53 97 Total $ 32,277 $ 30,617 $ 29,249 $ 329 $ 321 $ 955 $ 977
AIG capitalization: Total equity $ 89,165 $ 99,619 $ 90,210 Hybrid - debt securities (16) 861 1,335 1,327
Total equity and hybrid capital 90,026 100,954 91,537 Financial debt 20,841 18,746 17,857
Total capital $ 110,867 $ 119,700 $ 109,394Ratios:
Hybrid - debt securities / Total capital 0.8% 1.1% 1.2% Financial debt / Total capital 18.8% 15.7% 16.3% Total debt / Total capital 19.6% 16.8% 17.5%
See Accompanying Notes on Pages 14 to 15.
14
American International Group, Inc.Notes
Consolidated Results
(1) Beginning in 1Q16, the presentation of income on alternative investments has been refined to include only income from hedge funds, private equity funds and affordable housing partnerships. Hedge funds for which we elected the fair value option are recorded as of the balance sheet date. Other hedge funds are generally reported on a one-month lag, while private equity funds are generally reported on a one-quarter lag. Other investment income primarily includes changes in market value of investments accounted for under the fair value option (including PICC Property & Casualty Company Limited (PICC P&C) held by Non-Life Insurance Companies), real estate income, life settlements, and income (loss) from equity method investments. Prior period disclosures have been reclassified to conform to this presentation.
(2) For the quarters ended March 31, 2016, December 31, 2015 and September 30, 2015, because we reported a net loss and, in the quarter ended December 31, 2015, an after-tax operating loss, all common stock equivalents are anti-dilutive and are therefore excluded from the calculation of diluted shares and diluted per share amounts.
(3) 3Q16 primarily represents a $105 million gain on the sale of AIG’s controlling interest in NSM. 2Q16 included the sale of AIG Advisor Group. The nine months ended September 30, 2015 included certain post-acquisition transaction expenses incurred by AerCap in connection with its acquisition of ILFC and the difference between expensing AerCap’s maintenance rights assets over the remaining lease term as compared to the remaining economic life of the related aircraft and our share of AerCap’s income taxes.
(4) Beginning in 3Q15, we launched broad initiatives designed to reduce operating expenses, improve efficiency and simplify our organization. These costs include employee severance and one-time termination benefits, modernization of our information technology platforms, and costs associated with consolidation of legal entities and exiting lower return lines of business.
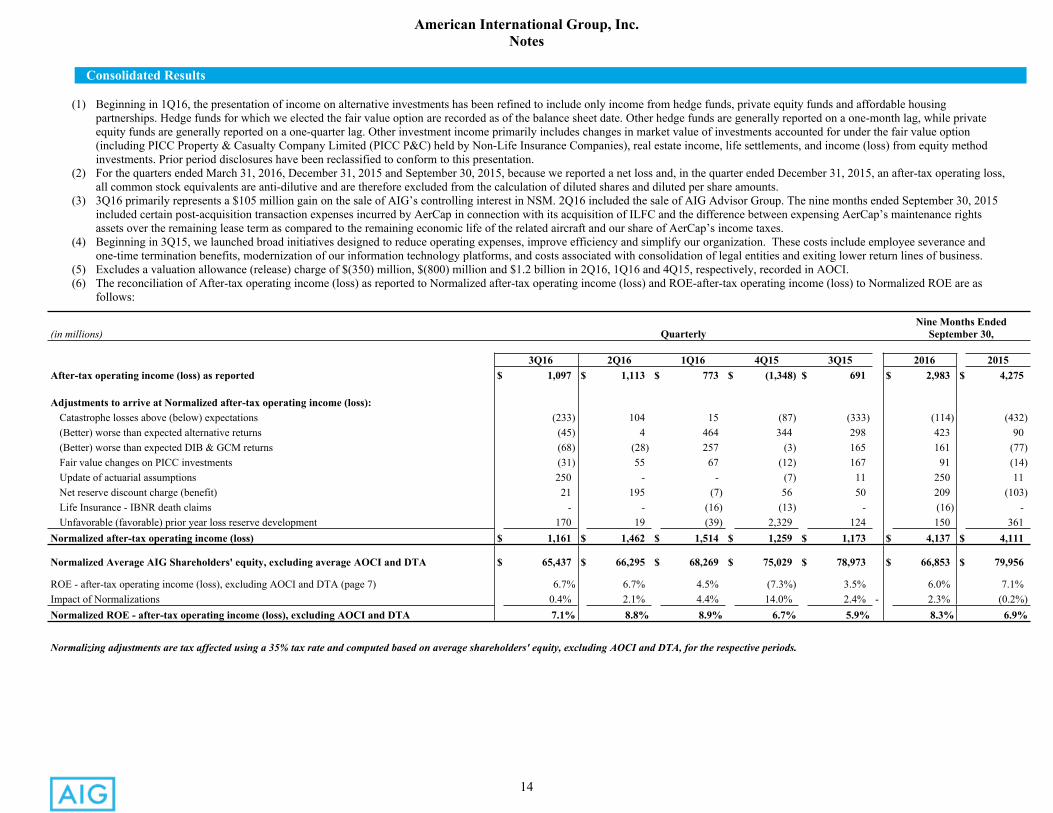
(5) Excludes a valuation allowance (release) charge of $(350) million, $(800) million and $1.2 billion in 2Q16, 1Q16 and 4Q15, respectively, recorded in AOCI.(6) The reconciliation of After-tax operating income (loss) as reported to Normalized after-tax operating income (loss) and ROE-after-tax operating income (loss) to Normalized ROE are as
follows:
(in millions) QuarterlyNine Months Ended
September 30,
3Q16 2Q16 1Q16 4Q15 3Q15 2016 2015After-tax operating income (loss) as reported $ 1,097 $ 1,113 $ 773 $ (1,348) $ 691 $ 2,983 $ 4,275
Adjustments to arrive at Normalized after-tax operating income (loss):Catastrophe losses above (below) expectations (233) 104 15 (87) (333) (114) (432)(Better) worse than expected alternative returns (45) 4 464 344 298 423 90(Better) worse than expected DIB & GCM returns (68) (28) 257 (3) 165 161 (77)Fair value changes on PICC investments (31) 55 67 (12) 167 91 (14)Update of actuarial assumptions 250 - - (7) 11 250 11Net reserve discount charge (benefit) 21 195 (7) 56 50 209 (103)Life Insurance - IBNR death claims - - (16) (13) - (16) -Unfavorable (favorable) prior year loss reserve development 170 19 (39) 2,329 124 150 361
Normalized after-tax operating income (loss) $ 1,161 $ 1,462 $ 1,514 $ 1,259 $ 1,173 $ 4,137 $ 4,111
Normalized Average AIG Shareholders' equity, excluding average AOCI and DTA $ 65,437 $ 66,295 $ 68,269 $ 75,029 $ 78,973 $ 66,853 $ 79,956
ROE - after-tax operating income (loss), excluding AOCI and DTA (page 7) 6.7% 6.7% 4.5% (7.3%) 3.5% 6.0% 7.1%Impact of Normalizations 0.4% 2.1% 4.4% 14.0% 2.4% - 2.3% (0.2%)Normalized ROE - after-tax operating income (loss), excluding AOCI and DTA 7.1% 8.8% 8.9% 6.7% 5.9% 8.3% 6.9%
Normalizing adjustments are tax affected using a 35% tax rate and computed based on average shareholders' equity, excluding AOCI and DTA, for the respective periods.
15
American International Group, Inc.Notes (continued)
Consolidated Results
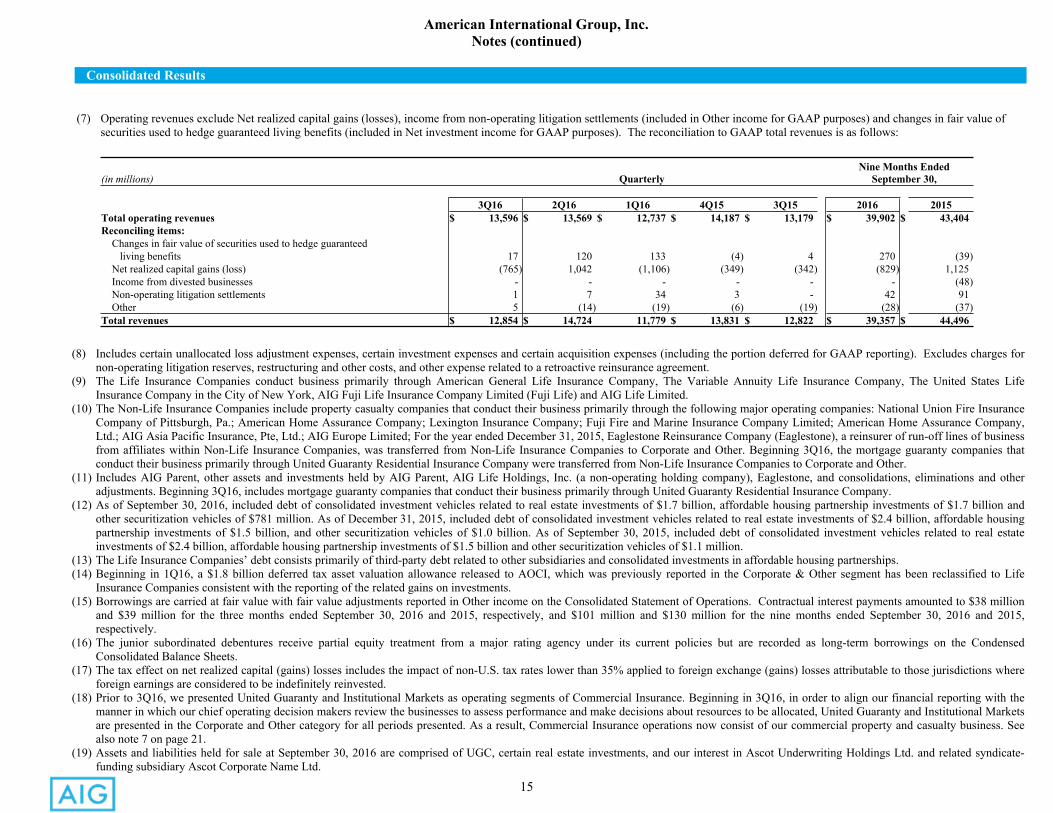
(7) Operating revenues exclude Net realized capital gains (losses), income from non-operating litigation settlements (included in Other income for GAAP purposes) and changes in fair value of securities used to hedge guaranteed living benefits (included in Net investment income for GAAP purposes). The reconciliation to GAAP total revenues is as follows:
(in millions) QuarterlyNine Months Ended
September 30,
3Q16 2Q16 1Q16 4Q15 3Q15 2016 2015Total operating revenues $ 13,596 $ 13,569 $ 12,737 $ 14,187 $ 13,179 $ 39,902 $ 43,404Reconciling items: Changes in fair value of securities used to hedge guaranteed living benefits 17 120 133 (4) 4 270 (39) Net realized capital gains (loss) (765) 1,042 (1,106) (349) (342) (829) 1,125 Income from divested businesses - - - - - - (48) Non-operating litigation settlements 1 7 34 3 - 42 91 Other 5 (14) (19) (6) (19) (28) (37)Total revenues $ 12,854 $ 14,724 11,779 $ 13,831 $ 12,822 $ 39,357 $ 44,496
(8) Includes certain unallocated loss adjustment expenses, certain investment expenses and certain acquisition expenses (including the portion deferred for GAAP reporting). Excludes charges for non-operating litigation reserves, restructuring and other costs, and other expense related to a retroactive reinsurance agreement.
(9) The Life Insurance Companies conduct business primarily through American General Life Insurance Company, The Variable Annuity Life Insurance Company, The United States Life Insurance Company in the City of New York, AIG Fuji Life Insurance Company Limited (Fuji Life) and AIG Life Limited.
(10) The Non-Life Insurance Companies include property casualty companies that conduct their business primarily through the following major operating companies: National Union Fire Insurance Company of Pittsburgh, Pa.; American Home Assurance Company; Lexington Insurance Company; Fuji Fire and Marine Insurance Company Limited; American Home Assurance Company, Ltd.; AIG Asia Pacific Insurance, Pte, Ltd.; AIG Europe Limited; For the year ended December 31, 2015, Eaglestone Reinsurance Company (Eaglestone), a reinsurer of run-off lines of business from affiliates within Non-Life Insurance Companies, was transferred from Non-Life Insurance Companies to Corporate and Other. Beginning 3Q16, the mortgage guaranty companies that conduct their business primarily through United Guaranty Residential Insurance Company were transferred from Non-Life Insurance Companies to Corporate and Other.
(11) Includes AIG Parent, other assets and investments held by AIG Parent, AIG Life Holdings, Inc. (a non-operating holding company), Eaglestone, and consolidations, eliminations and other adjustments. Beginning 3Q16, includes mortgage guaranty companies that conduct their business primarily through United Guaranty Residential Insurance Company.
(12) As of September 30, 2016, included debt of consolidated investment vehicles related to real estate investments of $1.7 billion, affordable housing partnership investments of $1.7 billion and other securitization vehicles of $781 million. As of December 31, 2015, included debt of consolidated investment vehicles related to real estate investments of $2.4 billion, affordable housing partnership investments of $1.5 billion, and other securitization vehicles of $1.0 billion. As of September 30, 2015, included debt of consolidated investment vehicles related to real estate investments of $2.4 billion, affordable housing partnership investments of $1.5 billion and other securitization vehicles of $1.1 million.
(13) The Life Insurance Companies’ debt consists primarily of third-party debt related to other subsidiaries and consolidated investments in affordable housing partnerships.(14) Beginning in 1Q16, a $1.8 billion deferred tax asset valuation allowance released to AOCI, which was previously reported in the Corporate & Other segment has been reclassified to Life
Insurance Companies consistent with the reporting of the related gains on investments.(15) Borrowings are carried at fair value with fair value adjustments reported in Other income on the Consolidated Statement of Operations. Contractual interest payments amounted to $38 million
and $39 million for the three months ended September 30, 2016 and 2015, respectively, and $101 million and $130 million for the nine months ended September 30, 2016 and 2015, respectively.
(16) The junior subordinated debentures receive partial equity treatment from a major rating agency under its current policies but are recorded as long-term borrowings on the Condensed Consolidated Balance Sheets.
(17) The tax effect on net realized capital (gains) losses includes the impact of non-U.S. tax rates lower than 35% applied to foreign exchange (gains) losses attributable to those jurisdictions where foreign earnings are considered to be indefinitely reinvested.
(18) Prior to 3Q16, we presented United Guaranty and Institutional Markets as operating segments of Commercial Insurance. Beginning in 3Q16, in order to align our financial reporting with the manner in which our chief operating decision makers review the businesses to assess performance and make decisions about resources to be allocated, United Guaranty and Institutional Markets are presented in the Corporate and Other category for all periods presented. As a result, Commercial Insurance operations now consist of our commercial property and casualty business. See also note 7 on page 21.
(19) Assets and liabilities held for sale at September 30, 2016 are comprised of UGC, certain real estate investments, and our interest in Ascot Underwriting Holdings Ltd. and related syndicate-funding subsidiary Ascot Corporate Name Ltd.
16
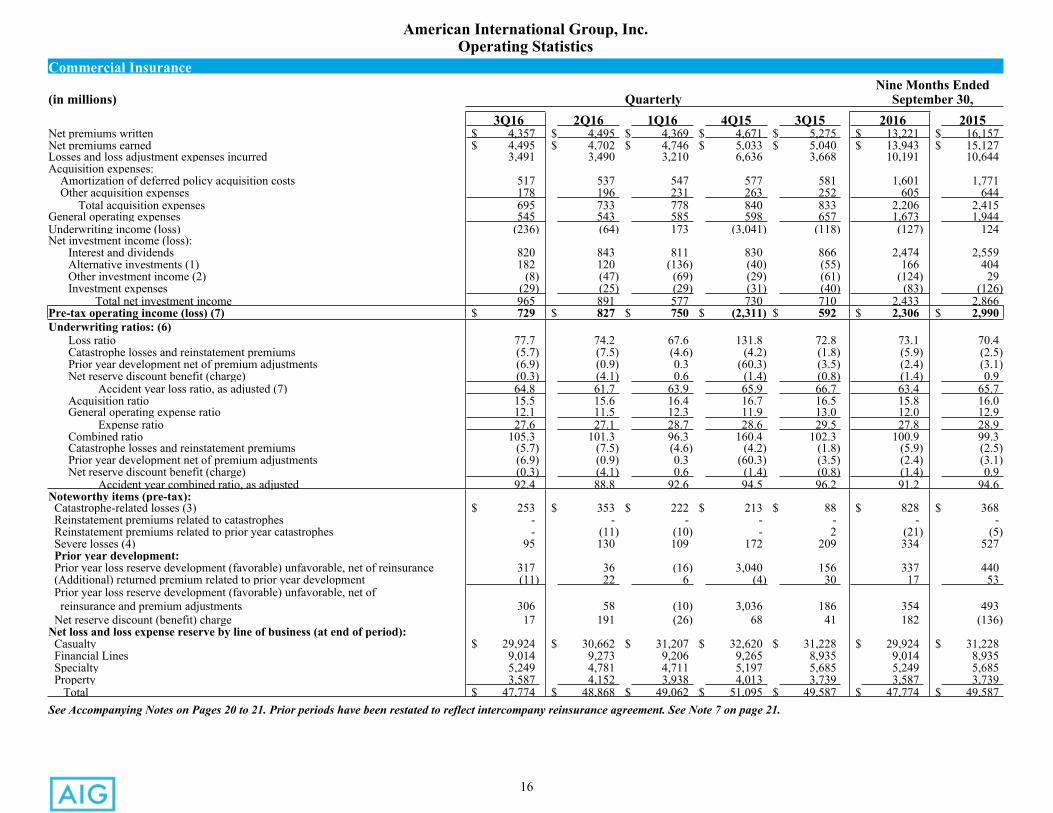
American International Group, Inc.Operating Statistics
Commercial InsuranceNine Months Ended
(in millions) Quarterly September 30, 3Q16 2Q16 1Q16 4Q15 3Q15 2016 2015
Net premiums written $ 4,357 $ 4,495 $ 4,369 $ 4,671 $ 5,275 $ 13,221 $ 16,157Net premiums earned $ 4,495 $ 4,702 $ 4,746 $ 5,033 $ 5,040 $ 13,943 $ 15,127Losses and loss adjustment expenses incurred 3,491 3,490 3,210 6,636 3,668 10,191 10,644Acquisition expenses: Amortization of deferred policy acquisition costs 517 537 547 577 581 1,601 1,771 Other acquisition expenses 178 196 231 263 252 605 644 Total acquisition expenses 695 733 778 840 833 2,206 2,415General operating expenses 545 543 585 598 657 1,673 1,944Underwriting income (loss) (236) (64) 173 (3,041) (118) (127) 124Net investment income (loss):
Interest and dividends 820 843 811 830 866 2,474 2,559Alternative investments (1) 182 120 (136) (40) (55) 166 404Other investment income (2) (8) (47) (69) (29) (61) (124) 29Investment expenses (29) (25) (29) (31) (40) (83) (126)
Total net investment income 965 891 577 730 710 2,433 2,866Pre-tax operating income (loss) (7) $ 729 $ 827 $ 750 $ (2,311) $ 592 $ 2,306 $ 2,990Underwriting ratios: (6)
Loss ratio 77.7 74.2 67.6 131.8 72.8 73.1 70.4Catastrophe losses and reinstatement premiums (5.7) (7.5) (4.6) (4.2) (1.8) (5.9) (2.5)Prior year development net of premium adjustments (6.9) (0.9) 0.3 (60.3) (3.5) (2.4) (3.1)Net reserve discount benefit (charge) (0.3) (4.1) 0.6 (1.4) (0.8) (1.4) 0.9 Accident year loss ratio, as adjusted (7) 64.8 61.7 63.9 65.9 66.7 63.4 65.7Acquisition ratio 15.5 15.6 16.4 16.7 16.5 15.8 16.0General operating expense ratio 12.1 11.5 12.3 11.9 13.0 12.0 12.9 Expense ratio 27.6 27.1 28.7 28.6 29.5 27.8 28.9Combined ratio 105.3 101.3 96.3 160.4 102.3 100.9 99.3Catastrophe losses and reinstatement premiums (5.7) (7.5) (4.6) (4.2) (1.8) (5.9) (2.5)Prior year development net of premium adjustments (6.9) (0.9) 0.3 (60.3) (3.5) (2.4) (3.1)Net reserve discount benefit (charge) (0.3) (4.1) 0.6 (1.4) (0.8) (1.4) 0.9 Accident year combined ratio, as adjusted 92.4 88.8 92.6 94.5 96.2 91.2 94.6
Noteworthy items (pre-tax): Catastrophe-related losses (3) $ 253 $ 353 $ 222 $ 213 $ 88 $ 828 $ 368 Reinstatement premiums related to catastrophes - - - - - - - Reinstatement premiums related to prior year catastrophes - (11) (10) - 2 (21) (5) Severe losses (4) 95 130 109 172 209 334 527 Prior year development: Prior year loss reserve development (favorable) unfavorable, net of reinsurance 317 36 (16) 3,040 156 337 440 (Additional) returned premium related to prior year development (11) 22 6 (4) 30 17 53 Prior year loss reserve development (favorable) unfavorable, net of reinsurance and premium adjustments 306 58 (10) 3,036 186 354 493 Net reserve discount (benefit) charge 17 191 (26) 68 41 182 (136)Net loss and loss expense reserve by line of business (at end of period): Casualty $ 29,924 $ 30,662 $ 31,207 $ 32,620 $ 31,228 $ 29,924 $ 31,228 Financial Lines 9,014 9,273 9,206 9,265 8,935 9,014 8,935 Specialty 5,249 4,781 4,711 5,197 5,685 5,249 5,685 Property 3,587 4,152 3,938 4,013 3,739 3,587 3,739
Total $ 47,774 $ 48,868 $ 49,062 $ 51,095 $ 49,587 $ 47,774 $ 49,587See Accompanying Notes on Pages 20 to 21. Prior periods have been restated to reflect intercompany reinsurance agreement. See Note 7 on page 21.
17
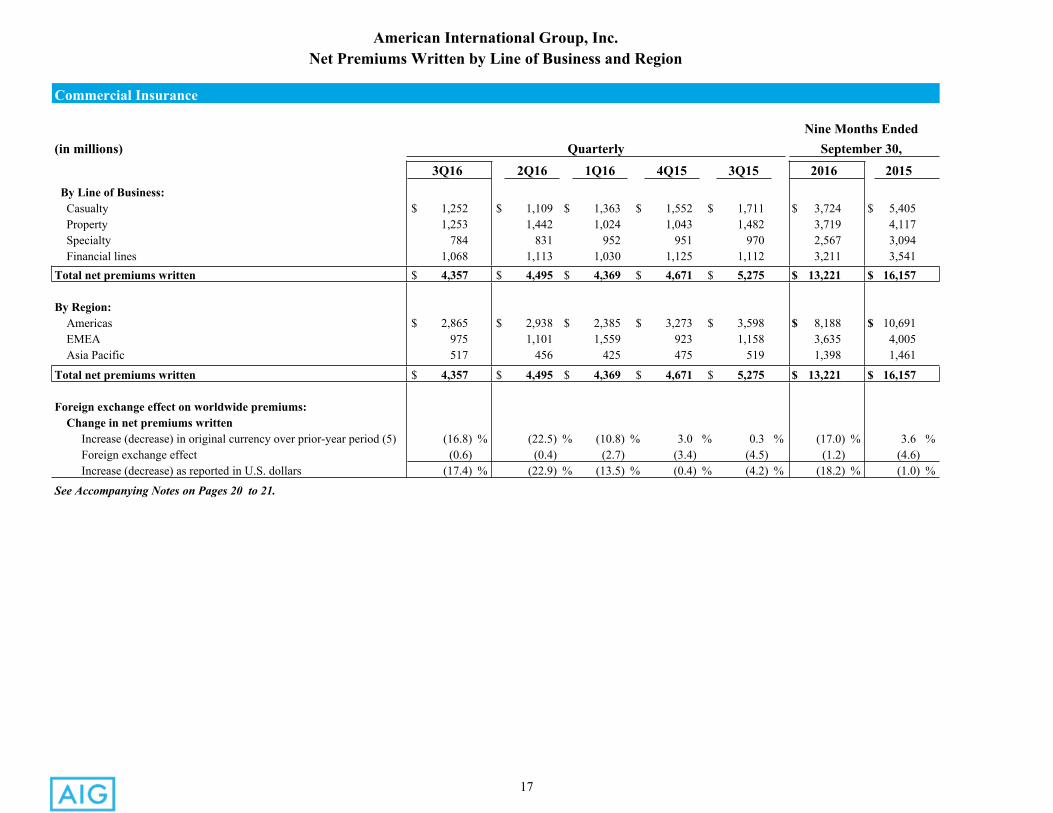
American International Group, Inc.Net Premiums Written by Line of Business and Region
Commercial Insurance
Nine Months Ended(in millions) Quarterly September 30,
3Q16 2Q16 1Q16 4Q15 3Q15 2016 2015 By Line of Business: Casualty $ 1,252 $ 1,109 $ 1,363 $ 1,552 $ 1,711 $ 3,724 $ 5,405 Property 1,253 1,442 1,024 1,043 1,482 3,719 4,117 Specialty 784 831 952 951 970 2,567 3,094 Financial lines 1,068 1,113 1,030 1,125 1,112 3,211 3,541Total net premiums written $ 4,357 $ 4,495 $ 4,369 $ 4,671 $ 5,275 $ 13,221 $ 16,157
By Region: Americas $ 2,865 $ 2,938 $ 2,385 $ 3,273 $ 3,598 $ 8,188 $ 10,691 EMEA 975 1,101 1,559 923 1,158 3,635 4,005 Asia Pacific 517 456 425 475 519 1,398 1,461
Total net premiums written $ 4,357 $ 4,495 $ 4,369 $ 4,671 $ 5,275 $ 13,221 $ 16,157
Foreign exchange effect on worldwide premiums: Change in net premiums written
Increase (decrease) in original currency over prior-year period (5) (16.8) % (22.5) % (10.8) % 3.0 % 0.3 % (17.0) % 3.6 %Foreign exchange effect (0.6) (0.4) (2.7) (3.4) (4.5) (1.2) (4.6)Increase (decrease) as reported in U.S. dollars (17.4) % (22.9) % (13.5) % (0.4) % (4.2) % (18.2) % (1.0) %
See Accompanying Notes on Pages 20 to 21.
18
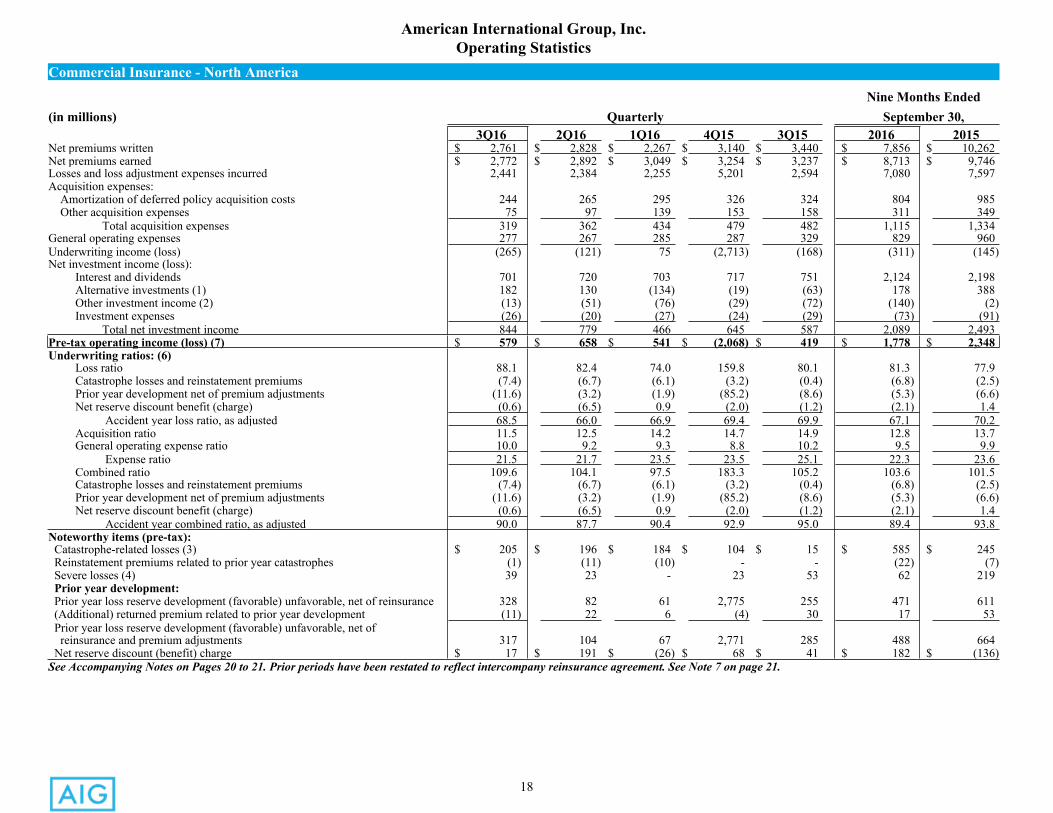
American International Group, Inc.Operating Statistics
Commercial Insurance - North America
Nine Months Ended(in millions) Quarterly September 30,
3Q16 2Q16 1Q16 4Q15 3Q15 2016 2015 Net premiums written $ 2,761 $ 2,828 $ 2,267 $ 3,140 $ 3,440 $ 7,856 $ 10,262Net premiums earned $ 2,772 $ 2,892 $ 3,049 $ 3,254 $ 3,237 $ 8,713 $ 9,746Losses and loss adjustment expenses incurred 2,441 2,384 2,255 5,201 2,594 7,080 7,597Acquisition expenses: Amortization of deferred policy acquisition costs 244 265 295 326 324 804 985 Other acquisition expenses 75 97 139 153 158 311 349
Total acquisition expenses 319 362 434 479 482 1,115 1,334General operating expenses 277 267 285 287 329 829 960Underwriting income (loss) (265) (121) 75 (2,713) (168) (311) (145)Net investment income (loss):
Interest and dividends 701 720 703 717 751 2,124 2,198Alternative investments (1) 182 130 (134) (19) (63) 178 388Other investment income (2) (13) (51) (76) (29) (72) (140) (2)Investment expenses (26) (20) (27) (24) (29) (73) (91)
Total net investment income 844 779 466 645 587 2,089 2,493Pre-tax operating income (loss) (7) $ 579 $ 658 $ 541 $ (2,068) $ 419 $ 1,778 $ 2,348Underwriting ratios: (6)
Loss ratio 88.1 82.4 74.0 159.8 80.1 81.3 77.9Catastrophe losses and reinstatement premiums (7.4) (6.7) (6.1) (3.2) (0.4) (6.8) (2.5)Prior year development net of premium adjustments (11.6) (3.2) (1.9) (85.2) (8.6) (5.3) (6.6)Net reserve discount benefit (charge) (0.6) (6.5) 0.9 (2.0) (1.2) (2.1) 1.4 Accident year loss ratio, as adjusted 68.5 66.0 66.9 69.4 69.9 67.1 70.2Acquisition ratio 11.5 12.5 14.2 14.7 14.9 12.8 13.7General operating expense ratio 10.0 9.2 9.3 8.8 10.2 9.5 9.9 Expense ratio 21.5 21.7 23.5 23.5 25.1 22.3 23.6Combined ratio 109.6 104.1 97.5 183.3 105.2 103.6 101.5Catastrophe losses and reinstatement premiums (7.4) (6.7) (6.1) (3.2) (0.4) (6.8) (2.5)Prior year development net of premium adjustments (11.6) (3.2) (1.9) (85.2) (8.6) (5.3) (6.6)Net reserve discount benefit (charge) (0.6) (6.5) 0.9 (2.0) (1.2) (2.1) 1.4 Accident year combined ratio, as adjusted 90.0 87.7 90.4 92.9 95.0 89.4 93.8
Noteworthy items (pre-tax): Catastrophe-related losses (3) $ 205 $ 196 $ 184 $ 104 $ 15 $ 585 $ 245 Reinstatement premiums related to prior year catastrophes (1) (11) (10) - - (22) (7) Severe losses (4) 39 23 - 23 53 62 219 Prior year development: Prior year loss reserve development (favorable) unfavorable, net of reinsurance 328 82 61 2,775 255 471 611 (Additional) returned premium related to prior year development (11) 22 6 (4) 30 17 53 Prior year loss reserve development (favorable) unfavorable, net of reinsurance and premium adjustments 317 104 67 2,771 285 488 664 Net reserve discount (benefit) charge $ 17 $ 191 $ (26) $ 68 $ 41 $ 182 $ (136)See Accompanying Notes on Pages 20 to 21. Prior periods have been restated to reflect intercompany reinsurance agreement. See Note 7 on page 21.
19
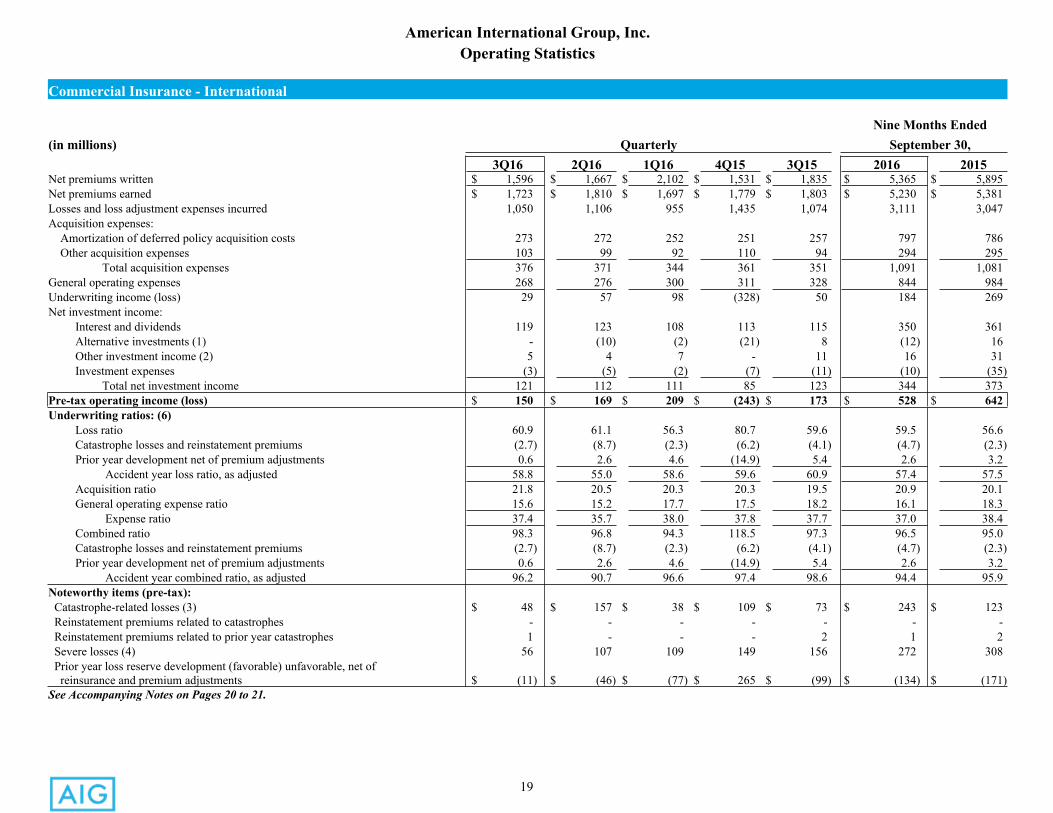
American International Group, Inc.Operating Statistics
Commercial Insurance - International
Nine Months Ended(in millions) Quarterly September 30,
3Q16 2Q16 1Q16 4Q15 3Q15 2016 2015 Net premiums written $ 1,596 $ 1,667 $ 2,102 $ 1,531 $ 1,835 $ 5,365 $ 5,895Net premiums earned $ 1,723 $ 1,810 $ 1,697 $ 1,779 $ 1,803 $ 5,230 $ 5,381Losses and loss adjustment expenses incurred 1,050 1,106 955 1,435 1,074 3,111 3,047Acquisition expenses: Amortization of deferred policy acquisition costs 273 272 252 251 257 797 786 Other acquisition expenses 103 99 92 110 94 294 295
Total acquisition expenses 376 371 344 361 351 1,091 1,081General operating expenses 268 276 300 311 328 844 984Underwriting income (loss) 29 57 98 (328) 50 184 269Net investment income:
Interest and dividends 119 123 108 113 115 350 361Alternative investments (1) - (10) (2) (21) 8 (12) 16Other investment income (2) 5 4 7 - 11 16 31Investment expenses (3) (5) (2) (7) (11) (10) (35)
Total net investment income 121 112 111 85 123 344 373Pre-tax operating income (loss) $ 150 $ 169 $ 209 $ (243) $ 173 $ 528 $ 642Underwriting ratios: (6)
Loss ratio 60.9 61.1 56.3 80.7 59.6 59.5 56.6Catastrophe losses and reinstatement premiums (2.7) (8.7) (2.3) (6.2) (4.1) (4.7) (2.3)Prior year development net of premium adjustments 0.6 2.6 4.6 (14.9) 5.4 2.6 3.2 Accident year loss ratio, as adjusted 58.8 55.0 58.6 59.6 60.9 57.4 57.5Acquisition ratio 21.8 20.5 20.3 20.3 19.5 20.9 20.1General operating expense ratio 15.6 15.2 17.7 17.5 18.2 16.1 18.3 Expense ratio 37.4 35.7 38.0 37.8 37.7 37.0 38.4Combined ratio 98.3 96.8 94.3 118.5 97.3 96.5 95.0Catastrophe losses and reinstatement premiums (2.7) (8.7) (2.3) (6.2) (4.1) (4.7) (2.3)Prior year development net of premium adjustments 0.6 2.6 4.6 (14.9) 5.4 2.6 3.2 Accident year combined ratio, as adjusted 96.2 90.7 96.6 97.4 98.6 94.4 95.9
Noteworthy items (pre-tax): Catastrophe-related losses (3) $ 48 $ 157 $ 38 $ 109 $ 73 $ 243 $ 123 Reinstatement premiums related to catastrophes - - - - - - - Reinstatement premiums related to prior year catastrophes 1 - - - 2 1 2 Severe losses (4) 56 107 109 149 156 272 308 Prior year loss reserve development (favorable) unfavorable, net of reinsurance and premium adjustments $ (11) $ (46) $ (77) $ 265 $ (99) $ (134) $ (171)See Accompanying Notes on Pages 20 to 21.
20
American International Group, Inc.Notes
Commercial Insurance
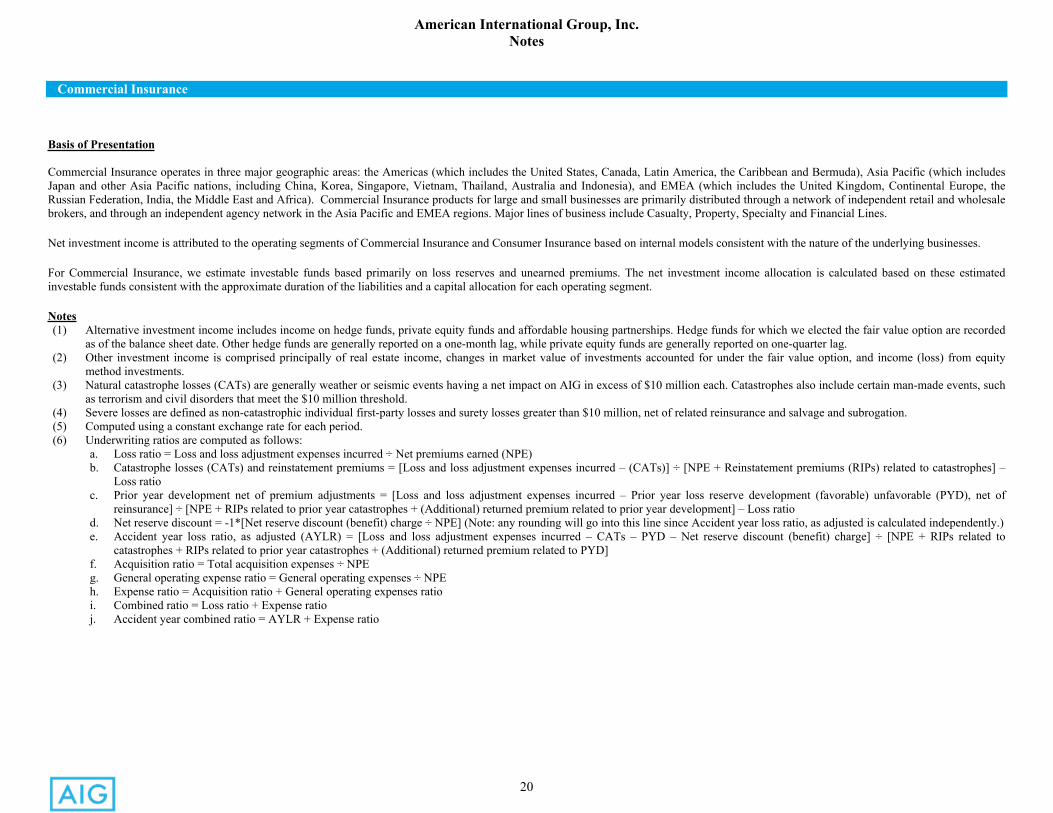
Basis of Presentation
Commercial Insurance operates in three major geographic areas: the Americas (which includes the United States, Canada, Latin America, the Caribbean and Bermuda), Asia Pacific (which includes Japan and other Asia Pacific nations, including China, Korea, Singapore, Vietnam, Thailand, Australia and Indonesia), and EMEA (which includes the United Kingdom, Continental Europe, the Russian Federation, India, the Middle East and Africa). Commercial Insurance products for large and small businesses are primarily distributed through a network of independent retail and wholesale brokers, and through an independent agency network in the Asia Pacific and EMEA regions. Major lines of business include Casualty, Property, Specialty and Financial Lines.
Net investment income is attributed to the operating segments of Commercial Insurance and Consumer Insurance based on internal models consistent with the nature of the underlying businesses.
For Commercial Insurance, we estimate investable funds based primarily on loss reserves and unearned premiums. The net investment income allocation is calculated based on these estimated investable funds consistent with the approximate duration of the liabilities and a capital allocation for each operating segment.
Notes(1) Alternative investment income includes income on hedge funds, private equity funds and affordable housing partnerships. Hedge funds for which we elected the fair value option are recorded
as of the balance sheet date. Other hedge funds are generally reported on a one-month lag, while private equity funds are generally reported on one-quarter lag.(2) Other investment income is comprised principally of real estate income, changes in market value of investments accounted for under the fair value option, and income (loss) from equity
method investments. (3) Natural catastrophe losses (CATs) are generally weather or seismic events having a net impact on AIG in excess of $10 million each. Catastrophes also include certain man-made events, such
as terrorism and civil disorders that meet the $10 million threshold.(4) Severe losses are defined as non-catastrophic individual first-party losses and surety losses greater than $10 million, net of related reinsurance and salvage and subrogation. (5) Computed using a constant exchange rate for each period.(6) Underwriting ratios are computed as follows:
a. Loss ratio = Loss and loss adjustment expenses incurred ÷ Net premiums earned (NPE)b. Catastrophe losses (CATs) and reinstatement premiums = [Loss and loss adjustment expenses incurred – (CATs)] ÷ [NPE + Reinstatement premiums (RIPs) related to catastrophes] –
Loss ratioc. Prior year development net of premium adjustments = [Loss and loss adjustment expenses incurred – Prior year loss reserve development (favorable) unfavorable (PYD), net of
reinsurance] ÷ [NPE + RIPs related to prior year catastrophes + (Additional) returned premium related to prior year development] – Loss ratiod. Net reserve discount = -1*[Net reserve discount (benefit) charge ÷ NPE] (Note: any rounding will go into this line since Accident year loss ratio, as adjusted is calculated independently.)e. Accident year loss ratio, as adjusted (AYLR) = [Loss and loss adjustment expenses incurred – CATs – PYD – Net reserve discount (benefit) charge] ÷ [NPE + RIPs related to
catastrophes + RIPs related to prior year catastrophes + (Additional) returned premium related to PYD]f. Acquisition ratio = Total acquisition expenses ÷ NPEg. General operating expense ratio = General operating expenses ÷ NPEh. Expense ratio = Acquisition ratio + General operating expenses ratioi. Combined ratio = Loss ratio + Expense ratioj. Accident year combined ratio = AYLR + Expense ratio
21
American International Group, Inc.Notes (continued)
Commercial Insurance
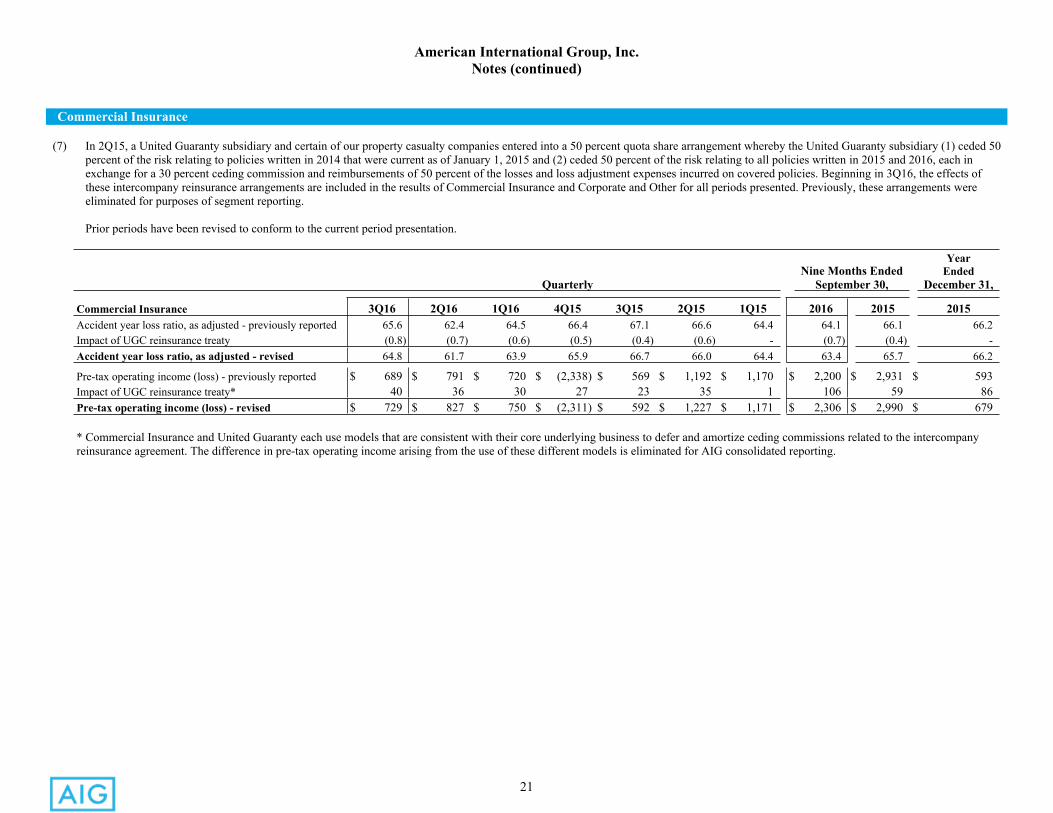
(7) In 2Q15, a United Guaranty subsidiary and certain of our property casualty companies entered into a 50 percent quota share arrangement whereby the United Guaranty subsidiary (1) ceded 50 percent of the risk relating to policies written in 2014 that were current as of January 1, 2015 and (2) ceded 50 percent of the risk relating to all policies written in 2015 and 2016, each in exchange for a 30 percent ceding commission and reimbursements of 50 percent of the losses and loss adjustment expenses incurred on covered policies. Beginning in 3Q16, the effects of these intercompany reinsurance arrangements are included in the results of Commercial Insurance and Corporate and Other for all periods presented. Previously, these arrangements were eliminated for purposes of segment reporting.
Prior periods have been revised to conform to the current period presentation.
Nine Months EndedYear
EndedQuarterly September 30, December 31,
Commercial Insurance 3Q16 2Q16 1Q16 4Q15 3Q15 2Q15 1Q15 2016 2015 2015 Accident year loss ratio, as adjusted - previously reported 65.6 62.4 64.5 66.4 67.1 66.6 64.4 64.1 66.1 66.2Impact of UGC reinsurance treaty (0.8) (0.7) (0.6) (0.5) (0.4) (0.6) - (0.7) (0.4) -Accident year loss ratio, as adjusted - revised 64.8 61.7 63.9 65.9 66.7 66.0 64.4 63.4 65.7 66.2
Pre-tax operating income (loss) - previously reported $ 689 $ 791 $ 720 $ (2,338) $ 569 $ 1,192 $ 1,170 $ 2,200 $ 2,931 $ 593Impact of UGC reinsurance treaty* 40 36 30 27 23 35 1 106 59 86Pre-tax operating income (loss) - revised $ 729 $ 827 $ 750 $ (2,311) $ 592 $ 1,227 $ 1,171 $ 2,306 $ 2,990 $ 679
* Commercial Insurance and United Guaranty each use models that are consistent with their core underlying business to defer and amortize ceding commissions related to the intercompany reinsurance agreement. The difference in pre-tax operating income arising from the use of these different models is eliminated for AIG consolidated reporting.
22
American International Group, Inc.Operating Results
Consumer Insurance
Nine Months Ended(in millions) Quarterly September 30,
3Q16 2Q16 1Q16 4Q15 3Q15 2016 2015
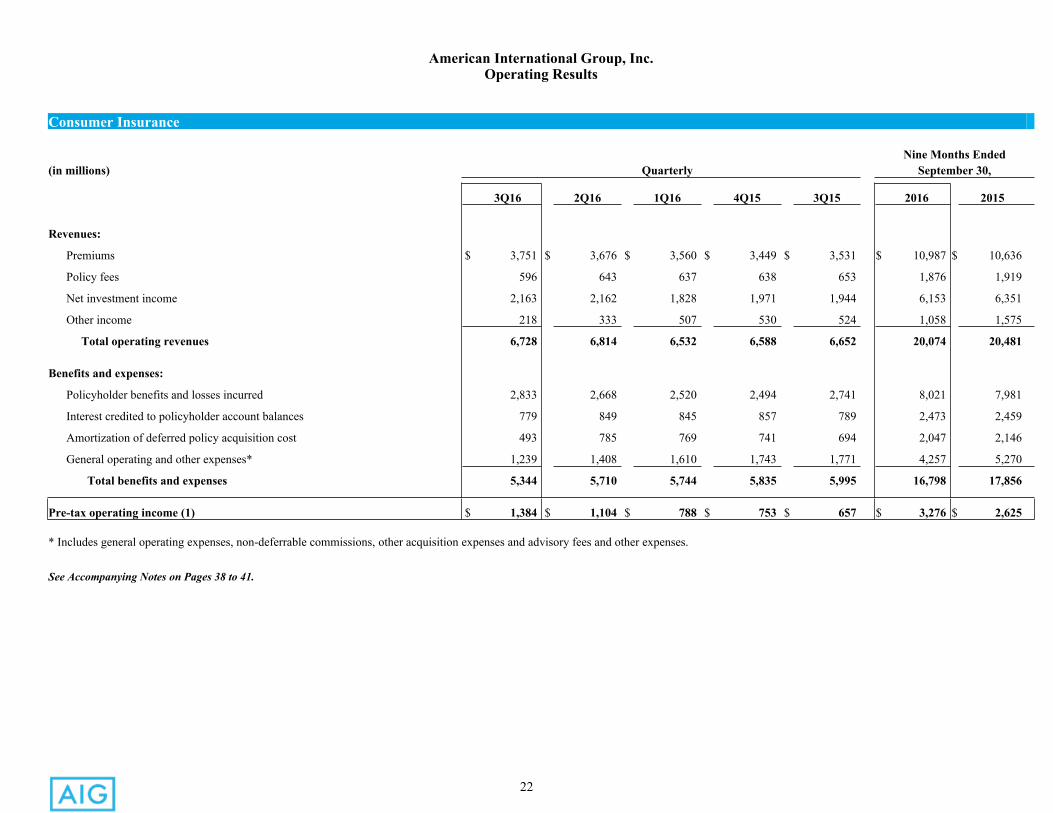
Revenues:
Premiums $ 3,751 $ 3,676 $ 3,560 $ 3,449 $ 3,531 $ 10,987 $ 10,636
Policy fees 596 643 637 638 653 1,876 1,919
Net investment income 2,163 2,162 1,828 1,971 1,944 6,153 6,351
Other income 218 333 507 530 524 1,058 1,575
Total operating revenues 6,728 6,814 6,532 6,588 6,652 20,074 20,481
Benefits and expenses:
Policyholder benefits and losses incurred 2,833 2,668 2,520 2,494 2,741 8,021 7,981
Interest credited to policyholder account balances 779 849 845 857 789 2,473 2,459
Amortization of deferred policy acquisition cost 493 785 769 741 694 2,047 2,146
General operating and other expenses* 1,239 1,408 1,610 1,743 1,771 4,257 5,270
Total benefits and expenses 5,344 5,710 5,744 5,835 5,995 16,798 17,856
Pre-tax operating income (1) $ 1,384 $ 1,104 $ 788 $ 753 $ 657 $ 3,276 $ 2,625
* Includes general operating expenses, non-deferrable commissions, other acquisition expenses and advisory fees and other expenses.
See Accompanying Notes on Pages 38 to 41.
23
American International Group, Inc.Operating Results
Consumer Insurance - Retirement
Nine Months Ended(in millions) Quarterly September 30,
3Q16 2Q16 1Q16 4Q15 3Q15 2016 2015
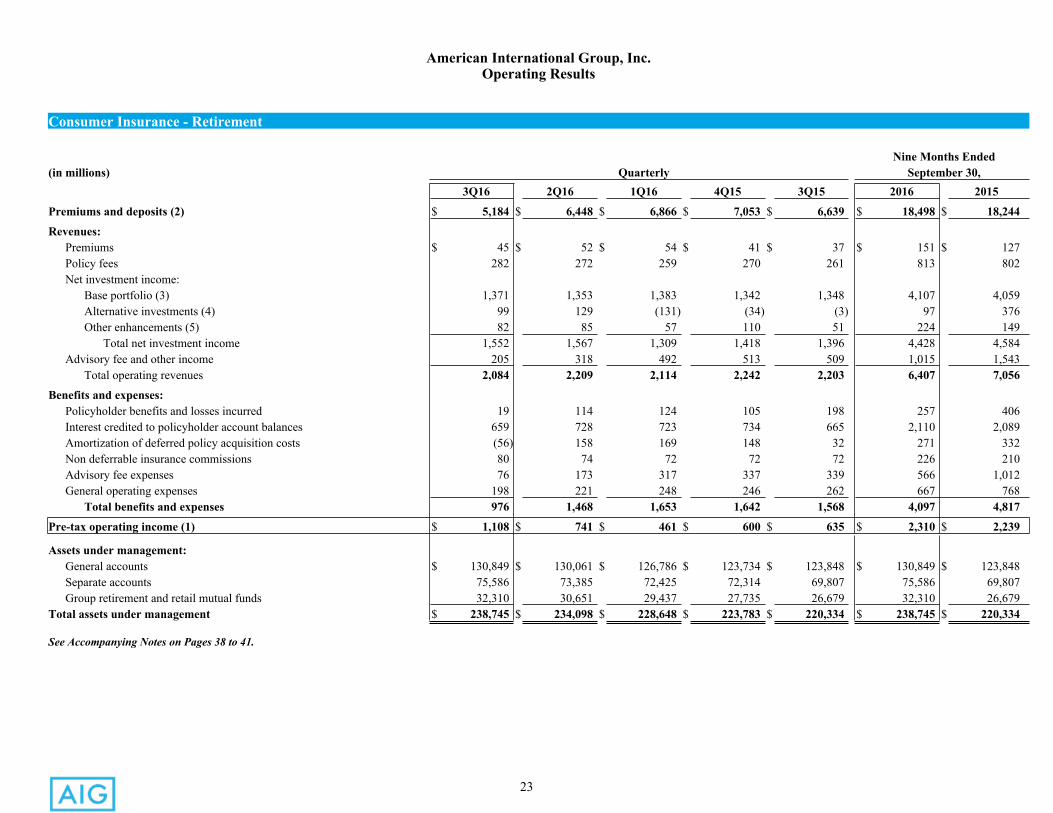
Premiums and deposits (2) $ 5,184 $ 6,448 $ 6,866 $ 7,053 $ 6,639 $ 18,498 $ 18,244
Revenues:Premiums $ 45 $ 52 $ 54 $ 41 $ 37 $ 151 $ 127Policy fees 282 272 259 270 261 813 802Net investment income:
Base portfolio (3) 1,371 1,353 1,383 1,342 1,348 4,107 4,059Alternative investments (4) 99 129 (131) (34) (3) 97 376Other enhancements (5) 82 85 57 110 51 224 149
Total net investment income 1,552 1,567 1,309 1,418 1,396 4,428 4,584Advisory fee and other income 205 318 492 513 509 1,015 1,543
Total operating revenues 2,084 2,209 2,114 2,242 2,203 6,407 7,056
Benefits and expenses:Policyholder benefits and losses incurred 19 114 124 105 198 257 406Interest credited to policyholder account balances 659 728 723 734 665 2,110 2,089Amortization of deferred policy acquisition costs (56) 158 169 148 32 271 332Non deferrable insurance commissions 80 74 72 72 72 226 210Advisory fee expenses 76 173 317 337 339 566 1,012General operating expenses 198 221 248 246 262 667 768
Total benefits and expenses 976 1,468 1,653 1,642 1,568 4,097 4,817
Pre-tax operating income (1) $ 1,108 $ 741 $ 461 $ 600 $ 635 $ 2,310 $ 2,239
Assets under management:General accounts $ 130,849 $ 130,061 $ 126,786 $ 123,734 $ 123,848 $ 130,849 $ 123,848Separate accounts 75,586 73,385 72,425 72,314 69,807 75,586 69,807Group retirement and retail mutual funds 32,310 30,651 29,437 27,735 26,679 32,310 26,679
Total assets under management $ 238,745 $ 234,098 $ 228,648 $ 223,783 $ 220,334 $ 238,745 $ 220,334
See Accompanying Notes on Pages 38 to 41.
24
American International Group, Inc.Net Flows
Consumer Insurance - Retirement
Nine Months Ended(in millions) Quarterly September 30,
3Q16 2Q16 1Q16 4Q15 3Q15 2016 2015Investment Products Net Flows:
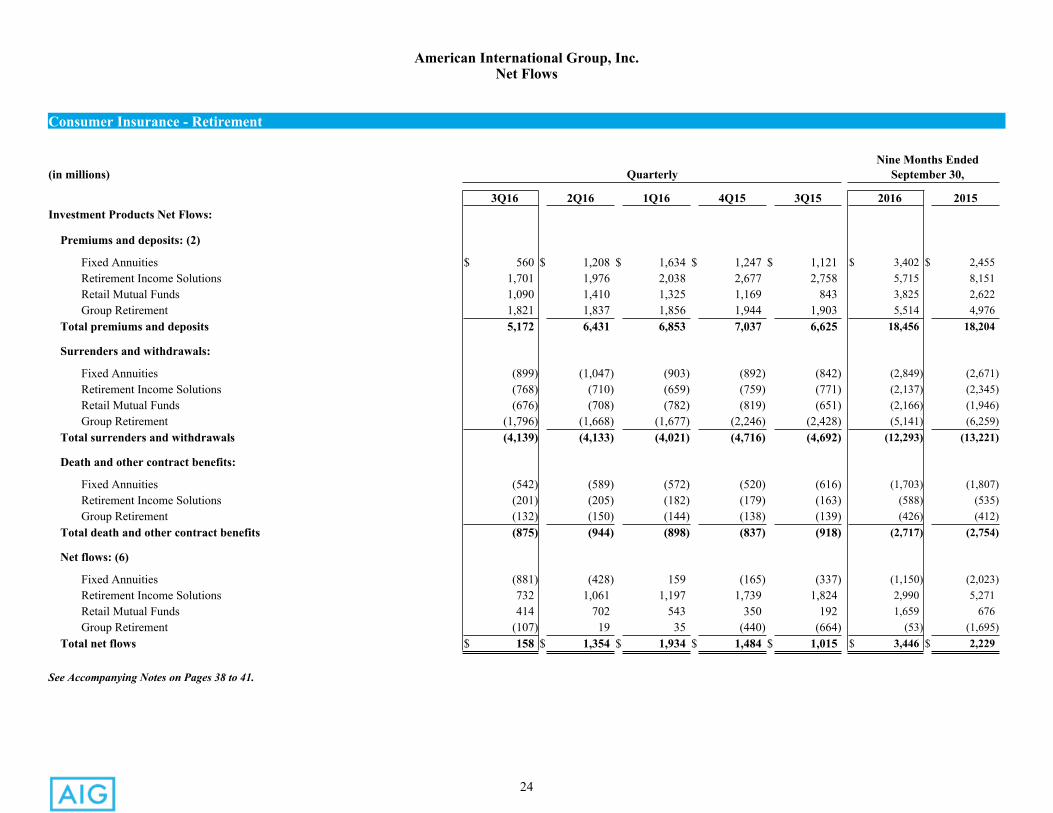
Premiums and deposits: (2)
Fixed Annuities $ 560 $ 1,208 $ 1,634 $ 1,247 $ 1,121 $ 3,402 $ 2,455Retirement Income Solutions 1,701 1,976 2,038 2,677 2,758 5,715 8,151Retail Mutual Funds 1,090 1,410 1,325 1,169 843 3,825 2,622Group Retirement 1,821 1,837 1,856 1,944 1,903 5,514 4,976
Total premiums and deposits 5,172 6,431 6,853 7,037 6,625 18,456 18,204
Surrenders and withdrawals:
Fixed Annuities (899) (1,047) (903) (892) (842) (2,849) (2,671)Retirement Income Solutions (768) (710) (659) (759) (771) (2,137) (2,345)Retail Mutual Funds (676) (708) (782) (819) (651) (2,166) (1,946)Group Retirement (1,796) (1,668) (1,677) (2,246) (2,428) (5,141) (6,259)
Total surrenders and withdrawals (4,139) (4,133) (4,021) (4,716) (4,692) (12,293) (13,221)
Death and other contract benefits:
Fixed Annuities (542) (589) (572) (520) (616) (1,703) (1,807)Retirement Income Solutions (201) (205) (182) (179) (163) (588) (535)Group Retirement (132) (150) (144) (138) (139) (426) (412)
Total death and other contract benefits (875) (944) (898) (837) (918) (2,717) (2,754)
Net flows: (6)
Fixed Annuities (881) (428) 159 (165) (337) (1,150) (2,023)Retirement Income Solutions 732 1,061 1,197 1,739 1,824 2,990 5,271Retail Mutual Funds 414 702 543 350 192 1,659 676Group Retirement (107) 19 35 (440) (664) (53) (1,695)
Total net flows $ 158 $ 1,354 $ 1,934 $ 1,484 $ 1,015 $ 3,446 $ 2,229
See Accompanying Notes on Pages 38 to 41.
25
American International Group, Inc.Operating Statistics
Consumer Insurance - Retirement (Fixed Annuities)
Nine Months Ended(in millions) Quarterly September 30,
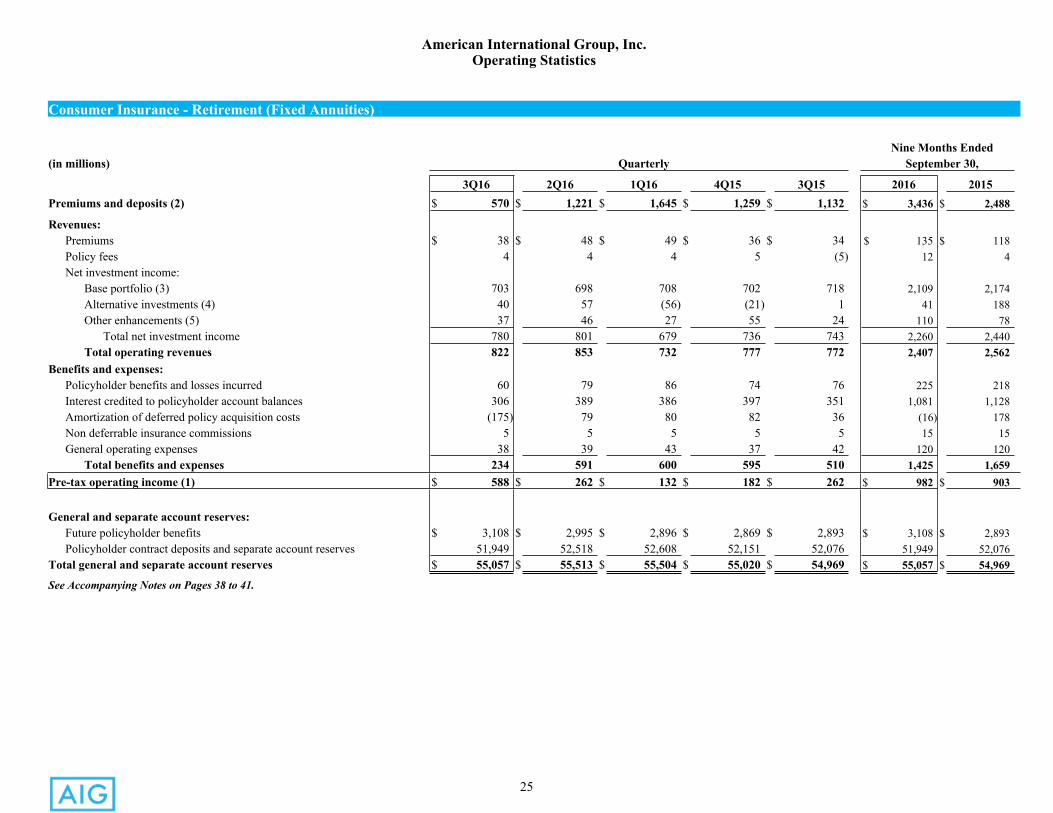
3Q16 2Q16 1Q16 4Q15 3Q15 2016 2015Premiums and deposits (2) $ 570 $ 1,221 $ 1,645 $ 1,259 $ 1,132 $ 3,436 $ 2,488
Revenues:Premiums $ 38 $ 48 $ 49 $ 36 $ 34 $ 135 $ 118Policy fees 4 4 4 5 (5) 12 4Net investment income:
Base portfolio (3) 703 698 708 702 718 2,109 2,174Alternative investments (4) 40 57 (56) (21) 1 41 188Other enhancements (5) 37 46 27 55 24 110 78
Total net investment income 780 801 679 736 743 2,260 2,440Total operating revenues 822 853 732 777 772 2,407 2,562
Benefits and expenses:Policyholder benefits and losses incurred 60 79 86 74 76 225 218Interest credited to policyholder account balances 306 389 386 397 351 1,081 1,128Amortization of deferred policy acquisition costs (175) 79 80 82 36 (16) 178Non deferrable insurance commissions 5 5 5 5 5 15 15General operating expenses 38 39 43 37 42 120 120
Total benefits and expenses 234 591 600 595 510 1,425 1,659Pre-tax operating income (1) $ 588 $ 262 $ 132 $ 182 $ 262 $ 982 $ 903
General and separate account reserves: Future policyholder benefits $ 3,108 $ 2,995 $ 2,896 $ 2,869 $ 2,893 $ 3,108 $ 2,893Policyholder contract deposits and separate account reserves 51,949 52,518 52,608 52,151 52,076 51,949 52,076
Total general and separate account reserves $ 55,057 $ 55,513 $ 55,504 $ 55,020 $ 54,969 $ 55,057 $ 54,969
See Accompanying Notes on Pages 38 to 41.
26
American International Group, Inc.Operating Statistics
Consumer Insurance - Retirement (Fixed Annuities)
Nine Months Ended(in millions) Quarterly September 30,
3Q16 2Q16 1Q16 4Q15 3Q15 2016 2015
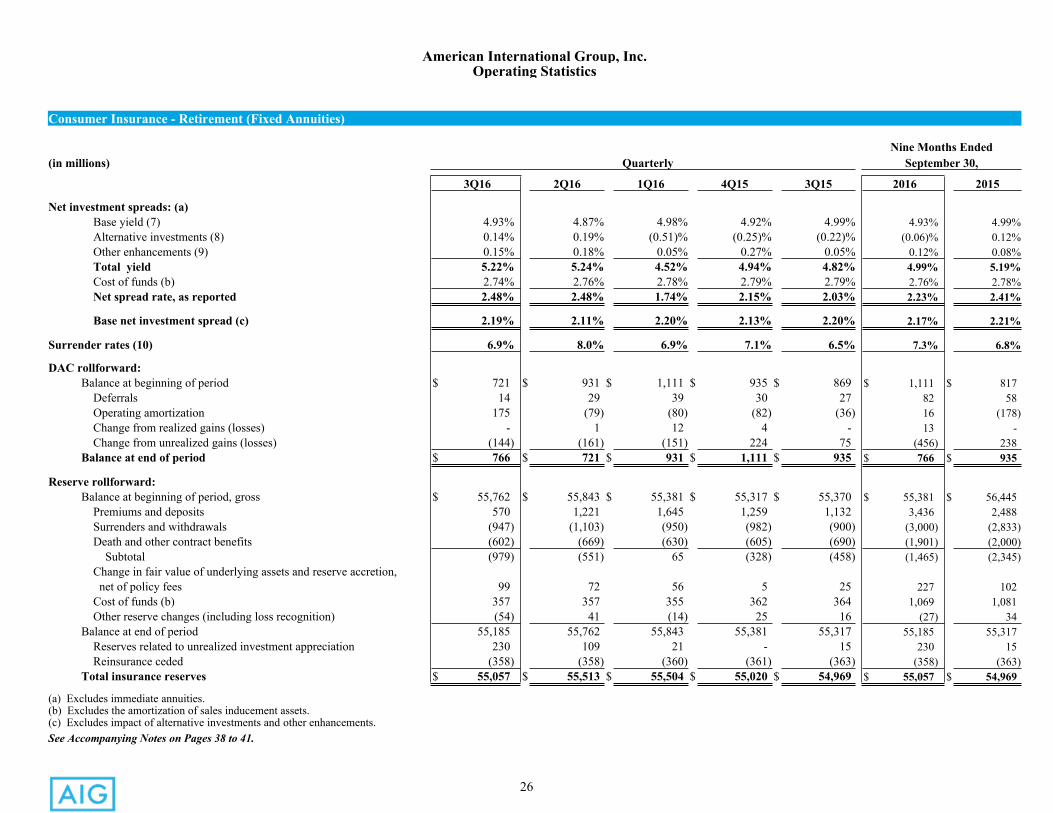
Net investment spreads: (a)Base yield (7) 4.93% 4.87% 4.98% 4.92% 4.99% 4.93% 4.99%Alternative investments (8) 0.14% 0.19% (0.51)% (0.25)% (0.22)% (0.06)% 0.12%Other enhancements (9) 0.15% 0.18% 0.05% 0.27% 0.05% 0.12% 0.08%Total yield 5.22% 5.24% 4.52% 4.94% 4.82% 4.99% 5.19%Cost of funds (b) 2.74% 2.76% 2.78% 2.79% 2.79% 2.76% 2.78%Net spread rate, as reported 2.48% 2.48% 1.74% 2.15% 2.03% 2.23% 2.41%
Base net investment spread (c) 2.19% 2.11% 2.20% 2.13% 2.20% 2.17% 2.21%
Surrender rates (10) 6.9% 8.0% 6.9% 7.1% 6.5% 7.3% 6.8%
DAC rollforward:Balance at beginning of period $ 721 $ 931 $ 1,111 $ 935 $ 869 $ 1,111 $ 817
Deferrals 14 29 39 30 27 82 58Operating amortization 175 (79) (80) (82) (36) 16 (178)Change from realized gains (losses) - 1 12 4 - 13 -Change from unrealized gains (losses) (144) (161) (151) 224 75 (456) 238
Balance at end of period $ 766 $ 721 $ 931 $ 1,111 $ 935 $ 766 $ 935
Reserve rollforward: Balance at beginning of period, gross $ 55,762 $ 55,843 $ 55,381 $ 55,317 $ 55,370 $ 55,381 $ 56,445
Premiums and deposits 570 1,221 1,645 1,259 1,132 3,436 2,488Surrenders and withdrawals (947) (1,103) (950) (982) (900) (3,000) (2,833)Death and other contract benefits (602) (669) (630) (605) (690) (1,901) (2,000) Subtotal (979) (551) 65 (328) (458) (1,465) (2,345)Change in fair value of underlying assets and reserve accretion, net of policy fees 99 72 56 5 25 227 102Cost of funds (b) 357 357 355 362 364 1,069 1,081Other reserve changes (including loss recognition) (54) 41 (14) 25 16 (27) 34
Balance at end of period 55,185 55,762 55,843 55,381 55,317 55,185 55,317Reserves related to unrealized investment appreciation 230 109 21 - 15 230 15Reinsurance ceded (358) (358) (360) (361) (363) (358) (363)
Total insurance reserves $ 55,057 $ 55,513 $ 55,504 $ 55,020 $ 54,969 $ 55,057 $ 54,969
(a) Excludes immediate annuities.(b) Excludes the amortization of sales inducement assets.(c) Excludes impact of alternative investments and other enhancements.See Accompanying Notes on Pages 38 to 41.
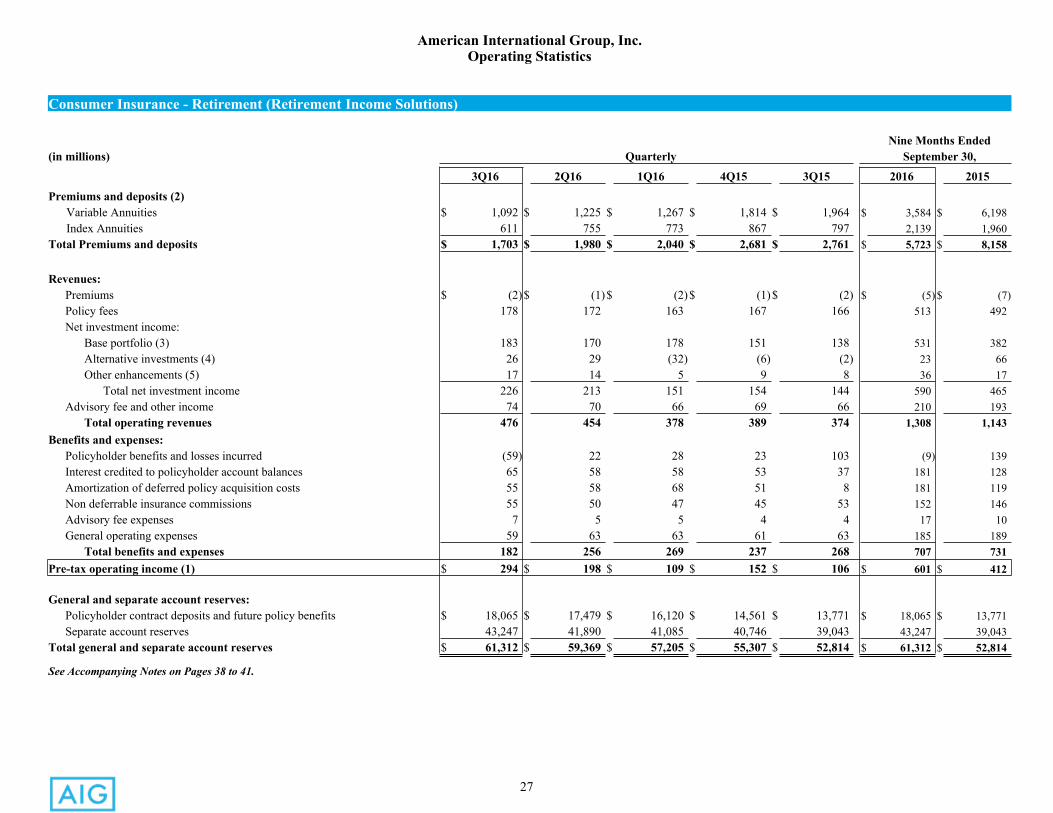
27
American International Group, Inc.Operating Statistics
Consumer Insurance - Retirement (Retirement Income Solutions)
Nine Months Ended(in millions) Quarterly September 30,
3Q16 2Q16 1Q16 4Q15 3Q15 2016 2015
Premiums and deposits (2)Variable Annuities $ 1,092 $ 1,225 $ 1,267 $ 1,814 $ 1,964 $ 3,584 $ 6,198Index Annuities 611 755 773 867 797 2,139 1,960
Total Premiums and deposits $ 1,703 $ 1,980 $ 2,040 $ 2,681 $ 2,761 $ 5,723 $ 8,158
Revenues:Premiums $ (2)$ (1)$ (2)$ (1)$ (2) $ (5) $ (7)Policy fees 178 172 163 167 166 513 492Net investment income:
Base portfolio (3) 183 170 178 151 138 531 382Alternative investments (4) 26 29 (32) (6) (2) 23 66Other enhancements (5) 17 14 5 9 8 36 17
Total net investment income 226 213 151 154 144 590 465Advisory fee and other income 74 70 66 69 66 210 193
Total operating revenues 476 454 378 389 374 1,308 1,143Benefits and expenses:
Policyholder benefits and losses incurred (59) 22 28 23 103 (9) 139Interest credited to policyholder account balances 65 58 58 53 37 181 128Amortization of deferred policy acquisition costs 55 58 68 51 8 181 119Non deferrable insurance commissions 55 50 47 45 53 152 146Advisory fee expenses 7 5 5 4 4 17 10General operating expenses 59 63 63 61 63 185 189
Total benefits and expenses 182 256 269 237 268 707 731-Pre-tax operating income (1) $ 294 $ 198 $ 109 $ 152 $ 106 $ 601 $ 412
General and separate account reserves:Policyholder contract deposits and future policy benefits $ 18,065 $ 17,479 $ 16,120 $ 14,561 $ 13,771 $ 18,065 $ 13,771Separate account reserves 43,247 41,890 41,085 40,746 39,043 43,247 39,043
Total general and separate account reserves $ 61,312 $ 59,369 $ 57,205 $ 55,307 $ 52,814 $ 61,312 $ 52,814
See Accompanying Notes on Pages 38 to 41.
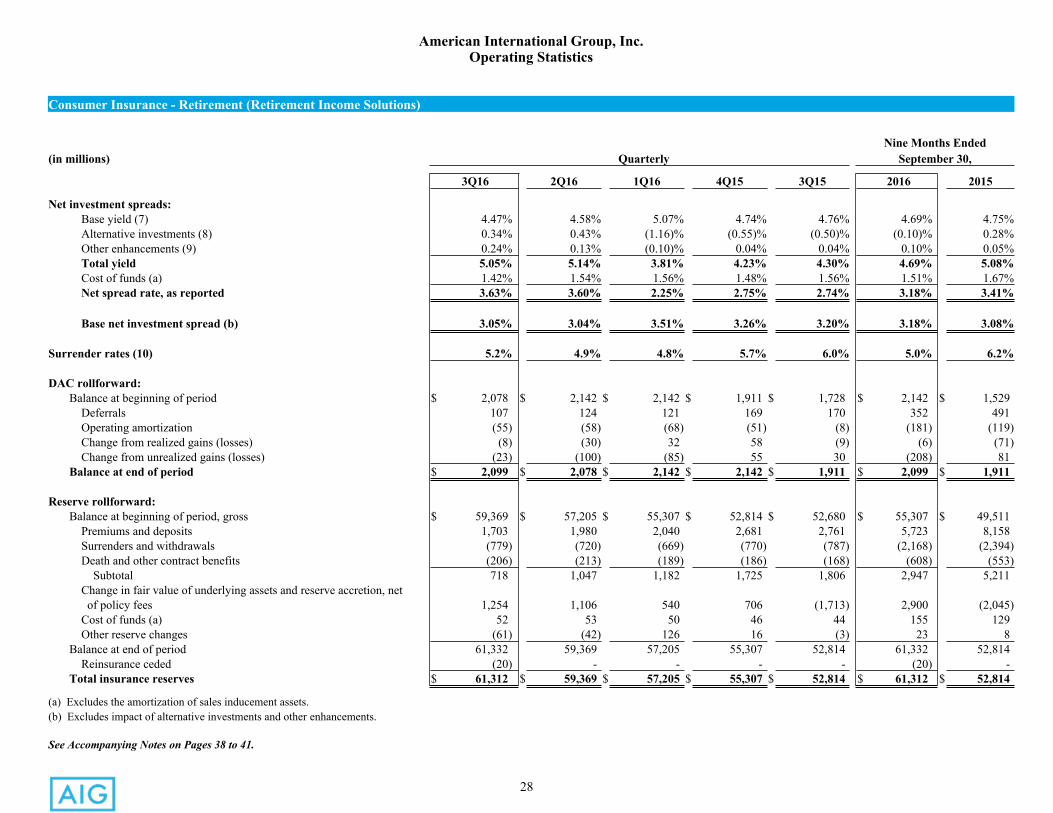
28
American International Group, Inc.Operating Statistics
Consumer Insurance - Retirement (Retirement Income Solutions)
Nine Months Ended(in millions) Quarterly September 30,
3Q16 2Q16 1Q16 4Q15 3Q15 2016 2015
Net investment spreads:Base yield (7) 4.47% 4.58% 5.07% 4.74% 4.76% 4.69% 4.75%Alternative investments (8) 0.34% 0.43% (1.16)% (0.55)% (0.50)% (0.10)% 0.28%Other enhancements (9) 0.24% 0.13% (0.10)% 0.04% 0.04% 0.10% 0.05%Total yield 5.05% 5.14% 3.81% 4.23% 4.30% 4.69% 5.08%Cost of funds (a) 1.42% 1.54% 1.56% 1.48% 1.56% 1.51% 1.67%Net spread rate, as reported 3.63% 3.60% 2.25% 2.75% 2.74% 3.18% 3.41%
Base net investment spread (b) 3.05% 3.04% 3.51% 3.26% 3.20% 3.18% 3.08%
Surrender rates (10) 5.2% 4.9% 4.8% 5.7% 6.0% 5.0% 6.2%
DAC rollforward:Balance at beginning of period $ 2,078 $ 2,142 $ 2,142 $ 1,911 $ 1,728 $ 2,142 $ 1,529
Deferrals 107 124 121 169 170 352 491Operating amortization (55) (58) (68) (51) (8) (181) (119)Change from realized gains (losses) (8) (30) 32 58 (9) (6) (71)Change from unrealized gains (losses) (23) (100) (85) 55 30 (208) 81
Balance at end of period $ 2,099 $ 2,078 $ 2,142 $ 2,142 $ 1,911 $ 2,099 $ 1,911
Reserve rollforward:Balance at beginning of period, gross $ 59,369 $ 57,205 $ 55,307 $ 52,814 $ 52,680 $ 55,307 $ 49,511
Premiums and deposits 1,703 1,980 2,040 2,681 2,761 5,723 8,158Surrenders and withdrawals (779) (720) (669) (770) (787) (2,168) (2,394)Death and other contract benefits (206) (213) (189) (186) (168) (608) (553) Subtotal 718 1,047 1,182 1,725 1,806 2,947 5,211Change in fair value of underlying assets and reserve accretion, net of policy fees 1,254 1,106 540 706 (1,713) 2,900 (2,045)Cost of funds (a) 52 53 50 46 44 155 129Other reserve changes (61) (42) 126 16 (3) 23 8
Balance at end of period 61,332 59,369 57,205 55,307 52,814 61,332 52,814Reinsurance ceded (20) - - - - (20) -
Total insurance reserves $ 61,312 $ 59,369 $ 57,205 $ 55,307 $ 52,814 $ 61,312 $ 52,814
(a) Excludes the amortization of sales inducement assets.(b) Excludes impact of alternative investments and other enhancements.
See Accompanying Notes on Pages 38 to 41.
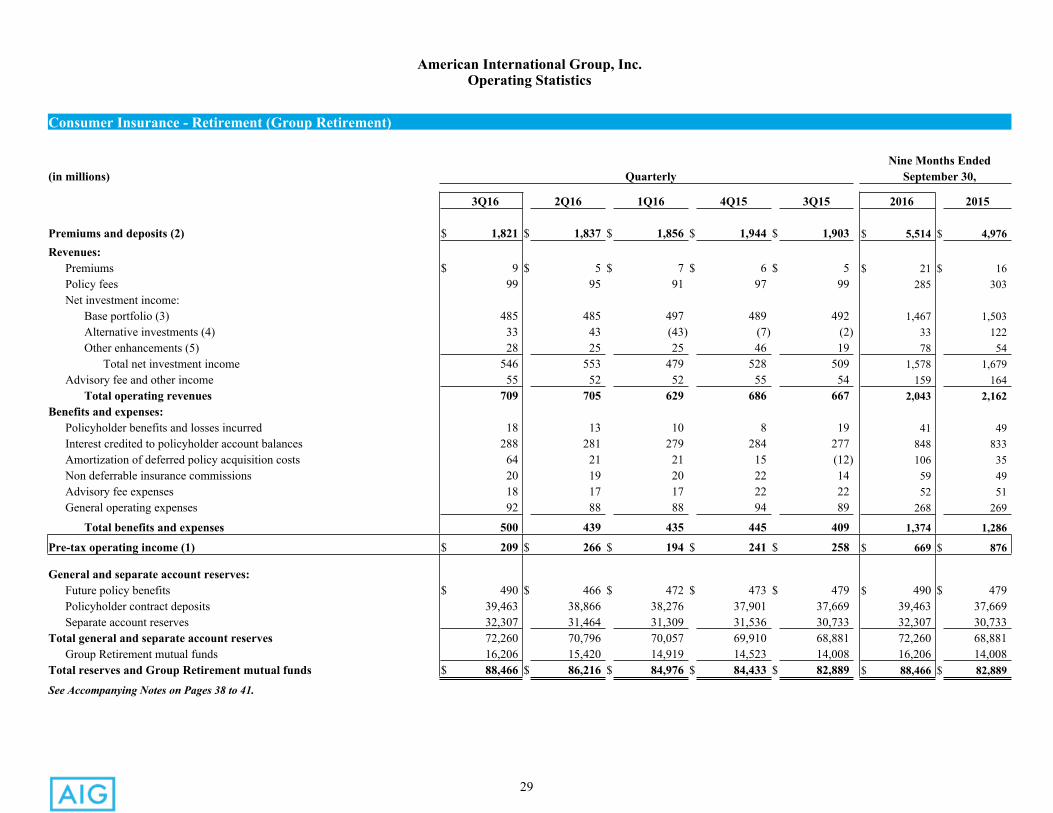
29
American International Group, Inc.Operating Statistics
Consumer Insurance - Retirement (Group Retirement)
Nine Months Ended(in millions) Quarterly September 30,
3Q16 2Q16 1Q16 4Q15 3Q15 2016 2015
Premiums and deposits (2) $ 1,821 $ 1,837 $ 1,856 $ 1,944 $ 1,903 $ 5,514 $ 4,976Revenues:
Premiums $ 9 $ 5 $ 7 $ 6 $ 5 $ 21 $ 16Policy fees 99 95 91 97 99 285 303Net investment income:
Base portfolio (3) 485 485 497 489 492 1,467 1,503Alternative investments (4) 33 43 (43) (7) (2) 33 122Other enhancements (5) 28 25 25 46 19 78 54
Total net investment income 546 553 479 528 509 1,578 1,679Advisory fee and other income 55 52 52 55 54 159 164
Total operating revenues 709 705 629 686 667 2,043 2,162Benefits and expenses:
Policyholder benefits and losses incurred 18 13 10 8 19 41 49Interest credited to policyholder account balances 288 281 279 284 277 848 833Amortization of deferred policy acquisition costs 64 21 21 15 (12) 106 35Non deferrable insurance commissions 20 19 20 22 14 59 49Advisory fee expenses 18 17 17 22 22 52 51General operating expenses 92 88 88 94 89 268 269
Total benefits and expenses 500 439 435 445 409 1,374 1,286
Pre-tax operating income (1) $ 209 $ 266 $ 194 $ 241 $ 258 $ 669 $ 876
General and separate account reserves:Future policy benefits $ 490 $ 466 $ 472 $ 473 $ 479 $ 490 $ 479Policyholder contract deposits 39,463 38,866 38,276 37,901 37,669 39,463 37,669Separate account reserves 32,307 31,464 31,309 31,536 30,733 32,307 30,733
Total general and separate account reserves 72,260 70,796 70,057 69,910 68,881 72,260 68,881Group Retirement mutual funds 16,206 15,420 14,919 14,523 14,008 16,206 14,008
Total reserves and Group Retirement mutual funds $ 88,466 $ 86,216 $ 84,976 $ 84,433 $ 82,889 $ 88,466 $ 82,889
See Accompanying Notes on Pages 38 to 41.
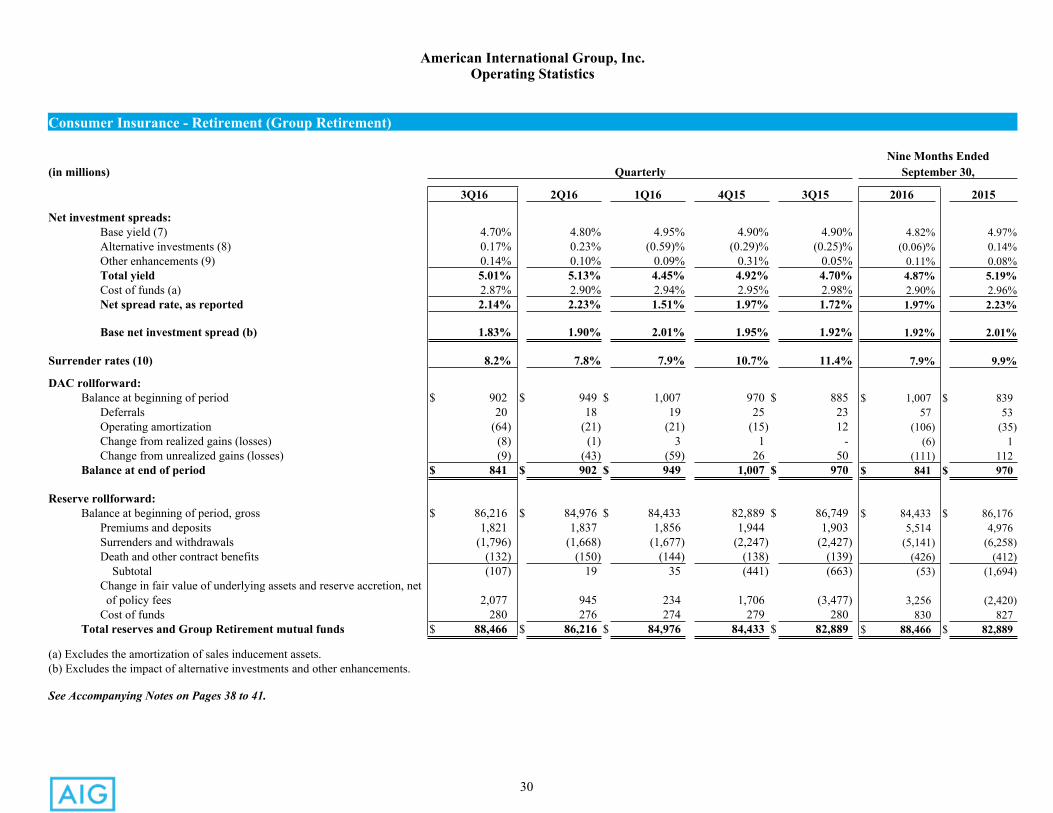
30
American International Group, Inc.Operating Statistics
Consumer Insurance - Retirement (Group Retirement)
Nine Months Ended(in millions) Quarterly September 30,
3Q16 2Q16 1Q16 4Q15 3Q15 2016 2015
Net investment spreads:Base yield (7) 4.70% 4.80% 4.95% 4.90% 4.90% 4.82% 4.97%Alternative investments (8) 0.17% 0.23% (0.59)% (0.29)% (0.25)% (0.06)% 0.14%Other enhancements (9) 0.14% 0.10% 0.09% 0.31% 0.05% 0.11% 0.08%Total yield 5.01% 5.13% 4.45% 4.92% 4.70% 4.87% 5.19%Cost of funds (a) 2.87% 2.90% 2.94% 2.95% 2.98% 2.90% 2.96%Net spread rate, as reported 2.14% 2.23% 1.51% 1.97% 1.72% 1.97% 2.23%
Base net investment spread (b) 1.83% 1.90% 2.01% 1.95% 1.92% 1.92% 2.01%
Surrender rates (10) 8.2% 7.8% 7.9% 10.7% 11.4% 7.9% 9.9%
DAC rollforward:Balance at beginning of period $ 902 $ 949 $ 1,007 970 $ 885 $ 1,007 $ 839
Deferrals 20 18 19 25 23 57 53Operating amortization (64) (21) (21) (15) 12 (106) (35)Change from realized gains (losses) (8) (1) 3 1 - (6) 1Change from unrealized gains (losses) (9) (43) (59) 26 50 (111) 112
Balance at end of period $ 841 $ 902 $ 949 1,007 $ 970 $ 841 $ 970
Reserve rollforward: Balance at beginning of period, gross $ 86,216 $ 84,976 $ 84,433 82,889 $ 86,749 $ 84,433 $ 86,176
Premiums and deposits 1,821 1,837 1,856 1,944 1,903 5,514 4,976Surrenders and withdrawals (1,796) (1,668) (1,677) (2,247) (2,427) (5,141) (6,258)Death and other contract benefits (132) (150) (144) (138) (139) (426) (412) Subtotal (107) 19 35 (441) (663) (53) (1,694)Change in fair value of underlying assets and reserve accretion, net of policy fees 2,077 945 234 1,706 (3,477) 3,256 (2,420)Cost of funds 280 276 274 279 280 830 827
Total reserves and Group Retirement mutual funds $ 88,466 $ 86,216 $ 84,976 84,433 $ 82,889 $ 88,466 $ 82,889
(a) Excludes the amortization of sales inducement assets.(b) Excludes the impact of alternative investments and other enhancements.
See Accompanying Notes on Pages 38 to 41.
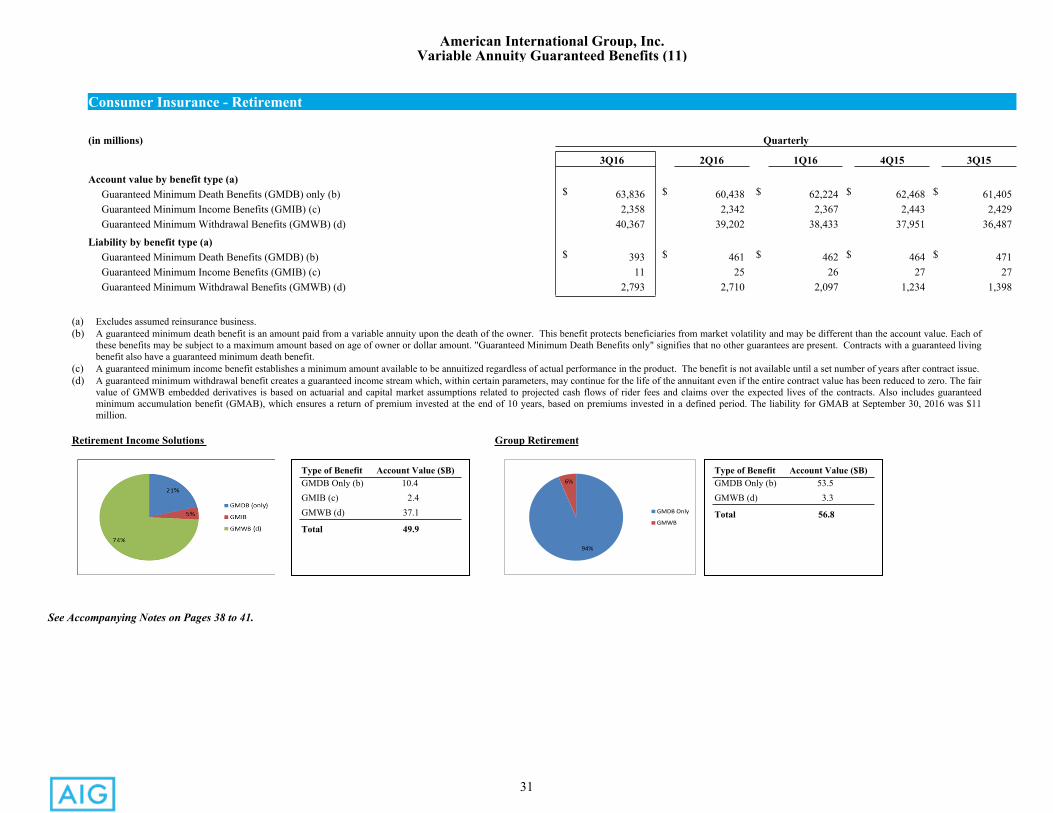
31
American International Group, Inc.Variable Annuity Guaranteed Benefits (11)
Consumer Insurance - Retirement
(in millions) Quarterly
3Q16 2Q16 1Q16 4Q15 3Q15
Account value by benefit type (a) Guaranteed Minimum Death Benefits (GMDB) only (b) $ 63,836 $ 60,438 $ 62,224 $ 62,468 $ 61,405 Guaranteed Minimum Income Benefits (GMIB) (c) 2,358 2,342 2,367 2,443 2,429 Guaranteed Minimum Withdrawal Benefits (GMWB) (d) 40,367 39,202 38,433 37,951 36,487
Liability by benefit type (a) Guaranteed Minimum Death Benefits (GMDB) (b) $ 393 $ 461 $ 462 $ 464 $ 471 Guaranteed Minimum Income Benefits (GMIB) (c) 11 25 26 27 27 Guaranteed Minimum Withdrawal Benefits (GMWB) (d) 2,793 2,710 2,097 1,234 1,398
(a) Excludes assumed reinsurance business.(b) A guaranteed minimum death benefit is an amount paid from a variable annuity upon the death of the owner. This benefit protects beneficiaries from market volatility and may be different than the account value. Each of
these benefits may be subject to a maximum amount based on age of owner or dollar amount. "Guaranteed Minimum Death Benefits only" signifies that no other guarantees are present. Contracts with a guaranteed living benefit also have a guaranteed minimum death benefit.
(c) A guaranteed minimum income benefit establishes a minimum amount available to be annuitized regardless of actual performance in the product. The benefit is not available until a set number of years after contract issue.(d) A guaranteed minimum withdrawal benefit creates a guaranteed income stream which, within certain parameters, may continue for the life of the annuitant even if the entire contract value has been reduced to zero. The fair
value of GMWB embedded derivatives is based on actuarial and capital market assumptions related to projected cash flows of rider fees and claims over the expected lives of the contracts. Also includes guaranteed minimum accumulation benefit (GMAB), which ensures a return of premium invested at the end of 10 years, based on premiums invested in a defined period. The liability for GMAB at September 30, 2016 was $11 million.
Retirement Income Solutions Group Retirement
94%
6%
GMDB Only
GMWB
See Accompanying Notes on Pages 38 to 41.
Type of Benefit Account Value ($B) GMDB Only (b) 10.4GMIB (c) 2.4 GMWB (d) 37.1
Total 49.9
Type of Benefit Account Value ($B) GMDB Only (b) 53.5 GMWB (d) 3.3
Total 56.8
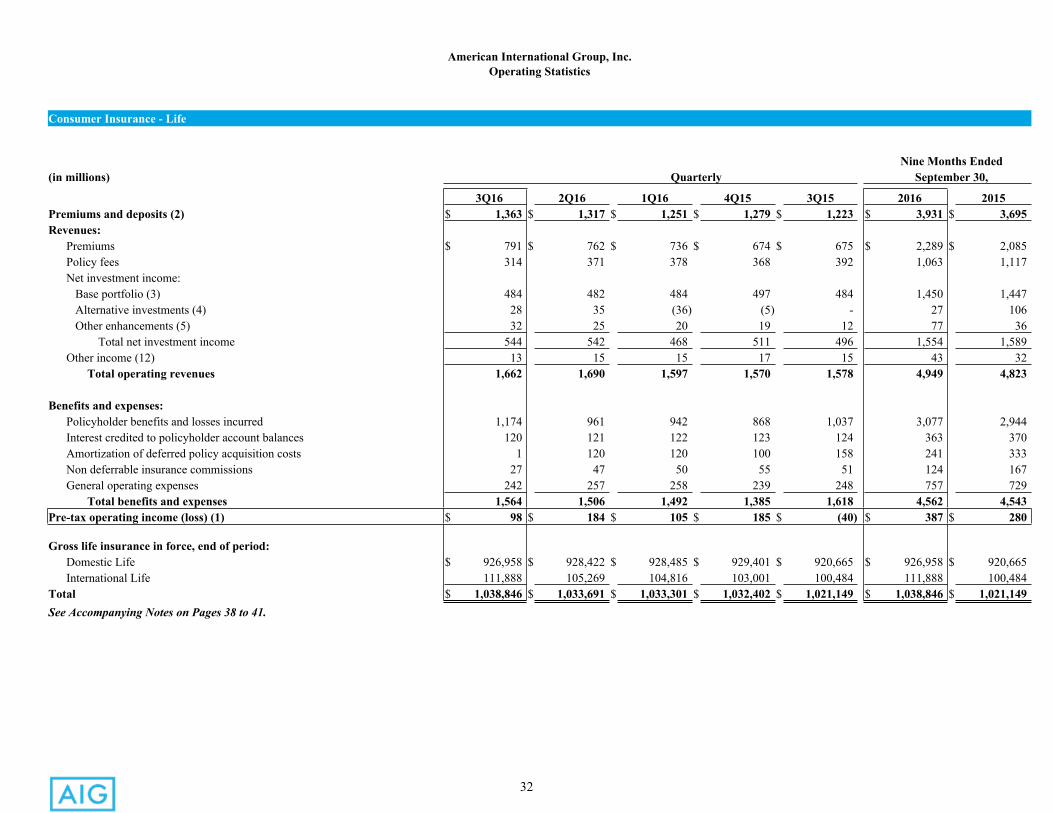
32
American International Group, Inc.Operating Statistics
Consumer Insurance - Life
Nine Months Ended(in millions) Quarterly September 30,
3Q16 2Q16 1Q16 4Q15 3Q15 2016 2015 Premiums and deposits (2) $ 1,363 $ 1,317 $ 1,251 $ 1,279 $ 1,223 $ 3,931 $ 3,695Revenues: Premiums $ 791 $ 762 $ 736 $ 674 $ 675 $ 2,289 $ 2,085 Policy fees 314 371 378 368 392 1,063 1,117 Net investment income:
Base portfolio (3) 484 482 484 497 484 1,450 1,447Alternative investments (4) 28 35 (36) (5) - 27 106Other enhancements (5) 32 25 20 19 12 77 36
Total net investment income 544 542 468 511 496 1,554 1,589 Other income (12) 13 15 15 17 15 43 32
Total operating revenues 1,662 1,690 1,597 1,570 1,578 4,949 4,823
Benefits and expenses: Policyholder benefits and losses incurred 1,174 961 942 868 1,037 3,077 2,944 Interest credited to policyholder account balances 120 121 122 123 124 363 370 Amortization of deferred policy acquisition costs 1 120 120 100 158 241 333 Non deferrable insurance commissions 27 47 50 55 51 124 167 General operating expenses 242 257 258 239 248 757 729
Total benefits and expenses 1,564 1,506 1,492 1,385 1,618 4,562 4,543Pre-tax operating income (loss) (1) $ 98 $ 184 $ 105 $ 185 $ (40) $ 387 $ 280
Gross life insurance in force, end of period: Domestic Life $ 926,958 $ 928,422 $ 928,485 $ 929,401 $ 920,665 $ 926,958 $ 920,665 International Life 111,888 105,269 104,816 103,001 100,484 111,888 100,484Total $ 1,038,846 $ 1,033,691 $ 1,033,301 $ 1,032,402 $ 1,021,149 $ 1,038,846 $ 1,021,149See Accompanying Notes on Pages 38 to 41.
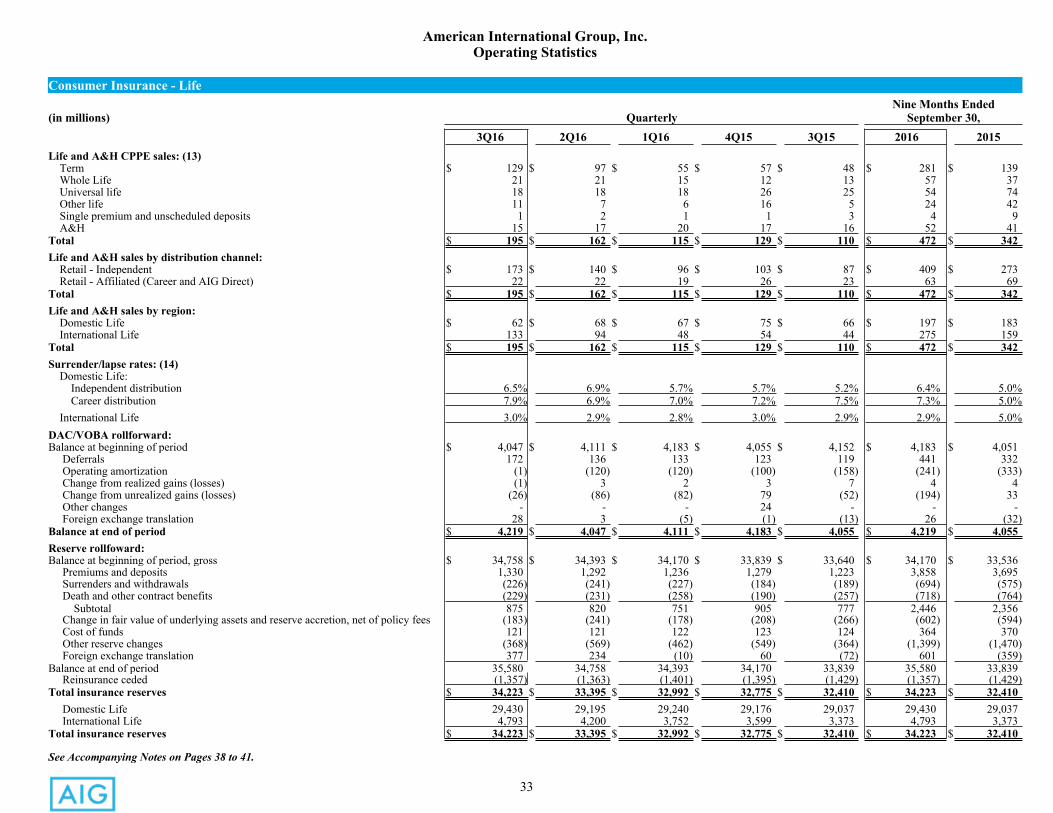
33
American International Group, Inc.Operating Statistics
Consumer Insurance - LifeNine Months Ended
(in millions) Quarterly September 30,3Q16 2Q16 1Q16 4Q15 3Q15 2016 2015
Life and A&H CPPE sales: (13) Term $ 129 $ 97 $ 55 $ 57 $ 48 $ 281 $ 139 Whole Life 21 21 15 12 13 57 37 Universal life 18 18 18 26 25 54 74 Other life 11 7 6 16 5 24 42 Single premium and unscheduled deposits 1 2 1 1 3 4 9 A&H 15 17 20 17 16 52 41Total $ 195 $ 162 $ 115 $ 129 $ 110 $ 472 $ 342Life and A&H sales by distribution channel: Retail - Independent $ 173 $ 140 $ 96 $ 103 $ 87 $ 409 $ 273 Retail - Affiliated (Career and AIG Direct) 22 22 19 26 23 63 69Total $ 195 $ 162 $ 115 $ 129 $ 110 $ 472 $ 342Life and A&H sales by region: Domestic Life $ 62 $ 68 $ 67 $ 75 $ 66 $ 197 $ 183 International Life 133 94 48 54 44 275 159Total $ 195 $ 162 $ 115 $ 129 $ 110 $ 472 $ 342Surrender/lapse rates: (14) Domestic Life: Independent distribution 6.5% 6.9% 5.7% 5.7% 5.2% 6.4% 5.0% Career distribution 7.9% 6.9% 7.0% 7.2% 7.5% 7.3% 5.0% International Life 3.0% 2.9% 2.8% 3.0% 2.9% 2.9% 5.0%DAC/VOBA rollforward:Balance at beginning of period $ 4,047 $ 4,111 $ 4,183 $ 4,055 $ 4,152 $ 4,183 $ 4,051 Deferrals 172 136 133 123 119 441 332 Operating amortization (1) (120) (120) (100) (158) (241) (333) Change from realized gains (losses) (1) 3 2 3 7 4 4 Change from unrealized gains (losses) (26) (86) (82) 79 (52) (194) 33 Other changes - - - 24 - - - Foreign exchange translation 28 3 (5) (1) (13) 26 (32)Balance at end of period $ 4,219 $ 4,047 $ 4,111 $ 4,183 $ 4,055 $ 4,219 $ 4,055Reserve rollfoward:Balance at beginning of period, gross $ 34,758 $ 34,393 $ 34,170 $ 33,839 $ 33,640 $ 34,170 $ 33,536 Premiums and deposits 1,330 1,292 1,236 1,279 1,223 3,858 3,695 Surrenders and withdrawals (226) (241) (227) (184) (189) (694) (575) Death and other contract benefits (229) (231) (258) (190) (257) (718) (764) Subtotal 875 820 751 905 777 2,446 2,356 Change in fair value of underlying assets and reserve accretion, net of policy fees (183) (241) (178) (208) (266) (602) (594) Cost of funds 121 121 122 123 124 364 370 Other reserve changes (368) (569) (462) (549) (364) (1,399) (1,470) Foreign exchange translation 377 234 (10) 60 (72) 601 (359)Balance at end of period 35,580 34,758 34,393 34,170 33,839 35,580 33,839 Reinsurance ceded (1,357) (1,363) (1,401) (1,395) (1,429) (1,357) (1,429)Total insurance reserves $ 34,223 $ 33,395 $ 32,992 $ 32,775 $ 32,410 $ 34,223 $ 32,410
- Domestic Life 29,430 29,195 29,240 29,176 29,037 29,430 29,037 International Life 4,793 4,200 3,752 3,599 3,373 4,793 3,373Total insurance reserves $ 34,223 $ 33,395 $ 32,992 $ 32,775 $ 32,410 $ 34,223 $ 32,410
See Accompanying Notes on Pages 38 to 41.
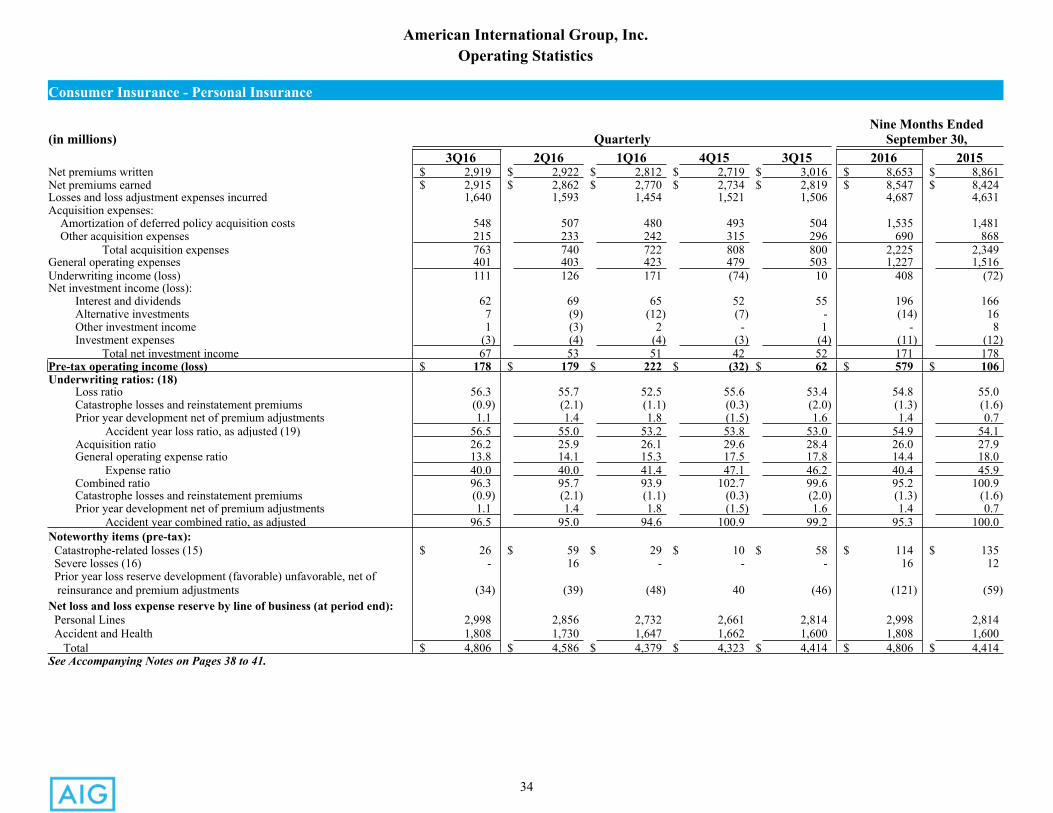
34
American International Group, Inc.Operating Statistics
Consumer Insurance - Personal Insurance
Nine Months Ended(in millions) Quarterly September 30,
3Q16 2Q16 1Q16 4Q15 3Q15 2016 2015 Net premiums written $ 2,919 $ 2,922 $ 2,812 $ 2,719 $ 3,016 $ 8,653 $ 8,861Net premiums earned $ 2,915 $ 2,862 $ 2,770 $ 2,734 $ 2,819 $ 8,547 $ 8,424Losses and loss adjustment expenses incurred 1,640 1,593 1,454 1,521 1,506 4,687 4,631Acquisition expenses: Amortization of deferred policy acquisition costs 548 507 480 493 504 1,535 1,481 Other acquisition expenses 215 233 242 315 296 690 868
Total acquisition expenses 763 740 722 808 800 2,225 2,349General operating expenses 401 403 423 479 503 1,227 1,516Underwriting income (loss) 111 126 171 (74) 10 408 (72)Net investment income (loss):
Interest and dividends 62 69 65 52 55 196 166Alternative investments 7 (9) (12) (7) - (14) 16Other investment income 1 (3) 2 - 1 - 8Investment expenses (3) (4) (4) (3) (4) (11) (12)
Total net investment income 67 53 51 42 52 171 178Pre-tax operating income (loss) $ 178 $ 179 $ 222 $ (32) $ 62 $ 579 $ 106Underwriting ratios: (18)
Loss ratio 56.3 55.7 52.5 55.6 53.4 54.8 55.0Catastrophe losses and reinstatement premiums (0.9) (2.1) (1.1) (0.3) (2.0) (1.3) (1.6)Prior year development net of premium adjustments 1.1 1.4 1.8 (1.5) 1.6 1.4 0.7 Accident year loss ratio, as adjusted (19) 56.5 55.0 53.2 53.8 53.0 54.9 54.1Acquisition ratio 26.2 25.9 26.1 29.6 28.4 26.0 27.9General operating expense ratio 13.8 14.1 15.3 17.5 17.8 14.4 18.0 Expense ratio 40.0 40.0 41.4 47.1 46.2 40.4 45.9Combined ratio 96.3 95.7 93.9 102.7 99.6 95.2 100.9Catastrophe losses and reinstatement premiums (0.9) (2.1) (1.1) (0.3) (2.0) (1.3) (1.6)Prior year development net of premium adjustments 1.1 1.4 1.8 (1.5) 1.6 1.4 0.7 Accident year combined ratio, as adjusted 96.5 95.0 94.6 100.9 99.2 95.3 100.0
Noteworthy items (pre-tax): Catastrophe-related losses (15) $ 26 $ 59 $ 29 $ 10 $ 58 $ 114 $ 135 Severe losses (16) - 16 - - - 16 12 Prior year loss reserve development (favorable) unfavorable, net of reinsurance and premium adjustments (34) (39) (48) 40 (46) (121) (59)Net loss and loss expense reserve by line of business (at period end): Personal Lines 2,998 2,856 2,732 2,661 2,814 2,998 2,814 Accident and Health 1,808 1,730 1,647 1,662 1,600 1,808 1,600
Total $ 4,806 $ 4,586 $ 4,379 $ 4,323 $ 4,414 $ 4,806 $ 4,414See Accompanying Notes on Pages 38 to 41.
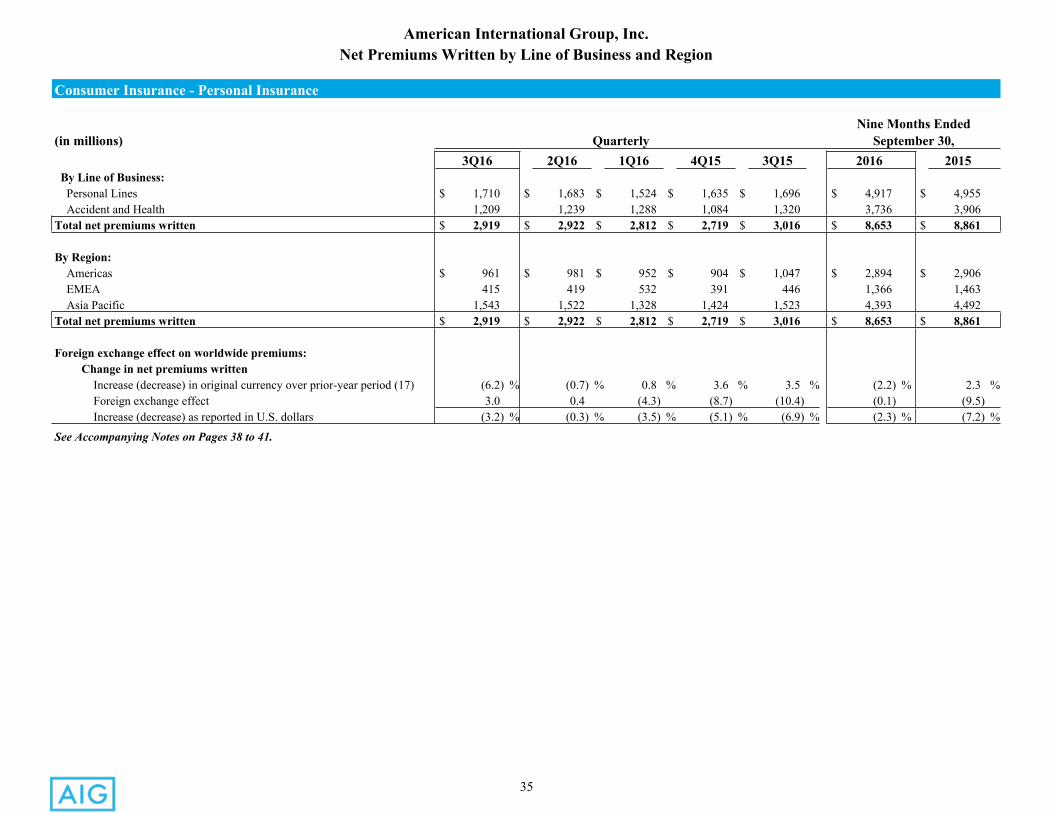
35
American International Group, Inc.Net Premiums Written by Line of Business and Region
Consumer Insurance - Personal Insurance
Nine Months Ended(in millions) Quarterly September 30,
3Q16 2Q16 1Q16 4Q15 3Q15 2016 2015 By Line of Business: Personal Lines $ 1,710 $ 1,683 $ 1,524 $ 1,635 $ 1,696 $ 4,917 $ 4,955 Accident and Health 1,209 1,239 1,288 1,084 1,320 3,736 3,906Total net premiums written $ 2,919 $ 2,922 $ 2,812 $ 2,719 $ 3,016 $ 8,653 $ 8,861
By Region: Americas $ 961 $ 981 $ 952 $ 904 $ 1,047 $ 2,894 $ 2,906 EMEA 415 419 532 391 446 1,366 1,463 Asia Pacific 1,543 1,522 1,328 1,424 1,523 4,393 4,492Total net premiums written $ 2,919 $ 2,922 $ 2,812 $ 2,719 $ 3,016 $ 8,653 $ 8,861
Foreign exchange effect on worldwide premiums:Change in net premiums written Increase (decrease) in original currency over prior-year period (17) (6.2) % (0.7) % 0.8 % 3.6 % 3.5 % (2.2) % 2.3 % Foreign exchange effect 3.0 0.4 (4.3) (8.7) (10.4) (0.1) (9.5) Increase (decrease) as reported in U.S. dollars (3.2) % (0.3) % (3.5) % (5.1) % (6.9) % (2.3) % (7.2) %
See Accompanying Notes on Pages 38 to 41.
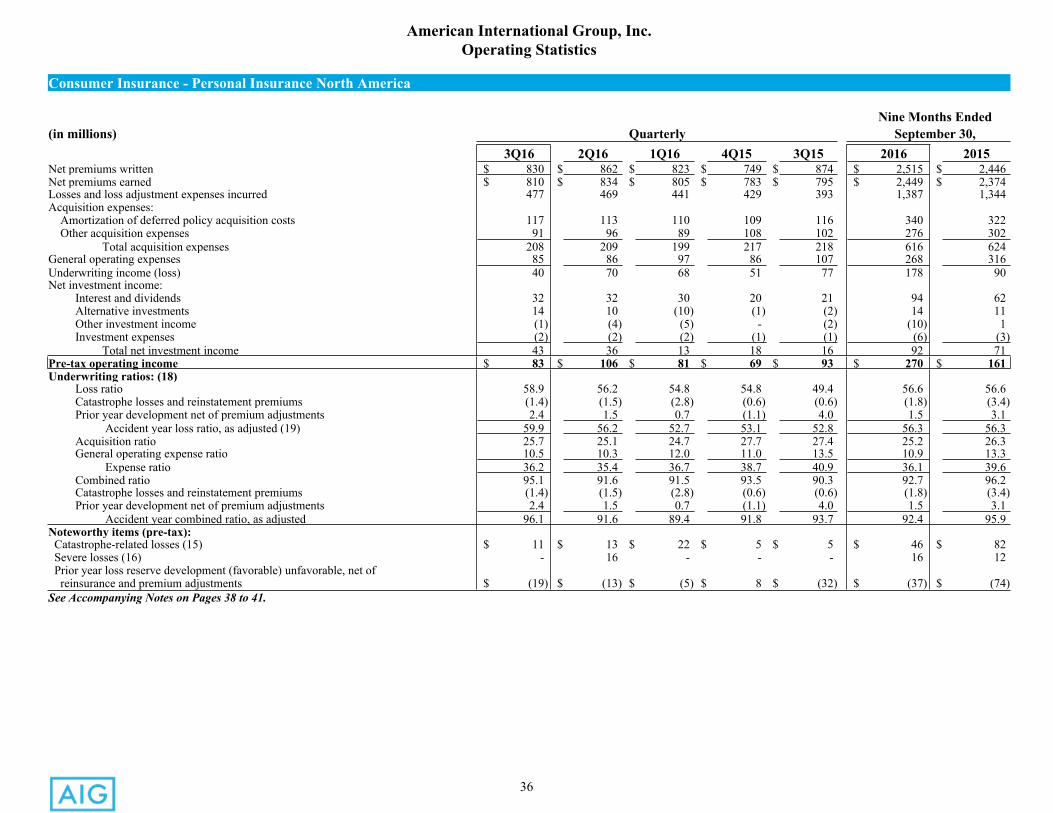
36
American International Group, Inc.Operating Statistics
Consumer Insurance - Personal Insurance North America
Nine Months Ended(in millions) Quarterly September 30,
3Q16 2Q16 1Q16 4Q15 3Q15 2016 2015 Net premiums written $ 830 $ 862 $ 823 $ 749 $ 874 $ 2,515 $ 2,446Net premiums earned $ 810 $ 834 $ 805 $ 783 $ 795 $ 2,449 $ 2,374Losses and loss adjustment expenses incurred 477 469 441 429 393 1,387 1,344Acquisition expenses: Amortization of deferred policy acquisition costs 117 113 110 109 116 340 322 Other acquisition expenses 91 96 89 108 102 276 302
Total acquisition expenses 208 209 199 217 218 616 624General operating expenses 85 86 97 86 107 268 316Underwriting income (loss) 40 70 68 51 77 178 90Net investment income:
Interest and dividends 32 32 30 20 21 94 62Alternative investments 14 10 (10) (1) (2) 14 11Other investment income (1) (4) (5) - (2) (10) 1Investment expenses (2) (2) (2) (1) (1) (6) (3)
Total net investment income 43 36 13 18 16 92 71Pre-tax operating income $ 83 $ 106 $ 81 $ 69 $ 93 $ 270 $ 161Underwriting ratios: (18)
Loss ratio 58.9 56.2 54.8 54.8 49.4 56.6 56.6Catastrophe losses and reinstatement premiums (1.4) (1.5) (2.8) (0.6) (0.6) (1.8) (3.4)Prior year development net of premium adjustments 2.4 1.5 0.7 (1.1) 4.0 1.5 3.1 Accident year loss ratio, as adjusted (19) 59.9 56.2 52.7 53.1 52.8 56.3 56.3Acquisition ratio 25.7 25.1 24.7 27.7 27.4 25.2 26.3General operating expense ratio 10.5 10.3 12.0 11.0 13.5 10.9 13.3 Expense ratio 36.2 35.4 36.7 38.7 40.9 36.1 39.6Combined ratio 95.1 91.6 91.5 93.5 90.3 92.7 96.2Catastrophe losses and reinstatement premiums (1.4) (1.5) (2.8) (0.6) (0.6) (1.8) (3.4)Prior year development net of premium adjustments 2.4 1.5 0.7 (1.1) 4.0 1.5 3.1 Accident year combined ratio, as adjusted 96.1 91.6 89.4 91.8 93.7 92.4 95.9
Noteworthy items (pre-tax): Catastrophe-related losses (15) $ 11 $ 13 $ 22 $ 5 $ 5 $ 46 $ 82 Severe losses (16) - 16 - - - 16 12 Prior year loss reserve development (favorable) unfavorable, net of reinsurance and premium adjustments $ (19) $ (13) $ (5) $ 8 $ (32) $ (37) $ (74)See Accompanying Notes on Pages 38 to 41.
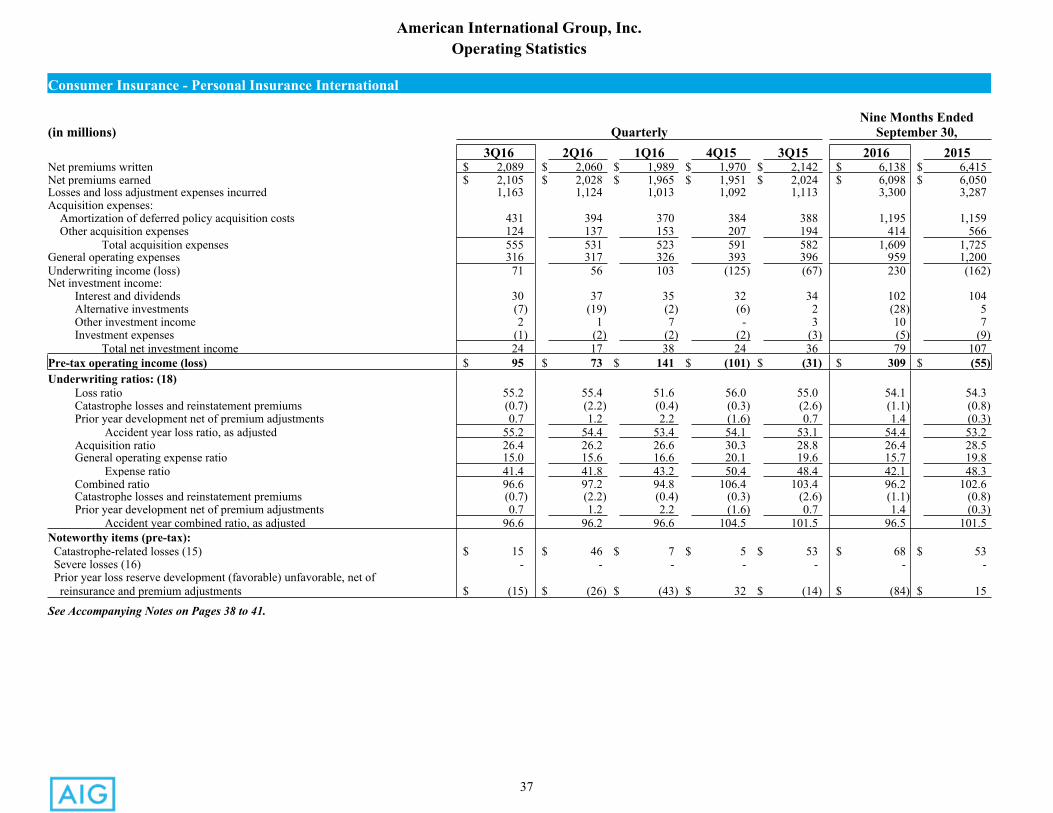
37
American International Group, Inc.Operating Statistics
Consumer Insurance - Personal Insurance International
Nine Months Ended(in millions) Quarterly September 30,
3Q16 2Q16 1Q16 4Q15 3Q15 2016 2015 Net premiums written $ 2,089 $ 2,060 $ 1,989 $ 1,970 $ 2,142 $ 6,138 $ 6,415Net premiums earned $ 2,105 $ 2,028 $ 1,965 $ 1,951 $ 2,024 $ 6,098 $ 6,050Losses and loss adjustment expenses incurred 1,163 1,124 1,013 1,092 1,113 3,300 3,287Acquisition expenses: Amortization of deferred policy acquisition costs 431 394 370 384 388 1,195 1,159 Other acquisition expenses 124 137 153 207 194 414 566
Total acquisition expenses 555 531 523 591 582 1,609 1,725General operating expenses 316 317 326 393 396 959 1,200Underwriting income (loss) 71 56 103 (125) (67) 230 (162)Net investment income:
Interest and dividends 30 37 35 32 34 102 104Alternative investments (7) (19) (2) (6) 2 (28) 5Other investment income 2 1 7 - 3 10 7Investment expenses (1) (2) (2) (2) (3) (5) (9)
Total net investment income 24 17 38 24 36 79 107Pre-tax operating income (loss) $ 95 $ 73 $ 141 $ (101) $ (31) $ 309 $ (55)Underwriting ratios: (18)
Loss ratio 55.2 55.4 51.6 56.0 55.0 54.1 54.3Catastrophe losses and reinstatement premiums (0.7) (2.2) (0.4) (0.3) (2.6) (1.1) (0.8)Prior year development net of premium adjustments 0.7 1.2 2.2 (1.6) 0.7 1.4 (0.3) Accident year loss ratio, as adjusted 55.2 54.4 53.4 54.1 53.1 54.4 53.2Acquisition ratio 26.4 26.2 26.6 30.3 28.8 26.4 28.5General operating expense ratio 15.0 15.6 16.6 20.1 19.6 15.7 19.8 Expense ratio 41.4 41.8 43.2 50.4 48.4 42.1 48.3Combined ratio 96.6 97.2 94.8 106.4 103.4 96.2 102.6Catastrophe losses and reinstatement premiums (0.7) (2.2) (0.4) (0.3) (2.6) (1.1) (0.8)Prior year development net of premium adjustments 0.7 1.2 2.2 (1.6) 0.7 1.4 (0.3) Accident year combined ratio, as adjusted 96.6 96.2 96.6 104.5 101.5 96.5 101.5
Noteworthy items (pre-tax): Catastrophe-related losses (15) $ 15 $ 46 $ 7 $ 5 $ 53 $ 68 $ 53 Severe losses (16) - - - - - - - Prior year loss reserve development (favorable) unfavorable, net of reinsurance and premium adjustments $ (15) $ (26) $ (43) $ 32 $ (14) $ (84) $ 15
See Accompanying Notes on Pages 38 to 41.
38
American International Group, Inc.Notes
Consumer Insurance
Basis of Presentation:
Consumer Insurance presents its results in the following operating segments:
Retirement: product lines include Fixed Annuities, with products including deferred fixed annuities and immediate annuities; Retirement Income Solutions, with products including variable and index annuities; Group Retirement, with products including retirement plans, annuity and investment products for employees of education, healthcare and other sponsoring companies; and Retail Mutual Funds. Periods through 2Q16 also included results for AIG Advisor Group, our network of independent broker-dealers, which was sold in May 2016.
Life: includes the following product lines: Traditional Life, Universal Life, International Life, Accident & Health (A&H), Endowments and Group Benefits of the Life Insurance Companies.
Personal Insurance: Personal Insurance - North America and Personal Insurance - International include the following product lines: Automobile, Property, Warranty Service Programs, and A&H and Group Benefits of the Non-Life Insurance Companies.
Selected operating statistics are provided for the Fixed Annuities, Retirement Income Solutions, and Group Retirement product lines in the Retirement operating segment, as well as the Personal Insurance - North America and Personal Insurance - International in the Personal Insurance operating segment. Operating statistics are not separately presented for Advisory Services and Retail Mutual Funds, which are included in the Retirement operating segment.
Consumer Insurance operations are conducted through the Life Insurance Companies as well as the Non-Life Insurance Companies.
Consumer Insurance operates in three major geographic areas: the Americas (which includes the United States, Canada, Latin America, the Caribbean and Bermuda), Asia Pacific (which includes Japan, China, Korea, Singapore, Vietnam, Thailand, Australia, Indonesia and other Asia Pacific nations), and EMEA (which includes the United Kingdom, Ireland, Continental Europe, the Russian Federation, India, the Middle East and Africa).
Consumer Insurance products are distributed primarily to individual consumers or groups of consumers through a diverse, multi-channel distribution network that includes broker-dealers, agencies and independent marketing organizations, banks, brokers, partnerships, travel agents, affiliated financial advisors, and direct-to-consumer platforms.
Net investment income is attributed to the operating segments of Commercial Insurance and Consumer Insurance based on internal models consistent with the nature of the underlying businesses.
For Consumer Insurance - Personal Insurance, we estimate investable funds based primarily on loss reserves and unearned premiums. The net investment income allocation is calculated based on these estimated investable funds consistent with the approximate duration of the liabilities and a capital allocation for each operating segment.
For Consumer Insurance - Retirement and Consumer Insurance - Life, net investment income is attributed based on invested assets from segregated product line portfolios held in our Life Insurance Companies. The fundamental investment strategy for these product line portfolios is to maintain primarily a diversified, high quality portfolio of fixed maturity securities and, to the extent practicable, to approximately match established duration targets based on characteristics of the underlying liabilities. All invested assets of the Life Insurance Companies in excess of liabilities are allocated based on internal estimates of target statutory capital for each product line.
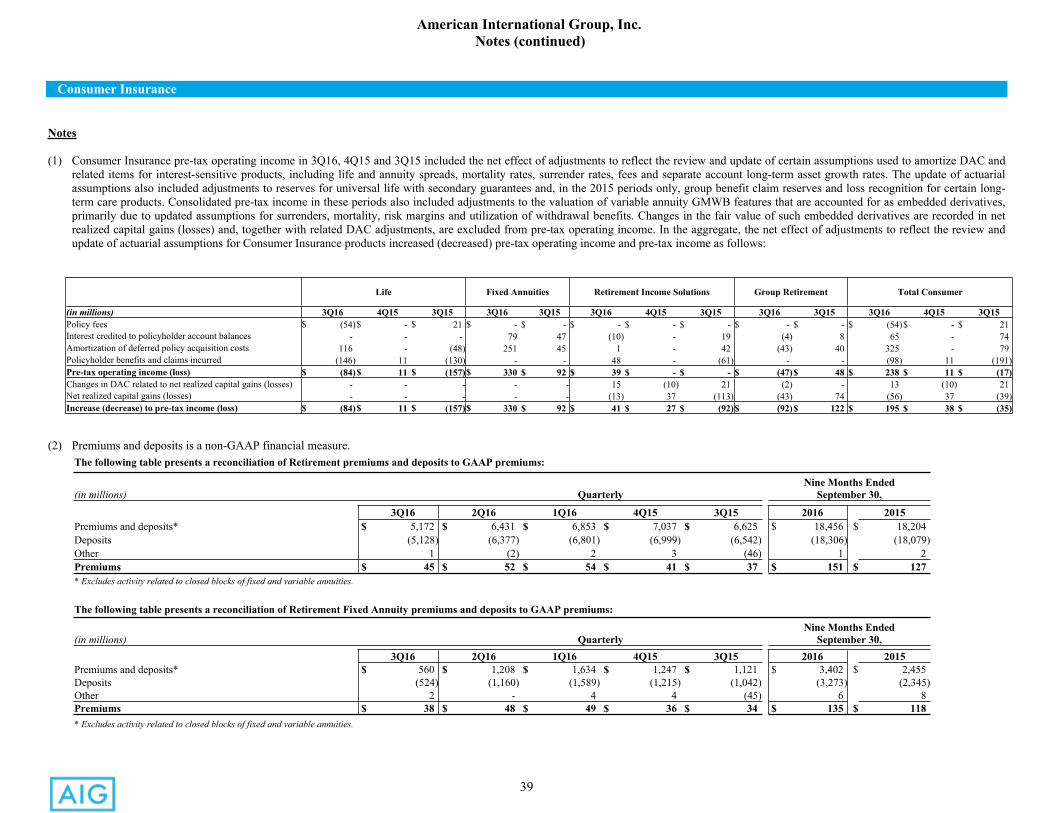
39
American International Group, Inc. Notes (continued)
Consumer Insurance
Notes
(1) Consumer Insurance pre-tax operating income in 3Q16, 4Q15 and 3Q15 included the net effect of adjustments to reflect the review and update of certain assumptions used to amortize DAC and related items for interest-sensitive products, including life and annuity spreads, mortality rates, surrender rates, fees and separate account long-term asset growth rates. The update of actuarial assumptions also included adjustments to reserves for universal life with secondary guarantees and, in the 2015 periods only, group benefit claim reserves and loss recognition for certain long-term care products. Consolidated pre-tax income in these periods also included adjustments to the valuation of variable annuity GMWB features that are accounted for as embedded derivatives, primarily due to updated assumptions for surrenders, mortality, risk margins and utilization of withdrawal benefits. Changes in the fair value of such embedded derivatives are recorded in net realized capital gains (losses) and, together with related DAC adjustments, are excluded from pre-tax operating income. In the aggregate, the net effect of adjustments to reflect the review and update of actuarial assumptions for Consumer Insurance products increased (decreased) pre-tax operating income and pre-tax income as follows:
Life Fixed Annuities Retirement Income Solutions Group Retirement Total Consumer
(in millions) 3Q16 4Q15 3Q15 3Q16 3Q15 3Q16 4Q15 3Q15 3Q16 3Q15 3Q16 4Q15 3Q15Policy fees $ (54)$ - $ 21 $ - $ - $ - $ - $ - $ - $ - $ (54)$ - $ 21Interest credited to policyholder account balances - - - 79 47 (10) - 19 (4) 8 65 - 74Amortization of deferred policy acquisition costs 116 - (48) 251 45 1 - 42 (43) 40 325 - 79Policyholder benefits and claims incurred (146) 11 (130) - - 48 - (61) - - (98) 11 (191)Pre-tax operating income (loss) $ (84)$ 11 $ (157)$ 330 $ 92 $ 39 $ - $ - $ (47)$ 48 $ 238 $ 11 $ (17)Changes in DAC related to net realized capital gains (losses) - - - - - 15 (10) 21 (2) - 13 (10) 21Net realized capital gains (losses) - - - - - (13) 37 (113) (43) 74 (56) 37 (39)Increase (decrease) to pre-tax income (loss) $ (84)$ 11 $ (157)$ 330 $ 92 $ 41 $ 27 $ (92)$ (92)$ 122 $ 195 $ 38 $ (35)
(2) Premiums and deposits is a non-GAAP financial measure. The following table presents a reconciliation of Retirement premiums and deposits to GAAP premiums:
(in millions) QuarterlyNine Months Ended
September 30,
3Q16 2Q16 1Q16 4Q15 3Q15 2016 2015Premiums and deposits* $ 5,172 $ 6,431 $ 6,853 $ 7,037 $ 6,625 $ 18,456 $ 18,204Deposits (5,128) (6,377) (6,801) (6,999) (6,542) (18,306) (18,079)Other 1 (2) 2 3 (46) 1 2Premiums $ 45 $ 52 $ 54 $ 41 $ 37 $ 151 $ 127* Excludes activity related to closed blocks of fixed and variable annuities.
The following table presents a reconciliation of Retirement Fixed Annuity premiums and deposits to GAAP premiums:
(in millions) QuarterlyNine Months Ended
September 30,3Q16 2Q16 1Q16 4Q15 3Q15 2016 2015
Premiums and deposits* $ 560 $ 1,208 $ 1,634 $ 1,247 $ 1,121 $ 3,402 $ 2,455Deposits (524) (1,160) (1,589) (1,215) (1,042) (3,273) (2,345)Other 2 - 4 4 (45) 6 8Premiums $ 38 $ 48 $ 49 $ 36 $ 34 $ 135 $ 118* Excludes activity related to closed blocks of fixed and variable annuities.
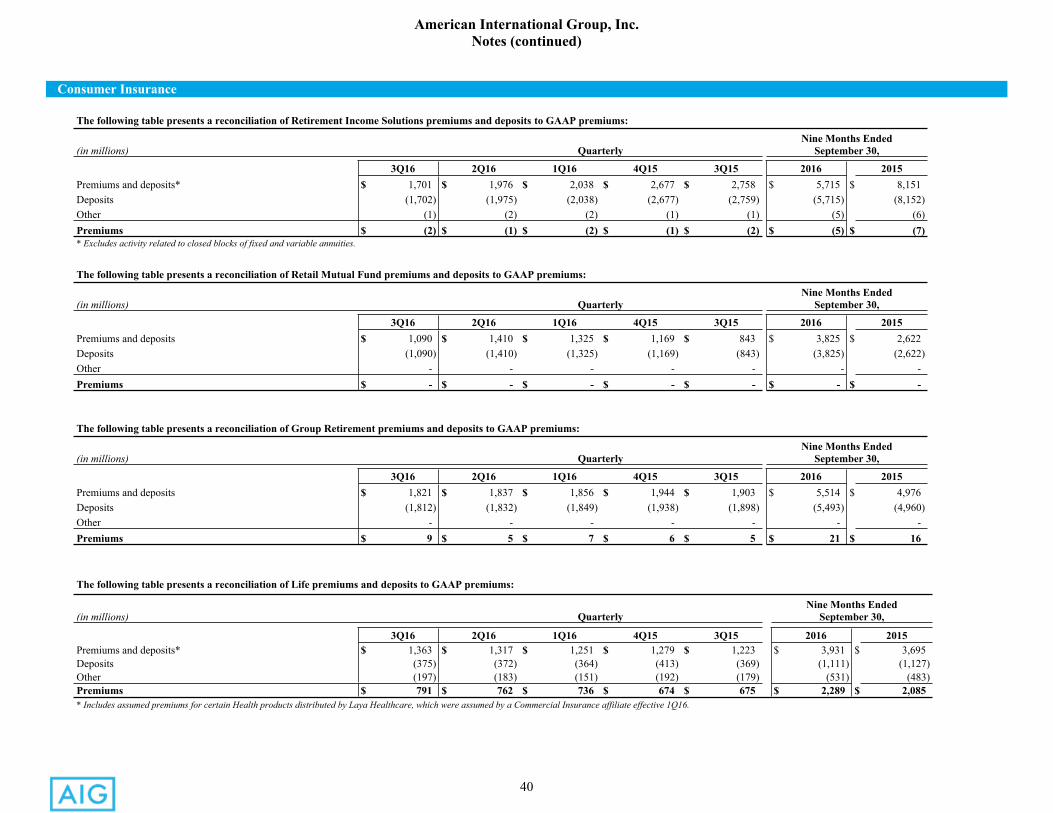
40
American International Group, Inc.Notes (continued)
Consumer Insurance
The following table presents a reconciliation of Retirement Income Solutions premiums and deposits to GAAP premiums:
(in millions) QuarterlyNine Months Ended
September 30,
3Q16 2Q16 1Q16 4Q15 3Q15 2016 2015Premiums and deposits* $ 1,701 $ 1,976 $ 2,038 $ 2,677 $ 2,758 $ 5,715 $ 8,151Deposits (1,702) (1,975) (2,038) (2,677) (2,759) (5,715) (8,152)Other (1) (2) (2) (1) (1) (5) (6)Premiums $ (2) $ (1) $ (2) $ (1) $ (2) $ (5) $ (7)* Excludes activity related to closed blocks of fixed and variable annuities.
The following table presents a reconciliation of Retail Mutual Fund premiums and deposits to GAAP premiums:
(in millions) QuarterlyNine Months Ended
September 30,
3Q16 2Q16 1Q16 4Q15 3Q15 2016 2015Premiums and deposits $ 1,090 $ 1,410 $ 1,325 $ 1,169 $ 843 $ 3,825 $ 2,622Deposits (1,090) (1,410) (1,325) (1,169) (843) (3,825) (2,622)Other - - - - - - -Premiums $ - $ - $ - $ - $ - $ - $ -
The following table presents a reconciliation of Group Retirement premiums and deposits to GAAP premiums:
(in millions) QuarterlyNine Months Ended
September 30,
3Q16 2Q16 1Q16 4Q15 3Q15 2016 2015Premiums and deposits $ 1,821 $ 1,837 $ 1,856 $ 1,944 $ 1,903 $ 5,514 $ 4,976Deposits (1,812) (1,832) (1,849) (1,938) (1,898) (5,493) (4,960)Other - - - - - - -Premiums $ 9 $ 5 $ 7 $ 6 $ 5 $ 21 $ 16
The following table presents a reconciliation of Life premiums and deposits to GAAP premiums:
(in millions) QuarterlyNine Months Ended
September 30,
3Q16 2Q16 1Q16 4Q15 3Q15 2016 2015Premiums and deposits* $ 1,363 $ 1,317 $ 1,251 $ 1,279 $ 1,223 $ 3,931 $ 3,695Deposits (375) (372) (364) (413) (369) (1,111) (1,127)Other (197) (183) (151) (192) (179) (531) (483)Premiums $ 791 $ 762 $ 736 $ 674 $ 675 $ 2,289 $ 2,085* Includes assumed premiums for certain Health products distributed by Laya Healthcare, which were assumed by a Commercial Insurance affiliate effective 1Q16.
41
American International Group, Inc.Notes (continued)
Consumer Insurance(3) Base portfolio investment income includes interest, dividends and foreclosed real estate income, net of investment expenses.(4) Alternative investment income includes income on hedge funds, private equity funds and affordable housing partnerships. Hedge funds for which we elected the fair value option are recorded as
of the balance sheet date. Other hedge funds are generally reported on a one-month lag, while private equity funds are generally reported on a one-quarter lag.(5) Net investment income - other enhancements include call and tender income, changes in market value of investments accounted for under the fair value option, interest received on defaulted
investments (other than foreclosed real estate) and other miscellaneous investment income, including income of certain partnership entities that are required to be consolidated.(6) Net flows are provided for Fixed Annuities, Retirement Income Solutions, Retail Mutual Funds and Group Retirement. Annuity net flows represent premiums and deposits less death, surrender
and other withdrawal benefits. Net flows related to mutual funds represent deposits less withdrawals. Life Insurance, Advisory Services, Group Benefits and Personal Insurance are not included in net flows. Net flows exclude activity related to closed blocks of fixed and variable annuities.
(7) Includes return on base portfolio. Quarterly results are annualized.(8) Includes incremental effect on base yield of alternative investments. Quarterly results are annualized.(9) Includes incremental effect on base yield of other enhancements. Quarterly results are annualized.(10) Annuity surrender rates represent actual or annualized surrenders and withdrawals as a percentage of average account value.(11) Consumer Insurance uses reinsurance, product design and hedging to mitigate risks related to guaranteed benefits in individual annuity contracts. Certain GMDB benefits written before 2004 and
the majority of GMIB benefits (which are not currently offered) are reinsured. Risk mitigation product design features for GMWB include rider fees indexed to an equity market volatility index, required minimum allocations to fixed accounts, and the use of volatility control funds. After reflecting product risk-mitigating features, we hedge our remaining economic exposure to market risk within GMWB and GMAB liabilities (GMAB is not currently offered) through our variable annuity hedging program, which is designed to provide additional protection against large and combined movements in interest rates, equity prices, credit spreads and market volatility under multiple scenarios. See Enterprise Risk Management – Life Insurance Companies Key Insurance Risks – Variable Annuity Risk Management and Hedging Program in our Annual Report on Form 10-K for the year ended December 31, 2015 for an additional discussion.
(12) Life - Other income is primarily related to Laya Healthcare commission and profit sharing revenues received from insurers for distribution of their products. We acquired Laya Healthcare on March 31, 2015.
(13) Life and A&H sales are shown on a continuous payment premium equivalent (CPPE) basis. Life insurance sales include periodic premiums from new business expected to be collected over a one-year period and 10 percent of unscheduled and single premiums from new and existing policyholders. Sales of A&H insurance represent annualized first-year premium from new policies.
(14) Life insurance lapse rates are reported on a 90-day lag basis to include grace period processing. International lapse rates represent Fuji Life (Japan).(15) Natural catastrophe losses (CATs) are generally weather or seismic events having a net impact on AIG in excess of $10 million each. Catastrophes also include certain man-made events, such as
terrorism and civil disorders that meet the $10 million threshold. (16) Severe losses are defined as non-catastrophic individual first party losses greater than $10 million, net of related reinsurance and salvage and subrogation. (17) Computed using a constant exchange rate for each period.(18) Underwriting ratios are computed as follows:
a) Loss ratio = Losses and loss adjustment expenses incurred ÷ Net premiums earned (NPE)b) CATs and reinstatement premiums = [Loss and loss adjustment expenses incurred – (CATs)] ÷ [NPE + Reinstatement premiums (RIPs) related to catastrophes] – Loss ratioc) Prior year development net of premium adjustments = [Loss and loss adjustment expenses incurred – Prior year loss reserve development (favorable) unfavorable (PYD), net of reinsurance]
÷ [NPE + RIPs related to prior year catastrophes + (Additional) returned premium related to prior year development] – Loss ratiod) Net reserve discount = -1*[Net reserve discount (benefit) charge ÷ NPE] (Note: any rounding will go into this line since Accident year loss ratio, as adjusted is calculated independently.)e) Accident year loss ratio, as adjusted (AYLR) = [Loss and loss adjustment expenses incurred – CATs – PYD – Net reserve discount (benefit) charge] ÷ [NPE + RIPs related to catastrophes +
RIPs related to prior year catastrophes + (Additional) returned premium related to PYD]f) Acquisition ratio = Total acquisition expenses ÷ NPEg) General operating expense ratio = General operating expenses ÷ NPEh) Expense ratio = Acquisition ratio + General operating expenses ratioi) Combined ratio = Loss ratio + Expense ratioj) Accident year combined ratio = AYLR + Expense ratio
(19) The 2Q16 accident year loss ratio, as adjusted, includes a single large loss event which totaled $33 million, of which $16 million was related to first party losses (meeting the definition of severe losses) and $17 million was related to third party losses, impacting the personal property business in the U.S.
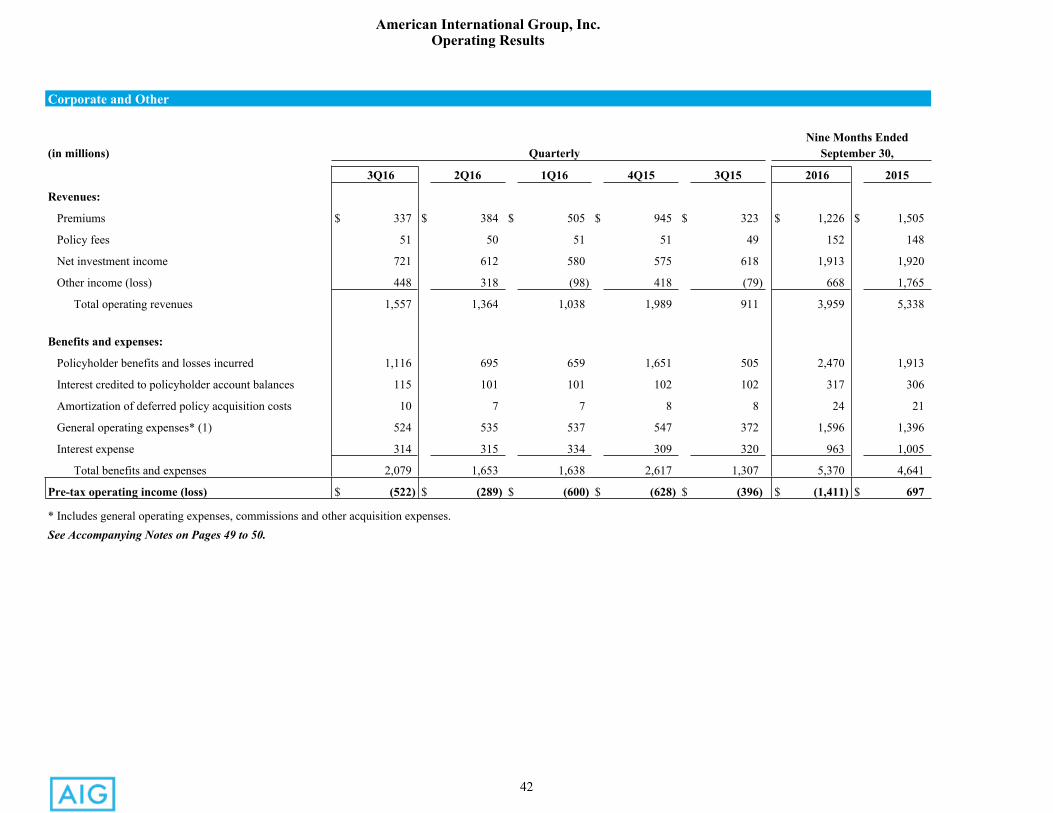
42
American International Group, Inc.Operating Results
Corporate and Other
Nine Months Ended(in millions) Quarterly September 30,
3Q16 2Q16 1Q16 4Q15 3Q15 2016 2015
Revenues:
Premiums $ 337 $ 384 $ 505 $ 945 $ 323 $ 1,226 $ 1,505
Policy fees 51 50 51 51 49 152 148
Net investment income 721 612 580 575 618 1,913 1,920
Other income (loss) 448 318 (98) 418 (79) 668 1,765
Total operating revenues 1,557 1,364 1,038 1,989 911 3,959 5,338
Benefits and expenses:
Policyholder benefits and losses incurred 1,116 695 659 1,651 505 2,470 1,913
Interest credited to policyholder account balances 115 101 101 102 102 317 306
Amortization of deferred policy acquisition costs 10 7 7 8 8 24 21
General operating expenses* (1) 524 535 537 547 372 1,596 1,396
Interest expense 314 315 334 309 320 963 1,005
Total benefits and expenses 2,079 1,653 1,638 2,617 1,307 5,370 4,641
Pre-tax operating income (loss) $ (522) $ (289) $ (600) $ (628) $ (396) $ (1,411) $ 697
* Includes general operating expenses, commissions and other acquisition expenses.See Accompanying Notes on Pages 49 to 50.
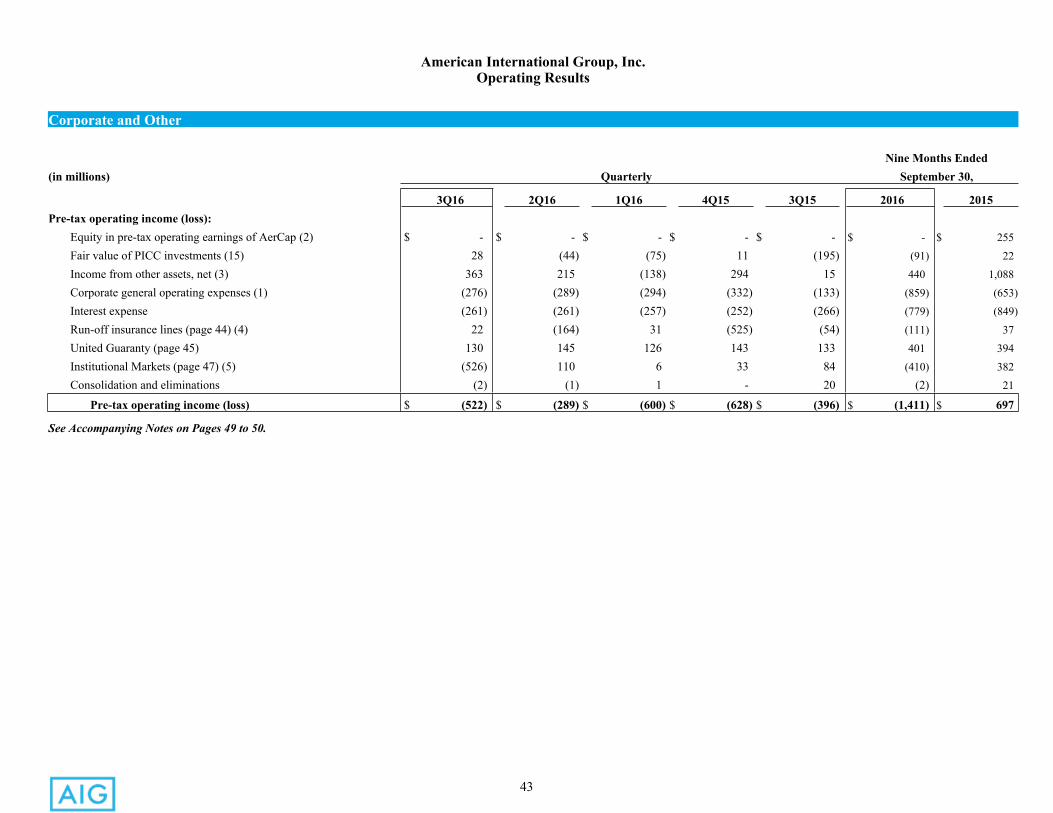
43
American International Group, Inc.Operating Results
Corporate and Other
Nine Months Ended(in millions) Quarterly September 30,
3Q16 2Q16 1Q16 4Q15 3Q15 2016 2015Pre-tax operating income (loss):
Equity in pre-tax operating earnings of AerCap (2) $ - $ - $ - $ - $ - $ - $ 255Fair value of PICC investments (15) 28 (44) (75) 11 (195) (91) 22Income from other assets, net (3) 363 215 (138) 294 15 440 1,088Corporate general operating expenses (1) (276) (289) (294) (332) (133) (859) (653)Interest expense (261) (261) (257) (252) (266) (779) (849)Run-off insurance lines (page 44) (4) 22 (164) 31 (525) (54) (111) 37United Guaranty (page 45) 130 145 126 143 133 401 394Institutional Markets (page 47) (5) (526) 110 6 33 84 (410) 382Consolidation and eliminations (2) (1) 1 - 20 (2) 21
Pre-tax operating income (loss) $ (522) $ (289) $ (600) $ (628) $ (396) $ (1,411) $ 697
See Accompanying Notes on Pages 49 to 50.
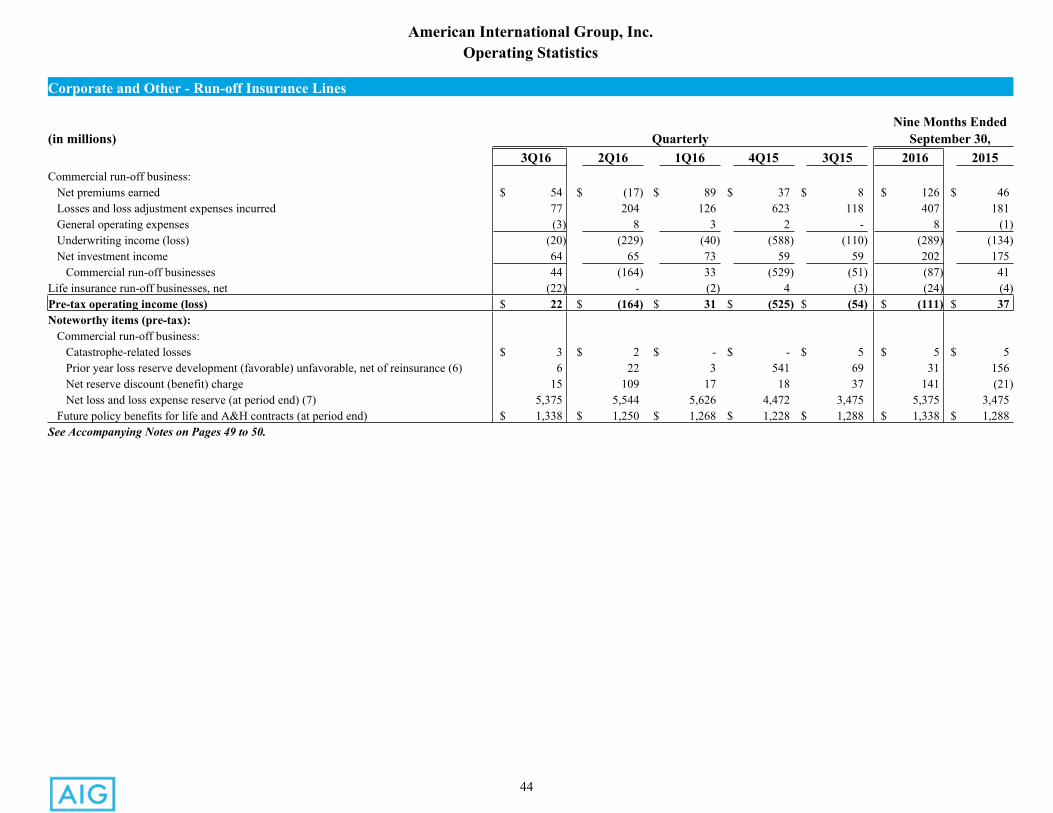
44
American International Group, Inc.Operating Statistics
Corporate and Other - Run-off Insurance Lines
Nine Months Ended(in millions) Quarterly September 30,
3Q16 2Q16 1Q16 4Q15 3Q15 2016 2015 Commercial run-off business: Net premiums earned $ 54 $ (17) $ 89 $ 37 $ 8 $ 126 $ 46 Losses and loss adjustment expenses incurred 77 204 126 623 118 407 181 General operating expenses (3) 8 3 2 - 8 (1) Underwriting income (loss) (20) (229) (40) (588) (110) (289) (134) Net investment income 64 65 73 59 59 202 175 Commercial run-off businesses 44 (164) 33 (529) (51) (87) 41Life insurance run-off businesses, net (22) - (2) 4 (3) (24) (4)Pre-tax operating income (loss) $ 22 $ (164) $ 31 $ (525) $ (54) $ (111) $ 37Noteworthy items (pre-tax): Commercial run-off business: Catastrophe-related losses $ 3 $ 2 $ - $ - $ 5 $ 5 $ 5 Prior year loss reserve development (favorable) unfavorable, net of reinsurance (6) 6 22 3 541 69 31 156 Net reserve discount (benefit) charge 15 109 17 18 37 141 (21) Net loss and loss expense reserve (at period end) (7) 5,375 5,544 5,626 4,472 3,475 5,375 3,475 Future policy benefits for life and A&H contracts (at period end) $ 1,338 $ 1,250 $ 1,268 $ 1,228 $ 1,288 $ 1,338 $ 1,288See Accompanying Notes on Pages 49 to 50.
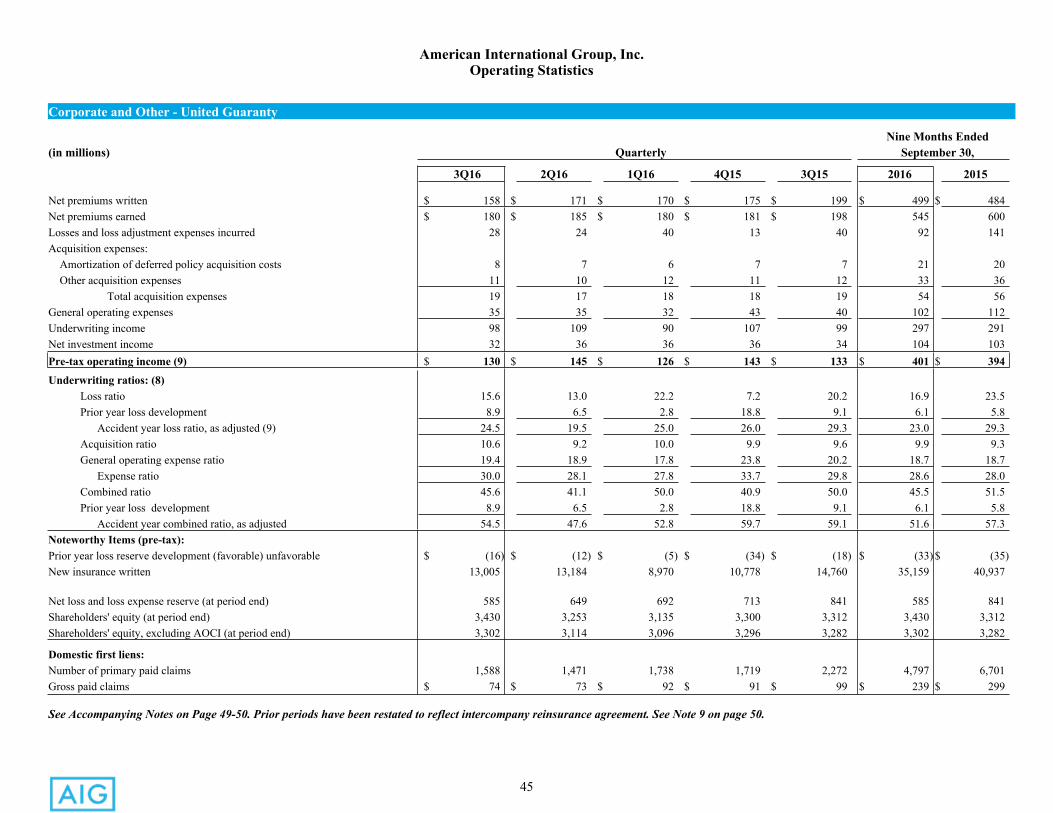
45
American International Group, Inc.Operating Statistics
Corporate and Other - United Guaranty
Nine Months Ended(in millions) Quarterly September 30,
3Q16 2Q16 1Q16 4Q15 3Q15 2016 2015
Net premiums written $ 158 $ 171 $ 170 $ 175 $ 199 $ 499 $ 484Net premiums earned $ 180 $ 185 $ 180 $ 181 $ 198 545 600Losses and loss adjustment expenses incurred 28 24 40 13 40 92 141Acquisition expenses: Amortization of deferred policy acquisition costs 8 7 6 7 7 21 20 Other acquisition expenses 11 10 12 11 12 33 36
Total acquisition expenses 19 17 18 18 19 54 56General operating expenses 35 35 32 43 40 102 112Underwriting income 98 109 90 107 99 297 291Net investment income 32 36 36 36 34 104 103Pre-tax operating income (9) $ 130 $ 145 $ 126 $ 143 $ 133 $ 401 $ 394
Underwriting ratios: (8)Loss ratio 15.6 13.0 22.2 7.2 20.2 16.9 23.5Prior year loss development 8.9 6.5 2.8 18.8 9.1 6.1 5.8 Accident year loss ratio, as adjusted (9) 24.5 19.5 25.0 26.0 29.3 23.0 29.3Acquisition ratio 10.6 9.2 10.0 9.9 9.6 9.9 9.3General operating expense ratio 19.4 18.9 17.8 23.8 20.2 18.7 18.7 Expense ratio 30.0 28.1 27.8 33.7 29.8 28.6 28.0Combined ratio 45.6 41.1 50.0 40.9 50.0 45.5 51.5Prior year loss development 8.9 6.5 2.8 18.8 9.1 6.1 5.8 Accident year combined ratio, as adjusted 54.5 47.6 52.8 59.7 59.1 51.6 57.3
Noteworthy Items (pre-tax):Prior year loss reserve development (favorable) unfavorable $ (16) $ (12) $ (5) $ (34) $ (18) $ (33) $ (35)New insurance written 13,005 13,184 8,970 10,778 14,760 35,159 40,937
Net loss and loss expense reserve (at period end) 585 649 692 713 841 585 841Shareholders' equity (at period end) 3,430 3,253 3,135 3,300 3,312 3,430 3,312Shareholders' equity, excluding AOCI (at period end) 3,302 3,114 3,096 3,296 3,282 3,302 3,282
Domestic first liens:Number of primary paid claims 1,588 1,471 1,738 1,719 2,272 4,797 6,701Gross paid claims $ 74 $ 73 $ 92 $ 91 $ 99 $ 239 $ 299
-See Accompanying Notes on Page 49-50. Prior periods have been restated to reflect intercompany reinsurance agreement. See Note 9 on page 50.
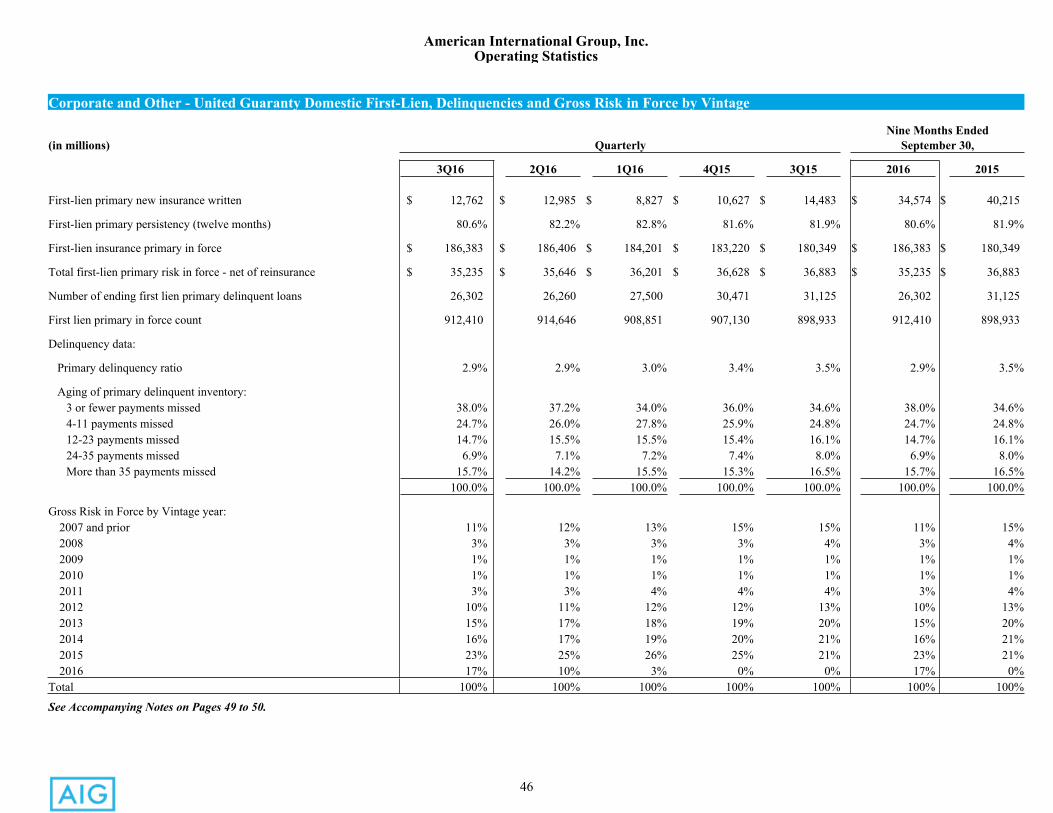
46
American International Group, Inc.Operating Statistics
Corporate and Other - United Guaranty Domestic First-Lien, Delinquencies and Gross Risk in Force by Vintage
Nine Months Ended(in millions) Quarterly September 30,
3Q16 2Q16 1Q16 4Q15 3Q15 2016 2015
First-lien primary new insurance written $ 12,762 $ 12,985 $ 8,827 $ 10,627 $ 14,483 $ 34,574 $ 40,215
First-lien primary persistency (twelve months) 80.6% 82.2% 82.8% 81.6% 81.9% 80.6% 81.9%
First-lien insurance primary in force $ 186,383 $ 186,406 $ 184,201 $ 183,220 $ 180,349 $ 186,383 $ 180,349
Total first-lien primary risk in force - net of reinsurance $ 35,235 $ 35,646 $ 36,201 $ 36,628 $ 36,883 $ 35,235 $ 36,883
Number of ending first lien primary delinquent loans 26,302 26,260 27,500 30,471 31,125 26,302 31,125
First lien primary in force count 912,410 914,646 908,851 907,130 898,933 912,410 898,933
Delinquency data:
Primary delinquency ratio 2.9% 2.9% 3.0% 3.4% 3.5% 2.9% 3.5%
Aging of primary delinquent inventory: 3 or fewer payments missed 38.0% 37.2% 34.0% 36.0% 34.6% 38.0% 34.6% 4-11 payments missed 24.7% 26.0% 27.8% 25.9% 24.8% 24.7% 24.8% 12-23 payments missed 14.7% 15.5% 15.5% 15.4% 16.1% 14.7% 16.1% 24-35 payments missed 6.9% 7.1% 7.2% 7.4% 8.0% 6.9% 8.0% More than 35 payments missed 15.7% 14.2% 15.5% 15.3% 16.5% 15.7% 16.5%
100.0% 100.0% 100.0% 100.0% 100.0% 100.0% 100.0%
Gross Risk in Force by Vintage year:2007 and prior 11% 12% 13% 15% 15% 11% 15%2008 3% 3% 3% 3% 4% 3% 4%2009 1% 1% 1% 1% 1% 1% 1%2010 1% 1% 1% 1% 1% 1% 1%2011 3% 3% 4% 4% 4% 3% 4%2012 10% 11% 12% 12% 13% 10% 13%2013 15% 17% 18% 19% 20% 15% 20%2014 16% 17% 19% 20% 21% 16% 21%2015 23% 25% 26% 25% 21% 23% 21%2016 17% 10% 3% 0% 0% 17% 0%
Total 100% 100% 100% 100% 100% 100% 100%
See Accompanying Notes on Pages 49 to 50.
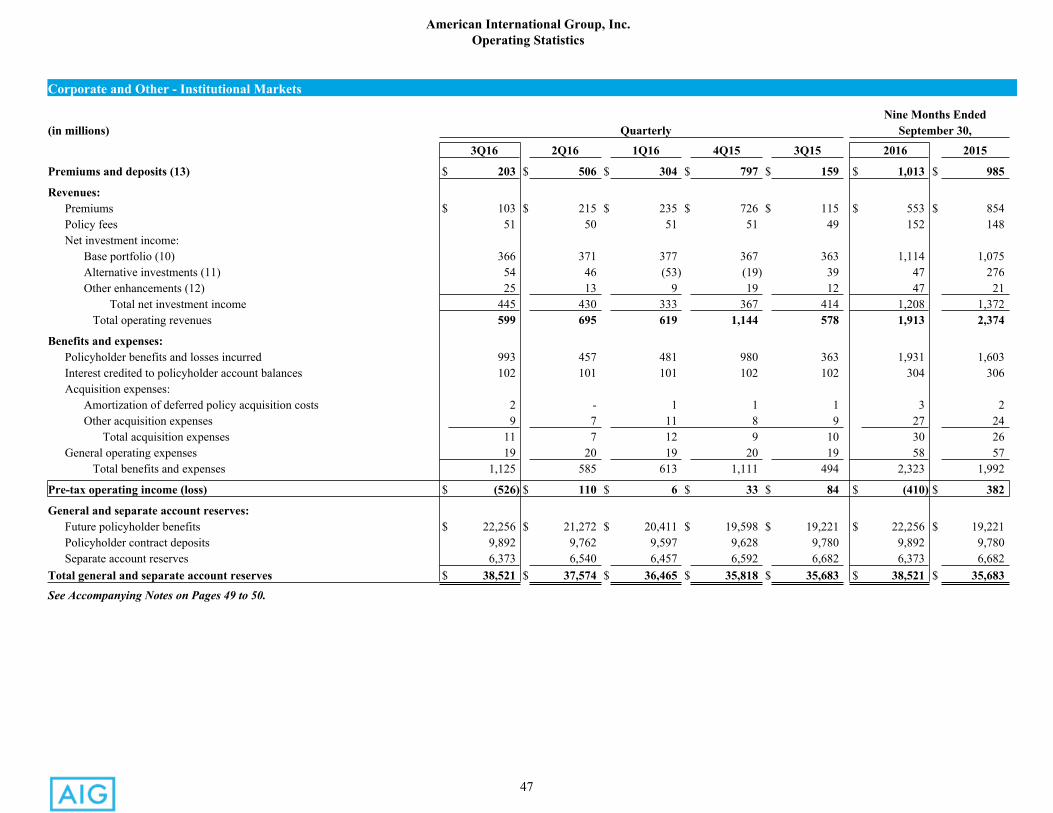
47
American International Group, Inc.Operating Statistics
Corporate and Other - Institutional Markets
Nine Months Ended(in millions) Quarterly September 30,
3Q16 2Q16 1Q16 4Q15 3Q15 2016 2015
Premiums and deposits (13) $ 203 $ 506 $ 304 $ 797 $ 159 $ 1,013 $ 985
Revenues:Premiums $ 103 $ 215 $ 235 $ 726 $ 115 $ 553 $ 854Policy fees 51 50 51 51 49 152 148Net investment income:
Base portfolio (10) 366 371 377 367 363 1,114 1,075Alternative investments (11) 54 46 (53) (19) 39 47 276Other enhancements (12) 25 13 9 19 12 47 21
Total net investment income 445 430 333 367 414 1,208 1,372 Total operating revenues 599 695 619 1,144 578 1,913 2,374
Benefits and expenses:Policyholder benefits and losses incurred 993 457 481 980 363 1,931 1,603Interest credited to policyholder account balances 102 101 101 102 102 304 306Acquisition expenses:
Amortization of deferred policy acquisition costs 2 - 1 1 1 3 2Other acquisition expenses 9 7 11 8 9 27 24
Total acquisition expenses 11 7 12 9 10 30 26General operating expenses 19 20 19 20 19 58 57
Total benefits and expenses 1,125 585 613 1,111 494 2,323 1,992
Pre-tax operating income (loss) $ (526) $ 110 $ 6 $ 33 $ 84 $ (410) $ 382
General and separate account reserves:Future policyholder benefits $ 22,256 $ 21,272 $ 20,411 $ 19,598 $ 19,221 $ 22,256 $ 19,221Policyholder contract deposits 9,892 9,762 9,597 9,628 9,780 9,892 9,780Separate account reserves 6,373 6,540 6,457 6,592 6,682 6,373 6,682
Total general and separate account reserves $ 38,521 $ 37,574 $ 36,465 $ 35,818 $ 35,683 $ 38,521 $ 35,683
See Accompanying Notes on Pages 49 to 50.
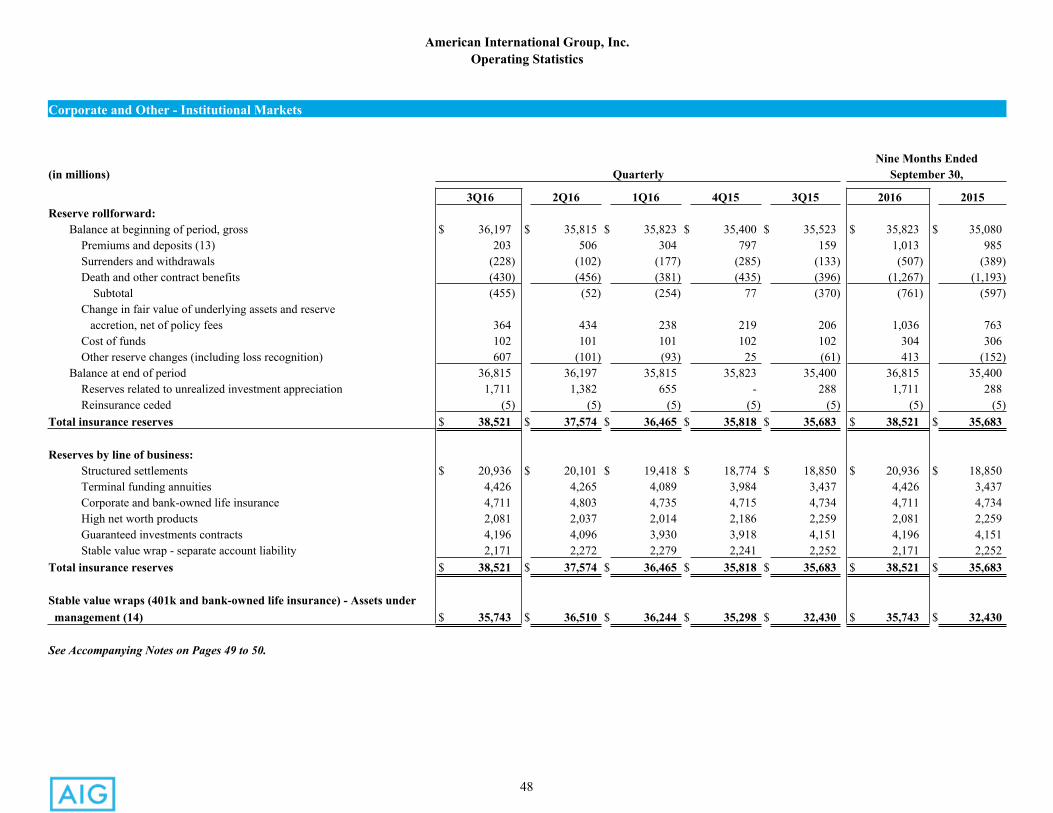
48
American International Group, Inc.Operating Statistics
Corporate and Other - Institutional Markets
Nine Months Ended(in millions) Quarterly September 30,
3Q16 2Q16 1Q16 4Q15 3Q15 2016 2015Reserve rollforward: Balance at beginning of period, gross $ 36,197 $ 35,815 $ 35,823 $ 35,400 $ 35,523 $ 35,823 $ 35,080 Premiums and deposits (13) 203 506 304 797 159 1,013 985 Surrenders and withdrawals (228) (102) (177) (285) (133) (507) (389) Death and other contract benefits (430) (456) (381) (435) (396) (1,267) (1,193) Subtotal (455) (52) (254) 77 (370) (761) (597) Change in fair value of underlying assets and reserve accretion, net of policy fees 364 434 238 219 206 1,036 763 Cost of funds 102 101 101 102 102 304 306 Other reserve changes (including loss recognition) 607 (101) (93) 25 (61) 413 (152) Balance at end of period 36,815 36,197 35,815 35,823 35,400 36,815 35,400 Reserves related to unrealized investment appreciation 1,711 1,382 655 - 288 1,711 288 Reinsurance ceded (5) (5) (5) (5) (5) (5) (5)Total insurance reserves $ 38,521 $ 37,574 $ 36,465 $ 35,818 $ 35,683 $ 38,521 $ 35,683
Reserves by line of business: Structured settlements $ 20,936 $ 20,101 $ 19,418 $ 18,774 $ 18,850 $ 20,936 $ 18,850 Terminal funding annuities 4,426 4,265 4,089 3,984 3,437 4,426 3,437 Corporate and bank-owned life insurance 4,711 4,803 4,735 4,715 4,734 4,711 4,734 High net worth products 2,081 2,037 2,014 2,186 2,259 2,081 2,259 Guaranteed investments contracts 4,196 4,096 3,930 3,918 4,151 4,196 4,151 Stable value wrap - separate account liability 2,171 2,272 2,279 2,241 2,252 2,171 2,252Total insurance reserves $ 38,521 $ 37,574 $ 36,465 $ 35,818 $ 35,683 $ 38,521 $ 35,683
Stable value wraps (401k and bank-owned life insurance) - Assets under management (14) $ 35,743 $ 36,510 $ 36,244 $ 35,298 $ 32,430 $ 35,743 $ 32,430
See Accompanying Notes on Pages 49 to 50.
49
American International Group, Inc.Notes
Corporate and Other
Basis of presentation
For Corporate and Other - Institutional Markets, net investment income is attributed based on invested assets from segregated product line portfolios held in our Life Insurance Companies. The fundamental investment strategy for these product line portfolios is to maintain primarily a diversified, high quality portfolio of fixed maturity securities and, to the extent practicable, to approximately match established duration targets based on characteristics of the underlying liabilities. All invested assets of the Life Insurance Companies in excess of liabilities are allocated based on internal estimates of target statutory capital for each product line.
Net investment income for Corporate and Other - United Guaranty is attributed based on legal entity invested assets.
Notes
(1) 3Q15 included a $175 million pre-tax pension curtailment gain related to freezing of the AIG Retirement Plan, the Non-Qualified Retirement Income Plan and the Supplemental Executive Retirement Plan.
(2) Represents AIG’s share of AerCap’s pre-tax operating income through the June 2015 date of sale of a majority of our ordinary shares of AerCap, which excludes certain post-acquisition transaction expenses incurred by AerCap in connection with its acquisition of ILFC and the difference between expensing AerCap’s maintenance rights asset over the remaining lease term as compared to the remaining economic life of the aircraft and our share of AerCap’s income taxes.
(3) Consists of the results of investments held by AIG Parent to support various corporate needs as well as the remaining positions of AIG Financial Products Corp. and related subsidiaries (collectively, AIGFP), life settlements, real estate, equipment leasing and lending and other secured lending investments held by AIG Parent and certain subsidiaries.
(4) Commercial run-off insurance lines consists primarily of excess workers’ compensation, asbestos and legacy environmental (1986 and prior); certain environmental liability, certain healthcare coverage, certain casualty and specialty coverages, and long-duration business in Japan. U.S. Life Insurance run-off insurance lines include American Security Life Insurance Company Limited, AIG Life Insurance Company (Switzerland) Ltd. and a reinsurance transaction of American International Reinsurance Company, Ltd. During the third and fourth quarters of 2015, certain environmental liability, healthcare, casualty and specialty coverages that are no longer offered by Commercial were transferred to run-off Commercial insurance lines.
(5) 3Q16 includes the impact of $622 million loss recognition as a result of the update of actuarial assumptions.(6) 4Q15 included $311 million of net adverse prior year loss reserve development associated with certain environmental liability, healthcare, casualty and specialty coverages previously
reported in Commercial. 3Q15 included $43 million of net adverse prior year loss reserve development associated with certain environmental liability, healthcare, casualty and specialty coverages previously reported in Commercial, and excluded $30 million of non-operating net adverse prior year loss reserve development.
(7) In 1Q16, 4Q15, and 3Q15, $1.3 billion, $0.9 billion and $0.3 billion, respectively, of loss reserves for certain environmental liability, casualty, healthcare, and specialty coverages, previously reported in Commercial Casualty and Specialty lines of business, were transferred to Other run-off insurance lines.
(8) Underwriting ratios are computed as follows:a. Loss ratio = Loss and loss adjustment expenses incurred ÷ Net premiums earned (NPE)b. Prior year loss development = [Loss and loss adjustment expenses incurred – Prior year loss reserve development (favorable) unfavorable (PYD)] ÷ NPE – Loss ratioc. Accident year loss ratio, as adjusted (AYLR) = [Loss and loss adjustment expenses incurred – PYD] ÷ NPEd. Acquisition ratio = Total acquisition expenses ÷ NPEe. General operating expense ratio = General operating expenses ÷ NPEf. Expense ratio = Acquisition ratio + General operating expenses ratiog. Combined ratio = Loss ratio + Expense ratioh. Accident year combined ratio, as adjusted = AYLR + Expense ratio
50
American International Group, Inc. Notes (continued)
Corporate and Other
(9) In 2Q15, a United Guaranty subsidiary and certain of our property casualty companies entered into a 50 percent quota share arrangement whereby the United Guaranty subsidiary (1) ceded 50 percent of the risk relating to policies written in 2014 that were current as of January 1, 2015 and (2) ceded 50 percent of the risk relating to all policies written in 2015 and 2016, each in exchange for a 30 percent ceding commission and reimbursements of 50 percent of the losses and loss adjustment expenses incurred on covered policies. Beginning in 3Q16, the effects of these intercompany reinsurance arrangements are included in the results of Commercial Insurance and Corporate and Other for all periods presented. Previously, these arrangements were eliminated for purposes of segment reporting.
Prior periods have been revised to conform to the current period presentation.
Nine Months EndedYear
EndedQuarterly September 30, December 31,
United Guaranty 3Q16 2Q16 1Q16 4Q15 3Q15 2Q15 1Q15 2016 2015 2015 Accident year loss ratio, as adjusted - previously reported 19.4 15.5 20.9 22.3 25.9 27.0 25.2 18.7 26.0 25.1Impact of UGC reinsurance treaty 5.1 4.0 4.1 3.7 3.4 7.5 - 4.3 3.3 3.5Other - - - - - - 0.3 - - -Accident year loss ratio, as adjusted - revised 24.5 19.5 25.0 26.0 29.3 34.5 25.5 23.0 29.3 28.6
Pre-tax operating income (loss) - previously reported $ 172 $ 187 $ 163 $ 180 $ 162 $ 157 $ 145 $ 522 $ 464 $ 644Impact of UGC reinsurance treaty * (45) (42) (35) (34) (30) (38) - (122) (68) (102)Other 3 - (2) (3) 1 (2) (1) 1 (2) (5)Pre-tax operating income (loss) - revised $ 130 $ 145 $ 126 $ 143 $ 133 $ 117 $ 144 $ 401 $ 394 $ 537
* Commercial Insurance and United Guaranty each use models that are consistent with their core underlying business to defer and amortize ceding commissions related to the intercompany reinsurance agreement. The difference in pre-tax operating income arising from the use of these different models is eliminated for AIG consolidated reporting.
(10) Base portfolio investment income includes interest, dividends and foreclosed real estate income, net of investment expenses. (11) Alternative investment income includes income on hedge funds, private equity funds and affordable housing partnerships. Hedge funds for which we elected the fair value option are
recorded as of the balance sheet date. Other hedge funds are generally reported on a one-month lag, while private equity funds are generally reported on one-quarter lag.(12) Net investment income-other enhancements include call and tender income, changes in market value of investments accounted for under the fair value option, interest received on defaulted
investments and other miscellaneous investment income, including income of certain partnership entities that are required to be consolidated.(13) Premiums and deposits is a non-GAAP financial measure.The following table presents a reconciliation of Institutional Markets premiums and deposits to GAAP premiums:
(in millions) QuarterlyNine Months Ended
September 30,
3Q16 2Q16 1Q16 4Q15 3Q15 2016 2015Premiums and deposits $ 203 $ 506 $ 304 $ 797 $ 159 $ 1,013 $ 985Deposits (95) (288) (61) (65) (33) (444) (104)Other (5) (3) (8) (6) (11) (16) (27)Premiums $ 103 $ 215 $ 235 $ 726 $ 115 $ 553 $ 854
(14) Comprises the notional value of (i) new stable value wrap contracts and (ii) stable value wrap contracts novated from AIG Global Capital Markets and rewritten as group annuity contracts. Excludes the portion of stable value wraps included in Total insurance reserves.
(15) Represents fair value adjustments related to our holding of 1.113 billion shares of The People’s Insurance Company (Group) of China Limited (PICC) (ticker: 1339HK).
51
American International Group, Inc.
Investments - Cash and Investments
September 30, 2016 (2)Life Insurance Non-Life Insurance Corporate and
(in millions) Companies Companies Other (1) AIG Inc.
Bonds available for sale, at fair value: U.S. government and government sponsored entities $ 788 $ 611 $ 824 $ 2,223 Obligations of states, municipalities and political subdivisions 6,180 19,350 1,048 26,578 Non-U.S. governments 9,598 10,689 419 20,706 Corporate debt 106,337 30,210 4,657 141,204 Mortgage-backed, asset-backed and collateralized: RMBS 24,712 10,868 2,235 37,815 CMBS 11,499 3,253 321 15,073 CDO/ABS 12,261 7,644 (2,855) 17,050 Total mortgage-backed, asset-backed and collateralized 48,472 21,765 (299) 69,938Total bonds available for sale, at fair value 171,375 82,625 6,649 260,649Other bond securities, at fair value 3,828 1,409 9,535 14,772Equity securities available for sale, at fair value 209 1,837 (502) 1,544Other equity securities trading, at fair value 3 - 495 498Mortgage and other loans receivable, net of allowance 24,773 9,419 (1,779) 32,413Other invested assets 9,486 10,923 5,338 25,747Cash and short-term investments 5,346 5,003 2,894 13,243Total cash and investments $ 215,020 $ 111,216 $ 22,630 $ 348,866
December 31, 2015 (2)Life Insurance Non-Life Insurance Corporate and
(in millions) Companies Companies Other (1) AIG Inc.
Bonds available for sale, at fair value: U.S. government and government sponsored entities $ 765 $ 591 $ 488 $ 1,844 Obligations of states, municipalities and political subdivisions 5,462 19,215 2,646 27,323 Non-U.S. governments 7,355 10,480 360 18,195 Corporate debt 99,821 30,465 5,702 135,988 Mortgage-backed, asset-backed and collateralized: RMBS 22,643 10,457 3,127 36,227 CMBS 10,248 2,923 400 13,571 CDO/ABS 10,856 6,628 (2,387) 15,097 Total mortgage-backed, asset-backed and collateralized 43,747 20,008 1,140 64,895Total bonds available for sale, at fair value 157,150 80,759 10,336 248,245Other bond securities, at fair value 3,589 1,463 11,730 16,782Equity securities available for sale, at fair value 144 2,821 (50) 2,915Other equity securities trading, at fair value - 355 566 921Mortgage and other loans receivable, net of allowance 23,979 8,277 (2,691) 29,565Other invested assets 12,398 10,569 6,827 29,794Cash and short-term investments 3,434 4,040 4,287 11,761Total cash and investments $ 200,694 $ 108,284 $ 31,005 $ 339,983
See Accompanying Notes on Page 55.
52
American International Group, Inc.
Investments - Other Invested Assets
September 30, 2016 (2)(in millions) Life Insurance Non-Life Insurance Corporate and
Companies Companies Other (1) AIG Inc.
Alternative investments (4) $ 6,090 $ 8,274 $ (137) $ 14,227Investments in life settlements - - 3,577 3,577Investment real estate 3,298 1,694 1,502 6,494Aircraft assets - - 356 356All other investments (3) 98 955 40 1,093
$ 9,486 $ 10,923 $ 5,338 $ 25,747
December 31, 2015 (2)(in millions) Life Insurance Non-Life Insurance Corporate and
Companies Companies Other (1) AIG Inc.
Alternative investments (4) $ 9,356 $ 8,852 $ (58) $ 18,150Investments in life settlements - - 3,606 3,606Investment real estate 2,977 847 2,755 6,579Aircraft assets - - 477 477All other investments (3) 65 870 47 982
$ 12,398 $ 10,569 $ 6,827 $ 29,794
See Accompanying Notes on Page 55.
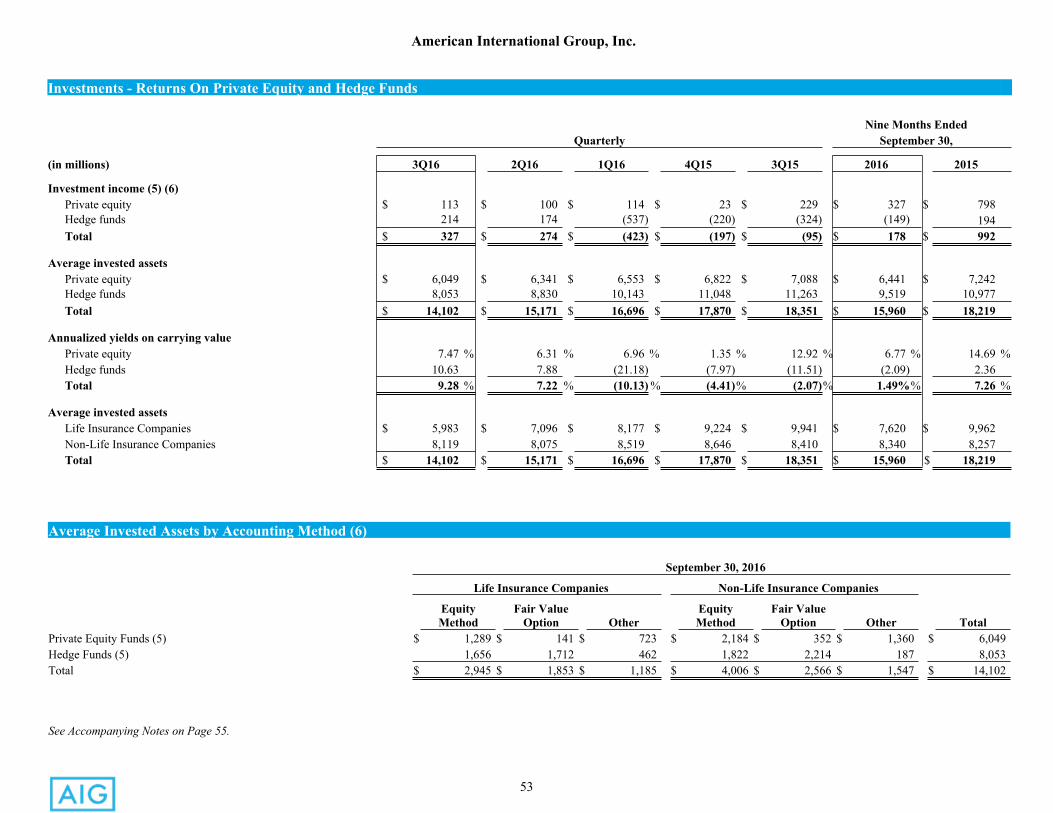
53
American International Group, Inc.
Investments - Returns On Private Equity and Hedge Funds
Nine Months EndedQuarterly September 30,
(in millions) 3Q16 2Q16 1Q16 4Q15 3Q15 2016 2015
Investment income (5) (6)Private equity $ 113 $ 100 $ 114 $ 23 $ 229 $ 327 $ 798Hedge funds 214 174 (537) (220) (324) (149) 194Total $ 327 $ 274 $ (423) $ (197) $ (95) $ 178 $ 992
Average invested assetsPrivate equity $ 6,049 $ 6,341 $ 6,553 $ 6,822 $ 7,088 $ 6,441 $ 7,242Hedge funds 8,053 8,830 10,143 11,048 11,263 9,519 10,977Total $ 14,102 $ 15,171 $ 16,696 $ 17,870 $ 18,351 $ 15,960 $ 18,219
Annualized yields on carrying valuePrivate equity 7.47 % 6.31 % 6.96 % 1.35 % 12.92 % 6.77 % 14.69 %Hedge funds 10.63 7.88 (21.18) (7.97) (11.51) (2.09) 2.36Total 9.28 % 7.22 % (10.13) % (4.41)% (2.07)% 1.49%% 7.26 %
Average invested assetsLife Insurance Companies $ 5,983 $ 7,096 $ 8,177 $ 9,224 $ 9,941 $ 7,620 $ 9,962Non-Life Insurance Companies 8,119 8,075 8,519 8,646 8,410 8,340 8,257Total $ 14,102 $ 15,171 $ 16,696 $ 17,870 $ 18,351 $ 15,960 $ 18,219
Average Invested Assets by Accounting Method (6)
September 30, 2016
Life Insurance Companies Non-Life Insurance Companies
Equity Method
Fair Value Option Other
Equity Method
Fair Value Option Other Total
Private Equity Funds (5) $ 1,289 $ 141 $ 723 $ 2,184 $ 352 $ 1,360 $ 6,049Hedge Funds (5) 1,656 1,712 462 1,822 2,214 187 8,053Total $ 2,945 $ 1,853 $ 1,185 $ 4,006 $ 2,566 $ 1,547 $ 14,102
See Accompanying Notes on Page 55.
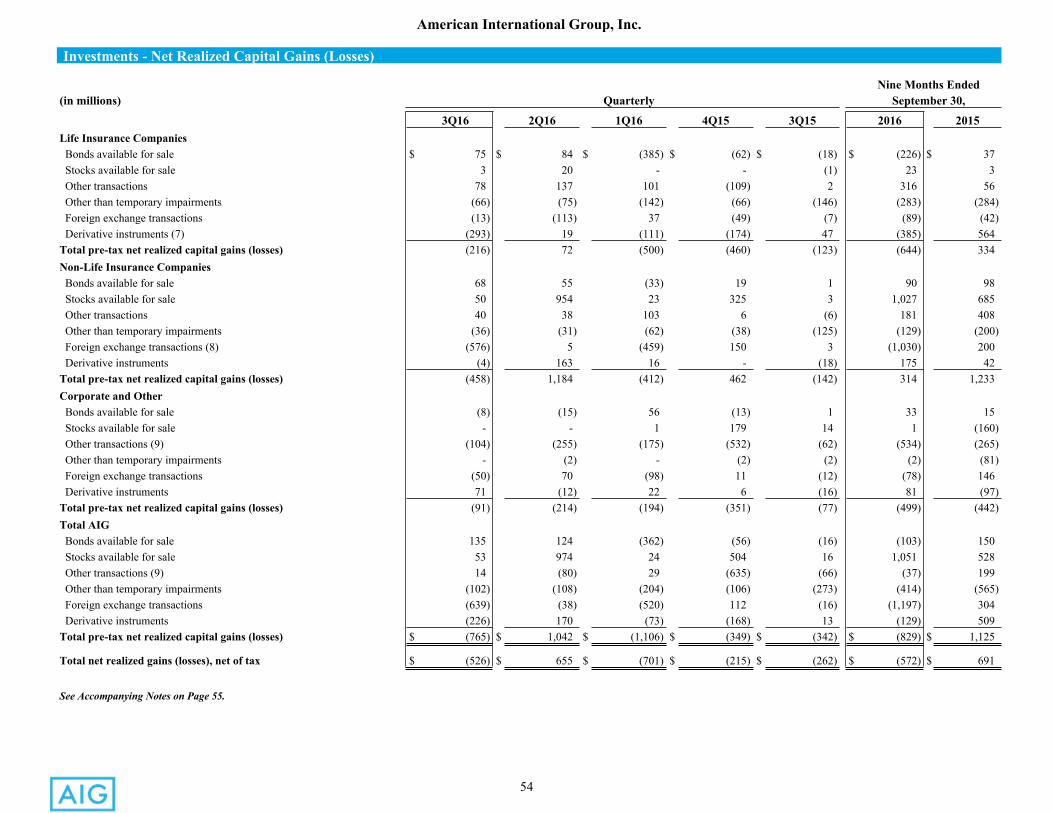
54
American International Group, Inc.
Investments - Net Realized Capital Gains (Losses)
Nine Months Ended(in millions) Quarterly September 30,
3Q16 2Q16 1Q16 4Q15 3Q15 2016 2015Life Insurance Companies Bonds available for sale $ 75 $ 84 $ (385) $ (62) $ (18) $ (226) $ 37 Stocks available for sale 3 20 - - (1) 23 3 Other transactions 78 137 101 (109) 2 316 56 Other than temporary impairments (66) (75) (142) (66) (146) (283) (284) Foreign exchange transactions (13) (113) 37 (49) (7) (89) (42) Derivative instruments (7) (293) 19 (111) (174) 47 (385) 564Total pre-tax net realized capital gains (losses) (216) 72 (500) (460) (123) (644) 334Non-Life Insurance Companies Bonds available for sale 68 55 (33) 19 1 90 98 Stocks available for sale 50 954 23 325 3 1,027 685 Other transactions 40 38 103 6 (6) 181 408 Other than temporary impairments (36) (31) (62) (38) (125) (129) (200) Foreign exchange transactions (8) (576) 5 (459) 150 3 (1,030) 200 Derivative instruments (4) 163 16 - (18) 175 42Total pre-tax net realized capital gains (losses) (458) 1,184 (412) 462 (142) 314 1,233Corporate and Other Bonds available for sale (8) (15) 56 (13) 1 33 15 Stocks available for sale - - 1 179 14 1 (160) Other transactions (9) (104) (255) (175) (532) (62) (534) (265) Other than temporary impairments - (2) - (2) (2) (2) (81) Foreign exchange transactions (50) 70 (98) 11 (12) (78) 146 Derivative instruments 71 (12) 22 6 (16) 81 (97)Total pre-tax net realized capital gains (losses) (91) (214) (194) (351) (77) (499) (442)Total AIG Bonds available for sale 135 124 (362) (56) (16) (103) 150 Stocks available for sale 53 974 24 504 16 1,051 528 Other transactions (9) 14 (80) 29 (635) (66) (37) 199 Other than temporary impairments (102) (108) (204) (106) (273) (414) (565) Foreign exchange transactions (639) (38) (520) 112 (16) (1,197) 304 Derivative instruments (226) 170 (73) (168) 13 (129) 509Total pre-tax net realized capital gains (losses) $ (765) $ 1,042 $ (1,106) $ (349) $ (342) $ (829) $ 1,125
Total net realized gains (losses), net of tax $ (526) $ 655 $ (701) $ (215) $ (262) $ (572) $ 691
See Accompanying Notes on Page 55.
55
American International Group, Inc.Notes
Consolidated Results
(1) Includes consolidations, eliminations and other adjustments.(2) Includes assets backed by debt of consolidated investment vehicles. These vehicles include debt related to real estate investments of $1.7 billion, affordable housing
partnership investments and securitizations of $1.7 billion and other securitization vehicles and investments of $781 million at September 30, 2016 and debt related to real estate investments of $2.4 billion, affordable housing partnership investments and securitizations of $2.2 billion, and other securitization vehicles and investments of $359 million at December 31, 2015.
(3) Consists primarily of long-term time deposits and direct private equity investments.(4) Alternative investments include hedge funds, private equity funds and affordable housing partnerships.(5) Hedge funds for which we elected the fair value option are recorded as of the balance sheet date. Other hedge funds are generally reported on a one-month lag, while private
equity funds are generally reported on one-quarter lag.(6) Changes in the value of the underlying investments in hedge funds and private equity funds that are accounted for under the equity method or fair value option are recorded
in earnings. Changes in the value of the investments in similar funds included in Other are primarily recorded in accumulated other comprehensive income (AOCI).(7) Includes changes in the fair value of embedded derivatives and a portion of associated fees for variable annuity living benefit features (primarily GMWB) and changes in
fair value of hedging instruments purchased to hedge the liabilities.(8) 3Q16, 2Q16, 1Q16, 4Q15, and 3Q15 included $(528) million, $105 million, $(483) million, $136 million, and $(48) million, respectively, of foreign exchange gains (losses)
primarily due to a short term intercompany balance that was matched with available for sale investments in fixed maturity securities denominated in the same foreign currencies. Unrealized gains and losses on the available for sale investments were recorded in other comprehensive income resulting in an immaterial impact on our overall equity or book value per share from this arrangement.
(9) Includes impairments on investments in life settlements.
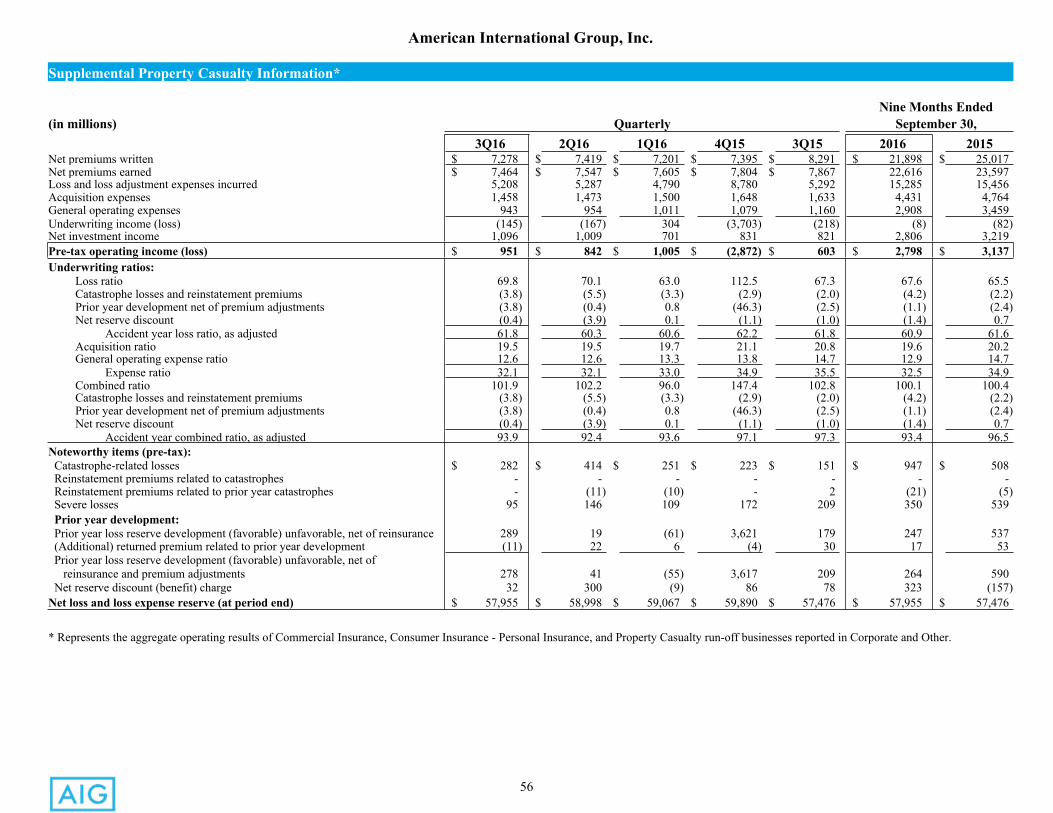
56
American International Group, Inc.
Supplemental Property Casualty Information*
Nine Months Ended(in millions) Quarterly September 30,
3Q16 2Q16 1Q16 4Q15 3Q15 2016 2015 Net premiums written $ 7,278 $ 7,419 $ 7,201 $ 7,395 $ 8,291 $ 21,898 $ 25,017Net premiums earned $ 7,464 $ 7,547 $ 7,605 $ 7,804 $ 7,867 22,616 23,597Loss and loss adjustment expenses incurred 5,208 5,287 4,790 8,780 5,292 15,285 15,456Acquisition expenses 1,458 1,473 1,500 1,648 1,633 4,431 4,764General operating expenses 943 954 1,011 1,079 1,160 2,908 3,459Underwriting income (loss) (145) (167) 304 (3,703) (218) (8) (82)Net investment income 1,096 1,009 701 831 821 2,806 3,219Pre-tax operating income (loss) $ 951 $ 842 $ 1,005 $ (2,872) $ 603 $ 2,798 $ 3,137Underwriting ratios:
Loss ratio 69.8 70.1 63.0 112.5 67.3 67.6 65.5Catastrophe losses and reinstatement premiums (3.8) (5.5) (3.3) (2.9) (2.0) (4.2) (2.2)Prior year development net of premium adjustments (3.8) (0.4) 0.8 (46.3) (2.5) (1.1) (2.4)Net reserve discount (0.4) (3.9) 0.1 (1.1) (1.0) (1.4) 0.7 Accident year loss ratio, as adjusted 61.8 60.3 60.6 62.2 61.8 60.9 61.6Acquisition ratio 19.5 19.5 19.7 21.1 20.8 19.6 20.2General operating expense ratio 12.6 12.6 13.3 13.8 14.7 12.9 14.7 Expense ratio 32.1 32.1 33.0 34.9 35.5 32.5 34.9Combined ratio 101.9 102.2 96.0 147.4 102.8 100.1 100.4Catastrophe losses and reinstatement premiums (3.8) (5.5) (3.3) (2.9) (2.0) (4.2) (2.2)Prior year development net of premium adjustments (3.8) (0.4) 0.8 (46.3) (2.5) (1.1) (2.4)Net reserve discount (0.4) (3.9) 0.1 (1.1) (1.0) (1.4) 0.7 Accident year combined ratio, as adjusted 93.9 92.4 93.6 97.1 97.3 93.4 96.5
Noteworthy items (pre-tax): Catastrophe-related losses $ 282 $ 414 $ 251 $ 223 $ 151 $ 947 $ 508 Reinstatement premiums related to catastrophes - - - - - - - Reinstatement premiums related to prior year catastrophes - (11) (10) - 2 (21) (5) Severe losses 95 146 109 172 209 350 539 Prior year development: Prior year loss reserve development (favorable) unfavorable, net of reinsurance 289 19 (61) 3,621 179 247 537 (Additional) returned premium related to prior year development (11) 22 6 (4) 30 17 53 Prior year loss reserve development (favorable) unfavorable, net of reinsurance and premium adjustments 278 41 (55) 3,617 209 264 590 Net reserve discount (benefit) charge 32 300 (9) 86 78 323 (157)Net loss and loss expense reserve (at period end) $ 57,955 $ 58,998 $ 59,067 $ 59,890 $ 57,476 $ 57,955 $ 57,476
* Represents the aggregate operating results of Commercial Insurance, Consumer Insurance - Personal Insurance, and Property Casualty run-off businesses reported in Corporate and Other.
57
American International Group, Inc.Acronyms
A&H Accident and Health Insurance
ABS Asset-Backed Securities
AOCI Accumulated Other Comprehensive Income
CDO Collateralized Debt Obligations
CMBS Commercial Mortgage-Backed Securities
CPPE Continuous Payment Premium Equivalent
DAC Deferred Acquisition Costs
DTA Deferred Tax Assets
GAAP Accounting principles generally accepted in the United States of America
GMAB Guaranteed Minimum Accumulation Benefits
GMDB Guaranteed Minimum Death Benefits
GMIB Guaranteed Minimum Income Benefits
GMWB Guaranteed Minimum Withdrawal Benefits
RMBS Residential Mortgage-Backed Securities
ROE Return on Equity
SIA Sales Inducement Assets
VOBA Value of Business Acquired