Embed Size (px)
Citation preview

Investor Presentation
June 2019
American Honda Finance Corporation
2019
2019
2019 Passport2019 Insight Hybrid
2019 Insight Hybrid
2019 Passport2019 Passport
2019 Passport
Caution with Respect to Forward-Looking Statements:
These slides may contain “forward-looking statements” within the meaning of the Private Securities Litigation Reform Act of 1995 that involve a number of risks and
uncertainties. Certain such forward-looking statements can be identified by the use of forward-looking terminology such as “believes,” “expects,” “may,” “will,” “should,” “seeks,”
“scheduled,” or “anticipates” or similar expressions or the negative thereof or other variations thereof or comparable terminology, or by discussions of strategy, plans or
intentions. Such forward-looking statements are necessarily dependent on assumptions, data, or methods that may be incorrect or imprecise and that may be incapable of being
realized. Factors such as declines in the financial condition or performance of Honda or AHFC or the sales of Honda or Acura products, changes in general business and
economic conditions, and fluctuations in interest rates and currency exchange rates, among others, could cause actual results and other matters to differ materially from those in
such forward-looking statements.
Use and Definition of Non-GAAP Financial Measure:This presentation includes the following financial measure defined as a non‐GAAP financial measure by the SEC: Income before income taxes excluding valuation adjustments
and reclassifications. This measure has limitations as an analytical tool and should not be considered as an alternative to, or more meaningful than, net income as determined in
accordance with GAAP or as an indicator of our liquidity. Our presentation of this non‐GAAP financial measure should also not be construed as an inference that our results will
be unaffected by unusual or non‐recurring items. Our computations of this non‐GAAP financial measure may not be comparable to other similarly titled measures of other
companies.
We define income before income taxes excluding valuation adjustments and reclassifications as income before income taxes excluding realized (gains)/losses on derivatives
and foreign currency denominated debt, (gain)/loss on derivative instruments, and (gain)/loss on foreign currency revaluation of debt. Management believes income before
income taxes excluding valuation adjustments and reclassifications is useful because it allows management to evaluate our operating performance and compare the results of
our operations from period to period and against our peers without regard to fluctuations in performance resulting from currency related charges and interest rate swaps.
A reconciliation of our net income as determined in accordance with GAAP to income before taxes excluding valuation adjustments and reclassifications is provided in Appendix
A to these slides.
Accounting Standards:Honda Motor Co., Ltd.
Financial information is prepared in conformity with International Financial Reporting Standards (IFRS), as issued by the International Accounting Standards Board (IASB).
American Honda Finance Corp.
Financial information is prepared in conformity with U.S. generally accepted accounting principles.
This information is presented as of June 13, 2019 and does not purport to be accurate as of any other date. We undertake no obligation to update this information.
This presentation does not constitute an offer to sell or a solicitation of an offer to purchase any securities. Any offer or sale of securities will be made only by means of an
offering memorandum and related documents.
Foreign Currency Translation:
The financial data in these slides is presented on a consolidated basis unless otherwise noted. Upon consolidation, the assets and liabilities are translated at year-end
exchange rates, and the revenues and expenses are translated at the average rates of exchange during the respective years. Foreign currency denominated debt is translated
at year-end exchange rates, and the foreign currency transaction gains and losses are recognized through earnings.
2
3
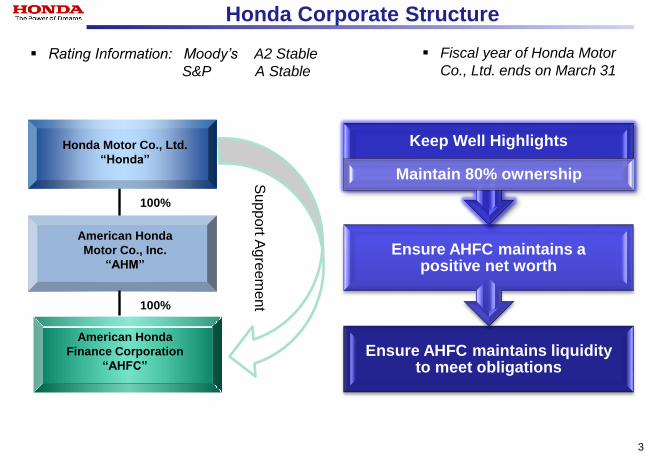
Honda Corporate Structure
Support A
gre
em
ent
Honda Motor Co., Ltd.
“Honda”
American Honda
Motor Co., Inc.
“AHM”
American Honda
Finance Corporation
“AHFC”
100%
100%
Ensure AHFC maintains liquidity to meet obligations
Ensure AHFC maintains a positive net worth
Keep Well Highlights
Maintain 80% ownership
Rating Information: Moody’s A2 Stable
S&P A Stable
Fiscal year of Honda Motor
Co., Ltd. ends on March 31
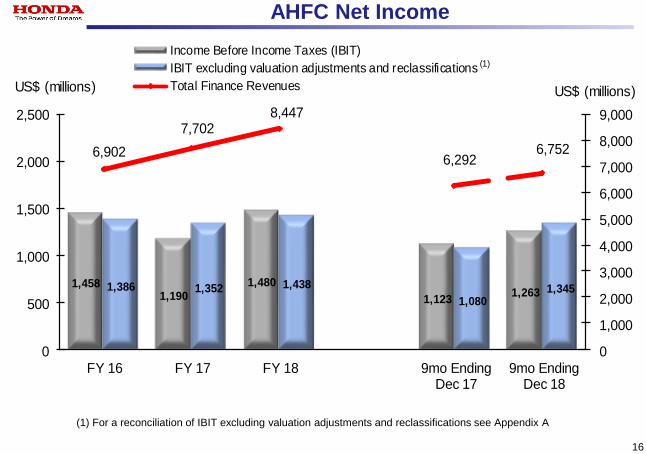
AHFC Net Income
1,458 1,190
1,480
1,123 1,263
1,386 1,352 1,438
1,080 1,345
6,902
7,7028,447
6,2926,752
0
1,000
2,000
3,000
4,000
5,000
6,000
7,000
8,000
9,000
0
500
1,000
1,500
2,000
2,500
FY 16 FY 17 FY 18 9mo EndingDec 17
9mo EndingDec 18
Income Before Income Taxes (IBIT)
IBIT excluding valuation adjustments and reclassifications
Total Finance RevenuesUS$ (millions) US$ (millions)
(1)
(1) For a reconciliation of IBIT excluding valuation adjustments and reclassifications see Appendix A
16
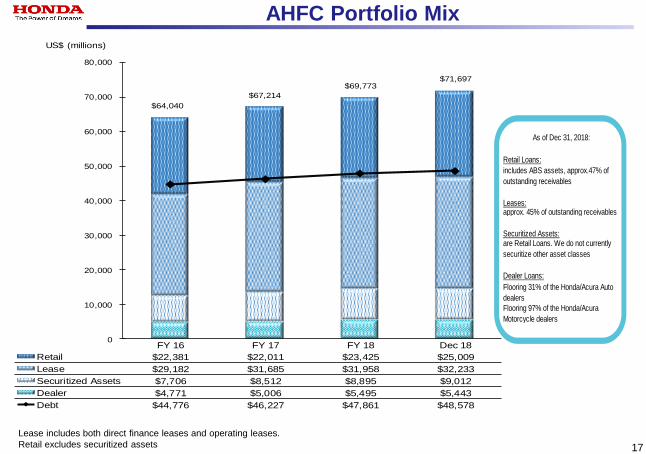
Lease includes both direct finance leases and operating leases.
Retail excludes securitized assets
AHFC Portfolio Mix
$64,040
$67,214
$69,773 $71,697
0
10,000
20,000
30,000
40,000
50,000
60,000
70,000
80,000
FY 16 FY 17 FY 18 Dec 18
Retail $22,381 $22,011 $23,425 $25,009
Lease $29,182 $31,685 $31,958 $32,233
Securitized Assets $7,706 $8,512 $8,895 $9,012
Dealer $4,771 $5,006 $5,495 $5,443
Debt $44,776 $46,227 $47,861 $48,578
US$ (millions)
As of Dec 31, 2018:
Retail Loans:
Leases:approx. 45% of outstanding receivables
Securitized Assets:are Retail Loans. We do not currently
securitize other asset classes
Dealer Loans:
Flooring 31% of the Honda/Acura Auto
dealers
Flooring 97% of the Honda/Acura
Motorcycle dealers
includes ABS assets, approx.47% of
outstanding receivables
17
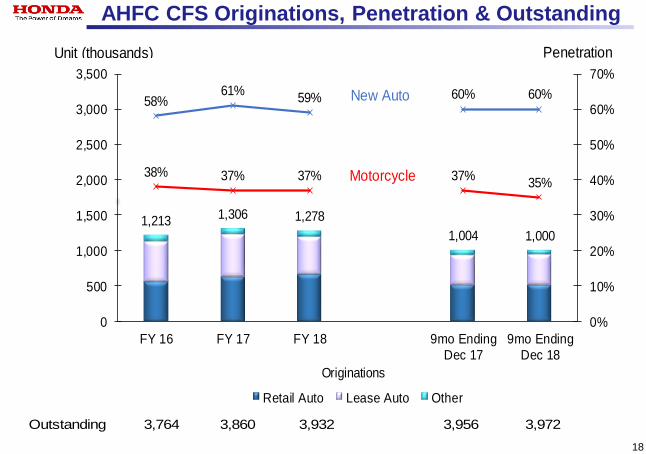
AHFC CFS Originations, Penetration & Outstanding
18
58%61%
59% 60% 60%
38% 37% 37% 37%35%
1,213 1,306 1,278
1,004 1,000
0%
10%
20%
30%
40%
50%
60%
70%
0
500
1,000
1,500
2,000
2,500
3,000
3,500
FY 16 FY 17 FY 18 9mo EndingDec 17
9mo EndingDec 18
Retail Auto Lease Auto Other
New Auto
Motorcycle
Originations
Outstanding 3,764 3,860 3,932 3,956 3,972
Unit (thousands) Penetration
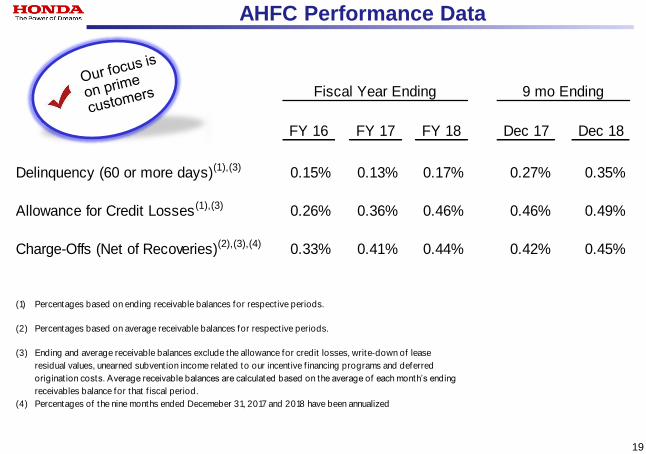
AHFC Performance Data
FY 16 FY 17 FY 18 Dec 17 Dec 18
Delinquency (60 or more days)(1),(3) 0.15% 0.13% 0.17% 0.27% 0.35%
Allowance for Credit Losses (1),(3) 0.26% 0.36% 0.46% 0.46% 0.49%
Charge-Offs (Net of Recoveries)(2),(3),(4) 0.33% 0.41% 0.44% 0.42% 0.45%
(1) Percentages based on ending receivable balances for respective periods.
(2) Percentages based on average receivable balances for respective periods.
(3)
(4) Percentages of the nine months ended Decemeber 31, 2017 and 2018 have been annualized
Ending and average receivable balances exclude the allowance for credit losses, write-down of lease
residual values, unearned subvention income related to our incentive f inancing programs and deferred
originat ion costs. Average receivable balances are calculated based on the average of each month’s ending
receivables balance for that f iscal period.
Fiscal Year Ending 9 mo Ending
19
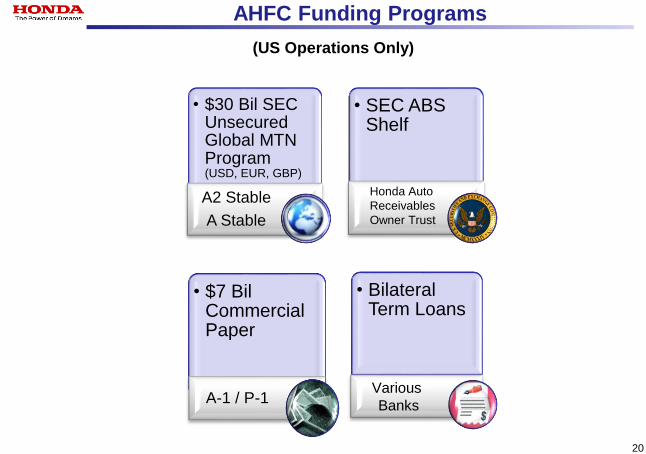
AHFC Funding Programs
20
• $30 Bil SEC Unsecured Global MTN Program (USD, EUR, GBP)
A2 Stable
A Stable
• SEC ABS Shelf
• $7 Bil Commercial Paper
A-1 / P-1
• Bilateral Term Loans
Honda Auto
Receivables
Owner Trust
(US Operations Only)
Various
Banks
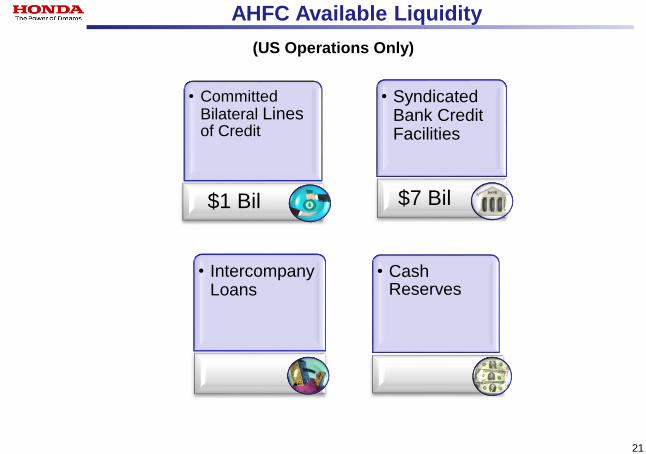
AHFC Available Liquidity
21
• Committed Bilateral Linesof Credit
$1 Bil
• Cash Reserves
(US Operations Only)
• Intercompany Loans
• Syndicated Bank Credit Facilities
$7 Bil
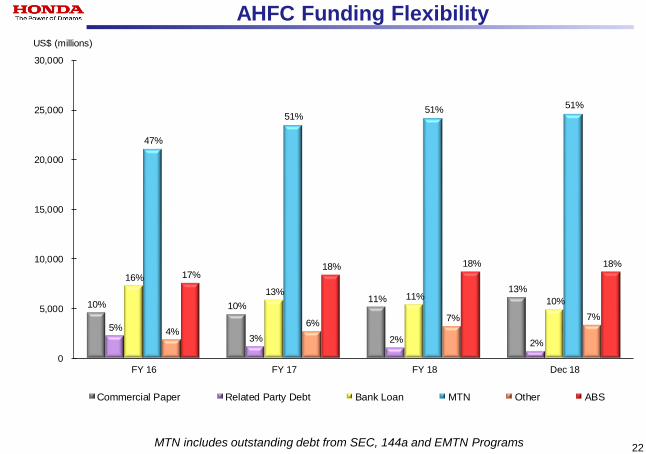
AHFC Funding Flexibility
10% 10%11%
13%
5%3% 2% 2%
16%
13%11%
10%
47%
51%51%
51%
4%6%
7% 7%
17%18% 18% 18%
0
5,000
10,000
15,000
20,000
25,000
30,000
FY 16 FY 17 FY 18 Dec 18
US$ (millions)
Commercial Paper Related Party Debt Bank Loan MTN Other ABS
MTN includes outstanding debt from SEC, 144a and EMTN Programs 22
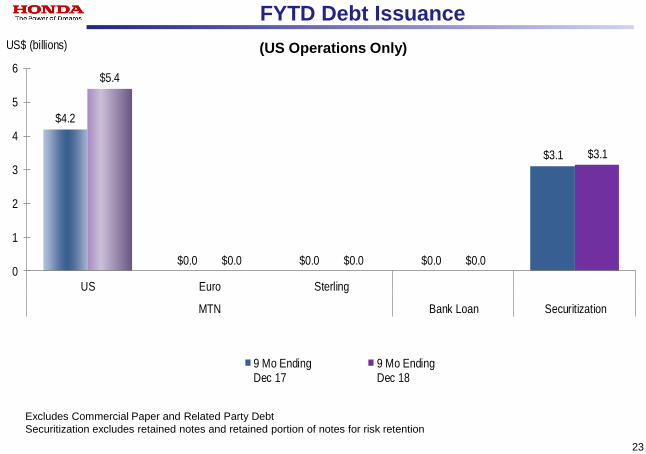
FYTD Debt Issuance
(US Operations Only)
$4.2
$0.0 $0.0 $0.0
$3.1
$5.4
$0.0 $0.0 $0.0
$3.1
0
1
2
3
4
5
6
US Euro Sterling
MTN Bank Loan Securitization
US$ (billions)
9 Mo EndingDec 17
9 Mo EndingDec 18
Excludes Commercial Paper and Related Party Debt
Securitization excludes retained notes and retained portion of notes for risk retention
23
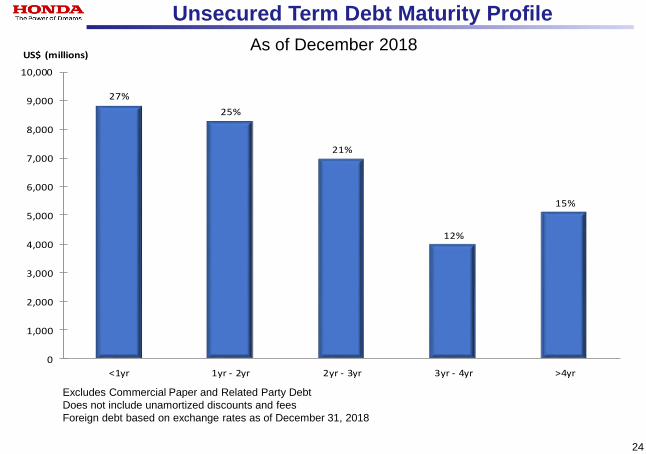
Unsecured Term Debt Maturity Profile
27%
25%
21%
12%
15%
0
1,000
2,000
3,000
4,000
5,000
6,000
7,000
8,000
9,000
10,000
<1yr 1yr - 2yr 2yr - 3yr 3yr - 4yr >4yr
US$ (millions)As of December 2018
Excludes Commercial Paper and Related Party Debt
Does not include unamortized discounts and fees
Foreign debt based on exchange rates as of December 31, 2018
24

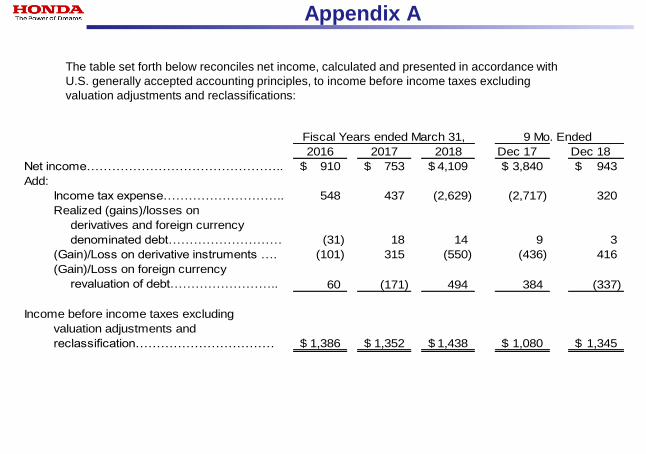
Appendix A
The table set forth below reconciles net income, calculated and presented in accordance with
U.S. generally accepted accounting principles, to income before income taxes excluding
valuation adjustments and reclassifications:
2016 2017 2018 Dec 17 Dec 18
Net income……………………………………….. 910$ 753$ 4,109$ 3,840$ 943$
Add:
Income tax expense……………………….. 548 437 (2,629) (2,717) 320
Realized (gains)/losses on
derivatives and foreign currency
denominated debt……………………… (31) 18 14 9 3
(Gain)/Loss on derivative instruments …. (101) 315 (550) (436) 416
(Gain)/Loss on foreign currency
revaluation of debt…………………….. 60 (171) 494 384 (337)
Income before income taxes excluding
valuation adjustments and
reclassification…………………………… 1,386$ 1,352$ 1,438$ 1,080$ 1,345$
Fiscal Years ended March 31, 9 Mo. Ended