Embed Size (px)
Citation preview
UNITED STATES
SECURITIES AND EXCHANGE COMMISSION WASHINGTON, D.C. 20549
FORM 10-K
(Mark One)
ANNUAL REPORT PURSUANT TO SECTION 13 OR 15(d) OF THE SECURITIES EXCHANGE ACT OF 1934
For the fiscal year ended March 31, 2015
OR
TRANSITION REPORT PURSUANT TO SECTION 13 OR 15(d) OF THE SECURITIES EXCHANGE ACT OF 1934
For the transition period from to
Commission File Number 001-36111
AMERICAN HONDA FINANCE CORPORATION (Exact name of registrant as specified in its charter)
California 95-3472715 (State or other jurisdiction of incorporation or organization) (IRS Employer Identification No.)
20800 Madrona Avenue, Torrance, California 90503 (Address of principal executive offices) (Zip Code)
(310) 972-2555
(Registrant’s telephone number, including area code)
Securities registered pursuant to Section 12(b) of the Act:
Title of each class Name of each exchange on which registered
2.125% Medium-Term Notes, Series A
Due October 10, 2018
New York Stock Exchange
Securities registered pursuant to Section 12(g) of the Act: None
Indicate by check mark if the registrant is a well-known seasoned issuer, as defined in Rule 405 of the Securities Act. Yes No
Indicate by check mark if the registrant is not required to file reports pursuant to Section 13 or Section 15(d) of the Act. Yes No
Indicate by check mark whether the registrant (1) has filed all reports required to be filed by Section 13 or 15(d) of the Securities Exchange
Act of 1934 during the preceding 12 months (or for such shorter period that the registrant was required to file such reports), and (2) has been subject
to such filing requirements for the past 90 days. Yes No
Indicate by check mark whether the registrant has submitted electronically and posted on its corporate Web site, if any, every Interactive Data
File required to be submitted and posted pursuant to Rule 405 of Regulation S-T (§232.405 of this chapter) during the preceding 12 months (or for
such shorter period that the registrant was required to submit and post such files). Yes No
Indicate by check mark if disclosure of delinquent filers pursuant to Item 405 of Regulation S-K (§229.405 of this chapter) is not contained
herein, and will not be contained, to the best of registrant’s knowledge, in definitive proxy or information statements incorporated by reference in
Part III of this Form 10-K or any amendment of this Form 10-K.
Indicate by check mark whether the registrant is a large accelerated filer, an accelerated filer, a non-accelerated filer, or a smaller reporting
company. See the definitions of “large accelerated filer,” “accelerated filer,” and “smaller reporting company” in Rule 12b-2 of the Exchange Act.
Large accelerated filer Accelerated filer Non-accelerated filer (Do not check if a smaller reporting company) Smaller reporting company
Indicate by check mark whether the registrant is a shell company (as defined in Rule 12b-2 of the Exchange Act). Yes No
As of May 31, 2015, the number of outstanding shares of common stock of the registrant was 13,660,000 all of which shares were held by
American Honda Motor Co., Inc. None of the shares are publicly traded.
Documents incorporated by reference: None
REDUCED DISCLOSURE FORMAT
American Honda Finance Corporation, a wholly owned subsidiary of American Honda Motor Co., Inc., which in turn is a wholly owned
subsidiary of Honda Motor Co., Ltd., meets the requirements set forth in General Instruction I(1)(a) and (b) of Form 10-K and is therefore filing this
Form with the reduced disclosure format.
i
AMERICAN HONDA FINANCE CORPORATION
ANNUAL REPORT ON FORM 10-K
For the fiscal year ended March 31, 2015
Table of Contents Page
PART I 1
Item 1. Business ..................................................................................................................................................................................... 1
Item 1A. Risk Factors ............................................................................................................................................................................... 11
Item 1B. Unresolved Staff Comments ...................................................................................................................................................... 17
Item 2. Properties ................................................................................................................................................................................... 17
Item 3. Legal Proceedings ..................................................................................................................................................................... 17
Item 4. Mine Safety Disclosures ............................................................................................................................................................ 17
PART II 18
Item 5. Market for Registrant’s Common Equity, Related Stockholder Matters and Issuer Purchases of Equity Securities ................. 18
Item 6. Selected Financial Data ............................................................................................................................................................. 19
Item 7. Management’s Discussion and Analysis of Financial Condition and Results of Operations..................................................... 21
Item 7A. Quantitative and Qualitative Disclosures About Market Risk ................................................................................................... 39
Item 8. Financial Statements and Supplementary Data .......................................................................................................................... 40
Item 9. Changes in and Disagreements with Accountants on Accounting and Financial Disclosure .................................................... 41
Item 9A. Controls and Procedures ............................................................................................................................................................ 41
Item 9B. Other Information ...................................................................................................................................................................... 41
PART III 42
Item 10. Directors, Executive Officers and Corporate Governance ......................................................................................................... 42
Item 11. Executive Compensation ........................................................................................................................................................... 42
Item 12. Security Ownership of Certain Beneficial Owners and Management and Related Stockholder Matters .................................. 42
Item 13. Certain Relationships and Related Transactions, and Director Independence ........................................................................... 42
Item 14. Principal Accounting Fees and Services .................................................................................................................................... 42
PART IV 43
Item 15. Exhibits, Financial Statement Schedules ................................................................................................................................... 43
Signatures ....................................................................................................................................................................................................... 44
Index to Financial Statements ......................................................................................................................................................................... F-1
Exhibit Index .................................................................................................................................................................................................. E-1
ii
Cautionary Statement Regarding Forward-Looking Statements
Certain statements included herein constitute “forward-looking statements” within the meaning of the Private Securities Litigation
Reform Act of 1995 that involve a number of risks and uncertainties. Certain such forward-looking statements can be identified by the
use of forward-looking terminology such as “believes,” “expects,” “may,” “will,” “should,” “seeks,” “scheduled,” or “anticipates” or
similar expressions or the negative thereof or other variations thereof or comparable terminology, or by discussions of strategy, plans,
or intentions. In addition, all information included herein with respect to projected or future results of operations, cash flows, financial
condition, financial performance, or other financial or statistical matters constitute forward-looking statements. Such forward-looking
statements are necessarily dependent on assumptions, data, or methods that may be incorrect or imprecise and that may be incapable
of being realized. The following factors, among others, could cause actual results and other matters to differ materially from those in
such forward-looking statements:
declines in the financial condition or performance of Honda Motor Co., Ltd. and/or the sales of Honda or Acura products;
changes in general business and economic conditions;
fluctuations in interest rates and currency exchange rates;
the failure of our customers, dealers or counterparties in the financial industry to meet the terms of any contracts with us,
or otherwise fail to perform as agreed;
our inability to recover the estimated residual value of vehicles at the end of their lease terms;
changes or disruption in our funding sources or access to the capital markets;
changes in our, or Honda Motor Co., Ltd.’s, credit ratings;
increases in competition from other financial institutions seeking to increase their share of financing of Honda and Acura
products;
changes in laws and regulations and related costs;
changes in accounting standards;
a failure or interruption in our operations; and
the other risks and uncertainties set forth in “Part I, Item 1A. Risk Factors”.
We do not intend, and undertake no obligation to, update any forward-looking information to reflect actual results or future events or
circumstances, except as required by applicable law.
1
PART I
Item 1. Business
Overview
American Honda Finance Corporation (AHFC) is a California corporation that was incorporated on February 6, 1980. Unless
otherwise indicated by the context, all references to the “Company”, “we”, “us”, and “our” in this report include AHFC and our
consolidated subsidiaries, and references to “AHFC” refer solely to American Honda Finance Corporation (excluding our
subsidiaries). AHFC is a wholly owned subsidiary of American Honda Motor Co., Inc. (AHM). Honda Canada Finance Inc. (HCFI) is
a majority-owned subsidiary of AHFC. Noncontrolling interest in HCFI is held by Honda Canada Inc. (HCI), an affiliate. AHM is a
wholly owned subsidiary and HCI is an indirect wholly owned subsidiary of Honda Motor Co., Ltd. (HMC). AHM and HCI are the
sole authorized distributors of Honda and Acura products, including motor vehicles, parts, and accessories in the United States and
Canada. AHFC’s principal executive offices are located at 20800 Madrona Avenue, Torrance, California 90503.
We provide various forms of financing in the United States and Canada to purchasers and lessees of Honda and Acura products and
authorized independent dealers of Honda and Acura products. Our primary focus, in collaboration with AHM and HCI, is to provide
support for the sale of Honda and Acura products in the United States and Canada and maintain customer and dealer satisfaction and
loyalty. Our business is substantially dependent upon the sale of those Honda and Acura products in the United States and Canada and
the percentage of those sales financed by us.
We acquire retail loans, primarily installment sale contracts, and leases made to retail customers of Honda and Acura products and we
offer wholesale flooring and commercial loans to authorized dealers of Honda and Acura products. A small portion of our business
also consists of acquiring financings of non-Honda and non-Acura used automobiles and providing wholesale loans to non-Honda and
non-Acura dealerships.
AHM and HCI sponsor incentive financing programs in the United States and Canada, respectively. These programs offer promotional
rates on loans and leases to purchasers, lessees, and authorized dealers of Honda and Acura products. AHM or HCI, as applicable,
pays us a subsidy that enables us to realize a market yield on any financing contract we indirectly or directly finance under these
programs.
We acquire and offer, as applicable, substantially similar products and services throughout many different regions, provinces, and
territories, subject to local legal restrictions and market conditions. We divide our business segments between our business in the
United States and in Canada. For additional financial information regarding our operations by business segments, see Note 15—
Segment Information of Notes to Consolidated Financial Statements and “Part II, Item 7. Management’s Discussion and Analysis of
Financial Condition and Results of Operations—Overview.” In the United States and Canada, we provide our financing products
under the brand names Honda Financial Services and Acura Financial Services.
References to “C$” are to the Canadian dollar. This report contains translations of certain Canadian dollar amounts into U.S. dollars at
the rate specified below solely for your convenience. These translations should not be construed as representations that the Canadian
dollar amounts actually represent such U.S. dollar amounts or that they could be converted into U.S. dollars at the rate indicated. U.S.
dollar equivalents for “C$” amounts are calculated based on an exchange rate of 1.2686 per U.S. dollar as of March 31, 2015.
Public Filings
Our filings with the Securities and Exchange Commission (SEC) may be found by accessing the SEC website at www.sec.gov under
“Company Filings”. The SEC website contains reports, registration statements, and other information regarding issuers that file
electronically with the SEC. The public may obtain additional information by calling the “SEC Toll-Free Investor Information Service”
line at 1-800-SEC-0330 (1-800-732-0330). A direct link to the SEC website and certain of our filings is contained on our website
located at www.hondafinancialservices.com under “Investor Relations, SEC Filings”. Additionally, we have made available on our
website, without charge, electronic copies of our periodic and current reports that have been filed with the SEC.
Investors and others should note that we announce material financial information using the investor relations section of our corporate
website (http://www.hondafinancialservices.com). We use our website and press releases to communicate with our investors,
customers and the general public about our company, our services and other matters. While not all of the information that we post on
our website is of a material nature, some information could be material. Therefore, we encourage investors, the media, and others
interested in our company to review the information we post on the investor relations section of our website. Currently, we do not use
any social media channels for purposes of communicating with the public. Any changes to our communication channels will be posted
on the investor relations website. We are not incorporating any of the information set forth on our website into this filing on Form 10-
K.
2
Consumer Financing
Retail Loans
We provide indirect financing to retail customers of Honda and Acura products by acquiring retail loans originated by authorized
Honda and Acura dealers. Retail loans are acquired in accordance with our underwriting standards. See “—Underwriting and Pricing
of Consumer Financing” below for a description of our underwriting process. The products that we finance consist primarily of new
and used Honda and Acura automobiles and Honda motorcycles, power equipment, and marine engines. On a limited basis, we also
finance customer purchases of non-Honda and non-Acura used automobiles. Retail loans may also include the financing of insurance
products or Vehicle Service Contracts. See “—Other Consumer Products” below for more information. The terms of retail loans
originated in the United States generally range from 24 to 72 months while the terms of retail loans originated in Canada generally
range from 24 to 84 months.
We service all of the retail loans we acquire. We generally hold a security interest in the products purchased through our retail loans.
As a result, if our collection efforts fail to bring a delinquent customer’s payments current, we generally can repossess the customer’s
vehicle, after satisfying local legal requirements, and sell it at auction. We may waive late payment fees and other fees assessed in the
ordinary course of servicing the retail loans and allow payment deferrals by extending the loan’s term. See “—Servicing of Consumer
Financing” below for more information.
We require customers that purchase Honda and Acura products through retail loans acquired by us to obtain adequate physical
damage, comprehensive and collision insurance.
Retail Leases
We acquire closed-end vehicle lease contracts between authorized Honda and Acura dealers and their customers primarily for leases
of new Honda and Acura automobiles. On a limited basis, we also acquire lease contracts for leases of used Honda and Acura
automobiles and Honda motorcycles. In the case of leases originating in the United States, upon our acquisition of such leases, the
dealer assigns all of its rights, title, and interest in the lease and the automobile to either our wholly owned subsidiary, Honda Lease
Trust (HLT) or its trustee, HVT, Inc. (HVT), depending on the applicable state. HLT is a trust established to take assignments of and
serve as holder of legal title to leased automobiles. In the case of leases originating in Canada, upon our acquisition of such leases, the
dealer assigns all of its rights, title, and interest in the lease and the vehicle to our majority owned subsidiary HCFI.
Leases are acquired in accordance with our underwriting standards. See “—Underwriting and Pricing of Consumer Financing” below
for a description of our underwriting process. Terms of the leases generally range from 24 to 60 months. We service the leases we
acquire. We may waive late payment fees and other fees assessed in the ordinary course of servicing the leases, extend the lease term,
or offer end-of-lease incentives. See “—Servicing of Consumer Financing” below for more information.
At the end of the lease term, customers of leased vehicles have an option to return the vehicle or to purchase the vehicle for the
contractual residual value (or if purchased prior to lease maturity, for the outstanding contractual balance). We estimate the contractual
residual values of the leased vehicle at inception of the lease based on a number of factors including external industry data and our
own historical experience, which factors include, without limitation, expected economic conditions, historical trends and market
information on new and used vehicles. If the customer returns the vehicle to the dealer, the dealer may buy the vehicle from us or
return it to us. See “—Servicing of Consumer Financing—Remarketing Center” below.
We require the lessee to obtain insurance with adequate public liability and physical damage coverage for the entire lease term.
Underwriting and Pricing of Consumer Financing
Dealers submit customer credit applications electronically through our online system. In addition, customers are able to submit their
own credit applications for pre-approval directly through our website. If our requirements are met, an application received from a
dealer is approved automatically. Our system is programmed to review application information for purchase policy and legal
compliance. Applications that are not automatically approved are routed to credit buyers located in our regional offices, who will
evaluate and make purchase decisions within the framework of our purchase policy and legal requirements.
3
We utilize our proprietary credit scoring system to evaluate the credit risk of applicants. Factors used by our credit scoring system to
develop a customer’s credit grade include the term of the contract, the loan or lease-to-value ratio, the customer’s debt ratios, and
credit bureau attributes, number of trade lines, utilization ratio, and number of credit inquiries. A customer’s credit grade is
determined only at the time of origination and is not reassessed during the life of the contract. We utilize different scorecards
depending on the type of product we finance and we regularly review and analyze our consumer financing portfolio to evaluate the
effectiveness of our underwriting guidelines, purchasing criteria and scorecard predictability of our customers.
In the United States, AHFC utilizes a tiered pricing structure based on customer Fair Isaac Corporation (FICO) scores. In Canada,
HCFI has a single tiered pricing structure.
Servicing of Consumer Financing
We have eight regional offices in the United States that are responsible for the acquisition, servicing, collection, and customer service
activities related to our automobile retail loans and leases. These offices are located in California, Texas, Massachusetts, Illinois,
North Carolina, Delaware, and Georgia. We also have one office in Georgia that is responsible for the underwriting of motorcycle,
power equipment, and marine engine loans, customer service related to those contracts and collection efforts for past due accounts on
a national basis.
In addition to our servicing regions, we have centralized certain operational functions in the United States relating to our automobile
retail loans and leases at the National Service Center located in Texas, which contains our National Processing Center, Lease Maturity
Center, Remarketing Center, National Recovery Center, and National Bankruptcy Center which are described below:
National Processing Center. The National Processing Center is responsible for processing customer payments that cannot
be processed through our automated servicing system, providing service to our Regional Offices and other services.
Lease Maturity Center. Lease accounts are transferred from our regional offices to the Lease Maturity Center six months
prior to the end of the lease term. The Lease Maturity Center assumes responsibility for servicing the lease from this time,
including providing the leaseholder with end of term options, responding to customer service issues and coordinating end
of term vehicle inspections. Once a vehicle is returned to us, the Lease Maturity Center transfers the account to the
Remarketing Center to arrange for the disposition of the vehicle.
Remarketing Center. The Remarketing Center oversees the disposition of vehicles returned at the end of leases and after
repossession. In order to minimize losses at lease maturity, we have developed remarketing strategies to maximize
proceeds and minimize disposition costs on vehicles sold at lease termination. We use various channels to sell vehicles
returned at lease end, including a dealer direct program referred to as the Vehicle Inter-Dealer Purchase System (VIPS)
and physical auctions. The goal of our VIPS program is to increase vehicle dealer purchases of off-lease vehicles thereby
reducing our disposition costs of such vehicles. Through VIPS, the dealer accepting return of the leased vehicle (also
referred to as the grounding dealer) initially has the exclusive right to purchase the vehicle at the contractual residual value
or a market based price. If the grounding dealer does not purchase the vehicle, it then becomes available to Honda and
Acura vehicle dealers through the VIPS online auction. If the vehicle is not sold to a Honda or Acura dealer, the auction is
opened to any dealer. Off-lease vehicles that are not purchased through a VIPS online auction and all repossessed vehicles
are sold at physical auction sites throughout the United States. When deemed necessary, we recondition used vehicles
prior to sale in order to enhance the vehicle values at auction. Additionally, vehicles to be sold at public auctions may be
relocated in accordance with our goal to minimize oversupply at any given location.
National Recovery Center. The National Recovery Center is responsible for collecting the deficiency balances of charged-
off accounts through the use of outside collection agencies, locating and securing the collateral of charged-off accounts,
and collecting lease end of term fees. Consumer financing contracts are transferred from our regional offices to the
National Recovery Center after charge-off which occurs when they become 120 days contractually past due, payments due
are no longer expected to be received, or the underlying product is sold or has been held in unsold repossessed inventory
for 90 days, whichever occurs first.
National Bankruptcy Center. Accounts subject to bankruptcy proceedings are assigned to the National Bankruptcy Center
for tracking, monitoring and handling through the life of the loan or until the related customer is discharged from
bankruptcy. If the customer is discharged or dismissed from bankruptcy, the account will return to the original regional
office for servicing.
4
In Canada, we have two regional offices that are responsible for acquisition, servicing, collection, and customer service activities
related to our retail loans and leases. These offices are located in Quebec and Ontario. Similar to our United States operations, in
addition to our servicing regions, we have centralized certain operational functions for our Canadian retail loans and leases. These
centralized functions are located in Ontario and include our Lease Maturity Centre, Recovery Centre, Collections Centre, Customer
Service Centre, and Auctions/Remarketing Centre. The services provided by these centralized functions are comparable to the services
provided by our National Service Center in the United States.
Recovery Policies and Procedures
We use a servicing system and an automated dialer system that prioritize collection efforts, generate past due notices, and signal our
collections personnel to make telephone contact with delinquent customers. For the purposes of determining whether a retail loan or
lease is delinquent, payment is generally considered to have been made upon receipt of 90% of the sum of the current monthly
payment due plus any overdue monthly payments.
If necessary, repossession action is taken through the use of bonded and licensed repossession agencies. Subject to recording, filing,
and notice requirements of state, or other laws, we are generally permitted by applicable state law to repossess automobiles or
motorcycles upon default by the related customer. We typically decide whether or not to repossess a vehicle when the account is 45 to
60 or more days past due, subject to the laws and regulations governing repossession in the state where the automobile or motorcycle
is located.
Incentive Financing Programs for Retail Loans and Leases
AHM and HCI sponsor incentive financing programs in the United States and Canada, respectively. These programs offer promotional
rates on retail loans and leases to purchasers and lessees of Honda and Acura products. AHM or HCI, as applicable, pays us a subsidy
that enables us to realize a market yield on any financing contract we indirectly finance under these programs. Market yield is based
on, among other things, the credit quality of the customer and the length of the contract. Subsidy payments received on retail loans and
leases are deferred and recognized as revenue over the term of the related contracts. The volume of incentive financing programs
sponsored by AHM and HCI and the allocation of those programs between retail loans and leases may vary from fiscal period to fiscal
period depending upon the respective marketing strategies of AHM and HCI. AHM and HCI’s marketing strategies are based in part
on their business planning, in which we do not participate. Therefore we cannot predict the level of incentive financing programs
AHM and HCI may sponsor in the future. See “Part II, Item 7. Management’s Discussion and Analysis of Financial Condition and
Results of Operations—Overview.”
Other Consumer Products
Vehicle Service Contracts
AHFC administers vehicle service contracts issued by AHM and American Honda Protection Products Corporation (AHPPC), a
wholly owned subsidiary of AHM. HCFI performs marketing services for vehicle service contracts issued by HCI.
A vehicle service contract is a contractual agreement between the dealer, manufacturer or an independent third party, and the dealer’s
customer. The contract provides for certain repairs, mechanical breakdown coverage, roadside assistance, and/or oil changes for the
customer’s new or used automobile. A vehicle service contract can be obtained on both Honda and Acura automobiles.
As the administrator, we approve claims and provide customer service to purchasers of vehicle service contracts. We receive fees to
perform administrative and marketing services for AHM, AHPPC, or HCI, as applicable. We do not provide the maintenance or
roadside assistance provided by the vehicle service contracts.
Honda Aviation
Honda Aviation Finance Company LLC, a wholly owned subsidiary of AHFC, was established to provide financing and account
servicing for customers of Honda Aircraft Company LLC, a subsidiary of AHM, in the United States. Customers submit a credit
application and if our underwriting policies and legal requirements are met, the retail loan is approved.
5
Dealer Financing
Wholesale Flooring Loans
We provide wholesale flooring loans to dealers of Honda and Acura automobiles and Honda motorcycles, power equipment, and
marine engines through our Dealer Financial Services (DFS) business unit. In the United States, wholesale flooring loans are also
provided on a limited basis to non-Honda and non-Acura automobile dealerships whose ownership is directly affiliated with a Honda
and/or Acura dealership or to multi-brand dealer organizations.
Wholesale flooring financing is available primarily through revolving lines of credit and may only be used by dealers to finance the
purchase of inventory. AHFC will finance new automobiles and motorcycles up to 100% of the dealer invoice price and used
automobiles and motorcycles up to 80% of the applicable market value determined in accordance with industry pricing guides in the
United States. HCFI will finance new automobiles and motorcycles up to 100% of the dealer invoice price and used automobiles and
motorcycles up to the current market value determined in accordance with industry pricing guides in Canada. Dealers pay a variable
interest rate on wholesale flooring loans. Wholesale flooring loans must be prepaid at specified intervals and increments and generally
must be paid in full upon the sale of the product, although a grace period of three to seven days for payment may be provided to
dealers. AHM and HCI sponsor incentive financing programs in the United States and Canada, respectively, to Honda and Acura
authorized dealers approved for wholesale flooring loans.
In establishing a wholesale flooring loan, we conduct a comprehensive review of the dealership, including a review of its business
operations and management, any credit reports, financial statements, tax returns, bank references, and/or other available historical
credit information and a review of the personal financial statements of the dealership’s individual owner(s). This data is organized into
an electronic scorecard which supports our determination of whether we will provide a wholesale flooring loan and, if so, the amount
of the loan and the interest rate. Once a wholesale flooring loan has been approved, we maintain an ongoing review process of the
dealerships we finance, which we believe is consistent with industry practice. Dealers of Honda and Acura automobiles are required to
submit financial statements on a monthly basis and dealers of Honda motorcycles, power equipment, and marine engines are required
to submit financial statements annually. We typically use a third party to perform random periodic on-site physical inspections of
financed dealership inventory at a frequency determined by the dealership’s scorecard, which is updated through the term of the loan,
and financial performance. Monitoring activities are performed more frequently for dealerships with higher levels of credit risk.
We seek to retain a purchase money security interest in all products that are financed pursuant to wholesale flooring loan agreements
we enter into with dealers. In addition, we generally secure wholesale flooring loans with liens on the dealership’s other assets and
obtain a personal guarantee from dealership owners, as well as corporate guarantees from, or on behalf of, dealership owner(s)’ other
dealerships. Although the loans are typically collateralized or guaranteed, the value of the underlying collateral or guarantees may not
be sufficient to cover our exposure under such agreements. We require dealerships to maintain insurance on all inventory, including
peril coverage for flood, hail, wind, false pretense, liability, earthquake, vandalism, and other risks.
In the event of a default on a wholesale flooring loan, we may repossess the financed product and sell the repossessed assets and seek
other available legal remedies pursuant to the related wholesale flooring loan agreement and related guarantees consistent with
commercially accepted practices and applicable laws. We have no right, however, to recover a Honda or Acura product sold by a
dealer to a buyer in the ordinary course of business and are limited after sales to the remedies under our wholesale flooring loan
agreement with the dealer. Additionally, we have entered into agreements with AHM and HCI that provide for the repurchase of any
new, unused, undamaged, and unregistered vehicle or equipment repossessed by us from a dealer in the United States and Canada,
respectively, who defaulted under the terms of its wholesale flooring agreement with us at the net cost of the financing we provided.
A wholesale flooring loan is considered delinquent when any payment is contractually past due. Depending on a dealer’s level of
credit risk, a dealer may be given a grace period of three to seven days to make payments. Collection efforts are initiated through the
use of our staff. We file replevin actions, send past due notices, enter into forbearance agreements, and renegotiate contracts with
delinquent dealers. If we determine a dealer cannot meet the obligations under its wholesale flooring loan agreement, legal action may
commence. Subject to recording, filing and notice requirements of state, provincial or other laws we are generally permitted by the
applicable laws to repossess the underlying collateral that have not been sold to a buyer in the ordinary course of business.
In the United States, wholesale flooring loans are approved through our headquarters in Torrance, California, and serviced through our
regional offices in California, Texas, Massachusetts, Illinois, North Carolina, Delaware, and Georgia. Wholesale flooring loans for
Honda and Acura dealerships in Canada are approved and serviced at HCFI’s headquarters in Ontario.
6
Commercial Loans
We provide commercial loans to Honda and Acura automobile dealers through our DFS business unit. This commercial financing is
available primarily through term loans and are used primarily for financing dealership property, equipment, construction, facility
improvements, and working capital. Dealers generally pay a variable interest rate on commercial loans in the United States. In
Canada, dealers pay both fixed rates and variable rates on commercial loans.
In establishing a commercial loan, we conduct a comprehensive review of the dealership, including a review of its business operations
and management, appraisals of dealership property, credit reports, financial statements, tax returns, bank references, and/or other
available historical credit information and a review of the personal financial statements of the dealership’s individual owner(s). Once
the loan has been approved, we maintain an ongoing review process of the dealership we finance, which we believe is consistent with
industry practices.
Commercial loans are generally secured by the associated properties, inventory, and other dealership assets. In addition, we generally
obtain a personal guarantee from dealership owners, as well as corporate guarantees from, or on behalf of, dealership individual
owner(s)’ other dealerships. Although our commercial loans are typically collateralized or guaranteed, the value of the underlying
collateral or guarantees may not be sufficient to cover our exposure. Commercial loans are considered delinquent when any payment
is contractually past due.
In the United States, DFS also utilizes DFNET to administer its portfolio of commercial loans. Commercial loans are originated
through our headquarters in California and serviced through our regional offices in California, Texas, Massachusetts, Illinois, North
Carolina, Delaware, and Georgia. In Canada, commercial loans are originated and administered at HCFI’s headquarters in Ontario and
serviced through a proprietary standalone system.
Competition
The automobile financing industry in the United States and Canada is very competitive. Providers of vehicle and similar product
financing have traditionally competed on the basis of interest rates charged, the quality of credit accepted, the flexibility of loan terms
offered, the quality of service provided to dealers and customers, and the strength of dealer relationships.
National and regional commercial banks, credit unions, savings and loan associations, finance companies, and other captive finance
companies provide consumer financing for new and used Honda and Acura automobiles and parts and accessories and Honda
motorcycles, power equipment, and marine engines. Commercial banks, finance companies, and captive finance companies of other
manufacturers also provide inventory financing for Honda and Acura dealers. Our primary competition in the wholesale motorcycle,
power equipment, and marine engine financing business tends to be local banks and specialty finance firms that are familiar with the
particular characteristics of these businesses.
The automobile finance industry in Canada is becoming increasingly more competitive. In particular, Canadian commercial banks
have become stronger competitors in the automobile consumer financing business.
Relationships with HMC and Other Affiliates
The following is a description of certain relationships with HMC and other affiliates.
HMC and AHFC Keep Well Agreement
HMC and AHFC are parties to a keep well agreement (the HMC-AHFC Agreement), which became effective on September 9, 2005.
Under the terms of the HMC-AHFC Agreement, HMC has agreed to:
own and hold, at all times, directly or indirectly, at least 80% of AHFC’s issued and outstanding shares of voting stock
and not pledge, directly or indirectly, encumber, or otherwise dispose of any such shares or permit any of HMC’s
subsidiaries to do so, except to HMC or wholly owned subsidiaries of HMC;
cause AHFC to, on the last day of each of AHFC’s fiscal years, have a positive consolidated tangible net worth (with
“tangible net worth” for purposes of this discussion of the HMC-AHFC Agreement understood to mean (a) shareholders’
equity less (b) any intangible assets, as determined in accordance with U.S. generally accepted accounting principles
(GAAP)); and
7
ensure that, at all times, AHFC has sufficient liquidity and funds to meet its payment obligations under any Debt (with
“Debt” for purposes of this discussion of the HMC-AHFC Agreement defined as AHFC’s debt for borrowed money that
HMC has confirmed in writing is covered by the HMC-AHFC Agreement) in accordance with the terms of such Debt, or
where necessary, HMC will make available to AHFC, or HMC will procure for AHFC, sufficient funds to enable AHFC
to pay its Debt in accordance with its terms.
The HMC-AHFC Agreement is not a guarantee by HMC of any Debt or other obligation, indebtedness, or liability of any kind of
AHFC.
The HMC-AHFC Agreement includes AHFC’s agreement that it will use any funds made available to it by HMC thereunder solely for
fulfilling AHFC’s payment obligations in respect of Debt. Any claims of HMC arising from any provisions of funds to AHFC by
HMC shall be subordinated to the claims of all holders of Debt with respect to such Debt, whether or not such claims exist at the time
such funds are made available to AHFC, and HMC will not demand payment of such claims from AHFC unless and until all
outstanding Debt has been paid in full.
HMC or AHFC may each terminate the HMC-AHFC Agreement upon giving to the other party 30 days’ prior written notice and the
HMC-AHFC Agreement may be modified or amended only by the written agreement of HMC and AHFC and upon 30 days’ prior
written notice to each rating agency rating any covered Debt. However, such termination, modification, or amendment will not be
effective with respect to any Debt outstanding at the time of such termination, modification, or amendment unless: (i) such
termination, modification, or amendment is permitted under the documentation governing such Debt, (ii) all affected holders of such
Debt (or, in the case of Debt incurred pursuant to documentation that permits the HMC-AHFC Agreement to be terminated, modified,
or amended with the consent of less than all of the holders of such Debt, the requisite holders of such Debt) otherwise consent in
writing, or (iii) with respect to Debt that is rated by one or more rating agencies at the request of HMC or AHFC, each such rating
agency confirms in writing that the rating assigned to such Debt will not be withdrawn or reduced because of the proposed action.
An amendment, modification, or termination of the HMC-AHFC Agreement (except as permitted by its terms) would constitute an
event of default under certain of AHFC’s Debt and failure by HMC to meet its obligations under the HMC-AHFC Agreement would
constitute an event of default under such Debt if the failure continued for 30 days and was continuing at the time the default was
declared.
Under its terms, the HMC-AHFC Agreement is not enforceable against HMC by anyone other than: (i) AHFC or (ii) if any case is
commenced under the United States Bankruptcy Code (11 USC §§101 et seq.), or any successor statutory provisions, or the
Bankruptcy Code, in respect of AHFC, the debtor in possession or trustee appointed by the court having jurisdiction over such
proceeding. In the event of (1) a breach by HMC in performing a provision of the HMC-AHFC Agreement and (2) the commencement
of such a case under the Bankruptcy Code in respect of AHFC while any Debt is outstanding, the remedies of a holder of Debt shall
include the right, if no proceeding in respect of AHFC has already been commenced in such case, to file a petition in respect of AHFC
thereunder with a view to the debtor in possession, or the trustee appointed by the court having jurisdiction over such proceeding,
pursuing AHFC’s rights under the HMC-AHFC Agreement against HMC. However, all holders of outstanding Debt may (i) demand
in writing that AHFC enforce its rights under the HMC-AHFC Agreement and (ii) proceed directly against HMC to enforce
compliance by HMC with its obligations under the HMC-AHFC Agreement if AHFC fails or refuses to take action to enforce its
rights under that agreement within 30 days following AHFC’s receipt of demand for such enforcement by such holder.
The HMC-AHFC Agreement is governed by and construed in accordance with the laws of the State of New York.
HMC and HCFI Keep Well Agreement
HMC and HCFI are parties to a keep well agreement (the HMC-HCFI Agreement), which became effective on September 26, 2005.
Under the terms of the HMC-HCFI Agreement, HMC has agreed to:
own and hold, at all times, directly or indirectly, at least 80% of HCFI’s issued and outstanding shares of voting stock and
not pledge, directly or indirectly, encumber, or otherwise dispose of any such shares or permit any of HMC’s subsidiaries
to do so, except to HMC or wholly owned subsidiaries of HMC;
cause HCFI to, on the last day of each of HCFI’s fiscal years, have a positive consolidated tangible net worth (with
“tangible net worth” for purposes of this discussion of the HMC-HCFI Agreement understood to mean (a) shareholders’
equity less (b) any intangible assets, as determined in accordance with generally accepted accounting principles in
Canada); and
8
ensure that, at all times, HCFI has sufficient liquidity and funds to meet its payment obligations under any Debt (with
“Debt” for purposes of this discussion of the HMC-HCFI Agreement defined as HCFI’s debt for borrowed money that
HMC has confirmed in writing is covered by the HMC-HCFI Agreement) in accordance with the terms of such Debt, or
where necessary, HMC will make available to HCFI, or HMC will procure for HCFI, sufficient funds to enable HCFI to
pay its Debt in accordance with its terms.
The HMC-HCFI Agreement is not a guarantee by HMC of any Debt or other obligation, indebtedness, or liability of any kind of
HCFI.
The HMC-HCFI Agreement includes HCFI’s agreement that it will use any funds made available to it by HMC thereunder solely for
the purposes of fulfilling HCFI’s payment obligations in respect of Debt. Any claims of HMC arising from any provisions of funds to
HCFI by HMC shall be subordinated to the claims of all holders of Debt with respect to such Debt, whether or not such claims exist at
the time such funds are made available to HCFI, and HMC will not demand payment of such claims from HCFI unless and until all
outstanding Debt has been paid in full.
HMC or HCFI may each terminate the HMC-HCFI Agreement upon giving to the other party 30 days’ prior written notice and the
HMC-HCFI Agreement may be modified or amended only by the written agreement of HMC and HCFI and upon 30 days’ prior
written notice to each rating agency rating any covered Debt. However, such termination, modification, or amendment will not be
effective with respect to any Debt outstanding at the time of such termination, modification, or amendment unless: (i) such
termination, modification, or amendment is permitted under the documentation governing such Debt, (ii) all affected holders of such
Debt (or, in the case of Debt incurred pursuant to documentation that permits the HMC-HCFI Agreement to be terminated, modified,
or amended with the consent of less than all of the holders of such Debt, the requisite holders of such Debt) otherwise consent in
writing, or (iii) with respect to Debt that is rated by one or more rating agencies at the request of HMC or HCFI, each such rating
agency confirms in writing that the rating assigned to such Debt will not be withdrawn or reduced because of the proposed action.
An amendment, modification, or termination of the HMC-HCFI Agreement (except as permitted by its terms) would constitute an
event of default under certain of HCFI’s Debt and failure by HMC to meet its obligations under the HMC-HCFI Agreement would
constitute an event of default under such Debt if the failure continued for 30 days and was continuing at the time the default was
declared.
Under its terms, the HMC-HCFI Agreement is not enforceable against HMC by anyone other than: (i) HCFI or (ii) if any case is
commenced under the Canadian Bankruptcy and Insolvency Act, the Canadian Companies’ Creditors Arrangement Act, or the
Canadian Winding Up and Restructuring Act by or against HCFI, the debtor in possession or trustee or receiver appointed by the court
having jurisdiction over such proceeding. In the event of (1) a breach by HMC in performing a provision of the HMC-HCFI
Agreement and (2) the insolvency of HCFI while any Debt is outstanding, the remedies of a holder of Debt shall include the right, if
no proceeding in respect of HCFI has already been commenced in such proceeding, to file an application in respect of HCFI for the
appointment of a trustee or receiver by the court having jurisdiction over such proceeding in order to pursue HFCI’s rights under the
HMC-HCFI Agreement against HMC. However, all holders of outstanding Debt may (i) demand in writing that HCFI enforce its
rights under the HMC-HCFI Agreement and (ii) proceed directly against HMC to enforce compliance by HMC with its obligations
under the HMC-HCFI Agreement if HCFI fails or refuses to take action to enforce its rights under that agreement within 30 days
following HCFI’s receipt of demand for such enforcement by such holder.
The HMC-HCFI Agreement is governed by and construed in accordance with the laws of the State of New York.
Incentive Financing Programs
AHM and HCI sponsor incentive financing programs in the United States and Canada, respectively. These programs offer promotional
rates on loans and leases to purchasers, lessees, and authorized dealers of Honda and Acura products. AHM or HCI, as applicable,
pays us a subsidy that enables us to realize a market yield on any financing contract we indirectly or directly finance under these
programs. These subsidy payments supplement the revenues on our financing products offered under our incentive financing
programs. See “—Consumer Financing—Incentive Financing Programs for Retail Loans and Leases” above for more information.
Related Party Debt
AHFC routinely issues fixed rate short-term notes to AHM to fund AHFC’s general corporate operations. HCFI routinely issues fixed
rate short-term notes to HCI to fund HCFI’s general corporate operations. See Note 4—Debt of Notes to Consolidated Financial
Statements for further information regarding our related party debt.
9
Vehicle Service Contract Administration
We receive fees to perform administrative and marketing services for vehicle service contracts issued by AHM, AHPPC, and HCI. See
“—Consumer Financing—Other Consumer Products—Vehicle Service Contracts” above for more information.
Shared Services
Honda North America, Inc. (HNA), a wholly owned subsidiary of HMC, provides services to Honda’s North American operations.
HNA provides us with legal, internal auditing, information technology, and other services pursuant to a shared services agreement. In
particular, HNA schedules and conducts the audits of our departments, divisions, and offices. HNA is paid a compensation fee for
these services.
We also share certain common expenditures with HCI, including professional services, data processing services, insurance policies,
software development and facilities.
Benefit Plans
Our employees participate in various employee benefit plans that are sponsored by AHM and HCI, respectively. Refer to Note 8—
Benefit Plans of Notes to Consolidated Financial Statements for additional information about employee benefit plans.
Income taxes
AHFC and its United States subsidiaries are included in the consolidated United States federal income tax returns of AHM and many
consolidated or combined state and local income tax returns of AHM. In some cases AHFC and its United States subsidiaries file tax
returns separately as required by certain state and local jurisdictions. AHFC and its United States subsidiaries pay for their share of the
consolidated or combined income tax on a modified separate return basis pursuant to an intercompany tax allocation agreement with
AHM. AHFC and its applicable United States subsidiaries file a separate California return based on California’s worldwide income
and apportionment rules. To the extent AHFC and its United States subsidiaries have taxable losses in AHM’s consolidated federal
and consolidated or combined state and local tax returns, AHM reimburses AHFC and its United States subsidiaries, as applicable, to
the extent the losses are utilized by AHM or another member of the consolidated or combined group under the terms of the
intercompany tax allocation agreement. All but an insignificant amount of the federal and state taxes payable or receivable shown on
the consolidated balance sheets are due to or from AHM, pursuant to the intercompany tax allocation agreement.
The Company’s Canadian subsidiary, HCFI, files Canadian federal and provincial income tax returns based on the separate legal
entity financial statements. HCFI does not file federal, state or local income tax returns in the United States. Consequently, HCFI does
not participate in the intercompany tax allocation agreement that AHFC and its United States subsidiaries have with AHM.
Repurchase Agreements
We have entered into agreements with AHM and HCI that provide for the repurchase of any new, unused, undamaged, and
unregistered vehicles or equipment repossessed by us from dealers in the United States and Canada, respectively, who defaulted under
the terms of its wholesale flooring agreement with us at the net cost of the financing we provided.
Geographic Concentration
As of March 31, 2015, approximately 16% of the outstanding retail loans and leases we acquired in the United States were from
customers residing in California. Any material adverse changes to the economies or applicable laws in these states could have a
material adverse effect on our financial condition and results of operations.
Seasonality
We are subject to seasonal variations in credit losses, which are historically higher in the first and fourth quarters of the calendar year.
This seasonality does not have a significant impact on our results of operations.
Employee Relations
At March 31, 2015, we had 1,369 employees. We consider our employee relations to be satisfactory. We are not subject to any
collective bargaining agreements with our employees.
10
Governmental Regulations
Our consumer financing and dealer financing operations are subject to regulation, supervision, and licensing under various United
States, Canadian, state, provincial, and local statutes, ordinances and regulations. In recent years, regulators have increased their focus
on the regulation of the financial services industry and consumer financing in particular. As a result, there have been and may continue
to be proposals for laws and regulations that could increase the scope and nature of laws and regulations that are currently applicable
to us. We actively monitor proposed changes to relevant legal and regulatory requirements in order to maintain our compliance. The
cost of our ongoing compliance efforts in our consumer financing and dealer financing operations has not had a material adverse effect
on our results of operations, cash flows, or financial condition to date, although future compliance efforts may have such an effect.
United States
Our consumer financing operations in the United States are regulated under both federal and state laws, including consumer protection
statutes and related regulations.
Federal Regulation
We are subject to extensive federal regulation, including the regulations discussed below. These laws, in part, require us to provide
certain disclosures to prospective purchasers and lessees in consumer retail and lease financing transactions and prohibit
discriminatory credit practices.
The Truth in Lending Act and the Consumer Leasing Act place disclosure and substantive transaction restrictions on
consumer credit and leasing transactions.
The Equal Credit Opportunity Act is designed to prevent credit discrimination on the basis of certain protected classes,
requires the distribution of specified credit decision notices and limits the information that may be requested and
considered in a credit transaction.
The Fair Credit Reporting Act imposes restrictions and requirements regarding our use and sharing of credit reports, the
reporting of data to credit reporting agencies, credit decision notices, the accuracy and integrity of information reported to
the credit reporting agencies, and identity theft prevention requirements.
The Gramm-Leach-Bliley Act requires certain communications periodically with consumers on privacy matters, restricts
the disclosure of nonpublic personal information about consumers by financial institutions and prohibits the sharing of
account number information for certain marketing purposes.
The Servicemembers Civil Relief Act is federal legislation that provides special protection to customers in military service
and is designed to protect military personnel from personal hardship or loss resulting from financial obligations while in
service.
The Right to Financial Privacy Act restricts the disclosure of customers’ financial records to federal government agencies.
The Dodd-Frank Wall Street Reform and Consumer Protection Act (Dodd-Frank Act) was signed into law in July 2010.
The scope of the Dodd-Frank Act has broad implications for the financial services industries, including automotive
financing, securitizations and derivatives, and requires the development, adoption, and implementation of many
regulations which will impact the offering, marketing, and regulation of consumer financial products and services offered
by financial institutions. Agencies have issued rules establishing a comprehensive framework for the regulation of
derivatives, providing for the regulation of non-bank financial institutions that pose systemic risk, and requiring sponsors
of asset-backed securities to retain an ownership stake in securitization transactions. Although we have analyzed these and
other rulemakings, the absence of final rules in some cases and the complexity of some of the proposed rules make it
difficult for us to estimate the financial, compliance and operational impacts.
The Dodd-Frank Act created the Consumer Financial Protection Bureau (CFPB), which has broad rule-making, examination and
enforcement authority with respect to the laws and regulations that apply to consumer financial products and services. In June 2015,
the CFPB published a final rule defining larger participants of the automobile financing market that will be subject to their supervisory
authority. Upon the effective date of this rule, we will be subject to CFPB supervision with respect to our compliance with applicable
consumer protection laws.
CFPB action with respect to regulation, examination and enforcement, if any, may increase our compliance costs, require changes in
our business practices, affect our competitiveness, impair our profitability, harm our reputation, or otherwise adversely affect our
business. See “Item IA. Risk Factors—New or revised financial or consumer regulations may adversely impact our business, results of
operations, cash flows and financial condition” below for more information.
11
State Regulation
We are also subject to laws and regulations that vary among the states. A majority of states have enacted legislation establishing
licensing requirements to conduct consumer financing activities. We are also periodically subject to state audits which monitor our
compliance with consumer and other regulations.
State rules and regulations generally include requirements as to the form and content of finance contracts and limitations on the
maximum rate of consumer finance charges, including interest rate. In periods of high interest rates, interest rate limitations could
have an adverse effect on our operations if we are unable to pass on our increased costs to our customers or dealers. State rules and
regulations also restrict collection practices and creditor’s rights on our consumer accounts.
Canada
The consumer financing and dealer financing operations of HCFI are regulated under both Canadian federal and provincial law.
Management believes that HCFI is in compliance with the applicable statutes and regulations of the federal government of Canada, its
jurisdiction of incorporation, as well as applicable provincial statutes and regulations.
Item 1A. Risk Factors
We are exposed to certain risks and uncertainties that could have a material adverse effect on our business, results of operations, cash
flows, financial condition, or on our ability to service our indebtedness. There may be additional risks and uncertainties (either
currently unknown or not currently believed to be material) that could have a material adverse effect on our business, results of
operations, cash flows, financial condition, or on our ability to service our indebtedness.
Risks Relating To Our Business
Our results of operations, cash flows, and financial condition are substantially dependent upon HMC and the sale of Honda and
Acura products and any decline in the financial condition of HMC or the sales of Honda and Acura products could have a
materially unfavorable impact on our financial condition, cash flows, and results of operations.
Our results of operations, cash flows, and financial condition are substantially dependent upon the sale of Honda and Acura products
in the United States and Canada. Any prolonged reduction or suspension of HMC’s production or sales of Honda or Acura products in
the United States or Canada resulting from a decline in demand, a change in consumer preferences, a decline in the actual or perceived
quality, safety, or reliability of Honda and Acura products, a reduction of incentive financing programs, volatility in fuel prices,
continued economic stagnation or the occurrence of a recession, a financial crisis, a work stoppage, governmental action, including a
change in regulation, adverse publicity, a recall, a war, a use of force by foreign countries, a terrorist attack, a multinational conflict, a
natural disaster, an epidemic, or similar events could have a substantially unfavorable effect on us.
The production and sale of HMC’s products will depend significantly on HMC’s ability to continue its capital expenditure and product
development programs and to market its vehicles successfully. This ability is subject to several risks, including:
any prolonged reduction or suspension of production or sales as discussed above;
discovery of defects in vehicles which could lead to recall campaigns;
volatility in the price of automobiles, motorcycles, power equipment and marine products;
currency and interest rate fluctuation affecting pricing of products sold and materials purchased and any derivative
financial instruments used to hedge against these risks;
extensive environmental and government regulation of the automotive, motorcycle, and power product industries;
the inability to protect and preserve its valuable intellectual property;
legal proceedings, which could adversely affect business, financial condition, cash flows, or results of operations;
reliance on external suppliers for the provision of raw materials and parts used in the manufacturing of its products;
increased costs from conducting business worldwide;
inadvertent disclosures of confidential information despite internal controls and procedures; and
pension costs and benefit obligations.
12
Additionally, our credit ratings depend, in large part, on the existence of the keep well agreements with HMC and on the financial
condition and results of operations of HMC. If these arrangements (or replacement arrangements acceptable to the rating agencies, if
any) become unavailable to us, or if a credit rating of HMC is lowered, our credit ratings will also likely be adversely impacted,
leading to higher borrowing costs.
Because our operations are heavily dependent on retail sales of motor vehicles and other retail products, a decline in general
business and economic conditions can have a significant adverse impact on our results of operations, cash flows, and financial
condition.
Because our operations are heavily dependent on retail sales of motor vehicles and other retail products, general business and
economic conditions have a significant impact on our operations. In particular, changes in the following events can adversely affect
our results of operations, cash flows, and financial condition:
changes in the United States or Canadian economies;
changes in the overall market for consumer financing or dealer financing;
changes in the United States and Canadian regulatory environment;
a decline in the new or used vehicle market;
increased fuel prices;
inflation; and
the fiscal and monetary policies in the countries in which we issue debt.
Elevated levels of market disruption and volatility could adversely affect our ability to access the global capital markets in a similar
manner and at a similar cost as we have had in the past. These market conditions could also have an adverse effect on our results of
operations, cash flows, and financial condition by diminishing the value of financial assets. If, as a result, we increase the rates we
charge to our customers and dealers, our competitive position could be negatively affected.
Additionally, the United States and Canada have experienced periods of economic slowdown and a recession. These periods have
been accompanied by decreases in consumer demand for automobiles. High unemployment, decreases in home values, and lack of
availability of credit may lead to increased default rates. Significant increases in the inventory of used automobiles during periods of
economic recession may also depress the prices at which repossessed automobiles may be sold or delay the timing of these sales.
Dealers may also be affected by an economic slowdown or recession, which in turn may increase the risk of default of certain dealers
within our wholesale flooring and commercial financing portfolios.
Fluctuations in interest rates could have an adverse impact on our results of operations, cash flows, and financial condition.
Our results of operations, cash flows, and financial condition could be adversely affected during any period of changing interest rates,
possibly to a material degree. Interest rate risks arise from the mismatch between assets and the related liabilities used for funding. We
have entered into contracts to provide consumer financing, dealer financing, incentive financing, originations and servicing, all of
which are exposed, in varying degrees, to changes in value due to movements in interest rates. Further, an increase in interest rates
could increase our costs of providing dealer and consumer financing originations, which could, in turn, adversely affect our financing
volumes because financing can be less attractive to our dealers and customers and qualifying for financing may be more difficult.
We monitor the interest rate environment and enter into various financial instruments, including interest rate and basis swaps, to
manage our exposure to the risk of interest rate fluctuations. However, our hedging strategies may not fully mitigate the impact of
changes in interest rates. Further, these instruments contain an element of risk in the event the counterparties are unable to meet the
terms of the agreements. See “—The failure or commercial soundness of our counterparties and other financial institutions may have
an adverse effect on our results of operations, cash flows, or financial condition” below.
Our results of operations, cash flows, and financial condition may be adversely affected because of currency risk.
Currency risk or exchange rate risk refers to potential changes of value of financial assets, including Canadian dollar denominated
finance receivables, foreign currency denominated debt or derivatives used to manage exposure on foreign currency denominated debt
in response to fluctuations in exchange rates of various currencies, including, without limitation, the U.S. dollar, the Canadian dollar,
the Japanese yen and the Euro. Changes in exchange rates can have adverse effects on our results of operations, cash flows, and
financial condition.
13
We monitor the exchange rate environment and enter into various financial instruments, including currency swap agreements, to
manage our exposure to the risk of exchange rate fluctuations. However, our hedging strategies may not fully mitigate the impact of
changes in exchange rates. Further, these instruments contain an element of risk in the event the counterparties are unable to meet the
terms of the agreements. See “—The failure or commercial soundness of our counterparties and other financial institutions may have
an adverse effect on our results of operations, cash flows, or financial condition” below.
We need substantial capital to finance our operations and a disruption in our funding sources and access to the capital markets
would have an adverse effect on our results of operations, cash flows, and financial condition.
We depend on a significant amount of financing to operate our business. Our business strategies utilize diverse sources to fund our
operations, including the issuance of commercial paper and medium term notes, asset-backed securities and bank loans and
borrowings from AHM and HCI, as applicable.
The availability of these financing sources at the prices we desire may depend on factors outside of our control, including our credit
ratings, disruptions to the capital markets, the fiscal and monetary policies of government, and government regulations. In the event
that we are unable to raise the funds we require at reasonable rates, we may curtail our various loan origination activities or incur the
effects of increased costs of operation. Reducing loan origination activities or increasing the rates we charge consumers and dealers to
accommodate increased costs of operation may adversely affect our ability to remain a preferred source of financing for consumers
and dealers for Honda and Acura products and will have an adverse effect on our results of operations, cash flows, and financial
condition.
Our borrowing costs and access to the debt capital markets depend significantly on our credit ratings, the credit ratings of HMC
and the keep well agreements.
The cost and availability of financing is influenced by credit ratings, which are intended to be an indicator of the creditworthiness of a
particular company, security, or obligation. Our credit ratings depend, in large part, on the existence of the keep well agreements with
HMC and on the financial condition and results of operations of HMC. If these arrangements (or replacement arrangements acceptable
to the rating agencies, if any) become unavailable to us, or if a credit rating of HMC is lowered, our credit ratings will also likely be
adversely impacted, leading to higher borrowing costs.
Credit rating agencies that rate the credit of HMC and its affiliates, including AHFC, may qualify, alter, or terminate their ratings at
any time. Global economic conditions and other geopolitical factors may directly or indirectly affect such ratings. Any downgrade in
the sovereign credit ratings of the United States, Japan, or Canada may directly or indirectly have a negative effect on the ratings of
HMC and AHFC. Downgrades, the change to a negative outlook, or placement on review for possible downgrades of such ratings
could result in an increase in our borrowing costs as well as reduced access to global unsecured debt capital markets. These factors
would have a negative impact on our business, including our competitive position, results of operations, cash flows and financial
condition.
We are subject to consumer and dealer credit risk, which could adversely impact our results of operations, cash flows, and
financial condition.
Credit risk is the risk of loss arising from the failure of a consumer or dealer to meet the terms of any contract with us or otherwise fail
to perform as agreed. Credit losses are an expected cost of extending credit. The majority of our credit risk is with consumer
financing, and to a lesser extent, with dealer financing. Our level of credit risk on our consumer financing portfolios is influenced
primarily by two factors: the total number of contracts that default, and the amount of loss per occurrence, net of recoveries, which in
turn are influenced by various factors, such as the used vehicle market, our purchase quality mix, contract term lengths, operational
changes, and certain economic factors such as unemployment rates, levels of consumer debt service burden and personal income
growth rates. Our level of credit risk on our dealer financing portfolio is influenced primarily by the financial strength of dealers
within the portfolio, the concentration of dealers demonstrating financial strength, the quality of the collateral securing the financing
within the portfolio and economic factors. An increase in credit risk would increase our provision for credit losses, which would have
a negative impact on our results of operations, cash flows, and financial condition.
We manage credit risk by managing the credit quality of our consumer financing and dealer financing portfolios, pricing contracts for
expected losses and focusing collection efforts to minimize losses. However, our monitoring of credit risk and our efforts to mitigate
credit risk may not be sufficient to prevent a material adverse effect on our results of operations, cash flows, and financial condition.
14
We are exposed to residual value risk on the vehicles we lease.
Customers of leased vehicles typically have an option to return the vehicle to the dealer at the end of the lease term or to buy the
vehicle for the contractual residual value (or if purchased prior to lease maturity, for the outstanding contractual balance). Returned
lease vehicles can be purchased by the grounding dealer for the contractual residual value (or if purchased prior to lease maturity, for
the outstanding contractual balance) or a market based price. Returned lease vehicles that are not purchased by the grounding dealer
are sold through online and physical auctions. Residual value risk is the risk that the contractual residual value determined at lease
inception will not be recoverable at the end of the lease term. When the market value of a leased vehicle at contract maturity is less
than its contractual residual value, there is a higher probability that the vehicle will be returned to us. As a result, we are exposed to
risk of loss on the disposition of leased vehicles to the extent that sales proceeds are not sufficient to cover the carrying value of the
leased asset at termination. Among the factors that can affect the value of returned lease vehicles are the volume of vehicles returned,
adverse economic conditions, preferences for particular types of vehicles, new vehicle pricing, new vehicle incentive financing
programs, new vehicle sales, the actual or perceived quality, safety, or reliability of vehicles, future plans for new Honda and Acura
product introductions, competitor actions and behavior, product attributes of popular vehicles, the mix of used vehicle supply, the
level of current used vehicle values, and fuel prices.
We maintain projections for expected residual values and return volumes of the vehicles we lease. Actual proceeds realized by us
upon sales of returned leased vehicles at lease termination may be lower than the amount projected, which would reduce the
profitability of the lease transaction and could have the potential to adversely affect our results of operations.
The failure or commercial soundness of our counterparties and other financial institutions may have an adverse effect on our
results of operations, cash flows, or financial condition.
We have exposure to many different financial institutions, and we routinely execute transactions with counterparties in the financial
industry. Our debt, derivative and investment transactions, and our ability to borrow under committed and uncommitted credit
facilities, could be adversely affected by the creditworthiness, actions, and commercial soundness of these other financial institutions.
Deterioration of social, political, labor, or economic conditions in a specific country or region may also adversely affect the ability of
financial institutions, including our derivative counterparties and lenders, to perform their contractual obligations. Financial
institutions are interrelated as a result of trading, clearing, lending, and other relationships, and as a result, financial and political
difficulties in one country or region may adversely affect financial institutions in other jurisdictions, including those with which we
have relationships. The failure of any financial institutions and other counterparties to which we have exposure, directly or indirectly,
to perform their contractual obligations, and any losses resulting from that failure, could have a material adverse effect on our results
of operations, cash flows, or financial condition.
If we are unable to compete successfully or if competition continues to increase in the businesses in which we operate, our results
of operations, cash flows, and financial condition could be materially and adversely affected.
The finance industries in the United States and Canada are highly competitive. We compete with national and regional commercial
banks, credit unions, savings and loan associations, finance companies, and other captive finance companies that provide consumer
financing for new and used Honda and Acura automobiles and parts and accessories and Honda motorcycles, power equipment, and
marine engines. Additionally, Canadian commercial banks have become stronger competitors in the automobile consumer financing
markets. Commercial banks, finance companies, and captive finance companies of other manufacturers also provide wholesale
flooring financing for Honda and Acura dealers. Our primary competition in the wholesale motorcycle, power equipment, and marine
engine financing business tends to be local banks and specialty finance firms that are familiar with the particular characteristics of
these businesses. Our inability to compete successfully, as well as increases in competitive pressures, could have an adverse impact on
our contract volume, market share, revenues, and margins and have a material adverse effect on us. Providers of vehicle financing
have traditionally competed on the basis of interest rates charged, the quality of credit accepted, the flexibility of loan terms offered,
the quality of service provided to dealers and customers, and strong dealer relationships.
Our results of operations may be adversely affected by the prepayment of our financing contracts.
Our financing contracts may be repaid by borrowers at any time at their option. Early repayment of contracts will limit the amount of
earnings we would have otherwise generated under those contracts and we may not be able to reinvest the portions repaid early
immediately into new loans or loans with similar pricing.
15
Changes in laws and regulations, or the application thereof, may adversely affect our business, results of operations, cash flows,
and financial condition.
Our operations are subject to regulation, supervision, and licensing under various United States, Canadian, state, provincial, and local
statutes, ordinances, and regulations. A failure to comply with applicable regulatory, supervisory, or licensing requirements may
adversely affect our business, results of operations, cash flows, and financial condition. Due to recent events in the global financial
markets, regulators have increased their focus on the regulation of the financial services industry. As a result, there have been and may
continue to be proposals for laws and regulations that could increase the scope and nature of laws and regulations that are currently
applicable to us. Any change in such laws and regulations, whether in the form of new or amended laws or regulations, regulatory
policies, supervisory action, or the application of any of the above, may adversely affect our business, results of operations, cash
flows, and financial condition by increasing our costs to comply with the new laws, prohibiting or limiting the amount of certain
revenues we currently receive, or constraining certain collection or collateral recovery action which are currently available to us.
New or revised financial or consumer regulations may adversely impact our business, results of operations, cash flows and
financial condition.
The Dodd-Frank Act is extensive and significant legislation that, among other things:
created a liquidation framework for purposes of liquidating certain bank holding companies or other nonbank financial
companies determined to be “covered financial companies,” and certain of their respective subsidiaries, defined as
“covered subsidiaries,” if, among other conditions, it is determined such a company is in default or in danger of default
and the resolution of such a company under other applicable law would have serious adverse effects on financial stability
in the United States;
created the CFPB, an agency with broad rule-making examination and enforcement authority with respect to the laws and
regulations that apply to consumer financial products and services, such as the extension of credit to finance the purchase
of automobiles and motorcycles;
created a new framework for the regulation of over-the-counter derivatives activities; and
strengthened the regulatory oversight of securities and capital markets activities by the SEC.
The scope of the Dodd-Frank Act has broad implications for the financial services industry, including us, and requires the
implementation of numerous rules and regulations. The Dodd-Frank Act impacts the offering, marketing, and regulation of consumer
financial products and services offered by financial institutions. The potential impact of the Dodd-Frank Act and its implementing
rules and regulations may include supervision and examination, limitations on our ability to expand product and service offerings and
new or modified disclosure requirements.
As previously disclosed, the CFPB, together with the U.S. Department of Justice (the Agencies), have contacted us regarding their
review of pricing practices by dealers originating retail installment sale contracts for automobiles. We have voluntarily provided the
information requested and cooperated fully with the investigation. As also previously disclosed, we have received a notice that the
Agencies have authorized an enforcement action, alleging discrimination in automobile loan pricing to certain borrowers by dealers
and alleging the loan pricing disparities were caused by our business practices related to dealer discretion, and that the Agencies may
seek monetary relief and implementation of changes to our pricing practices and policies, which may affect our business. We have
also been informed that the Agencies may defer pursuit of litigation if we work with them to seek a voluntary resolution to these
allegations. We continue to cooperate with the Agencies to find a mutually agreeable resolution. At March 31, 2015, given the current
status of discussions with the Agencies, we recorded as a loss contingency an amount that was not material to our consolidated
financial condition or results of operations for the year ended March 31, 2015. We intend to continue discussions with the Agencies to
attempt to achieve a mutually satisfactory resolution to these matters. In addition, we also received a subpoena from a state agency
requesting information relating to its fair lending laws. We are cooperating with this request for information. We cannot predict the
outcome of this inquiry. Compliance with the regulations under the Dodd-Frank Act or the oversight of the SEC, CFPB, or other
governmental entities may impose costs on, create operational constraints for, or place limits on pricing with respect to, finance
companies such as us. Such compliance may affect our competitiveness, impairing our profitability.
Adverse economic conditions or changes in laws in states in which we have customer concentrations may negatively affect our
results of operations, cash flows, and financial condition.
We are exposed to geographic concentration risk in our consumer financing operations. Factors adversely affecting the economy and
applicable laws in various states where we have concentration risk could have an adverse effect on our results of operations, cash
flows, and financial condition.
16
A failure or interruption in our operations could adversely affect our results of operations and financial condition.
Operational risk is the risk of loss resulting from, among other factors, inadequate or failed processes, systems or internal controls,
theft, fraud, cybersecurity breaches, or natural disasters. Operational risk can occur in many forms including, but not limited to, errors,
business interruptions, failure of controls, inappropriate behavior or misconduct by our employees or those contracted to perform
services for us, and vendors that do not perform in accordance with their contractual agreements. These events can potentially result in
financial losses or other damage to us, including damage to our reputation.
We rely on internal and external information and technological systems to help us manage and maintain our operations and are
exposed to risk of loss resulting from breaches in the security or other failures of these systems. We collect and store certain personal
and financial information from customers, related parties, and employees. We also store confidential business and technical
information. Security breaches could expose us to a risk of loss of this information, regulatory scrutiny, claims for damages, actions,
and penalties, litigation, reputational harm, and a loss of confidence that could potentially have an adverse impact on future business
with current and potential customers. In addition, any upgrade or replacement of our major legacy transaction systems, including our
planned replacement of our electronic originations systems, could have a significant impact on our ability to conduct our core business
operations and increase our risk of loss resulting from disruptions of normal operating processes and procedures that may occur during
the implementation of new information and transaction systems. These factors could have an adverse effect on our results of
operations, cash flows, and financial condition.
We also rely on a framework of internal controls designed to provide a sound and well-controlled operating environment. Due to the
complexity of our business and the challenges inherent in implementing control structures across large organizations, control issues
could be identified in the future that could have a material adverse effect on us.
A security breach or a cyber attack may adversely affect our business, results of operations and financial condition.
A security breach or cyber attack of our systems could interrupt, damage or harm our operations. We collect, analyze and retain
certain types of personally identifiable and other information pertaining to our customers and employees through our information and
technology systems. A breach or cyber attack of these systems due to the actions of third parties, employee error, malfeasance or
otherwise, could expose us to a risk of loss of this information, regulatory scrutiny, claims for damages, penalties, litigation,
reputational harm, and a loss of confidence that could potentially have an adverse impact on future business with current and potential
customers.
We are subject to various privacy, data protection and information security laws, including requirements concerning security breach
notification. Compliance with current or future privacy, data protection and information security laws affecting customer or employee
data to which we are subject could result in higher compliance and technology costs and could materially and adversely affect our
profitability. Our failure to comply with privacy, data protection and information security laws could result in potentially significant
regulatory and/or governmental investigations and/or actions, litigation, fines, sanctions and damage to our reputation.
Our pension costs and the pension costs of AHM and HCI may affect our financial condition, cash flows, and results of
operations.
Our employees participate in either AHM’s and HCI’s pension plans. HMC also has a pension plan but a great majority of our
employees do not participate in that plan. The amount of pension benefits and lump-sum payments provided in those plans are
primarily based on the combination of years of service and compensation. AHM and HCI each determine and make periodic
contributions to their respective benefit plans pursuant to applicable regulations and we are allocated our share of pension plan costs
due to the participation of our employees. Since benefit obligations and pension costs are based on many assumptions, including, but
not limited to, the discount rate, the rate of salary increase, and the expected long-term rate of return on plan assets, differences in
actual expenses and costs or changes in those assumptions could affect AHM’s, HCI’s, and our cash contributions and liquidity. Under
the Employee Retirement Income Security Act of 1974 (ERISA), we are jointly and severally liable for the obligations under AHM’s
plans that are subject to ERISA, even for participants in the plans that are not our employees.
Vehicle recalls and other announcements may impact our business
From time to time, AHM may recall, suspend sales and production of, or initiate market actions on certain Honda or Acura products to
address performance, customer satisfaction, compliance or safety-related issues. Because our business is substantially dependent upon
the sale of Honda and Acura products such actions may negatively impact our business. A decrease in the level of vehicle sales would
negatively impact our financing volume. Additionally, recalls may cause a decrease in the demand for used recalled vehicles which
may cause a decline in values of those vehicles. Declines in values of used vehicles may also cause an increase in our credit losses.
17
Item 1B. Unresolved Staff Comments
None.
Item 2. Properties
Our headquarters are located in Torrance, California. Our United States operations have regional offices and national servicing centers
located in California, Georgia, Texas, Massachusetts, Illinois, North Carolina, and Delaware. HCFI’s headquarters are located in
Markham, Ontario, Canada and our Canadian operations have regional offices and national servicing centers located in Quebec and
Ontario. All premises are occupied pursuant to lease agreements.
We believe that our properties are suitable to meet the requirements of our business.
Item 3. Legal Proceedings
We are involved, in the ordinary course of our business, in various legal proceedings including claims of individual customers and
purported class action lawsuits. Certain of these actions are similar to suits filed against other financial institutions and captive finance
companies. Most of these proceedings concern customer allegations of wrongful repossession or defamation of credit. We are also
subject to governmental reviews from time to time. We establish accruals for legal claims when payments associated with the claims
become probable and the costs can be reasonably estimated. When we are able, we will determine estimates of reasonably possible
loss or range of loss, whether in excess of any related accrued liability or where there is no accrued liability. Given the inherent
uncertainty associated with legal matters, the actual costs of resolving legal claims and associated costs of defense may be
substantially higher or lower than the amounts for which accruals have been established. Based on available information and
established accruals, we do not believe it is reasonably possible that the results of these proceedings, in the aggregate, will have a
material adverse effect on us.
As previously disclosed, the CFPB, together with the U.S. Department of Justice (the Agencies), have contacted us regarding their
review of pricing practices by dealers originating retail installment sale contracts for automobiles. We have voluntarily provided the
information requested and cooperated fully with the investigation. As also previously disclosed, we have received a notice that the
Agencies have authorized an enforcement action, alleging discrimination in automobile loan pricing to certain borrowers by dealers
and alleging the loan pricing disparities were caused by our business practices related to dealer discretion, and that the Agencies may
seek monetary relief and implementation of changes to our pricing practices and policies, which may affect our business. We have
also been informed that the Agencies may defer pursuit of litigation if we work with them to seek a voluntary resolution to these
allegations. We continue to cooperate with the Agencies to find a mutually agreeable resolution. At March 31, 2015, given the current
status of discussions with the Agencies, we recorded as a loss contingency an amount that was not material to our consolidated
financial condition or results of operations for the year ended March 31, 2015. We intend to continue discussions with the Agencies to
attempt to achieve a mutually satisfactory resolution to these matters. In addition, we also received a subpoena from a state agency
requesting information relating to its fair lending laws. We are cooperating with this request for information. We cannot predict the
outcome of this inquiry.
Item 4. Mine Safety Disclosures
Not applicable.
18
PART II
Item 5. Market for Registrant’s Common Equity, Related Stockholder Matters and Issuer Purchases of Equity Securities
All of the outstanding common stock of AHFC is owned by AHM. Accordingly, shares of our common stock are not listed on any
national securities exchange and there is no established public trading market for AHFC’s common stock and there is no intention to
create a public market or list the common stock on any securities exchange. As of the date of this annual report, there are no shares of
AHFC common stock that are subject to outstanding options or warrants to purchase, or securities convertible into, AHFC common
stock. No shares of AHFC common stock can be sold pursuant to Rule 144 under the Securities Act.
Dividends are declared and paid by AHFC if, when, and as determined by its Board of Directors. In fiscal years 2015 and 2014 AHFC
did not declare or pay dividends. We presently do not have plans to pay any cash dividends in the near future.
Use of Proceeds from Registered Securities
On August 27, 2013, AHFC’s Registration Statement on Form 10 with respect to the registration of its common stock became
effective. On September 6, 2013, AHFC filed an automatic shelf on Form S-3 that became effective upon its filing. On September 25,
2013, AHFC established a public U.S. medium term note program that registered the offer and sale of up to $5.0 billion in an
aggregate principal amount of Medium Term Notes, Series A with the SEC (refer to Commission File Number 333-191021). On
February 12, 2014, AHFC increased the maximum aggregate principal amount of Public U.S. Medium Term Notes authorized for
issuance and sale to $16.0 billion. The aggregate principal amount of Public U.S. Medium Term Notes offered under this program
may be increased from time to time. During the fiscal year ended March 31, 2015, AHFC issued $8.2 billion aggregate principal
amount of Public U.S. Medium Term Notes and the aggregate underwriting discounts and commissions, finders’ fees, and other
related costs paid was approximately $20 million. AHFC has used the net proceeds received from the sale of these Public U.S.
Medium Term Notes to repay other existing indebtedness, acquire retail loans and/or leases, provide wholesale flooring and
commercial loans and for other general corporate purposes. The following institutions served as managing underwriters for the
offering and sale of these AHFC’s Public U.S. Medium Term Notes: Merrill Lynch, Pierce, Fenner & Smith Incorporated, Barclays
Capital Inc., BNP Paribas Securities Corp., Citigroup Global Markets Inc., Credit Suisse Securities (USA) LLC, Deutsche Bank
Securities Inc., J.P. Morgan Securities LLC, Mizuho Securities USA Inc., Morgan Stanley & Co. LLC, RBS Securities Inc., SG
Americas Securities, LLC, SMBC Nikko Securities America, Inc., and Wells Fargo Securities, LLC.
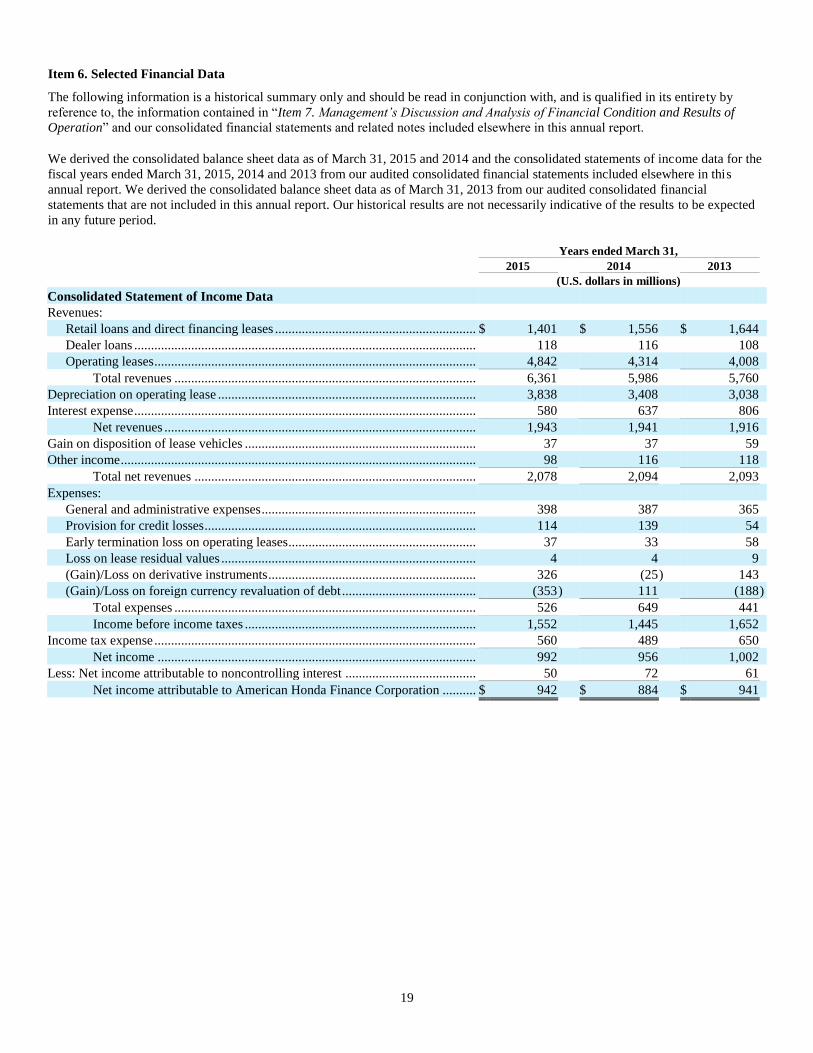
19
Item 6. Selected Financial Data
The following information is a historical summary only and should be read in conjunction with, and is qualified in its entirety by
reference to, the information contained in “Item 7. Management’s Discussion and Analysis of Financial Condition and Results of
Operation” and our consolidated financial statements and related notes included elsewhere in this annual report.
We derived the consolidated balance sheet data as of March 31, 2015 and 2014 and the consolidated statements of income data for the
fiscal years ended March 31, 2015, 2014 and 2013 from our audited consolidated financial statements included elsewhere in this
annual report. We derived the consolidated balance sheet data as of March 31, 2013 from our audited consolidated financial
statements that are not included in this annual report. Our historical results are not necessarily indicative of the results to be expected
in any future period.
Years ended March 31,
2015 2014 2013
(U.S. dollars in millions)
Consolidated Statement of Income Data
Revenues:
Retail loans and direct financing leases ............................................................ $ 1,401 $ 1,556 $ 1,644
Dealer loans ...................................................................................................... 118 116 108
Operating leases ................................................................................................ 4,842 4,314 4,008
Total revenues .......................................................................................... 6,361 5,986 5,760
Depreciation on operating lease ............................................................................. 3,838 3,408 3,038
Interest expense ...................................................................................................... 580 637 806
Net revenues ............................................................................................. 1,943 1,941 1,916
Gain on disposition of lease vehicles ..................................................................... 37 37 59
Other income .......................................................................................................... 98 116 118
Total net revenues .................................................................................... 2,078 2,094 2,093
Expenses:
General and administrative expenses ................................................................ 398 387 365
Provision for credit losses ................................................................................. 114 139 54
Early termination loss on operating leases........................................................ 37 33 58
Loss on lease residual values ............................................................................ 4 4 9
(Gain)/Loss on derivative instruments .............................................................. 326 (25 ) 143
(Gain)/Loss on foreign currency revaluation of debt ........................................ (353 ) 111 (188 )
Total expenses .......................................................................................... 526 649 441
Income before income taxes ..................................................................... 1,552 1,445 1,652
Income tax expense ................................................................................................ 560 489 650
Net income ............................................................................................... 992 956 1,002
Less: Net income attributable to noncontrolling interest ....................................... 50 72 61
Net income attributable to American Honda Finance Corporation .......... $ 942 $ 884 $ 941
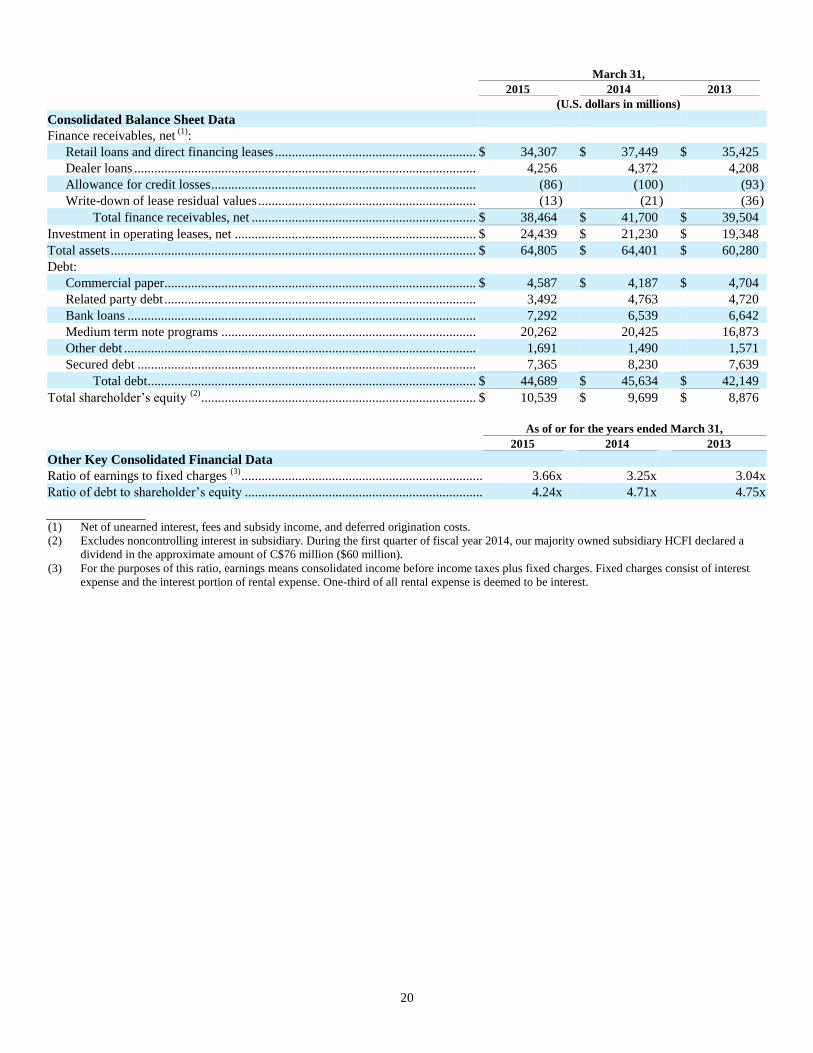
20
March 31,
2015 2014 2013
(U.S. dollars in millions)
Consolidated Balance Sheet Data
Finance receivables, net (1)
:
Retail loans and direct financing leases ............................................................ $ 34,307 $ 37,449 $ 35,425
Dealer loans ...................................................................................................... 4,256 4,372 4,208
Allowance for credit losses ............................................................................... (86 ) (100 ) (93 )
Write-down of lease residual values ................................................................. (13 ) (21 ) (36 )
Total finance receivables, net ................................................................... $ 38,464 $ 41,700 $ 39,504
Investment in operating leases, net ........................................................................ $ 24,439 $ 21,230 $ 19,348
Total assets ............................................................................................................. $ 64,805 $ 64,401 $ 60,280
Debt:
Commercial paper............................................................................................. $ 4,587 $ 4,187 $ 4,704
Related party debt ............................................................................................. 3,492 4,763 4,720
Bank loans ........................................................................................................ 7,292 6,539 6,642
Medium term note programs ............................................................................ 20,262 20,425 16,873
Other debt ......................................................................................................... 1,691 1,490 1,571
Secured debt ..................................................................................................... 7,365 8,230 7,639
Total debt .................................................................................................. $ 44,689 $ 45,634 $ 42,149
Total shareholder’s equity (2)
.................................................................................. $ 10,539 $ 9,699 $ 8,876
As of or for the years ended March 31,
2015 2014 2013
Other Key Consolidated Financial Data
Ratio of earnings to fixed charges (3)
........................................................................ 3.66x 3.25x 3.04x
Ratio of debt to shareholder’s equity ....................................................................... 4.24x 4.71x 4.75x
(1) Net of unearned interest, fees and subsidy income, and deferred origination costs.
(2) Excludes noncontrolling interest in subsidiary. During the first quarter of fiscal year 2014, our majority owned subsidiary HCFI declared a
dividend in the approximate amount of C$76 million ($60 million).
(3) For the purposes of this ratio, earnings means consolidated income before income taxes plus fixed charges. Fixed charges consist of interest
expense and the interest portion of rental expense. One-third of all rental expense is deemed to be interest.
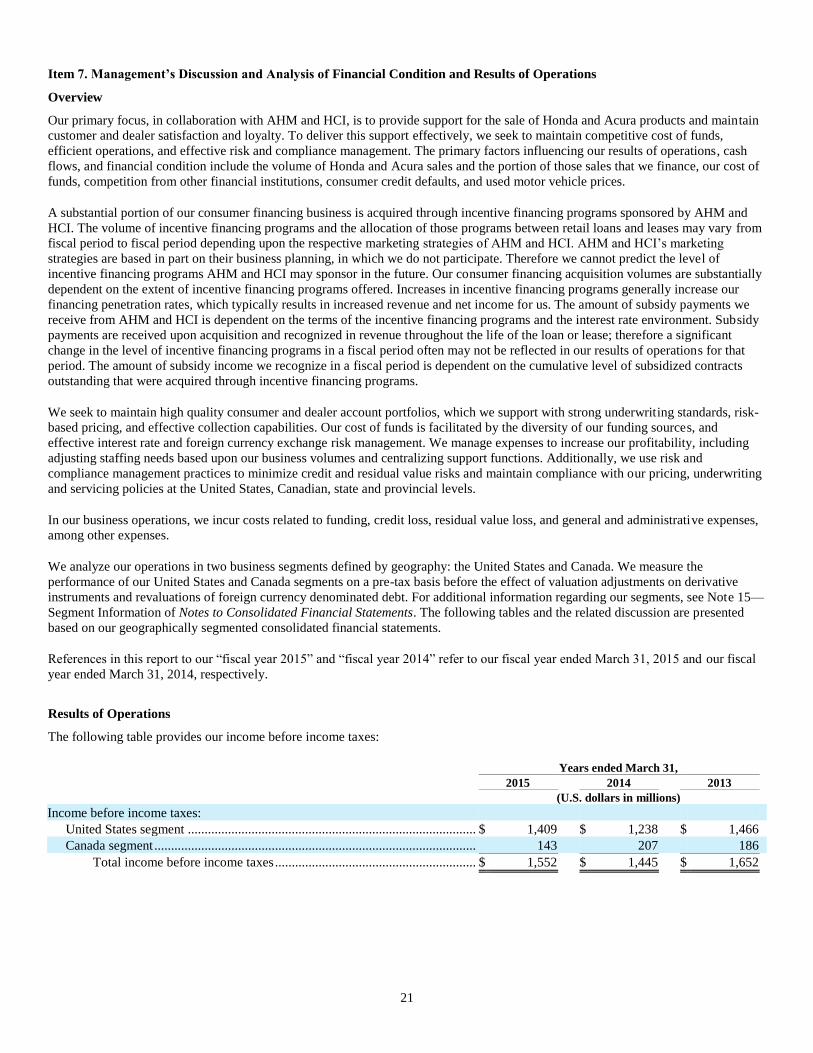
21
Item 7. Management’s Discussion and Analysis of Financial Condition and Results of Operations
Overview
Our primary focus, in collaboration with AHM and HCI, is to provide support for the sale of Honda and Acura products and maintain
customer and dealer satisfaction and loyalty. To deliver this support effectively, we seek to maintain competitive cost of funds,
efficient operations, and effective risk and compliance management. The primary factors influencing our results of operations, cash
flows, and financial condition include the volume of Honda and Acura sales and the portion of those sales that we finance, our cost of
funds, competition from other financial institutions, consumer credit defaults, and used motor vehicle prices.
A substantial portion of our consumer financing business is acquired through incentive financing programs sponsored by AHM and
HCI. The volume of incentive financing programs and the allocation of those programs between retail loans and leases may vary from
fiscal period to fiscal period depending upon the respective marketing strategies of AHM and HCI. AHM and HCI’s marketing
strategies are based in part on their business planning, in which we do not participate. Therefore we cannot predict the level of
incentive financing programs AHM and HCI may sponsor in the future. Our consumer financing acquisition volumes are substantially
dependent on the extent of incentive financing programs offered. Increases in incentive financing programs generally increase our
financing penetration rates, which typically results in increased revenue and net income for us. The amount of subsidy payments we
receive from AHM and HCI is dependent on the terms of the incentive financing programs and the interest rate environment. Subsidy
payments are received upon acquisition and recognized in revenue throughout the life of the loan or lease; therefore a significant
change in the level of incentive financing programs in a fiscal period often may not be reflected in our results of operations for that
period. The amount of subsidy income we recognize in a fiscal period is dependent on the cumulative level of subsidized contracts
outstanding that were acquired through incentive financing programs.
We seek to maintain high quality consumer and dealer account portfolios, which we support with strong underwriting standards, risk-
based pricing, and effective collection capabilities. Our cost of funds is facilitated by the diversity of our funding sources, and
effective interest rate and foreign currency exchange risk management. We manage expenses to increase our profitability, including
adjusting staffing needs based upon our business volumes and centralizing support functions. Additionally, we use risk and
compliance management practices to minimize credit and residual value risks and maintain compliance with our pricing, underwriting
and servicing policies at the United States, Canadian, state and provincial levels.
In our business operations, we incur costs related to funding, credit loss, residual value loss, and general and administrative expenses,
among other expenses.
We analyze our operations in two business segments defined by geography: the United States and Canada. We measure the
performance of our United States and Canada segments on a pre-tax basis before the effect of valuation adjustments on derivative
instruments and revaluations of foreign currency denominated debt. For additional information regarding our segments, see Note 15—
Segment Information of Notes to Consolidated Financial Statements. The following tables and the related discussion are presented
based on our geographically segmented consolidated financial statements.
References in this report to our “fiscal year 2015” and “fiscal year 2014” refer to our fiscal year ended March 31, 2015 and our fiscal
year ended March 31, 2014, respectively.
Results of Operations
The following table provides our income before income taxes:
Years ended March 31,
2015 2014 2013
(U.S. dollars in millions)
Income before income taxes:
United States segment ...................................................................................... $ 1,409 $ 1,238 $ 1,466
Canada segment ................................................................................................ 143 207 186
Total income before income taxes ............................................................ $ 1,552 $ 1,445 $ 1,652
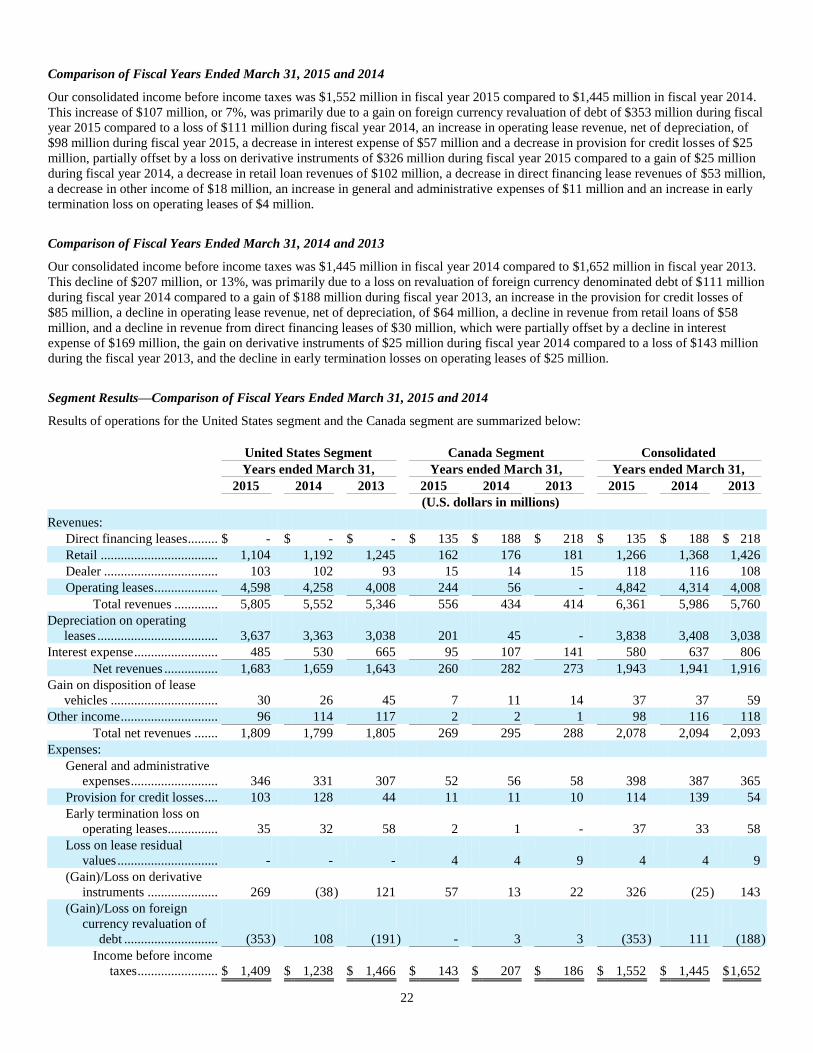
22
Comparison of Fiscal Years Ended March 31, 2015 and 2014
Our consolidated income before income taxes was $1,552 million in fiscal year 2015 compared to $1,445 million in fiscal year 2014.
This increase of $107 million, or 7%, was primarily due to a gain on foreign currency revaluation of debt of $353 million during fiscal
year 2015 compared to a loss of $111 million during fiscal year 2014, an increase in operating lease revenue, net of depreciation, of
$98 million during fiscal year 2015, a decrease in interest expense of $57 million and a decrease in provision for credit losses of $25
million, partially offset by a loss on derivative instruments of $326 million during fiscal year 2015 compared to a gain of $25 million
during fiscal year 2014, a decrease in retail loan revenues of $102 million, a decrease in direct financing lease revenues of $53 million,
a decrease in other income of $18 million, an increase in general and administrative expenses of $11 million and an increase in early
termination loss on operating leases of $4 million.
Comparison of Fiscal Years Ended March 31, 2014 and 2013
Our consolidated income before income taxes was $1,445 million in fiscal year 2014 compared to $1,652 million in fiscal year 2013.
This decline of $207 million, or 13%, was primarily due to a loss on revaluation of foreign currency denominated debt of $111 million
during fiscal year 2014 compared to a gain of $188 million during fiscal year 2013, an increase in the provision for credit losses of
$85 million, a decline in operating lease revenue, net of depreciation, of $64 million, a decline in revenue from retail loans of $58
million, and a decline in revenue from direct financing leases of $30 million, which were partially offset by a decline in interest
expense of $169 million, the gain on derivative instruments of $25 million during fiscal year 2014 compared to a loss of $143 million
during the fiscal year 2013, and the decline in early termination losses on operating leases of $25 million.
Segment Results—Comparison of Fiscal Years Ended March 31, 2015 and 2014
Results of operations for the United States segment and the Canada segment are summarized below:
United States Segment Canada Segment Consolidated
Years ended March 31, Years ended March 31, Years ended March 31,
2015 2014 2013 2015 2014 2013 2015 2014 2013
(U.S. dollars in millions)
Revenues:
Direct financing leases ......... $ - $ - $ - $ 135 $ 188 $ 218 $ 135 $ 188 $ 218
Retail ................................... 1,104 1,192 1,245 162 176 181 1,266 1,368 1,426
Dealer .................................. 103 102 93 15 14 15 118 116 108
Operating leases ................... 4,598 4,258 4,008 244 56 - 4,842 4,314 4,008
Total revenues ............. 5,805 5,552 5,346 556 434 414 6,361 5,986 5,760
Depreciation on operating
leases .................................... 3,637 3,363 3,038 201 45 - 3,838 3,408 3,038
Interest expense ......................... 485 530 665 95 107 141 580 637 806
Net revenues ................ 1,683 1,659 1,643 260 282 273 1,943 1,941 1,916
Gain on disposition of lease
vehicles ................................ 30 26 45 7 11 14 37 37 59
Other income ............................. 96 114 117 2 2 1 98 116 118
Total net revenues ....... 1,809 1,799 1,805 269 295 288 2,078 2,094 2,093
Expenses:
General and administrative
expenses .......................... 346 331 307 52 56 58 398 387 365
Provision for credit losses .... 103 128 44 11 11 10 114 139 54
Early termination loss on
operating leases............... 35 32 58 2 1 - 37 33 58
Loss on lease residual
values .............................. - - - 4 4 9 4 4 9
(Gain)/Loss on derivative
instruments ..................... 269 (38 ) 121 57 13 22 326 (25 ) 143
(Gain)/Loss on foreign
currency revaluation of
debt ............................ (353 ) 108 (191 ) - 3 3 (353 ) 111 (188 )
Income before income
taxes ........................ $ 1,409 $ 1,238 $ 1,466 $ 143 $ 207 $ 186 $ 1,552 $ 1,445 $ 1,652
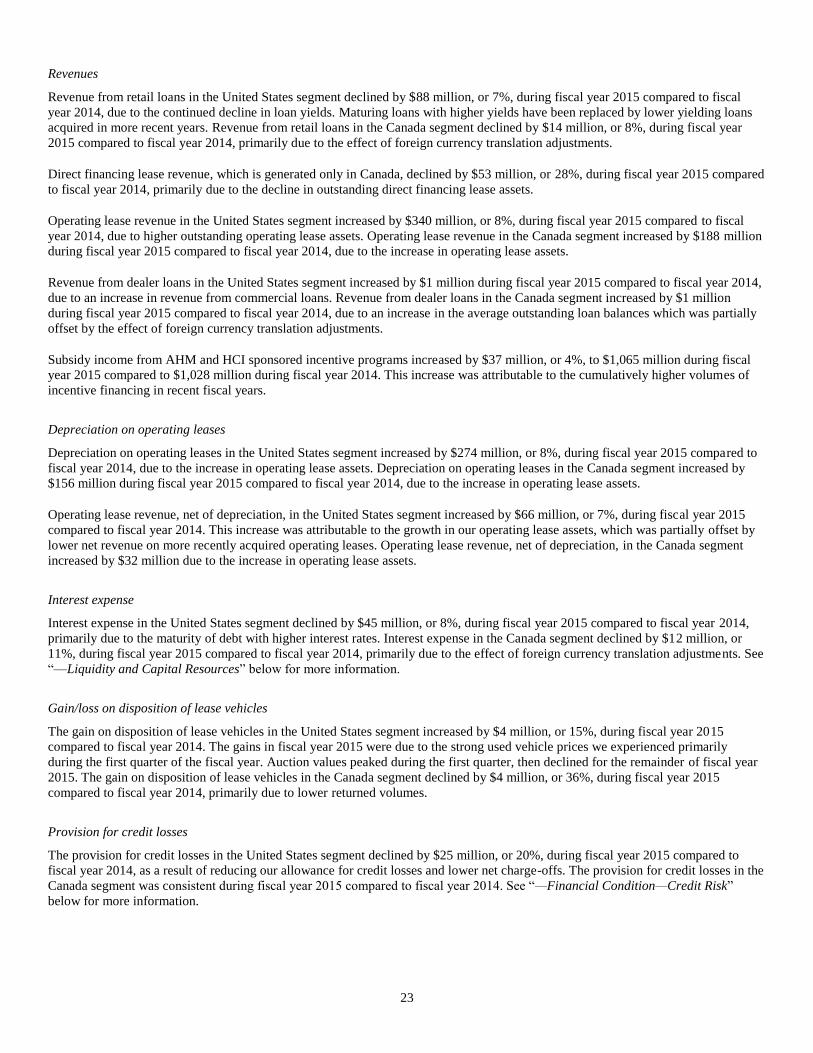
23
Revenues
Revenue from retail loans in the United States segment declined by $88 million, or 7%, during fiscal year 2015 compared to fiscal
year 2014, due to the continued decline in loan yields. Maturing loans with higher yields have been replaced by lower yielding loans
acquired in more recent years. Revenue from retail loans in the Canada segment declined by $14 million, or 8%, during fiscal year
2015 compared to fiscal year 2014, primarily due to the effect of foreign currency translation adjustments.
Direct financing lease revenue, which is generated only in Canada, declined by $53 million, or 28%, during fiscal year 2015 compared
to fiscal year 2014, primarily due to the decline in outstanding direct financing lease assets.
Operating lease revenue in the United States segment increased by $340 million, or 8%, during fiscal year 2015 compared to fiscal
year 2014, due to higher outstanding operating lease assets. Operating lease revenue in the Canada segment increased by $188 million
during fiscal year 2015 compared to fiscal year 2014, due to the increase in operating lease assets.
Revenue from dealer loans in the United States segment increased by $1 million during fiscal year 2015 compared to fiscal year 2014,
due to an increase in revenue from commercial loans. Revenue from dealer loans in the Canada segment increased by $1 million
during fiscal year 2015 compared to fiscal year 2014, due to an increase in the average outstanding loan balances which was partially
offset by the effect of foreign currency translation adjustments.
Subsidy income from AHM and HCI sponsored incentive programs increased by $37 million, or 4%, to $1,065 million during fiscal
year 2015 compared to $1,028 million during fiscal year 2014. This increase was attributable to the cumulatively higher volumes of
incentive financing in recent fiscal years.
Depreciation on operating leases
Depreciation on operating leases in the United States segment increased by $274 million, or 8%, during fiscal year 2015 compared to
fiscal year 2014, due to the increase in operating lease assets. Depreciation on operating leases in the Canada segment increased by
$156 million during fiscal year 2015 compared to fiscal year 2014, due to the increase in operating lease assets.
Operating lease revenue, net of depreciation, in the United States segment increased by $66 million, or 7%, during fiscal year 2015
compared to fiscal year 2014. This increase was attributable to the growth in our operating lease assets, which was partially offset by
lower net revenue on more recently acquired operating leases. Operating lease revenue, net of depreciation, in the Canada segment
increased by $32 million due to the increase in operating lease assets.
Interest expense
Interest expense in the United States segment declined by $45 million, or 8%, during fiscal year 2015 compared to fiscal year 2014,
primarily due to the maturity of debt with higher interest rates. Interest expense in the Canada segment declined by $12 million, or
11%, during fiscal year 2015 compared to fiscal year 2014, primarily due to the effect of foreign currency translation adjustments. See
“—Liquidity and Capital Resources” below for more information.
Gain/loss on disposition of lease vehicles
The gain on disposition of lease vehicles in the United States segment increased by $4 million, or 15%, during fiscal year 2015
compared to fiscal year 2014. The gains in fiscal year 2015 were due to the strong used vehicle prices we experienced primarily
during the first quarter of the fiscal year. Auction values peaked during the first quarter, then declined for the remainder of fiscal year
2015. The gain on disposition of lease vehicles in the Canada segment declined by $4 million, or 36%, during fiscal year 2015
compared to fiscal year 2014, primarily due to lower returned volumes.
Provision for credit losses
The provision for credit losses in the United States segment declined by $25 million, or 20%, during fiscal year 2015 compared to
fiscal year 2014, as a result of reducing our allowance for credit losses and lower net charge-offs. The provision for credit losses in the
Canada segment was consistent during fiscal year 2015 compared to fiscal year 2014. See “—Financial Condition—Credit Risk”
below for more information.
24
Early termination loss on operating leases
Early termination loss on operating leases increased by $3 million, or 9%, in the United States segment and by $1 million, or 100%, in
the Canada segment during fiscal year 2015 compared to fiscal year 2014. The increases in losses were primarily due to the growth in
operating lease assets in both the United States and Canada segments. See “—Financial Condition—Credit Risk” below for more
information.
Loss on lease residual values
Loss on lease residual values in the Canada segment was consistent during fiscal year 2015 compared to fiscal year 2014.
Gain/loss on derivative instruments
In the United States segment, we recognized a loss on derivative instruments of $269 million during fiscal year 2015 compared to a
gain of $38 million during fiscal year 2014. The loss in fiscal year 2015 was attributable to losses on cross currency swaps of $314
million and losses on pay fixed interest rate swaps of $157 million, which were partially offset by gains on pay float interest rate
swaps of $202 million. The losses on cross currency swaps were attributable to the U.S. dollar strengthening against the Euro and Yen
during fiscal year 2015. The losses on pay fixed interest rate swaps and gains on pay float interest rate swaps were primarily due to the
decline in duration of the interest rate swaps. In the Canada segment, the loss on derivative instruments increased by $44 million
during fiscal year 2015 as compared to fiscal year 2014. The loss during fiscal year 2015 was due to the decline in Canadian interest
rates. See “—Derivatives” below for more information.
Gain/loss on foreign currency revaluation of debt
In the United States segment, we recognized a gain on the revaluation of foreign currency denominated debt of $353 million during
fiscal year 2015 compared to a loss of $108 million during fiscal year 2014. The gain during fiscal year 2015 was attributable to gains
on Euro and Yen denominated debt in the United States segment as the U.S. dollar strengthened against both currencies. In the Canada
segment, there was no gain or loss on the revaluation of foreign currency denominated debt during fiscal year 2015 compared to a loss
of $3 million during fiscal year 2014. The Canada segment did not have any foreign currency denominated debt outstanding during
fiscal year 2015.
Income tax expense
Our consolidated effective tax rate was 36.1% for fiscal year 2015 and 33.8% for fiscal year 2014. The primary factors contributing to
the change in the effective tax rate for fiscal year 2015 include a decrease in the estimated state tax rate and increases due to a change
of prior period deferred taxes, an unrecognized tax benefit related to prior years, and the tax deduction for qualified domestic
production which is allocated between AHM and affiliated companies. The deduction for qualified domestic production was affected
by the extension of 50% bonus depreciation included in the Tax Increase Prevention Act of 2014 signed into law on December 19,
2014. For additional information regarding income taxes, see Note 7—Income Taxes of Notes to Consolidated Financial Statements.
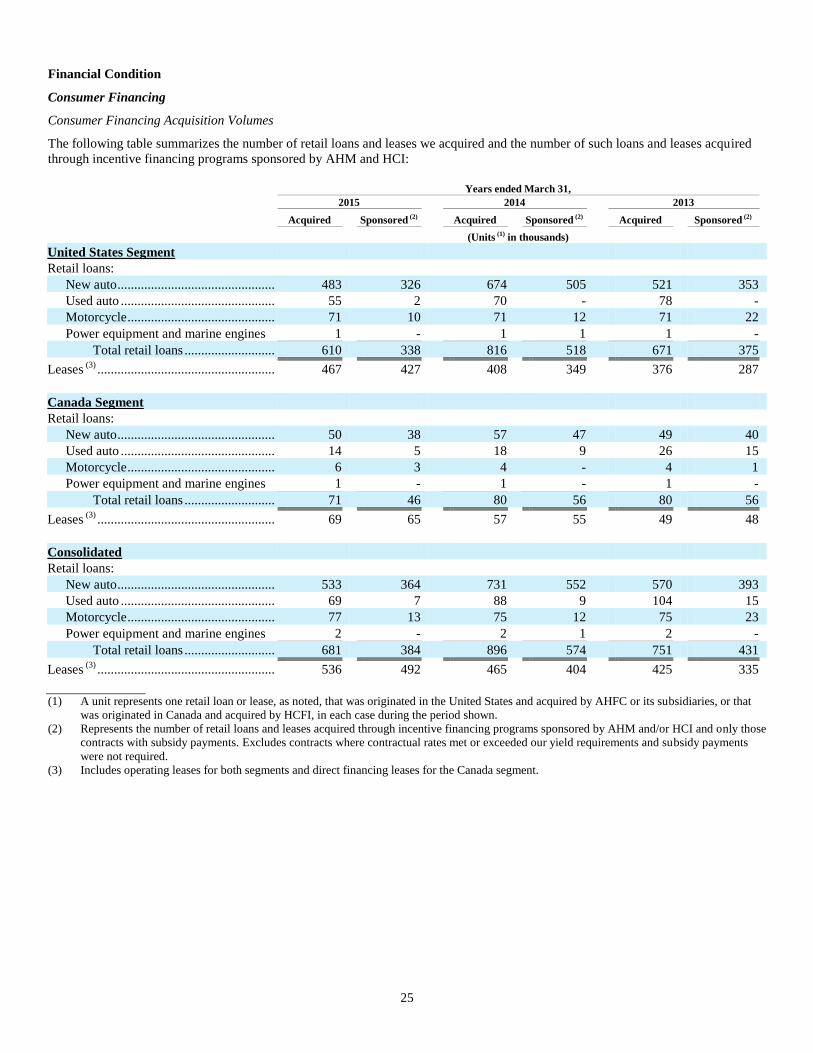
25
Financial Condition
Consumer Financing
Consumer Financing Acquisition Volumes
The following table summarizes the number of retail loans and leases we acquired and the number of such loans and leases acquired
through incentive financing programs sponsored by AHM and HCI:
Years ended March 31,
2015 2014 2013
Acquired Sponsored (2) Acquired Sponsored (2) Acquired Sponsored (2) (Units (1) in thousands) United States Segment
Retail loans:
New auto ............................................... 483 326 674 505 521 353
Used auto .............................................. 55 2 70 - 78 -
Motorcycle ............................................ 71 10 71 12 71 22
Power equipment and marine engines 1 - 1 1 1 -
Total retail loans ........................... 610 338 816 518 671 375
Leases (3)
..................................................... 467 427 408 349 376 287
Canada Segment
Retail loans:
New auto ............................................... 50 38 57 47 49 40
Used auto .............................................. 14 5 18 9 26 15
Motorcycle ............................................ 6 3 4 - 4 1
Power equipment and marine engines 1 - 1 - 1 -
Total retail loans ........................... 71 46 80 56 80 56
Leases (3)
..................................................... 69 65 57 55 49 48
Consolidated
Retail loans:
New auto ............................................... 533 364 731 552 570 393
Used auto .............................................. 69 7 88 9 104 15
Motorcycle ............................................ 77 13 75 12 75 23
Power equipment and marine engines 2 - 2 1 2 -
Total retail loans ........................... 681 384 896 574 751 431
Leases (3)
..................................................... 536 492 465 404 425 335
(1) A unit represents one retail loan or lease, as noted, that was originated in the United States and acquired by AHFC or its subsidiaries, or that
was originated in Canada and acquired by HCFI, in each case during the period shown.
(2) Represents the number of retail loans and leases acquired through incentive financing programs sponsored by AHM and/or HCI and only those
contracts with subsidy payments. Excludes contracts where contractual rates met or exceeded our yield requirements and subsidy payments
were not required.
(3) Includes operating leases for both segments and direct financing leases for the Canada segment.
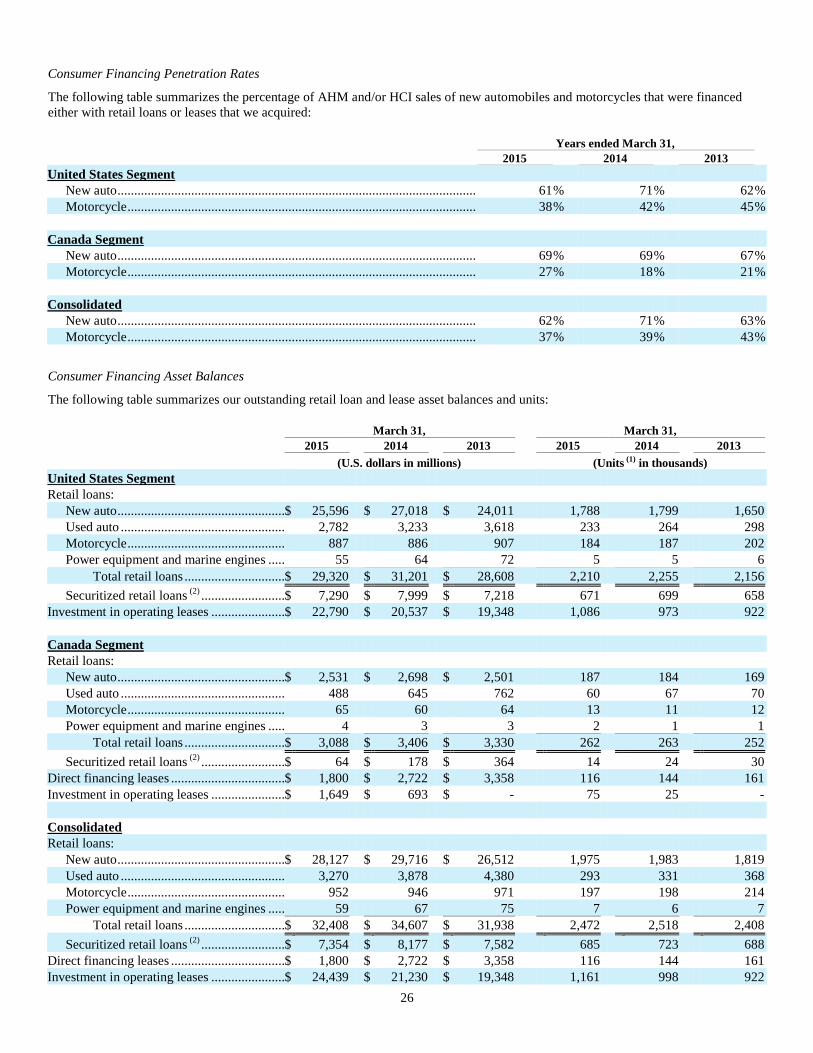
26
Consumer Financing Penetration Rates
The following table summarizes the percentage of AHM and/or HCI sales of new automobiles and motorcycles that were financed
either with retail loans or leases that we acquired:
Years ended March 31,
2015 2014 2013
United States Segment
New auto ........................................................................................................... 61 % 71 % 62 %
Motorcycle ........................................................................................................ 38 % 42 % 45 %
Canada Segment
New auto ........................................................................................................... 69 % 69 % 67 %
Motorcycle ........................................................................................................ 27 % 18 % 21 %
Consolidated
New auto ........................................................................................................... 62 % 71 % 63 %
Motorcycle ........................................................................................................ 37 % 39 % 43 %
Consumer Financing Asset Balances
The following table summarizes our outstanding retail loan and lease asset balances and units:
March 31, March 31,
2015 2014 2013 2015 2014 2013
(U.S. dollars in millions) (Units (1) in thousands) United States Segment
Retail loans:
New auto .................................................. $ 25,596 $ 27,018 $ 24,011 1,788 1,799 1,650
Used auto ................................................. 2,782 3,233 3,618 233 264 298
Motorcycle ............................................... 887 886 907 184 187 202
Power equipment and marine engines ..... 55 64 72 5 5 6
Total retail loans .............................. $ 29,320 $ 31,201 $ 28,608 2,210 2,255 2,156
Securitized retail loans (2)
......................... $ 7,290 $ 7,999 $ 7,218 671 699 658
Investment in operating leases ...................... $ 22,790 $ 20,537 $ 19,348 1,086 973 922
Canada Segment
Retail loans:
New auto .................................................. $ 2,531 $ 2,698 $ 2,501 187 184 169
Used auto ................................................. 488 645 762 60 67 70
Motorcycle ............................................... 65 60 64 13 11 12
Power equipment and marine engines ..... 4 3 3 2 1 1
Total retail loans .............................. $ 3,088 $ 3,406 $ 3,330 262 263 252
Securitized retail loans (2)
......................... $ 64 $ 178 $ 364 14 24 30
Direct financing leases .................................. $ 1,800 $ 2,722 $ 3,358 116 144 161
Investment in operating leases ...................... $ 1,649 $ 693 $ - 75 25 -
Consolidated
Retail loans:
New auto .................................................. $ 28,127 $ 29,716 $ 26,512 1,975 1,983 1,819
Used auto ................................................. 3,270 3,878 4,380 293 331 368
Motorcycle ............................................... 952 946 971 197 198 214
Power equipment and marine engines ..... 59 67 75 7 6 7
Total retail loans .............................. $ 32,408 $ 34,607 $ 31,938 2,472 2,518 2,408
Securitized retail loans (2)
......................... $ 7,354 $ 8,177 $ 7,582 685 723 688
Direct financing leases .................................. $ 1,800 $ 2,722 $ 3,358 116 144 161
Investment in operating leases ...................... $ 24,439 $ 21,230 $ 19,348 1,161 998 922
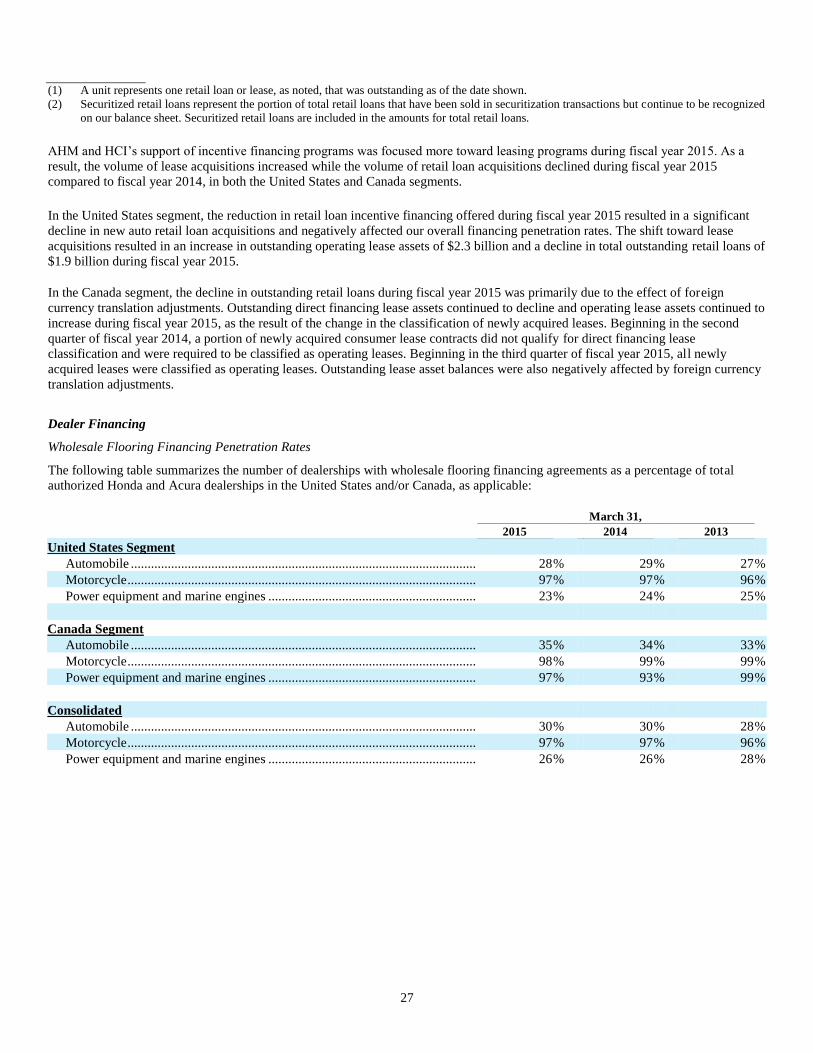
27
(1) A unit represents one retail loan or lease, as noted, that was outstanding as of the date shown.
(2) Securitized retail loans represent the portion of total retail loans that have been sold in securitization transactions but continue to be recognized
on our balance sheet. Securitized retail loans are included in the amounts for total retail loans.
AHM and HCI’s support of incentive financing programs was focused more toward leasing programs during fiscal year 2015. As a
result, the volume of lease acquisitions increased while the volume of retail loan acquisitions declined during fiscal year 2015
compared to fiscal year 2014, in both the United States and Canada segments.
In the United States segment, the reduction in retail loan incentive financing offered during fiscal year 2015 resulted in a significant
decline in new auto retail loan acquisitions and negatively affected our overall financing penetration rates. The shift toward lease
acquisitions resulted in an increase in outstanding operating lease assets of $2.3 billion and a decline in total outstanding retail loans of
$1.9 billion during fiscal year 2015.
In the Canada segment, the decline in outstanding retail loans during fiscal year 2015 was primarily due to the effect of foreign
currency translation adjustments. Outstanding direct financing lease assets continued to decline and operating lease assets continued to
increase during fiscal year 2015, as the result of the change in the classification of newly acquired leases. Beginning in the second
quarter of fiscal year 2014, a portion of newly acquired consumer lease contracts did not qualify for direct financing lease
classification and were required to be classified as operating leases. Beginning in the third quarter of fiscal year 2015, all newly
acquired leases were classified as operating leases. Outstanding lease asset balances were also negatively affected by foreign currency
translation adjustments.
Dealer Financing
Wholesale Flooring Financing Penetration Rates
The following table summarizes the number of dealerships with wholesale flooring financing agreements as a percentage of total
authorized Honda and Acura dealerships in the United States and/or Canada, as applicable:
March 31,
2015 2014 2013
United States Segment
Automobile ....................................................................................................... 28 % 29 % 27 %
Motorcycle ........................................................................................................ 97 % 97 % 96 %
Power equipment and marine engines .............................................................. 23 % 24 % 25 %
Canada Segment
Automobile ....................................................................................................... 35 % 34 % 33 %
Motorcycle ........................................................................................................ 98 % 99 % 99 %
Power equipment and marine engines .............................................................. 97 % 93 % 99 %
Consolidated
Automobile ....................................................................................................... 30 % 30 % 28 %
Motorcycle ........................................................................................................ 97 % 97 % 96 %
Power equipment and marine engines .............................................................. 26 % 26 % 28 %
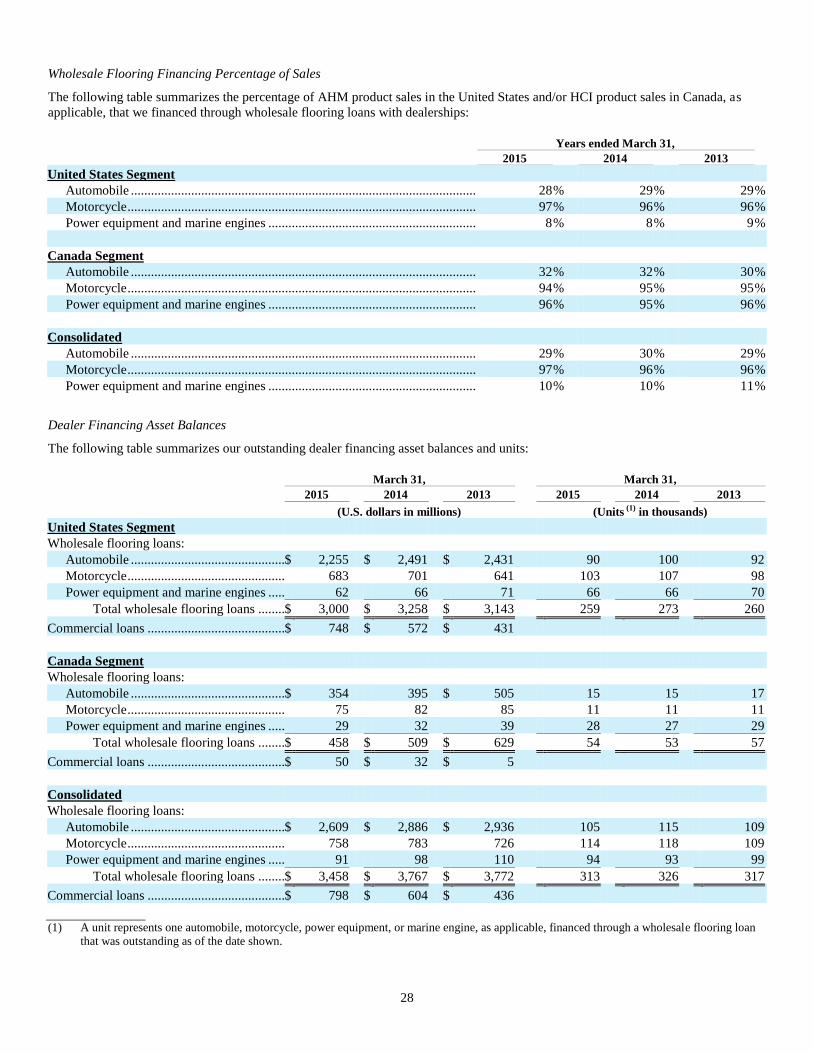
28
Wholesale Flooring Financing Percentage of Sales
The following table summarizes the percentage of AHM product sales in the United States and/or HCI product sales in Canada, as
applicable, that we financed through wholesale flooring loans with dealerships:
Years ended March 31,
2015 2014 2013
United States Segment
Automobile ....................................................................................................... 28 % 29 % 29 %
Motorcycle ........................................................................................................ 97 % 96 % 96 %
Power equipment and marine engines .............................................................. 8 % 8 % 9 %
Canada Segment
Automobile ....................................................................................................... 32 % 32 % 30 %
Motorcycle ........................................................................................................ 94 % 95 % 95 %
Power equipment and marine engines .............................................................. 96 % 95 % 96 %
Consolidated
Automobile ....................................................................................................... 29 % 30 % 29 %
Motorcycle ........................................................................................................ 97 % 96 % 96 %
Power equipment and marine engines .............................................................. 10 % 10 % 11 %
Dealer Financing Asset Balances
The following table summarizes our outstanding dealer financing asset balances and units:
March 31, March 31,
2015 2014 2013 2015 2014 2013
(U.S. dollars in millions) (Units (1) in thousands) United States Segment
Wholesale flooring loans:
Automobile .............................................. $ 2,255 $ 2,491 $ 2,431 90 100 92
Motorcycle ............................................... 683 701 641 103 107 98
Power equipment and marine engines ..... 62 66 71 66 66 70
Total wholesale flooring loans ........ $ 3,000 $ 3,258 $ 3,143 259 273 260
Commercial loans ......................................... $ 748 $ 572 $ 431
Canada Segment
Wholesale flooring loans:
Automobile .............................................. $ 354 395 $ 505 15 15 17
Motorcycle ............................................... 75 82 85 11 11 11
Power equipment and marine engines ..... 29 32 39 28 27 29
Total wholesale flooring loans ........ $ 458 $ 509 $ 629 54 53 57
Commercial loans ......................................... $ 50 $ 32 $ 5
Consolidated
Wholesale flooring loans:
Automobile .............................................. $ 2,609 $ 2,886 $ 2,936 105 115 109
Motorcycle ............................................... 758 783 726 114 118 109
Power equipment and marine engines ..... 91 98 110 94 93 99
Total wholesale flooring loans ........ $ 3,458 $ 3,767 $ 3,772 313 326 317
Commercial loans ......................................... $ 798 $ 604 $ 436
(1) A unit represents one automobile, motorcycle, power equipment, or marine engine, as applicable, financed through a wholesale flooring loan
that was outstanding as of the date shown.
29
In the United States segment, the average outstanding balance of wholesale flooring loans declined during fiscal year 2015 compared
to fiscal year 2014 due to a slight decline in auto flooring penetration rates. The average outstanding balance of commercial loans
increased during fiscal year 2015 compared to fiscal year 2014 which contributed to the overall increase in revenue from dealer loans.
In the Canada segment, the decline in outstanding dealer loans during fiscal year 2015 was primarily due to the effect of foreign
currency translation adjustments.
Credit Risk
Credit losses are an expected cost of extending credit. The majority of our credit risk is in consumer financing and to a lesser extent in
dealer financing. Credit risk of our portfolio of consumer finance receivables can be affected by general economic conditions. Adverse
changes such as a rise in unemployment rates can increase the likelihood of defaults. Declines in used vehicle prices can reduce the
amount of recoveries on repossessed collateral. We manage our exposure to credit risk in retail loans and direct financing leases by
monitoring and adjusting our underwriting standards, which affect the level of credit risk that we assume, pricing contracts for
expected losses, and focusing collection efforts to minimize losses.
We are also exposed to credit risk on our portfolio of operating lease assets. We expect a portion of our operating leases to terminate
prior to their scheduled maturities when lessees default on their contractual obligations. Losses are generally realized upon the
disposition of the repossessed operating lease vehicles. The factors affecting credit risk on our operating leases and our management
of the risk are similar to that of our retail loans and direct financing leases.
Credit risk on dealer loans is affected primarily by the financial strength of the dealers within the portfolio, the value of collateral
securing the financings, and economic and market factors that could affect the creditworthiness of dealers. We manage our exposure
to credit risk in dealer financing by performing comprehensive reviews of dealers prior to establishing financing arrangements and
continuously monitoring the payment performance and creditworthiness of these dealers. In the event of default by a dealer, we seek
all available legal remedies pursuant to the related dealer agreements and guarantees. Additionally, we have entered into agreements
with AHM and HCI that provide for the repurchase of any new, unused, undamaged and unregistered vehicle or equipment
repossessed by us from a dealer in the United States and Canada, respectively, who defaulted under the terms of its wholesale flooring
agreement with us at the net cost of the financing that we provided.
An allowance for credit losses is maintained for management’s estimate of probable losses incurred on finance receivables. We also
maintain an estimate for early termination losses on operating lease assets due to lessee defaults and an allowance for credit losses on
past due operating lease rental payments.
Additional information regarding credit losses is provided in the discussion of “—Critical Accounting Policies—Credit Losses”
below.
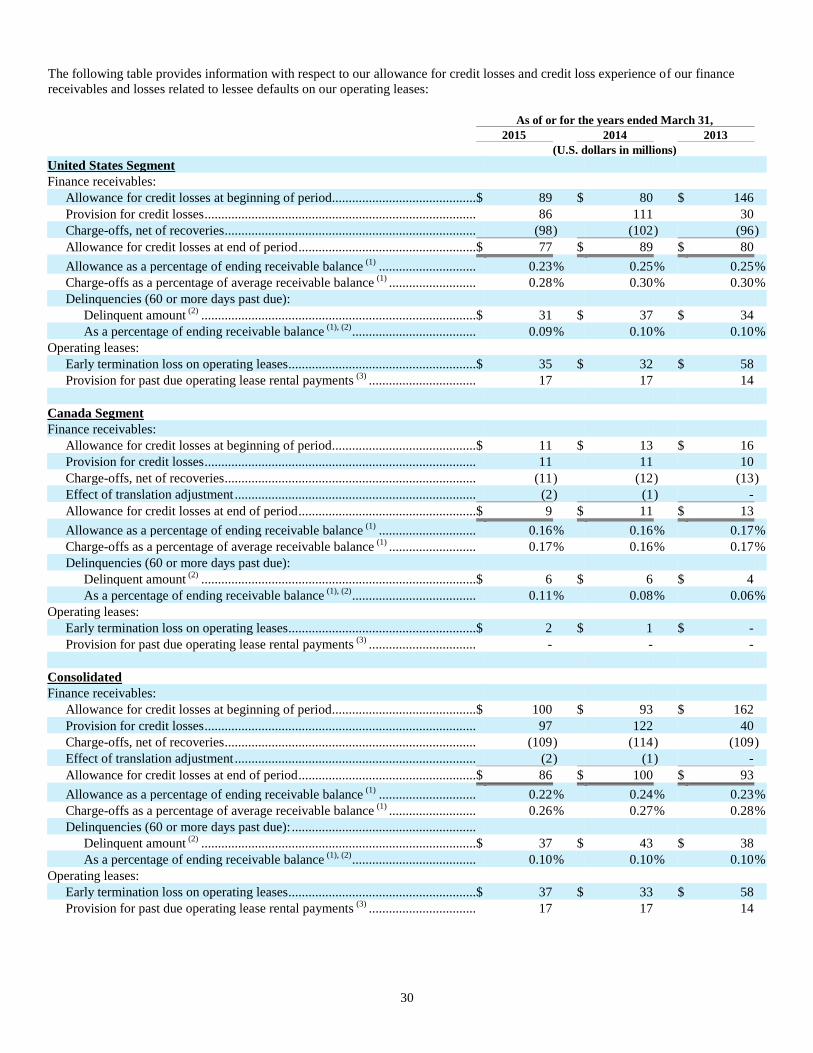
30
The following table provides information with respect to our allowance for credit losses and credit loss experience of our finance
receivables and losses related to lessee defaults on our operating leases:
As of or for the years ended March 31,
2015 2014 2013
(U.S. dollars in millions)
United States Segment
Finance receivables:
Allowance for credit losses at beginning of period........................................... $ 89 $ 80 $ 146
Provision for credit losses ................................................................................. 86 111 30
Charge-offs, net of recoveries ........................................................................... (98 ) (102 ) (96 )
Allowance for credit losses at end of period ..................................................... $ 77 $ 89 $ 80
Allowance as a percentage of ending receivable balance (1)
............................. 0.23 % 0.25 % 0.25 %
Charge-offs as a percentage of average receivable balance (1)
.......................... 0.28 % 0.30 % 0.30 %
Delinquencies (60 or more days past due):
Delinquent amount (2)
.................................................................................. $ 31 $ 37 $ 34
As a percentage of ending receivable balance (1), (2)
..................................... 0.09 % 0.10 % 0.10 %
Operating leases:
Early termination loss on operating leases........................................................ $ 35 $ 32 $ 58
Provision for past due operating lease rental payments (3)
................................ 17 17 14
Canada Segment
Finance receivables:
Allowance for credit losses at beginning of period........................................... $ 11 $ 13 $ 16
Provision for credit losses ................................................................................. 11 11 10
Charge-offs, net of recoveries ........................................................................... (11 ) (12 ) (13 )
Effect of translation adjustment ........................................................................ (2 ) (1 ) -
Allowance for credit losses at end of period ..................................................... $ 9 $ 11 $ 13
Allowance as a percentage of ending receivable balance (1)
............................. 0.16 % 0.16 % 0.17 %
Charge-offs as a percentage of average receivable balance (1)
.......................... 0.17 % 0.16 % 0.17 %
Delinquencies (60 or more days past due):
Delinquent amount (2)
.................................................................................. $ 6 $ 6 $ 4
As a percentage of ending receivable balance (1), (2)
..................................... 0.11 % 0.08 % 0.06 %
Operating leases:
Early termination loss on operating leases........................................................ $ 2 $ 1 $ -
Provision for past due operating lease rental payments (3)
................................ - - -
Consolidated
Finance receivables:
Allowance for credit losses at beginning of period........................................... $ 100 $ 93 $ 162
Provision for credit losses ................................................................................. 97 122 40
Charge-offs, net of recoveries ........................................................................... (109 ) (114 ) (109 )
Effect of translation adjustment ........................................................................ (2 ) (1 ) -
Allowance for credit losses at end of period ..................................................... $ 86 $ 100 $ 93
Allowance as a percentage of ending receivable balance (1)
............................. 0.22 % 0.24 % 0.23 %
Charge-offs as a percentage of average receivable balance (1)
.......................... 0.26 % 0.27 % 0.28 %
Delinquencies (60 or more days past due): .......................................................
Delinquent amount (2)
.................................................................................. $ 37 $ 43 $ 38
As a percentage of ending receivable balance (1), (2)
..................................... 0.10 % 0.10 % 0.10 %
Operating leases:
Early termination loss on operating leases........................................................ $ 37 $ 33 $ 58
Provision for past due operating lease rental payments (3)
................................ 17 17 14
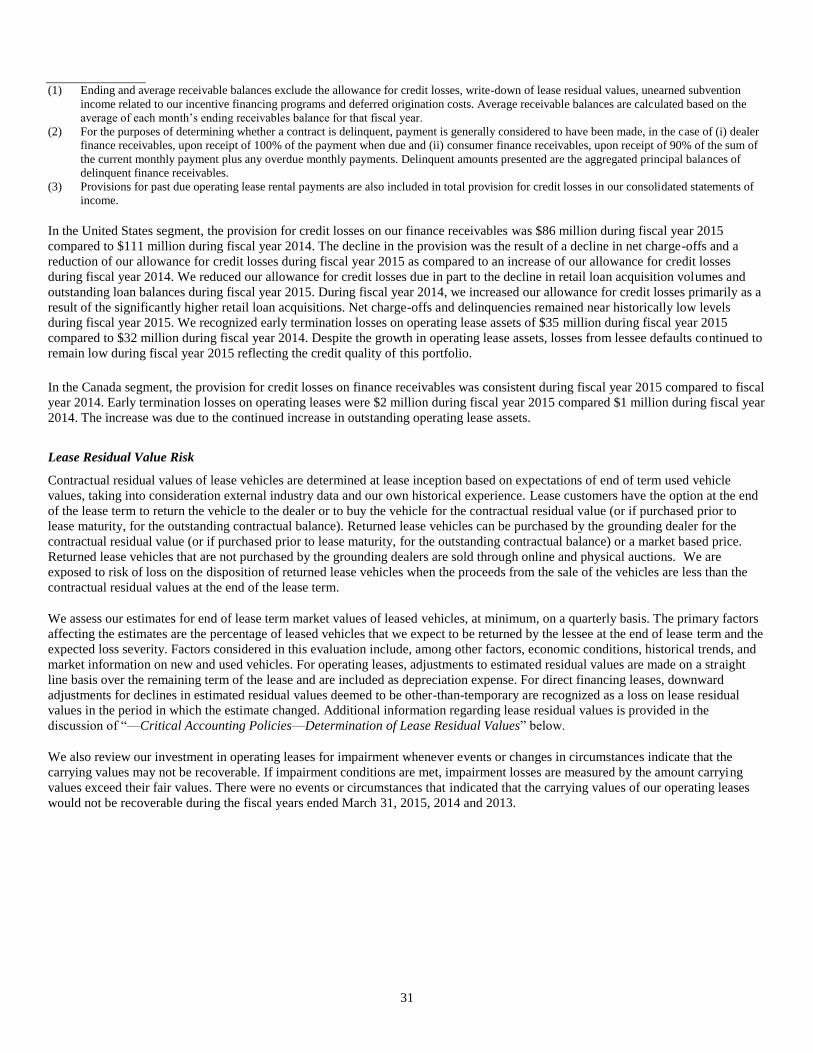
31
(1) Ending and average receivable balances exclude the allowance for credit losses, write-down of lease residual values, unearned subvention
income related to our incentive financing programs and deferred origination costs. Average receivable balances are calculated based on the
average of each month’s ending receivables balance for that fiscal year.
(2) For the purposes of determining whether a contract is delinquent, payment is generally considered to have been made, in the case of (i) dealer
finance receivables, upon receipt of 100% of the payment when due and (ii) consumer finance receivables, upon receipt of 90% of the sum of
the current monthly payment plus any overdue monthly payments. Delinquent amounts presented are the aggregated principal balances of
delinquent finance receivables.
(3) Provisions for past due operating lease rental payments are also included in total provision for credit losses in our consolidated statements of
income.
In the United States segment, the provision for credit losses on our finance receivables was $86 million during fiscal year 2015
compared to $111 million during fiscal year 2014. The decline in the provision was the result of a decline in net charge-offs and a
reduction of our allowance for credit losses during fiscal year 2015 as compared to an increase of our allowance for credit losses
during fiscal year 2014. We reduced our allowance for credit losses due in part to the decline in retail loan acquisition volumes and
outstanding loan balances during fiscal year 2015. During fiscal year 2014, we increased our allowance for credit losses primarily as a
result of the significantly higher retail loan acquisitions. Net charge-offs and delinquencies remained near historically low levels
during fiscal year 2015. We recognized early termination losses on operating lease assets of $35 million during fiscal year 2015
compared to $32 million during fiscal year 2014. Despite the growth in operating lease assets, losses from lessee defaults continued to
remain low during fiscal year 2015 reflecting the credit quality of this portfolio.
In the Canada segment, the provision for credit losses on finance receivables was consistent during fiscal year 2015 compared to fiscal
year 2014. Early termination losses on operating leases were $2 million during fiscal year 2015 compared $1 million during fiscal year
2014. The increase was due to the continued increase in outstanding operating lease assets.
Lease Residual Value Risk
Contractual residual values of lease vehicles are determined at lease inception based on expectations of end of term used vehicle
values, taking into consideration external industry data and our own historical experience. Lease customers have the option at the end
of the lease term to return the vehicle to the dealer or to buy the vehicle for the contractual residual value (or if purchased prior to
lease maturity, for the outstanding contractual balance). Returned lease vehicles can be purchased by the grounding dealer for the
contractual residual value (or if purchased prior to lease maturity, for the outstanding contractual balance) or a market based price.
Returned lease vehicles that are not purchased by the grounding dealers are sold through online and physical auctions. We are
exposed to risk of loss on the disposition of returned lease vehicles when the proceeds from the sale of the vehicles are less than the
contractual residual values at the end of the lease term.
We assess our estimates for end of lease term market values of leased vehicles, at minimum, on a quarterly basis. The primary factors
affecting the estimates are the percentage of leased vehicles that we expect to be returned by the lessee at the end of lease term and the
expected loss severity. Factors considered in this evaluation include, among other factors, economic conditions, historical trends, and
market information on new and used vehicles. For operating leases, adjustments to estimated residual values are made on a straight
line basis over the remaining term of the lease and are included as depreciation expense. For direct financing leases, downward
adjustments for declines in estimated residual values deemed to be other-than-temporary are recognized as a loss on lease residual
values in the period in which the estimate changed. Additional information regarding lease residual values is provided in the
discussion of “—Critical Accounting Policies—Determination of Lease Residual Values” below.
We also review our investment in operating leases for impairment whenever events or changes in circumstances indicate that the
carrying values may not be recoverable. If impairment conditions are met, impairment losses are measured by the amount carrying
values exceed their fair values. There were no events or circumstances that indicated that the carrying values of our operating leases
would not be recoverable during the fiscal years ended March 31, 2015, 2014 and 2013.
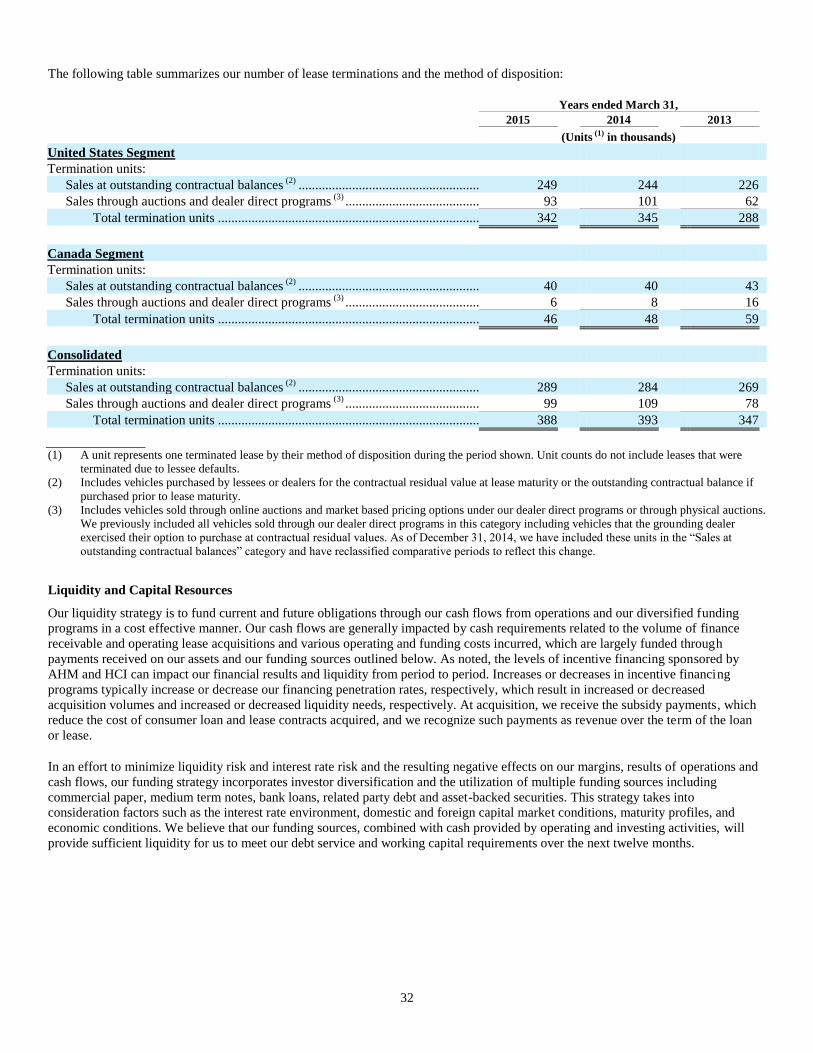
32
The following table summarizes our number of lease terminations and the method of disposition:
Years ended March 31,
2015 2014 2013
(Units (1) in thousands) United States Segment
Termination units:
Sales at outstanding contractual balances (2)
...................................................... 249 244 226
Sales through auctions and dealer direct programs (3)
........................................ 93 101 62
Total termination units .............................................................................. 342 345 288
Canada Segment
Termination units:
Sales at outstanding contractual balances (2)
...................................................... 40 40 43
Sales through auctions and dealer direct programs (3)
........................................ 6 8 16
Total termination units .............................................................................. 46 48 59
Consolidated
Termination units:
Sales at outstanding contractual balances (2)
...................................................... 289 284 269
Sales through auctions and dealer direct programs (3)
........................................ 99 109 78
Total termination units .............................................................................. 388 393 347
(1) A unit represents one terminated lease by their method of disposition during the period shown. Unit counts do not include leases that were
terminated due to lessee defaults.
(2) Includes vehicles purchased by lessees or dealers for the contractual residual value at lease maturity or the outstanding contractual balance if
purchased prior to lease maturity.
(3) Includes vehicles sold through online auctions and market based pricing options under our dealer direct programs or through physical auctions.
We previously included all vehicles sold through our dealer direct programs in this category including vehicles that the grounding dealer
exercised their option to purchase at contractual residual values. As of December 31, 2014, we have included these units in the “Sales at
outstanding contractual balances” category and have reclassified comparative periods to reflect this change.
Liquidity and Capital Resources
Our liquidity strategy is to fund current and future obligations through our cash flows from operations and our diversified funding
programs in a cost effective manner. Our cash flows are generally impacted by cash requirements related to the volume of finance
receivable and operating lease acquisitions and various operating and funding costs incurred, which are largely funded through
payments received on our assets and our funding sources outlined below. As noted, the levels of incentive financing sponsored by
AHM and HCI can impact our financial results and liquidity from period to period. Increases or decreases in incentive financing
programs typically increase or decrease our financing penetration rates, respectively, which result in increased or decreased
acquisition volumes and increased or decreased liquidity needs, respectively. At acquisition, we receive the subsidy payments, which
reduce the cost of consumer loan and lease contracts acquired, and we recognize such payments as revenue over the term of the loan
or lease.
In an effort to minimize liquidity risk and interest rate risk and the resulting negative effects on our margins, results of operations and
cash flows, our funding strategy incorporates investor diversification and the utilization of multiple funding sources including
commercial paper, medium term notes, bank loans, related party debt and asset-backed securities. This strategy takes into
consideration factors such as the interest rate environment, domestic and foreign capital market conditions, maturity profiles, and
economic conditions. We believe that our funding sources, combined with cash provided by operating and investing activities, will
provide sufficient liquidity for us to meet our debt service and working capital requirements over the next twelve months.
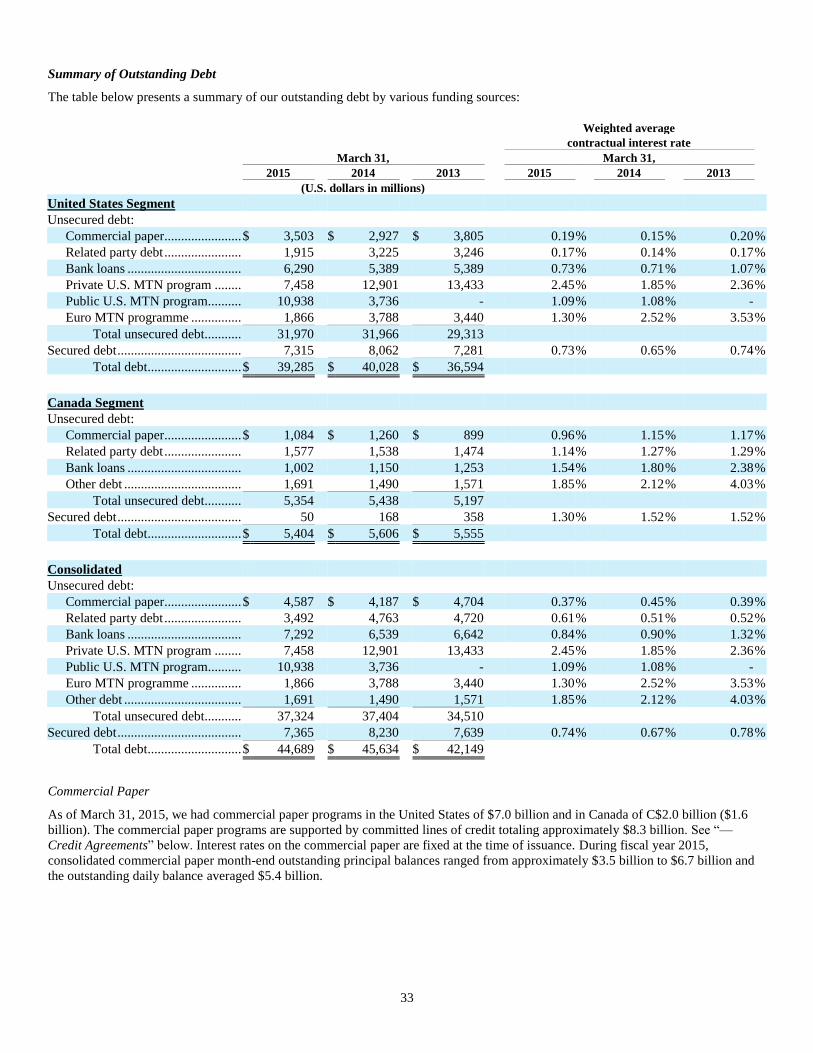
33
Summary of Outstanding Debt
The table below presents a summary of our outstanding debt by various funding sources:
Weighted average
contractual interest rate
March 31, March 31,
2015 2014 2013 2015 2014 2013
(U.S. dollars in millions)
United States Segment
Unsecured debt:
Commercial paper....................... $ 3,503 $ 2,927 $ 3,805 0.19 % 0.15 % 0.20 %
Related party debt ....................... 1,915 3,225 3,246 0.17 % 0.14 % 0.17 %
Bank loans .................................. 6,290 5,389 5,389 0.73 % 0.71 % 1.07 %
Private U.S. MTN program ........ 7,458 12,901 13,433 2.45 % 1.85 % 2.36 %
Public U.S. MTN program.......... 10,938 3,736 - 1.09 % 1.08 % -
Euro MTN programme ............... 1,866 3,788 3,440 1.30 % 2.52 % 3.53 %
Total unsecured debt........... 31,970 31,966 29,313
Secured debt ..................................... 7,315 8,062 7,281 0.73 % 0.65 % 0.74 %
Total debt ............................ $ 39,285 $ 40,028 $ 36,594
Canada Segment
Unsecured debt:
Commercial paper....................... $ 1,084 $ 1,260 $ 899 0.96 % 1.15 % 1.17 %
Related party debt ....................... 1,577 1,538 1,474 1.14 % 1.27 % 1.29 %
Bank loans .................................. 1,002 1,150 1,253 1.54 % 1.80 % 2.38 %
Other debt ................................... 1,691 1,490 1,571 1.85 % 2.12 % 4.03 %
Total unsecured debt........... 5,354 5,438 5,197
Secured debt ..................................... 50 168 358 1.30 % 1.52 % 1.52 %
Total debt ............................ $ 5,404 $ 5,606 $ 5,555
Consolidated
Unsecured debt:
Commercial paper....................... $ 4,587 $ 4,187 $ 4,704 0.37 % 0.45 % 0.39 %
Related party debt ....................... 3,492 4,763 4,720 0.61 % 0.51 % 0.52 %
Bank loans .................................. 7,292 6,539 6,642 0.84 % 0.90 % 1.32 %
Private U.S. MTN program ........ 7,458 12,901 13,433 2.45 % 1.85 % 2.36 %
Public U.S. MTN program.......... 10,938 3,736 - 1.09 % 1.08 % -
Euro MTN programme ............... 1,866 3,788 3,440 1.30 % 2.52 % 3.53 %
Other debt ................................... 1,691 1,490 1,571 1.85 % 2.12 % 4.03 %
Total unsecured debt........... 37,324 37,404 34,510
Secured debt ..................................... 7,365 8,230 7,639 0.74 % 0.67 % 0.78 %
Total debt ............................ $ 44,689 $ 45,634 $ 42,149
Commercial Paper
As of March 31, 2015, we had commercial paper programs in the United States of $7.0 billion and in Canada of C$2.0 billion ($1.6
billion). The commercial paper programs are supported by committed lines of credit totaling approximately $8.3 billion. See “—
Credit Agreements” below. Interest rates on the commercial paper are fixed at the time of issuance. During fiscal year 2015,
consolidated commercial paper month-end outstanding principal balances ranged from approximately $3.5 billion to $6.7 billion and
the outstanding daily balance averaged $5.4 billion.
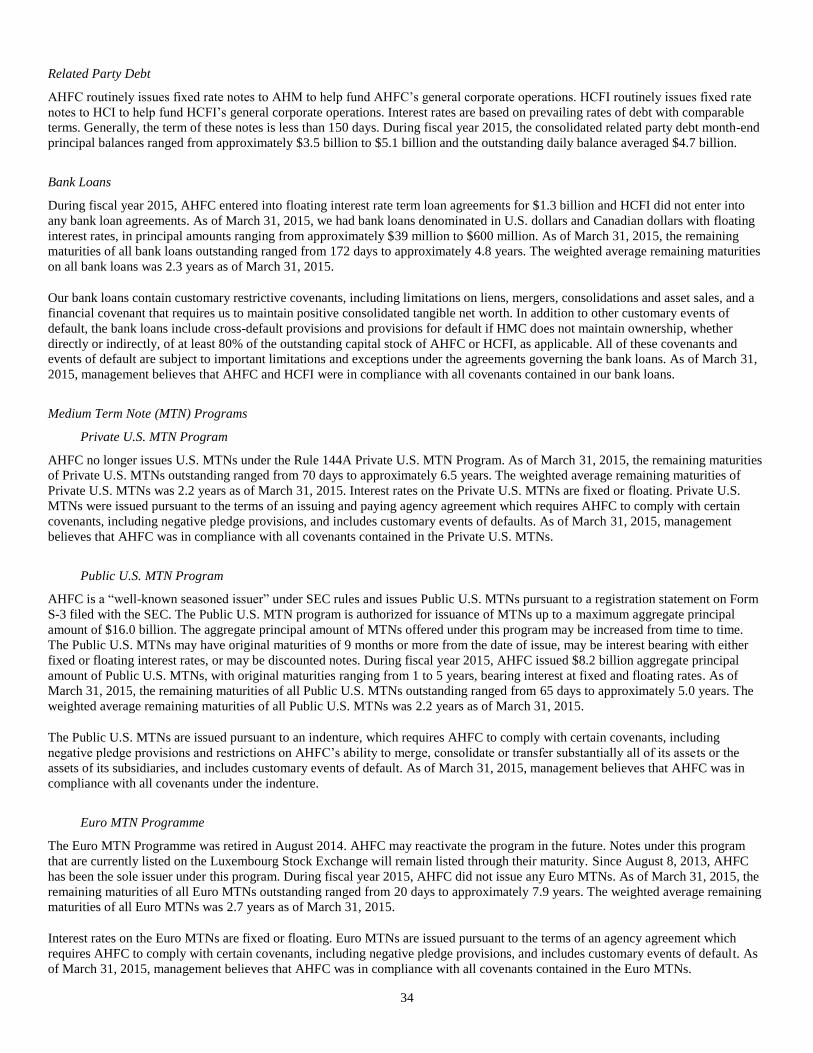
34
Related Party Debt
AHFC routinely issues fixed rate notes to AHM to help fund AHFC’s general corporate operations. HCFI routinely issues fixed rate
notes to HCI to help fund HCFI’s general corporate operations. Interest rates are based on prevailing rates of debt with comparable
terms. Generally, the term of these notes is less than 150 days. During fiscal year 2015, the consolidated related party debt month-end
principal balances ranged from approximately $3.5 billion to $5.1 billion and the outstanding daily balance averaged $4.7 billion.
Bank Loans
During fiscal year 2015, AHFC entered into floating interest rate term loan agreements for $1.3 billion and HCFI did not enter into
any bank loan agreements. As of March 31, 2015, we had bank loans denominated in U.S. dollars and Canadian dollars with floating
interest rates, in principal amounts ranging from approximately $39 million to $600 million. As of March 31, 2015, the remaining
maturities of all bank loans outstanding ranged from 172 days to approximately 4.8 years. The weighted average remaining maturities
on all bank loans was 2.3 years as of March 31, 2015.
Our bank loans contain customary restrictive covenants, including limitations on liens, mergers, consolidations and asset sales, and a
financial covenant that requires us to maintain positive consolidated tangible net worth. In addition to other customary events of
default, the bank loans include cross-default provisions and provisions for default if HMC does not maintain ownership, whether
directly or indirectly, of at least 80% of the outstanding capital stock of AHFC or HCFI, as applicable. All of these covenants and
events of default are subject to important limitations and exceptions under the agreements governing the bank loans. As of March 31,
2015, management believes that AHFC and HCFI were in compliance with all covenants contained in our bank loans.
Medium Term Note (MTN) Programs
Private U.S. MTN Program
AHFC no longer issues U.S. MTNs under the Rule 144A Private U.S. MTN Program. As of March 31, 2015, the remaining maturities
of Private U.S. MTNs outstanding ranged from 70 days to approximately 6.5 years. The weighted average remaining maturities of
Private U.S. MTNs was 2.2 years as of March 31, 2015. Interest rates on the Private U.S. MTNs are fixed or floating. Private U.S.
MTNs were issued pursuant to the terms of an issuing and paying agency agreement which requires AHFC to comply with certain
covenants, including negative pledge provisions, and includes customary events of defaults. As of March 31, 2015, management
believes that AHFC was in compliance with all covenants contained in the Private U.S. MTNs.
Public U.S. MTN Program
AHFC is a “well-known seasoned issuer” under SEC rules and issues Public U.S. MTNs pursuant to a registration statement on Form
S-3 filed with the SEC. The Public U.S. MTN program is authorized for issuance of MTNs up to a maximum aggregate principal
amount of $16.0 billion. The aggregate principal amount of MTNs offered under this program may be increased from time to time.
The Public U.S. MTNs may have original maturities of 9 months or more from the date of issue, may be interest bearing with either
fixed or floating interest rates, or may be discounted notes. During fiscal year 2015, AHFC issued $8.2 billion aggregate principal
amount of Public U.S. MTNs, with original maturities ranging from 1 to 5 years, bearing interest at fixed and floating rates. As of
March 31, 2015, the remaining maturities of all Public U.S. MTNs outstanding ranged from 65 days to approximately 5.0 years. The
weighted average remaining maturities of all Public U.S. MTNs was 2.2 years as of March 31, 2015.
The Public U.S. MTNs are issued pursuant to an indenture, which requires AHFC to comply with certain covenants, including
negative pledge provisions and restrictions on AHFC’s ability to merge, consolidate or transfer substantially all of its assets or the
assets of its subsidiaries, and includes customary events of default. As of March 31, 2015, management believes that AHFC was in
compliance with all covenants under the indenture.
Euro MTN Programme
The Euro MTN Programme was retired in August 2014. AHFC may reactivate the program in the future. Notes under this program
that are currently listed on the Luxembourg Stock Exchange will remain listed through their maturity. Since August 8, 2013, AHFC
has been the sole issuer under this program. During fiscal year 2015, AHFC did not issue any Euro MTNs. As of March 31, 2015, the
remaining maturities of all Euro MTNs outstanding ranged from 20 days to approximately 7.9 years. The weighted average remaining
maturities of all Euro MTNs was 2.7 years as of March 31, 2015.
Interest rates on the Euro MTNs are fixed or floating. Euro MTNs are issued pursuant to the terms of an agency agreement which
requires AHFC to comply with certain covenants, including negative pledge provisions, and includes customary events of default. As
of March 31, 2015, management believes that AHFC was in compliance with all covenants contained in the Euro MTNs.

35
Details of our outstanding Euro MTNs by currency is as follows:
March 31,
2015 2014 2013
(U.S. dollars in millions)
U.S. dollar ..................................... $ 793 42 % $ 942 25 % $ 813 24 %
Japanese yen .................................. 271 15 % 373 10 % 515 15 %
Euro ............................................... 802 43 % 2,473 65 % 2,112 61 %
Total ......................................... $ 1,866 100 % $ 3,788 100 % $ 3,440 100 %
Other Debt
HCFI issues privately placed Canadian dollar denominated notes. During fiscal year 2015, HCFI issued C$800 million ($631 million)
of these notes with original maturities of 2.5 years to 4.5 years. As of March 31, 2015, the remaining maturities of all of HCFI’s
Canadian notes outstanding ranged from 247 days to approximately 4.4 years. The weighted average remaining maturities of these
notes was 2.8 years as of March 31, 2015.
The notes are issued pursuant to the terms of an indenture, which requires HCFI to comply with certain covenants, including negative
pledge provisions, and includes customary events of default. As of March 31, 2015, management believes that HCFI was in
compliance with all covenants contained in the privately placed notes.
Secured Debt
Asset-Backed Securities
We enter into securitization transactions for funding purposes. Securitization transactions involve transferring pools of retail loans to
statutory trusts. The trusts are special-purpose entities that we establish to accommodate securitization structures. Securitization trusts
have the limited purpose of acquiring assets, issuing asset-backed securities, and making payments on the securities. Assets transferred
to securitization trusts are considered to be legally isolated from us and the claims of our creditors. We continue to service the retail
loans transferred to the trusts. Investors in the notes issued by a trust only have recourse to the assets of such trust and do not have
recourse to AHFC, HCFI, or our other subsidiaries or to other trusts.
Our securitizations are structured to provide credit enhancements to investors in the notes issued by the trusts. Credit enhancements
can include the following:
Subordinated certificates—which are securities issued by the trusts that are retained by us and are subordinated in priority
of payment to the notes.
Overcollateralization—which occurs when the principal balance of securitized assets exceed the balance of securities
issued by the trust.
Excess interest—which allows excess interest collections to be used to cover losses on defaulted loans.
Reserve funds—which are restricted cash accounts held by the trusts to cover shortfalls in payments of interest and
principal required to be paid on the notes.
Yield supplement accounts—which are restricted cash accounts held by the trusts to supplement interest payments on
notes.
We are required to consolidate the securitization trusts in our financial statements, which results in the securitizations being accounted
for as on-balance sheet secured financings. The securitized receivables remain on our consolidated balance sheet along with the notes
issued by the trusts. The notes are secured solely by the assets of the applicable trust and not by any of our other assets or those of
other trusts. The assets of a trust are the only source of funds for repayment on the notes of such trust.
During the fiscal year ended March 31, 2015, we issued notes through asset-backed securitizations totaling $4.3 billion, which were
secured by consumer finance receivables with an initial principal balance of $4.4 billion.
36
Asset-Backed Conduits
In September 2010, we entered into a receivables loan agreement with a bank-sponsored asset-backed commercial paper conduit to
allow us access to additional secured funding. Under this agreement, we would transfer finance receivables to funding agents as
collateral for debt issued by the funding agents who are contractually committed, at our option, to make advances to us of up to $500
million. This agreement was amended in September 2014 and expires in September 2015. As of March 31, 2015, we had no amounts
outstanding under this agreement. Our ability to obtain funding under this agreement is subject to us having a sufficient amount of
assets eligible and any unused portion of this commitment may be terminated if the performance of the underlying assets deteriorates
beyond specified levels.
Credit Agreements
We maintain committed lines of credit with various financial institutions. These credit agreements are primarily in place to support our
commercial paper programs. If these lines were used, it would be in the form of short-term notes.
AHFC maintains a $3.5 billion 364 day credit agreement, as amended, which expires on March 4, 2016, and a $3.5 billion five year
credit agreement, as amended, which expires on March 7, 2020. At March 31, 2015, no amounts were outstanding or repaid under the
AHFC credit agreements. AHFC intends to renew or replace the credit agreements prior to or on their respective expiration dates.
HCFI maintains a C$1.6 billion ($1.3 billion) credit agreement, as amended, which provides that HCFI may borrow up to C$800
million ($631 million) on a one year and five-year revolving basis. The one year tranche of the credit agreement terminates on March
24, 2016 and the five year tranche of the credit agreement expires on March 24, 2020. At March 31, 2015, no amounts were
outstanding or repaid under the HCFI credit agreement. HCFI intends to renew or replace the credit agreement prior to or on the
expiration date of each respective tranche.
The credit agreements contain customary conditions to borrowing and customary restrictive covenants, including limitations on liens
and limitations on mergers, consolidations and asset sales. The credit agreements also require us to maintain a positive consolidated
tangible net worth. The credit agreements, in addition to other customary events of default, include cross-default provisions and
provisions for default if HMC does not maintain ownership, whether directly or indirectly, of at least 80% of the outstanding capital
stock of AHFC or HCFI, as applicable. In addition, the AHFC and HCFI credit agreements contain provisions for default if HMC’s
obligations under the HMC-AHFC Agreement or the HMC-HCFI Agreement, as applicable, become invalid, voidable, or
unenforceable. All of these conditions, covenants and events of default are subject to important limitations and exceptions under the
agreements governing the credit agreements. As of March 31, 2015, management believes that AHFC and HCFI were in compliance
with all covenants contained in the credit agreements.
Keep Well Agreements
HMC has entered into separate Keep Well Agreements with AHFC and HCFI. Pursuant to the Keep Well Agreements, HMC has
agreed to, among other things:
own and hold, at all times, directly or indirectly, at least 80% of each of AHFC’s and HCFI’s issued and outstanding
shares of voting stock and not pledge, directly or indirectly, encumber, or otherwise dispose of any such shares or permit
any of HMC’s subsidiaries to do so, except to HMC or wholly owned subsidiaries of HMC;
cause each of AHFC and HCFI to, on the last day of each of AHFC’s and HCFI’s respective fiscal years, have a positive
consolidated tangible net worth (with “tangible net worth” meaning (a) shareholders’ equity less (b) any intangible assets,
as determined in accordance with GAAP with respect to AHFC and generally accepted accounting principles in Canada
with respect to HCFI); and
ensure that, at all times, each of AHFC and HCFI has sufficient liquidity and funds to meet their payment obligations
under any Debt (with “Debt” defined as AHFC’s or HCFI’s debt, as applicable, for borrowed money that HMC has
confirmed in writing is covered by the respective keep well agreement) in accordance with the terms of such Debt, or
where necessary, HMC will make available to AHFC or HCFI, as applicable, or HMC will procure for AHFC or HCFI, as
applicable, sufficient funds to enable AHFC or HCFI, as applicable, to pay its Debt in accordance with its terms. AHFC or
HCFI Debt does not include the notes issued by securitization trusts in connection with AHFC’s or HCFI’s secured
financing transactions, any related party debt or any indebtedness outstanding as of March 31, 2015 under AHFC’s and
HCFI’s bank loan agreements.
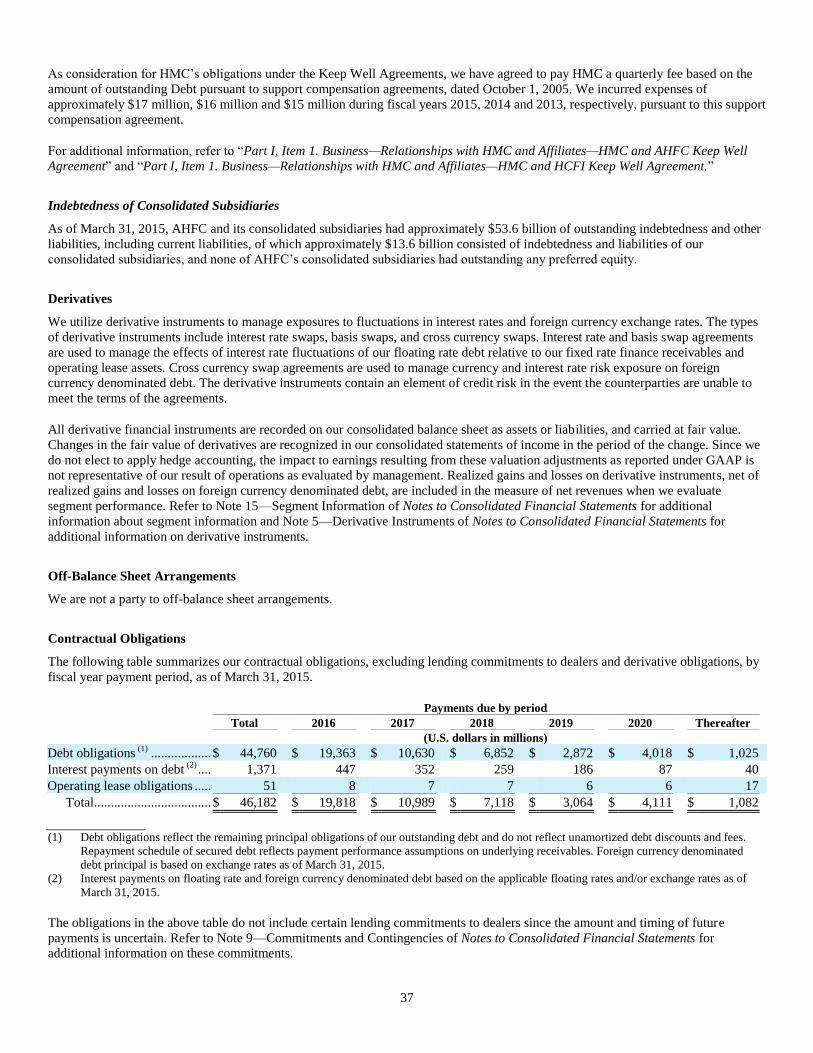
37
As consideration for HMC’s obligations under the Keep Well Agreements, we have agreed to pay HMC a quarterly fee based on the
amount of outstanding Debt pursuant to support compensation agreements, dated October 1, 2005. We incurred expenses of
approximately $17 million, $16 million and $15 million during fiscal years 2015, 2014 and 2013, respectively, pursuant to this support
compensation agreement.
For additional information, refer to “Part I, Item 1. Business—Relationships with HMC and Affiliates—HMC and AHFC Keep Well
Agreement” and “Part I, Item 1. Business—Relationships with HMC and Affiliates—HMC and HCFI Keep Well Agreement.”
Indebtedness of Consolidated Subsidiaries
As of March 31, 2015, AHFC and its consolidated subsidiaries had approximately $53.6 billion of outstanding indebtedness and other
liabilities, including current liabilities, of which approximately $13.6 billion consisted of indebtedness and liabilities of our
consolidated subsidiaries, and none of AHFC’s consolidated subsidiaries had outstanding any preferred equity.
Derivatives
We utilize derivative instruments to manage exposures to fluctuations in interest rates and foreign currency exchange rates. The types
of derivative instruments include interest rate swaps, basis swaps, and cross currency swaps. Interest rate and basis swap agreements
are used to manage the effects of interest rate fluctuations of our floating rate debt relative to our fixed rate finance receivables and
operating lease assets. Cross currency swap agreements are used to manage currency and interest rate risk exposure on foreign
currency denominated debt. The derivative instruments contain an element of credit risk in the event the counterparties are unable to
meet the terms of the agreements.
All derivative financial instruments are recorded on our consolidated balance sheet as assets or liabilities, and carried at fair value.
Changes in the fair value of derivatives are recognized in our consolidated statements of income in the period of the change. Since we
do not elect to apply hedge accounting, the impact to earnings resulting from these valuation adjustments as reported under GAAP is
not representative of our result of operations as evaluated by management. Realized gains and losses on derivative instruments, net of
realized gains and losses on foreign currency denominated debt, are included in the measure of net revenues when we evaluate
segment performance. Refer to Note 15—Segment Information of Notes to Consolidated Financial Statements for additional
information about segment information and Note 5—Derivative Instruments of Notes to Consolidated Financial Statements for
additional information on derivative instruments.
Off-Balance Sheet Arrangements
We are not a party to off-balance sheet arrangements.
Contractual Obligations
The following table summarizes our contractual obligations, excluding lending commitments to dealers and derivative obligations, by
fiscal year payment period, as of March 31, 2015.
Payments due by period
Total 2016 2017 2018 2019 2020 Thereafter
(U.S. dollars in millions)
Debt obligations (1)
.................. $ 44,760 $ 19,363 $ 10,630 $ 6,852 $ 2,872 $ 4,018 $ 1,025
Interest payments on debt (2)
.... 1,371 447 352 259 186 87 40
Operating lease obligations ..... 51 8 7 7 6 6 17
Total ................................... $ 46,182 $ 19,818 $ 10,989 $ 7,118 $ 3,064 $ 4,111 $ 1,082
(1) Debt obligations reflect the remaining principal obligations of our outstanding debt and do not reflect unamortized debt discounts and fees.
Repayment schedule of secured debt reflects payment performance assumptions on underlying receivables. Foreign currency denominated
debt principal is based on exchange rates as of March 31, 2015.
(2) Interest payments on floating rate and foreign currency denominated debt based on the applicable floating rates and/or exchange rates as of
March 31, 2015.
The obligations in the above table do not include certain lending commitments to dealers since the amount and timing of future
payments is uncertain. Refer to Note 9—Commitments and Contingencies of Notes to Consolidated Financial Statements for
additional information on these commitments.
38
Our contractual obligations on derivative instruments are also excluded from the table above because our future cash obligations under
these contracts are inherently uncertain. We recognize all derivative instruments on our consolidated balance sheet at fair value. The
amounts recognized as fair value do not represent the amounts that will be ultimately paid or received upon settlement under these
contracts. Refer to Note 5—Derivative Instruments of Notes to Consolidated Financial Statements for additional information on
derivative instruments.
New Accounting Standards
Refer to Note 1(o) —Recently Adopted Accounting Standards and Note 1(p)—Recently Issued Accounting Standards of Notes to
Consolidated Financial Statements.
Critical Accounting Policies
Critical accounting policies are those accounting policies that require the application of our most difficult, subjective, or complex
judgments, often requiring us to make estimates about the effects of matters that are inherently uncertain and may change in
subsequent periods, or for which the use of different estimates that could have reasonably been used in the current period would have
had a material impact on the presentation of our financial condition, cash flows, and results of operations. The impact and any
associated risks related to these estimates on our financial condition, cash flows, and results of operations are discussed throughout
“Management’s Discussion and Analysis of Financial Condition and Results of Operation” where such estimates affect reported and
expected financial results. Different assumptions or changes in economic circumstances could result in additional changes to the
determination of the allowance for credit losses and the determination of residual values.
Credit Losses
We maintain an allowance for credit losses for management’s estimate of probable losses incurred on our finance receivables. We also
maintain an estimate for early termination losses on operating lease assets due to lessee defaults and an allowance for credit losses on
past due operating lease rental payments. These estimates are evaluated by management, at minimum, on a quarterly basis.
Consumer finance receivables are collectively evaluated for impairment. Delinquencies and losses are continuously monitored and this
historical experience provides the primary basis for estimating the allowance. Management utilizes various methodologies when
estimating the allowance for credit losses including models which incorporate vintage loss and delinquency migration analysis. These
models take into consideration attributes of the portfolio, including loan-to-value ratios, internal and external credit scores, and
collateral types. Economic factors such as used vehicle prices, unemployment rates, and consumer debt service burdens are also
incorporated when estimating losses. Estimated losses on operating leases expected to terminate early due to lessee defaults are also
determined collectively, consistent with the methodologies used for consumer finance receivables.
Dealer finance receivables are individually evaluated for impairment when specifically identified as impaired. Dealer finance
receivables are considered to be impaired when it is probable that we will be unable to collect all amounts due according to the
original terms of the loan. Our determination of whether dealer loans are impaired is based on evaluations of dealerships’ payment
history, financial condition, and cash flows, and their ability to perform under the terms of the loans. Dealer loans that have not been
specifically identified as impaired are collectively evaluated for impairment.
Refer to Note 1(e)—Finance Receivables, Note 1(f)—Investment in Operating Leases and Note 1(i)—Vehicles Held for Disposition
of Notes to Consolidated Financial Statements for additional information regarding charge-offs or write-downs of contractual
balances of retail and dealer finance receivables and operating leases.
Our allowance for credit losses and early termination losses on operating leases requires significant judgment about inherently
uncertain factors. The estimates are based on management’s evaluation of many factors, including our historical credit loss experience,
the value of the underlying collateral, delinquency trends, and economic conditions. The estimates are based on information available
as of each reporting date. Actual losses may differ from the original estimates due to actual results varying from those assumed in our
estimates.
Sensitivity Analysis
If we had experienced a 10% increase in net charge-offs of finance receivables during the fiscal year ended March 31, 2015, our
provision for credit losses would have increased by approximately $20 million. Similarly, if we had experienced a 10% increase in
realized losses on the disposition of repossessed operating lease vehicles during the twelve month period ended March 31, 2015, we
would have recognized an additional $9 million in early termination losses in our consolidated statement of income during the period.
39
Determination of Lease Residual Values
Contractual residual values of lease vehicles are determined at lease inception based on expectations of end of term used vehicle
values, taking into consideration external industry data and our own historical experience. Lease customers have the option at the end
of the lease term to return the vehicle to the dealer or to buy the vehicle for the contractual residual value (or if purchased prior to
lease maturity, for the outstanding contractual balance). Returned lease vehicles can be purchased by the grounding dealer for the
contractual residual value (or if purchased prior to lease maturity, for the outstanding contractual balance) or a market based price.
Returned lease vehicles that are not purchased by the grounding dealer are sold through online and physical auctions. We are exposed
to risk of loss on the disposition of returned lease vehicles when the proceeds from the sale of the vehicles are less than the contractual
residual values at the end of lease term. We assess our estimates for end of term market values of the leased vehicles, at minimum, on
a quarterly basis. The primary factors affecting the estimates are the percentage of leased vehicles that we expect to be returned by the
lessee at the end of lease term and the expected loss severity. Factors considered in this evaluation include, among other factors,
economic conditions, historical trends and market information on new and used vehicles.
For operating leases, adjustments to estimated residual values are made on a straight-line basis over the remaining term of the lease
and are included as depreciation expense. For direct financing leases, downward adjustments for declines in estimated residual values
deemed to be other-than-temporary are recognized as a loss on lease residual values in the period in which the estimate changed.
Sensitivity Analysis
If future estimated auction values for all outstanding operating leases as of March 31, 2015 were to decrease by $100 per unit from our
current estimates, the total impact would be an increase of approximately $42 million in depreciation expense, which would be
recognized over the remaining lease terms. If future return rates for all operating leases were to increase by one percentage point from
our current estimates, the total impact would be an increase of approximately $6 million in depreciation expense, which would be
recognized over the remaining lease terms. Similarly, if the future estimated auction values were to decrease by $100 per unit and
future return rates were to increase by one percentage point from our current estimates for all direct financing leases as of March 31,
2015, we would have recognized an increase of approximately $1 million and less than $1 million in losses on lease residual values,
respectively. This sensitivity analysis may be asymmetric and is specific to the conditions in effect as of March 31, 2015.
Additionally, any declines in auction values are likely to have a negative effect on return rates which could affect the severity of the
impact on our results of operations.
Item 7A. Quantitative and Qualitative Disclosures About Market Risk
We are exposed to various market risks. Our financial condition, cash flows, and results of operations depend on the extent to which
we effectively identify and manage these risks. The principal types of risk to our business include:
Interest rate risk arising from changes in interest rates related to our funding, investing, and cash management activities.
Our assets consist primarily of fixed rate receivables and operating lease assets, however, our liabilities consist of both
floating and fixed rate debt. We utilize interest rate and basis swaps to mitigate the impact of interest rate movements on
our cash flows and net interest margins.
Exchange rate risk arising from changes in value of our foreign currency denominated debt in response to fluctuations in
exchange rates of various currencies, including, without limitation, the U.S. dollar, the Canadian dollar, the Euro, and the
Japanese yen. We enter into cross currency swaps concurrently with the issuance of this debt to convert all interest and
principal payments to either of our functional currencies, which is United States dollars in the United States segment and
Canadian dollars in the Canadian segment, which effectively eliminates our foreign currency exchange rate risks.
Counterparty risk arising primarily with our derivative contracts. To manage this risk, we limit our exposure to
counterparties in accordance with credit rating related guidelines. We also enter into master netting agreements which help
to mitigate our exposure to loss in the case of defaults. Except in very limited circumstances involving counterparties with
consolidated securitization trusts, we generally have not entered into credit support agreements with our counterparties.
To provide a quantitative measure of the sensitivity of interest rate movements on our pre-tax cash flows, we have estimated the effect
of a hypothetical 100 basis point increase and decrease to benchmark interest rates on our floating rate financial instruments for the 12
month periods ending March 31, 2016 and 2015 below. Our estimates were based upon our existing receivables, debt, and derivatives
as of March 31, 2015 and 2014. We do not include any assumptions for reinvestment of maturing assets and refinancing of maturing
debt. The estimates for a 100 basis point decrease assume that rates cannot fall below zero percent.
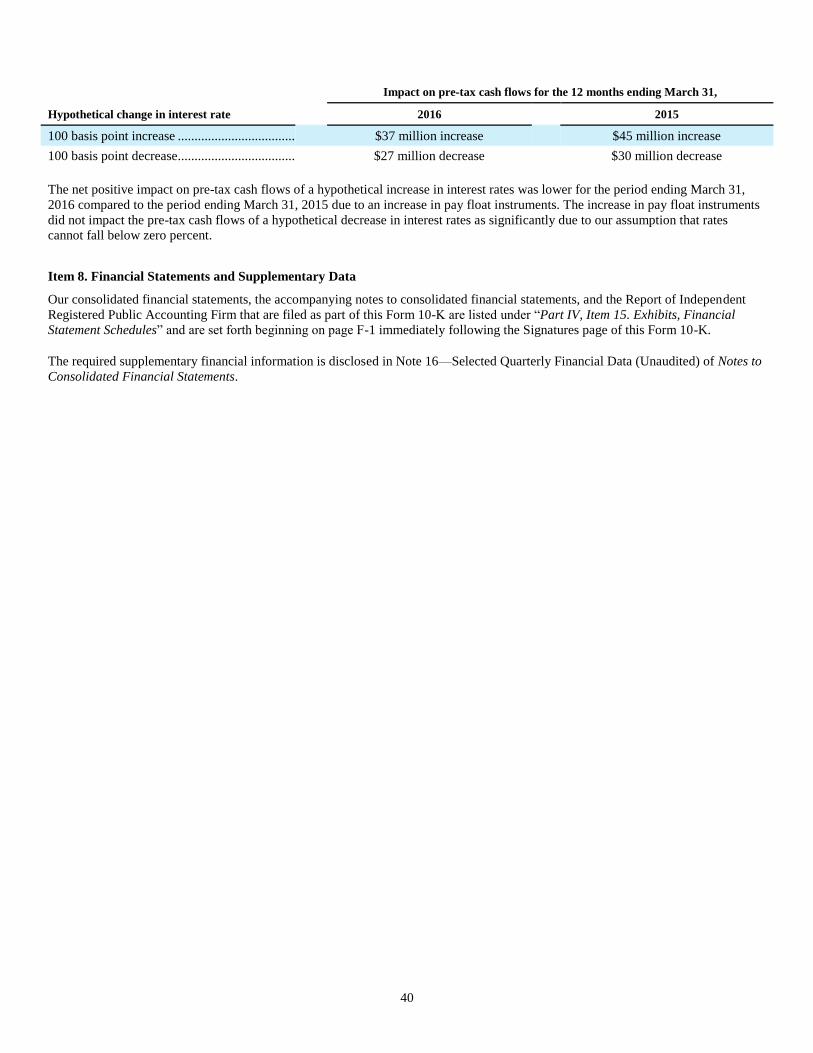
40
Impact on pre-tax cash flows for the 12 months ending March 31,
Hypothetical change in interest rate
2016
2015
100 basis point increase ..................................... $37 million increase
$45 million increase
100 basis point decrease ..................................... $27 million decrease
$30 million decrease
The net positive impact on pre-tax cash flows of a hypothetical increase in interest rates was lower for the period ending March 31,
2016 compared to the period ending March 31, 2015 due to an increase in pay float instruments. The increase in pay float instruments
did not impact the pre-tax cash flows of a hypothetical decrease in interest rates as significantly due to our assumption that rates
cannot fall below zero percent.
Item 8. Financial Statements and Supplementary Data
Our consolidated financial statements, the accompanying notes to consolidated financial statements, and the Report of Independent
Registered Public Accounting Firm that are filed as part of this Form 10-K are listed under “Part IV, Item 15. Exhibits, Financial
Statement Schedules” and are set forth beginning on page F-1 immediately following the Signatures page of this Form 10-K.
The required supplementary financial information is disclosed in Note 16—Selected Quarterly Financial Data (Unaudited) of Notes to
Consolidated Financial Statements.
41
Item 9. Changes in and Disagreements with Accountants on Accounting and Financial Disclosure
None.
Item 9A. Controls and Procedures
Evaluation of Disclosure Controls and Procedures
Our Principal Executive Officer and Principal Financial Officer have performed an evaluation of our disclosure controls and
procedures, as that term is defined in Rule 13a-15(e) of the Securities Exchange Act of 1934, as amended (the “Exchange Act”), as of
March 31, 2015, and each has concluded that such disclosure controls and procedures are effective, at the reasonable assurance level,
to ensure that information required to be disclosed in our periodic reports filed under the Exchange Act is recorded, processed,
summarized and reported within the time periods specified by the SEC’s rules and forms, and such information is accumulated and
communicated to management, including our Principal Executive Officer and Principal Financial Officer, as appropriate to allow
timely decisions regarding required disclosures. Our management recognizes that any controls and procedures, no matter how well
designed and operated, can provide only reasonable assurance of achieving their objectives, and management necessarily applies its
judgment in evaluating the cost-benefit relationship of possible controls and procedures.
Management’s Annual Report on Internal Control over Financial Reporting
Management is responsible for establishing and maintaining adequate internal control over financial reporting, as that term is defined
in Rule 13a-15(f) of the Exchange Act. Internal control over financial reporting is a process designed to provide reasonable assurance
regarding the reliability of financial reporting and the preparation of financial statements for external purposes in accordance with
generally accepted accounting principles in the United States. Because of its inherent limitations, internal control over financial
reporting may not prevent or detect misstatements. Also, projections of any evaluation of effectiveness to future periods are subject to
the risk that controls may become inadequate because of changes in conditions or because the degree of compliance with policies or
procedures may deteriorate.
Management conducted, under the supervision of our Principal Executive Officer and Principal Financial Officer, an evaluation of the
effectiveness of our internal control over financial reporting based on the framework in Internal Control – Integrated Framework
(1992) issued by the Committee of Sponsoring Organizations of the Treadway Commission, commonly referred to as the “COSO”
criteria. Based on the assessment performed, management concluded that our internal control over financial reporting was effective as
of March 31, 2015.
This annual report does not include an attestation report of our independent registered public accounting firm regarding internal
control over financial reporting. Management’s report is not subject to attestation by our independent registered public accounting
firm pursuant to rules of the SEC applicable to non-accelerated filers.
Changes in Internal Control over Financial Reporting
There were no changes in the internal control over financial reporting during the quarter ended March 31, 2015, that have materially
affected, or are reasonably likely to materially affect, our internal control over financial reporting.
Item 9B. Other Information
None.
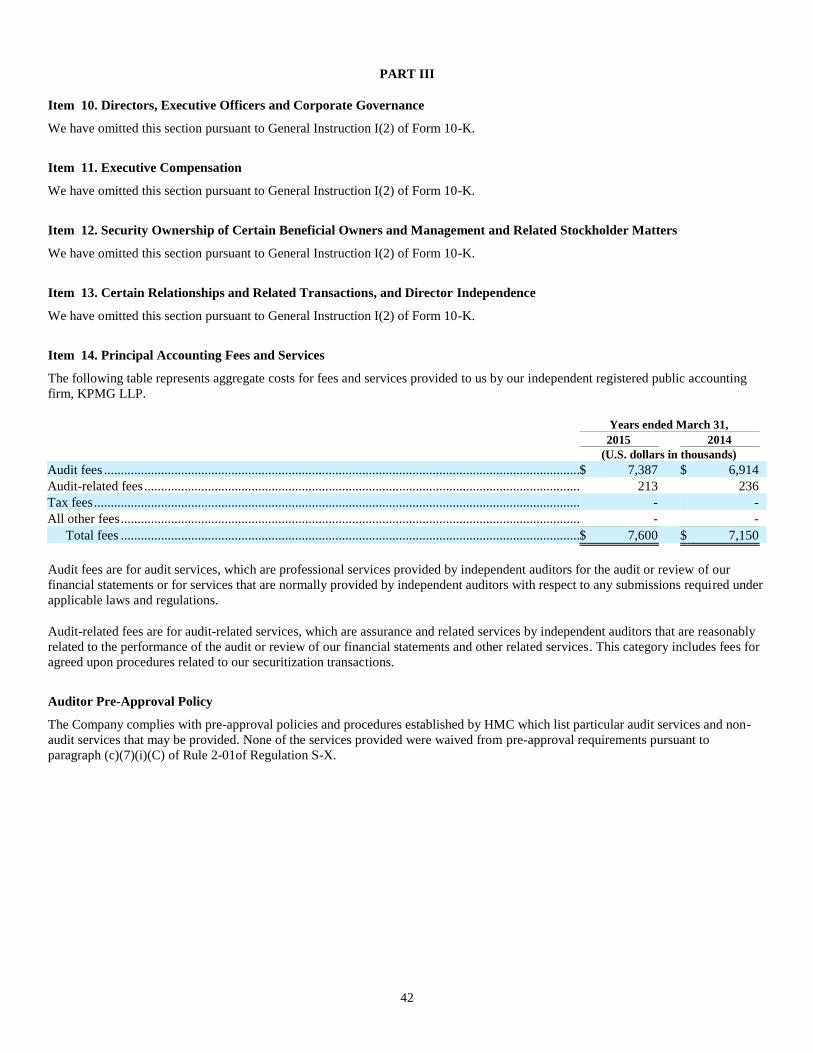
42
PART III
Item 10. Directors, Executive Officers and Corporate Governance
We have omitted this section pursuant to General Instruction I(2) of Form 10-K.
Item 11. Executive Compensation
We have omitted this section pursuant to General Instruction I(2) of Form 10-K.
Item 12. Security Ownership of Certain Beneficial Owners and Management and Related Stockholder Matters
We have omitted this section pursuant to General Instruction I(2) of Form 10-K.
Item 13. Certain Relationships and Related Transactions, and Director Independence
We have omitted this section pursuant to General Instruction I(2) of Form 10-K.
Item 14. Principal Accounting Fees and Services
The following table represents aggregate costs for fees and services provided to us by our independent registered public accounting
firm, KPMG LLP.
Years ended March 31,
2015 2014
(U.S. dollars in thousands)
Audit fees .............................................................................................................................................. $ 7,387 $ 6,914
Audit-related fees .................................................................................................................................. 213 236
Tax fees ................................................................................................................................................. - -
All other fees ......................................................................................................................................... - -
Total fees ......................................................................................................................................... $ 7,600 $ 7,150
Audit fees are for audit services, which are professional services provided by independent auditors for the audit or review of our
financial statements or for services that are normally provided by independent auditors with respect to any submissions required under
applicable laws and regulations.
Audit-related fees are for audit-related services, which are assurance and related services by independent auditors that are reasonably
related to the performance of the audit or review of our financial statements and other related services. This category includes fees for
agreed upon procedures related to our securitization transactions.
Auditor Pre-Approval Policy
The Company complies with pre-approval policies and procedures established by HMC which list particular audit services and non-
audit services that may be provided. None of the services provided were waived from pre-approval requirements pursuant to
paragraph (c)(7)(i)(C) of Rule 2-01of Regulation S-X.
43
PART IV
Item 15. Exhibits, Financial Statement Schedules
(1) Our consolidated financial statements, the accompanying notes to consolidated financial statements, and the Report of Independent
Registered Public Accounting Firm that are filed as part of this Form 10-K are set forth beginning on page F-1 immediately following
the Signatures page of this Form 10-K.
(2) Financial statement schedules have been omitted because they are not applicable, the information required to be contained in them
is disclosed in Note 2—Finance Receivables of Notes to Consolidated Financial Statements or the amounts involved are not sufficient
to require submission.
(3) See the Exhibit Index beginning on page E-1 of this Form 10-K.
44
Signatures
Pursuant to the requirements of Section 13 or 15(d) of the Securities Exchange Act of 1934, the registrant has duly caused this report
to be signed on its behalf by the undersigned, thereunto duly authorized.
Dated: June 26, 2015
AMERICAN HONDA FINANCE CORPORATION
By: /s/ Paul C. Honda
Paul C. Honda
Vice President and Assistant Secretary
(Principal Accounting Officer)
Pursuant to the requirements of the Securities Exchange Act of 1934, this report has been signed below by the following persons on
behalf of the registrant and in the capacities and on the dates indicated.
Signature Title Date
/s/ Hideo Moroe
President and Director
(Principal Executive Officer)
June 26, 2015
Hideo Moroe
/s/ Shinji Kubaru
Vice President, Treasurer and Director
(Principal Financial Officer)
June 26, 2015
Shinji Kubaru
/s/ Paul C. Honda
Vice President and Assistant Secretary
(Principal Accounting Officer)
June 26, 2015
Paul C. Honda
/s/ David W. Paul
Senior Vice President, Risk Management
Officer and Director
June 26, 2015
David W. Paul
/s/ Takuji Yamada
Chairman and Director
June 26, 2015
Takuji Yamada
Director
John Mendel
Director
Kohei Takeuchi
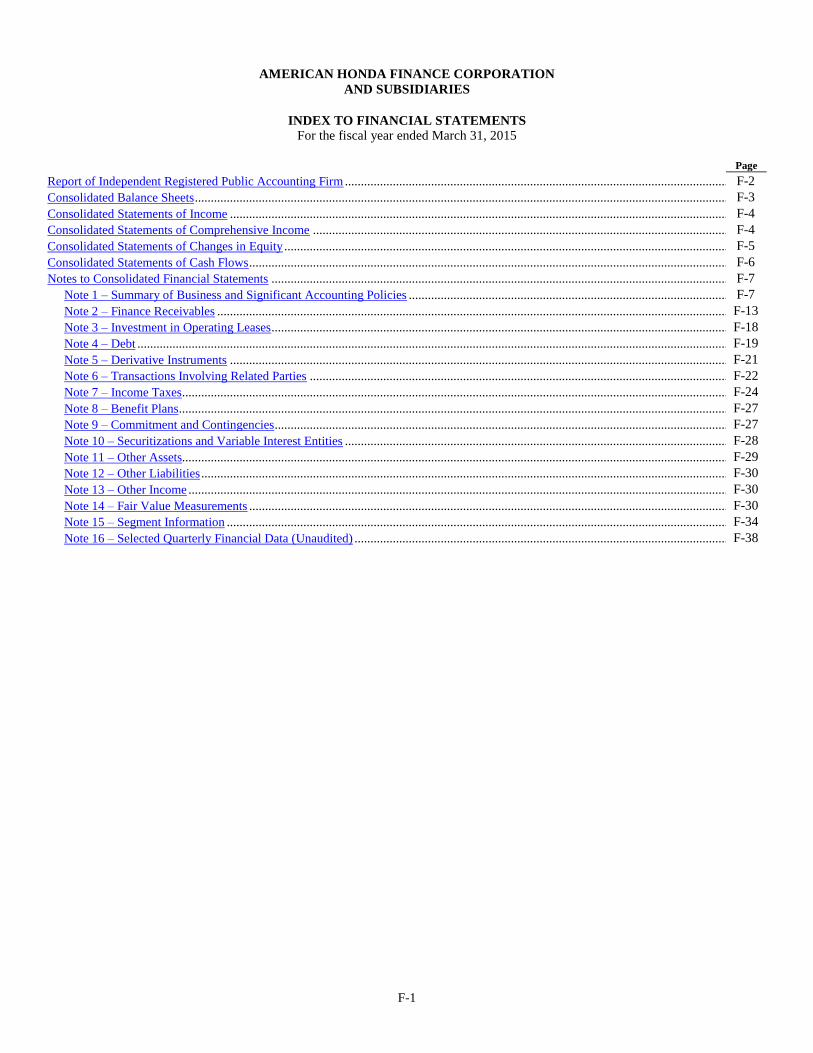
F-1
AMERICAN HONDA FINANCE CORPORATION
AND SUBSIDIARIES
INDEX TO FINANCIAL STATEMENTS For the fiscal year ended March 31, 2015
Page
Report of Independent Registered Public Accounting Firm ........................................................................................................................ F-2
Consolidated Balance Sheets ....................................................................................................................................................................... F-3
Consolidated Statements of Income ............................................................................................................................................................ F-4
Consolidated Statements of Comprehensive Income .................................................................................................................................. F-4
Consolidated Statements of Changes in Equity ........................................................................................................................................... F-5
Consolidated Statements of Cash Flows ...................................................................................................................................................... F-6
Notes to Consolidated Financial Statements ............................................................................................................................................... F-7
Note 1 – Summary of Business and Significant Accounting Policies .................................................................................................... F-7
Note 2 – Finance Receivables ................................................................................................................................................................ F-13
Note 3 – Investment in Operating Leases ............................................................................................................................................... F-18
Note 4 – Debt ......................................................................................................................................................................................... F-19
Note 5 – Derivative Instruments ............................................................................................................................................................ F-21
Note 6 – Transactions Involving Related Parties ................................................................................................................................... F-22
Note 7 – Income Taxes........................................................................................................................................................................... F-24
Note 8 – Benefit Plans ............................................................................................................................................................................ F-27
Note 9 – Commitment and Contingencies .............................................................................................................................................. F-27
Note 10 – Securitizations and Variable Interest Entities ........................................................................................................................ F-28
Note 11 – Other Assets........................................................................................................................................................................... F-29
Note 12 – Other Liabilities ..................................................................................................................................................................... F-30
Note 13 – Other Income ......................................................................................................................................................................... F-30
Note 14 – Fair Value Measurements ...................................................................................................................................................... F-30
Note 15 – Segment Information ............................................................................................................................................................. F-34
Note 16 – Selected Quarterly Financial Data (Unaudited) ..................................................................................................................... F-38
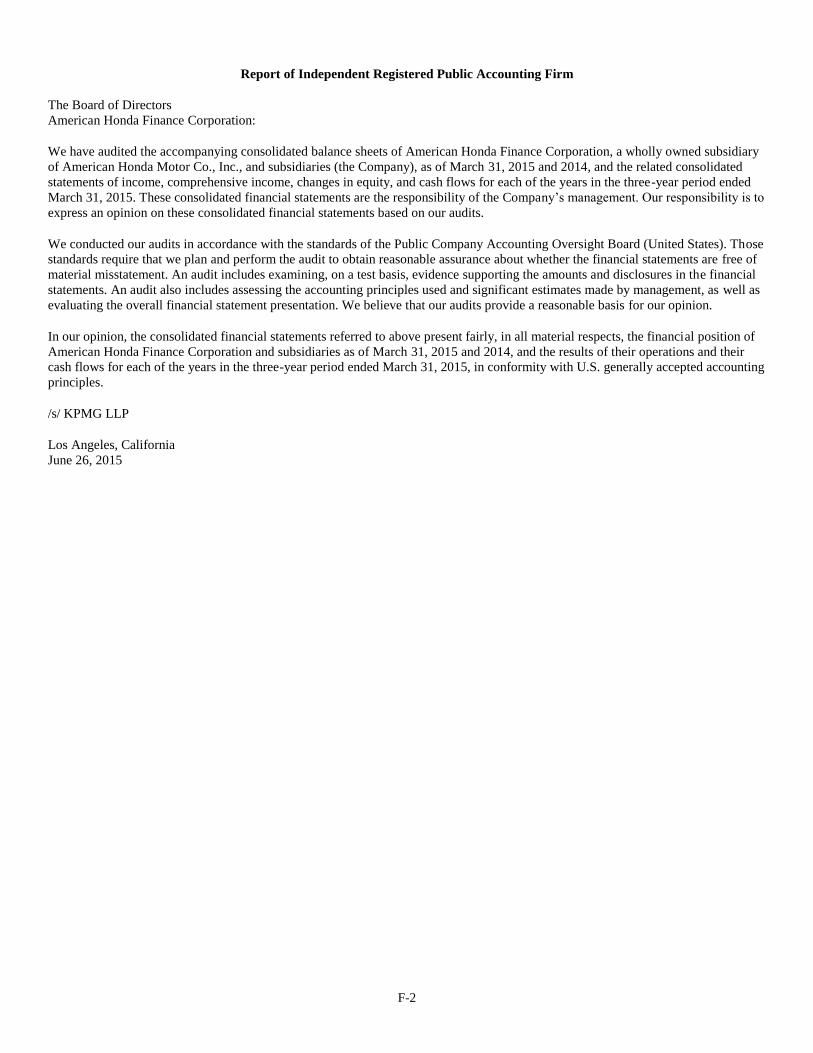
F-2
Report of Independent Registered Public Accounting Firm
The Board of Directors
American Honda Finance Corporation:
We have audited the accompanying consolidated balance sheets of American Honda Finance Corporation, a wholly owned subsidiary
of American Honda Motor Co., Inc., and subsidiaries (the Company), as of March 31, 2015 and 2014, and the related consolidated
statements of income, comprehensive income, changes in equity, and cash flows for each of the years in the three-year period ended
March 31, 2015. These consolidated financial statements are the responsibility of the Company’s management. Our responsibility is to
express an opinion on these consolidated financial statements based on our audits.
We conducted our audits in accordance with the standards of the Public Company Accounting Oversight Board (United States). Those
standards require that we plan and perform the audit to obtain reasonable assurance about whether the financial statements are free of
material misstatement. An audit includes examining, on a test basis, evidence supporting the amounts and disclosures in the financial
statements. An audit also includes assessing the accounting principles used and significant estimates made by management, as well as
evaluating the overall financial statement presentation. We believe that our audits provide a reasonable basis for our opinion.
In our opinion, the consolidated financial statements referred to above present fairly, in all material respects, the financial position of
American Honda Finance Corporation and subsidiaries as of March 31, 2015 and 2014, and the results of their operations and their
cash flows for each of the years in the three-year period ended March 31, 2015, in conformity with U.S. generally accepted accounting
principles.
/s/ KPMG LLP
Los Angeles, California
June 26, 2015
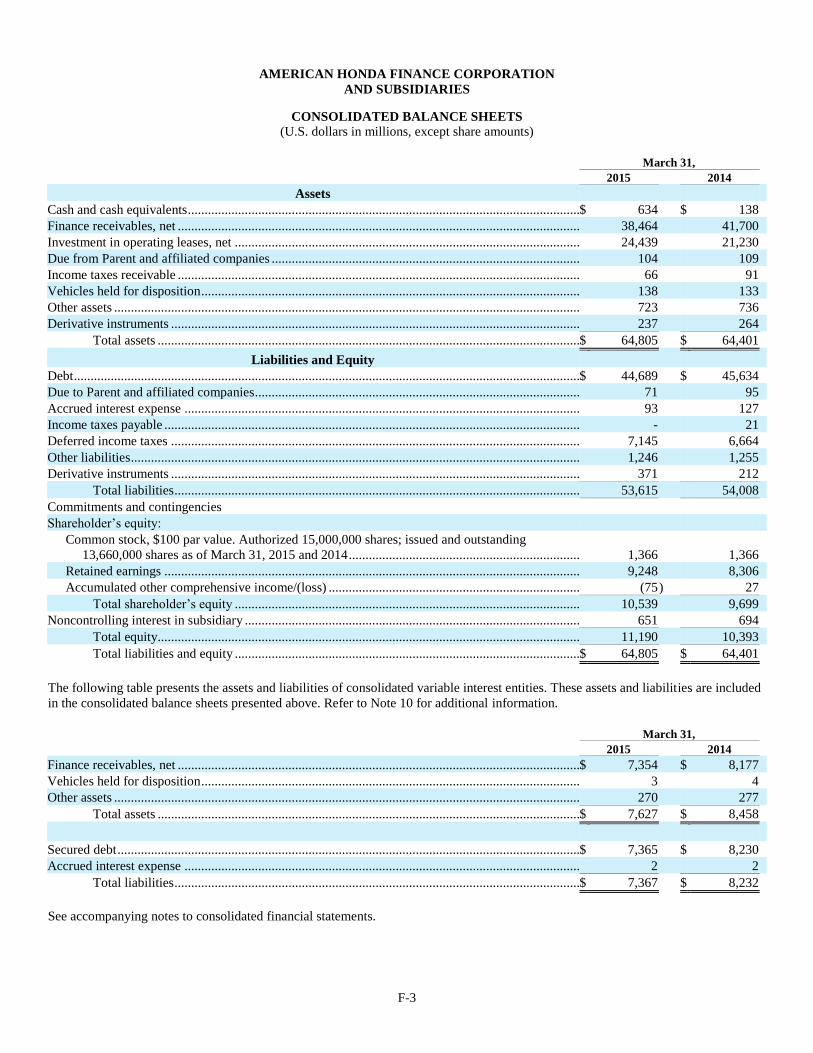
F-3
AMERICAN HONDA FINANCE CORPORATION
AND SUBSIDIARIES
CONSOLIDATED BALANCE SHEETS (U.S. dollars in millions, except share amounts)
March 31,
2015 2014
Assets
Cash and cash equivalents ..................................................................................................................... $ 634 $ 138
Finance receivables, net ........................................................................................................................ 38,464 41,700
Investment in operating leases, net ....................................................................................................... 24,439 21,230
Due from Parent and affiliated companies ............................................................................................ 104 109
Income taxes receivable ........................................................................................................................ 66 91
Vehicles held for disposition ................................................................................................................. 138 133
Other assets ........................................................................................................................................... 723 736
Derivative instruments .......................................................................................................................... 237 264
Total assets .............................................................................................................................. $ 64,805 $ 64,401
Liabilities and Equity
Debt ....................................................................................................................................................... $ 44,689 $ 45,634
Due to Parent and affiliated companies................................................................................................. 71 95
Accrued interest expense ...................................................................................................................... 93 127
Income taxes payable ............................................................................................................................ - 21
Deferred income taxes .......................................................................................................................... 7,145 6,664
Other liabilities ...................................................................................................................................... 1,246 1,255
Derivative instruments .......................................................................................................................... 371 212
Total liabilities ......................................................................................................................... 53,615 54,008
Commitments and contingencies
Shareholder’s equity:
Common stock, $100 par value. Authorized 15,000,000 shares; issued and outstanding
13,660,000 shares as of March 31, 2015 and 2014 ..................................................................... 1,366 1,366
Retained earnings ............................................................................................................................ 9,248 8,306
Accumulated other comprehensive income/(loss) ........................................................................... (75 ) 27
Total shareholder’s equity ....................................................................................................... 10,539 9,699
Noncontrolling interest in subsidiary .................................................................................................... 651 694
Total equity.............................................................................................................................. 11,190 10,393
Total liabilities and equity ....................................................................................................... $ 64,805 $ 64,401
The following table presents the assets and liabilities of consolidated variable interest entities. These assets and liabilities are included
in the consolidated balance sheets presented above. Refer to Note 10 for additional information.
March 31,
2015 2014
Finance receivables, net ........................................................................................................................ $ 7,354 $ 8,177
Vehicles held for disposition ................................................................................................................. 3 4
Other assets ........................................................................................................................................... 270 277
Total assets .............................................................................................................................. $ 7,627 $ 8,458
Secured debt .......................................................................................................................................... $ 7,365 $ 8,230
Accrued interest expense ...................................................................................................................... 2 2
Total liabilities ......................................................................................................................... $ 7,367 $ 8,232
See accompanying notes to consolidated financial statements.
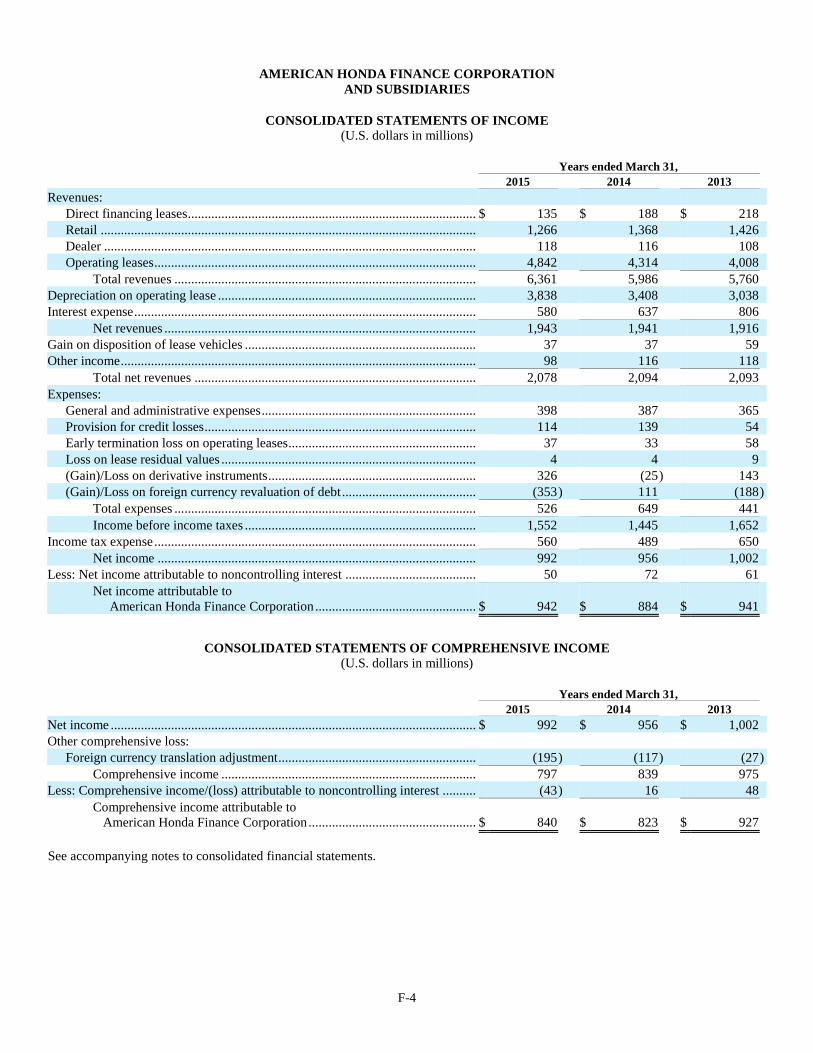
F-4
AMERICAN HONDA FINANCE CORPORATION
AND SUBSIDIARIES
CONSOLIDATED STATEMENTS OF INCOME (U.S. dollars in millions)
Years ended March 31,
2015 2014 2013
Revenues:
Direct financing leases ...................................................................................... $ 135 $ 188 $ 218
Retail ................................................................................................................ 1,266 1,368 1,426
Dealer ............................................................................................................... 118 116 108
Operating leases ................................................................................................ 4,842 4,314 4,008
Total revenues .......................................................................................... 6,361 5,986 5,760
Depreciation on operating lease ............................................................................. 3,838 3,408 3,038
Interest expense ...................................................................................................... 580 637 806
Net revenues ............................................................................................. 1,943 1,941 1,916
Gain on disposition of lease vehicles ..................................................................... 37 37 59
Other income .......................................................................................................... 98 116 118
Total net revenues .................................................................................... 2,078 2,094 2,093
Expenses:
General and administrative expenses ................................................................ 398 387 365
Provision for credit losses ................................................................................. 114 139 54
Early termination loss on operating leases........................................................ 37 33 58
Loss on lease residual values ............................................................................ 4 4 9
(Gain)/Loss on derivative instruments .............................................................. 326 (25 ) 143
(Gain)/Loss on foreign currency revaluation of debt ........................................ (353 ) 111 (188 )
Total expenses .......................................................................................... 526 649 441
Income before income taxes ..................................................................... 1,552 1,445 1,652
Income tax expense ................................................................................................ 560 489 650
Net income ............................................................................................... 992 956 1,002
Less: Net income attributable to noncontrolling interest ....................................... 50 72 61
Net income attributable to
American Honda Finance Corporation ................................................ $ 942 $ 884 $ 941
CONSOLIDATED STATEMENTS OF COMPREHENSIVE INCOME (U.S. dollars in millions)
Years ended March 31,
2015 2014 2013
Net income ............................................................................................................. $ 992 $ 956 $ 1,002
Other comprehensive loss:
Foreign currency translation adjustment ........................................................... (195 ) (117 ) (27 )
Comprehensive income ............................................................................ 797 839 975
Less: Comprehensive income/(loss) attributable to noncontrolling interest .......... (43 ) 16 48
Comprehensive income attributable to
American Honda Finance Corporation .................................................. $ 840 $ 823 $ 927
See accompanying notes to consolidated financial statements.
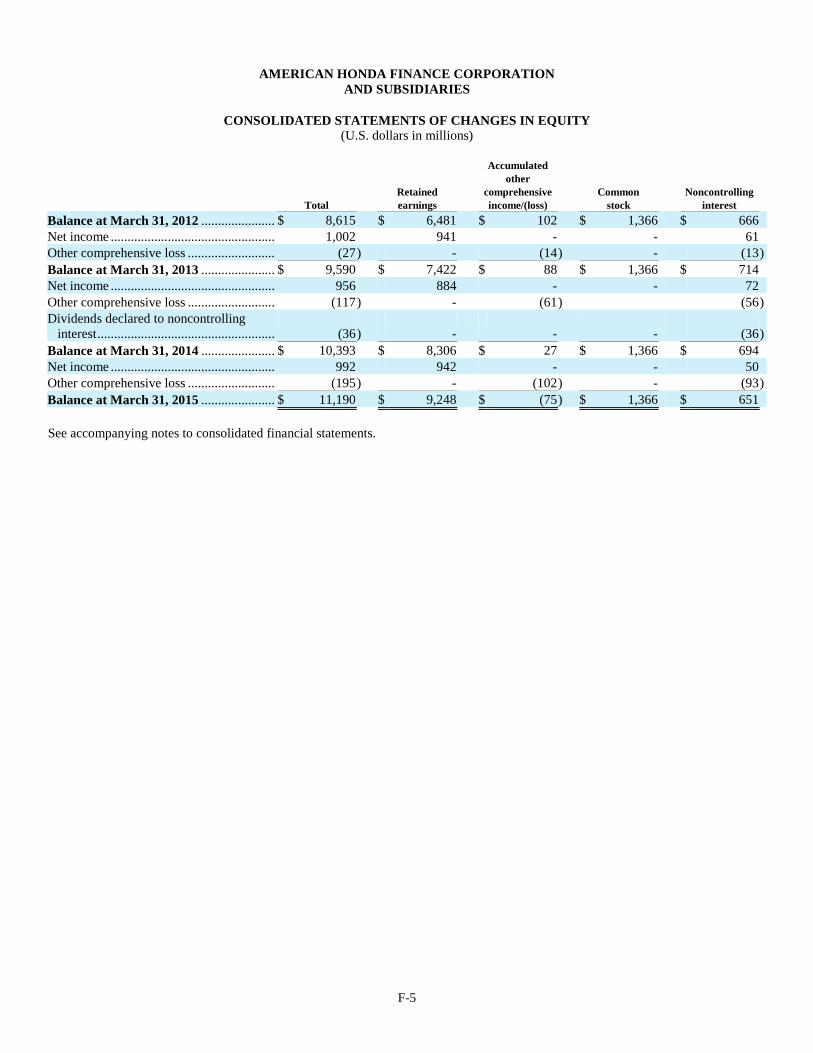
F-5
AMERICAN HONDA FINANCE CORPORATION
AND SUBSIDIARIES
CONSOLIDATED STATEMENTS OF CHANGES IN EQUITY (U.S. dollars in millions)
Accumulated
other
Retained comprehensive Common Noncontrolling
Total earnings income/(loss) stock interest
Balance at March 31, 2012 ...................... $ 8,615 $ 6,481 $ 102 $ 1,366 $ 666
Net income ................................................. 1,002 941 - - 61
Other comprehensive loss .......................... (27 ) - (14 ) - (13 )
Balance at March 31, 2013 ...................... $ 9,590 $ 7,422 $ 88 $ 1,366 $ 714
Net income ................................................. 956 884 - - 72
Other comprehensive loss .......................... (117 ) - (61 ) (56 )
Dividends declared to noncontrolling
interest ..................................................... (36 ) - - - (36 )
Balance at March 31, 2014 ...................... $ 10,393 $ 8,306 $ 27 $ 1,366 $ 694
Net income ................................................. 992 942 - - 50
Other comprehensive loss .......................... (195 ) - (102 ) - (93 )
Balance at March 31, 2015 ...................... $ 11,190 $ 9,248 $ (75 ) $ 1,366 $ 651
See accompanying notes to consolidated financial statements.
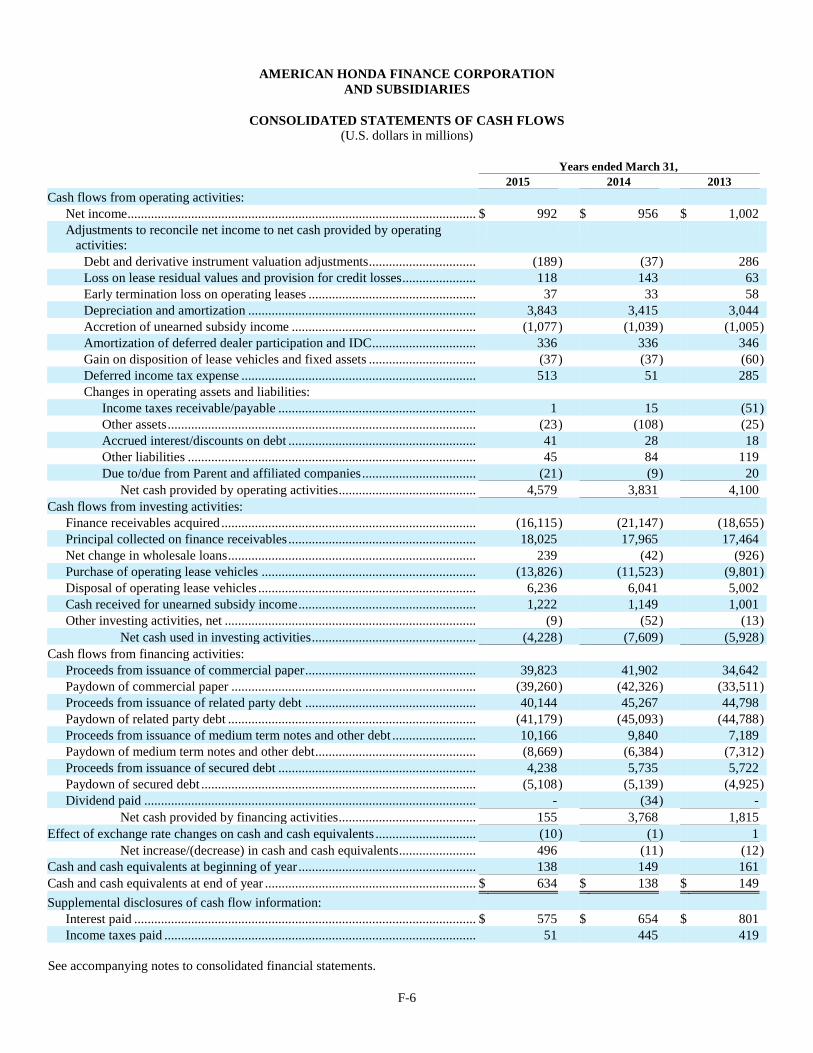
F-6
AMERICAN HONDA FINANCE CORPORATION
AND SUBSIDIARIES
CONSOLIDATED STATEMENTS OF CASH FLOWS (U.S. dollars in millions)
Years ended March 31,
2015 2014 2013
Cash flows from operating activities:
Net income ........................................................................................................ $ 992 $ 956 $ 1,002
Adjustments to reconcile net income to net cash provided by operating
activities:
Debt and derivative instrument valuation adjustments ................................ (189 ) (37 ) 286
Loss on lease residual values and provision for credit losses ...................... 118 143 63
Early termination loss on operating leases .................................................. 37 33 58
Depreciation and amortization .................................................................... 3,843 3,415 3,044
Accretion of unearned subsidy income ....................................................... (1,077 ) (1,039 ) (1,005 )
Amortization of deferred dealer participation and IDC ............................... 336 336 346
Gain on disposition of lease vehicles and fixed assets ................................ (37 ) (37 ) (60 )
Deferred income tax expense ...................................................................... 513 51 285
Changes in operating assets and liabilities:
Income taxes receivable/payable ........................................................... 1 15 (51 )
Other assets ............................................................................................ (23 ) (108 ) (25 )
Accrued interest/discounts on debt ........................................................ 41 28 18
Other liabilities ...................................................................................... 45 84 119
Due to/due from Parent and affiliated companies .................................. (21 ) (9 ) 20
Net cash provided by operating activities ......................................... 4,579 3,831 4,100
Cash flows from investing activities:
Finance receivables acquired ............................................................................ (16,115 ) (21,147 ) (18,655 )
Principal collected on finance receivables ........................................................ 18,025 17,965 17,464
Net change in wholesale loans .......................................................................... 239 (42 ) (926 )
Purchase of operating lease vehicles ................................................................ (13,826 ) (11,523 ) (9,801 )
Disposal of operating lease vehicles ................................................................. 6,236 6,041 5,002
Cash received for unearned subsidy income ..................................................... 1,222 1,149 1,001
Other investing activities, net ........................................................................... (9 ) (52 ) (13 )
Net cash used in investing activities ................................................. (4,228 ) (7,609 ) (5,928 )
Cash flows from financing activities:
Proceeds from issuance of commercial paper ................................................... 39,823 41,902 34,642
Paydown of commercial paper ......................................................................... (39,260 ) (42,326 ) (33,511 )
Proceeds from issuance of related party debt ................................................... 40,144 45,267 44,798
Paydown of related party debt .......................................................................... (41,179 ) (45,093 ) (44,788 )
Proceeds from issuance of medium term notes and other debt ......................... 10,166 9,840 7,189
Paydown of medium term notes and other debt ................................................ (8,669 ) (6,384 ) (7,312 )
Proceeds from issuance of secured debt ........................................................... 4,238 5,735 5,722
Paydown of secured debt .................................................................................. (5,108 ) (5,139 ) (4,925 )
Dividend paid ................................................................................................... - (34 ) -
Net cash provided by financing activities ......................................... 155 3,768 1,815
Effect of exchange rate changes on cash and cash equivalents .............................. (10 ) (1 ) 1
Net increase/(decrease) in cash and cash equivalents ....................... 496 (11 ) (12 )
Cash and cash equivalents at beginning of year ..................................................... 138 149 161
Cash and cash equivalents at end of year ............................................................... $ 634 $ 138 $ 149
Supplemental disclosures of cash flow information:
Interest paid ...................................................................................................... $ 575 $ 654 $ 801
Income taxes paid ............................................................................................. 51 445 419
See accompanying notes to consolidated financial statements.
F-7
AMERICAN HONDA FINANCE CORPORATION
AND SUBSIDIARIES
Notes to Consolidated Financial Statements
(1) Summary of Business and Significant Accounting Policies
American Honda Finance Corporation (AHFC) is a wholly owned subsidiary of American Honda Motor Co., Inc. (AHM or the
Parent). Honda Canada Finance Inc. (HCFI) is a majority-owned subsidiary of AHFC. Noncontrolling interest in HCFI is held
by Honda Canada Inc. (HCI), an affiliate of AHFC. AHM is a wholly owned subsidiary and HCI is an indirect wholly owned
subsidiary of Honda Motor Co., Ltd. (HMC). AHM and HCI are the sole authorized distributors of Honda and Acura products,
including motor vehicles, parts, and accessories in the United States and Canada.
Unless otherwise indicated by the context, all references to the “Company” include AHFC and its consolidated subsidiaries
(refer Note 1(b) Principles of Consolidation below), and references to “AHFC” refer solely to American Honda Finance
Corporation (excluding AHFC’s subsidiaries).
The Company provides various forms of financing to authorized dealers of Honda and Acura products and their customers in the
United States and Canada. The Company also finances a limited number of vehicles other than Honda and Acura products. The
Company’s financing products include the following categories:
Retail Loans – The Company acquires retail installment contracts from dealers who originate the contracts with
consumers. Retail loans are collateralized by liens on the related vehicles or equipment. Retail loan terms range primarily
from two to six years.
Retail Leases – The Company acquires closed-end vehicle lease contracts between authorized dealers and their customers.
The dealer assigns all of its rights, title, and interest in the lease and motor vehicle to the Company upon acquisition.
Lease terms range primarily from two to five years.
Dealer Loans – The Company provides wholesale and commercial loans to dealers. Wholesale loans are used by dealers
to finance the purchase of inventory. The Company retains purchase money security interest in all inventory financed;
however, the Company has no right to recover a product sold to consumers in the ordinary course of business. The
Company has entered into agreements with AHM and HCI, which provide for the repurchase of new, unused, and
unregistered vehicles or equipment repossessed by the Company from a dealer who defaults on a wholesale loan.
Commercial loans are used primarily for financing dealership property and working capital purposes. Commercial loans
are generally secured by the associated properties, as well as corporate or personal guarantees from, or on behalf of, the
related dealer’s principals.
The Company’s finance receivables and investment in operating leases are geographically diversified throughout the United
States and Canada.
The consolidated financial statements have been prepared in conformity with U.S. generally accepted accounting principles
(GAAP). In preparing the consolidated financial statements, management is required to make estimates and assumptions that
affect the reported amounts of assets and liabilities as of the dates of the consolidated balance sheets and revenues and expenses
for the applicable periods. Those estimates include, among other things, the residual value estimates of lease vehicles and
estimates for the allowances for credit losses and early termination losses on operating leases. Actual results could differ
significantly from these estimates.
(a) Business Risks
The Company’s business is substantially dependent upon the sale of Honda and Acura products. The financing business is
also highly competitive. The Company’s competitors and potential competitors include national, regional, and local
finance companies and other types of financial services companies, such as commercial banks, savings and loan
associations, leasing companies, and credit unions. The Company’s future profitability will be largely dependent upon its
ability to provide cost-competitive, quality financial products and services to its customers and to the availability and cost
of its capital in relation to that of its competitors. The Company’s liquidity is largely dependent on access to credit
markets. The Company has been able to meet funding needs through diversified funding sources.
AMERICAN HONDA FINANCE CORPORATION
AND SUBSIDIARIES
Notes to Consolidated Financial Statements
F-8
Higher than expected credit losses and lower than anticipated lease residual values due to prolonged periods of negative
economic and market conditions can adversely affect the Company’s financial position, results of operations, and related
cash flows. The Company manages these risks with purchasing and residual value setting standards, collection efforts, and
lease remarketing programs. Refer to Note 1(g) for additional discussion on the allowance for credit losses and Note 1(h)
for additional discussion on the determination of lease residual values.
The Company is exposed to market risks, principally interest rate and foreign currency risks, and utilizes derivative
instruments to manage those risks. Although the use of derivative instruments mitigates a substantial portion of these
risks, not all risk is eliminated. Refer to Note 1(n) for additional discussion on derivative instruments.
(b) Principles of Consolidation
The consolidated financial statements include the accounts of AHFC and its subsidiaries. All subsidiaries are wholly
owned, except for HCFI, which is majority-owned (52.33% as of March 31, 2015 and 2014).
The Company also consolidates variable interest entities (VIEs) where the Company is the primary beneficiary. All
consolidated VIEs are statutory trusts formed by the Company to accommodate securitization structures.
All significant intercompany balances and transactions have been eliminated upon consolidation.
The Company reclassified certain prior period amounts in the consolidated financial statements to conform to current year
presentation.
(c) Comprehensive Income
Comprehensive income consists of net income and the effect of foreign currency translation adjustments and is presented
in the consolidated statements of comprehensive income.
(d) Cash and Cash Equivalents
Cash and cash equivalents include cash on hand and short-term, highly liquid investments with original maturities of three
months or less.
(e) Finance Receivables
Finance receivables include retail loan, direct financing lease, and dealer loan portfolio segments. The retail loan portfolio
segment consists of retail installment contracts with consumers. The direct financing lease portfolio segment consists of
closed-end vehicle lease contracts with consumers. The dealer loan portfolio segment consists of wholesale and
commercial loans with dealers.
Finance receivables are classified as held-for-investment if the Company has the intent and ability to hold the receivables
for the foreseeable future or until maturity or payoff. As of March 31, 2015 and 2014, all finance receivables were
classified as held-for-investment and reported at amortized cost.
Retail and dealer loans include the outstanding principal balance, allowance for credit losses, unearned origination fees,
and deferred origination costs. Direct financing leases include the gross receivable balances, unearned interest income,
write-down of lease residual values, allowance for credit losses, unearned origination fees, and deferred origination costs.
Origination fees include payments received from AHM and HCI for incentive programs (refer to Note 6 regarding these
related party transactions). For a limited number of contracts, origination fees include payments received from dealers to
buy down the interest rates charged to their customers. Origination costs include initial direct origination costs (IDC) and
payments made to dealers for rate participation.
AMERICAN HONDA FINANCE CORPORATION
AND SUBSIDIARIES
Notes to Consolidated Financial Statements
F-9
Revenue on finance receivables includes contractual interest income, accretion of origination fees, and amortization of
origination costs. Interest income on retail and dealer loans is accrued as earned using the simple interest method.
Unearned interest income on direct financing leases is recognized as finance revenue over the term of the lease using the
interest method. Origination fees and costs are recognized as revenue using the interest method over the contractual life of
the finance receivables. The recognition of finance revenue on retail loans and leases is discontinued when the underlying
collateral is repossessed or accounts are charged off. The recognition of finance revenue on dealer loans is discontinued
when it has been determined the Company will be unable to collect all principal and interest payments.
Retail loans and leases are considered delinquent if more than 10% of a scheduled payment is contractually past due on a
cumulative basis. Dealer loans are considered delinquent when any payment is contractually past due. The contractual
balance of retail loans and leases, including accrued interest and fees, are automatically charged off when they become
120 days past due or earlier if they have been specifically identified as uncollectible. Dealer loans are charged off when
they have been individually identified as uncollectible. Charge-offs of loan and lease balances, including uncollected
interest and fees, are recognized as a reduction to the allowance for credit losses. Subsequent recoveries of amounts
previously charged off are credited to the allowance.
(f) Investment in Operating Leases
The investment in operating leases is reported at cost, less accumulated depreciation and net of unearned origination fees
and deferred origination costs. Origination fees include payments received from AHM for incentive programs (refer to
Note 6 regarding these related party transactions). For a limited number of contracts, origination fees include payments
received from dealers to buy down the rental charges. Origination costs include payments made for dealer participation.
Operating lease revenue is recognized on a straight-line basis over the lease term. Operating lease revenue includes
accretion of origination fees and is net of amortization of origination costs, which are also recognized on a straight-line
basis over the lease term. Operating lease vehicles are depreciated on a straight-line basis over the lease term to the
estimated residual value. Refer to Note 1(h) regarding the determination of lease residual values.
A portion of the Company’s operating leases is expected to terminate prior to their scheduled maturities when lessees
default on their contractual obligations. Losses are generally realized upon the disposition of the repossessed operating
lease vehicles. The methodologies used to determine the estimated losses are similar to the methodologies used to
determine the allowance for credit losses on consumer finance receivables. Operating leases are collectively evaluated to
determine the estimated losses incurred. Estimated early termination losses are recognized as a reduction to the carrying
value of operating lease assets.
A review for impairment of the Company’s operating lease assets is performed whenever events or changes in
circumstances indicate that the carrying values may not be recoverable. Generally, an impairment condition is determined
to exist if estimated undiscounted cash flows from the use and eventual disposition of the asset is lower than the carrying
value. For the purposes of testing for impairment, operating lease assets are grouped at the lowest level the Company can
reasonably estimate cash flows. When impairment conditions are met, impairment losses are measured by the amount
carrying values exceed their fair values.
(g) Allowance for Credit Losses
The allowance for credit losses is management’s estimate of probable losses incurred on finance receivables and is
evaluated, at minimum, on a quarterly basis. The retail loan and direct financing lease portfolio segments consist primarily
of pools of homogeneous loans and leases with relatively small balances, which are collectively evaluated for impairment.
Dealer loans are individually evaluated for impairment when specifically identified as impaired. Dealer loans that have
not been specifically identified as impaired are collectively evaluated. An allowance for credit losses is also maintained
for estimated losses on past due operating lease rental payments.
AMERICAN HONDA FINANCE CORPORATION
AND SUBSIDIARIES
Notes to Consolidated Financial Statements
F-10
(h) Determination of Lease Residual Values
Contractual residual values of lease vehicles are determined at lease inception based on expectations of end of term used
vehicle values, taking into consideration external industry data and the Company’s own historical experience. Lease
customers have the option at the end of the lease term to return the vehicle to the dealer or to buy the vehicle for the
contractual residual value (or if purchased prior to lease maturity, for the outstanding contractual balance). Returned lease
vehicles can be purchased by the grounding dealer for the contractual residual value (or if purchased prior to lease
maturity, for the outstanding contractual balance) or a market based price. Returned lease vehicles that are not purchased
by the grounding dealers are sold through online and physical auctions. The Company is exposed to risk of loss on the
disposition of returned lease vehicles when the proceeds from the sale of the vehicles are less than the contractual residual
values at the end of lease term. The Company assesses the estimated end of term market values of the lease vehicles, at
minimum, on a quarterly basis. The primary factors affecting the estimates are the percentage of leased vehicles the
Company expects to be returned by the lessee at the end of lease term and the expected loss severity. Factors considered in
this evaluation include, among other factors, economic conditions, historical trends, and market information on new and
used vehicles.
For operating leases, adjustments to the estimated residual values are made on a straight-line basis over the remaining
term of the lease and are included as depreciation expense. For direct financing leases, downward adjustments for declines
in estimated residual values deemed to be other-than-temporary are recognized as a loss in the period in which the
estimate changed.
(i) Vehicles Held for Disposition
Vehicles held for disposition consist of returned and repossessed vehicles. The vehicles are either sold at used vehicle
auctions or purchased by dealers, usually within two months of return or repossession. The vehicles are valued at the
lower of their carrying value or estimated fair value, less estimated disposition costs. For returned vehicles, valuation
adjustments are recorded as a charge against the gain on disposition of lease vehicles. Valuation adjustments made for
repossessed collateral of finance receivables and operating leases are recognized as charges to the allowance for credit
loss and estimated early termination losses on operating leases, respectively.
(j) Vehicle Service Contract Administration
AHFC performs administrative services for vehicle service contracts (VSC) issued by AHM and its subsidiary, American
Honda Protection Products Corporation. AHFC receives fees for performing the services, which are recognized in other
income over the lives of the underlying contracts, proportionate to the anticipated amount of service to be performed.
HCFI performs marketing services for vehicle service contracts issued by HCI. HCFI receives fees for performing the
services, which are recognized in other income.
(k) Securitizations and Variable Interest Entities
The Company enters into securitization transactions for funding purposes. Securitization transactions involve transferring
pools of the Company’s retail loans to statutory trusts. The trusts are special purpose entities formed by the Company to
accommodate securitization structures. Securitization trusts have the limited purpose of acquiring assets, issuing asset-
backed securities, and making payments on the securities. Assets transferred to securitization trusts are considered to be
legally isolated from the Company and the claims of the Company’s creditors. The Company continues to service the
retail loans transferred to the trusts. Investors in the notes issued by the trusts only have recourse to the assets of the trusts
and do not have recourse to the general credit of the Company.
The Company’s securitizations are structured to provide credit enhancements to investors in notes issued by the trusts.
Credit enhancements can include the following:
Subordinated certificates – Securities issued by the trusts, which are retained by the Company and are subordinated
in priority of payment to the notes.
Overcollateralization – Principal balance of securitized assets exceed the balance of securities issued by the trust.
Excess interest – Excess interest collections can be used to cover losses on defaulted loans.
AMERICAN HONDA FINANCE CORPORATION
AND SUBSIDIARIES
Notes to Consolidated Financial Statements
F-11
Reserve funds – Restricted cash accounts held by the trusts to cover shortfalls in payments of interest and principal
required to be paid on the notes.
Yield supplement accounts – Restricted cash accounts held by the trusts to supplement interest payments on notes.
The securitization trusts formed by the Company are VIEs, which are required to be consolidated by their primary
beneficiary. The Company is considered to be the primary beneficiary of these trusts due to (i) the power to direct the
activities of the trusts that most significantly impact the trusts’ economic performance through its role as servicer, and
(ii) the obligation to absorb losses or the right to receive residual returns that could potentially be significant to the trusts
through the subordinated certificates and residual interest retained.
Consolidation of these trusts results in the securitization transactions being accounted for as on-balance sheet secured
financings. The securitized receivables remain on the consolidated balance sheet of the Company along with the notes
issued by the trusts. The notes are secured solely by the assets of the trusts and not by any other assets of the Company.
The assets of the trusts are the only source of funds for repayment on the notes. Restricted cash accounts held by the trusts
can only be used to support payments on the notes. The restricted cash accounts are included in the Company’s
consolidated balance sheet in other assets. Company recognizes finance revenue and provisions for credit losses on the
securitized receivables and interest expense on the related secured debt.
(l) Income Taxes
The Company’s U.S. entities are included in the consolidated U.S. federal and many consolidated or combined state and
local income tax returns of the Parent, though in some cases the Company files separately as required by certain state and
local jurisdictions. The Company provides its share of the consolidated or combined income tax on a modified separate
return basis pursuant to an intercompany income tax allocation agreement that it has entered into with the Parent. The
Company files a separate California return based on California’s worldwide income and apportionment rules. To the
extent the Company’s U.S. entities have taxable losses in its consolidated federal, and consolidated or combined state and
local tax returns, a benefit will be recognized to the extent that it is more likely than not that these losses will be utilized
by the consolidated or combined return group in the current or future year and thus would be subject to current or future
reimbursement by the Parent under the terms of the intercompany tax allocation agreement. To the extent such losses are
attributable to a state where the Company files a separate return, a benefit for such losses would be recognized to the
extent such losses are more likely than not to be utilized in the future. All but an insignificant amount of the federal and
state taxes payable or receivable shown on the consolidated balance sheets are due to or from the Parent, pursuant to the
intercompany tax allocation agreement.
The Company’s Canadian subsidiary, HCFI, files Canadian federal and provincial income tax returns based on the
separate legal entity financial statements. HCFI does not file U.S. federal, state, or local income tax returns. Consequently,
HCFI does not participate in the intercompany tax allocation agreement that the Company has with the Parent.
Deferred tax assets and liabilities are recognized for the estimated future tax consequences attributable to differences
between the financial statement carrying amounts of existing assets and liabilities and their respective tax bases as well as
operating loss and tax credit carryforwards. Deferred tax assets and liabilities are measured using enacted tax rates
expected to apply to taxable income in the years in which those temporary differences are expected to be recovered or
settled. Under this method, the effect on deferred tax assets and liabilities of a change in tax rates is recognized in income
during the period in which the enactment date occurs. A valuation allowance is provided to offset deferred tax assets if,
based on available evidence, it is more likely than not that some or all of the deferred tax assets will not be realized. In
addition, tax benefits related to positions considered uncertain are recognized only if, based on the technical merits of the
issue, the Company believes that it is more likely than not to sustain the position and then at the largest amount that is
greater than 50% likely to be realized upon ultimate settlement.
(m) Foreign Currency Translation
Upon consolidation, the assets and liabilities of HCFI are translated at year-end exchange rates, and the revenues and
expenses are translated at the average rates of exchange during the respective years. The resulting translation adjustment is
included in other comprehensive income and the cumulative translation adjustment is reported as a separate component of
equity in accumulated other comprehensive income and noncontrolling interest.
AMERICAN HONDA FINANCE CORPORATION
AND SUBSIDIARIES
Notes to Consolidated Financial Statements
F-12
Foreign currency denominated debt is translated at year-end exchange rates, and the foreign currency transaction gains
and losses are recognized through earnings.
(n) Derivative Instruments
The Company utilizes derivative instruments to manage exposures to interest rate and foreign currency risks. The
Company’s assets consist primarily of fixed rate receivables and operating lease assets. The Company’s liabilities consist
of both floating and fixed rate debt, denominated in various currencies. Interest rate and basis swaps are used to match the
interest rate characteristics of the Company’s assets and debt. Currency swaps are used to manage currency risk exposure
on foreign currency denominated debt. Derivative instruments are not used for trading or any other speculative purposes.
All derivative financial instruments are recorded on the consolidated balance sheets at fair value. Beginning March 31,
2015, the Company elected to present derivative instruments in the Company’s consolidated balance sheets on a gross
basis rather than on a net basis by counterparty. Refer to Note 5 for additional information. Except in very limited
circumstances involving counterparties with consolidated securitization trusts, the Company generally has not entered into
credit support (collateral) agreements with its counterparties. Changes in the fair value of derivatives are recognized in
earnings in the period of the change.
(o) Recently Adopted Accounting Standards
Effective April 1, 2014, the Company adopted Accounting Standards Update (ASU) 2013-11, Presentation of an
Unrecognized Tax Benefit When a Net Operating Loss Carryforward, a Similar Tax Loss, or a Tax Credit Carryforward
Exists, which amended Accounting Standards Codification (ASC) Topic 740, Income Taxes. The amendment requires that
an unrecognized tax benefit, or a portion of an unrecognized tax benefit, be presented in the financial statements as a
reduction to a deferred tax asset for a net operating loss carryforward, a similar tax loss, or a tax credit carryforward when
settlement in this manner is available at the reporting date under the tax law, and the entity intends to use the deferred tax
asset for such purpose. The amendment was applied prospectively and did not require new recurring disclosures. The
adoption of this standard did not have a material impact on the consolidated financial statements.
(p) Recently Issued Accounting Standards
In May 2014, the Financial Accounting Standards Board (FASB) issued ASU 2014-09, Revenue from Contracts with
Customers and created a new ASC Topic 606, Revenue from Contracts with Customers, and added ASC Subtopic 340-40,
Other Assets and Deferred Costs—Contracts with Customers. The guidance in this update supersedes the revenue
recognition requirements in ASC Topic 605, Revenue Recognition, and most industry-specific guidance throughout the
industry topics of the codification. This guidance will be effective for the Company beginning in fiscal year 2018. The
Company is currently assessing the impact on the consolidated financial statements.
In August 2014, the FASB issued ASU 2014-15, Presentation of Financial Statements—Going Concern (Subtopic 205-
40): Disclosure of Uncertainties about an Entity’s Ability to Continue as a Going Concern. The amendments require
management to assess an entity’s ability to continue as a going concern by incorporating and expanding upon certain
principles that are currently in U.S. auditing standards. The amendments are effective for the fiscal year ending March 31,
2017 and interim periods thereafter. The adoption of this new standard is not expected to have an impact on the
consolidated financial statements.
In February 2015, the FASB issued ASU 2015-02, Consolidation (Topic 810): Amendments to the Consolidation
Analysis. Under the amendments in this update, all reporting entities are within the scope of Subtopic 810-10,
Consolidation—Overall, including limited partnerships and similar legal entities, unless a scope exception applies. The
amendments are effective for the Company beginning in fiscal year 2016. The Company is currently assessing the impact
on the consolidated financial statements.
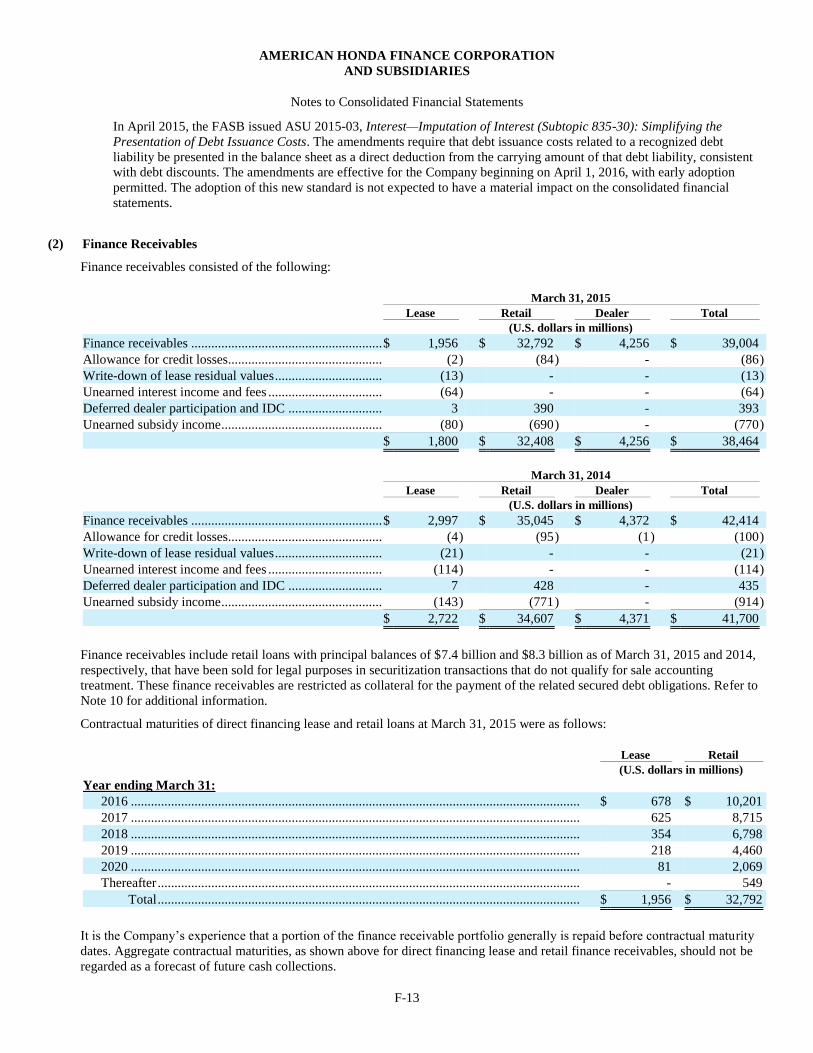
AMERICAN HONDA FINANCE CORPORATION
AND SUBSIDIARIES
Notes to Consolidated Financial Statements
F-13
In April 2015, the FASB issued ASU 2015-03, Interest—Imputation of Interest (Subtopic 835-30): Simplifying the
Presentation of Debt Issuance Costs. The amendments require that debt issuance costs related to a recognized debt
liability be presented in the balance sheet as a direct deduction from the carrying amount of that debt liability, consistent
with debt discounts. The amendments are effective for the Company beginning on April 1, 2016, with early adoption
permitted. The adoption of this new standard is not expected to have a material impact on the consolidated financial
statements.
(2) Finance Receivables
Finance receivables consisted of the following:
March 31, 2015
Lease Retail Dealer Total
(U.S. dollars in millions)
Finance receivables ......................................................... $ 1,956 $ 32,792 $ 4,256 $ 39,004
Allowance for credit losses.............................................. (2 ) (84 ) - (86 )
Write-down of lease residual values ................................ (13 ) - - (13 )
Unearned interest income and fees .................................. (64 ) - - (64 )
Deferred dealer participation and IDC ............................ 3 390 - 393
Unearned subsidy income ................................................ (80 ) (690 ) - (770 )
$ 1,800 $ 32,408 $ 4,256 $ 38,464
March 31, 2014
Lease Retail Dealer Total
(U.S. dollars in millions)
Finance receivables ......................................................... $ 2,997 $ 35,045 $ 4,372 $ 42,414
Allowance for credit losses.............................................. (4 ) (95 ) (1 ) (100 )
Write-down of lease residual values ................................ (21 ) - - (21 )
Unearned interest income and fees .................................. (114 ) - - (114 )
Deferred dealer participation and IDC ............................ 7 428 - 435
Unearned subsidy income ................................................ (143 ) (771 ) - (914 )
$ 2,722 $ 34,607 $ 4,371 $ 41,700
Finance receivables include retail loans with principal balances of $7.4 billion and $8.3 billion as of March 31, 2015 and 2014,
respectively, that have been sold for legal purposes in securitization transactions that do not qualify for sale accounting
treatment. These finance receivables are restricted as collateral for the payment of the related secured debt obligations. Refer to
Note 10 for additional information.
Contractual maturities of direct financing lease and retail loans at March 31, 2015 were as follows:
Lease Retail
(U.S. dollars in millions)
Year ending March 31:
2016 ...................................................................................................................................... $ 678 $ 10,201
2017 ...................................................................................................................................... 625 8,715
2018 ...................................................................................................................................... 354 6,798
2019 ...................................................................................................................................... 218 4,460
2020 ...................................................................................................................................... 81 2,069
Thereafter .............................................................................................................................. - 549
Total .............................................................................................................................. $ 1,956 $ 32,792
It is the Company’s experience that a portion of the finance receivable portfolio generally is repaid before contractual maturity
dates. Aggregate contractual maturities, as shown above for direct financing lease and retail finance receivables, should not be
regarded as a forecast of future cash collections.
AMERICAN HONDA FINANCE CORPORATION
AND SUBSIDIARIES
Notes to Consolidated Financial Statements
F-14
The uninsured portions of the lease residual values were $298 million and $433 million at March 31, 2015 and 2014,
respectively. Included in the gain or loss on disposition of lease vehicles are end of term charges on both direct financing and
operating leases of $23 million, $26 million and $22 million for the fiscal years ended March 31, 2015, 2014 and 2013,
respectively.
Credit Quality of Financing Receivables
Credit losses are an expected cost of extending credit. The majority of the credit risk is with consumer financing and to a lesser
extent with dealer financing. Credit risk can be affected by general economic conditions. Adverse changes such as a rise in
unemployment rates can increase the likelihood of defaults. Declines in used vehicle prices can reduce the amount of recoveries
on repossessed collateral. Credit risk on dealer loans is affected primarily by the financial strength of the dealers within the
portfolio. Exposure to credit risk is managed through purchasing standards, pricing of contracts for expected losses, focusing
collection efforts to minimize losses, and ongoing reviews of the financial condition of dealers.
Allowance for Credit Losses
The allowance for credit losses is management’s estimate of probable losses incurred on finance receivables, which require
significant judgment and assumptions that are inherently uncertain. The allowance is based on management’s evaluation of
many factors, including the Company’s historical credit loss experience, the value of the underlying collateral, delinquency
trends, and economic conditions.
Consumer finance receivables in the retail loan and direct financing lease portfolio segments are collectively evaluated for
impairment. Delinquencies and losses are continuously monitored and this historical experience provides the primary basis for
estimating the allowance. Management utilizes various methodologies when estimating the allowance for credit losses including
models, which incorporate vintage loss and delinquency migration analysis. These models take into consideration attributes of
the portfolio including loan-to-value ratios, internal and external credit scores, and collateral types. Market and economic factors
such as used vehicle prices, unemployment rates, and consumer debt service burdens are also incorporated when estimating
losses.
Dealer loans are individually evaluated for impairment when specifically identified as impaired. Dealer loans are considered to
be impaired when it is probable that the Company will be unable to collect all amounts due according to the terms of the
contract. The Company’s determination of whether dealer loans are impaired is based on evaluations of dealerships’ payment
history, financial condition, and their ability to perform under the terms of the loan agreements. Dealer loans that have not been
specifically identified as impaired are collectively evaluated for impairment.
There were no modifications to dealer loans that constituted troubled debt restructurings during the fiscal years ended March 31,
2015 and 2014. Dealer loans totaling $7 million were modified during the fiscal year ended March 31, 2013 that constituted
troubled debt restructurings. No impairment losses were recognized as the modifications extended the maturity of the loans and
did not involve a reduction of principal, accrued interest, or stated interest rates. The period of deferral was considered to be
more than insignificant and the interest rates were not adjusted to reflect the extension in maturities.
The Company generally does not grant concessions on consumer finance receivables that are considered to be troubled debt
restructurings other than modifications of retail loans in reorganization proceeding pursuant to the U.S. Bankruptcy Code. Retail
loans modified under bankruptcy protection were not material to the Company’s consolidated financial statements during the
fiscal years ended March 31, 2015, 2014 and 2013. The Company does allow payment deferrals on consumer finance
receivables. However, these payment deferrals are not considered to be troubled debt restructurings since the deferrals are
deemed to be insignificant and interest continues to accrue during the deferral period.
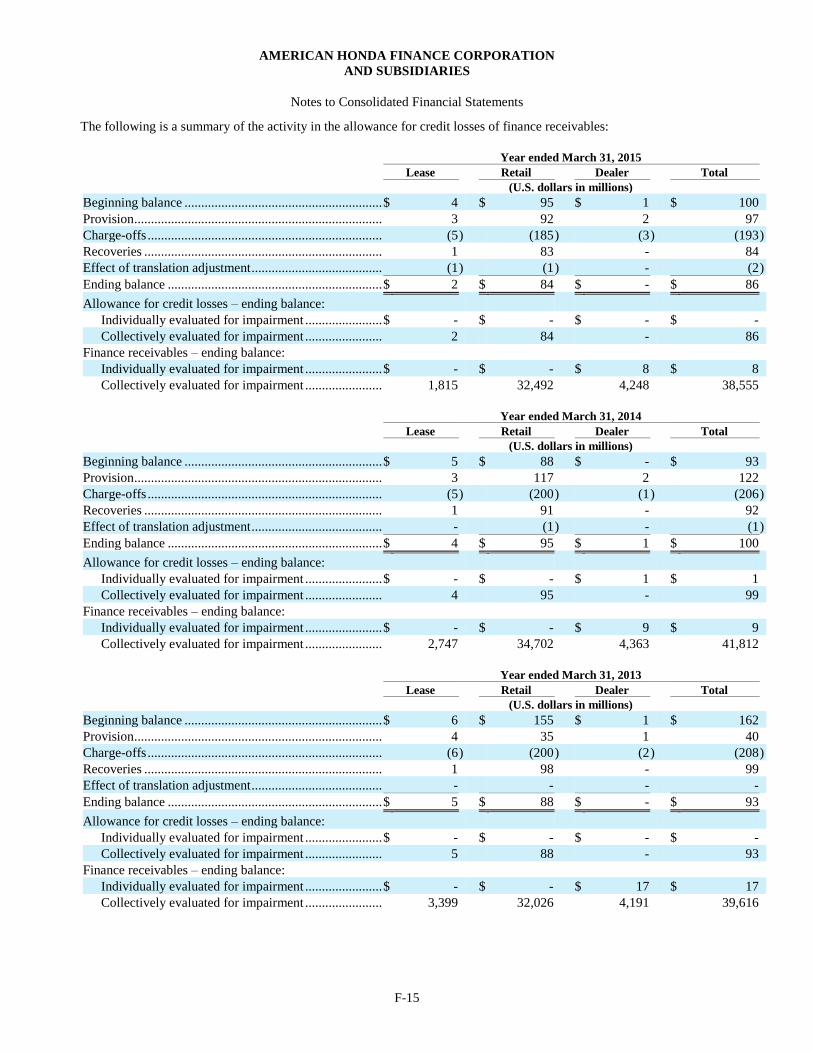
AMERICAN HONDA FINANCE CORPORATION
AND SUBSIDIARIES
Notes to Consolidated Financial Statements
F-15
The following is a summary of the activity in the allowance for credit losses of finance receivables:
Year ended March 31, 2015
Lease Retail Dealer Total
(U.S. dollars in millions)
Beginning balance ........................................................... $ 4 $ 95 $ 1 $ 100
Provision .......................................................................... 3 92 2 97
Charge-offs ...................................................................... (5 ) (185 ) (3 ) (193 )
Recoveries ....................................................................... 1 83 - 84
Effect of translation adjustment ....................................... (1 ) (1 ) - (2 )
Ending balance ................................................................ $ 2 $ 84 $ - $ 86
Allowance for credit losses – ending balance:
Individually evaluated for impairment ....................... $ - $ - $ - $ -
Collectively evaluated for impairment ....................... 2 84 - 86
Finance receivables – ending balance:
Individually evaluated for impairment ....................... $ - $ - $ 8 $ 8
Collectively evaluated for impairment ....................... 1,815 32,492 4,248 38,555
Year ended March 31, 2014
Lease Retail Dealer Total
(U.S. dollars in millions)
Beginning balance ........................................................... $ 5 $ 88 $ - $ 93
Provision .......................................................................... 3 117 2 122
Charge-offs ...................................................................... (5 ) (200 ) (1 ) (206 )
Recoveries ....................................................................... 1 91 - 92
Effect of translation adjustment ....................................... - (1 ) - (1 )
Ending balance ................................................................ $ 4 $ 95 $ 1 $ 100
Allowance for credit losses – ending balance:
Individually evaluated for impairment ....................... $ - $ - $ 1 $ 1
Collectively evaluated for impairment ....................... 4 95 - 99
Finance receivables – ending balance:
Individually evaluated for impairment ....................... $ - $ - $ 9 $ 9
Collectively evaluated for impairment ....................... 2,747 34,702 4,363 41,812
Year ended March 31, 2013
Lease Retail Dealer Total
(U.S. dollars in millions)
Beginning balance ........................................................... $ 6 $ 155 $ 1 $ 162
Provision .......................................................................... 4 35 1 40
Charge-offs ...................................................................... (6 ) (200 ) (2 ) (208 )
Recoveries ....................................................................... 1 98 - 99
Effect of translation adjustment ....................................... - - - -
Ending balance ................................................................ $ 5 $ 88 $ - $ 93
Allowance for credit losses – ending balance:
Individually evaluated for impairment ....................... $ - $ - $ - $ -
Collectively evaluated for impairment ....................... 5 88 - 93
Finance receivables – ending balance:
Individually evaluated for impairment ....................... $ - $ - $ 17 $ 17
Collectively evaluated for impairment ....................... 3,399 32,026 4,191 39,616
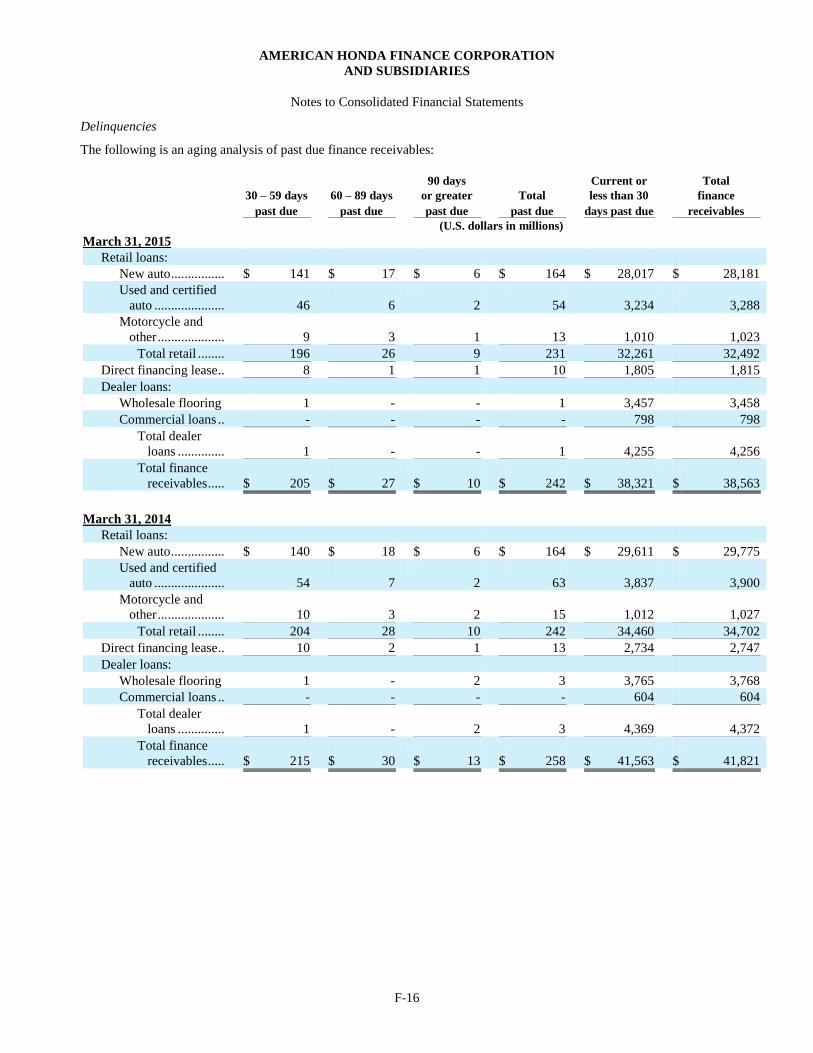
AMERICAN HONDA FINANCE CORPORATION
AND SUBSIDIARIES
Notes to Consolidated Financial Statements
F-16
Delinquencies
The following is an aging analysis of past due finance receivables:
90 days Current or Total
30 – 59 days 60 – 89 days or greater Total less than 30 finance
past due past due past due past due days past due receivables
(U.S. dollars in millions)
March 31, 2015
Retail loans:
New auto ................ $ 141 $ 17 $ 6 $ 164 $ 28,017 $ 28,181
Used and certified
auto ..................... 46 6 2 54 3,234 3,288
Motorcycle and
other .................... 9 3 1 13 1,010 1,023
Total retail ........ 196 26 9 231 32,261 32,492
Direct financing lease .. 8 1 1 10 1,805 1,815
Dealer loans:
Wholesale flooring 1 - - 1 3,457 3,458
Commercial loans .. - - - - 798 798
Total dealer
loans .............. 1 - - 1 4,255 4,256
Total finance
receivables ..... $ 205 $ 27 $ 10 $ 242 $ 38,321 $ 38,563
March 31, 2014
Retail loans:
New auto ................ $ 140 $ 18 $ 6 $ 164 $ 29,611 $ 29,775
Used and certified
auto ..................... 54 7 2 63 3,837 3,900
Motorcycle and
other .................... 10 3 2 15 1,012 1,027
Total retail ........ 204 28 10 242 34,460 34,702
Direct financing lease .. 10 2 1 13 2,734 2,747
Dealer loans:
Wholesale flooring 1 - 2 3 3,765 3,768
Commercial loans .. - - - - 604 604
Total dealer
loans .............. 1 - 2 3 4,369 4,372
Total finance
receivables ..... $ 215 $ 30 $ 13 $ 258 $ 41,563 $ 41,821
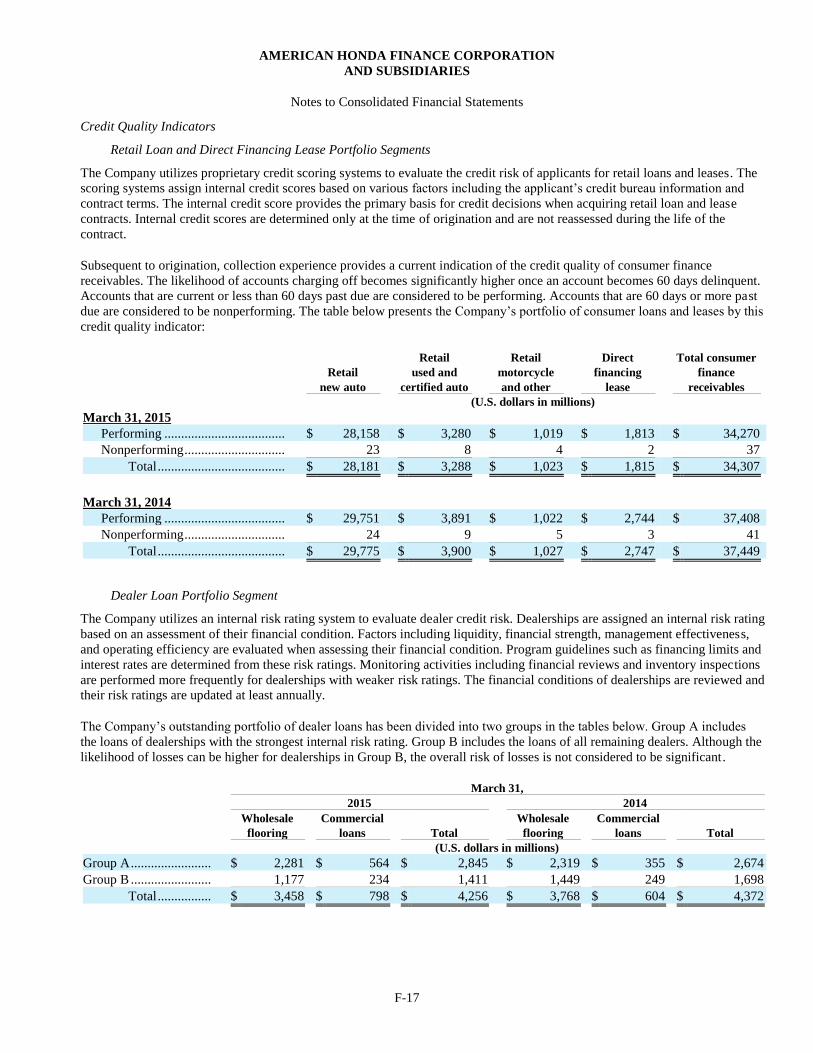
AMERICAN HONDA FINANCE CORPORATION
AND SUBSIDIARIES
Notes to Consolidated Financial Statements
F-17
Credit Quality Indicators
Retail Loan and Direct Financing Lease Portfolio Segments
The Company utilizes proprietary credit scoring systems to evaluate the credit risk of applicants for retail loans and leases. The
scoring systems assign internal credit scores based on various factors including the applicant’s credit bureau information and
contract terms. The internal credit score provides the primary basis for credit decisions when acquiring retail loan and lease
contracts. Internal credit scores are determined only at the time of origination and are not reassessed during the life of the
contract.
Subsequent to origination, collection experience provides a current indication of the credit quality of consumer finance
receivables. The likelihood of accounts charging off becomes significantly higher once an account becomes 60 days delinquent.
Accounts that are current or less than 60 days past due are considered to be performing. Accounts that are 60 days or more past
due are considered to be nonperforming. The table below presents the Company’s portfolio of consumer loans and leases by this
credit quality indicator:
Retail Retail Direct Total consumer
Retail used and motorcycle financing finance
new auto certified auto and other lease receivables
(U.S. dollars in millions)
March 31, 2015
Performing .................................... $ 28,158 $ 3,280 $ 1,019 $ 1,813 $ 34,270
Nonperforming .............................. 23 8 4 2 37
Total ...................................... $ 28,181 $ 3,288 $ 1,023 $ 1,815 $ 34,307
March 31, 2014
Performing .................................... $ 29,751 $ 3,891 $ 1,022 $ 2,744 $ 37,408
Nonperforming .............................. 24 9 5 3 41
Total ...................................... $ 29,775 $ 3,900 $ 1,027 $ 2,747 $ 37,449
Dealer Loan Portfolio Segment
The Company utilizes an internal risk rating system to evaluate dealer credit risk. Dealerships are assigned an internal risk rating
based on an assessment of their financial condition. Factors including liquidity, financial strength, management effectiveness,
and operating efficiency are evaluated when assessing their financial condition. Program guidelines such as financing limits and
interest rates are determined from these risk ratings. Monitoring activities including financial reviews and inventory inspections
are performed more frequently for dealerships with weaker risk ratings. The financial conditions of dealerships are reviewed and
their risk ratings are updated at least annually.
The Company’s outstanding portfolio of dealer loans has been divided into two groups in the tables below. Group A includes
the loans of dealerships with the strongest internal risk rating. Group B includes the loans of all remaining dealers. Although the
likelihood of losses can be higher for dealerships in Group B, the overall risk of losses is not considered to be significant.
March 31,
2015 2014
Wholesale Commercial Wholesale Commercial
flooring loans Total flooring loans Total
(U.S. dollars in millions)
Group A ........................ $ 2,281 $ 564 $ 2,845 $ 2,319 $ 355 $ 2,674
Group B ........................ 1,177 234 1,411 1,449 249 1,698
Total ................ $ 3,458 $ 798 $ 4,256 $ 3,768 $ 604 $ 4,372
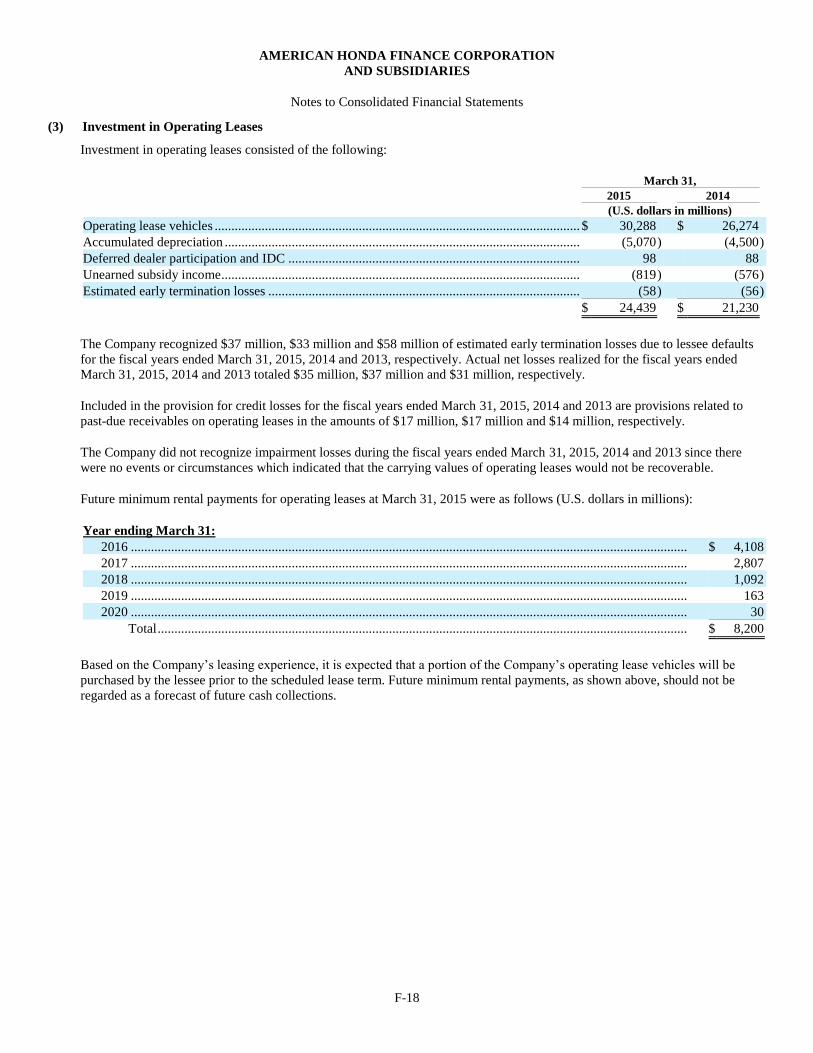
AMERICAN HONDA FINANCE CORPORATION
AND SUBSIDIARIES
Notes to Consolidated Financial Statements
F-18
(3) Investment in Operating Leases
Investment in operating leases consisted of the following:
March 31,
2015 2014
(U.S. dollars in millions)
Operating lease vehicles ............................................................................................................. $ 30,288 $ 26,274
Accumulated depreciation .......................................................................................................... (5,070 ) (4,500 )
Deferred dealer participation and IDC ....................................................................................... 98 88
Unearned subsidy income ........................................................................................................... (819 ) (576 )
Estimated early termination losses ............................................................................................. (58 ) (56 )
$ 24,439 $ 21,230
The Company recognized $37 million, $33 million and $58 million of estimated early termination losses due to lessee defaults
for the fiscal years ended March 31, 2015, 2014 and 2013, respectively. Actual net losses realized for the fiscal years ended
March 31, 2015, 2014 and 2013 totaled $35 million, $37 million and $31 million, respectively.
Included in the provision for credit losses for the fiscal years ended March 31, 2015, 2014 and 2013 are provisions related to
past-due receivables on operating leases in the amounts of $17 million, $17 million and $14 million, respectively.
The Company did not recognize impairment losses during the fiscal years ended March 31, 2015, 2014 and 2013 since there
were no events or circumstances which indicated that the carrying values of operating leases would not be recoverable.
Future minimum rental payments for operating leases at March 31, 2015 were as follows (U.S. dollars in millions):
Year ending March 31:
2016 ...................................................................................................................................................................... $ 4,108
2017 ...................................................................................................................................................................... 2,807
2018 ...................................................................................................................................................................... 1,092
2019 ...................................................................................................................................................................... 163
2020 ...................................................................................................................................................................... 30
Total .............................................................................................................................................................. $ 8,200
Based on the Company’s leasing experience, it is expected that a portion of the Company’s operating lease vehicles will be
purchased by the lessee prior to the scheduled lease term. Future minimum rental payments, as shown above, should not be
regarded as a forecast of future cash collections.
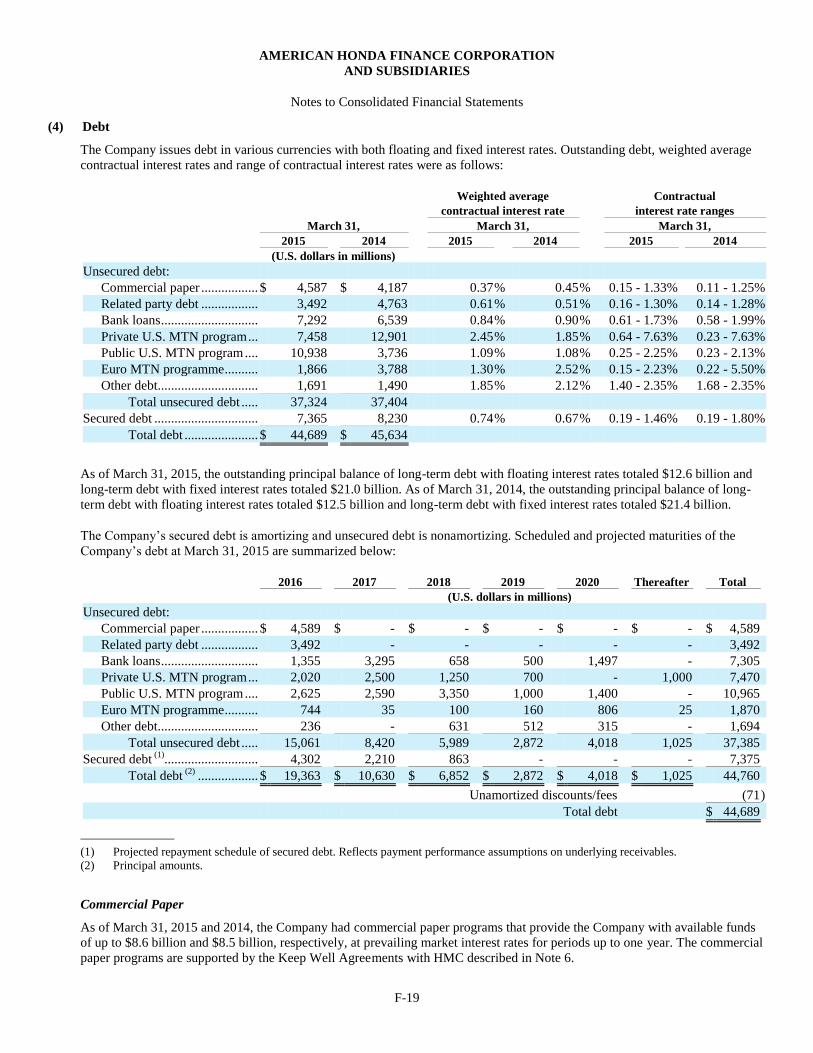
AMERICAN HONDA FINANCE CORPORATION
AND SUBSIDIARIES
Notes to Consolidated Financial Statements
F-19
(4) Debt
The Company issues debt in various currencies with both floating and fixed interest rates. Outstanding debt, weighted average
contractual interest rates and range of contractual interest rates were as follows:
Weighted average Contractual
contractual interest rate interest rate ranges
March 31, March 31, March 31,
2015 2014 2015 2014 2015 2014
(U.S. dollars in millions)
Unsecured debt:
Commercial paper ................. $ 4,587 $ 4,187 0.37 % 0.45 % 0.15 - 1.33% 0.11 - 1.25%
Related party debt ................. 3,492 4,763 0.61 % 0.51 % 0.16 - 1.30% 0.14 - 1.28%
Bank loans ............................. 7,292 6,539 0.84 % 0.90 % 0.61 - 1.73% 0.58 - 1.99%
Private U.S. MTN program ... 7,458 12,901 2.45 % 1.85 % 0.64 - 7.63% 0.23 - 7.63%
Public U.S. MTN program .... 10,938 3,736 1.09 % 1.08 % 0.25 - 2.25% 0.23 - 2.13%
Euro MTN programme .......... 1,866 3,788 1.30 % 2.52 % 0.15 - 2.23% 0.22 - 5.50%
Other debt.............................. 1,691 1,490 1.85 % 2.12 % 1.40 - 2.35% 1.68 - 2.35%
Total unsecured debt ..... 37,324 37,404
Secured debt ............................... 7,365 8,230 0.74 % 0.67 % 0.19 - 1.46% 0.19 - 1.80%
Total debt ...................... $ 44,689 $ 45,634
As of March 31, 2015, the outstanding principal balance of long-term debt with floating interest rates totaled $12.6 billion and
long-term debt with fixed interest rates totaled $21.0 billion. As of March 31, 2014, the outstanding principal balance of long-
term debt with floating interest rates totaled $12.5 billion and long-term debt with fixed interest rates totaled $21.4 billion.
The Company’s secured debt is amortizing and unsecured debt is nonamortizing. Scheduled and projected maturities of the
Company’s debt at March 31, 2015 are summarized below:
2016 2017 2018 2019 2020 Thereafter Total
(U.S. dollars in millions)
Unsecured debt:
Commercial paper ................. $ 4,589 $ - $ - $ - $ - $ - $ 4,589
Related party debt ................. 3,492 - - - - - 3,492
Bank loans ............................. 1,355 3,295 658 500 1,497 - 7,305
Private U.S. MTN program ... 2,020 2,500 1,250 700 - 1,000 7,470
Public U.S. MTN program .... 2,625 2,590 3,350 1,000 1,400 - 10,965
Euro MTN programme .......... 744 35 100 160 806 25 1,870
Other debt.............................. 236 - 631 512 315 - 1,694
Total unsecured debt ..... 15,061 8,420 5,989 2,872 4,018 1,025 37,385
Secured debt (1)
............................ 4,302 2,210 863 - - - 7,375
Total debt (2)
.................. $ 19,363 $ 10,630 $ 6,852 $ 2,872 $ 4,018 $ 1,025 44,760
Unamortized discounts/fees (71 )
Total debt $ 44,689
(1) Projected repayment schedule of secured debt. Reflects payment performance assumptions on underlying receivables.
(2) Principal amounts.
Commercial Paper
As of March 31, 2015 and 2014, the Company had commercial paper programs that provide the Company with available funds
of up to $8.6 billion and $8.5 billion, respectively, at prevailing market interest rates for periods up to one year. The commercial
paper programs are supported by the Keep Well Agreements with HMC described in Note 6.
AMERICAN HONDA FINANCE CORPORATION
AND SUBSIDIARIES
Notes to Consolidated Financial Statements
F-20
Outstanding commercial paper averaged $5.4 billion and $4.8 billion during fiscal years 2015 and 2014, respectively. The
maximum balance outstanding at any month-end during fiscal years 2015 and 2014 was $6.7 billion and $6.1 billion,
respectively.
As of March 31, 2015, the Company had available committed lines of credit totaling $8.3 billion, which expire at various times
through March 2020. Committed lines of credit are primarily in place to support the Company’s commercial paper programs. If
these lines were used, it would be in the form of short-term notes. The Company expensed commitment fees of $6 million, $7
million and $8 million during the fiscal years ended March 31, 2015, 2014 and 2013, respectively, in general and administrative
expenses. As of March 31, 2015 and 2014, there were no amounts outstanding under these lines.
Related Party Debt
AHFC routinely issues fixed rate short-term notes to AHM to help fund AHFC’s general corporate operations. The Company
incurred interest expense on these notes totaling approximately $4 million, $5 million and $6 million during the fiscal years
ended March 31, 2015, 2014 and 2013, respectively.
HCFI routinely issues fixed rate short-term notes to HCI to help fund HCFI’s general corporate operations. The Company
incurred interest expense on these notes totaling $22 million, $20 million and $18 million for the fiscal years ended March 31,
2015, 2014 and 2013, respectively.
Bank Loans
Outstanding bank loans at March 31, 2015 had floating rates and outstanding bank loans at March 31, 2014 had either fixed or
floating rates. Outstanding bank loans have prepayment options. No outstanding bank loans as of March 31, 2015 and 2014
were supported by the Keep Well Agreements with HMC described in Note 6.
Medium Term Note (MTN) Programs
Private U.S. MTN Program
AHFC no longer issues U.S. MTNs under the Rule 144A Private U.S. MTN Program. Notes outstanding under the Private U.S.
MTN Program as of March 31 2015 were long-term, with either fixed or floating interest rates, and denominated in U.S. dollars.
Public U.S. MTN Program
The Public U.S. MTN Program is authorized for the issuance of MTNs up to a maximum aggregate principal amount of $16.0
billion. The aggregate principal amount of MTNs offered under this program may be increased from time to time. Notes
outstanding under this program as of March 31, 2015 were both short-term and long-term, with either fixed or floating interest
rates, and denominated in U.S. dollars.
Euro MTN Programme
The Euro MTN Programme was retired in August 2014. AHFC may reactivate the program in the future. Notes under this
program that are currently listed on the Luxembourg Stock Exchange will remain listed through their maturities. Notes
outstanding under this program are long-term as of March 31, 2015 with either fixed or floating interest rates, and denominated
in U.S. dollars, Japanese Yen, or Euros.
The MTN programs are supported by the Keep Well Agreement with HMC described in Note 6.
Other Debt
The outstanding balances as of March 31, 2015 and 2014 represent private placement debt issuances by HCFI denominated in
Canadian dollars, with either fixed or floating rates. Private placement debt is supported by the Keep Well Agreement with
HMC described in Note 6.
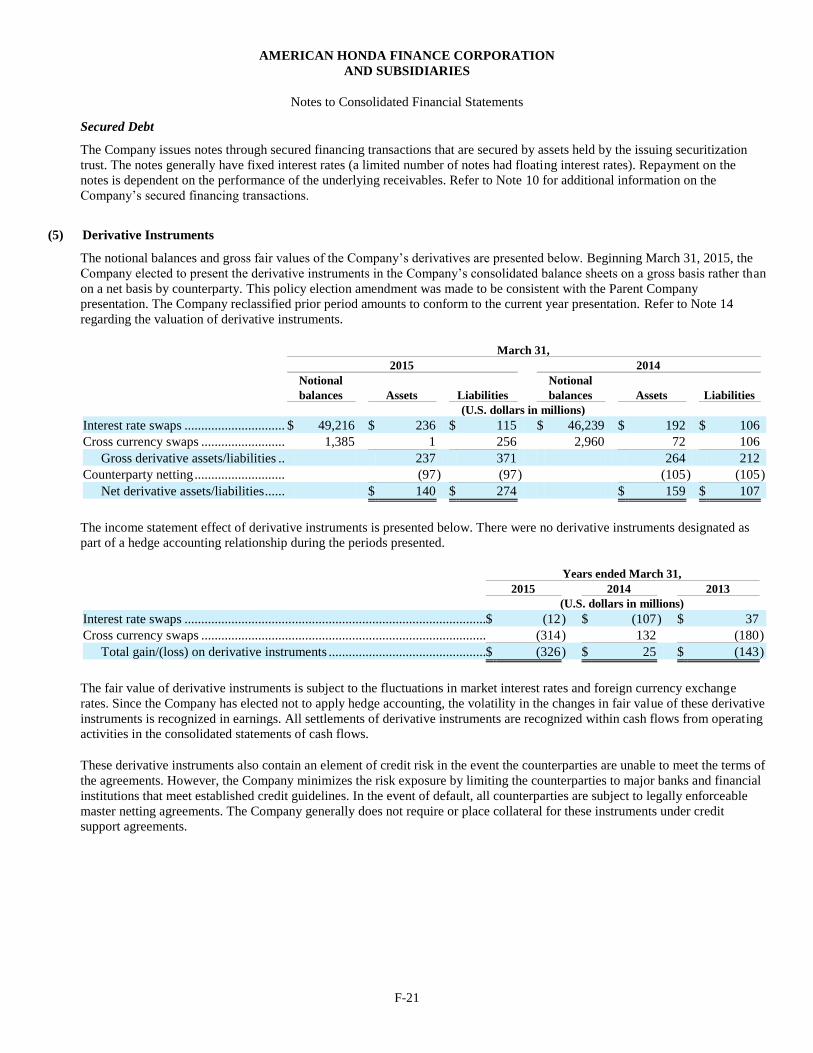
AMERICAN HONDA FINANCE CORPORATION
AND SUBSIDIARIES
Notes to Consolidated Financial Statements
F-21
Secured Debt
The Company issues notes through secured financing transactions that are secured by assets held by the issuing securitization
trust. The notes generally have fixed interest rates (a limited number of notes had floating interest rates). Repayment on the
notes is dependent on the performance of the underlying receivables. Refer to Note 10 for additional information on the
Company’s secured financing transactions.
(5) Derivative Instruments
The notional balances and gross fair values of the Company’s derivatives are presented below. Beginning March 31, 2015, the
Company elected to present the derivative instruments in the Company’s consolidated balance sheets on a gross basis rather than
on a net basis by counterparty. This policy election amendment was made to be consistent with the Parent Company
presentation. The Company reclassified prior period amounts to conform to the current year presentation. Refer to Note 14
regarding the valuation of derivative instruments.
March 31,
2015 2014
Notional Notional
balances Assets Liabilities balances Assets Liabilities
(U.S. dollars in millions)
Interest rate swaps .............................. $ 49,216 $ 236 $ 115 $ 46,239 $ 192 $ 106
Cross currency swaps ......................... 1,385 1 256 2,960 72 106
Gross derivative assets/liabilities .. 237 371 264 212
Counterparty netting ........................... (97 ) (97 ) (105 ) (105 )
Net derivative assets/liabilities ...... $ 140 $ 274 $ 159 $ 107
The income statement effect of derivative instruments is presented below. There were no derivative instruments designated as
part of a hedge accounting relationship during the periods presented.
Years ended March 31,
2015 2014 2013
(U.S. dollars in millions)
Interest rate swaps .......................................................................................... $ (12 ) $ (107 ) $ 37
Cross currency swaps ..................................................................................... (314 ) 132 (180 )
Total gain/(loss) on derivative instruments ............................................... $ (326 ) $ 25 $ (143 )
The fair value of derivative instruments is subject to the fluctuations in market interest rates and foreign currency exchange
rates. Since the Company has elected not to apply hedge accounting, the volatility in the changes in fair value of these derivative
instruments is recognized in earnings. All settlements of derivative instruments are recognized within cash flows from operating
activities in the consolidated statements of cash flows.
These derivative instruments also contain an element of credit risk in the event the counterparties are unable to meet the terms of
the agreements. However, the Company minimizes the risk exposure by limiting the counterparties to major banks and financial
institutions that meet established credit guidelines. In the event of default, all counterparties are subject to legally enforceable
master netting agreements. The Company generally does not require or place collateral for these instruments under credit
support agreements.
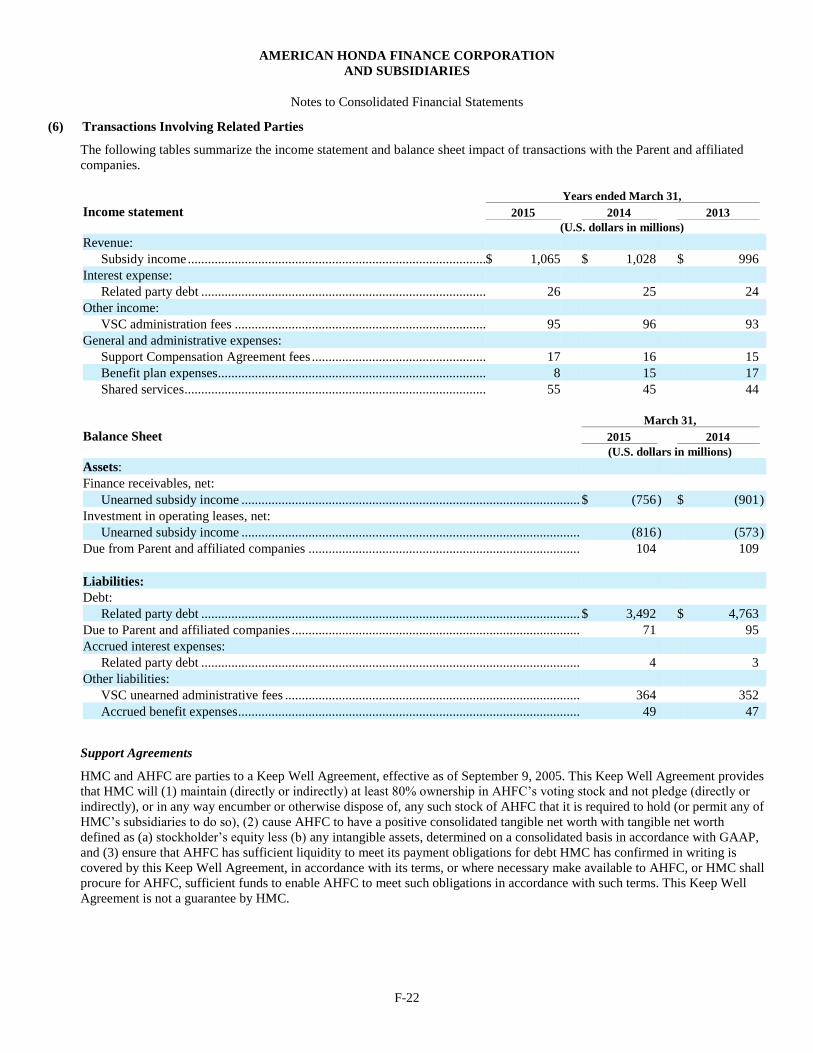
AMERICAN HONDA FINANCE CORPORATION
AND SUBSIDIARIES
Notes to Consolidated Financial Statements
F-22
(6) Transactions Involving Related Parties
The following tables summarize the income statement and balance sheet impact of transactions with the Parent and affiliated
companies.
Years ended March 31,
Income statement 2015 2014 2013
(U.S. dollars in millions)
Revenue:
Subsidy income ......................................................................................... $ 1,065 $ 1,028 $ 996
Interest expense:
Related party debt ..................................................................................... 26 25 24
Other income:
VSC administration fees ........................................................................... 95 96 93
General and administrative expenses:
Support Compensation Agreement fees .................................................... 17 16 15
Benefit plan expenses ................................................................................ 8 15 17
Shared services .......................................................................................... 55 45 44
March 31,
Balance Sheet 2015 2014
(U.S. dollars in millions)
Assets:
Finance receivables, net:
Unearned subsidy income ..................................................................................................... $ (756 ) $ (901 )
Investment in operating leases, net:
Unearned subsidy income ..................................................................................................... (816 ) (573 )
Due from Parent and affiliated companies ................................................................................. 104 109
Liabilities:
Debt:
Related party debt ................................................................................................................. $ 3,492 $ 4,763
Due to Parent and affiliated companies ...................................................................................... 71 95
Accrued interest expenses:
Related party debt ................................................................................................................. 4 3
Other liabilities:
VSC unearned administrative fees ........................................................................................ 364 352
Accrued benefit expenses ...................................................................................................... 49 47
Support Agreements
HMC and AHFC are parties to a Keep Well Agreement, effective as of September 9, 2005. This Keep Well Agreement provides
that HMC will (1) maintain (directly or indirectly) at least 80% ownership in AHFC’s voting stock and not pledge (directly or
indirectly), or in any way encumber or otherwise dispose of, any such stock of AHFC that it is required to hold (or permit any of
HMC’s subsidiaries to do so), (2) cause AHFC to have a positive consolidated tangible net worth with tangible net worth
defined as (a) stockholder’s equity less (b) any intangible assets, determined on a consolidated basis in accordance with GAAP,
and (3) ensure that AHFC has sufficient liquidity to meet its payment obligations for debt HMC has confirmed in writing is
covered by this Keep Well Agreement, in accordance with its terms, or where necessary make available to AHFC, or HMC shall
procure for AHFC, sufficient funds to enable AHFC to meet such obligations in accordance with such terms. This Keep Well
Agreement is not a guarantee by HMC.
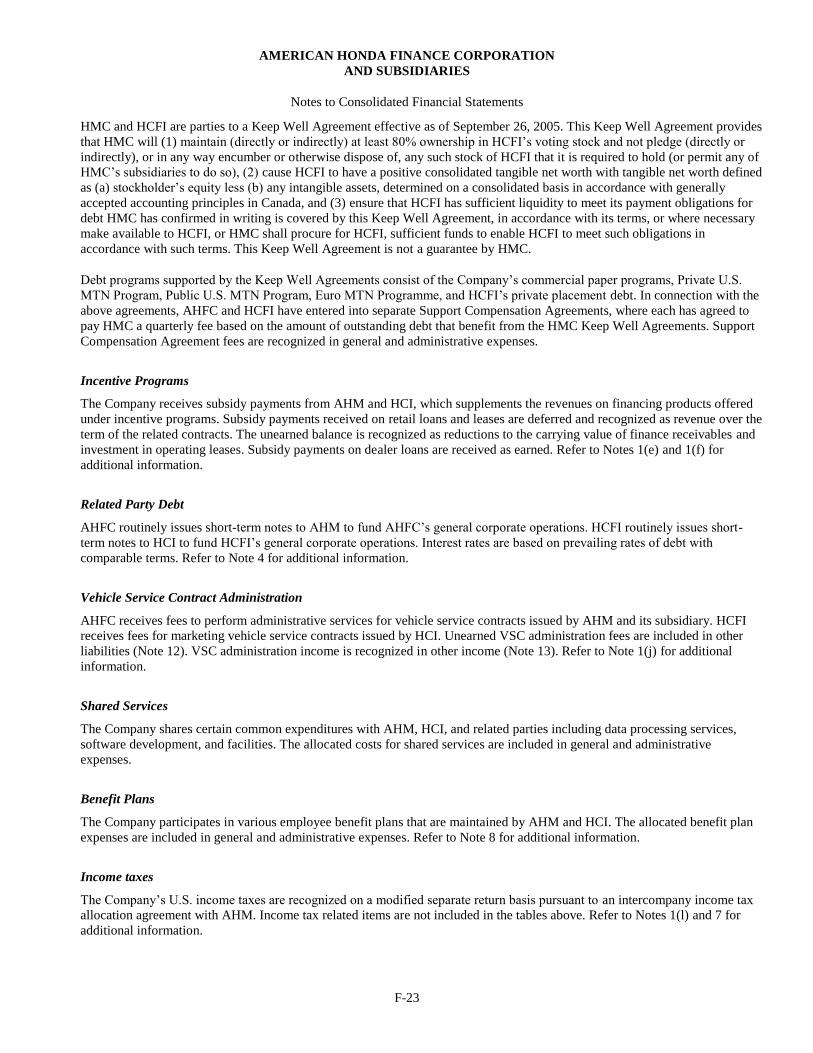
AMERICAN HONDA FINANCE CORPORATION
AND SUBSIDIARIES
Notes to Consolidated Financial Statements
F-23
HMC and HCFI are parties to a Keep Well Agreement effective as of September 26, 2005. This Keep Well Agreement provides
that HMC will (1) maintain (directly or indirectly) at least 80% ownership in HCFI’s voting stock and not pledge (directly or
indirectly), or in any way encumber or otherwise dispose of, any such stock of HCFI that it is required to hold (or permit any of
HMC’s subsidiaries to do so), (2) cause HCFI to have a positive consolidated tangible net worth with tangible net worth defined
as (a) stockholder’s equity less (b) any intangible assets, determined on a consolidated basis in accordance with generally
accepted accounting principles in Canada, and (3) ensure that HCFI has sufficient liquidity to meet its payment obligations for
debt HMC has confirmed in writing is covered by this Keep Well Agreement, in accordance with its terms, or where necessary
make available to HCFI, or HMC shall procure for HCFI, sufficient funds to enable HCFI to meet such obligations in
accordance with such terms. This Keep Well Agreement is not a guarantee by HMC.
Debt programs supported by the Keep Well Agreements consist of the Company’s commercial paper programs, Private U.S.
MTN Program, Public U.S. MTN Program, Euro MTN Programme, and HCFI’s private placement debt. In connection with the
above agreements, AHFC and HCFI have entered into separate Support Compensation Agreements, where each has agreed to
pay HMC a quarterly fee based on the amount of outstanding debt that benefit from the HMC Keep Well Agreements. Support
Compensation Agreement fees are recognized in general and administrative expenses.
Incentive Programs
The Company receives subsidy payments from AHM and HCI, which supplements the revenues on financing products offered
under incentive programs. Subsidy payments received on retail loans and leases are deferred and recognized as revenue over the
term of the related contracts. The unearned balance is recognized as reductions to the carrying value of finance receivables and
investment in operating leases. Subsidy payments on dealer loans are received as earned. Refer to Notes 1(e) and 1(f) for
additional information.
Related Party Debt
AHFC routinely issues short-term notes to AHM to fund AHFC’s general corporate operations. HCFI routinely issues short-
term notes to HCI to fund HCFI’s general corporate operations. Interest rates are based on prevailing rates of debt with
comparable terms. Refer to Note 4 for additional information.
Vehicle Service Contract Administration
AHFC receives fees to perform administrative services for vehicle service contracts issued by AHM and its subsidiary. HCFI
receives fees for marketing vehicle service contracts issued by HCI. Unearned VSC administration fees are included in other
liabilities (Note 12). VSC administration income is recognized in other income (Note 13). Refer to Note 1(j) for additional
information.
Shared Services
The Company shares certain common expenditures with AHM, HCI, and related parties including data processing services,
software development, and facilities. The allocated costs for shared services are included in general and administrative
expenses.
Benefit Plans
The Company participates in various employee benefit plans that are maintained by AHM and HCI. The allocated benefit plan
expenses are included in general and administrative expenses. Refer to Note 8 for additional information.
Income taxes
The Company’s U.S. income taxes are recognized on a modified separate return basis pursuant to an intercompany income tax
allocation agreement with AHM. Income tax related items are not included in the tables above. Refer to Notes 1(l) and 7 for
additional information.
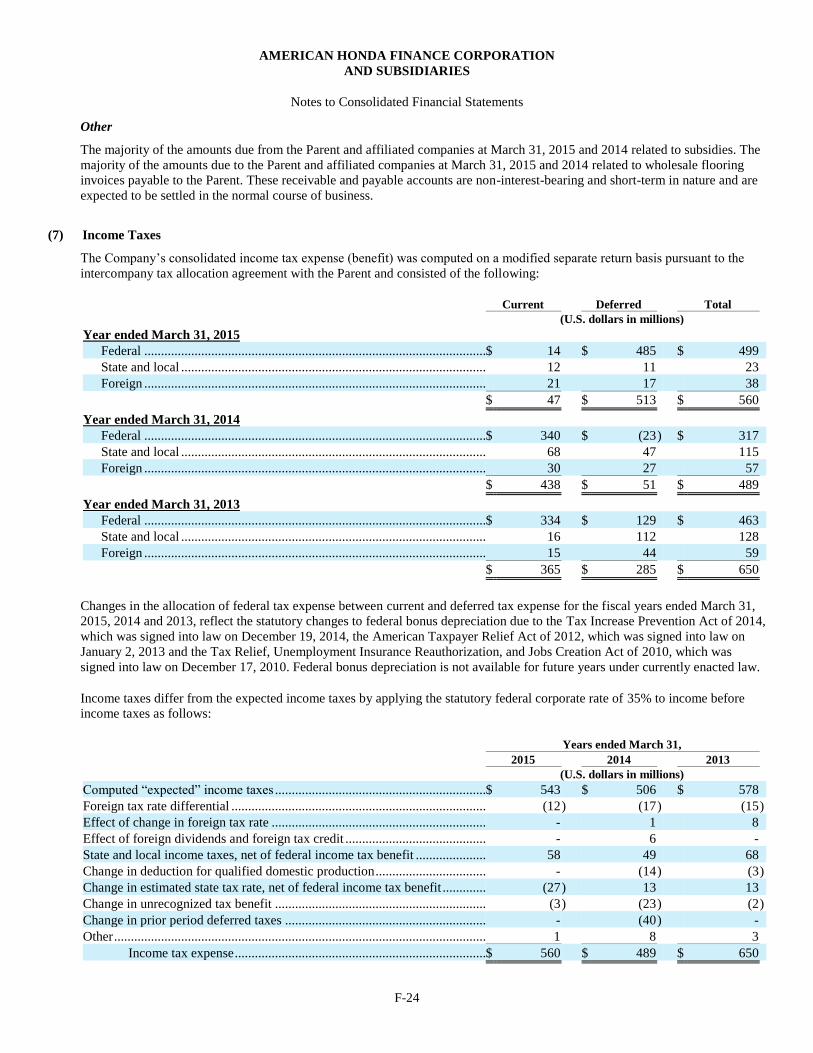
AMERICAN HONDA FINANCE CORPORATION
AND SUBSIDIARIES
Notes to Consolidated Financial Statements
F-24
Other
The majority of the amounts due from the Parent and affiliated companies at March 31, 2015 and 2014 related to subsidies. The
majority of the amounts due to the Parent and affiliated companies at March 31, 2015 and 2014 related to wholesale flooring
invoices payable to the Parent. These receivable and payable accounts are non-interest-bearing and short-term in nature and are
expected to be settled in the normal course of business.
(7) Income Taxes
The Company’s consolidated income tax expense (benefit) was computed on a modified separate return basis pursuant to the
intercompany tax allocation agreement with the Parent and consisted of the following:
Current Deferred Total
(U.S. dollars in millions)
Year ended March 31, 2015
Federal ...................................................................................................... $ 14 $ 485 $ 499
State and local ........................................................................................... 12 11 23
Foreign ...................................................................................................... 21 17 38
$ 47 $ 513 $ 560
Year ended March 31, 2014
Federal ...................................................................................................... $ 340 $ (23 ) $ 317
State and local ........................................................................................... 68 47 115
Foreign ...................................................................................................... 30 27 57
$ 438 $ 51 $ 489
Year ended March 31, 2013
Federal ...................................................................................................... $ 334 $ 129 $ 463
State and local ........................................................................................... 16 112 128
Foreign ...................................................................................................... 15 44 59
$ 365 $ 285 $ 650
Changes in the allocation of federal tax expense between current and deferred tax expense for the fiscal years ended March 31,
2015, 2014 and 2013, reflect the statutory changes to federal bonus depreciation due to the Tax Increase Prevention Act of 2014,
which was signed into law on December 19, 2014, the American Taxpayer Relief Act of 2012, which was signed into law on
January 2, 2013 and the Tax Relief, Unemployment Insurance Reauthorization, and Jobs Creation Act of 2010, which was
signed into law on December 17, 2010. Federal bonus depreciation is not available for future years under currently enacted law.
Income taxes differ from the expected income taxes by applying the statutory federal corporate rate of 35% to income before
income taxes as follows:
Years ended March 31,
2015 2014 2013
(U.S. dollars in millions)
Computed “expected” income taxes ............................................................... $ 543 $ 506 $ 578
Foreign tax rate differential ............................................................................ (12 ) (17 ) (15 )
Effect of change in foreign tax rate ................................................................ - 1 8
Effect of foreign dividends and foreign tax credit .......................................... - 6 -
State and local income taxes, net of federal income tax benefit ..................... 58 49 68
Change in deduction for qualified domestic production ................................. - (14 ) (3 )
Change in estimated state tax rate, net of federal income tax benefit ............. (27 ) 13 13
Change in unrecognized tax benefit ............................................................... (3 ) (23 ) (2 )
Change in prior period deferred taxes ............................................................ - (40 ) -
Other ............................................................................................................... 1 8 3
Income tax expense ........................................................................... $ 560 $ 489 $ 650
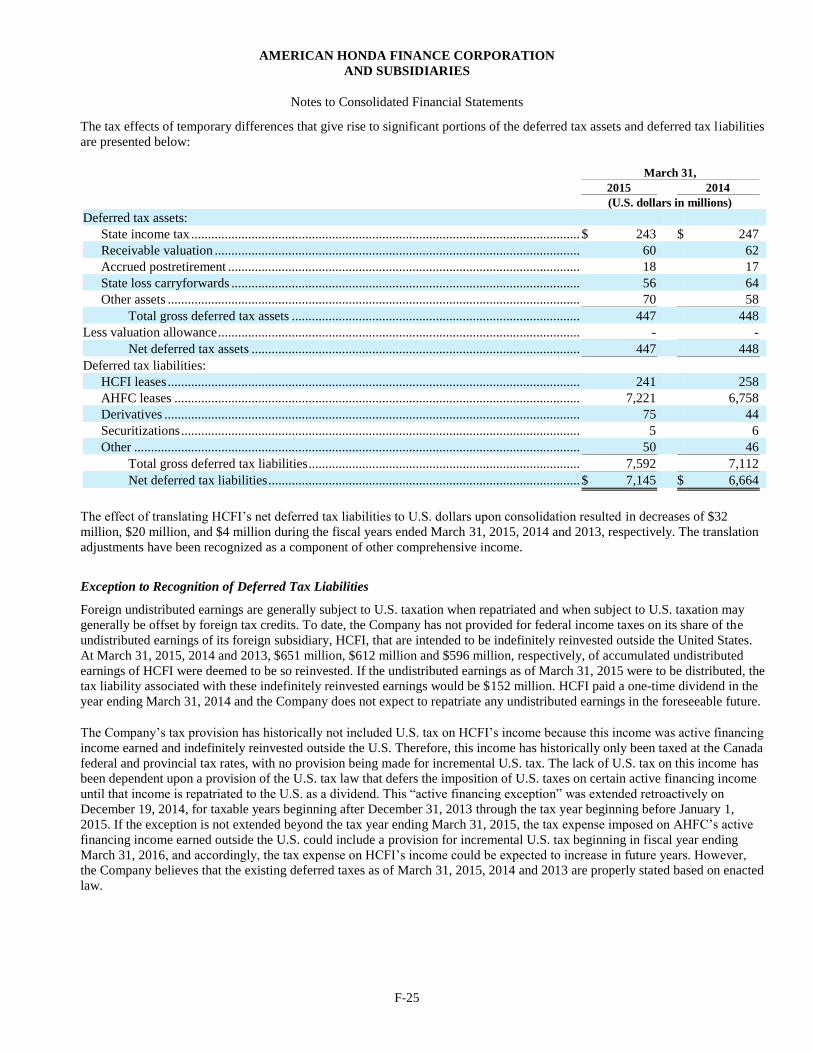
AMERICAN HONDA FINANCE CORPORATION
AND SUBSIDIARIES
Notes to Consolidated Financial Statements
F-25
The tax effects of temporary differences that give rise to significant portions of the deferred tax assets and deferred tax liabilities
are presented below:
March 31,
2015 2014
(U.S. dollars in millions)
Deferred tax assets:
State income tax .................................................................................................................... $ 243 $ 247
Receivable valuation ............................................................................................................. 60 62
Accrued postretirement ......................................................................................................... 18 17
State loss carryforwards ........................................................................................................ 56 64
Other assets ........................................................................................................................... 70 58
Total gross deferred tax assets ...................................................................................... 447 448
Less valuation allowance ............................................................................................................ - -
Net deferred tax assets .................................................................................................. 447 448
Deferred tax liabilities:
HCFI leases ........................................................................................................................... 241 258
AHFC leases ......................................................................................................................... 7,221 6,758
Derivatives ............................................................................................................................ 75 44
Securitizations ....................................................................................................................... 5 6
Other ..................................................................................................................................... 50 46
Total gross deferred tax liabilities ................................................................................. 7,592 7,112
Net deferred tax liabilities ............................................................................................. $ 7,145 $ 6,664
The effect of translating HCFI’s net deferred tax liabilities to U.S. dollars upon consolidation resulted in decreases of $32
million, $20 million, and $4 million during the fiscal years ended March 31, 2015, 2014 and 2013, respectively. The translation
adjustments have been recognized as a component of other comprehensive income.
Exception to Recognition of Deferred Tax Liabilities
Foreign undistributed earnings are generally subject to U.S. taxation when repatriated and when subject to U.S. taxation may
generally be offset by foreign tax credits. To date, the Company has not provided for federal income taxes on its share of the
undistributed earnings of its foreign subsidiary, HCFI, that are intended to be indefinitely reinvested outside the United States.
At March 31, 2015, 2014 and 2013, $651 million, $612 million and $596 million, respectively, of accumulated undistributed
earnings of HCFI were deemed to be so reinvested. If the undistributed earnings as of March 31, 2015 were to be distributed, the
tax liability associated with these indefinitely reinvested earnings would be $152 million. HCFI paid a one-time dividend in the
year ending March 31, 2014 and the Company does not expect to repatriate any undistributed earnings in the foreseeable future.
The Company’s tax provision has historically not included U.S. tax on HCFI’s income because this income was active financing
income earned and indefinitely reinvested outside the U.S. Therefore, this income has historically only been taxed at the Canada
federal and provincial tax rates, with no provision being made for incremental U.S. tax. The lack of U.S. tax on this income has
been dependent upon a provision of the U.S. tax law that defers the imposition of U.S. taxes on certain active financing income
until that income is repatriated to the U.S. as a dividend. This “active financing exception” was extended retroactively on
December 19, 2014, for taxable years beginning after December 31, 2013 through the tax year beginning before January 1,
2015. If the exception is not extended beyond the tax year ending March 31, 2015, the tax expense imposed on AHFC’s active
financing income earned outside the U.S. could include a provision for incremental U.S. tax beginning in fiscal year ending
March 31, 2016, and accordingly, the tax expense on HCFI’s income could be expected to increase in future years. However,
the Company believes that the existing deferred taxes as of March 31, 2015, 2014 and 2013 are properly stated based on enacted
law.
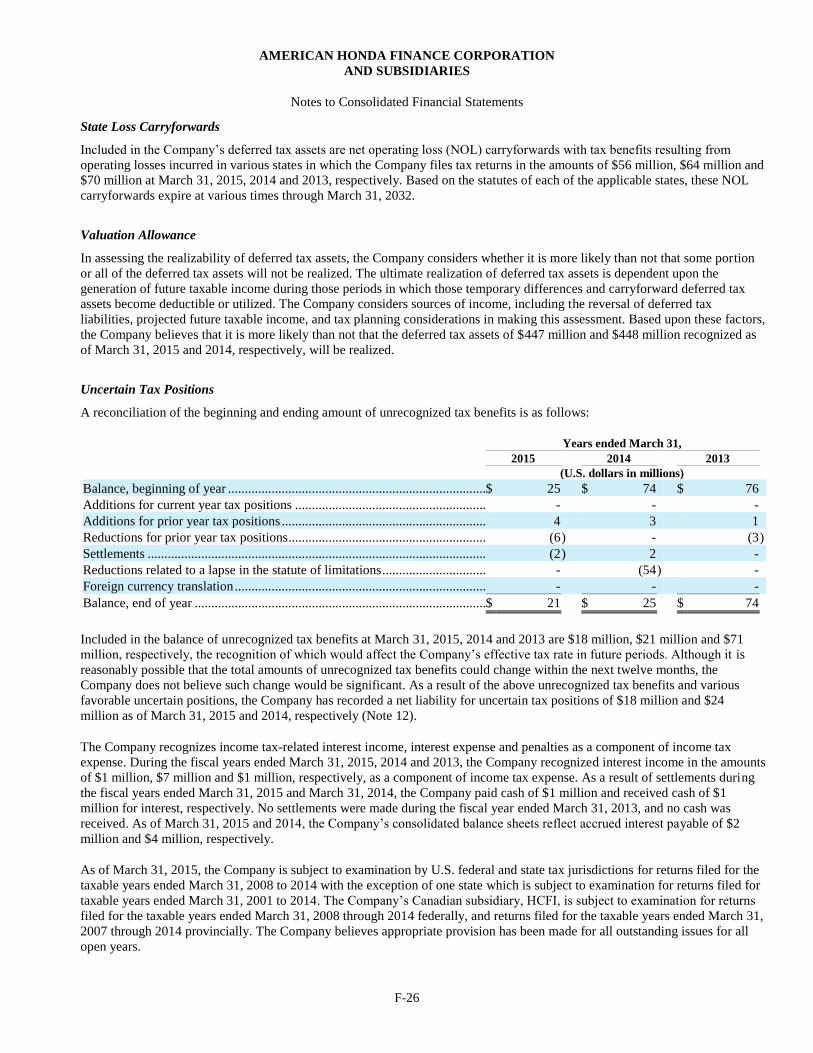
AMERICAN HONDA FINANCE CORPORATION
AND SUBSIDIARIES
Notes to Consolidated Financial Statements
F-26
State Loss Carryforwards
Included in the Company’s deferred tax assets are net operating loss (NOL) carryforwards with tax benefits resulting from
operating losses incurred in various states in which the Company files tax returns in the amounts of $56 million, $64 million and
$70 million at March 31, 2015, 2014 and 2013, respectively. Based on the statutes of each of the applicable states, these NOL
carryforwards expire at various times through March 31, 2032.
Valuation Allowance
In assessing the realizability of deferred tax assets, the Company considers whether it is more likely than not that some portion
or all of the deferred tax assets will not be realized. The ultimate realization of deferred tax assets is dependent upon the
generation of future taxable income during those periods in which those temporary differences and carryforward deferred tax
assets become deductible or utilized. The Company considers sources of income, including the reversal of deferred tax
liabilities, projected future taxable income, and tax planning considerations in making this assessment. Based upon these factors,
the Company believes that it is more likely than not that the deferred tax assets of $447 million and $448 million recognized as
of March 31, 2015 and 2014, respectively, will be realized.
Uncertain Tax Positions
A reconciliation of the beginning and ending amount of unrecognized tax benefits is as follows:
Years ended March 31,
2015 2014 2013
(U.S. dollars in millions)
Balance, beginning of year ............................................................................. $ 25 $ 74 $ 76
Additions for current year tax positions ......................................................... - - -
Additions for prior year tax positions ............................................................. 4 3 1
Reductions for prior year tax positions ........................................................... (6 ) - (3 )
Settlements ..................................................................................................... (2 ) 2 -
Reductions related to a lapse in the statute of limitations ............................... - (54 ) -
Foreign currency translation ........................................................................... - - -
Balance, end of year ....................................................................................... $ 21 $ 25 $ 74
Included in the balance of unrecognized tax benefits at March 31, 2015, 2014 and 2013 are $18 million, $21 million and $71
million, respectively, the recognition of which would affect the Company’s effective tax rate in future periods. Although it is
reasonably possible that the total amounts of unrecognized tax benefits could change within the next twelve months, the
Company does not believe such change would be significant. As a result of the above unrecognized tax benefits and various
favorable uncertain positions, the Company has recorded a net liability for uncertain tax positions of $18 million and $24
million as of March 31, 2015 and 2014, respectively (Note 12).
The Company recognizes income tax-related interest income, interest expense and penalties as a component of income tax
expense. During the fiscal years ended March 31, 2015, 2014 and 2013, the Company recognized interest income in the amounts
of $1 million, $7 million and $1 million, respectively, as a component of income tax expense. As a result of settlements during
the fiscal years ended March 31, 2015 and March 31, 2014, the Company paid cash of $1 million and received cash of $1
million for interest, respectively. No settlements were made during the fiscal year ended March 31, 2013, and no cash was
received. As of March 31, 2015 and 2014, the Company’s consolidated balance sheets reflect accrued interest payable of $2
million and $4 million, respectively.
As of March 31, 2015, the Company is subject to examination by U.S. federal and state tax jurisdictions for returns filed for the
taxable years ended March 31, 2008 to 2014 with the exception of one state which is subject to examination for returns filed for
taxable years ended March 31, 2001 to 2014. The Company’s Canadian subsidiary, HCFI, is subject to examination for returns
filed for the taxable years ended March 31, 2008 through 2014 federally, and returns filed for the taxable years ended March 31,
2007 through 2014 provincially. The Company believes appropriate provision has been made for all outstanding issues for all
open years.
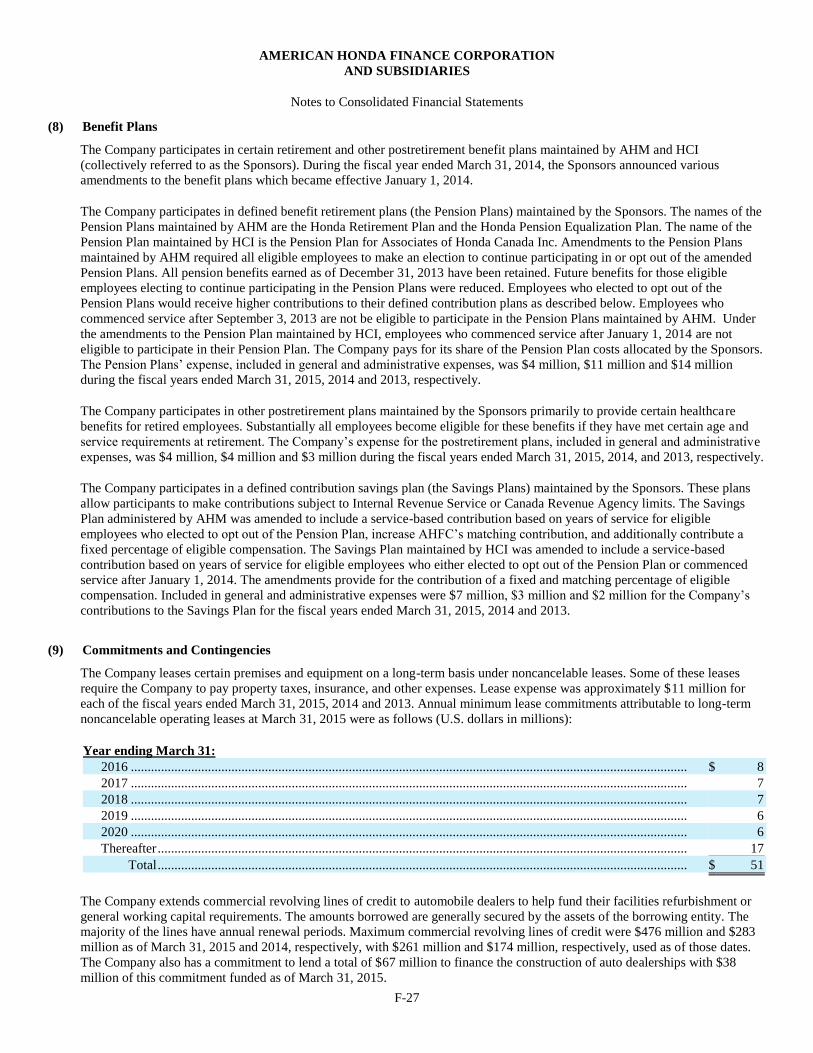
AMERICAN HONDA FINANCE CORPORATION
AND SUBSIDIARIES
Notes to Consolidated Financial Statements
F-27
(8) Benefit Plans
The Company participates in certain retirement and other postretirement benefit plans maintained by AHM and HCI
(collectively referred to as the Sponsors). During the fiscal year ended March 31, 2014, the Sponsors announced various
amendments to the benefit plans which became effective January 1, 2014.
The Company participates in defined benefit retirement plans (the Pension Plans) maintained by the Sponsors. The names of the
Pension Plans maintained by AHM are the Honda Retirement Plan and the Honda Pension Equalization Plan. The name of the
Pension Plan maintained by HCI is the Pension Plan for Associates of Honda Canada Inc. Amendments to the Pension Plans
maintained by AHM required all eligible employees to make an election to continue participating in or opt out of the amended
Pension Plans. All pension benefits earned as of December 31, 2013 have been retained. Future benefits for those eligible
employees electing to continue participating in the Pension Plans were reduced. Employees who elected to opt out of the
Pension Plans would receive higher contributions to their defined contribution plans as described below. Employees who
commenced service after September 3, 2013 are not be eligible to participate in the Pension Plans maintained by AHM. Under
the amendments to the Pension Plan maintained by HCI, employees who commenced service after January 1, 2014 are not
eligible to participate in their Pension Plan. The Company pays for its share of the Pension Plan costs allocated by the Sponsors.
The Pension Plans’ expense, included in general and administrative expenses, was $4 million, $11 million and $14 million
during the fiscal years ended March 31, 2015, 2014 and 2013, respectively.
The Company participates in other postretirement plans maintained by the Sponsors primarily to provide certain healthcare
benefits for retired employees. Substantially all employees become eligible for these benefits if they have met certain age and
service requirements at retirement. The Company’s expense for the postretirement plans, included in general and administrative
expenses, was $4 million, $4 million and $3 million during the fiscal years ended March 31, 2015, 2014, and 2013, respectively.
The Company participates in a defined contribution savings plan (the Savings Plans) maintained by the Sponsors. These plans
allow participants to make contributions subject to Internal Revenue Service or Canada Revenue Agency limits. The Savings
Plan administered by AHM was amended to include a service-based contribution based on years of service for eligible
employees who elected to opt out of the Pension Plan, increase AHFC’s matching contribution, and additionally contribute a
fixed percentage of eligible compensation. The Savings Plan maintained by HCI was amended to include a service-based
contribution based on years of service for eligible employees who either elected to opt out of the Pension Plan or commenced
service after January 1, 2014. The amendments provide for the contribution of a fixed and matching percentage of eligible
compensation. Included in general and administrative expenses were $7 million, $3 million and $2 million for the Company’s
contributions to the Savings Plan for the fiscal years ended March 31, 2015, 2014 and 2013.
(9) Commitments and Contingencies
The Company leases certain premises and equipment on a long-term basis under noncancelable leases. Some of these leases
require the Company to pay property taxes, insurance, and other expenses. Lease expense was approximately $11 million for
each of the fiscal years ended March 31, 2015, 2014 and 2013. Annual minimum lease commitments attributable to long-term
noncancelable operating leases at March 31, 2015 were as follows (U.S. dollars in millions):
Year ending March 31:
2016 ...................................................................................................................................................................... $ 8
2017 ...................................................................................................................................................................... 7
2018 ...................................................................................................................................................................... 7
2019 ...................................................................................................................................................................... 6
2020 ...................................................................................................................................................................... 6
Thereafter .............................................................................................................................................................. 17
Total .............................................................................................................................................................. $ 51
The Company extends commercial revolving lines of credit to automobile dealers to help fund their facilities refurbishment or
general working capital requirements. The amounts borrowed are generally secured by the assets of the borrowing entity. The
majority of the lines have annual renewal periods. Maximum commercial revolving lines of credit were $476 million and $283
million as of March 31, 2015 and 2014, respectively, with $261 million and $174 million, respectively, used as of those dates.
The Company also has a commitment to lend a total of $67 million to finance the construction of auto dealerships with $38
million of this commitment funded as of March 31, 2015.
AMERICAN HONDA FINANCE CORPORATION
AND SUBSIDIARIES
Notes to Consolidated Financial Statements
F-28
Legal Proceedings and Regulatory Matters
The Company is involved, in the ordinary course of business, in various legal proceedings including claims of individual
customers and purported class action lawsuits. Certain of these actions are similar to suits filed against other financial
institutions and captive finance companies. Most of these proceedings concern customer allegations of wrongful repossession or
defamation of credit. The Company is also subject to governmental reviews from time to time. The Company establishes
accruals for legal claims when payments associated with the claims become probable and the costs can be reasonably estimated.
When able, the Company will determine estimates of reasonably possible loss or range of loss, whether in excess of any related
accrued liability or where there is no accrued liability. Given the inherent uncertainty associated with legal matters, the actual
costs of resolving legal claims and associated costs of defense may be substantially higher or lower than the amounts for which
accruals have been established. Based on available information and established accruals, management does not believe it is
reasonably possible that the results of these proceedings, in the aggregate, will have a material adverse effect on the Company’s
consolidated financial statements.
As previously disclosed, the Consumer Financial Protection Bureau (CFPB), together with the U.S. Department of Justice (the
Agencies), have contacted the Company regarding their review of pricing practices by dealers originating retail installment sale
contracts for automobiles. The Company has voluntarily provided the information requested and cooperated fully with the
investigation. As also previously disclosed, the Company has received a notice that the Agencies have authorized an
enforcement action, alleging discrimination in automobile loan pricing to certain borrowers by dealers and alleging the loan
pricing disparities were caused by the Company’s business practices related to dealer discretion, and that the Agencies may seek
monetary relief and implementation of changes to the Company’s pricing practices and policies, which may affect the
Company’s business. The Company has also been informed that the Agencies may defer pursuit of litigation if the Company
works with them to seek a voluntary resolution to these allegations. The Company continues to cooperate with the Agencies to
find a mutually agreeable resolution. At March 31, 2015, given the current status of discussions with the Agencies, the
Company recorded as a loss contingency an amount that was not material to the Company’s consolidated financial condition or
results of operations for the year ended March 31, 2015. The Company intends to continue discussions with the Agencies to
attempt to achieve a mutually satisfactory resolution to these matters. In addition, the Company also received a subpoena from a
state agency requesting information relating to its fair lending laws. The Company is cooperating with this request for
information. Management cannot predict the outcome of this inquiry.
(10) Securitizations and Variable Interest Entities
The trusts utilized for on-balance sheet securitizations are VIEs, which are required to be consolidated by their primary
beneficiary. The Company is considered to be the primary beneficiary of these trusts due to (i) the power to direct the activities
of the trusts that most significantly impact the trusts’ economic performance through its role as servicer, and (ii) the obligation
to absorb losses or the right to receive residual returns that could potentially be significant to the trusts through the subordinated
certificates and residual interest retained. The debt securities issued by the trusts to third-party investors along with the assets of
the trusts are included in the Company’s consolidated financial statements.
During the fiscal years ended March 31, 2015 and 2014, the Company issued notes through asset-backed securitizations, which
were accounted for as secured financing transactions totaling $4.3 billion and $5.8 billion, respectively. The notes were secured
by receivables with an initial principal balance of $4.4 billion and $5.9 billion, respectively.
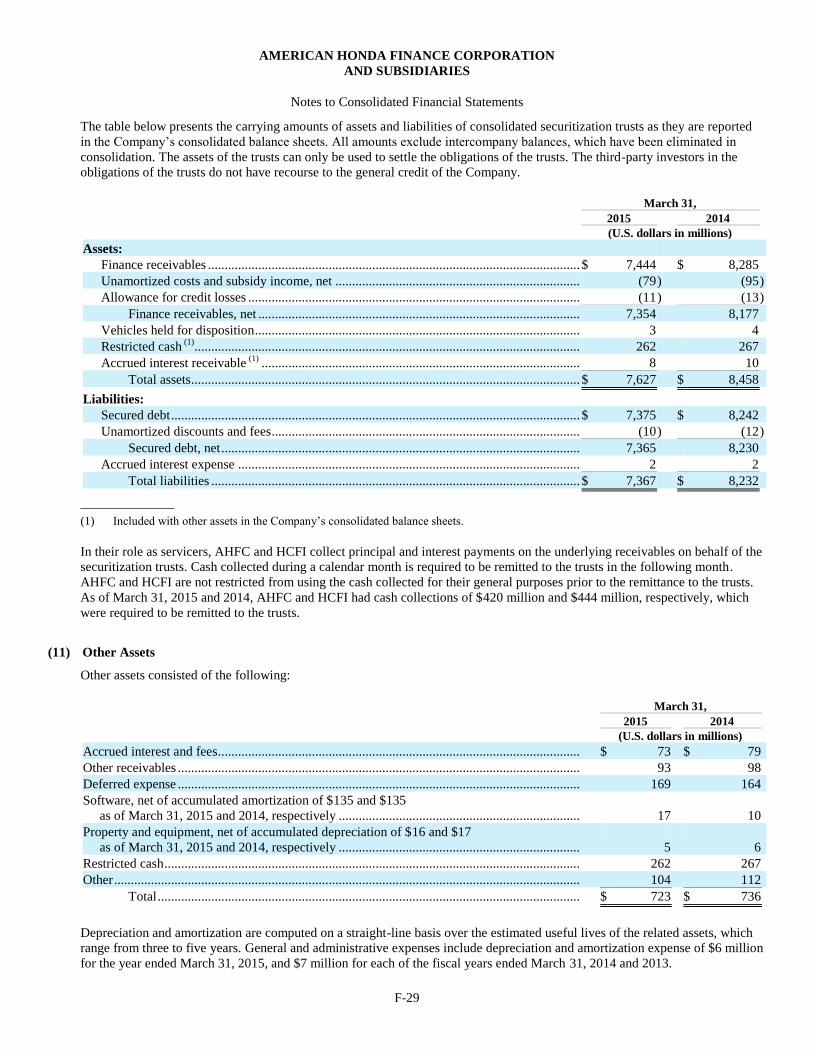
AMERICAN HONDA FINANCE CORPORATION
AND SUBSIDIARIES
Notes to Consolidated Financial Statements
F-29
The table below presents the carrying amounts of assets and liabilities of consolidated securitization trusts as they are reported
in the Company’s consolidated balance sheets. All amounts exclude intercompany balances, which have been eliminated in
consolidation. The assets of the trusts can only be used to settle the obligations of the trusts. The third-party investors in the
obligations of the trusts do not have recourse to the general credit of the Company.
March 31,
2015 2014
(U.S. dollars in millions)
Assets:
Finance receivables ............................................................................................................... $ 7,444 $ 8,285
Unamortized costs and subsidy income, net ......................................................................... (79 ) (95 )
Allowance for credit losses ................................................................................................... (11 ) (13 )
Finance receivables, net ................................................................................................ 7,354 8,177
Vehicles held for disposition ................................................................................................. 3 4
Restricted cash (1)
................................................................................................................... 262 267
Accrued interest receivable (1)
............................................................................................... 8 10
Total assets .................................................................................................................... $ 7,627 $ 8,458
Liabilities:
Secured debt .......................................................................................................................... $ 7,375 $ 8,242
Unamortized discounts and fees ............................................................................................ (10 ) (12 )
Secured debt, net ........................................................................................................... 7,365 8,230
Accrued interest expense ...................................................................................................... 2 2
Total liabilities .............................................................................................................. $ 7,367 $ 8,232
(1) Included with other assets in the Company’s consolidated balance sheets.
In their role as servicers, AHFC and HCFI collect principal and interest payments on the underlying receivables on behalf of the
securitization trusts. Cash collected during a calendar month is required to be remitted to the trusts in the following month.
AHFC and HCFI are not restricted from using the cash collected for their general purposes prior to the remittance to the trusts.
As of March 31, 2015 and 2014, AHFC and HCFI had cash collections of $420 million and $444 million, respectively, which
were required to be remitted to the trusts.
(11) Other Assets
Other assets consisted of the following:
March 31,
2015 2014
(U.S. dollars in millions)
Accrued interest and fees ............................................................................................................ $ 73 $ 79
Other receivables ........................................................................................................................ 93 98
Deferred expense ........................................................................................................................ 169 164
Software, net of accumulated amortization of $135 and $135
as of March 31, 2015 and 2014, respectively ........................................................................ 17 10
Property and equipment, net of accumulated depreciation of $16 and $17
as of March 31, 2015 and 2014, respectively ........................................................................ 5 6
Restricted cash ............................................................................................................................ 262 267
Other ........................................................................................................................................... 104 112
Total .............................................................................................................................. $ 723 $ 736
Depreciation and amortization are computed on a straight-line basis over the estimated useful lives of the related assets, which
range from three to five years. General and administrative expenses include depreciation and amortization expense of $6 million
for the year ended March 31, 2015, and $7 million for each of the fiscal years ended March 31, 2014 and 2013.
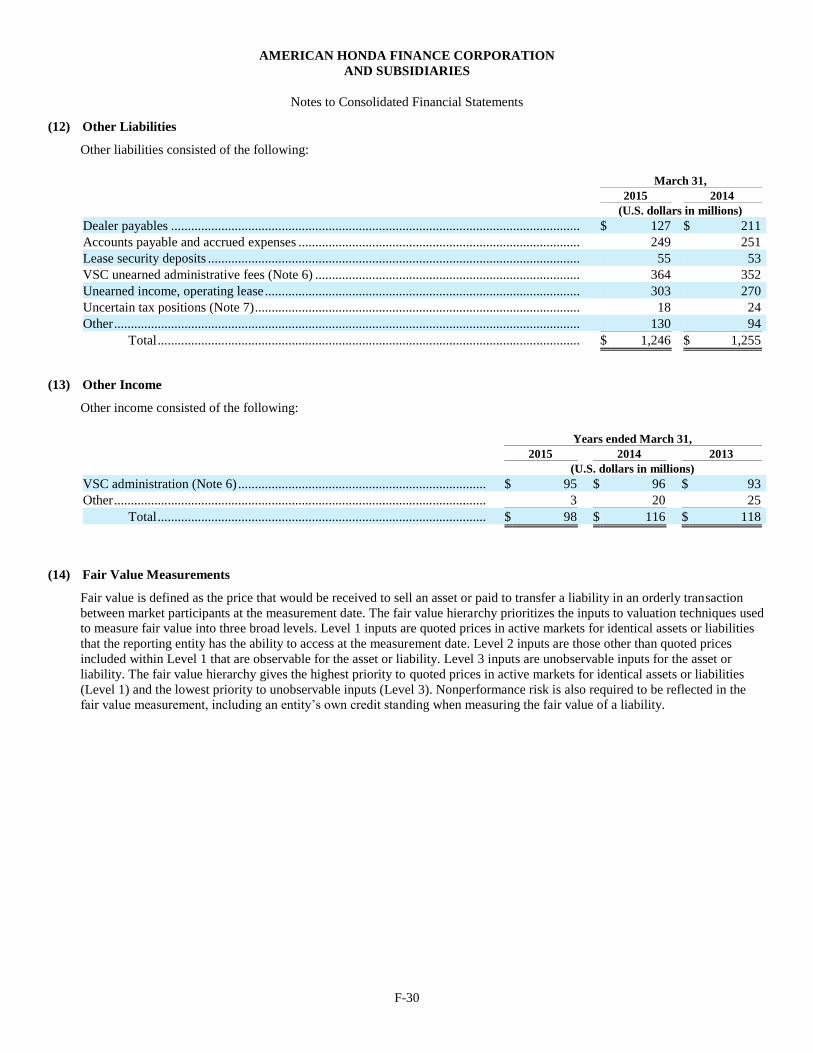
AMERICAN HONDA FINANCE CORPORATION
AND SUBSIDIARIES
Notes to Consolidated Financial Statements
F-30
(12) Other Liabilities
Other liabilities consisted of the following:
March 31,
2015 2014
(U.S. dollars in millions)
Dealer payables .......................................................................................................................... $ 127 $ 211
Accounts payable and accrued expenses .................................................................................... 249 251
Lease security deposits ............................................................................................................... 55 53
VSC unearned administrative fees (Note 6) ............................................................................... 364 352
Unearned income, operating lease .............................................................................................. 303 270
Uncertain tax positions (Note 7) ................................................................................................. 18 24
Other ........................................................................................................................................... 130 94
Total .............................................................................................................................. $ 1,246 $ 1,255
(13) Other Income
Other income consisted of the following:
Years ended March 31,
2015 2014 2013
(U.S. dollars in millions)
VSC administration (Note 6) .......................................................................... $ 95 $ 96 $ 93
Other ............................................................................................................... 3 20 25
Total .................................................................................................. $ 98 $ 116 $ 118
(14) Fair Value Measurements
Fair value is defined as the price that would be received to sell an asset or paid to transfer a liability in an orderly transaction
between market participants at the measurement date. The fair value hierarchy prioritizes the inputs to valuation techniques used
to measure fair value into three broad levels. Level 1 inputs are quoted prices in active markets for identical assets or liabilities
that the reporting entity has the ability to access at the measurement date. Level 2 inputs are those other than quoted prices
included within Level 1 that are observable for the asset or liability. Level 3 inputs are unobservable inputs for the asset or
liability. The fair value hierarchy gives the highest priority to quoted prices in active markets for identical assets or liabilities
(Level 1) and the lowest priority to unobservable inputs (Level 3). Nonperformance risk is also required to be reflected in the
fair value measurement, including an entity’s own credit standing when measuring the fair value of a liability.
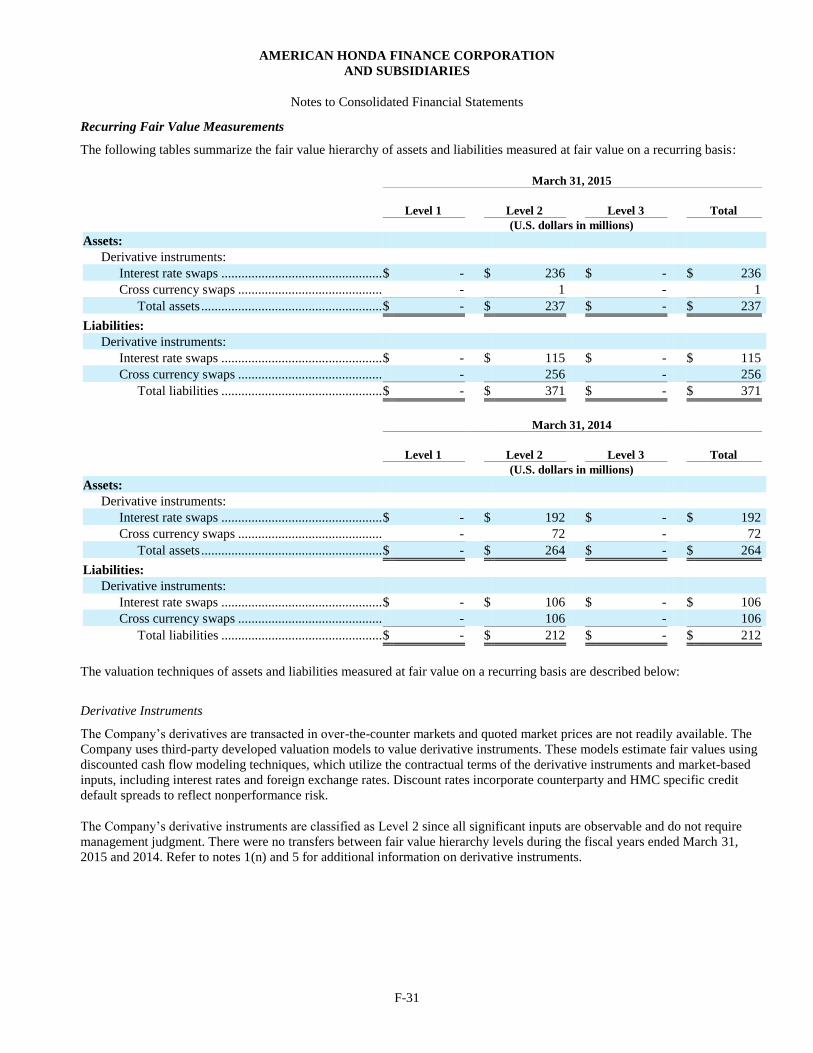
AMERICAN HONDA FINANCE CORPORATION
AND SUBSIDIARIES
Notes to Consolidated Financial Statements
F-31
Recurring Fair Value Measurements
The following tables summarize the fair value hierarchy of assets and liabilities measured at fair value on a recurring basis:
March 31, 2015
Level 1 Level 2 Level 3 Total
(U.S. dollars in millions)
Assets:
Derivative instruments:
Interest rate swaps ................................................ $ - $ 236 $ - $ 236
Cross currency swaps ........................................... - 1 - 1
Total assets ...................................................... $ - $ 237 $ - $ 237
Liabilities:
Derivative instruments:
Interest rate swaps ................................................ $ - $ 115 $ - $ 115
Cross currency swaps ........................................... - 256 - 256
Total liabilities ................................................ $ - $ 371 $ - $ 371
March 31, 2014
Level 1 Level 2 Level 3 Total
(U.S. dollars in millions)
Assets:
Derivative instruments:
Interest rate swaps ................................................ $ - $ 192 $ - $ 192
Cross currency swaps ........................................... - 72 - 72
Total assets ...................................................... $ - $ 264 $ - $ 264
Liabilities:
Derivative instruments:
Interest rate swaps ................................................ $ - $ 106 $ - $ 106
Cross currency swaps ........................................... - 106 - 106
Total liabilities ................................................ $ - $ 212 $ - $ 212
The valuation techniques of assets and liabilities measured at fair value on a recurring basis are described below:
Derivative Instruments
The Company’s derivatives are transacted in over-the-counter markets and quoted market prices are not readily available. The
Company uses third-party developed valuation models to value derivative instruments. These models estimate fair values using
discounted cash flow modeling techniques, which utilize the contractual terms of the derivative instruments and market-based
inputs, including interest rates and foreign exchange rates. Discount rates incorporate counterparty and HMC specific credit
default spreads to reflect nonperformance risk.
The Company’s derivative instruments are classified as Level 2 since all significant inputs are observable and do not require
management judgment. There were no transfers between fair value hierarchy levels during the fiscal years ended March 31,
2015 and 2014. Refer to notes 1(n) and 5 for additional information on derivative instruments.
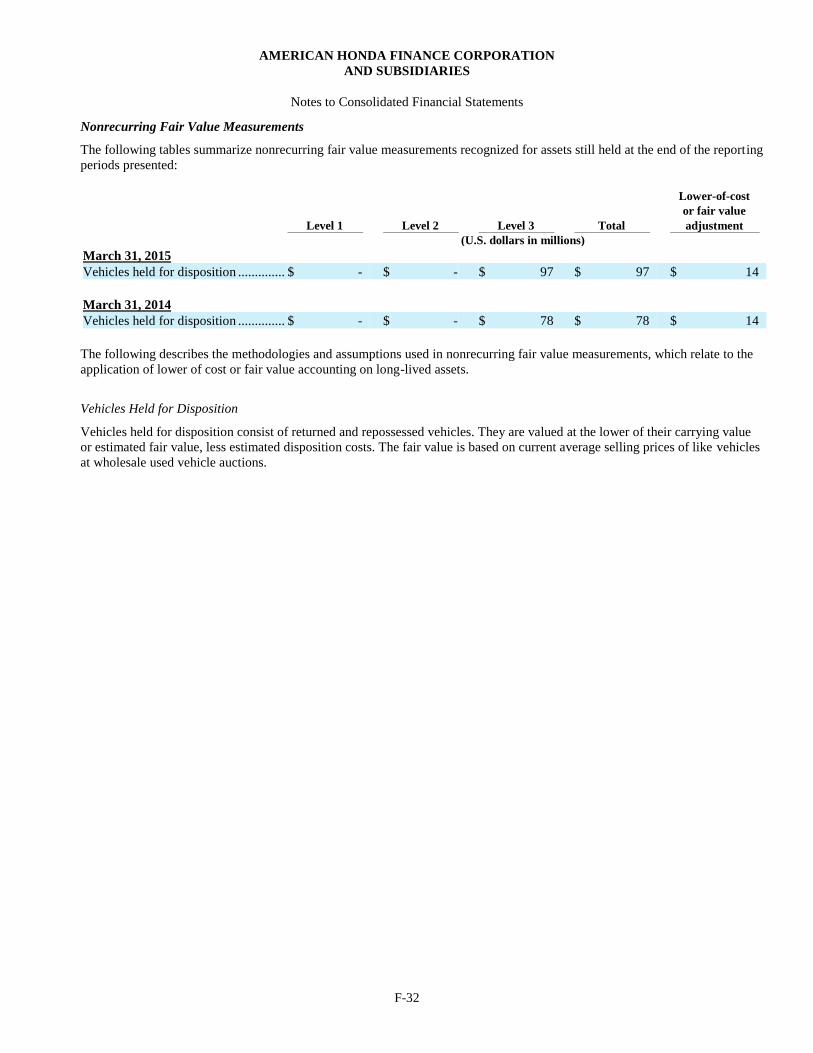
AMERICAN HONDA FINANCE CORPORATION
AND SUBSIDIARIES
Notes to Consolidated Financial Statements
F-32
Nonrecurring Fair Value Measurements
The following tables summarize nonrecurring fair value measurements recognized for assets still held at the end of the reporting
periods presented:
Lower-of-cost
or fair value
Level 1 Level 2 Level 3 Total adjustment
(U.S. dollars in millions)
March 31, 2015
Vehicles held for disposition .............. $ - $ - $ 97 $ 97 $ 14
March 31, 2014
Vehicles held for disposition .............. $ - $ - $ 78 $ 78 $ 14
The following describes the methodologies and assumptions used in nonrecurring fair value measurements, which relate to the
application of lower of cost or fair value accounting on long-lived assets.
Vehicles Held for Disposition
Vehicles held for disposition consist of returned and repossessed vehicles. They are valued at the lower of their carrying value
or estimated fair value, less estimated disposition costs. The fair value is based on current average selling prices of like vehicles
at wholesale used vehicle auctions.
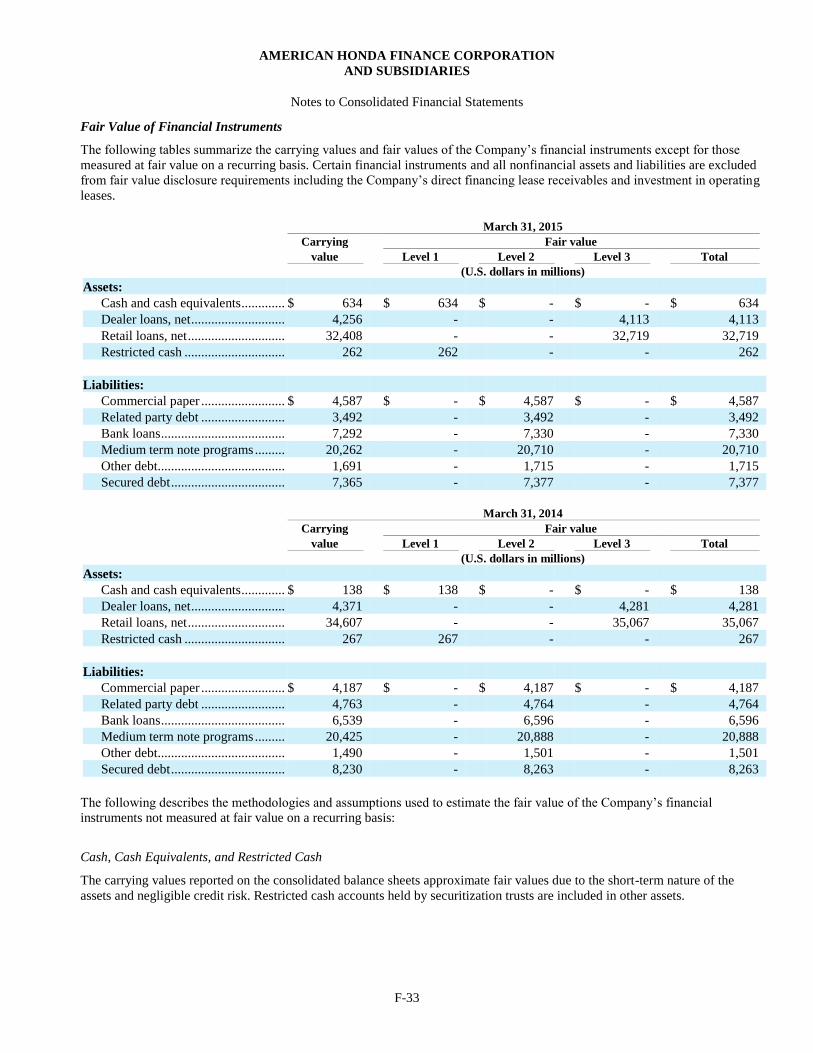
AMERICAN HONDA FINANCE CORPORATION
AND SUBSIDIARIES
Notes to Consolidated Financial Statements
F-33
Fair Value of Financial Instruments
The following tables summarize the carrying values and fair values of the Company’s financial instruments except for those
measured at fair value on a recurring basis. Certain financial instruments and all nonfinancial assets and liabilities are excluded
from fair value disclosure requirements including the Company’s direct financing lease receivables and investment in operating
leases.
March 31, 2015
Carrying Fair value
value Level 1 Level 2 Level 3 Total
(U.S. dollars in millions)
Assets:
Cash and cash equivalents ............. $ 634 $ 634 $ - $ - $ 634
Dealer loans, net ............................ 4,256 - - 4,113 4,113
Retail loans, net ............................. 32,408 - - 32,719 32,719
Restricted cash .............................. 262 262 - - 262
Liabilities:
Commercial paper ......................... $ 4,587 $ - $ 4,587 $ - $ 4,587
Related party debt ......................... 3,492 - 3,492 - 3,492
Bank loans ..................................... 7,292 - 7,330 - 7,330
Medium term note programs ......... 20,262 - 20,710 - 20,710
Other debt...................................... 1,691 - 1,715 - 1,715
Secured debt .................................. 7,365 - 7,377 - 7,377
March 31, 2014
Carrying Fair value
value Level 1 Level 2 Level 3 Total
(U.S. dollars in millions)
Assets:
Cash and cash equivalents ............. $ 138 $ 138 $ - $ - $ 138
Dealer loans, net ............................ 4,371 - - 4,281 4,281
Retail loans, net ............................. 34,607 - - 35,067 35,067
Restricted cash .............................. 267 267 - - 267
Liabilities:
Commercial paper ......................... $ 4,187 $ - $ 4,187 $ - $ 4,187
Related party debt ......................... 4,763 - 4,764 - 4,764
Bank loans ..................................... 6,539 - 6,596 - 6,596
Medium term note programs ......... 20,425 - 20,888 - 20,888
Other debt...................................... 1,490 - 1,501 - 1,501
Secured debt .................................. 8,230 - 8,263 - 8,263
The following describes the methodologies and assumptions used to estimate the fair value of the Company’s financial
instruments not measured at fair value on a recurring basis:
Cash, Cash Equivalents, and Restricted Cash
The carrying values reported on the consolidated balance sheets approximate fair values due to the short-term nature of the
assets and negligible credit risk. Restricted cash accounts held by securitization trusts are included in other assets.
AMERICAN HONDA FINANCE CORPORATION
AND SUBSIDIARIES
Notes to Consolidated Financial Statements
F-34
Finance Receivables
The fair values of the Company’s retail loans and dealer wholesale loans are based on estimated proceeds of hypothetical whole
loan transactions. It is assumed that market participants in whole loan transactions would acquire the loans with the intent of
securitizing the loans. Internally developed valuation models are used to estimate the pricing of securitization transactions,
which is adjusted for the estimated costs of securitization transactions and required profit margins of market participants. The
models incorporate projected cash flows of the underlying receivables, which include prepayment and credit loss assumptions.
The models also incorporate current market interest rates and market spreads for the credit and liquidity risk of securities issued
in the securitizations. The estimated fair values of the Company’s dealer commercial loans are based on a discounted cash flow
model.
Debt
The fair value of the Company’s debt is estimated based on a discounted cash flow analysis. Projected cash flows are discounted
using current market interest rates and credit spreads for debt with similar maturities. The Company’s specific nonperformance
risk is reflected in the credit spreads on the Company’s unsecured debt.
The above fair value estimates are made at a specific point in time, based on relevant market information and information about
the financial instrument. These estimates do not reflect any premium or discount that could result from offering for sale at one
time the Company’s entire holdings of a particular financial instrument. Because no active market exists for a portion of the
Company’s financial instruments, fair value estimates of such financial instruments are based on judgments regarding future
expected loss experience, current economic conditions, risk characteristics, and other factors. These estimates are subjective in
nature and involve uncertainties and matters of significant judgment and, therefore, cannot be determined with precision.
Changes in assumptions could significantly affect the estimates.
Fair value information presented in the tables above is based on information available at March 31, 2015 and 2014. Although
the Company is not aware of any factors that would significantly affect the estimated fair value amounts, such amounts have not
been updated since those dates, and therefore, the current estimates of fair value at dates subsequent to those dates may differ
significantly from the amounts presented herein.
(15) Segment Information
The Company’s reportable segments are based on the two geographic regions where operating results are measured and
evaluated by management: the United States and Canada.
Segment performance is evaluated using an internal measurement basis, which differs from the Company’s consolidated results
prepared in accordance with GAAP. Segment performance is evaluated on a pre-tax basis before the effect of valuation
adjustments on derivative instruments and revaluations of foreign currency denominated debt. Since the Company does not elect
to apply hedge accounting, the impact to earnings resulting from these valuation adjustments as reported under GAAP is not
representative of segment performance as evaluated by management. Realized gains and losses on derivative instruments, net of
realized gains and losses on foreign currency denominated debt, are included in the measure of net revenues when evaluating
segment performance.
No adjustments are made to segment performance to allocate any revenues or expenses. Financing products offered throughout
the United States and Canada are substantially similar. Segment revenues from the various financing products are reported on
the same basis as GAAP consolidated results.
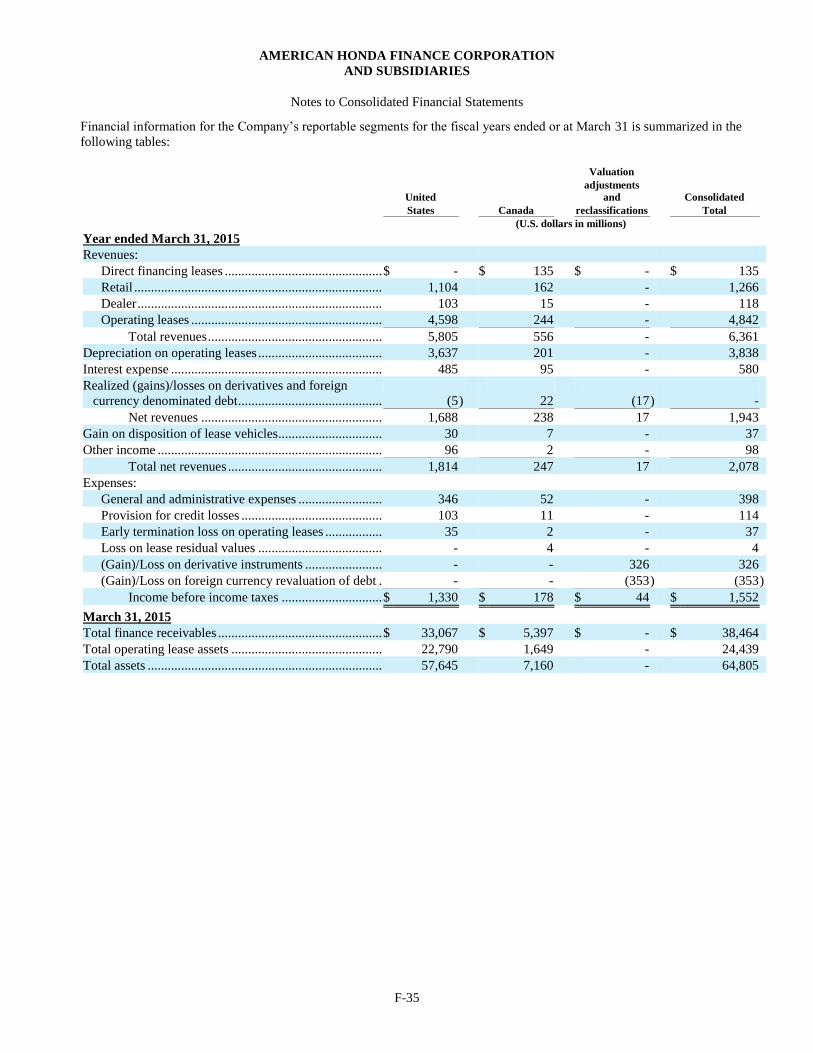
AMERICAN HONDA FINANCE CORPORATION
AND SUBSIDIARIES
Notes to Consolidated Financial Statements
F-35
Financial information for the Company’s reportable segments for the fiscal years ended or at March 31 is summarized in the
following tables:
Valuation
United
adjustments
and Consolidated
States Canada reclassifications Total
(U.S. dollars in millions)
Year ended March 31, 2015
Revenues:
Direct financing leases ............................................... $ - $ 135 $ - $ 135
Retail .......................................................................... 1,104 162 - 1,266
Dealer ......................................................................... 103 15 - 118
Operating leases ......................................................... 4,598 244 - 4,842
Total revenues .................................................... 5,805 556 - 6,361
Depreciation on operating leases ..................................... 3,637 201 - 3,838
Interest expense ............................................................... 485 95 - 580
Realized (gains)/losses on derivatives and foreign
currency denominated debt ........................................... (5 ) 22 (17 ) -
Net revenues ...................................................... 1,688 238 17 1,943
Gain on disposition of lease vehicles............................... 30 7 - 37
Other income ................................................................... 96 2 - 98
Total net revenues .............................................. 1,814 247 17 2,078
Expenses:
General and administrative expenses ......................... 346 52 - 398
Provision for credit losses .......................................... 103 11 - 114
Early termination loss on operating leases ................. 35 2 - 37
Loss on lease residual values ..................................... - 4 - 4
(Gain)/Loss on derivative instruments ....................... - - 326 326
(Gain)/Loss on foreign currency revaluation of debt . - - (353 ) (353 )
Income before income taxes .............................. $ 1,330 $ 178 $ 44 $ 1,552
March 31, 2015
Total finance receivables ................................................. $ 33,067 $ 5,397 $ - $ 38,464
Total operating lease assets ............................................. 22,790 1,649 - 24,439
Total assets ...................................................................... 57,645 7,160 - 64,805
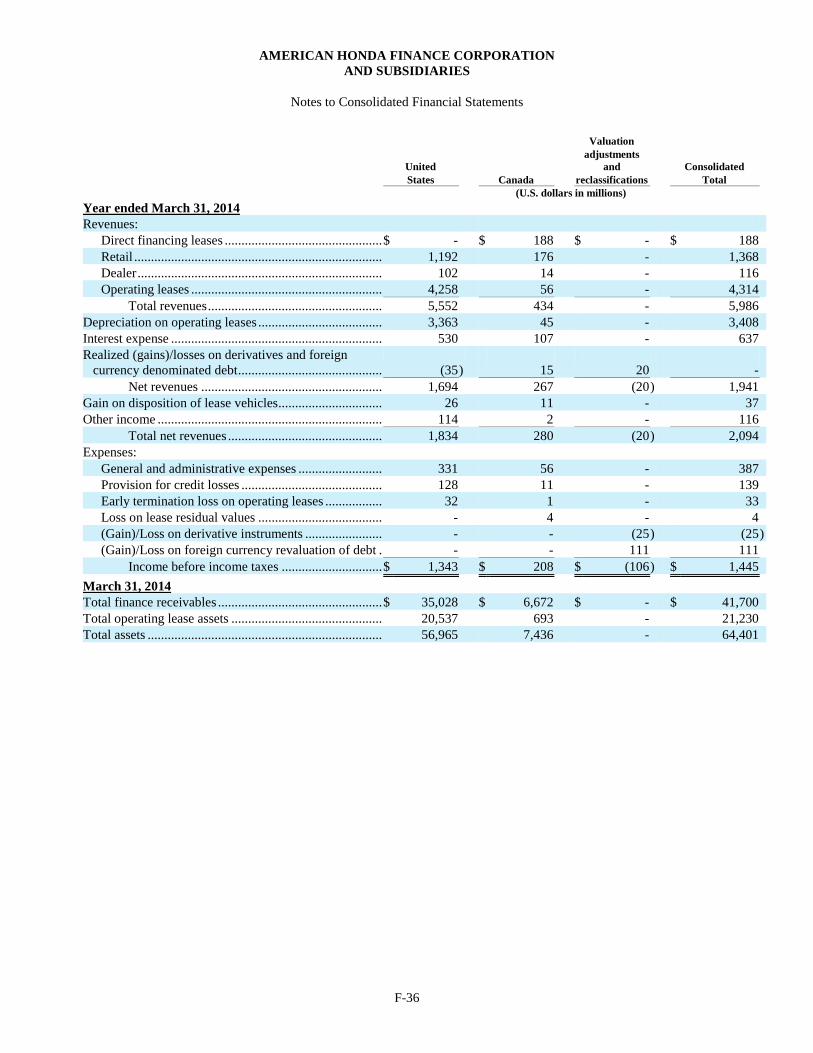
AMERICAN HONDA FINANCE CORPORATION
AND SUBSIDIARIES
Notes to Consolidated Financial Statements
F-36
Valuation
United
adjustments
and Consolidated
States Canada reclassifications Total
(U.S. dollars in millions)
Year ended March 31, 2014
Revenues:
Direct financing leases ............................................... $ - $ 188 $ - $ 188
Retail .......................................................................... 1,192 176 - 1,368
Dealer ......................................................................... 102 14 - 116
Operating leases ......................................................... 4,258 56 - 4,314
Total revenues .................................................... 5,552 434 - 5,986
Depreciation on operating leases ..................................... 3,363 45 - 3,408
Interest expense ............................................................... 530 107 - 637
Realized (gains)/losses on derivatives and foreign
currency denominated debt ........................................... (35 ) 15 20 -
Net revenues ...................................................... 1,694 267 (20 ) 1,941
Gain on disposition of lease vehicles............................... 26 11 - 37
Other income ................................................................... 114 2 - 116
Total net revenues .............................................. 1,834 280 (20 ) 2,094
Expenses:
General and administrative expenses ......................... 331 56 - 387
Provision for credit losses .......................................... 128 11 - 139
Early termination loss on operating leases ................. 32 1 - 33
Loss on lease residual values ..................................... - 4 - 4
(Gain)/Loss on derivative instruments ....................... - - (25 ) (25 )
(Gain)/Loss on foreign currency revaluation of debt . - - 111 111
Income before income taxes .............................. $ 1,343 $ 208 $ (106 ) $ 1,445
March 31, 2014
Total finance receivables ................................................. $ 35,028 $ 6,672 $ - $ 41,700
Total operating lease assets ............................................. 20,537 693 - 21,230
Total assets ...................................................................... 56,965 7,436 - 64,401
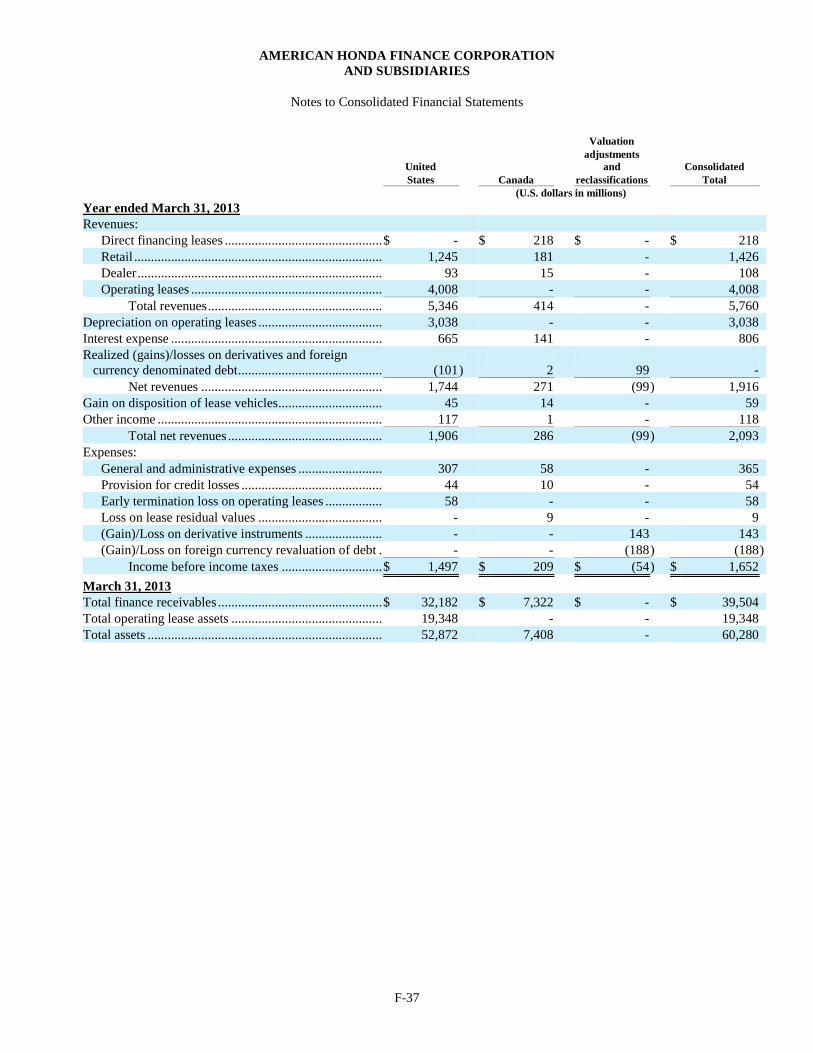
AMERICAN HONDA FINANCE CORPORATION
AND SUBSIDIARIES
Notes to Consolidated Financial Statements
F-37
Valuation
United
adjustments
and Consolidated
States Canada reclassifications Total
(U.S. dollars in millions)
Year ended March 31, 2013
Revenues:
Direct financing leases ............................................... $ - $ 218 $ - $ 218
Retail .......................................................................... 1,245 181 - 1,426
Dealer ......................................................................... 93 15 - 108
Operating leases ......................................................... 4,008 - - 4,008
Total revenues .................................................... 5,346 414 - 5,760
Depreciation on operating leases ..................................... 3,038 - - 3,038
Interest expense ............................................................... 665 141 - 806
Realized (gains)/losses on derivatives and foreign
currency denominated debt ........................................... (101 ) 2 99 -
Net revenues ...................................................... 1,744 271 (99 ) 1,916
Gain on disposition of lease vehicles............................... 45 14 - 59
Other income ................................................................... 117 1 - 118
Total net revenues .............................................. 1,906 286 (99 ) 2,093
Expenses:
General and administrative expenses ......................... 307 58 - 365
Provision for credit losses .......................................... 44 10 - 54
Early termination loss on operating leases ................. 58 - - 58
Loss on lease residual values ..................................... - 9 - 9
(Gain)/Loss on derivative instruments ....................... - - 143 143
(Gain)/Loss on foreign currency revaluation of debt . - - (188 ) (188 )
Income before income taxes .............................. $ 1,497 $ 209 $ (54 ) $ 1,652
March 31, 2013
Total finance receivables ................................................. $ 32,182 $ 7,322 $ - $ 39,504
Total operating lease assets ............................................. 19,348 - - 19,348
Total assets ...................................................................... 52,872 7,408 - 60,280
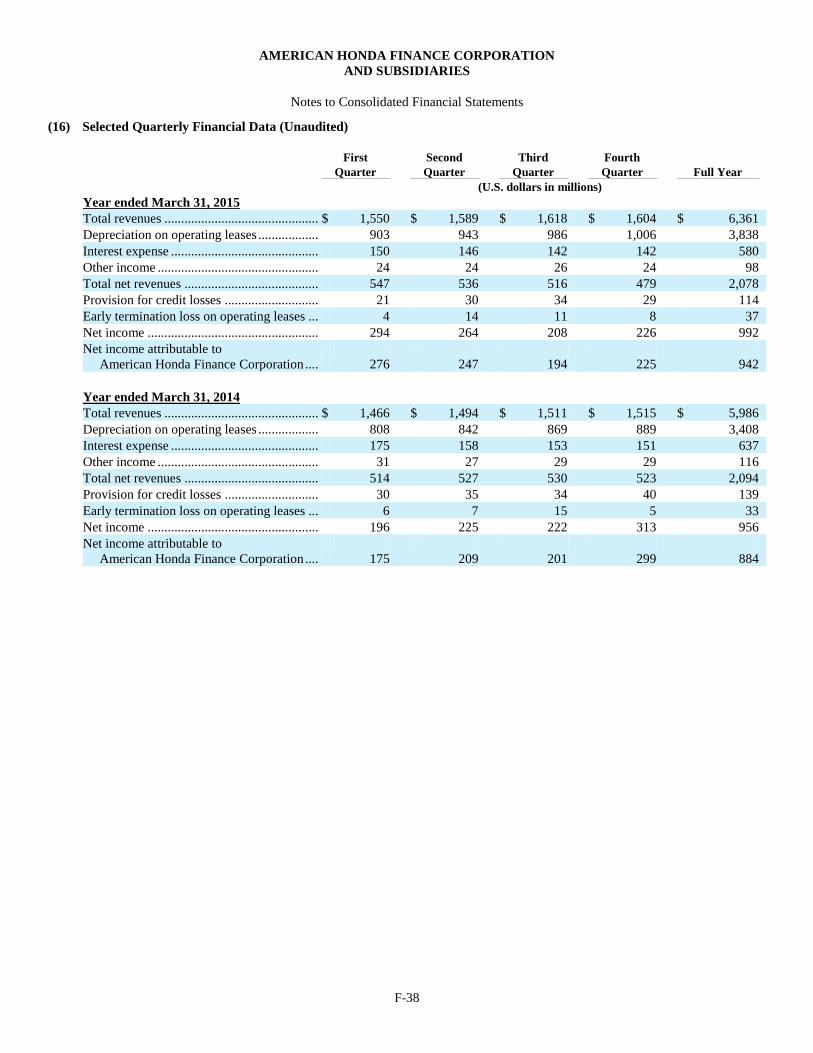
AMERICAN HONDA FINANCE CORPORATION
AND SUBSIDIARIES
Notes to Consolidated Financial Statements
F-38
(16) Selected Quarterly Financial Data (Unaudited)
First Second Third Fourth
Quarter Quarter Quarter Quarter Full Year
(U.S. dollars in millions)
Year ended March 31, 2015
Total revenues .............................................. $ 1,550 $ 1,589 $ 1,618 $ 1,604 $ 6,361
Depreciation on operating leases .................. 903 943 986 1,006 3,838
Interest expense ............................................ 150 146 142 142 580
Other income ................................................ 24 24 26 24 98
Total net revenues ........................................ 547 536 516 479 2,078
Provision for credit losses ............................ 21 30 34 29 114
Early termination loss on operating leases ... 4 14 11 8 37
Net income ................................................... 294 264 208 226 992
Net income attributable to
American Honda Finance Corporation .... 276 247 194 225 942
Year ended March 31, 2014
Total revenues .............................................. $ 1,466 $ 1,494 $ 1,511 $ 1,515 $ 5,986
Depreciation on operating leases .................. 808 842 869 889 3,408
Interest expense ............................................ 175 158 153 151 637
Other income ................................................ 31 27 29 29 116
Total net revenues ........................................ 514 527 530 523 2,094
Provision for credit losses ............................ 30 35 34 40 139
Early termination loss on operating leases ... 6 7 15 5 33
Net income ................................................... 196 225 222 313 956
Net income attributable to
American Honda Finance Corporation .... 175 209 201 299 884
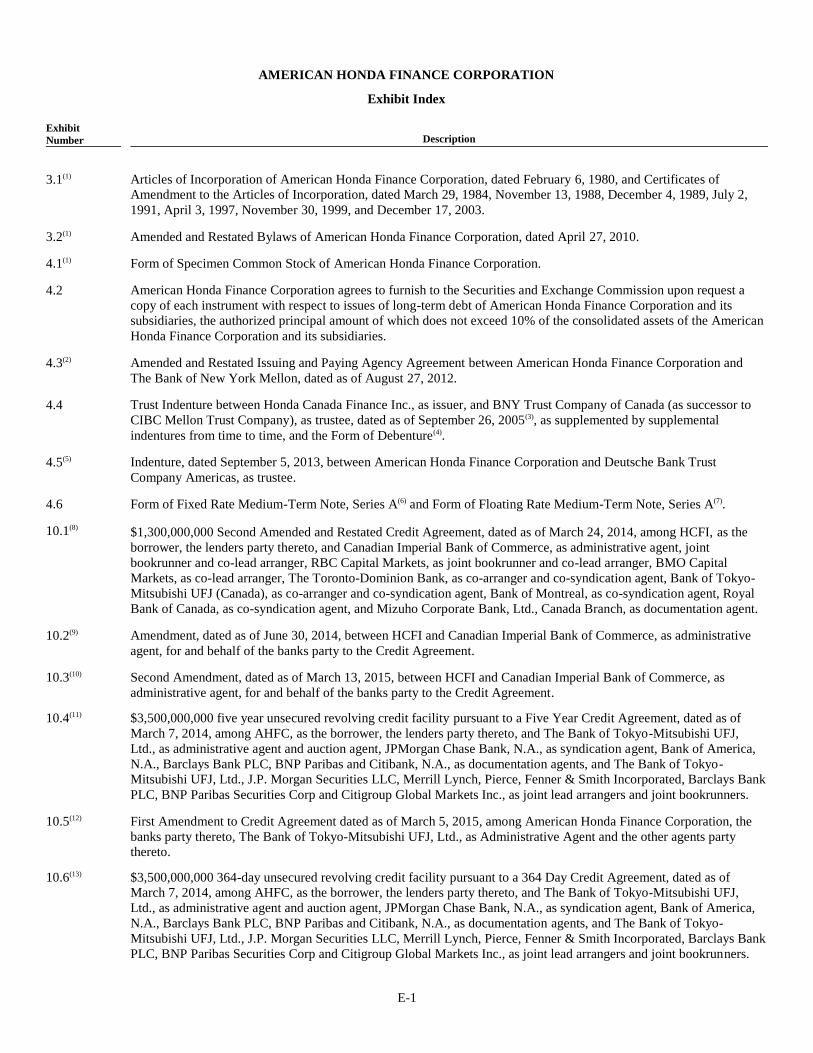
E-1
AMERICAN HONDA FINANCE CORPORATION
Exhibit Index
Exhibit
Number Description
3.1(1)
Articles of Incorporation of American Honda Finance Corporation, dated February 6, 1980, and Certificates of
Amendment to the Articles of Incorporation, dated March 29, 1984, November 13, 1988, December 4, 1989, July 2,
1991, April 3, 1997, November 30, 1999, and December 17, 2003.
3.2(1)
Amended and Restated Bylaws of American Honda Finance Corporation, dated April 27, 2010.
4.1(1)
Form of Specimen Common Stock of American Honda Finance Corporation.
4.2
American Honda Finance Corporation agrees to furnish to the Securities and Exchange Commission upon request a
copy of each instrument with respect to issues of long-term debt of American Honda Finance Corporation and its
subsidiaries, the authorized principal amount of which does not exceed 10% of the consolidated assets of the American
Honda Finance Corporation and its subsidiaries.
4.3(2)
Amended and Restated Issuing and Paying Agency Agreement between American Honda Finance Corporation and
The Bank of New York Mellon, dated as of August 27, 2012.
4.4
Trust Indenture between Honda Canada Finance Inc., as issuer, and BNY Trust Company of Canada (as successor to
CIBC Mellon Trust Company), as trustee, dated as of September 26, 2005(3), as supplemented by supplemental
indentures from time to time, and the Form of Debenture(4).
4.5(5)
Indenture, dated September 5, 2013, between American Honda Finance Corporation and Deutsche Bank Trust
Company Americas, as trustee.
4.6
Form of Fixed Rate Medium-Term Note, Series A(6) and Form of Floating Rate Medium-Term Note, Series A(7).
10.1(8)
$1,300,000,000 Second Amended and Restated Credit Agreement, dated as of March 24, 2014, among HCFI, as the
borrower, the lenders party thereto, and Canadian Imperial Bank of Commerce, as administrative agent, joint
bookrunner and co-lead arranger, RBC Capital Markets, as joint bookrunner and co-lead arranger, BMO Capital
Markets, as co-lead arranger, The Toronto-Dominion Bank, as co-arranger and co-syndication agent, Bank of Tokyo-
Mitsubishi UFJ (Canada), as co-arranger and co-syndication agent, Bank of Montreal, as co-syndication agent, Royal
Bank of Canada, as co-syndication agent, and Mizuho Corporate Bank, Ltd., Canada Branch, as documentation agent.
10.2(9)
Amendment, dated as of June 30, 2014, between HCFI and Canadian Imperial Bank of Commerce, as administrative
agent, for and behalf of the banks party to the Credit Agreement.
10.3(10)
Second Amendment, dated as of March 13, 2015, between HCFI and Canadian Imperial Bank of Commerce, as
administrative agent, for and behalf of the banks party to the Credit Agreement.
10.4(11)
$3,500,000,000 five year unsecured revolving credit facility pursuant to a Five Year Credit Agreement, dated as of
March 7, 2014, among AHFC, as the borrower, the lenders party thereto, and The Bank of Tokyo-Mitsubishi UFJ,
Ltd., as administrative agent and auction agent, JPMorgan Chase Bank, N.A., as syndication agent, Bank of America,
N.A., Barclays Bank PLC, BNP Paribas and Citibank, N.A., as documentation agents, and The Bank of Tokyo-
Mitsubishi UFJ, Ltd., J.P. Morgan Securities LLC, Merrill Lynch, Pierce, Fenner & Smith Incorporated, Barclays Bank
PLC, BNP Paribas Securities Corp and Citigroup Global Markets Inc., as joint lead arrangers and joint bookrunners.
10.5(12)
First Amendment to Credit Agreement dated as of March 5, 2015, among American Honda Finance Corporation, the
banks party thereto, The Bank of Tokyo-Mitsubishi UFJ, Ltd., as Administrative Agent and the other agents party
thereto.
10.6(13)
$3,500,000,000 364-day unsecured revolving credit facility pursuant to a 364 Day Credit Agreement, dated as of
March 7, 2014, among AHFC, as the borrower, the lenders party thereto, and The Bank of Tokyo-Mitsubishi UFJ,
Ltd., as administrative agent and auction agent, JPMorgan Chase Bank, N.A., as syndication agent, Bank of America,
N.A., Barclays Bank PLC, BNP Paribas and Citibank, N.A., as documentation agents, and The Bank of Tokyo-
Mitsubishi UFJ, Ltd., J.P. Morgan Securities LLC, Merrill Lynch, Pierce, Fenner & Smith Incorporated, Barclays Bank
PLC, BNP Paribas Securities Corp and Citigroup Global Markets Inc., as joint lead arrangers and joint bookrunners.
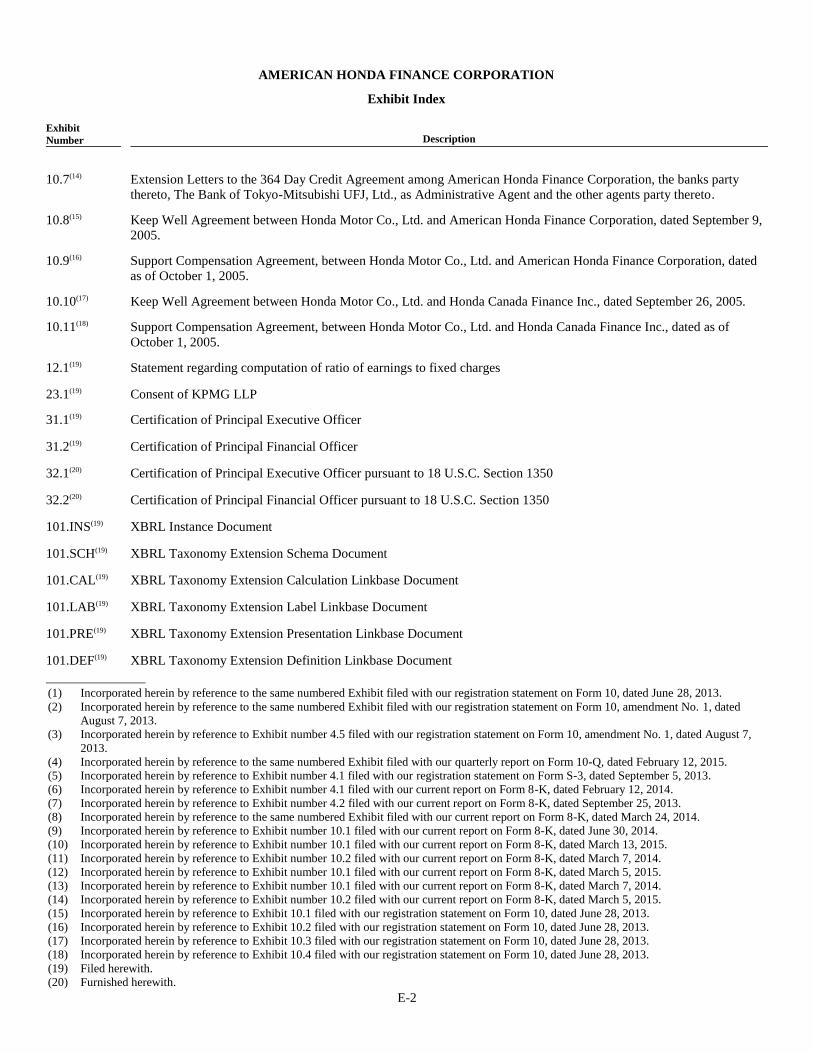
E-2
AMERICAN HONDA FINANCE CORPORATION
Exhibit Index
Exhibit
Number Description
10.7(14)
Extension Letters to the 364 Day Credit Agreement among American Honda Finance Corporation, the banks party
thereto, The Bank of Tokyo-Mitsubishi UFJ, Ltd., as Administrative Agent and the other agents party thereto.
10.8(15)
Keep Well Agreement between Honda Motor Co., Ltd. and American Honda Finance Corporation, dated September 9,
2005.
10.9(16)
Support Compensation Agreement, between Honda Motor Co., Ltd. and American Honda Finance Corporation, dated
as of October 1, 2005.
10.10(17)
Keep Well Agreement between Honda Motor Co., Ltd. and Honda Canada Finance Inc., dated September 26, 2005.
10.11(18)
Support Compensation Agreement, between Honda Motor Co., Ltd. and Honda Canada Finance Inc., dated as of
October 1, 2005.
12.1(19)
Statement regarding computation of ratio of earnings to fixed charges
23.1(19)
Consent of KPMG LLP
31.1(19)
Certification of Principal Executive Officer
31.2(19)
Certification of Principal Financial Officer
32.1(20)
Certification of Principal Executive Officer pursuant to 18 U.S.C. Section 1350
32.2(20)
Certification of Principal Financial Officer pursuant to 18 U.S.C. Section 1350
101.INS(19)
XBRL Instance Document
101.SCH(19)
XBRL Taxonomy Extension Schema Document
101.CAL(19)
XBRL Taxonomy Extension Calculation Linkbase Document
101.LAB(19)
XBRL Taxonomy Extension Label Linkbase Document
101.PRE(19)
XBRL Taxonomy Extension Presentation Linkbase Document
101.DEF(19)
XBRL Taxonomy Extension Definition Linkbase Document
(1) Incorporated herein by reference to the same numbered Exhibit filed with our registration statement on Form 10, dated June 28, 2013.
(2) Incorporated herein by reference to the same numbered Exhibit filed with our registration statement on Form 10, amendment No. 1, dated
August 7, 2013.
(3) Incorporated herein by reference to Exhibit number 4.5 filed with our registration statement on Form 10, amendment No. 1, dated August 7,
2013.
(4) Incorporated herein by reference to the same numbered Exhibit filed with our quarterly report on Form 10-Q, dated February 12, 2015.
(5) Incorporated herein by reference to Exhibit number 4.1 filed with our registration statement on Form S-3, dated September 5, 2013.
(6) Incorporated herein by reference to Exhibit number 4.1 filed with our current report on Form 8-K, dated February 12, 2014.
(7) Incorporated herein by reference to Exhibit number 4.2 filed with our current report on Form 8-K, dated September 25, 2013.
(8) Incorporated herein by reference to the same numbered Exhibit filed with our current report on Form 8-K, dated March 24, 2014.
(9) Incorporated herein by reference to Exhibit number 10.1 filed with our current report on Form 8-K, dated June 30, 2014.
(10) Incorporated herein by reference to Exhibit number 10.1 filed with our current report on Form 8-K, dated March 13, 2015.
(11) Incorporated herein by reference to Exhibit number 10.2 filed with our current report on Form 8-K, dated March 7, 2014.
(12) Incorporated herein by reference to Exhibit number 10.1 filed with our current report on Form 8-K, dated March 5, 2015.
(13) Incorporated herein by reference to Exhibit number 10.1 filed with our current report on Form 8-K, dated March 7, 2014.
(14) Incorporated herein by reference to Exhibit number 10.2 filed with our current report on Form 8-K, dated March 5, 2015.
(15) Incorporated herein by reference to Exhibit 10.1 filed with our registration statement on Form 10, dated June 28, 2013.
(16) Incorporated herein by reference to Exhibit 10.2 filed with our registration statement on Form 10, dated June 28, 2013.
(17) Incorporated herein by reference to Exhibit 10.3 filed with our registration statement on Form 10, dated June 28, 2013.
(18) Incorporated herein by reference to Exhibit 10.4 filed with our registration statement on Form 10, dated June 28, 2013.
(19) Filed herewith.
(20) Furnished herewith.
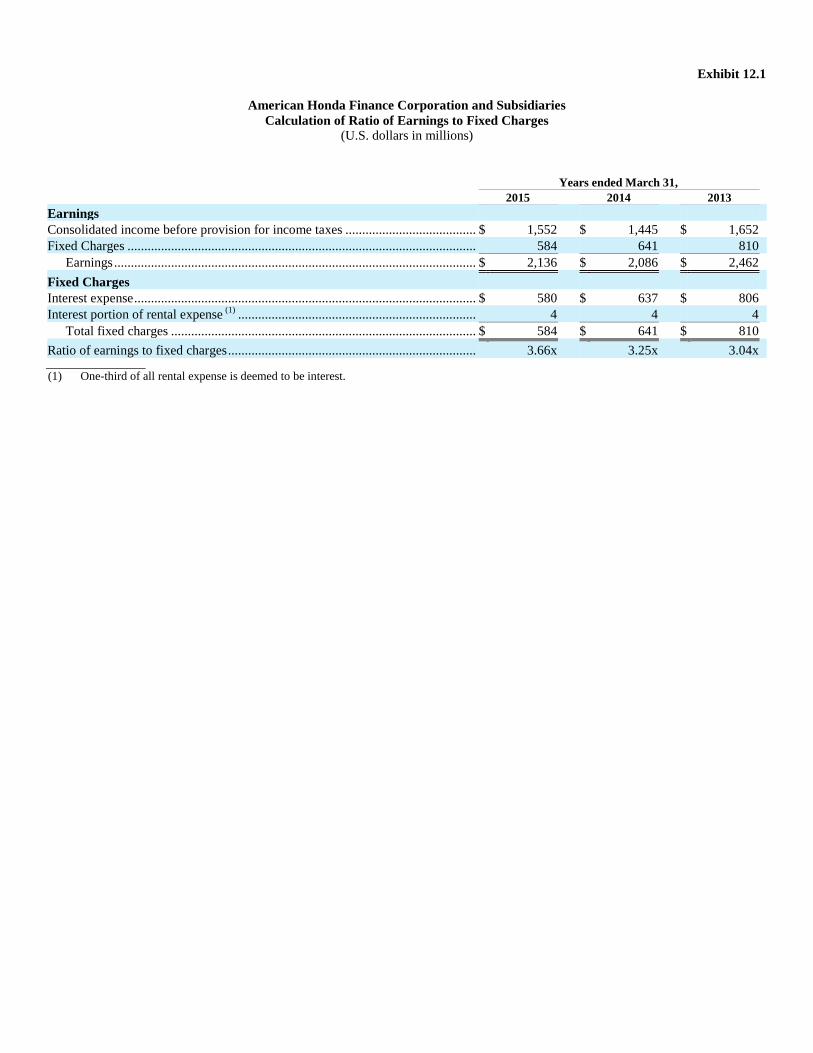
Exhibit 12.1
American Honda Finance Corporation and Subsidiaries
Calculation of Ratio of Earnings to Fixed Charges (U.S. dollars in millions)
Years ended March 31,
2015 2014 2013
Earnings
Consolidated income before provision for income taxes ....................................... $ 1,552 $ 1,445 $ 1,652
Fixed Charges ........................................................................................................ 584 641 810
Earnings ............................................................................................................ $ 2,136 $ 2,086 $ 2,462
Fixed Charges
Interest expense ...................................................................................................... $ 580 $ 637 $ 806
Interest portion of rental expense (1)
....................................................................... 4 4 4
Total fixed charges ........................................................................................... $ 584 $ 641 $ 810
Ratio of earnings to fixed charges .......................................................................... 3.66x 3.25x 3.04x
(1) One-third of all rental expense is deemed to be interest.
Exhibit 23.1
Consent of Independent Registered Public Accounting Firm
We consent to the incorporation by reference in the registration statement (No. 333-191021) on Form S-3 of American Honda Finance
Corporation (the Company) of our report dated June 26, 2015, with respect to the consolidated balance sheets of the Company as of
March 31, 2015 and 2014, and the related consolidated statements of income, comprehensive income, changes in equity, and cash
flows for each of the years in the three-year period ended March 31, 2015, which report appears in the March 31, 2015 annual report
on Form 10-K of the Company.
/s/ KPMG LLP
Los Angeles, California
June 26, 2015
Exhibit 31.1
CERTIFICATION PURSUANT TO
SECTION 302 OF THE SARBANES-OXLEY ACT OF 2002
I, Hideo Moroe, certify that:
1. I have reviewed this Annual Report on Form 10-K for the year ended March 31, 2015 of American Honda Finance Corporation;
2. Based on my knowledge, this report does not contain any untrue statement of a material fact or omit to state a material fact
necessary to make the statements made, in light of the circumstances under which such statements were made, not misleading
with respect to the period covered by this report;
3. Based on my knowledge, the financial statements, and other financial information included in this report, fairly present in all
material respects the financial condition, results of operations and cash flows of the registrant as of, and for, the periods presented
in this report;
4. The registrant’s other certifying officer(s) and I are responsible for establishing and maintaining disclosure controls and
procedures (as defined in Exchange Act Rules 13a-15(e) and 15d-15(e)) and internal control over financial reporting (as defined
in Exchange Act Rules 13a-15(f) and 15d-15(f)) for the registrant and have:
(a) Designed such disclosure controls and procedures, or caused such disclosure controls and procedures to be designed under
our supervision, to ensure that material information relating to the registrant, including its consolidated subsidiaries, is made
known to us by others within those entities, particularly during the period in which this report is being prepared;
(b) Designed such internal control over financial reporting, or caused such internal control over financial reporting to be
designed under our supervision, to provide reasonable assurance regarding the reliability of financial reporting and the
preparation of financial statements for external purposes in accordance with generally accepted accounting principles;
(c) Evaluated the effectiveness of the registrant’s disclosure controls and procedures and presented in this report our
conclusions about the effectiveness of the disclosure controls and procedures, as of the end of the period covered by this
report based on such evaluation; and
(d) Disclosed in this report any change in the registrant’s internal control over financial reporting that occurred during the
registrant’s most recent fiscal quarter (the registrant’s fourth fiscal quarter in the case of an annual report) that has materially
affected, or is reasonably likely to materially affect, the registrant’s internal control over financial reporting; and
5. The registrant’s other certifying officer(s) and I have disclosed, based on our most recent evaluation of internal control over
financial reporting, to the registrant’s auditors and the audit committee of the registrant’s board of directors (or persons
performing the equivalent functions):
(a) All significant deficiencies and material weaknesses in the design or operation of internal control over financial reporting
which are reasonably likely to adversely affect the registrant’s ability to record, process, summarize and report financial
information; and
(b) Any fraud, whether or not material, that involves management or other employees who have a significant role in the
registrant’s internal control over financial reporting.
Dated: June 26, 2015
By: /s/ Hideo Moroe
Hideo Moroe
President
(Principal Executive Officer)
Exhibit 31.2
CERTIFICATION PURSUANT TO
SECTION 302 OF THE SARBANES-OXLEY ACT OF 2002
I, Shinji Kubaru, certify that:
1. I have reviewed this Annual Report on Form 10-K for the year ended March 31, 2015 of American Honda Finance Corporation;
2. Based on my knowledge, this report does not contain any untrue statement of a material fact or omit to state a material fact
necessary to make the statements made, in light of the circumstances under which such statements were made, not misleading
with respect to the period covered by this report;
3. Based on my knowledge, the financial statements, and other financial information included in this report, fairly present in all
material respects the financial condition, results of operations and cash flows of the registrant as of, and for, the periods
presented in this report;
4. The registrant’s other certifying officer(s) and I are responsible for establishing and maintaining disclosure controls and
procedures (as defined in Exchange Act Rules 13a-15(e) and 15d-15(e)) and internal control over financial reporting (as defined
in Exchange Act Rules 13a-15(f) and 15d-15(f)) for the registrant and have:
(a) Designed such disclosure controls and procedures, or caused such disclosure controls and procedures to be designed under
our supervision, to ensure that material information relating to the registrant, including its consolidated subsidiaries, is
made known to us by others within those entities, particularly during the period in which this report is being prepared;
(b) Designed such internal control over financial reporting, or caused such internal control over financial reporting to be
designed under our supervision, to provide reasonable assurance regarding the reliability of financial reporting and the
preparation of financial statements for external purposes in accordance with generally accepted accounting principles;
(c) Evaluated the effectiveness of the registrant’s disclosure controls and procedures and presented in this report our
conclusions about the effectiveness of the disclosure controls and procedures, as of the end of the period covered by this
report based on such evaluation; and
(d) Disclosed in this report any change in the registrant’s internal control over financial reporting that occurred during the
registrant’s most recent fiscal quarter (the registrant’s fourth fiscal quarter in the case of an annual report) that has
materially affected, or is reasonably likely to materially affect, the registrant’s internal control over financial reporting; and
5. The registrant’s other certifying officer(s) and I have disclosed, based on our most recent evaluation of internal control over
financial reporting, to the registrant’s auditors and the audit committee of the registrant’s board of directors (or persons
performing the equivalent functions):
(a) All significant deficiencies and material weaknesses in the design or operation of internal control over financial reporting
which are reasonably likely to adversely affect the registrant’s ability to record, process, summarize and report financial
information; and
(b) Any fraud, whether or not material, that involves management or other employees who have a significant role in the
registrant’s internal control over financial reporting.
Dated: June 26, 2015
By: /s/ Shinji Kubaru
Shinji Kubaru
Vice President and Treasurer
(Principal Financial Officer)

Exhibit 32.1
CERTIFICATION PURSUANT TO
18 U.S.C. SECTION 1350,
AS ADOPTED PURSUANT TO
SECTION 906 OF THE SARBANES-OXLEY ACT OF 2002*
In connection with the Annual Report of American Honda Finance Corporation (the “Company”) on Form 10-K for the year ended
March 31, 2015 as filed with the Securities and Exchange Commission on the date hereof (the “Report”), I, Hideo Moroe, President
and Principal Executive Officer of the Company, certify, pursuant to Section 1350 of Chapter 63 of Title 18 of the United States Code,
as adopted pursuant to § 906 of the Sarbanes-Oxley Act of 2002, that to the best of my knowledge:
1. The Report fully complies with the requirements of section 13(a) or 15(d) of the Securities Exchange Act of 1934; and
2. The information contained in the Report fairly presents, in all material respects, the financial condition and results of
operations of the Company.
Dated: June 26, 2015
By: /s/ Hideo Moroe
Hideo Moroe
President
(Principal Executive Officer)
*A signed original of this written statement required by Section 906 has been provided to American Honda Finance Corporation and
will be retained by American Honda Finance Corporation and furnished to the Securities and Exchange Commission or its staff upon
request.
Exhibit 32.2
CERTIFICATION PURSUANT TO
18 U.S.C. SECTION 1350,
AS ADOPTED PURSUANT TO
SECTION 906 OF THE SARBANES-OXLEY ACT OF 2002*
In connection with the Annual Report of American Honda Finance Corporation (the “Company”) on Form 10-K for the year ended
March 31, 2015 as filed with the Securities and Exchange Commission on the date hereof (the “Report”), I, Shinji Kubaru, Vice
President, Treasurer and Principal Financial Officer of the Company, certify, pursuant to Section 1350 of Chapter 63 of Title 18 of the
United States Code, as adopted pursuant to § 906 of the Sarbanes-Oxley Act of 2002, that to the best of my knowledge:
1. The Report fully complies with the requirements of section 13(a) or 15(d) of the Securities Exchange Act of 1934; and
2. The information contained in the Report fairly presents, in all material respects, the financial condition and results of
operations of the Company.
Dated: June 26, 2015
By: /s/ Shinji Kubaru
Shinji Kubaru
Vice President and Treasurer
(Principal Financial Officer)
*A signed original of this written statement required by Section 906 has been provided to American Honda Finance Corporation and
will be retained by American Honda Finance Corporation and furnished to the Securities and Exchange Commission or its staff upon
request.