Embed Size (px)
Citation preview

American Government and the Promotion of Economic DevelopmentIn the National Era, 1790 to 1860
John Joseph Wallis
University of Maryland
and
NBER
This paper was prepared for the conference on the The Role of Government in U.S. EconomicHistory”, held in honor of Robert Higgs, Tucson, January, 2004.
I apologize for the length of the paper, but nothing extraneous was included accept several extrafigures and perhaps a table or two.

1
When Americans decided for independence in the spring of 1776 they faced many
difficult decisions. They were declaring there independence as independent states. John Adams,
leader of the Congress and later President of the United States, believed the real declaration of
independence was made on May 6, 1776, when Congress asked the individual states to write
their own constitutions.1 But they also declared their independence together, as part of a nation.
Once independence was declared, the balancing act of political genius was creating a national
government strong enough to defend the country from external threats, while keeping the
national government weak enough internally that it did not threaten the independence of the
states. It took a long time to get the balance right. The first national constitution, the Articles of
Confederation, created a national government just barely strong enough to secure independence,
but not strong enough to pay off its debts, deal adequately with international affairs, or referee
disputes between the states. The second constitution adopted in 1787 created a stronger national
government. But that constitution left unsettled so many of the details about sharing power
between national and state governments that internal debate over the proper “constitutional”
powers of the national government brought the nation to the brink of disunity several times and
finally to civil war in 1861. The biggest issue facing American government between 1790 and
1860 was internal, not external. How were Americans to govern themselves? How were power
and policies to be shared between the national and state governments?
The division of responsibility between national and state governments was a source of
constant debate between 1790 and 1860. Some functions of government were divided and some
were shared between the two levels, and any history of government between 1790 and 1860 must
take both levels into account. Our interest in explaining the structure of American government
2
as well as how government consciously or inadvertently promoted economic development. It
begins by tracing in rough outlines the size and structure of government before the Civil War.
After a sketch of the sources of growth in the American economy, it identifies the main policies
of the national and state government, and what each level did to promote economic
development.2
I. Constitutions, the Division of Powers, and the Sharing of Powers:
By 1780, every state but two heeded the call to write new constitutions. Connecticut and
Rhode Island adopted their colonial charters as constitutions by substituting the state for the
King. Every new constitution incorporated the idea of British mixed government – the King, the
Lords, and the Commons – with bicameral legislatures and an independent executive. While all
were democratic republics, the extent of democracy varied (all states had some wealth, property,
or tax paying restrictions on voting and/or office holding), as did the internal relationships
between the legislative bodies themselves and with the executive.3 Over the next fifty years
most states adopted universal white male suffrage, streamlined their legislative machinery, and
clarified the role and structure of the judiciary.4
The Articles of Confederation were proposed in 1777, but not ratified until 1781.
Maryland ratified last, and only when New York agreed to cede its western land claims to the
national government and other states agreed, in principle, to cede their claims as well.5 The
Articles gave the Congress control over international relations and the military, but otherwise did
not create a strong national government. States retained the sole power to levy taxes and the
national government could only request funds from the states.6 While the Articles did not forbid
national taxation, changes to the Articles required the consent of every state and Congress

3
viewed any attempt to impose a national tax as a change in the Articles.7 The unanimity
provision protected each state individually from any national policy they did not like. But the
unanimity clause meant that the new Congress of the United States – the Articles created neither
an executive or judicial branch – was hamstrung from the very beginning.
The inability to levy national taxes meant that Congress was forever short of funds.
Congress began by printing its own currency, but soon “continental dollars” were almost
worthless. The United States was forced to borrow from domestic and international lenders to
fight the revolutionary war. Victory did nothing to alleviate the government’s financial burdens.
The national government defaulted (stopped paying annual interest) on most of its bonds after
the war was over, although it promised to eventually to repay all of its debts. In 1781 and in
1783, Congress passed legislation asking the states to give permission for a national “impost,” a
import tax, but first Rhode Island and then New York refused to give their assent. By 1785, the
national government was bankrupt.8
The inability of the national government to raise revenue crippled its ability to provide
national defense: the reason for its existence. Writing a new constitution giving the national
government sufficient power to raise revenue to provide for external defense threatened internal
liberties (see Robert McGuire’s essay in this volume). How could a national government with
the power to tax be controlled? Article I, section I of the constitution provides that “All
legislative powers herein granted shall be vested in a Congress of the United States,” and Article
I, section II that “Representatives and direct Taxes shall be apportioned among the several States
which may be included in this Union, according to their respective Numbers, which shall be
determined by adding to the whole Number of Free persons, including those bound to Service for
4
a Term of Years, and excluding Indians not taxed, three fifths of all other persons.” Taxation
was equated with representation.
The Constitution is a remarkably short document for all that it accomplishes. It is built
around several checks and limits. First, it divides authority and decision making between the
Legislative (Article I), Executive (Article II), and Judicial branches (Article III). Second, it
enumerates national government powers in Section 8 of Article I and explicitly limits those
powers in Article 1, section 9. The Tenth Amendment, “The powers not delegated to the United
States by the Constitution, nor prohibited by it to the States, are reserved to the States
respectively, or to the people,” in combination with the enumeration of powers places effective
limits on the national government. Article 1, section 10 places explicit prohibitions on specific
state government powers. But states retain an explicit the power to act as an external check on
the national government through the ability of state governments to appoint Senators directly.
What powers are given solely to the national government, which are shared between state
and national governments, and which reside solely with the states?
Powers given to solely to the national government (and conversely prohibited to the
states) include:
- Regulation and conduct of international relations and international trade.
- Provision of national defense and the raising of an Army, although states are allowed tohave militias.
- Power over the minting of coins, the printing of money, and regulation of the currency. States cannot “coin money; emit Bills of Credit; make anything but gold andsilver coins a Tender in Payment of Debts” (Article 1, section 10).
- Regulate the movement of goods between states and internationally. The nationalgovernment has the power to “Regulate Commerce with foreign nations, andamong the several States, and with the Indian tribes.”(article I, section 8) States

5
are enjoined from imposing import or export duties without the consent ofCongress.
National and state governments share the:
- Power to tax. With restrictions on the national governments ability to levy direct taxes(they can only be apportioned by population) and the national prohibition onexport duties.
- Police powers. These are the use of the powers of government to “promote the generalwelfare.”
- All the powers of sovereignty associated with the common law powers of governmentin Britain This is implied rather than stated by the “necessary and proper” clause. So, for example, both national and state governments possessed the power tocreate corporations, without explicitly stating so in the national or stateconstitutions.
Finally, the national government was limited in its ability to
- Suspend the writ of Habeas Corpus, pass writs of attainder or ex post facto laws, passlaws giving preference to the citizens of one state over another, or create titles ofnobility.
- Suspend any of the individual rights guaranteed in the Bill of Rights (the first TenAmendments).
- These protections of individual liberties against government infringement would beextended to state governments under the 14th Amendment.
Given these constitutional mandates and restrictions, what did American governments
actually do?
II. The size and functions of American Government:
No student of Bob Higgs would ever say the size of government is measured simply by
the size of revenues, expenditures, or debt. Nonetheless, basic fiscal measures are a good place
to begin describing what government did between 1790 and 1860 did. Several important
functions of government were not reflected in the budget data and will be discussed later. Table

6
1 presents information on the size of government revenues by level of government for the 19th
and 20th century. The 19th century numbers for local governments are rough estimates that begin
only in 1840. The state numbers are also estimates based on fairly complete counts of state
fiscal activity. The federal numbers are based on Treasury reports and are complete and
accurate. The figures are decade averages (e.g., 1810 is the average of per capita revenues from
1806 to 1815). Per capita revenues are given in current dollars and as a percentage of per capita
income.9
National government finances followed a distinct pattern driven by war finance. Figures
1 and 2 give national government expenditures and revenues annually in nominal dollars per
capita from 1791 to 1936.10 The War of 1812, the Civil War, and World War I stand out in both
figures. The national government paid for wars partly by raising taxes and partly by borrowing
money. Figure 3 shows debt per capita and the deficit or surplus in the national budget. Debt
measures the total amount of debt outstanding, while the deficit/surplus number measures the
change in debt from year to year. These figures are also driven by war finance.
Where did the revenues come from? Figure 4 gives the share of total revenues from
customs, land sales, and internal revenue. Internal revenue in the 19th century was primarily
excise taxes on alcohol and other products, and after 1917 the income tax. There are three
distinct federal revenue structures. The first, from 1790 to 1860 was dominated by customs
revenues; the second, from 1860 to 1912, was a combination of customs revenues and internal
revenues; and the third, post 1919, was dominated by internal revenues, specifically the income
tax. Wars exert their effect on the structure of revenues. In the War of 1812, excise taxes were
increased sharply, only to be eliminated after the war. In the Civil War new excise and income

7
taxes were imposed. The income taxes were removed after the war, but the excise taxes were
not. Just before World War I the income tax was made constitutional and during that war
sharply higher income taxes were collected.
On the expenditure side, Figure 5 gives the share of national expenditures going to the
military and to interest payments on the national debt. As we’ve already discussed in regard to
the constitution, the national government acquired a large debt in the revolution, and interest
payments on the debt dominated national expenditures in the early years of the republic. Until
the 1820s expenditures for the Army, Navy, and interest were usually 80 percent of national
expenditures. During the War of 1812, the national debt increased, but it was quickly paid off.
By 1835 the debt was zero, and interest payments fell accordingly. Up until the Civil War,
defense expenditures average about half of federal expenditures. During the Civil War military
expenditures peaked, and interest payments remained high for several decades after the war as
debt was gradually paid off. The defense share fell to roughly 20 percent of national
expenditures after the Civil War, but then rose again to about 40 percent during the Spanish
American war and World War I.
Looking closely between 1790 and 1860 we see the same pattern: figures 6, 7, and 8
show national expenditures, revenues, and debts respectively. After 1790, the national
government paid off the revolutionary war debt by running persistent budget surpluses and using
the surpluses to retire debt.11 The lion’s share of revenues came from custom receipts. Between
1791 and 1860, the national government raised $1,805,917,000 in revenues. Customs revenue of
$1,535,572,000 account for 85 percent of the total. Excise taxes were unpopular, in 179?
President Washington had to call out federal troops to suppress a protest of the whiskey excise in

8
western Pennsylvania.12 Land sales rarely contributed significantly to federal revenues, except in
years when land sales boomed, like 1835 and 1836. Tariffs ultimately became a divisive
political issue in Congress, but at no time was the national government in a position to remove
tariffs entirely or to raise them to prohibitive levels on most imports. There was no feasible or
popular alternative to import duties in the early 19th century.
Expenditures totaled $1,730,767,000, between 1790 and 1860, of which $897,122,000
(52 percent) was for military defense and $203,711,000 (12 percent) was for interest payments.
The excess of total revenues over total expenditures reflects the repayment of $85,000,000 in
national debt. Of the remaining 36 percent of national expenditures, the largest portions went to
running the government, what is often called general administration: the costs of running the
executive, Congress, and federal courts. There were no large or significant expenditures for any
other functions except the post office. Expenditures on transportation, including roads, rivers
and harbors, and other improvements came to just $54,000,000 between 1790 and 1860, only 3
percent of national expenditures.
Constructing measures of state government revenues and expenditures is more difficult
because states varied widely in the way that they recorded revenues, expenditures, and debts and
rarely kept track of everything they did in one report. The numbers in Table 1 give a rough
measure of the relative size of state and national governments in the early 19th century. The per
capita revenue numbers for state governments are constructed from the states for which Richard
Sylla, John Legler, and I have collected information.
Aggregate averages conceal the wide variety in state taxes and spending. Figure 9
presents average annual per capita revenue from all (non-loan) revenue sources Indiana, New

9
Hampshire, Maryland, and South Carolina as well as per capita federal revenues.13 Collectively,
as in Table 1, state revenues averaged about 20 to 25 percent of national revenues from 1800 to
1830. In the decade between 1835 and 1844, state revenues rose absolutely and as a percentage
of national revenues, from less than $.50 a person to $.88 and to slightly over half of national
revenues, and state revenues continued at a higher level through the 1850s. The rise in state
government activity was caused by a boom in state investments in canals, banks, and railroads in
the 1830s, and will be discussed in more detail in a following section.
There is considerable variation from year to year and from state to state. Figure 10
shows the per capita revenues of each state government in comparison to federal revenues.
Panel 10A shows Maryland, where per capita revenues were between $.30 and $.50 per person
up to the 1830s. In the late 1820s Maryland began borrowing money to invest in the Chesapeake
and Ohio canal. In 1839, the state borrowed $6,000,000 to save the canal. Total state debt
reached $15,000,000 in 1841. In 1842, Maryland defaulted on its state bonds, not resuming
interest payments until 1848. Since the canal never made any money, the state eventually raised
taxes to service its debts. As panel 10A shows, by the mid-1840s, per capita tax revenues were
$2.00 per person, four to six times higher than they had been in the 1820s and early 1830s, and
equal to national taxes in those years.
Indiana and New Hampshire were both small rural states with very small state
governments. Per capita revenues in both states ran about $.10 to $.20 per capita in the 1820s
(the first year we have data for Indiana is 1825). In the mid-1830s, Indiana began construction
on its ambitious canal and railroad network. At a time when the state population was about
500,000 people and the annual state budget about $50,000, the state legislature authorized a bond
10
issue of $10,000,000 in 5 percent bonds. Annual interest payments on the bonds came to $1.00
per person, an ten-fold increase in size of the state government. Indiana thought, of course, that
the canals and railroads would return a profit to the state. When they did not, Indiana, like
Maryland, was forced to default on its bonds for a time, and to raise taxes to service it debts. In
the 1840s and 1850s, per capita revenues in Indiana ranged between $1.50 and $2.00 per capita,
again comparable to federal revenues. In contrast, New Hampshire, which did not borrow
money to invest in canals, railroads, or banks, maintained low and steady revenues for the entire
period up to 1860.
South Carolina presents another picture. The state was an early and active supporter of
canals and banks. South Carolina borrowed in the 1810s to finance investments, and state
revenues were always relatively high, between $.40 and $1.00 per person. South Carolina,
however, did not participate in the 1830s investment boom. Like New Hampshire, per capita
revenues stayed stable for the entire period up to the beginning of the Civil War.
Figure 10 takes the state and national revenues up to 1900 to illustrate a point that jumps
out in each graph. National government revenues increased dramatically during the Civil War,
remained high while the Civil War debt was retired, and never returned to their pre-war levels.
State revenues rose during the war, but were never as high as national revenues. The structure of
American government after the Civil War was dramatically different than it was before the Civil
War.
What did states spend money on and where did they get their revenues from? In 1831,
Hanna’s Financial History of Maryland breaks down expenditures into the following categories:
Category Expenditure Share Expenditure Share1831 1831 1841 1841

11
Executive Department $10,378 5% $15,441 2%Legislative Department $33,871 16% $67,369 8%Judicial Department $36,785 17% $39,102 4%Education $18,750 9% $18,500 2%Charities $16,936 8% $19,987 2%Penitentiary 0% $10,000 1%Negro Colonization 0% $10,583 1%Internal Improvements $21,311 10% $57,732 6%Interest on Funded Debt $20,540 10% $566,322 63%Sinking Fund $500 0% 0%Miscellaneous $56,484 26% $89,456 10%
Total $215,555 $894,492
The year 1831 was typical of Maryland before the canal boom. Total expenditures were
$215,555. The number are representative of the general pattern of expenditures in many states:
40 percent for government administration, 10 percent for education, and 10 percent for charities
(including asylums), in total a bit more than half of all state expenditures. Miscellaneous
expenditures were roughly a quarter, and, of course, the content of these expenditures varied
from year to year.
The main element in which states differed was the amount of expenditures devoted to
“internal improvements” which in the early 19th century meant state expenditures on investments
in or the construction and operation of roads, turnpikes, and canals, or investment in banks.
South Carolina made early investments in transportation and banking. Virginia had a Board of
Public Works in 1816. Pennsylvania was investing in turnpikes in the 1790s.14 The sharp
increase in revenues in Indiana and Maryland in Figure 10 resulted from their needs to finance
large canal investments in the mid-1830s. Hanna’s figure for 1841 show expenditures were
$894,492. Work on the canal had almost ceased, but expenditures on interest alone reached
$566,322. The internal improvement boom of the 1830s was critically important for states, and
we will consider it in more detail in a later section.

12
States differed more widely on the revenue side. Revenues came from four general
sources: property taxes, poll taxes, taxes on businesses, and asset income. Property taxes were
levied on land and other wealth. Property taxes were sometimes levied on a per acre basis, but
more commonly they were levied ad valorem, that is, on the assessed value of the land and other
wealth subject to taxation. Poll taxes were head taxes imposed on voters. Business taxes
encompassed a wide variety of fees, licenses, permits, bonuses for corporate charters, and taxes
on capital. Asset income was income earned directly as dividends on state investments in
corporations, or as tolls on state transportation projects.
Tables 2 and 3 provide information on the importance, or lack of importance, of property
taxation in state revenues. Table 2 looks at eleven states from 1800 to the mid-1820s. The table
shows the increase in state expenditures during the War of 1812, the middle column 1813 to
1817, and the share of expenditures financed by property taxes. The last rows of the table give
simple averages, population weighted averages, and weighted averages excluding Ohio and
Delaware, which were outliers with respect to property taxes. The Ohio case is particularly
interesting, as it is the only “western” state in this table. Ohio became a state in 1803 and
immediately began taxing land. Property taxes initially account for 100 percent of Ohio
revenues. Property taxes in most states rose during the War of 1812, absolutely and as a share of
total revenues, as states were forced to defend themselves from British troops (the federal
government was unable to defend states adequately). States always possessed the ability to tax
land, and in emergencies fell back on property taxation as a revenue source.
States preferred, however, to eliminate the property tax if possible. Table 3 gives per
capita property tax revenues, property tax shares of total revenues, and per capita total non-loan
13
revenues for a selection of states between 1835 to 1841 and 1842 to 1851. The upper panel of
the table lists states that did not depend on the property tax before 1841. Indeed, many states had
eliminated the state property tax (not the local property tax) completely before 1830. These
states were well established eastern states with substantial amounts of business taxes and asset
income. The weighted average property tax share in these states was only 2 percent between
1835 and 1841. States in the second panel were established states in New England that
continued to rely on the property tax, a weighted average property tax share of 58 percent.
States in the third panel are from the west. These were also states that relied heavily on the
property tax, a weighted average of 43 percent of total revenue.
The revenue figures are divided into pre- and post-1842 to demonstrate the effect that the
collapse of the canal boom had on the source of state financing. Maryland, Pennsylvania,
Illinois, Michigan, Indiana, Florida, Mississippi, Louisiana, and Arkansas all defaulted on their
debts in 1841 and 1842. Just as in the War of 1812, states faced a fiscal crisis and fell back on
their property taxes. Property taxes rose from $.03 to $.87 per capita in Maryland, from $.02 to
$.53 in Pennsylvania, from $.01 to $.14 in New York, from $.14 to $.22 in Indiana, $.21 to $.52
in Ohio, and $.23 to $.34 in Indiana. These represented substantial increases in property tax
rates and overall increases in taxation. In each of these states higher taxes were driven by the
need to service debts incurred in the 1830s canal boom.
The distinct regional differences in tables 2 and 3 reflected the ability of eastern states
(with exceptions in New England) to tax businesses and to acquire ownership in private
enterprises. Massachusetts, New York, Pennsylvania, Maryland, Virginia, South Carolina,
Georgia, and Alabama all held significant amount of bank stock at some time before 1830.

14
Massachusetts, Connecticut, and Rhode Island taxed bank capital. The bank capital tax made up
over 50 percent of Massachusetts revenues in the 1830. In the 1820s and 1830s taxes on bank
capital or charter fees were over 25 percent of revenues in Connecticut, Delaware,
Pennsylvania, and North Carolina. Dividends from their bank investments allowed Georgia and
Alabama to eliminate their state property taxes in the 1830s.15 Eastern states also levied an array
of taxes on corporate capital, business licenses, and fees of all types.
Western states simply didn’t have the businesses to tax and were forced to rely on
property and poll taxes. Indiana’s 1835 revenues of $50,000 came half from poll taxes and half
from property taxes. Western states had land and people, and that is what they taxed.
III. Economic growth and government promotion of economic development
The United States was an agrarian society in 1783. Three quarters of the labor force was
engaged directly in farming and a large share of the other quarter worked in processing, packing,
shipping, or selling farm products. Perhaps ten percent of the labor force was employed in
manufacturing. Agriculture and manufacturing were the two primary sources of economic
growth in the early 19th century. Growth in both sectors were related to the growth of the
domestic economy within the United States, but what each required from governments in terms
of legal and financial support were very different.
The single most important resource Americans possessed through the entire period up to
the Civil War was land: more wealth was held in the form of land than in any other form. The
peace settlement with Britain gave the new country extensive holdings of western land from the
Appalachians to the Mississippi, millions of acres of land the federal government wanted to sell
to private individuals. Opening the west to settlement and cultivation was the biggest potential

15
source of economic growth and the nation’s number one economic priority. But the process
wasn’t cheap. There were two elements to the cost. One borne directly by the farmers, the other
fell on the larger society.
Land is usually not treated as part of the capital stock, since land possesses certain
features like location that are not the result of investment and savings, but improvements to land
are definitely capital investments. Raw land, covered with trees or prairie grasses, could not be
brought into production without a substantial investment in land clearing, fence building, and
farm building. The land itself was cheap, but making a farm was expensive. In 1860, the state
of Minnesota estimated that a 160 acre farm cost $775 to establish, and only $200 of that cost
was for the land itself. The cost of building farms fell on individuals. Robert Gallman’s
estimates of the capital stock in the early 19th century show that improvements to land were the
single largest element in investment before 1840.16
Fertility and location determined the value of land. Western lands were inherently
productive, but in the wrong place. The cost of transporting bulk agricultural products over the
Appalachian mountains in 1800 exceeded the value of the product. Land prices throughout the
country varied in proportion to the distance of the land from viable transportation. Land along
the Atlantic and Gulf seaboards and the navigable inland waterways running to the ocean, was
much more valuable than land in the interior. Farming in the northwest depended on building a
national transportation system linking the Ohio and Mississippi River valleys with the eastern
seaboard. The costs of building such a system far exceeded the financial abilities of individual
farmers. Many private firms came forward in the 1780s and 1790s and asked states for charters
to build canals into the west: ompanies like the Schuykill & Susquehanna Navigation company

16
in Pennsylvania, the Western and Northern Inland Lock Navigation company in New York, or
the Potomac Company in Virginia. These companies all tried and failed to breach the
Appalachian mountains. In the end, state governments took the lead in successfully building a
national transportation network
Farm building and transportation investment were two of the three elements necessary to
bring all the nation’s farmers into a national market. The third element was a financial system
capable of providing short term credits to farmers, shippers, and wholesalers who moved the
crops from farms to urban and international markets. A farmer in Ohio faced the problem of
selling his crop in the east. One possibility was to sell his wheat in Cincinnati to someone who
would arrange to transport it to New York and sell it there. Another possibility was to arrange
shipment with a freight line, ship his crop to an agent in New York, and have the agent sell it and
send the profits back to him (net of the agent’s costs). The difference in these two methods was
the ownership of the wheat. If the farmer sells in Cincinnati, the shipper owns the wheat and
bears the risk of any rise or fall in the price. If the farmer consigns his crop to an agent, the
farmer bears the risk of any change in the price. The most common method in the 19th century
was for the farmer to consign his crop and bear the risk of price fluctuations.
The farmer, as a result, did not get paid in cash for his crop in Cincinnati. Instead, the
agent to whom he consigned his crop typically authorized the farmer to draw a “bill of
exchange” on the agent’s representative in New York. This bill was like a check, which the
farmer wrote in Ohio, honored by the agent’s representative in New York in the future.17 Since
no one in Ohio wanted to be paid with a check drawn on an individual in New York, the farmer
usually took the bill to the local bank (if there was one) and sold it to the bank for cash. The

17
bank paid the farmer less than the face value of the bill and then arranged to collect the amount
due in New York in the future. The bank’s profits came from the difference between what they
paid to the farmer and the face value they received when the bill matured. The “discount”
between the two prices represented the interest on the loan made to the farmer. Since the farmer
wrote the bill in the first place, the farmer was ultimately responsible for honoring the bill if the
New York agent did not pay the bill. Sound complicated? It was, but it was the cheapest way of
doing business over a long distance when communications and transportation were expensive
and took a long time.
Table 4 examines the difference in the price of a barrel of flour in Cincinnati and New
York/Philadelphia between 1816 and 1860 to give a rough idea of the importance of declines in
transportation and financial costs over the early 19th century. In 1820 a barrel of flour (weighing
196 pounds) cost about $8 in New York and $5.52 in Cincinnati, in 1860 the price was about $5
in New York and $4.72 in Cincinnati.18 Over time, the difference in prices between the two
markets fell from $2.48 a barrel to $.28 a barrel, a decline of almost 90 percent (the lower panel
of the table). The bulk of the decline was in transportation costs. In the early 1830s, Ohio
completed two canals that linked up southern Ohio with Lake Erie, and via the lake with the Erie
Canal and New York city. Transportation costs fell to $1.05 a barrel in 1836-1840, the first full
five year period after the canals were in operation. The next major drop in the price differential
occurred at the very end of the period, when the difference dropped to $.28 a barrel in 1855-
1860, after the railroad (the Baltimore and Ohio was the first) reached across the Appalachians in
the early 1850s.
The importance of financial services is approximated by the interest costs on a 90 day

18
loan to finance the shipment of flour east. The table uses two ballpark interest rates, 24 percent
in 1820 and 8 percent in 1860. The interest costs of $.33 a barrel comprised 6 percent of the
Cincinnati price in 1820, and costs of $.09 percent were only 2 percent of the Cincinnati price in
1860. On the other hand, interest costs were only 13 percent of the price differential in 1820,
while they were 33 percent of the price differential in 1860. As the physical cost of transporting
goods dropped, financial costs became a more important wedge between producer and consumer
prices.
Interest costs were only part of the “transaction costs” of getting goods to market.
Freight handling, insurance, and warehousing were all part of transaction costs. The figures give
some idea of their importance as well. Once the Ohio canals were open, tolls steadily declined
as both New York and Ohio tried to keep as much freight as possible moving over their canals.19
Despite lower canal tolls, the price difference between Cincinnati and New York widened in the
1840s and fluctuated over time. The rise in the price differential from $1.02 in the 1836-1840
period to $1.68 in the 1846-1850 period must have been the result of higher cost of transaction
services, not higher in transportation costs. Financial services were a substantial part of the cost
of getting goods to market, and banks played a central role in reducing the transaction costs of
getting goods to market.
There were several important advantages to establishing local banks in western and
southern state outside the commercially developed northeast. First, banks printed their own
money in the form of bank notes, redeemable in gold, that circulated in the local economy.20
Keeping with the numbers in the previous example, suppose that money could be borrowed in
the form of gold coins (specie) in Indiana at an interest rate of 24 percent. A bank that printed

19
$3 in bank notes for every $1 in gold coins it held in its vaults could discount three times as
many bills of exchange in bank notes as it could in gold. The bank could break even if it
discounted the bills of exchange for 8 percent, that is, its return on the gold it held would be 24
percent. By creating banks, western states could provide liquidity to their local markets, in the
form of bank notes, at much lower cost than the same amount of money in gold coins. Second,
the establishment of local banks created local information about credit worthiness of local
borrowers. A banker in Indianapolis could better judge the credit risk of his neighbors than a
banker in New York. Once the Indianapolis banker established his credit worthiness in New
York, he could borrow money in New York to lend in Indianapolis to his profit and to the benefit
of his neighbors. Finally, the establishment of local banks and currency provided local markets
with some independence from fluctuations in the bank notes of other cities. It is not surprising,
then, that every state wanted to encourage the establishment of banks within their boundaries. In
southwestern states with access to ocean transport, the states invested heavily in banks, but
almost nothing in transportation.
Bringing the west into the national market required improvements in transportation and
in financial services. The major beneficiaries of the improvements were farmers in the west who
shipped bulky, low value agricultural products to the east and on to international markets. But
the investment in the transportation/financial system directly stimulated the growth of
manufacturing in the north east. During colonial times Americans imported many of their
manufactured goods from Britain, a pattern that withstood the stress of the revolution. American
markets for higher quality manufactured goods – hats, clothes, textiles, cutlery, crockery, books,
etc – were dominated by British firms. The Embargo and the War of 1812 gave American

20
producers a brief window of protection from British competitors, and there was a surge in the
formation of American manufacturing firms and an increase in domestic output. With the
resumption of normal relations after the war, British goods flooded back into American markets.
American producers could compete with Britain in two ways. The first was protective tariffs, a
sole responsibility of the national government under the constitution. The second was the
production of cheap, lower quality goods naturally protected by the high transportation costs of
shipping goods across the Atlantic.
Because of their higher value and lower weight, manufactured goods always travel well,
that is they can be profitably shipped farther than most agricultural products. Opening up the
internal domestic market in the United States by reducing transportation and financing costs
offered northeastern manufacturers a growing market in cheap, durable, easily repaired or
replaced manufactured goods. While agriculture was geographically extensive, expanding
output in manufacturing was geographically intensive. Producers bunched together in small
geographic areas where costs were lower because of a price advantage (cheap labor or water
power) or because of knowledge was more readily available (a key in the new manufacturing
technologies), and then distributed their products over a wider area. This geographically intense
pattern was made possible by a more efficient distribution system. American manufactures in
the early 19th century were not producing for international export (this would change in the later
part of the century), but for domestic export.
Manufacturing concentrated in the northeast. Agriculture spread through the rest of the
country, grain and meat production in the north, cotton production in the south. Economic
growth built on advances in transportation and finance. Promotion of economic growth required

21
investments in banks and canals, later railroads. Whether governments promoted economic
development depended on government’s ability to stimulate development of transportation and
financial systems.
IV. The federal government and promotion of economic development
We have already learned that import tariffs were the major source of federal revenue and
that military defense and the interest payments on war debts were the major source of federal
expenditures. But not everything a government does is reflected in large revenues or
expenditures. Indeed, one of the most important government contributions to economic growth
is to provide a stable and unbiased legal environment. The costs of running the judicial system
are, in a way, unrelated to whether the government provides effective justice, since corrupt
courts might require more expenditures than just courts. This section examines the activities of
the national government to see which may have had an impact on economic growth regardless of
their size in the budget.
The federal government provided military defense, conducted international relations, ran
the postal system, and administered the federal courts. All important functions. Occasionally
major debates arose over the conduct of federal policy, but there was never any serious question
that the government would cease providing these services. On the other hand, Congress
regularly debated import tariffs, support for internal improvements (transportation), public land
policy, the existence of a federally chartered bank, and the continued existence of and regulation
of slavery. The previous section identified why tariffs, transportation, western land, and banking
were important determinants of economic growth in the early 19th century. Slavery was very
much an economic issue. The major issues facing Congress, the President, and the federal courts
22
in the early 19th century were how much, if anything, the federal government should do to
promote economic development through active policy in these areas.
The Constitution of 1787 explicitly assigned responsibility for tariffs, public lands, and
banking to the federal government, and there was never any question that the federal government
could build transportation projects and regulate slavery (at least in the territories). This doesn’t
mean that individuals, including several presidents, didn’t argue that a federal bank was
unconstitutional, or that the federal government couldn’t build a road or a canal without a
constitutional amendment, or that the federal government had no power over slavery. It does
mean that the federal government was never prohibited from establishing a bank, controlling the
emission of money, building a road or a canal, regulating slavery, levying a tariff, fighting a war,
or controlling the settlement of western lands because those actions were somehow declared
unconstitutional. People, politicians, and presidents sometimes argued that one of these policies
was unconstitutional, but that was a political argument, not a constitutional one.21
Yet, if the federal government had the constitutional power to promote economic
development in these ways, did it use those powers? The question is a subtle one. The federal
government did not have the option of not having a policy. For example, giving the federal lands
away for free is just as much a policy as not selling any. The questions are not whether the
federal government had a policy, but 1) whether the policy it did have was intended to promote
growth, 2) how, over this seventy year period, did the policy change, and 3) were the changes
intended to increase or decrease federal government promotion of economic development? It
appears that the federal policies put in place by 1792 were intended to promote economic
development, but after 1792 the federal government found it extremely difficult to expand

23
promotion of economic development farther than the status quo.
The easiest policy to quantify and understand is transportation or, in the words of the
time, internal improvements. There had always been a strong argument for federal support of
transportation projects. George Washington had been an early organizer and supporter of the
Potomac Company, which aimed to build a canal from the Chesapeake Bay into the Ohio river
valley. Even Thomas Jefferson, later an opponent of federal support for internal improvements,
said in his second Inaugural speech in 1805: “the revenue thereby liberated [from paying off the
national debt] may, by a just repartition among the states, and corresponding amendment of the
constitution, be applied, in time of peace, to rivers, canals, roads, arts, manufactures, education,
and other great objects within each state.”22 Jefferson mentions a constitutional amendment, one
allowing the federal government to make transportation expenditures. This implies Jefferson’s
belief that such a policy would be “unconstitutional” without an amendment. An interesting
position, since Jefferson himself had signed into law the enabling act for Ohio in 1803 which
required the federal government to spend 2 percent of the land sales revenues of public land in
Ohio on transportation improvements leading to or in Ohio. Congress and Jefferson had already
decided it was constitutional for the federal government to support and build roads.
Between 1790 and 1860 the federal government spent a total of $54 million on
transportation improvements. Table 5 presents Malone’s tabulations of federal expenditures by
type and time. By far the largest share of federal expenditures went to rivers, harbors, and aids
to navigation, all explicitly allowed in the constitution. The single largest project was the
National Road, which grew out of the promise made to Ohio to spend a portion of the revenues
derived from land sales on roads. But of $9 million on roads, plenty went to short roads built

24
within one state. When Andrew Jackson vetoed the appropriation for the Maysville Road in 1830
on the “constitutional” grounds that it lay entirely in Kentucky (and was the route home for his
arch political rival Henry Clay), he conveniently ignored the precedent of many similar grants
that had already been made.
How important were federal transportation expenditures? State and local governments
spent over $450 million on transportation projects, nine times federal expenditures. Most of the
federal spending went to small rivers and harbor improvements and light houses, only a few
were projects like the National Road. Why did the federal government accomplish so little? The
main reason can be found in the kind of projects they did fund. “Rivers and Harbors” bills
contained lots of small projects for congressional districts scattered around the country. No
section, east, west, north, or south was willing to support a large appropriation that would go
exclusively to one region. The Bonus Bill vetoed by Madison in 1817 would have taken the $2
million bonus (charter fee) paid to the federal government by the Second Bank of the United
States and divided it among the states on the basis on Congressional representation -- the share
distributed to each state was equal to its share in the total number of Senators and
Representatives.23 Henry Clay and John Calhoun, the bill’s sponsors, wanted to create a fund to
spend the money on projects in any state, but Congressional opponents would not support the bill
until it was clear that every state would get some money (even then the bill passed by just a few
votes).24 Three more times, in 1832, 1836, and 1841 Clay was able to get a “distribution” bill
that allocated federal land sale revenues among the states on the basis of Congressional
representation. But these bills amounted to very little; every state got a small amount and the
federal government put no projects in place.25

25
The public lands were always closely related to internal improvements. Land values rose
when transportation improvements were made. The federal government adopted a system of
public land sales in 1785 and 1787, before the Constitutional convention, that was designed to
maximize revenues from land sales (see Gary Libecap’s paper in this volume). Land sales were
rarely an important source of federal revenue. Only in land booms, as in 1818, 1836, and 1854,
did land sales approach 20 percent of federal revenues, and in most years were well below 10
percent. The original system offered land for sale in open auctions, in minimum size parcels of
640 acres at a minimum price of $2.00 an acre, with the option of buying land on credit. There
were no limits on the maximum size purchase. Between 1785 and 1841, a series of acts
gradually lowered the minimum size purchase, from 320, to 160, to 80 acres. The minimum
price was lowered to $1.25. Credit sales were abolished in 1820 when it became clear that most
of the people who bought on credit did not pay up. Preemption -- occupying land without title --
was illegal but widespread throughout the west. Dislodging farmers who had built farms on
preempted land was politically unpopular, and after a series of preemption acts that recognized
the rights of preempters to buy land at the minimum price, the federal government finally gave
up and made preemption permanent in 1841.26 At that point the federal government accepted
that revenues from land sales would never amount to much.
What did these changes in land policy mean for economic development? Almost
nothing. Land policy itself was very important, but the shape of land policy was in place by 1787
and the changes after that date were minor. Smaller minimum purchase sizes had some effect,
but individuals could still purchase larger parcels. Preemption was not a significant change,
since the government had rarely been willing to evict occupants without clear title, and had set a

26
definite precedent of negotiation. Feller concluded his history of federal land policy between
1790 and 1841 this way: “Considering its central place in the Jacksonian debate over political
economy, federal land policy did not change much during those years.”27
The fact that little was done in the area of land policy and internal improvements does not
mean that nothing was proposed or discussed. Appendix I gives major land and internal
improvement legislation that came before Congress between 1790 and 1840. The table lists 48
pieces of legislation, although not all were passed. There were bills to give the public lands to
the western states, bills to give the revenues to states for education, and bills to distribute land
revenues to support internal improvement. As with internal improvements, there was a continual
conflict between western states with public lands within their borders and wealthy eastern states
with no public land but a desire to see federal land revenues shared.
Slavery was the third area of federal responsibility (shared with the states) where much
was debated and little was changed. The focal debate over slavery in Congress involved the
process of creating territorial governments in the west from which new states would form. If a
territory was allowed slavery then the territory was likely to allow slavery when it became a
state. If slavery was prohibited in a territory, it the territory was likely to prohibit slavery when
it became a state. Debates over slavery were inextricably linked to land policy, established in
the land ordinances of 1785 and 1787. The 1787 “Northwest Ordinance” governed settlement in
what would become the states of Ohio, Indiana, Illinois, Michigan, and Wisconsin. Article VI
of the ordinance stated “There shall be neither slavery nor involuntary servitude in the said
territory, otherwise than in the punishment of crimes,... Provided always, That any person
escaping into the same, from whom labor or service is lawfully claimed in any one of the
27
original States, such fugitive may be lawfully reclaimed, and conveyed to the person claiming
his or her service as aforesaid.”28 Because the Ordinance preceded the federal constitution, there
was no room for debate about slavery in the northwest, nor was their any doubt that the federal
government was committed to enforcing fugitive slave laws.
Kentucky was created in 1791 out of the state of Virginia, so federal public land law
never applied there. North Carolina ceded Tennessee to the federal government in 1790. The
terms of the cession allowed all existing private claims to be honored, and most of Tennessee
had been sold or granted to private individuals. The cession required that Congress “assume the
government of the said ceded territory, which they shall execute in a manner similar to that
which they support in the territory west [sic] of the Ohio; ... Provided always, That no regulation
be made or to be made by Congress shall tend to emancipate slaves.”29 In 1798, Congress
created the Mississippi Territory, encompassing the land that would become Alabama and
Mississippi, stating that “the President of the United States is hereby authorized to establish
therein a government in all respects similar to that now exercised in the territory northwest of the
Ohio, excepting and excluding the last article of the ordinance made for the governance thereof
by the late Congress, on the thirteenth day of July, one thousand seven hundred and eighty-
seven.”30 The last article of the Northwest Ordinance was Article VI, prohibiting slavery. Land
and slavery in Kentucky and Tennessee were set aside from federal control by the Virginia and
North Carolina grants. In the northern arm of western settlement slavery was prohibited, in the
southern arm of western settlement slavery was allowed.
The first big crisis came when Missouri petitioned for admission as state in 1820.
Missouri was the second state created out of the Louisiana purchase, Louisiana was the first in
28
1811. The terms of the Louisiana and Orleans Territorial Act, 1804, prohibited importation of
slaves into the territory from outside the United States, prohibited the importation of slaves into
the territory from the United States if they had been imported into the United States after 1798,
but allowed the importation of slaves into the territory from other states in the Union as long as it
was done “by a citizen of the United States removing into said Territory for actual settlement,
and being at the time of such removal bona-fide owner of such slave or slaves.”31 It was legal to
bring slaves into Missouri and people did. The question raised in 1820 was whether slavery
would be allowed in the remainder of the Louisiana Purchase. The Missouri Compromise,
engineered by Henry Clay, brought Missouri into the Union as a slave state, brought Maine into
the Union as a free state (Maine was originally part of Massachusetts), and prohibited slavery “in
all that territory ceded by France to the United States, under the name of Louisiana, which lies
north of thirty-six degrees and thirty minutes north latitude, not included within the limits of the
state contemplated by this act.”32
The Missouri compromise acknowledged the “balance rule,” that slave and free states
should have equal numbers in the Senate. The compromise governed settlement in Minnesota
and Iowa (free) and Arkansas (slave), and put off until the 1840s the question of what would be
done with land further to the west. The recognition, then annexation and admission of Texas as
a slave state in 1845 created another intense debate between the south and north, which escalated
with the Mexican American war. Ultimately another round of compromise was reached in 1850,
the last of the famous compromises arranged by Henry Clay, in which California was admitted
as a free state to balance Texas. In the 1850s the status of the Kansas-Nebraska territory sparked
a crisis that could not be resolved by compromise, and led the nation into war.

29
Did federal policy regarding slavery change at all through these crises? The answer, as
with public lands and internal improvements, has to be no. The federal government decided to
draw the line for slave and free territories in 1820, beyond that it debated, argued, and finally
broke up, with exactly the same policy put into place in 1787.
In three other major areas of federal responsibility - import tariffs, banking, and
defense/international affairs -- the federal government did take action. In all three areas the
Constitution gave sole responsibility to the national government. Federal tariff and financial
policies were intertwined from the beginning by Alexander Hamilton’s proposal for funding the
revolutionary war debt, putting the government on a sound financial footing, and promoting the
development of American trade and manufacturing. Hamilton’s plan refunded most of the
existing federal and state debt from the revolution, that is, new bonds were created and traded for
existing bonds. A national bank, which issued its own currency, was created to act as the federal
government’s financial agent, where federal tax receipts would be deposited and where checks
were drawn for expenditures (including payments on the national debt). Finally a set of import
tariffs were imposed, both to generate revenues and to protect manufacturing.33
All three elements of the plan were passed by Congress and signed by President
Washington, despite intense debate and opposition. Attorney General Randolf and Secretary of
State Jefferson thought the Bank was unconstitutional. Their arguments turned on the power of
the government to create a corporation, a power the Constitution had not explicitly enumerated
and, therefore under the reserved powers clause, a power possessed by states but not the national
government. Hamilton argued, successfully, that the power to create a corporation was inherent
in the powers of a sovereign government:

30
The latter [Randolph], expressly admits, that if there is anything in the bill which is notwarranted by the Constitution, it is the clause of incorporation. Now it appears to the Secretary of the Treasury [Hamilton] that this general principleis inherent in the very definition of government, and essential to every step of theprogress to be made by that of the United States, namely: That every power vested in agovernment is in its nature sovereign, and includes by force of the term, a right to employall the means requisite and fairly applicable to the attainment of the ends of such power,and which are not precluded by restrictions and exceptions specified in the Constitution,or not immoral, or not contrary to the essential ends of political society.34
Hamilton’s Constitution contained an implicit and inherent grant of power to the federal
government sufficient to perform the functions it was assigned in the Constitution. There was no
doubt the federal government was given the power to regulate the emission of “bills of credit,”
that a common form of bills of credit were bank notes, and that banks typically required
corporate charters in order to operate. But you can see how Hamilton’s reading of the
Constitution differed from Jefferson. Hamilton saw limits on the federal government in the
Constitution only where there were explicit restrictions, where Jefferson saw powers given to the
federal government only where there were explicit grants. The two positions remain poles of
argument today.
The federal government did charter the Bank of the United States (BUS) in 1792. The
bank had branches throughout the country, issued its own bank notes, served as a depository for
federal tax receipts (mostly customs as we have seen), and moved federal funds around the
country through its branch system as needed to meet federal needs. Revenues were collected
primarily in seaports in the northeast and New Orleans, while the bulk of expenditures was for
military defense, much of it on the frontiers. The BUS enabled the government to perform these
functions efficiently and at low cost. The BUS was a private corporation whose stock was
owned, in part, by the federal government.

31
Congress failed to renew the BUS charter when it expired in 1812 and federal
government financing of the War of 1812 suffered as a result. In 1816, Congress passed a bill
chartering a new Bank of the United States (known as the Second BUS). President Madison
signed the bill chartering the bank despite his history of constitutional concerns, acknowledging
that experience had proven the bank useful and constitutional. Both the First and Second banks
provided an important link the in the development of a nationally integrated financial system.
The bank notes of the branches of the BUS were accepted at par (face value) at all branches of
the system, providing the country with a uniform paper currency. The notes of state chartered
banks tended to trade at a discount that increased with the distance of the note from its issuing
bank. As important, the BUS facilitated the movement of payments between the regions of the
country in the process of carrying out its role as the agent of the federal government. The BUS
bought bills of exchange in different regions and delivered them for payment at their maturity.
Because the BUS was involved in every region of the country, it could turn a tidy profit on the
business at the same time that it provided a more orderly market for these critically important
financial instruments.
The charter of the Second BUS expired in 1836. When Congress renewed the charter in
1832, the renewal was vetoed by President Jackson. Although Jackson attacked the bank on
constitutional grounds, the force of his argument lay on privileges exercised by the bank. These
extensive privileges and profits, some of which went to foreign stockholders, made the bank a
“monster of corruption.” There would not be a national bank again until 1914, although the
federal government would resume chartering banks in 1863 under the National Banking Act (see
Richard Sylla’s essay). The federal government did try to promote economic development by

32
chartering a national bank, Hamilton laid out the rational and drew up the blueprints in 1790.
But a national bank always generated lots of political opposition, and the federal government
was unable to sustain the national bank in 1812 and again in 1832.
Tariffs were different, if only because the government relied on them for 85 percent of its
revenues before 1860. Hamilton proposed moderate tariffs. He wanted an import tariff both to
raise revenues and to promote manufacturing development. Tariffs that were too high provided
protection, but no revenue. Tariffs that were too low provided neither revenues nor protection.
Hamilton’s proposed tariffs were generally implemented by Congress in the 1790s.35 Measuring
tariff rates is complicated by several factors. Tariffs can be imposed on units, weight, or value;
and tariffs vary from product to product. So the overall burden of tariffs depends on how the
tariffs are imposed and what goods they are imposed on.
Figure 11 gives tariffs as a share of dutiable value of imports (that is the official value on
which the tariffs were levied) from 1821 to 1955. Tariffs rates rose from the 1790s to the 1820s.
There was pressure to increase tariffs from manufacturing interests in the northeast and pressure
to reduce tariffs from the cotton exporters in the south. Pressure for tariffs peaked with the
“tariff of abominations” enacted in 1828. Tariff rates as a share of dutiable value were highest in
1831, 61 percent. Exporting interests always opposed high tariffs, but the tariff of abominations
brought extraordinary opposition from the south. In 1832, South Carolina “nullified” the tariff,
refusing to allow it to be collected with its borders. President Jackson threatened South Carolina
with military occupation if they did not back down, vehemently denying any state’s ability to
nullify a federal act.36 Again, Henry Clay arranged a compromise in 1832 that allowed South
Carolina to rescind nullification without an invasion of federal troops, but in the “Force Act”
33
gave the President the authority to use force should it be necessary, and promised to reduce tariff
rates by 10 percent per year for the next ten years. Clay’s compromise ended the nullification
crisis, but it also signaled the end of the protective tariff as an active policy tool to promote
development. Tariff rates declined steadily from 1832 to 1860.
The federal government started out the 1790s with the power and the tools to promote
economic development through banks and tariffs. Wielding those powers, however, was
politically controversial. By 1832 and the ascendance of the Jacksonian Democrats, the federal
government backed away from both a national bank and a protective tariff. Only in the third
area of undisputed federal policy, did the federal government continue to forge an active policy.
We have already seen the importance of land to the early 19th century American
economy. Between 1790 and 1867, the land area of the United States almost quadrupled. The
nation occupied 525 million acres after the Revolution. The Louisiana Purchase in 1803 added
523 million acres, the annexation of Texas in 1845 added 247 million acres, the Oregon
Compromise with Britain in 1846 added 180 million acres, the Treaty of Guadalupe Hidalgo that
ended the Mexican American war added 334 million acres, and the purchase of Alaska in 1867
added 365 million acres.37 This dramatic expansion into the west was the fruit of diplomatic
negotiation and war. Not all of attempts to increase the size of the United States were
successful, the War of 1812 began with an failed invasion of Canada. We have already seen
with slavery that the movement into western lands always involved internal debate about how
land should be acquired and who should settle it. But from its inception, the federal government
carried out an active program of expanding the country, and, through Army expenditures on the
frontier (the single largest item in the federal budget) provided security and government along

34
the western expanse.
In 1790, the federal government possessed the constitutional powers to promote
economic development through public land policy, internal improvement investments, banking
and financial investment, tariffs, and international expansion. Federal land and slavery policies
hardly changed at all from 1790 to 1860, and the federal governments efforts in the field of
transportation were negligible, less than a ninth of state and local investment. Hamilton’s
blueprint for economic development included federal action in banking and a protective tariff,
both of which were enacted, but by 1832 those policies had been eclipsed by political opposition.
Only the drive to add more land continued unabated from 1790 to 1860, but the development of
the new lands in the west, and their connection with established areas in the east, both through
transportation and financial systems, would depend on actions taken by state governments.
V. State Governments and the Promotion of Economic Development
It is easy to see why historians focus on the federal government. States did nothing so
exciting as making war on the British, the Mexicans, or the Indians; did not decide the fate of
any manufacturing interests by setting tariffs; did not distribute hundreds of millions of acres of
public land; and did not decide whether or not there would be a national bank. Successful state
politicians aspired to be Senators, no Senator aspired to be a Governor. The federal constitution
prohibited states from declaring war, conducting international relations, regulating the currency
or emitting bills of credit, levying a tariff or otherwise effecting international trade or even
domestic trade across state lines. The federal government was the only government involved in
the expanding the nation’s boundaries in the west. How could states possibly influence the pace
and pattern of economic growth in the early 19th century?

35
The process of opening the west required enormous resources and turned the economic
focus and energies of the country inward. In comparison to the colonial economy, which
revolved around international exports and imports, the 19th century economy became increasing
independent of foreign markets. The major economic opportunities were within the United
States, not outside of it, and the most important, and potentially profitable, investments were in
transportation and finance. The role of states in finance and transportation far outstrips the
federal government in importance. Despite constitutional restrictions on regulating the currency
and emitting bills of credit, the financial system that arose between 1790 and 1860 was based on
banks not only chartered by state governments, but in some cases owned by state governments.
Nine out of every ten dollars spent on public transportation investment came from state and local
governments. By 1860, portions of transportation system, particularly in the east, were passing
out of the hands of states and coming under private control, but that should not blind us to the
origins of the nation’s transportation system in state promotion. Banking was always under the
control of state governments, with the exception of the two Banks of the United States, and it
was not until 1863 that the federal government took an active role in chartering and regulating
banks. State governments were at the center of the development process.
There were no banks in America before the revolution. States began chartering banks in
the 1780s and 1790s. At first the numbers were small, but they increased steadily with time. By
the 1830s there were over 600 state chartered banks with a capital of over $400 million dollars.38
A corporate charter endowed the bank with limited liability, which was important to bankers
whose profits came mainly from borrowing money in the form of bank notes. The legal ability
to issue bank notes soon became a privilege that required a bank charter. Bank charters were

36
valuable licenses to engage in a profitable activity. It is not surprising that the first banks often
gave the state ownership shares in the bank as part of the cost of obtaining the charter.
Massachusetts, New York, Pennsylvania, Maryland, Virginia, and South Carolina all came to
hold a financial interest in banks in this way. As we pointed out earlier, dividends on bank stock
were an important element in the revenues of state governments in the east.
Once a state acquired an ownership interest in a bank, it faced conflicting incentives
when asked to charter a second bank. The profitability of a bank depended, in part, on
competition. As more banks were chartered, rates of return on the capital invested in individual
banks declined. Existing banks opposed the formation of new banks, but states were constantly
asked to open new banks, particularly in developing areas where financial systems were
primitive (for example, the western parts of New York and Pennsylvania in the 1810s.) States
that held large amounts of stock in existing banks were less likely to charter new banks, as
happened in Pennsylvania. Other states, like Massachusetts, decided to sell their bank stock and
tax bank capital. These states tended to have many more, and smaller, banks.39 By the 1810's all
of the states on the eastern seaboard were promoting or involved in banking in some way.
In places like New York, Philadelphia, Baltimore, and Boston there were many groups of
businessmen who aspired to have a bank. In these places states could sell bank charters and
receive substantial revenues from doing so. In per capita terms, there were more banking
services in the northeast than in the rest of the country. That is, more bank notes per capita,
more bank credit, more bank capital, etc.40 Moving west and south from the northeast, however,
the size and sophistication of commercial centers decreased (the exception was New Orleans),
the number of banks decreased, the number of farmers increased, but the need for banking

37
services did not decline. States in the south and west wanted banks just as much as New
Englanders, but the low density of population, the high share of farmers, and the geographic
concentration of crops meant that banking was riskier. Banks in Mississippi, for example, made
loans on cotton, both direct to farmers to plant crops and by discounting bills of exchange to
facilitate getting the crop to market. If the cotton crop failed or cotton prices collapsed, banks in
Mississippi were in trouble. The ability to diversify banking risk in Mississippi was limited,
unlike banks in major eastern commercial centers with many opportunities to diversify their risk.
The same was true in the northwest, except there it was markets for wheat, corn, and other grains
that mattered.
States in the south and west responded in two way. First, states invested their own funds
in banks, providing bankers with larger amounts of public capital (as opposed to the early eastern
states who usually received bank stock as part of the charter process, and did not put state funds
into the bank.) Second, there were fewer banks and the banks tended to be larger. Table 6 gives
the number of banks, total capital, and capital per bank for each state in 1837, and, in the lower
panel of the table, each region’s share of the national total of all banks, all bank capital, and, in
each region, the average capital per bank. Western states had many fewer banks. Ohio and
Louisiana are the only states west of the Appalachians with more than ten banks, and they are the
two oldest and most developed western states by the 1830s. Most frontier states had four banks
or less.41 Southern states in general had larger banks than northern states, but in both the north
and the south banks were much larger in the west than in the east. Banks in the southwest had
ten times the average capital of banks in New England.
The last three columns of the table provide some insight into state investment in banks in
38
the west. Column 4 gives the amount of state debt incurred to invest in banks up 1837. Only
states in the frontier south and west invested in banks. Column 5 gives state investment as a
share of total bank capital. With the exception of Kentucky, state governments provide more
than half of bank capital in each of these states.42 State involvement was critically important to
the development of banks in the south and west. Column 6 gives the share of all state borrowing
that went to investments in banks. We’ll return to this shortly.
The First and Second Banks of the United States were extremely important to the
development of American financial systems. They spanned the country with their branches,
provided a uniform paper currency, and stabilized the conduct of federal financial activities. But
they were not the only, or even the most important elements of the banking system that
developed in the early 19th century. By 1836, state chartered banks had ten times the capital of
the Second Bank. When the Second Bank lost its charter, it was quickly rechartered as the Bank
of the United States of Pennsylvania. The banking system continued to develop without a
national bank, and there is no reason to believe that the banking system would not have
developed before 1836 if there had not been a national bank.
State chartered banks where the heart of the developing American financial system. In
the northeast, private banking interests approached state governments and were willing to pay for
charters. State banking policy in New England and the Mid-Atlantic regions promoted
development by facilitating the creation of banks, the capital came from private sources. In the
south and west, states played a much more active role in providing capital and organizing banks.
State involvement in transportation investment has as a long history as well. By the
1780s, states were chartering private companies, providing subsidies, and purchasing stock in

39
canal, bridge, road, and turnpike companies.43 Virginia chartered the Potomac Company and the
James River Company in 1785 and the Dismal Swamp Company in 1790. In 1792, New York
chartered two companies, the Western Inland Lock Navigation Company and the Northern
Inland Lock Navigation Company, to open canals to Lake Ontario in the west at the St.
Lawrence in the north via Lake Champlain. Maryland chartered the Chesapeake and Delaware
canal in 1799. By 1811, Pennsylvania had spent $825,000 to build turnpikes. Massachusetts
also invested in turnpikes. Unlike their investments in banks, however, transportation projects
were rarely profitable investments for state governments. For a few brief years around 1805, it
appeared the federal government might get involved in transportation. Jefferson’s second
inaugural message, cited earlier, led Congress to ask the Secretary of the Treasury, Albert
Gallatin, to prepare a report laying out a possible system of internal improvements. Gallatin’s
famous report proposed a network of canals that would have connected the disparate parts of the
country at a cost of over $20,000,000. Most of the projects envisioned in the report were
eventually carried out in one form or another by state and/or private interests, but the federal
government spent very little on transportation before the 1820s (see Table 5).
Despite federal inaction, there was widespread support for internal improvements. In
1811, the New York legislature authorized the issue of $5,000,000 in state bonds to build a
canal; a plan sidetracked by the outbreak of the War of 1812. Virginia created a Board of Public
works in 1816. In 1817, after failing to receive federal support, New York embarked on the
largest infrastructure project of its time, the Erie Canal. The canal turned out to be a
phenomenally successful investment. Completed in 1825, it soon returned funds to the state
over and above maintenance costs and interest payments. Now it appeared canals could prove as
40
profitable as banks. The pattern of state transportation investment, after the Erie success, was
influenced by two factors.
The first was geography. Areas with access to ocean transportation did not need to build
canals, although they often improved their rivers and built short canals to bring their interior
regions into contact with ports. The real payoff was the construction of interregional canals, like
the Erie, that reached into the northwestern interior. In the late 1820s Ohio, Pennsylvania, and
Maryland started canals, all with hopes they would pay for themselves and return a handsome
dividend to the state treasury. Virginia, South Carolina, and Georgia contemplated projects that
would open up routes into Tennessee and Kentucky.
The second factor was the youth of western states. Indiana became a state in 1816,
Mississippi in 1817, Illinois in 1818, Alabama in 1819, and Missouri in 1820. Indiana was the
largest of those states in 1820 with a population of just 147,000. It was not until the early 1830s,
that western populations, swelled by rapid migration population inflows, and western state
budgets, spurred by the rapidly expanding economy and the boom in federal land sales, enabled
these young states to contemplate transportation investments of their own. In 1836 and 1837,
Indiana, Illinois, and Michigan started new canals and railroads systems. In the same years, New
York, Ohio, and Pennsylvania committed to expanding their existing systems. Rising western
populations raised land prices; rising land prices stimulated public land sales; increased sale of
public land raised the property tax base; and states began to think they could afford to build
better transportation systems, which would further raise land prices, increase land sales, and
expand the property tax base. The direction of causation in this story is difficult to disentangle,
but all the factors came together to produce a major economic boom in the 1830s.

41
The boom affected southwestern states, just as it affected northwestern states, but
southern states were not in need of major transportation investments. Their already navigable
rivers ran to the sea. In the south, banks dominated state investments. Louisiana invested $23
million in banks beginning in 1824. Alabama, Georgia, and Florida made substantial
investments in the early 1830s, while Mississippi and Arkansas committed millions to banks in
1837 and 1838. As table 6 shows, moving west from Florida, into Alabama, Mississippi,
Louisiana, Tennessee, and Missouri more than half of the banking capital in each of these states
by 1837 came from state investment and almost all of the debt in these states was issued for the
purpose of investing in banks.44 Northwestern states needed banks too, Illinois and Indiana made
significant investments in their state banks.
States had always borrowed money to finance long term capital projects. But the pace of
state borrowing increased dramatically in the 1830s. State debts expanded from a few million in
1820, to $80 million in 1830, and $200 million in 1841. Figure 12 gives state debt issued each
year in the 1830s. The relative size of some of the state debts is truly amazing. In 1836, Indiana,
with a population of roughly 600,000 and a state budget of $50,000 a year, authorized a bond
issue of $10,000,000 in 5 percent bonds. Michigan, with a population of no more than 200,000
and state revenues of $17,000 in 1836, authorized a bond issue of $5,000,000 of 5 percent bonds
in 1837.45 Earlier we saw the implications for tax revenues in Indiana. Per capita tax revenues
in the 1840s were ten time higher than they had been in the 1830s. Total and per capita state
debts outstanding in 1841 are given for each state in Table 7.
In 1837, the American economy was hit by a financial panic and in 1839 a depression
began that lasted until 1843. Many of the transportation and banking projects of the western
42
states were abandoned. Indiana, Illinois, Michigan, Arkansas, Louisiana, Mississippi, Florida
(still a territory), Maryland, and Pennsylvania stopped paying interest payments on their state
bonds in 1841 and 1842. Mississippi and Florida formally repudiated their bonds, while
Louisiana, Arkansas, and Michigan ultimately failed to repay part of the money they had
borrowed. The other states eventually resumed payments on their bonds, and in the end repaid
all of the principle and most of the back interest.46 New York, Ohio, and Alabama narrowly
avoided default.
It is tempting to think of the “canal” boom of the 1830s as the result of naive western
states optimistically thinking they could borrow to build canals, railroads, and banks and live off
the dividends and tolls. Such a view is inconsistent with the history recounted in this section.
States had been deeply involved in the creation of banks and transportation companies since the
1780s. In the case of banks, state involvement had proven profitable, in the sense that states who
owned stock in banks received substantial and steady dividends, and those states that taxed
banks earned a hefty share of state revenues from bank taxes. In the case of transportation, until
the Erie canal, state investments had rarely been directly profitable, but there is little reason to
doubt that the overall returns to the state treasury in terms of higher property tax revenues on
increased land values made these good investments.47 What happened after 1839 was an
unexpected economic depression, that was caused, in part, by the terrible fix the states found
themselves in.
States reacted predictably to the immediate crisis. New York passed a “Stop and Tax”
law in 1842: stop construction on the canals and reinstate the property tax. Indiana’s new
constitution, passed in 1851, left it up to the voters to ban banking entirely (they chose not to)

43
and made it unconstitutional for the state to borrow to finance internal improvements. But by
and large this “revulsion” against internal improvements was temporary. What changed
permanently was the way states approached the process of promoting economic development.
Already in 1837, Michigan and New York had adopted “free banking.” Under a free banking
act, anyone could obtain a bank charter who met minimum requirements for capital investment.
Free banks were regulated, the “free” referred to entry, not to regulation. Twenty states had free
banking systems by 1860. The corollary to free banking in manufacturing and other sectors of
the economy were general incorporation acts. In every state in 1790, a corporate charter could
only be obtained by an act of the state legislature. This made charters valuable, as we have seen,
but it also raised the possibility that business interests and politicians would conspire to limit
competition. This was always a problem if the state relied on corporate charters or investment
dividends for revenues, as we saw earlier as well. Eleven states adopted general incorporation
clauses in their constitutions in the 1840s, and ___ states had general incorporation acts in place
by 1860 (Evans). When states began moving toward free banking and general incorporation, the
importance of asset income necessarily declined, and state property taxes rose in importance as a
share of state revenue, as shown in Table 3.
The depression of 1839 ended state investment in transportation in some states. Indiana,
Illinois, Michigan, and Maryland wouldn’t spend a penny on transportation until well after the
Civil War.48 But voters in New York approved a bond issue to complete the canal system in
1850 (?). Ohio struggled through the 1839 depression to finish its canal network. Louisiana,
despite being in default on bank bonds issued in the 1820s, borrowed in national and
international capital markets in to build railroads in the 1850s. Nobody would lend money to

44
Mississippi or Florida, but Missouri borrowed millions to build railroads in the 1850s.
Active promotion of economic development shifted in the later 19th century from state to
local governments. In 1841, state government debt was eight times local government debt.
Almost all of the debt was incurred to invest in banks, canals, and railroads. In 1902, when the
first complete census of American governments was taken, local government debt was eight
times state debt. Local debt was, as before, primarily for economic development: railroads;
water and sewage, public power, and education. American governments kept promoting
economic development, but the level of government changed
VI. Conclusions
The history of American government cannot be written without writing the history of
American governments. Policies to promote of economic development move from one level of
government to another constantly through the nation’s history. In 1776, there were fourteen
individual government policies, not one. By the 1830s there were 26 states, each pursuing its
own development agenda. By the end of the 19th century local governments had taken the lead in
infrastructure investment. In 1940, when a complete count of the number of governments was
taken, there were 140,000 governments in the United States (today there are about 80,000).
Keeping track of how the American government interacts with the economy first requires that we
keep track of what all American governments are doing.
From the nation’s very beginnings in 1776, state governments took the lead in economic
policy, not the national government. The Articles of Confederation gave the federal government
a monopoly over defense and international relations, but power over very little else. Such a
weak central government could not provide even the basic service, national defense, required of

45
it. The second Constitution, written in 1787, created a stronger national government, a
government possessing its own independent source of tax revenues. The Constitution gave the
national government the sole power to conduct international affairs and military defense, to
regulate the currency, to regulate international trade, and to disperse the western lands. At the
same time, the Constitution hemmed in the national government by granting unenumerated
powers to state governments.
In the 1790s, the federal government set up an active policy of financial promotion and
protective revenue tariffs. Tariffs account for 85 percent of federal revenues, and military
defense over 52 percent of federal expenditures. But using the tariff to actively promote
American manufacturing raised substantial political opposition, and after the tariff of
abominations in 1828, tariff rates gradually declined and talk of using the tariff as a means of
economic development disappeared. The two federally chartered banks did exert a regulating
influence on the money supply between 1792 and 1836, but they also generated intense political
opposition. Congress failed to renew the first bank’s charter in 1812, and could not over ride
President Jackson’s veto of the charter renewal in 1832. The main function the federal
government continued to provide was military defense (and at times military offense) and
international relations.
It was the states that developed active policies to promote economic development by
encouraging public and private investment in banking and transportation. State development
policy began taking shape in the 1780s and continued to grow in size and importance. States
were often investors in early banks, and in several eastern states banks became an important
source of state government revenue. As western states entered the Union, they too sought to

46
develop banks and canals. Frontier states invested heavily in banks in the 1820s and 1830s.
Following the success of the Erie Canal, eastern states like Pennsylvania, Maryland, and
Massachusetts began canal and railroad projects, followed in the 1830s by a wave of
transportation investment in the north west. In the economic depression that began in 1839,
many of these western state projects in banking and transportation came to a bad end. States in
some parts of the country began receding from active investment, although others continued to
actively invest right up to the Civil War.
In the 1840s, following the default crisis, states began putting in place arrangements that
made it easier for corporations to form and guaranteed equal access to corporate charters for all
members of the economy. Free banking laws and general incorporation acts implemented these
policies. Many states wrote explicit provisions into their constitutions requiring legislators to
write general incorporation acts. The result was a growing number of corporations and banks,
throughout the country.
Throughout the early 19th century, the federal government wanted to promote economic
development, but found the political complexity of reaching a consensus about what should be
done too daunting. Federal policy changed very little, except to recede from development
promoting policies, between 1790 and 1860. State governments, on the other hand, actively
experimented with new ways to promote development, to help farmers get their goods to market
with better transportation and finance, and to raise land values, which helped the farmers and the
state treasuries that depended on the property tax. Not everything they tried worked and some of
their projects failed spectacularly. But the idea that government should play a positive role in
the economy was never seriously challenged, although it was often intensely debated.

47

48
1.See Adams Diary and Autobiography, Butterworth, ed. III, pp. 335-37.
2.This essay neglects two important areas of government action: education and the law. Stategovernments provided a minimum amount of support for public education before 1860, but localgovernments, with wide variety across the country, began moving towards public schools. Bothstate and federal courts made large contributions to the promotion of economic development. Two features stand out. First, by the lights of the early 19th century, the courts were independentand unbiased. The “rule of law,” the idea that governments should be of laws not men, andparticularly that governments and politicians should abide by the same laws they made foreveryone else was an important ideological element in the American legal system. Second,judges and the bar thought systematically about how law affected the economy, and consciouslyand effectively began changing the structure of American common law to “release energy” in thewords of James Willard Hurst.
3.For a discussion of the first state constitutions see Paul, Lutz, Tarr, Green, and Kruman. Kruman is particularly valuable as an antidote to the idea that the first state constitutions weresimple minded and gave too much power to legislatures, an idea articulated by Wood.
4.For the ever changing state of suffrage see Keyssar. Judicial independence was a principle ofAmerican constitutional theory, but as in the national constitution, the actual form that judicialinstitutions took was initially a legislative rather than constitutional matter. Over time statesadopted much more specific constitutional forms of judicial systems, while the nationalgovernment has left the federal judiciary to the Congress.
5. From the very beginning, ownership and distribution of western lands were contentious issues. Virginia’s extensive claims in the west caused the most difficulty.
6.”All charges... shall be defrayed out of a common treasury, which shall be supplied by theseveral States, in proportion to the value of all land within each State, granted to or surveyed forany person, as such land and the buildings and improvements thereon shall be estimatedaccording to such mode as the United States in Congress assembled, shall from time to timedirect and appoint.” (Article VIII).
7.Congress was able to decide some matters by a simple majority, and others by a super majorityof nine states (Article IX), but changes in the Articles required unanimous agreement, “And thearticles of this confederation shall be inviolably observed by every State, and the Union shall beperpetual; nor shall any alteration at any time hereafter be made in any of them; unless suchalteration be agreed to in a Congress of the United States, and afterwards confirmed by theLegislatures of every State” (Article XIII).
Endnotes
49
8.The story of national finances during the war and after is told in Ferguson, Power of the Purse.
9.The table is based on Wallis, 2000. The federal numbers are accurate, the state numbers arereliable but not completely accurate, and the local numbers are rough guesses at best.
10. Adjusting for inflation would have some effect on these numbers, but the basic featureswould still remain.
11.Repaying the principle on government debts is clearly an expense for the government, but itis not treated as an “expenditure” in the government accounts. To do so would double count theborrowed money. If the government borrows $100 to build a bridge, the construction costs arecounted as an expenditure. If the repayment of the $100 principle was also counted as anexpenditures, then total expenditures would be $200, when the government really spent just$100. Interest payments on debts are an expenditure. In a similar way, borrowed funds are notcounted as revenues.
12.Slaughter, The Whiskey Rebellion.
13.The four states are regionally representative and are ones for which we have relativelycomplete data. Individual state revenues are weighted by population to construct the average inthe figure.
14.See Goodrich’s Government Promotion of Canals and Railroads for a history oftransportation investment in the states.
15. Wallis, Sylla, and Legler [1994], p. 126. We do not have adequate fiscal data on Alabamaand Gerogia, but see Brantley [1961] for Alabama and Wallenstein for Georgia.
16.For the cost of farm building see Atack and Passell. For the share of capital held in the formof land improvements see Gallman.
17.This type of bill of exchange was often a “sight” bill, meaning that the agent’s representativein New York had 60 days from the presentation of the bill, the sight, to pay cash.
18.The price differentials are taken from Thomas Berry Western Prices, the prices in New Yorkand Philadelphia from Historical Statistics.
19.See the discussion in Scheiber, p. Ohio and New York worked together to get freight ontheir systems.
20.The federal government minted gold and silver coins, but did not print any paper money untilthe Civil War.
21.The distinction in this argument may be a bit difficult to follow. The Constitution declaresitself the law of the land, but is vague on how that works. Eventually the Supreme Courtasserted its power to be the ultimate arbiter of what is and is not constitutional, but that is not a

50
power delegated to the Supreme Court in the Constitution. Presidents Madison (the Bonus Billin 1817) and Jackson (the Maysville Road bill in 1830) both vetoed important Congressionallegislation on the grounds that it was “unconstitutional,” but their stands (particularly Jackson’s)appear to be motivated more by political than constitutional objections. By that we mean thatearlier and later Congresses and President’s passed and signed legislation that did exactly whatMadison and Jackson had vetoed without changing the Constitution. Madison and Jackson’sassertion that something was unconstitutional were simply that, assertions. But their statementscarried considerable weight at the time, since no one had yet figured out just how aCongressional Act or state law was to be declared “unconstitutional.”
22.Richardson, Messages and Papers of the Presidents, Vol. I, p. 367.
23.The formula had a slight bias toward small states, since every state had two Senators, butRepresentation varied with population.
24.Clay and Calhoun knew that their bill would be defeated if they proposed to spend most ofthe $2 million in, say, Kentucky and South Carolina, so they fought to the very end to notspecify the projects that the money would be spent on in the bill. See Larson, 2000.
25.The 1836 distribution act allocated the federal surplus (it turned out to be $36 million)generated by the extraordinary land sales in 1835 and 1836, see Figures 1 and 2. The 1817Bonus Bill would have allocated the $2 million bonus and the dividends on federal stock in theBUS. The 1841 Land Act would have allocated land sales revenues, net of land office costs,among the states. Land revenues averaged about $2 million a year.
26.This was the same bill that distributed land sales revenues to the states. The distributionprivilege was tied to the tariff, and President Tyler raised the tariff in 1843 and endeddistribution.
27.Feller, Public Lands, p. 194.
28.An Ordinance for the government of the territory of the United States northwest of the riverOhio. Confederate Congress, July 13, 1787. As reported in Poore, p. 432.
29.First Congress, Second Session, Poore, p. 1664.
30.Fifth Congress, Second Session, Poore, p. 1050.
31.Eight Congress, First Session, 1804, Poore, p. 694.
32.Enabling Act for Missouri, Sixteenth Congress, First Session, Poore, p. 1104.
33.Hamilton’s plans were laid out in a series of Reports to Congress: First Report on the PublicCredit, January 14, 1790; Report on a National Bank, December 14, 1790; Report onManufacturers, December 5, 1791; and Second Report on the Public Credit, January 16 and 21,1795. These are conveniently reprinted, along with Hamilton’s letter to President Washington

51
on the Constitutionality of the National Bank, in McKee.
34.Hamilton’s letter to Washington on the Constitutionality of a National Bank, McKee, p. 101,emphasis in the original.
35.See Irwin, 2003, for the success of Hamilton’s tariff plan in Congress.
36.This, of course, is the same Andrew Jackson who felt the federal government had too muchpower, and whose reelection campaign in 1832 was based on his positions against federalinvolvement in banking (the charter veto) and internal improvements. Ellis tells the history ofthe Nullification crisis.
37.The numbers are taken from Gates, p. 86. Other additional to the public domain included thecession of Florida and the Gadsen purchase.
38.Fenstermaker provides detailed information on the chartering of state banks before 1837.
39.The relationship between ownership and taxation of banks to the number of banks charted inPennsylvania, Massachusetts, and other states is examined in Wallis, Sylla, and Legler.
40.See Bodenhorn, 2000, p. 63.
41.The numbers for Mississippi and Michigan are larger because of the creation of banks in 1835and 1836.
42.The 148% figure in Illinois is the result of a large state investment in 1837, which occurredafter the figure on bank capital was collected in January. The same is true for Alabama.
43.The classic history of government involvement in transportation remains Goodrich [1960],which has been supplemented by Larson, [200?].
44.Arkansas became a state in 1837 and the first act of the state legislature was to create a backcapitalized by state bonds.
45.Information on state finances in the 1830s and 1840s is available at ICSPR Richard Sylla,John Legler, and John Wallis “Sources and Uses of Funds in State and Local Governments,1790-1915: [United States]”, Data set 1993-05-13.
46.How much was repaid and how quickly varied from state to state. Pennsylvania and Marylandresumed payments by 1848 and paid back interest in full. Indiana and Illinois were stillstruggling in the 1850s.
47.For a paper that estimates the effect of railroad construction on land values and property taxrevenues in the late 19th century see Heckelman and Wallis, and for a direct measure of canalconstruction on land values in Indiana in the mid-1830s, see Wallis.

52
48.Of course, these states would spend again for transportation in the 20th century when theautomobile was developed. While the state of Illinois stopped spending, local governmentscontinued to borrow money to invest in railroads, and a number of cities and counties wentbankrupt in the 1870s.
53
References
Adams, Willi Paul. 2001. The First American Constitutions. Expanded Edition, Lanham, MD:Rowman and Littlefield.
Atack, Jeremy and Peter Passell, A New Economic View of American History.
Berry, Thomas Senior. Western Prices Before 1861. Cambridge: Harvard University Press,1943.
Bodenhorn, Howard, 2000. A History of Banking in Antebellum America, Cambridge:Cambridge University Press.
Bodenhorn, Howard, 2003. State Banking in Early America: A New Economic History, Oxford:Oxford University Press.
Callender, Guy Stevens. “The Early Transportation and Banking Enterprises of the States.” Quarterly Journal of Economics , vol. XVII, no. 1, 1902.
Ellis, Richard E. 1987. The Union at Risk: Jacksonian Democracy, States’ Rights, and theNullification Crisis. Oxford: Oxford University Press.
Evans, George Heberton, 1948, Business Incorporations in the United States, 1800-1943. NBER,Baltimore: Waverly Press.
Feller, Daniel. The Public Lands in Jacksonian Politics, University of Wisconsin Press, 1984.
Fenstermaker, J. Van. The Development of American Commercial Banking 1782-1837. : Kent,Ohio: Kent State University, Bureau of Economic and Business Research, 1965.
Ferguson, E. James. 1961. The Power of the Purse: A History of American Public Finance,1776-1790. Chapel Hill: University of North Carolina Press.
Gates, Paul Wallace. History of Public Land Law Development. Washington, D.C.: GPO, 1968.
Gallman, Robert. 1992. “Capital Stock” in Gallman and Wallis, ed. American Economic Growthand Standards of Living before the Civil War. Chicago: University of Chicago Press.
Goodrich, Carter. Government Promotion of American Canals and Railroads. New York:Columbia University Press, 1960.
Green, Fletcher M. 1966. Constitutional Development in the South Atlantic States, 1776-1860.New York: Norton.

54
Hammond, Bray. Banks and Politics in America: From the Revolution to the Civil War.Princeton: Princeton University Press, 1957.
Handlin, Oscar and Mart Flug Handlin. Commonwealth: A Study of the Role of Government inthe American Economy: Massachusetts, 1774-1861. Cambridge: Belknap Press, 1969.
Hanna, Hugh Sisson. A Financial History of Maryland (1789-1848). Johns Hopkins UniversityStudies in Historical and Political Science, Series XXV, no 8-9-10. Baltimore: JohnsHopkins University Press, 1907.
Heckelman, Jac and John Joseph Wallis, 1997, “Railroads and Property Taxes” Explorations in Economic History, 34, pp. 77-99, January 1997.
Irwin, Douglas A., 2003, “The Aftermath of Hamilton’s “Report on Manufacturers.”” NBERworking paper, w9943, September 2003.
Keyssar, Alexander. 2000. The Right to Vote: The Contested History of Democracy in the UnitedStates. New York: Basic Books.
Kruman, Marc W. 1997. Between Authority and Liberty: State Constitution Making inRevolutionary America. Chapel Hill: University of North Carolina Press.
Larson, John Lauritz. 2001. Internal Improvement: National Public Works and the Promise ofPopular Government in the Early United States. Chapel Hill: University of NorthCarolina Press.
Legler, John B., Richard E. Sylla, and John Joseph Wallis, 1988. "U.S. City Finances and theGrowth of Government, 1850-1902," Journal of Economic History, 48, pp. 347-356, June1988.
Lutz, Donald S. 1988. The Origins of American Constitutionalism. Baton Rouge: Louisiana StateUniversity Press.
Lutz, Donald. S. 1980. Popular Consent and Popular Control: Whig Political Theory and theEarly State Constitutions. Baton Rouge: Louisiana State University Press.
Malone, Laurence J. 1998. Opening the West: Federal Internal Improvements Before 1860. Westport, CT: Greenwood Press.
McKee, Samuel Jr., ed. 1934. Alexander Hamilton’s Papers on Public Credit Commerce andFinance. New York: Columbia University Press.
Poore, Benjamin Perley, ed. 1878. The Federal and State Constitutions, Colonial Charters, andother Organic Laws of the United States, Second Edition. Washington: Government

55
Printing Office. Reprinted, 2003, Clark, New Jersey: The Lawbook Exchange.
Richardson, James D. Messages and Papers of the Presidents, Washington: Bureau of NationalLiterature, 1897.
Scheiber, Harry N. Ohio Canal Era: A Case Study of Government and the Economy, 1820-1861.Athens, Ohio: The Ohio State University Press, 1969.
Schwartz, Anna 1987. “The Beginning of Competitive Banking in Philadelphia.” In Money inHistorical Perspective, NBER, Chicago: University of Chicago Press.
Slaughter, Thomas P. The Whiskey Rebellion: Frontier Epilogue to the American Revolution. New York: Oxford University Press, 1986.
Sylla, Richard, John B. Legler, and John Joseph Wallis. "Banks and State Public Finance in the New Republic." Journal of Economic History, 47 1987.
Tarr, Alan Understanding State Constitutions, Princeton: Princeton University Press.
Wallis, John Joseph, Arthur Grinath, and Richard Sylla, “Debt, Default, and Revenue Structure.”NBER Working Paper, and mimeo. 2001.
Wallis, John Joseph, Richard Sylla and John Legler. 1994, “The Interaction of Taxation andRegulation in Nineteenth Century Banking.” In Goldin and Libecap, eds. The RegulatedEconomy: A Historical Approach to Political Economy, Chicago: University of ChicagoPress, pp. 121-144.
Wallis, John Joseph, “The Property Tax as a Coordination Device: Financing Indiana’sMammoth System of Internal Improvements.” Explorations in Economic History. July2003.
Wallis, John Joseph, 2000, “American Government Finance in the Long Run: 1790 to 1990,”Journal of Economic Perspectives, January, 2000.
Wallis, John Joseph, 2001, “History of the Property Tax,” in Property Tax, Wallace E. Oates,ed., Lincoln Institute.
Wood, Gordon S. 1969. Creation of the American Republic. Chapel Hill: University of NorthCarolina Press.
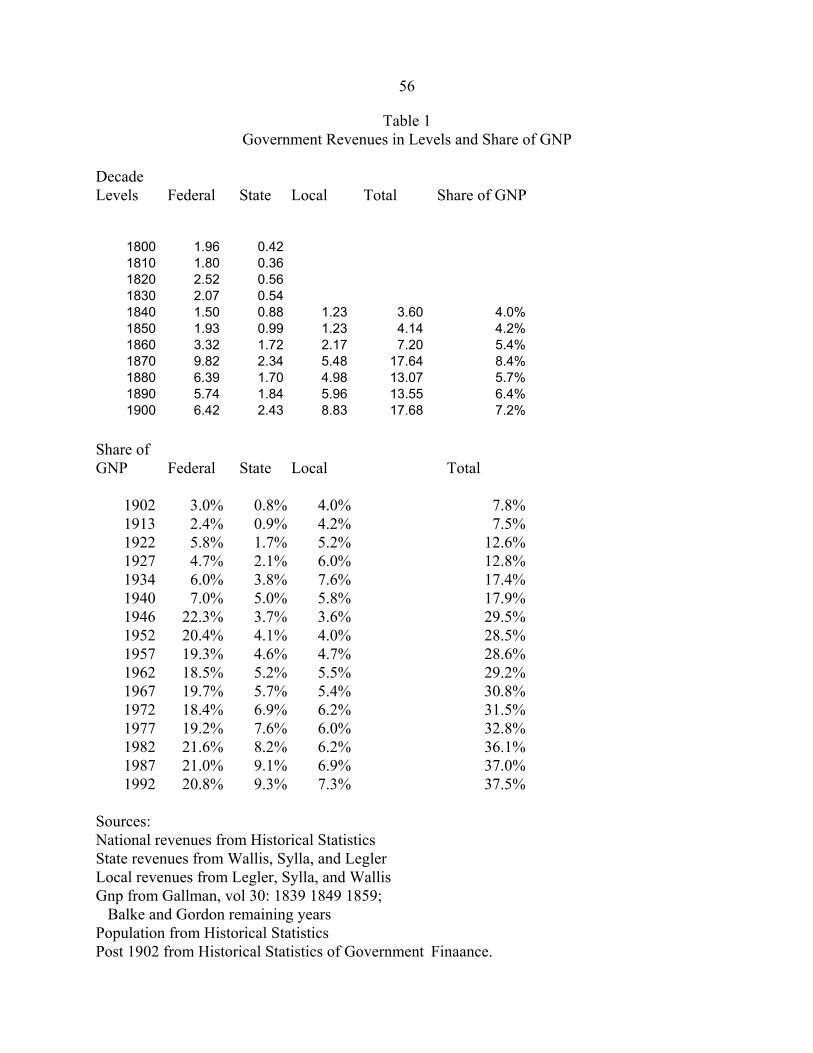
56
Table 1Government Revenues in Levels and Share of GNP
DecadeLevels Federal State Local Total Share of GNP
1800 1.96 0.42 1810 1.80 0.36 1820 2.52 0.56 1830 2.07 0.54 1840 1.50 0.88 1.23 3.60 4.0%1850 1.93 0.99 1.23 4.14 4.2%1860 3.32 1.72 2.17 7.20 5.4%1870 9.82 2.34 5.48 17.64 8.4%1880 6.39 1.70 4.98 13.07 5.7%1890 5.74 1.84 5.96 13.55 6.4%1900 6.42 2.43 8.83 17.68 7.2%
Share ofGNP Federal State Local Total
1902 3.0% 0.8% 4.0% 7.8%1913 2.4% 0.9% 4.2% 7.5%1922 5.8% 1.7% 5.2% 12.6%1927 4.7% 2.1% 6.0% 12.8%1934 6.0% 3.8% 7.6% 17.4%1940 7.0% 5.0% 5.8% 17.9%1946 22.3% 3.7% 3.6% 29.5%1952 20.4% 4.1% 4.0% 28.5%1957 19.3% 4.6% 4.7% 28.6%1962 18.5% 5.2% 5.5% 29.2%1967 19.7% 5.7% 5.4% 30.8%1972 18.4% 6.9% 6.2% 31.5%1977 19.2% 7.6% 6.0% 32.8%1982 21.6% 8.2% 6.2% 36.1%1987 21.0% 9.1% 6.9% 37.0%1992 20.8% 9.3% 7.3% 37.5%
Sources: National revenues from Historical StatisticsState revenues from Wallis, Sylla, and LeglerLocal revenues from Legler, Sylla, and WallisGnp from Gallman, vol 30: 1839 1849 1859; Balke and Gordon remaining yearsPopulation from Historical StatisticsPost 1902 from Historical Statistics of Government Finaance.
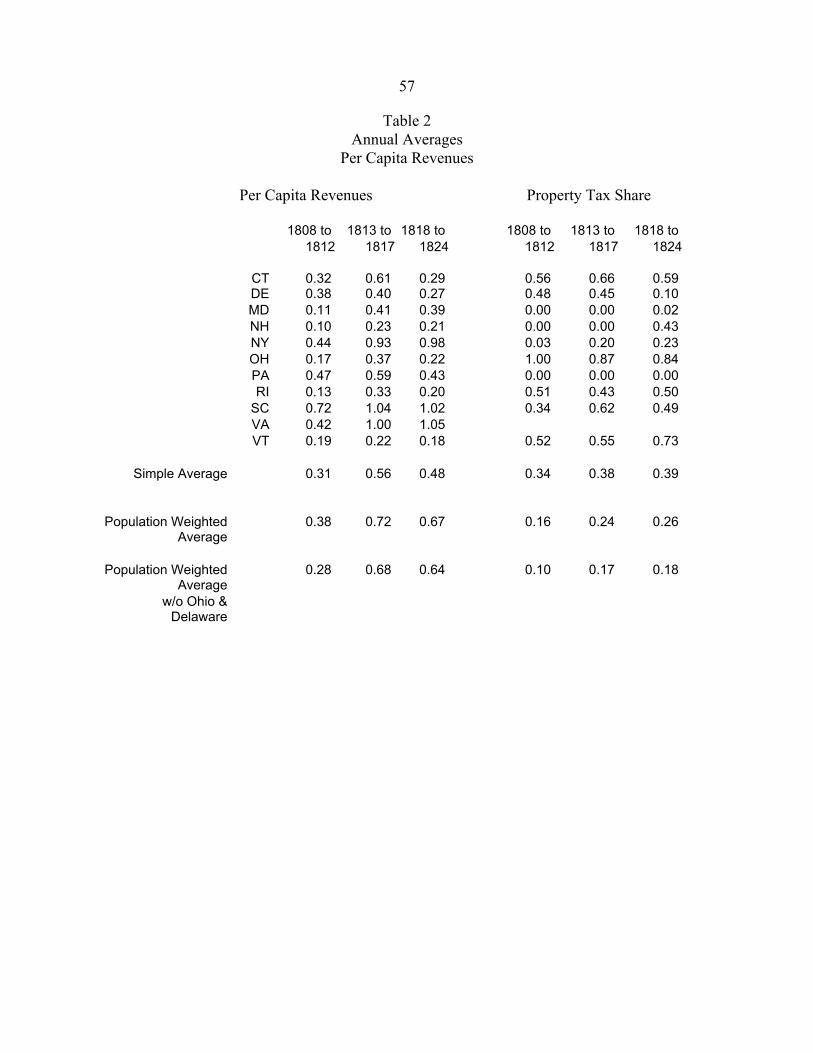
57
Table 2Annual Averages
Per Capita Revenues
Per Capita Revenues Property Tax Share
1808 to 1813 to 1818 to 1808 to 1813 to 1818 to 1812 1817 1824 1812 1817 1824
CT 0.32 0.61 0.29 0.56 0.66 0.59 DE 0.38 0.40 0.27 0.48 0.45 0.10 MD 0.11 0.41 0.39 0.00 0.00 0.02 NH 0.10 0.23 0.21 0.00 0.00 0.43 NY 0.44 0.93 0.98 0.03 0.20 0.23 OH 0.17 0.37 0.22 1.00 0.87 0.84 PA 0.47 0.59 0.43 0.00 0.00 0.00 RI 0.13 0.33 0.20 0.51 0.43 0.50
SC 0.72 1.04 1.02 0.34 0.62 0.49 VA 0.42 1.00 1.05 VT 0.19 0.22 0.18 0.52 0.55 0.73
Simple Average 0.31 0.56 0.48 0.34 0.38 0.39
Population Weighted 0.38 0.72 0.67 0.16 0.24 0.26 Average
Population Weighted 0.28 0.68 0.64 0.10 0.17 0.18 Average
w/o Ohio &Delaware

58
Table 3Property Tax Revenues
Per CapitaProperty
PropertyTax Share
Per CaptiaRevenues
TaxRevenues
of TotalRevenue
Net ofLoans
1835 to 1842 to 1835 to 1842 to 1835 to 1842 to1841 1851 1841 1851 1841 1851
MA 0.01 0.04 0.01 0.04 1.04 1.08 MD 0.03 0.87 0.02 0.50 1.62 1.73 NY 0.01 0.14 0.00 0.08 1.45 1.72 PA 0.02 0.53 0.02 0.37 1.58 1.43 RI 0.00 0.05 0.00 0.10 0.56 0.47 DE 0.01 0.00 0.03 0.00 0.39 0.43 SC 0.00 0.00 0.01 0.00 0.50 0.56 NC 0.03 - 0.19 0.18 -
weighted 0.01 0.25 0.02 0.16 1.21 1.28 average
CT 0.14 0.13 0.47 0.50 0.29 0.27 NH 0.19 0.20 0.94 0.80 0.21 0.25 VT 0.21 0.23 0.34 0.77 0.60 0.30
weighted 0.18 0.18 0.58 0.68 0.37 0.27 average
IL 0.14 0.22 0.26 0.82 0.54 0.26 IN 0.23 0.34 0.84 0.28 0.28 1.23 OH 0.21 0.52 0.27 0.46 0.80 1.11 AK 0.33 0.18 0.88 0.29 0.37 0.65 MS 0.29 0.62 0.54 0.46 0.53 1.35 KY 0.25 0.27 0.40 0.63 MI 0.80 1.21 0.28 0.56 2.88 2.15
weighted 0.25 0.45 0.43 0.51 0.59 0.90 average
National 0.11 0.32 0.20 0.33 0.94 1.07 weightedaverage

59
Table 4Price Differentials Cincinnati and New York
Bushel of Flour
1816-1820 1856-1860
Price in East $8 $5
Difference in Price $2.48 $0.28
Price in West $5.52 $4.72
Interest Rate 24% 8%
Interest Paid $0.33 $0.09
Interest as Percentage of 13% 34%Price Differential
Interest as Percentage 6.0% 2.0%of Price in West
Price 1816-1820 $2.48 Differential 1821-1825 $2.81 Over time 1826-1830 $1.78
1831-1835 $1.43 1836-1840 $1.02 1841-1845 $1.37 1846-1850 $1.68 1851-1855 $1.36 1856-1860 $0.28

60
Table 5Federal Transportation Expenditures
1800 to 1860
NotBy Function Level Share Itemized Itemized
Unspecified Navigation $14,240 0.26 $14,240 Roads $9,821 0.18 $9,821 Harbors $8,256 0.15 $7,737 $519 Coastal Navigation $7,428 0.14 $5,511 $1,917 Rivers $5,845 0.11 $5,327 $518 Public Land Funds $4,745 0.09 $4,745 Canals $1,917 0.03 $1,917 Internal Navigation $1,695 0.03 $1,692 $3 Other $940 0.02 $940
Total $54,888 1.00 $36,750 $18,137
Itemized Total $36,750 0.67 NonItemized Total $18,138 0.33
By Decade
1800-1809 $193 0.01 1810-1819 $1,931 0.05 1820-1829 $4,465 0.12 1830-1839 $16,365 0.45 1840-1849 $3,178 0.09 1850-1859 $9,790 0.27
1800-1860 $36,750 1.00
By Region
New England $3,185 0.09 Mid-Atlantic $4,260 0.12 East-North Central $10,006 0.27 West-North Central $2,414 0.07 South Atlantic $9,340 0.25 East-South Central $3,081 0.08 West-South Central $3,152 0.09 Mountain $663 0.02 Pacific $648 0.02
Total $36,750 1.00
Source: Malone, 1998, Tables 2.1, 2.2, 3.1, and 3.3.Note: Non-Itemized Rivers and Harbors were reported as $1,037,521; I have divided them equally between "Rivers" and "Harbors."

61
Table 6Banks and Bank Capital and
State Investments in Banks in 1837
State BankInvestment Debt
Capital Bank Share of ShareState Banks Capital per Bank Debt Capital All Debt
(1) (2) (3) (4) (5) (6)ME 55 5,226,700 95,031 --- --- --- NH 27 2,839,508 105,167 --- --- --- VT 6 510,000 85,000 --- --- --- MA 123 37,074,690 301,420 --- --- --- RI 62 9,837,171 158,664 --- --- --- CT 31 8,744,697 282,087 --- --- ---
NY 98 37,101,460 378,586 --- --- --- NJ 25 4,142,031 165,681 --- --- --- PA 49 23,750,338 484,701 --- --- --- DE 4 818,020 204,505 --- --- --- MD 21 10,438,655 497,079 --- --- --- DC 7 2,204,415 314,916 --- --- ---
VA 5 6,731,200 1,346,240 --- --- --- NC 3 2,525,000 841,667 --- --- --- SC 10 8,636,118 863,612 --- --- --- GA 16 11,438,828 714,927 --- --- --- FL 4 2,046,710 511,678 1,500,000 73% 100%
AL 3 7,572,176 2,524,059 7,800,000 103% 72%LA 16 36,769,455 2,298,091 22,950,000 62% 97%MS 9 12,872,815 1,430,313 7,000,000 54% 100%TN 3 5,092,665 1,697,555 3,000,000 59% 42%
KY 4 7,145,326 1,786,332 2,000,000 28% 27%MO 1 250,000 250,000 2,500,000 100% 100%IL 2 2,014,760 1,007,380 3,000,000 149% 26%IN 1 1,585,481 1,585,481 1,390,000 88% 12%OH 32 9,247,296 288,978 --- --- --- MI 9 1,400,000 155,556 --- --- ---
TOTAL 627 293,015,515 467,329
Regional Shares Banks Capital Capital PerBank
New England 48% 22% 211,292 Mid Atlantic 33% 27% 384,583 South Atlantic 6% 11% 825,733 South West 5% 21% 2,009,907 North West 8% 7% 441,691

62
Table 7Total State debt and debt per capita in 1841,
and whether a State defaulted.
State Total Debt Debt PC Default?1841 1841
FL $4,000,000 $74.07 YLA $23,985,000 $68.14 Y
MD $15,214,761 $32.37 YIL $13,527,292 $28.42 Y
AK $2,676,000 $27.31 Y
MI $5,611,000 $26.47 YAL $15,400,000 $26.06 NPA $33,301,013 $19.32 YMS $7,000,000 $18.62 YIN $12,751,000 $18.59 Y
NY $21,797,267 $8.97 NMA $5,424,137 $7.35 NOH $10,924,123 $7.19 NWI $200,000 $6.45 NSC $3,691,234 $6.21 N
TN $3,398,000 $4.10 NKY $3,085,500 $3.96 NME $1,734,861 $3.46 NVA $4,037,200 $3.23 N
MO $842,261 $2.19 N
GA $1,309,750 $1.90 NNH $0 $0.00 NCT $0 $0.00 NVT $0 $0.00 NRI $0 $0.00 N
NC $0 $0.00 NNJ $0 $0.00 NDE $0 $0.00 N
Notes: Debt in 1841 and 1880 taken from 1880 Census.
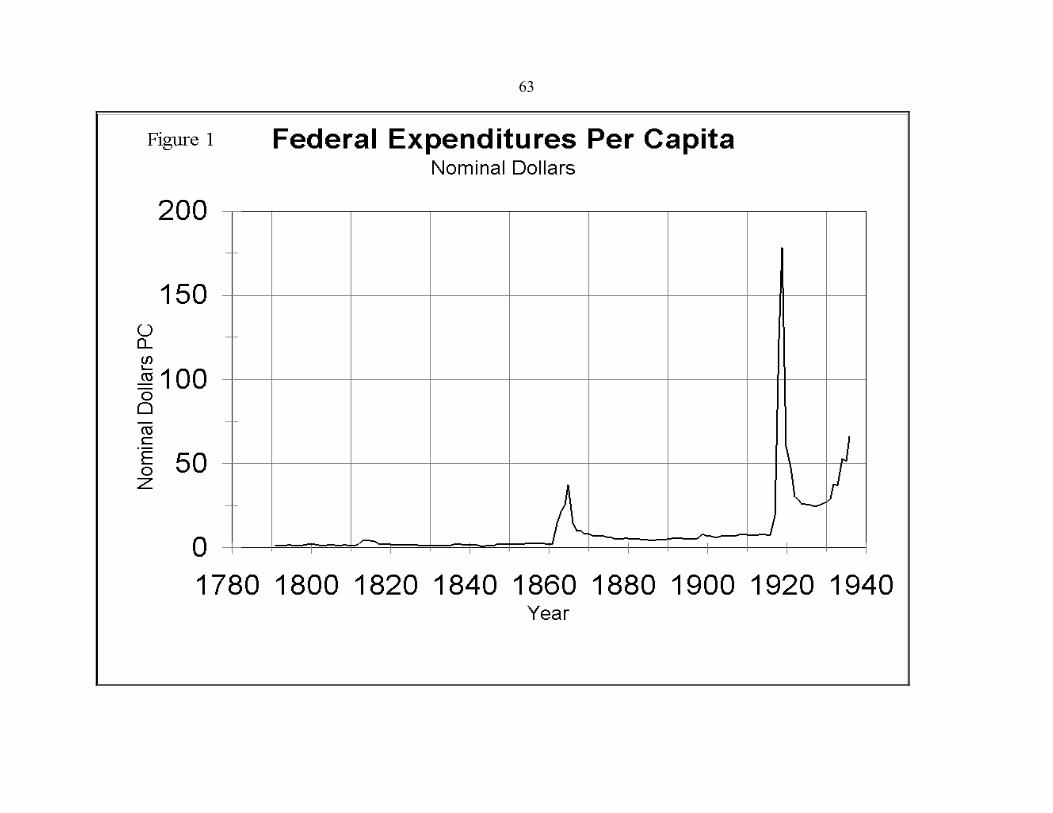
63

64
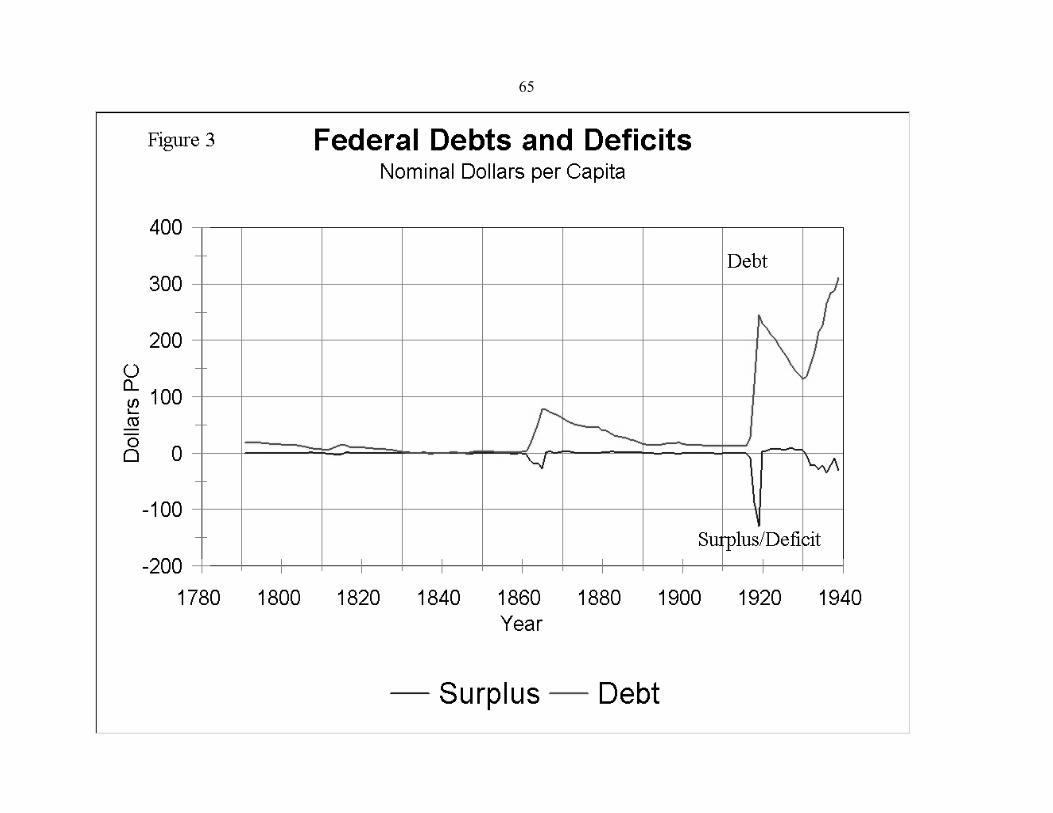
65

66

67

68
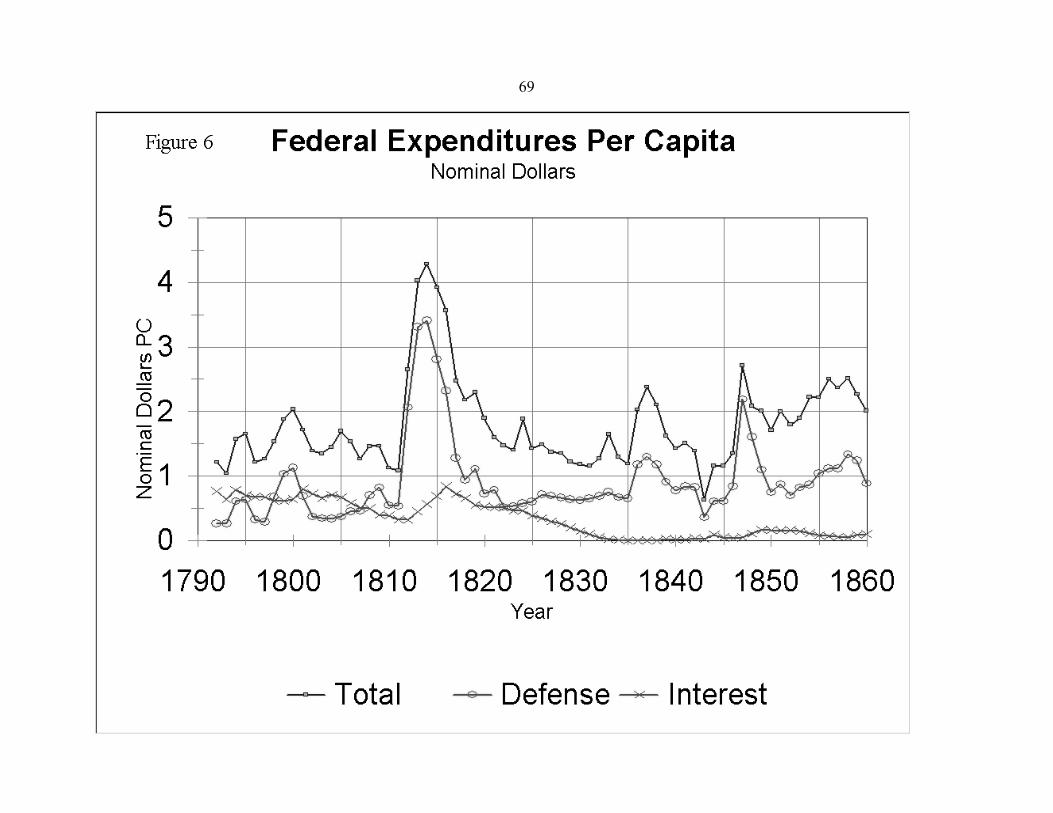
69

70

71

72

73

74

75