Embed Size (px)
Citation preview

American Association of Ports Authorities
Current State of Port Financing Alternatives
June 9, 2008
David C. MillerManaging Director

1
Presentation Topics
• Overview of Current Conditions in the Muni Market
• Impact of Credit Crisis on Tax-Exempt Borrowers
• Overview of Current Conditions in the Bank/P3 Markets
• Impact of Credit Crisis on P3 Transactions

2
Subprime Lending
• Making loans to borrowers who do not qualify for best market rates because credit history is less than ideal.
– Benefits – Gives credit to people who would not otherwise have access to the credit markets
– Downsides – Can likely lead to default, seizure of collateral and foreclosures

3
Housing Bust
Existing and New Home Sales
Source: Bloomberg

4
Housing Bust
Home ValuesJanuary 2003 – December 2007
Source: Bloomberg
-10.00%
-5.00%
0.00%
5.00%
10.00%
15.00%
20.00%
Mar
-03
Jun
-03
Sep
-03
Dec
-03
Mar
-04
Jun
-04
Sep
-04
Dec
-04
Mar
-05
Jun
-05
Sep
-05
Dec
-05
Mar
-06
Jun
-06
Sep
-06
Dec
-06
Mar
-07
Jun
-07
Sep
-07
Dec
-07

5
1. Consumers finance acquisition of real estate, auto, etc. by debt (mostly subprime, ALT/A, No Doc/Low Doc, etc.)
2. This paper is originated by brokers, mid/small/micro-cap banks, thrifts and others
3. This paper is sold primarily to 25 or so of the largest U.S. banks. Some selling banks rely on proceeds as a source of primary liquidity, some do not
4. The large banks bundled and “tranched”these assets into securities tailor-made and sold primarily to the hedge fund universe of buyers. Big banks rely on proceeds as primary sources of liquidity
5. Hedge funds sell to limited partner interests to investors
Prices Decline
Liquidity & Profits dry Up
Exposure to falling asset prices
Credit Freezes Up; Borrowing costs higher & terms “tighter”
Less liquidity and leverage leads to further declines in asset values
Downward de-leveraging spiral
6. Large banks and brokers also provide liquidity lines of credit to hedge funds on a margin or repo basis
Credit Market Update

6
Muni Debt Market Update
Credit spreads are up, without regard to credit risk

7
Flight-to-Quality in U.S. Bond Market
2-yr Treasury (299) bps2-yr MMD (130) bps30-yr Treasury (43) bps30-yr MMD 63 bps
Change in Yields since January 1, 2007
Rate Changes (January 2007 - Present)
1.0
1.5
2.0
2.5
3.0
3.5
4.0
4.5
5.0
5.5
6.0
1/1/2007 3/1/2007 5/1/2007 7/1/2007 9/1/2007 11/1/2007 1/1/2008 3/1/2008
Ra
te (
%)
2-yr Treasury 2-yr MMD
30-yr Treasury 30-yr MMD

8
Flight-to-Quality in U.S. Bond Market
30 year TSY vs. Bond Buyer RBI
4.00
4.25
4.50
4.75
5.00
5.25
5.50
1/1
/07
2/1
/07
3/1
/07
4/1
/07
5/1
/07
6/1
/07
7/1
/07
8/1
/07
9/1
/07
10/1
/07
11/1
/07
12/1
/07
1/1
/08
2/1
/08
3/1
/08
4/1
/08
Rat
e (%
)
30 Year Bond Bond Buyer RBI

9
Bond Insurance Turmoil– Bond insurers – the same ones insuring muni bonds – insured much
of the mortgage backed financial securities
– FSA and Assured Guaranty are the only AAA insurers with stable ratings from all three agencies
Insurer Moody's Investor ServicesStandard & Poor's Rating
ServicesFitch Rating Services
FSA Aaa / Stable AAA / Stable AAA / Stable
Assured Guaranty Aaa / Stable AAA / Stable AAA / Stable
Radian Asset Assurance Aa3 / Negative AA / Negative Watch
MBIA Aaa / Negative AA / Negative AA / Negative
CIFG Ba2 / Watch Developing A+ / Negative CCC / Evolving Watch
Ambac Aaa / Negative AA / Negative AA / Negative
FGIC Baa3 / Negative Watch BB / Negative BBB / Negative
XL Capital Assurance A3 / Negative Watch A- / Negative Watch BB / Negative
ACA Not Rated CCC / Developing Watch Not Rated
10
Bond Insurance Market
• FSA and Assured Guaranty only insurers without material impact on trading value
• Other bond insurers (MBIA, Ambac, FGIC, XL, CIFG, Radian) are trading on underlying credit of the Issuer.
– Investors look past bond insurance in a credit review
• Insurance premiums are higher from FSA and Assured Guaranty than in the past.
– Focus on capital charges for the rating agency requirements.
• FSA and Assured Guaranty will likely tighten underwriting conditions based on favorable market position.

11
Bond Insurance Market for New Deals
0 bps
10 bps
20 bps
30 bps
40 bps
50 bps
60 bps
70 bps
80 bps
Spring '07 Spring '08
Bo
rro
win
g C
ost
s
Additional Cost (Assured)
Bond Insurance
Spread to MMD
Assured Guaranty - 10 bps

12
Growth in the Variable Rate Market
• Over the past 10 years, the variable rate market doubled -- most of the
growth from Auction Rate Securities (ARS)
• ARS were attractive for borrowers because they traded at lower rates
than VRDO’s and did not require liquidity support
VRDO vs. Auction Rate Issuance
-
10,000
20,000
30,000
40,000
50,000
60,000
70,000
80,000
90,000
100,000
110,000
1998 1999 2000 2001 2002 2003 2004 2005 2006 2007
Variable Rate Auction Rate
($)
Mil
lio
ns

13
Meltdown of the Auction Rate Market
• Meltdown of the auction rate market was driven
by several factors
– 1) Investor demand for liquidity
-- ARS do not have a put option for investors
-- Investors view ARS as illiquid
– 2) Turmoil with bond insurers that insure most ARS
– 3) Capital pressure on broker-dealers limit their ability to support auctions

14
Failed Auctions
• A “Failed Auction” is an auction without enough orders to
produce a clearing rate to place the ARS
– Failed auction interest rate can be high rate or formula rate (% of a market index), depending on the auction documents
• ARS priced increasingly poorly through the fall and winter
– Pricing changed from below SIFMA to far above SIFMA
• Week of February 11th -- widespread meltdown of auction
market
– Vast majority of ARS with “failed auctions” or auctions with very high rates

15
ARS Conversion Options

16
Future of Auction Rate Securities Market
• Consensus market view is that the auction rate market is
defunct
– Most borrowers refinancing or converting ARS to other instruments, in particular to fixed put and VRDBs
– Currently pressure on the traditional fixed rate markets with many institutions refinancing to a traditional fixed rate
• See Prior Discussion of:
– Higher Tax-Exempt Rates
– Higher Insurance Costs

17
Pressure in the Variable Rate Demand Market
• VRDB market has some difficulties too
• Insured VRDBs with external liquidity provider
– Liquidity agreement usually has termination trigger tied to insurer rating
– Downgrades of insurers cause flight from insured VRDBs.
• Insured VRDBs are trading at wide spreads to SIFMA
• Many examples of failed remarketing of insured VRBDs
• Generally, VRDBs backed by a Letter of Credit (rather than an
insurer) have been performing well and trading at or through SIFMA.
• Supply of Letters of Credit is limited and pricing is increasing
significantly.

18
Subprime Impact to Swap Markets
• Increased focus on counterparty risk as several counterparties have faced downgrades
– Terms in the Credit Support Annex outline the situation in which swap counterparties must post collateral as credit protection
• In some instances of insured swaps a downgrade to the bond insurer may trigger a collateral event in which Issuers may need to post collateral to swap counterparties depending on the severity of insurer downgrade and provisions in the swap documents
BondholdersBondholdersBondholders
SwapCounterparty
SwapCounterparty
Typically these ratesmatch, but currently they are out of sync
Variable Swap Rate
(SIFMA)
Fixed Swap Rate
Borrower(XYZ)
BorrowerBorrower(XYZ)(XYZ)
Variable Bond Rate
19
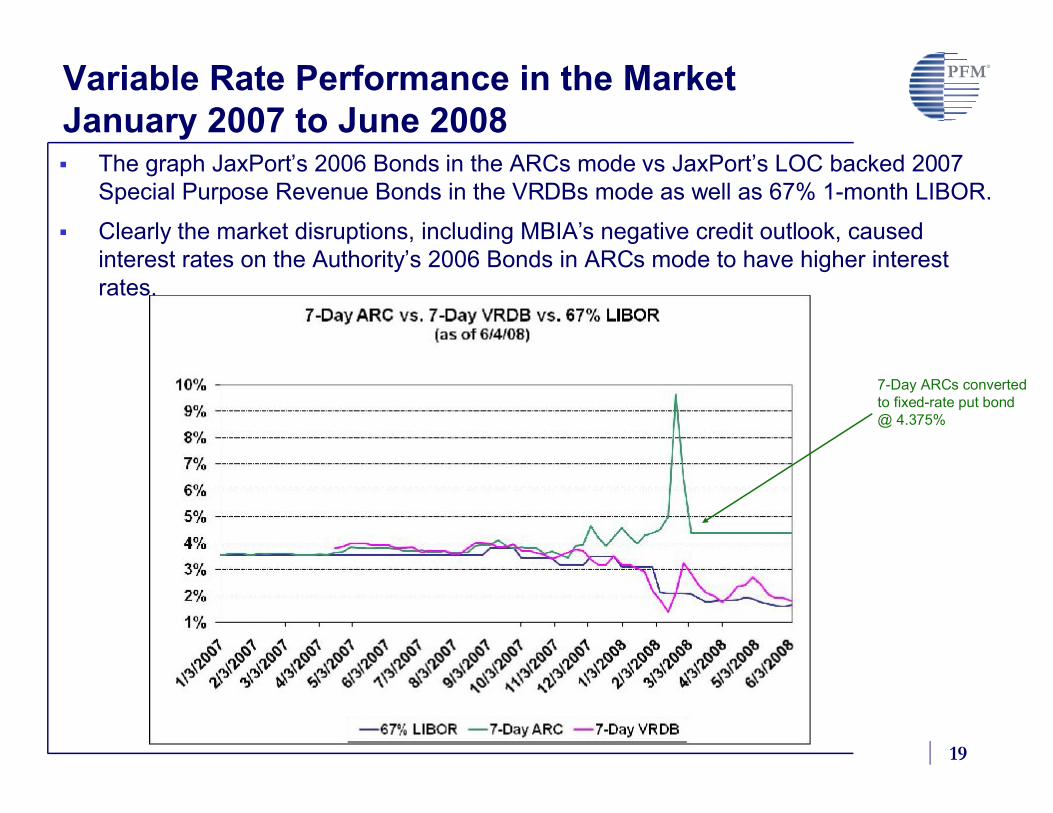
Variable Rate Performance in the MarketJanuary 2007 to June 2008
7-Day ARCs converted to fixed-rate put bond @ 4.375%
The graph JaxPort’s 2006 Bonds in the ARCs mode vs JaxPort’s LOC backed 2007 Special Purpose Revenue Bonds in the VRDBs mode as well as 67% 1-month LIBOR.
Clearly the market disruptions, including MBIA’s negative credit outlook, caused interest rates on the Authority’s 2006 Bonds in ARCs mode to have higher interest rates.

20
So What is the “Takeaway”
• Credit enhancement was cheap and accessible, so ratings were less important – The pendulum has swung back
• New Money
– Credit rating matters – Credit spreads have widened
– Insurance premiums have increased significantly
– LOC providers have become very selective on their exposures
• Existing VRDOs & ARS
– Increase in failed auctions
• Reset rate approaching max rate
– $ 200/300 billion of ARS/VRDOs are currently in the process of being converted or refunded
– Liquidity for VRDOs is difficult to obtain
Credit Spreads
0%
1%
2%
3%
4%
5%
6%
1/2/07 3/2/07 5/2/07 7/2/07 9/2/07 11/2/07 1/2/08 3/2/08
Ra
te
0
20
40
60
80
100
120
Sp
rea
d (
bp
s)
AA Spread A Spread AAA GO 20 yr AA GO 20 yr A GO 20 yr
Yield Curve Comparison
0%
1%
2%
3%
4%
5%
6%
1 3 5 7 9 11 13 15 17 19 21 23 25 27 29
Year Maturity
Ra
te
Current Last Year

Historical Perspective
21

22
Range of Port Financing Options
Financing ApproachPublic AgencyTax-Backed
Public AgencyOperating Revenues
Public PrivatePartnership
Private Concession
Operating Model Public Operator Public Operator/ Landlord Long Term Landlord Passive Landlord
Primary Management Control
Public Public Public-Private Private
Typical Contracts &Lease Agreement
N/A for Grants & Tax Revenues
Multiple Tenants;Variable Contracts
Discretionary Terms
Single Tenant;Long Term
Must Cover Debt
Single Tenant;Longest Term to Cover Debt &
Equity Return
Typical Facilities Financed
Public Use; Infrastructure such as Roads and Dredging
Private Activity;Docks, Wharves, Cranes,
Warehouses, Buildings, etc.
Private Activity;Docks, Wharves, Cranes,
Warehouses, Buildings, etc.
Private Activity;Docks, Wharves, Cranes,
Warehouses, Buildings, etc.
Sources of Revenues and Security for Debt
Grants,Gov’t Transfers,
Taxes
Tariffs, Throughput Fees, Security Fees, Facility Lease
Revenue, etc.
Corporate RentalMinimum Guarantee& Throughput Fees
Tariffs/Lease Revenue, etc.Received by Private
Concessionaire
Type of Debt Agency Revenue Bonds Agency Revenue BondsAgency Special Purpose
Conduit BondsCorporate Debt & Private
Equity
Tax Status/ TermGov’t Purpose & AMT Tax-
Exempt10-30 years
Gov’t Purpose & AMT Tax-Exempt
10-30 years
AMT Tax-Exempt20-40 years
Taxable Debt50–99 years
Primary Private Partners
Shipping Company, Railroads,
Private Haulers/Trucks
Shipping Company, Railroads,Private Haulers/Trucks,
Terminal Operator
Terminal Operator/ Corporate Guarantor
(likely operator parent and/or shipping co)
Private Equity Concessionaire

P3 Investors Fundamentally Differ from Bondholders
• Bondholders are passive lenders
– Seek timely payment of principal and interest
– Investment decisions are based on third-party evaluations and “done deals”
– Rating agencies and credit enhancement are key
• P3 investors are active business partners
– Interested in profit, in equity return, in risk allocation and in regulation
– P3 investor will perform their own technical due diligence
– The business structure creates the credit, which in turn defines the financing options
23

Typical P3 Financial Structures
• Generally taxable, in order to get benefit of tax ownership (interest deductions and depreciation)
• Initial equity 20-30 percent depending on strength of revenues;
• Re-leveraged to maximize equity return
• Return on equity targets for “greenfield” projects in the mid-teens percent due to high project risks
• Lower for mature “brownfield” projects
• Bank financing, not bonds, with construction loans flipping into tiered debt
• Maximum use of interest-only structures to get highest leverage possible
24

25
Typical P3 Financial Structures
Net
Rev
enu
e $
Equity
Taxable bonds / Bank loans
Net Revenue Curve
Project Debt Service
Year 0 Year 40 Year 99
• Municipal bonds monetize 40 years of value. While equity investors will take risk to 99 years of cash flow, to enhance the present value payment.
• Municipal issuers get none of the advantages of tax-exemption with a P3 finance approach.
• Cash flows monetized by equity are typically discounted back at rates of 12% to 18% for a “greenfield” facility.

26
Large losses at large banks constrained industry profitability
• The nation’s 8 largest banks accounted for 60% of the industries
spiraling decline in net income in the 4th quarter of 2007__________
Source: American Banker
P3 Debt Market Update

27
3-Month LIBOR - 3-Month Treasury Bill Spreads (January 1, 1993 - Present)
0.00
0.50
1.00
1.50
2.00
2.50
1/1/1993
1/1/1994
1/1/1995
1/1/1996
1/1/1997
1/1/1998
1/1/1999
1/1/2000
1/1/2001
1/1/2002
1/1/2003
1/1/2004
1/1/2005
1/1/2006
1/1/2007
1/1/2008
Spr
ead
(%)
Credit Spreads Widen on Subprime Mortgage Woes
• Yield difference or spread between risk-free (Treasury bills) and risky (LIBOR deposits) assets historically widens during financial stress
Average 0.43 %Minimum (0.06)%Maximum 2.40 %
U.S. sub-prime mortgage crisis
Russian debt default crisis
28
P3 Debt Market Update
Below the largest institutions, banks are not burdened with substantial stranded “bad assets” from failed asset securitizations.
Because banks in some states have not experienced a rapid decline in residential and commercial real estate values, the banks who compete in those states are much better off than peer banks in many other states
Therefore, on the debt side of P3s, interest from mid-caps and small-cap banks located outside of problematic geographic markets is still strong
Credit matters – investment grade is required – and the more stringent debt covenants reduce leverage
Exotic debt structures and subordinate debt will be limited – again, less leverage
More equity participation required

29
P3 Equity Availability
Source: Private Equity Intelligence, Ltd.
• There continues to be a tremendous amount of liquidity in the U.S. private
equity markets waiting to be deployed
• Strong fundraising throughout 2007, despite turmoil in the debt markets

30
P3 Market Update
Cumulative impact leading to lower purchase price multiples for deals and higher equity contribution rates, esp larger deals (41% for Penn Turnpike).
__________Note: Large defined as issuers with EBITDA of more than $50 million and Middle Market defined as issuers with EBITDA of $50 million or less(1) Includes transaction fees and expensesSource: Standard & Poor’s
(1) (1) (1)(1)
Average Purchase Price Multiples and Equity Contribution of Middle Market LBOs
30.4%34.9% 37.3%
9.70x 9.94x9.13x
0.0%
5.0%
10.0%
15.0%
20.0%
25.0%
30.0%
35.0%
40.0%
45.0%
50.0%
2Q'07 3Q'07 4Q'07
Ave
rag
e E
qu
ity
Co
ntr
ibu
tio
n
0.0x
2.0x
4.0x
6.0x
8.0x
10.0x
12.0x
Ave
rag
e P
urc
ha
se P
rice M
ultip
le
Average Equity Contribution (%) Average Purchase Price Multiple
Average Purchase Price Multiples and Equity Contribution of Large LBOs
29.8% 29.9% 31.7%
10.84x10.23x 9.97x
0.0%
5.0%
10.0%
15.0%
20.0%
25.0%
30.0%
35.0%
40.0%
45.0%
50.0%
2Q'07 3Q'07 4Q'07
Ave
rag
e E
qu
ity
Co
ntr
ibu
tio
n
0.0x
2.0x
4.0x
6.0x
8.0x
10.0x
12.0x
Ave
rag
e P
urc
ha
se P
rice M
ultip
le
Average Equity Contribution (%) Average Purchase Price Multiple

P3 “Takeaway”
31
Increased credit spreads and diminishing bank debt mean that a focus on strong economic & credit fundamentals will be very important
Market is still available for good projects but probably not at values as high as in the past, especially for larger projects
Strategic maritime & intermodal industry participants will continue to look for investment opportunities
Public ports should consider and compare the full range of project development and financing options

Questions??
32
David C. Miller
Managing Director
Public Financial Management, Inc.
407-648-2208