Embed Size (px)
Citation preview
Kamoto Copper Company
AMENDED TECHNICAL REPORT FOR
KAMOTO COPPER COMPANY KOLWEZI, KATANGA PROVINCE,
DEMOCRATIC REPUBLIC OF THE CONGO
PREPARED FOR KATANGA MINING LIMITED
Compiled by: McIntosh RSV LLC
Qualified Persons: Dr. Scott Jobin-Bevans, P. Geo.; CCIC Mr. Malcolm Paul Lotriet; Pr. Eng., FSAIMM; RSV Mr. Christian Heili, Pr. Eng., FSAIMM; Hatch Mr. Adriaan Meintjes; SRK Mr. Alan Naismith; SRK Date: June 23, 2006
Kamoto Copper Company
AMENDED TECHNICAL REPORT
KAMOTO REDEVELOPMENT PROJECT
File reference - 701-001-01-0000-00-CM-0010 Page 2 of 204
Contents 1.0 TITLE PAGE 2.0 CONTENTS 3.0 SUMMARY .............................................................................................................................10
3.1 Background....................................................................................................... 10 3.2 Property ............................................................................................................ 10 3.3 Geology ............................................................................................................ 11 3.4 Reserves and resources................................................................................... 11 3.5 Operations ........................................................................................................ 14 3.6 Financial summary............................................................................................ 16 3.7 Recommendations............................................................................................ 18
4.0 INTRODUCTION ....................................................................................................................19 4.1 Technical Report preparation............................................................................ 21 4.2 Purpose for which the Report was prepared..................................................... 24 4.3 Sources of information...................................................................................... 25 4.4 Scope of the personal inspection of the Property ............................................. 26
5.0 RELIANCE ON OTHER EXPERTS .......................................................................................28 6.0 PROPERTY DESCRIPTION AND LOCATION......................................................................29
6.1 The area of the Property................................................................................... 29 6.2 Location ............................................................................................................ 29 6.3 Type of mineral tenure...................................................................................... 29 6.4 The nature and extent of title ............................................................................ 31 6.5 Property boundaries ......................................................................................... 32 6.6 Royalties and rights .......................................................................................... 33 6.7 Environmental liabilities .................................................................................... 33 6.8 Permitting ......................................................................................................... 34
7.0 ACCESSIBILITY, CLIMATE, LOCAL RESOURCES, INFRASTRUCTURE AND PHYSIOGRAPHY............................................................................................................................34
7.1 Topography, elevation and vegetation.............................................................. 34 7.2 Means of access to the Property ...................................................................... 35 7.3 Proximity of the Property to a population centre ............................................... 35 7.4 Climate ............................................................................................................. 36 7.5 Local resources and infrastructure.................................................................... 37
8.0 HISTORY................................................................................................................................38 8.1 Prior ownership of the Property ........................................................................ 39 8.2 Exploration and development work undertaken by UMHK and Gécamines...... 40 8.3 Historical mineral resource and mineral reserve estimates .............................. 40
Kamoto Copper Company
AMENDED TECHNICAL REPORT
KAMOTO REDEVELOPMENT PROJECT
File reference - 701-001-01-0000-00-CM-0010 Page 3 of 204
8.4 Historical production from the Property............................................................. 42 9.0 GEOLOGICAL SETTING.......................................................................................................45
9.1 Regional ........................................................................................................... 45 9.2 Tectonic setting................................................................................................. 47 9.3 Basement to the Katangan Basin ..................................................................... 48 9.4 Katangan Basin ................................................................................................ 48 9.5 Depositional setting .......................................................................................... 50 9.6 Local (to sub-regional) geology......................................................................... 50 9.7 General stratigraphy ......................................................................................... 52 9.8 Property geology............................................................................................... 57
10.0 DEPOSIT TYPES ...................................................................................................................62 10.1 Mineral deposit type being investigated............................................................ 62 10.2 Geological model .............................................................................................. 62
11.0 MINERALIZATION.................................................................................................................66 11.1 Geological controls on mineralization ............................................................... 67 11.2 Source of the copper metal............................................................................... 67 11.3 Mineralization models ....................................................................................... 68 11.4 Supergene enrichment ..................................................................................... 69
12.0 EXPLORATION......................................................................................................................69 13.0 DRILLING...............................................................................................................................69
13.1 Kamoto Mine..................................................................................................... 70 13.2 DIMA................................................................................................................. 70 13.3 Musonoie – T17 West....................................................................................... 71
14.0 SAMPLING METHOD AND APPROACH..............................................................................71 15.0 SAMPLE PREPARATION, ANALYSES AND SECURITY....................................................71
15.1 Sample curatorship........................................................................................... 71 15.2 Sample preparation .......................................................................................... 72 15.3 Preparation for analysis .................................................................................... 72 15.4 Quality control................................................................................................... 73 15.5 Quality control measures .................................................................................. 73 15.6 Adequacy of sample preparation ...................................................................... 73
16.0 DATA VERIFICATION ...........................................................................................................73 16.1 Quality controls ................................................................................................. 74
17.0 ADJACENT PROPERTIES....................................................................................................75 18.0 MINERAL PROCESSING AND METALLURGICAL TESTING.............................................76 19.0 MINERAL RESOURCE AND MINERAL RESERVE ESTIMATES........................................77
Kamoto Copper Company
AMENDED TECHNICAL REPORT
KAMOTO REDEVELOPMENT PROJECT
File reference - 701-001-01-0000-00-CM-0010 Page 4 of 204
19.1 Database .......................................................................................................... 77 19.2 Geological interpretation................................................................................... 79 19.3 Density determination ....................................................................................... 82 19.4 Univariate Statistics .......................................................................................... 84 19.5 Variography ...................................................................................................... 87 19.6 Block modelling................................................................................................. 90 19.7 Grade interpolation ........................................................................................... 91 19.8 Validation of estimation..................................................................................... 91 19.9 Reserve and resource estimation ..................................................................... 99 19.10 Responsibility for estimation .......................................................................... 103
20.0 OTHER RELEVANT DATA AND INFORMATION...............................................................103 21.0 INTERPRETATIONS AND CONCLUSIONS .......................................................................103
21.1 Geology .......................................................................................................... 103 22.0 RECOMMENDATIONS ........................................................................................................104
22.1 Recommendation............................................................................................ 104 22.2 Exploration...................................................................................................... 105
23.0 REFERENCES .....................................................................................................................106 24.0 DATE AND SIGNATURE PAGE..........................................................................................110 25.0 REQUIREMENTS FOR TECHNICAL REPORTS ON DEVELOPMENT AND PRODUCTION PROPERTIES................................................................................................................................111
25.1 Underground mining operations...................................................................... 111 25.2 Open pit mining operations............................................................................. 138 25.3 Process operations ......................................................................................... 153 25.4 Power, water and tailings................................................................................ 161 25.5 Environmental considerations......................................................................... 165 25.6 Taxes and royalties......................................................................................... 168 25.7 Capital and operating costs ............................................................................ 168 25.8 Economic analysis .......................................................................................... 180 25.9 Human and social issues................................................................................ 185
26.0 APPENDICES ......................................................................................................................187 26.1 Copies of Mineral Concession certificates ...................................................... 187 26.2 Glossary ......................................................................................................... 200
Kamoto Copper Company
AMENDED TECHNICAL REPORT
KAMOTO REDEVELOPMENT PROJECT
File reference - 701-001-01-0000-00-CM-0010 Page 5 of 204
TABLES Table 3-1 Mineral reserve - open pits ................................................................................12 Table 3-2 Mineral reserve – underground..........................................................................12 Table 3-3 Mineral resource - open pits .............................................................................13 Table 3-4 Mineral resource – underground........................................................................13 Table 3-5 Fleet requirements.............................................................................................15 Table 3-6 Selected mills ....................................................................................................16 Table 6-1 Perimeter co-ordinates of the various concession areas ...................................30 Table 7-1 Kolwezi Monthly Average Rainfall (mm) ............................................................36 Table 7-2 Daily storm rainfall (mm)....................................................................................36 Table 7-3 Summary of the monthly temperature for Kolwezi between 1953 and 1977......37 Table 7-4 Humidity data for Kolwezi ..................................................................................37 Table 8-1 Gécamines reported historical “reserve” values for the Project in 1999 ............41 Table 8-2 Historical production from the Property 1969-2005 (source is Gécamines data)44 Table 9-1 Lithostratigraphy of the Katangan succession in the DRC and Zambia from
Kampunza et al., (2005)..................................................................................49 Table 9-2 Lithostratigraphy of the RAT and mines subgroups in the Katangan belt of the DRC
from Kampunza et al. (2005)...........................................................................52 Table 16-1 Original Gécamines and audited Cu and Co percentages for check samples from
each of the main resource areas on the Project..............................................74 Table 16-2 Analytical results of Lakefield against set point values ....................................75 Table 19-1 Summary of data source .................................................................................78 Table 19-2 Spatial properties for the three resource areas................................................82 Table 19-3 Ore types and densities as supplied by Gécamines ........................................82 Table 19-4 Density values for DDH cores from the various resource areas on the Project84 Table 19-5 Summary of drill hole statistics, per resource area, per stratigraphic unit for total
copper .............................................................................................................85 Table 19-6 Summary of drillhole statistics, per resource area, per stratigraphic unit for cobalt
........................................................................................................................86 Table 19-7 Summary of cutting statistics ...........................................................................87 Table 19-8 Kamoto underground copper variogram models..............................................88 Table 19-9 Kamoto underground cobalt variogram models ...............................................88 Table 19-10 Musonoie-T17 copper variogram models ......................................................88 Table 19-11 Musonoie-T17 cobalt variogram models........................................................88 Table 19-12 Dikuluwe copper variogram models...............................................................89 Table 19-13 Dikuluwe cobalt variogram models ................................................................89 Table 19-14 Mashamba West copper variogram models ..................................................89 Table 19-15 Mashamba West cobalt variogram models....................................................89 Table 19-16 Mashamba East copper variogram models ...................................................90 Table 19-17 Mashamba East cobalt variogram models.....................................................90 Table 19-18 Block Model statistics per resource area .......................................................90 Table 19-19 Kamoto cut-off grade parameters ..................................................................99
Kamoto Copper Company
AMENDED TECHNICAL REPORT
KAMOTO REDEVELOPMENT PROJECT
File reference - 701-001-01-0000-00-CM-0010 Page 6 of 204
Table 19-20 Kamoto underground reserve statement .....................................................100 Table 19-21 Open pit cut-off grade parameters...............................................................100 Table 19-22 Reserve cut-off grade results.......................................................................100 Table 19-23 Resource cut-off grade results.....................................................................100 Table 19-24 Individual pit reserve statements and consolidated reserve statement........101 Table 19-25 Measured and Indicated Resource Table....................................................102 Table 19-26 Inferred Resource Table..............................................................................103 Table 22-1 Recommended positions for additional underground drill holes at Kamoto Mine105 Table 25-1 Room and Pillar extractable tonnes...............................................................115 Table 25-2 Room and Pillar input parameters .................................................................115 Table 25-3 Long Hole Retreat Stoping extractable tonnes ..............................................120 Table 25-4 Input parameters ...........................................................................................120 Table 25-5 Cut-off grade parameters ..............................................................................124 Table 25-6 Fleet requirement ..........................................................................................126 Table 25-7 Cassette requirement ....................................................................................127 Table 25-8 Common extraction per block ........................................................................132 Table 25-9 Total tonnage extraction per common block (including additional development)133 Table 25-10 Tonnage extraction per common block........................................................134 Table 25-11 Kamoto underground reserve statement .....................................................136 Table 25-12 Generic pit shell parameters........................................................................140 Table 25-13 General parameters.....................................................................................142 Table 25-14 Contractor planning parameters ..................................................................143 Table 25-15 Excavation parameters................................................................................143 Table 25-16 Hauling parameters .....................................................................................144 Table 25-17 Equipment summary....................................................................................145 Table 25-18 Cut-off grade parameters ............................................................................146 Table 25-19 Reserve cut-off grade results.......................................................................146 Table 25-20 Resource cut-off grade results.....................................................................146 Table 25-21 Pit strip ratios and haul distances ................................................................147 Table 25-22 Pit reserve tables.........................................................................................149 Table 25-23 Revised parameters ....................................................................................150 Table 25-24 Musonoie T17 Pit results .............................................................................150 Table 25-25 Mashamba East Pit results ..........................................................................150 Table 25-26 Mashamba West Pit results .........................................................................150 Table 25-27 Dikuluwe Pit results .....................................................................................151 Table 25-28 Estimated pumping rates (m3/hr) over 2 years ............................................152 Table 25-29 Concentrator performance...........................................................................154 Table 25-30 Key plant design parameters.......................................................................159 Table 25-31 Process recovery.........................................................................................161 Table 25-32 Power consumption (MVA) ..........................................................................163 Table 25-33 Level 1 Area of responsibility and summary of capital cost estimate...........170 Table 25-34 Capital costs for initial production build up ..................................................174 Table 25-35 Replacement and ongoing capital requirement ...........................................175
Kamoto Copper Company
AMENDED TECHNICAL REPORT
KAMOTO REDEVELOPMENT PROJECT
File reference - 701-001-01-0000-00-CM-0010 Page 7 of 204
Table 25-36 Capital costs over the life of the project.......................................................175 Table 25-37 Transport costs for copper and cobalt .........................................................178 Table 25-38 Operating cost by phase..............................................................................178 Table 25-39 Operating cost summary .............................................................................179 Table 25-40 Metal price sensitivity ..................................................................................184 Table 25-41 Recovery sensitivity.....................................................................................184 Table 25-42 Capital and operating cost sensitivity ..........................................................185 Table 25-43 DRC economic benefits...............................................................................186
Kamoto Copper Company
AMENDED TECHNICAL REPORT
KAMOTO REDEVELOPMENT PROJECT
File reference - 701-001-01-0000-00-CM-0010 Page 8 of 204
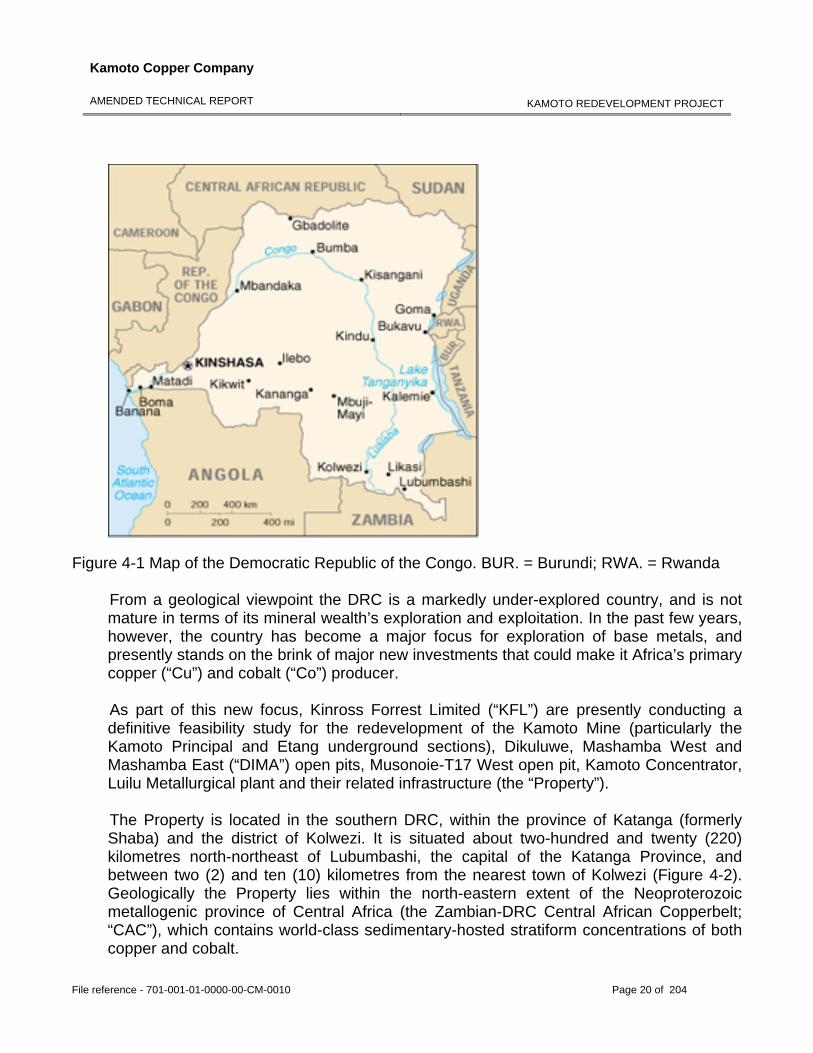
Figures Figure 3-1 Mine ramp-up schedule....................................................................................14 Figure 4-1 Map of the Democratic Republic of the Congo. BUR. = Burundi; RWA. = Rwanda
........................................................................................................................20 Figure 4-2 Locality plan of the property .............................................................................21 Figure 6-1 Area map..........................................................................................................33 Figure 8-1 Gécamines nine “reserve” blocks for the remaining underground resource at
Kamoto Mine (Kamoto Principal and Etang) as at 01/01/2005. Scale 1/1000041 Figure 9-1 Copper-cobalt deposits of the CAC from Robb (2005a) ...................................46 Figure 9-2 Surface geology of the Kolwezi Klippe deposits ...............................................51 Figure 9-3 Generalised stratigraphic section with copper percentages for the economically
significant sequence in the Kolwezi area. .......................................................53 Figure 9-4 Typical DSTRAT showing the included nodules. DDH core Musonoie (MU) 290,
Kolwezi geological survey ...............................................................................55 Figure 9-5 NQ sized DDH core from DIK 171 (Mashamba East) showing weathered RSC with
secondary enrichment of malachite in the network cavity structure. Core length is 10cm ...............................................................................................................56
Figure 9-6 Contact between the RSC and SD1a (or SDB) in the underground workings of the Kamoto Mine...................................................................................................57
Figure 9-7 Three-dimensional block model of the entire Kamoto underground ore body ..58 Figure 9-8 West to East section of the three dimensional block model for the DIMA Resource
area, including Dikuluwe, Mashamba West and Mashamba East. Key as per Figure 9-7...................................................................................................................60
Figure 9-9 Three-dimensional block model for the Musonoie-T17 West area. Key as per Figure 9-7...................................................................................................................61
Figure 11-1 Recrystallised pink feroan dolomite of the lower metre of the RSC, showing the abundance of visible shiny crystals of carrollite (Co2CuS4) .............................67
Figure 16-1 Scatter plot of historical and re-analyzed samples .........................................75 Figure 19-1 Scatter plot showing original and repeat values for total copper ....................78 Figure 19-2 Scatter plot showing original and repeat values for cobalt .............................79 Figure 19-3 Geological model for the Musonoie-T17 Resource Area. Key as for Figure 9-780 Figure 19-4 Geological model for the DIMA Resource Area. Key as for Figure 9-7 ..........80 Figure 19-5 Geology model for the Kamoto Underground resource area..........................81 Figure 19-6 Kamoto trend analysis for copper...................................................................92 Figure 19-7 Kamoto trend analysis for cobalt ....................................................................92 Figure 19-8 Mashamba East trend analysis for copper .....................................................93 Figure 19-9 Mashamba East trend analysis for cobalt.......................................................94 Figure 19-10 Mashamba West trend analysis for copper ..................................................95 Figure 19-11 Mashamba West trend analysis for cobalt....................................................96 Figure 19-12 Dikuluwe trend analysis for copper...............................................................97 Figure 19-13 Dikuluwe trend analysis for cobalt ................................................................97 Figure 19-14 Musonoie-T17 West trend analysis for copper .............................................98
Kamoto Copper Company
AMENDED TECHNICAL REPORT
KAMOTO REDEVELOPMENT PROJECT
File reference - 701-001-01-0000-00-CM-0010 Page 9 of 204
Figure 19-15 Musonoie-T17 West trend analysis for cobalt...............................................98 Figure 25-1 Kamoto 3D orebody .....................................................................................112 Figure 25-2 Kamoto ore body – plan view .......................................................................113 Figure 25-3 Room and Pillar common block....................................................................115 Figure 25-4 Common block development ........................................................................117 Figure 25-5 Pillar areas ...................................................................................................118 Figure 25-6 Stoping areas ...............................................................................................119 Figure 25-7 Plan view – LHRS common block ................................................................119 Figure 25-8 Section view – stope drives. .........................................................................121 Figure 25-9 Section view – stope drives in inclined ore body ..........................................122 Figure 25-10 Etang development layout ..........................................................................123 Figure 25-11 Cut-off grade methodology .........................................................................124 Figure 25-12 Cut-off grade analysis ................................................................................125 Figure 25-13 General arrangement of airflow..................................................................129 Figure 25-14 Development schedule...............................................................................135 Figure 25-15 Production profile .......................................................................................135 Figure 25-16 Schematic layout of underground dams and pump stations.......................137 Figure 25-17 Surface area map.......................................................................................139 Figure 25-18 Consolidated open pit production schedule................................................148 Figure 25-19 Oxide circuit................................................................................................155 Figure 25-20 Sulphide circuit ...........................................................................................156 Figure 25-21 Oxide mixed circuit .....................................................................................157 Figure 25-22 Luilu flowsheet............................................................................................160 Figure 25-23 LoM metal production.................................................................................182 Figure 25-24 LoM cash flow ............................................................................................182
Kamoto Copper Company
AMENDED TECHNICAL REPORT
KAMOTO REDEVELOPMENT PROJECT
File reference - 701-001-01-0000-00-CM-0010 Page 10 of 204
Document Numbering The document numbering system conforms to the contents of document form 43-101F1 Technical Report and section no 1 & 2 are covered by Title Page and Table of Contents.
3.0 SUMMARY 3.1 Background
The Report was compiled by McIntosh RSV LLC. The contributors to the report consisted of a team including: Hatch, who were responsible for the metallurgical and plant engineering studies including mechanical and electrical engineering, as well as surface infrastructure and financial modelling; McIntosh RSV LLC who in association with Caracle Creek International Consulting Inc. (“CCIC”) were responsible for the Resource and Reserve studies, including mine planning; and SRK Consulting Engineers and Scientists (“SRK”) who developed the environmental, tailings, geotechnical and groundwater studies. The data used in this Technical Report is based on the Kamoto Copper Company (“KCC”) Feasibility Study, May 2006, a study prepared through the joint efforts of Hatch, McIntosh RSV LLC, CCIC and SRK. Specific responsibilities for reporting are documented under Section 4.1.
3.2 Property The area under consideration (the “Property”) is located in the southern part of the Democratic Republic of the Congo (“DRC”), within the province of Katanga (formerly Shaba) and the district of Kolwezi. The Property consists of the underground workings at the original Kamoto Mine (including the Kamoto Principal and Etang areas) as well as three variously flooded open pit mine areas; Dikuluwe, Mashamba East and Mashamba West (collectively known as the DIMA pits), and the dry Musonoie-T17 West area. The Property is made up of two separate land packages for a total concession area of 15,235 hectares. The physical facilities include the Kamoto Concentrator and Luilu metallurgical plant, related shops, warehouses, railroads and power lines. The Property is situated about 220 kilometres north-northeast of Lubumbashi, the capital of the Katanga Province, and between 2 and 10 kilometres from the nearest town of Kolwezi and forms part of La Générale des Carrières et des Mines (Gécamines) Group West area in this region. The Property is covered by Mining Permit no 525 which has been granted to Gécamines by a Ministerial Arreté no 1024/CAB.MIN/MINES/01/2006 dated February 17, 2006. With the Mining Permit, a Mining Certificate no CAMI/CC/2083/2006 was approved, signed and delivered by the “Cadastre Minier” General Manager. This Mining Certificate gives Gécamines the exclusive rights to operate on all the surface of Mining Permit no 525. Gécamines and the Kamoto Copper Company have signed a Leasing Contract (Contrat d’Amodiation) dated November 4, 2005 regarding Mining Permit no 525, within which
Kamoto Copper Company
AMENDED TECHNICAL REPORT
KAMOTO REDEVELOPMENT PROJECT
File reference - 701-001-01-0000-00-CM-0010 Page 11 of 204
Gécamines leases all its rights to operate, exclusively to the Kamoto Copper Company. The “Cadastre Minier” has approved and authenticated the Leasing Contract (Contrat d’Amodiation) by registration on February 20, 2006. Mining Permit no 4958 has been granted for the 4 carrés that comprise the area around the Musonoie-T17 pit. Gécamines remains the sole title holder and owner of the mines and the tailings, free of encumbrances towards third parties. The concessions confer to Kamoto Copper Company the sole and exclusive right to mine.
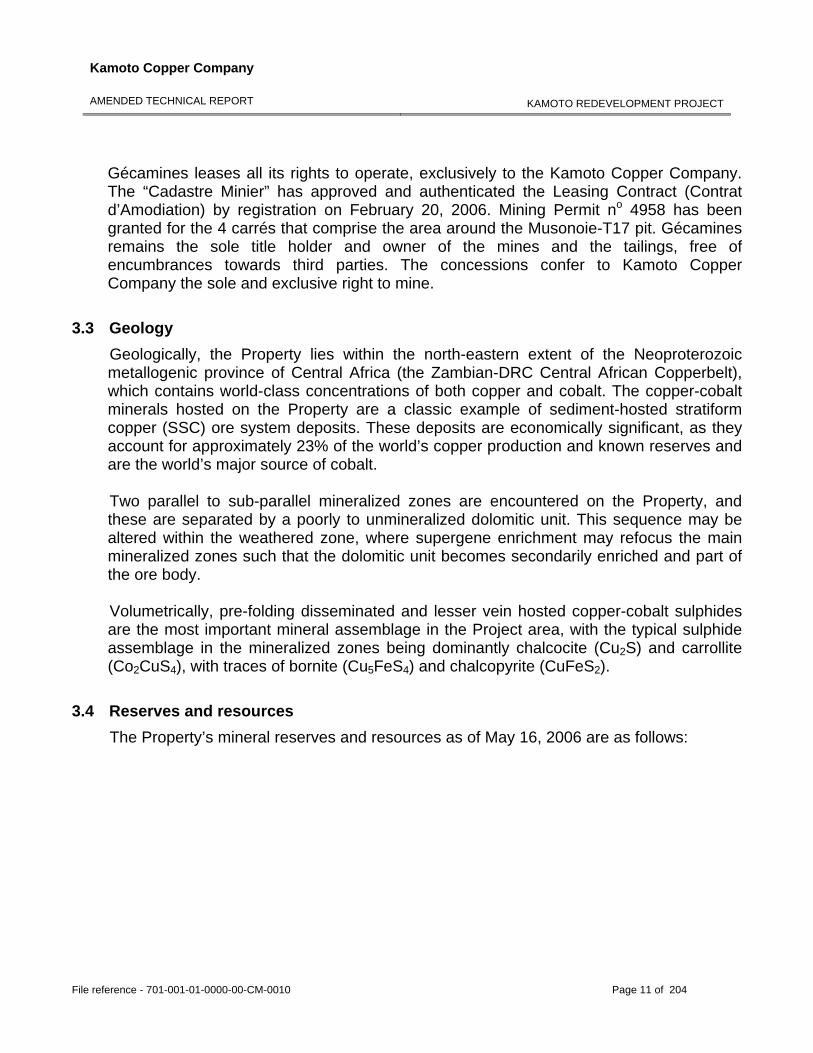
3.3 Geology Geologically, the Property lies within the north-eastern extent of the Neoproterozoic metallogenic province of Central Africa (the Zambian-DRC Central African Copperbelt), which contains world-class concentrations of both copper and cobalt. The copper-cobalt minerals hosted on the Property are a classic example of sediment-hosted stratiform copper (SSC) ore system deposits. These deposits are economically significant, as they account for approximately 23% of the world’s copper production and known reserves and are the world’s major source of cobalt. Two parallel to sub-parallel mineralized zones are encountered on the Property, and these are separated by a poorly to unmineralized dolomitic unit. This sequence may be altered within the weathered zone, where supergene enrichment may refocus the main mineralized zones such that the dolomitic unit becomes secondarily enriched and part of the ore body. Volumetrically, pre-folding disseminated and lesser vein hosted copper-cobalt sulphides are the most important mineral assemblage in the Project area, with the typical sulphide assemblage in the mineralized zones being dominantly chalcocite (Cu2S) and carrollite (Co2CuS4), with traces of bornite (Cu5FeS4) and chalcopyrite (CuFeS2).
3.4 Reserves and resources The Property’s mineral reserves and resources as of May 16, 2006 are as follows:
Kamoto Copper Company
AMENDED TECHNICAL REPORT
KAMOTO REDEVELOPMENT PROJECT
File reference - 701-001-01-0000-00-CM-0010 Page 12 of 204
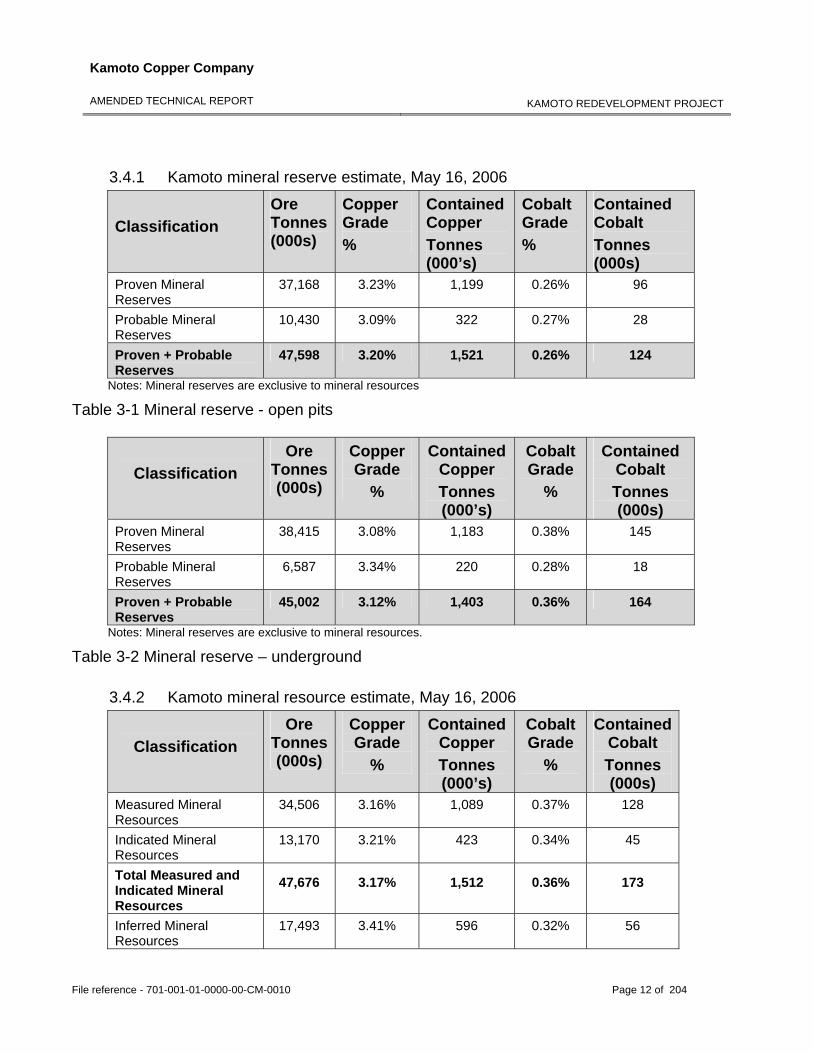
3.4.1 Kamoto mineral reserve estimate, May 16, 2006
Classification
Ore Tonnes (000s)
Copper Grade %
Contained Copper Tonnes (000’s)
Cobalt Grade %
Contained Cobalt Tonnes (000s)
Proven Mineral Reserves
37,168 3.23% 1,199 0.26% 96
Probable Mineral Reserves
10,430 3.09% 322 0.27% 28
Proven + Probable Reserves
47,598 3.20% 1,521 0.26% 124
Notes: Mineral reserves are exclusive to mineral resources
Table 3-1 Mineral reserve - open pits
Classification
Ore Tonnes (000s)
Copper Grade
%
Contained Copper Tonnes (000’s)
Cobalt Grade
%
Contained Cobalt Tonnes (000s)
Proven Mineral Reserves
38,415 3.08% 1,183 0.38% 145
Probable Mineral Reserves
6,587 3.34% 220 0.28% 18
Proven + Probable Reserves
45,002 3.12% 1,403 0.36% 164
Notes: Mineral reserves are exclusive to mineral resources.
Table 3-2 Mineral reserve – underground 3.4.2 Kamoto mineral resource estimate, May 16, 2006
Classification
Ore Tonnes (000s)
Copper Grade
%
Contained Copper Tonnes (000’s)
Cobalt Grade
%
Contained Cobalt Tonnes (000s)
Measured Mineral Resources
34,506 3.16% 1,089 0.37% 128
Indicated Mineral Resources
13,170 3.21% 423 0.34% 45
Total Measured and Indicated Mineral Resources
47,676 3.17% 1,512 0.36% 173
Inferred Mineral Resources
17,493 3.41% 596 0.32% 56
Kamoto Copper Company
AMENDED TECHNICAL REPORT
KAMOTO REDEVELOPMENT PROJECT
File reference - 701-001-01-0000-00-CM-0010 Page 13 of 204
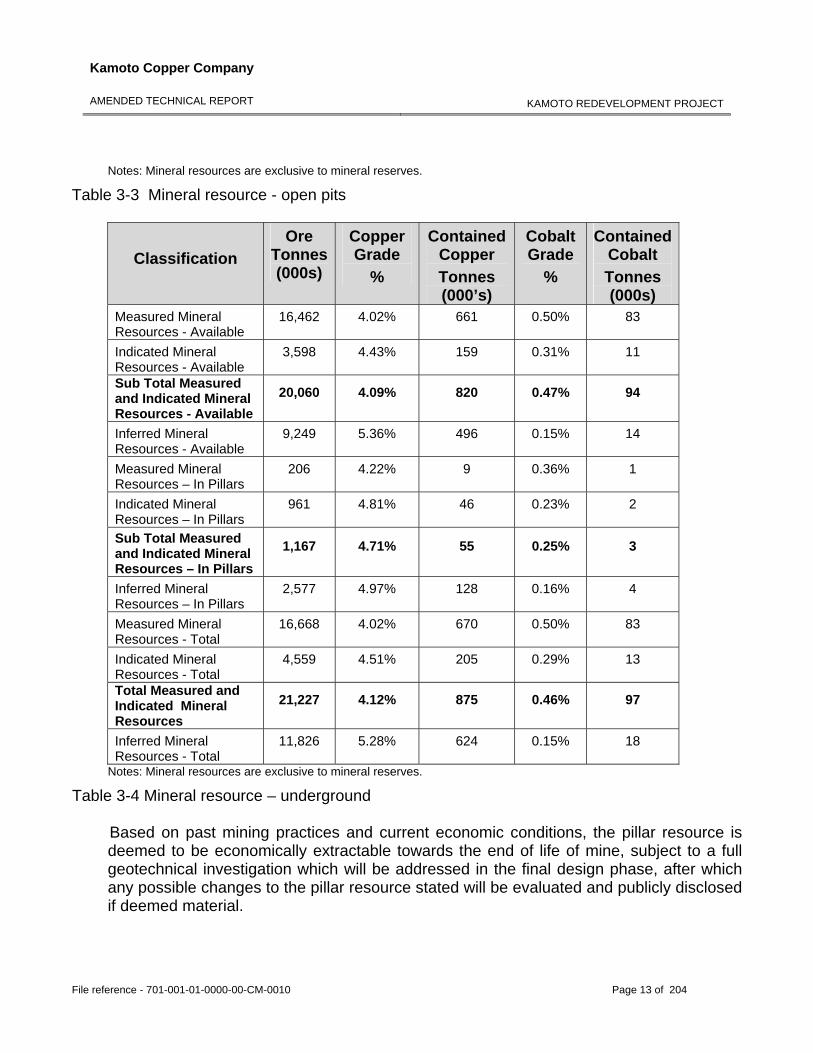
Notes: Mineral resources are exclusive to mineral reserves.
Table 3-3 Mineral resource - open pits
Classification
Ore Tonnes (000s)
Copper Grade
%
Contained Copper Tonnes (000’s)
Cobalt Grade
%
Contained Cobalt Tonnes (000s)
Measured Mineral Resources - Available
16,462 4.02% 661 0.50% 83
Indicated Mineral Resources - Available
3,598 4.43% 159 0.31% 11
Sub Total Measured and Indicated Mineral Resources - Available
20,060 4.09% 820 0.47% 94
Inferred Mineral Resources - Available
9,249 5.36% 496 0.15% 14
Measured Mineral Resources – In Pillars
206 4.22% 9 0.36% 1
Indicated Mineral Resources – In Pillars
961 4.81% 46 0.23% 2
Sub Total Measured and Indicated Mineral Resources – In Pillars
1,167 4.71% 55 0.25% 3
Inferred Mineral Resources – In Pillars
2,577 4.97% 128 0.16% 4
Measured Mineral Resources - Total
16,668 4.02% 670 0.50% 83
Indicated Mineral Resources - Total
4,559 4.51% 205 0.29% 13
Total Measured and Indicated Mineral Resources
21,227 4.12% 875 0.46% 97
Inferred Mineral Resources - Total
11,826 5.28% 624 0.15% 18
Notes: Mineral resources are exclusive to mineral reserves.
Table 3-4 Mineral resource – underground Based on past mining practices and current economic conditions, the pillar resource is deemed to be economically extractable towards the end of life of mine, subject to a full geotechnical investigation which will be addressed in the final design phase, after which any possible changes to the pillar resource stated will be evaluated and publicly disclosed if deemed material.
Kamoto Copper Company
AMENDED TECHNICAL REPORT
KAMOTO REDEVELOPMENT PROJECT
File reference - 701-001-01-0000-00-CM-0010 Page 14 of 204
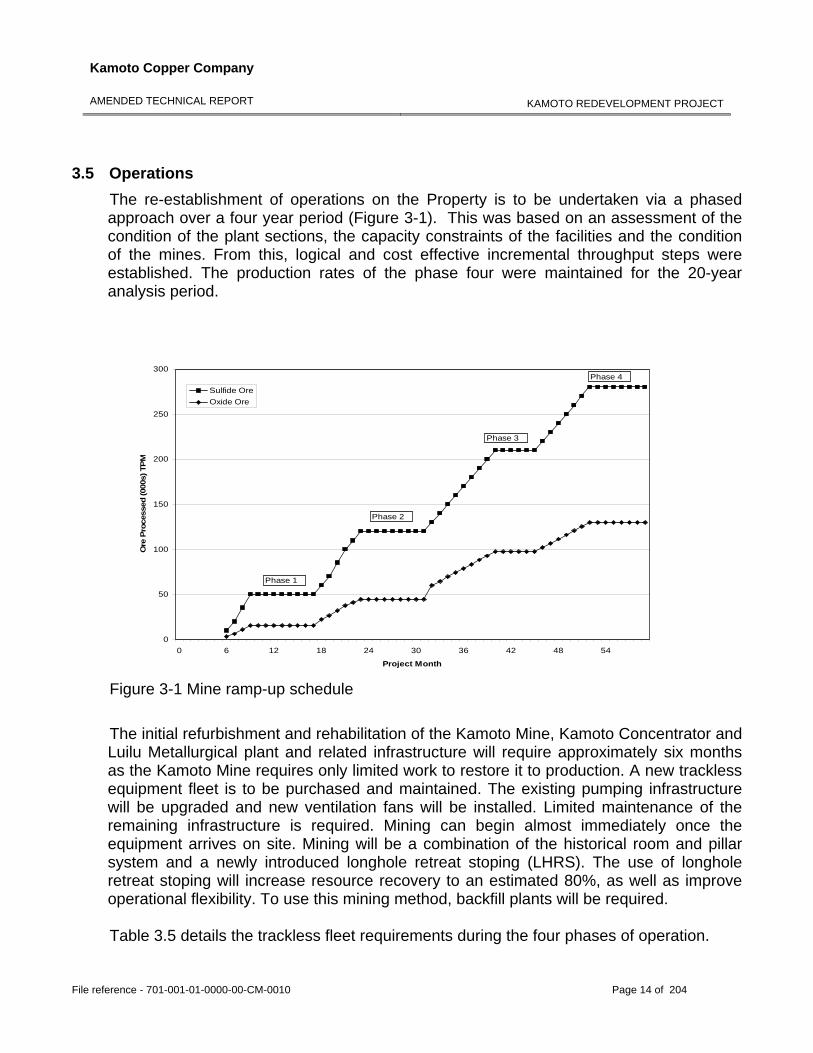
3.5 Operations The re-establishment of operations on the Property is to be undertaken via a phased approach over a four year period (Figure 3-1). This was based on an assessment of the condition of the plant sections, the capacity constraints of the facilities and the condition of the mines. From this, logical and cost effective incremental throughput steps were established. The production rates of the phase four were maintained for the 20-year analysis period.
0
50
100
150
200
250
300
0 6 12 18 24 30 36 42 48 54
Project Month
Ore
Pro
cess
ed (0
00s)
TPM
Sulfide OreOxide Ore
Phase 1
Phase 4
Phase 3
Phase 2
Figure 3-1 Mine ramp-up schedule
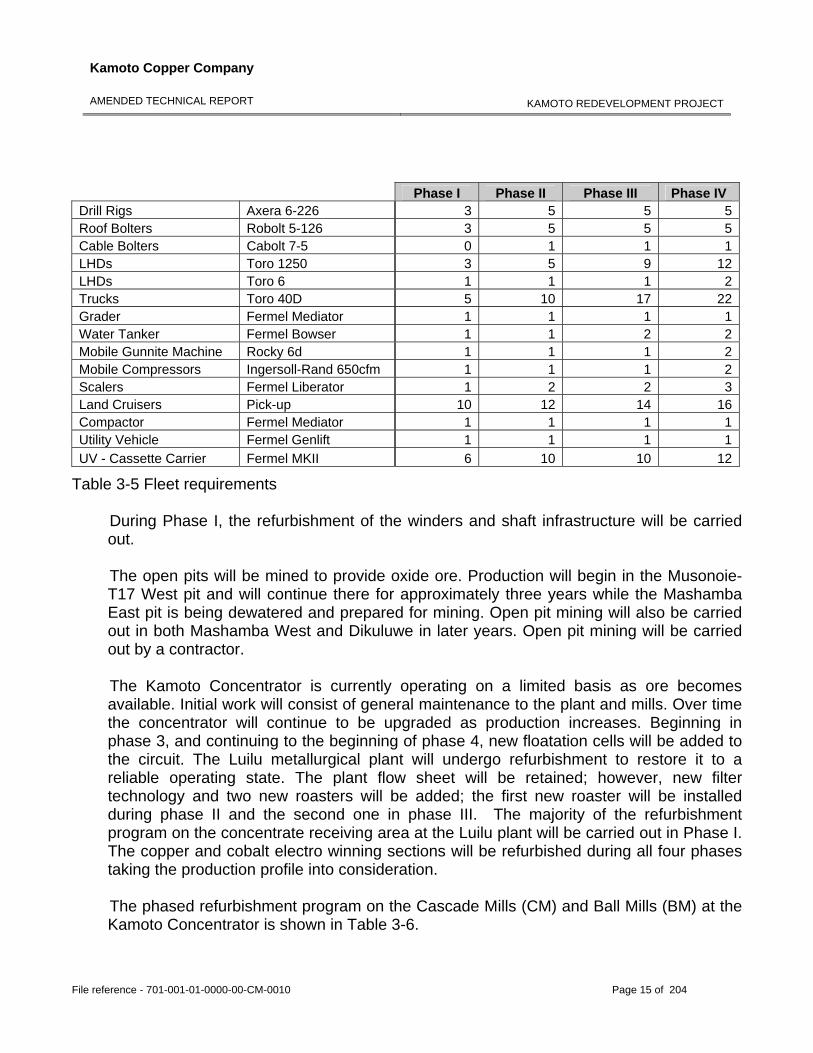
The initial refurbishment and rehabilitation of the Kamoto Mine, Kamoto Concentrator and Luilu Metallurgical plant and related infrastructure will require approximately six months as the Kamoto Mine requires only limited work to restore it to production. A new trackless equipment fleet is to be purchased and maintained. The existing pumping infrastructure will be upgraded and new ventilation fans will be installed. Limited maintenance of the remaining infrastructure is required. Mining can begin almost immediately once the equipment arrives on site. Mining will be a combination of the historical room and pillar system and a newly introduced longhole retreat stoping (LHRS). The use of longhole retreat stoping will increase resource recovery to an estimated 80%, as well as improve operational flexibility. To use this mining method, backfill plants will be required. Table 3.5 details the trackless fleet requirements during the four phases of operation.
Kamoto Copper Company
AMENDED TECHNICAL REPORT
KAMOTO REDEVELOPMENT PROJECT
File reference - 701-001-01-0000-00-CM-0010 Page 15 of 204
Phase I Phase II Phase III Phase IV
Drill Rigs Axera 6-226 3 5 5 5Roof Bolters Robolt 5-126 3 5 5 5Cable Bolters Cabolt 7-5 0 1 1 1LHDs Toro 1250 3 5 9 12LHDs Toro 6 1 1 1 2Trucks Toro 40D 5 10 17 22Grader Fermel Mediator 1 1 1 1Water Tanker Fermel Bowser 1 1 2 2Mobile Gunnite Machine Rocky 6d 1 1 1 2Mobile Compressors Ingersoll-Rand 650cfm 1 1 1 2Scalers Fermel Liberator 1 2 2 3Land Cruisers Pick-up 10 12 14 16Compactor Fermel Mediator 1 1 1 1Utility Vehicle Fermel Genlift 1 1 1 1UV - Cassette Carrier Fermel MKII 6 10 10 12
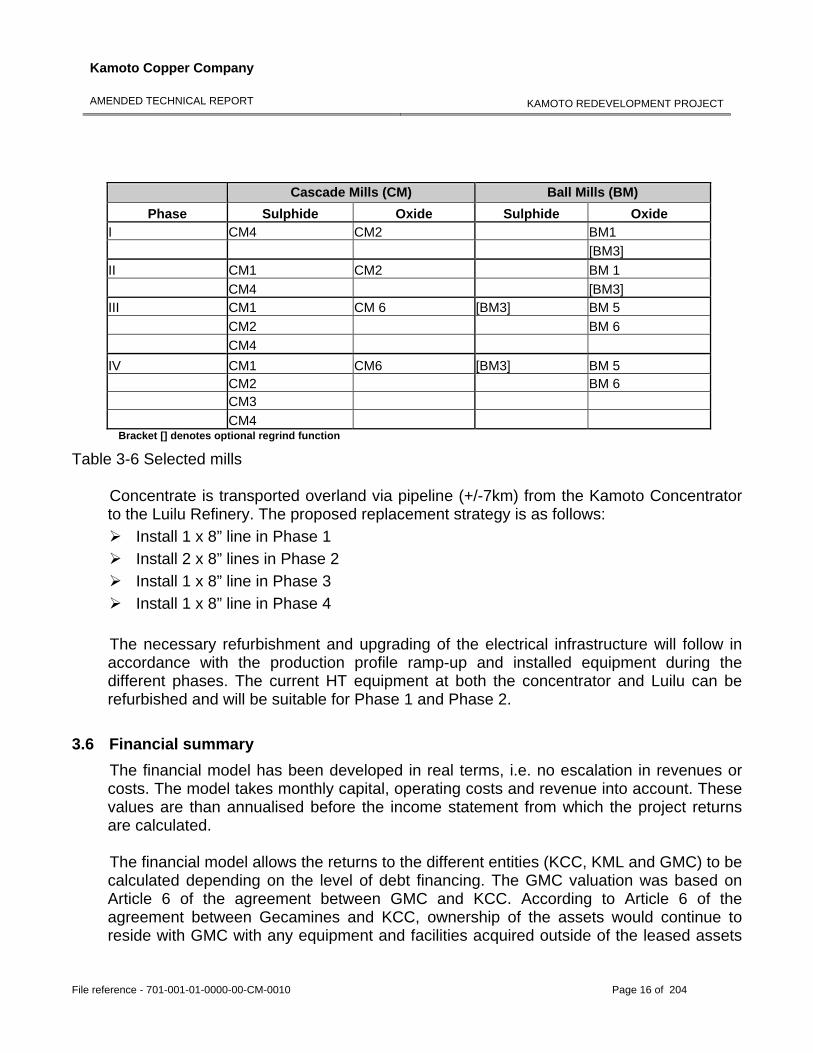
Table 3-5 Fleet requirements During Phase I, the refurbishment of the winders and shaft infrastructure will be carried out. The open pits will be mined to provide oxide ore. Production will begin in the Musonoie-T17 West pit and will continue there for approximately three years while the Mashamba East pit is being dewatered and prepared for mining. Open pit mining will also be carried out in both Mashamba West and Dikuluwe in later years. Open pit mining will be carried out by a contractor. The Kamoto Concentrator is currently operating on a limited basis as ore becomes available. Initial work will consist of general maintenance to the plant and mills. Over time the concentrator will continue to be upgraded as production increases. Beginning in phase 3, and continuing to the beginning of phase 4, new floatation cells will be added to the circuit. The Luilu metallurgical plant will undergo refurbishment to restore it to a reliable operating state. The plant flow sheet will be retained; however, new filter technology and two new roasters will be added; the first new roaster will be installed during phase II and the second one in phase III. The majority of the refurbishment program on the concentrate receiving area at the Luilu plant will be carried out in Phase I. The copper and cobalt electro winning sections will be refurbished during all four phases taking the production profile into consideration. The phased refurbishment program on the Cascade Mills (CM) and Ball Mills (BM) at the Kamoto Concentrator is shown in Table 3-6.
Kamoto Copper Company
AMENDED TECHNICAL REPORT
KAMOTO REDEVELOPMENT PROJECT
File reference - 701-001-01-0000-00-CM-0010 Page 16 of 204
Cascade Mills (CM) Ball Mills (BM)
Phase Sulphide Oxide Sulphide Oxide I CM4 CM2 BM1 [BM3] II CM1 CM2 BM 1 CM4 [BM3] III CM1 CM 6 [BM3] BM 5 CM2 BM 6 CM4 IV CM1 CM6 [BM3] BM 5 CM2 BM 6 CM3 CM4 Bracket [] denotes optional regrind function
Table 3-6 Selected mills Concentrate is transported overland via pipeline (+/-7km) from the Kamoto Concentrator to the Luilu Refinery. The proposed replacement strategy is as follows:
Install 1 x 8” line in Phase 1 Install 2 x 8” lines in Phase 2 Install 1 x 8” line in Phase 3 Install 1 x 8” line in Phase 4
The necessary refurbishment and upgrading of the electrical infrastructure will follow in accordance with the production profile ramp-up and installed equipment during the different phases. The current HT equipment at both the concentrator and Luilu can be refurbished and will be suitable for Phase 1 and Phase 2.
3.6 Financial summary The financial model has been developed in real terms, i.e. no escalation in revenues or costs. The model takes monthly capital, operating costs and revenue into account. These values are than annualised before the income statement from which the project returns are calculated. The financial model allows the returns to the different entities (KCC, KML and GMC) to be calculated depending on the level of debt financing. The GMC valuation was based on Article 6 of the agreement between GMC and KCC. According to Article 6 of the agreement between Gecamines and KCC, ownership of the assets would continue to reside with GMC with any equipment and facilities acquired outside of the leased assets
Kamoto Copper Company
AMENDED TECHNICAL REPORT
KAMOTO REDEVELOPMENT PROJECT
File reference - 701-001-01-0000-00-CM-0010 Page 17 of 204
being ceded to GMC at an agreed upon rate at termination of the agreement. Consequently, no attempt was made to establish a value for the assets and any liabilities that may accrue with ownership. Rather, the focus of financial modelling was on estimating the costs and revenues that would be produced for the specified production schedule. The production schedule was driven by the capacity of the concentrator and hydro-metallurgical plants as well as the underground mine’s sulphide ore production rate. The sulphide to oxide concentrate balance in the hydro-metallurgical plant then effectively created an oxide and dolomitic ore demand which the surface mine plan strove to achieve. Revenue was estimated based on the grade of ore mined and the recovery achieved for the different ore types by the various plants. The shipping costs required to get the product to market were then subtracted to determine the net revenue. Capital cost comprised of both the cost of rehabilitating the Kamoto assets in four phases as well as the ongoing sustaining capital cost for replacement of mining equipment and maintaining the plants. Operating costs for the underground mine, concentrator, metallurgical plant and G&A were derived using a zero-based model and the mining plan. Operating costs for the open pit mine were based on contract mining rates. The Kamoto Copper Company – Kamoto Redevelopment Project has been modeled with financial returns estimated for the following cases:
The initial capital investment required to rehabilitate KCC funded by debt (8.5% interest rate) in four tranches, each amortized over 60 months. This is the base case (NPV based on a 6% discount rate). This evaluation does not attempt to finance any operational losses occurring in the first years. They are simply treated as negative cash flows in the first years of the project;
KCC funded on a 100% equity basis (NPV based on a 15% discount rate); KCC funded on a 100% debt basis (8.5% interest rate), with principal repaid before
dividends are declared to the partners (NPV based on a 6% discount rate). GCM 25% stake in KCC and a royalty with no equity contribution (NPV based on a
6% discount rate). The financial base case carries the following assumptions:
Execution capital cost USD 426.7 million; Sustaining capital costs USD 231.3 million; Evaluation Period (LOM) 20 years;
Kamoto Copper Company
AMENDED TECHNICAL REPORT
KAMOTO REDEVELOPMENT PROJECT
File reference - 701-001-01-0000-00-CM-0010 Page 18 of 204
Copper revenue USD 1.10/lb; Cobalt revenue USD 10/lb; Total production of copper throughout LOM 2.17 millions tonnes (4,778 million lb); Total production of cobalt throughout LOM 0.113 millions tonnes (250 million lb).
The amortised debt discounted cash flow evaluation of the KCC redevelopment project shows an IRR of 23.8% and a NPV 612 million USD using a 6% discount rate and an 8.5% debt rate. Annual refined copper output peaks at 143,000 tonnes (315 million lbs), while a maximum of 10,000 tonnes (22 million lbs) cobalt is produced (not in the same year due to grade variations). Average annual production over the 20 year project life is 109,000 tonnes of copper (240 million lbs) and 5,680 tonnes of cobalt (12.5 million lbs).
3.7 Recommendations 3.7.1 Recommendation Based on the economic analysis set out in Section 25.8 and subject to the qualifications, assumptions and exclusions referred to in Section 25.8, the Project appears to be economically viable as of the base date of the analysis. Based solely on this economic analysis, it would appear to be reasonable for Katanga to proceed with Phase 1 of the Project. This conclusion, however, does not take into account political, financial, market and other factors that are not within the expertise of the contributors to this Report. The ultimate decision to proceed must be made by the management of KML after carefully considering all such factors, together with the conclusions set out in this Report. As detailed in Section 25.7, the capital costs for Phase 1 of the Project are estimated to be as follows:
Rehabilitation of the Kamoto Mine and dewatering of the Open Pits $44,844 Rehabilitation and replacement of capital equipment of the Kamoto
Concentrator $23,492 Rehabilitation and replacement of capital equipment at the Luilu
Recovery Plant $38,772 Infrastructure costs related to power, water and tailings sites $18,018 Indirect costs and overhead $50,432 Total $175,558
3.7.2 Exploration As meaningful exploration has not been carried out since the early 1980’s, this area holds significant potential for new discoveries, and further target generation and exploration drilling should be undertaken.
Kamoto Copper Company
AMENDED TECHNICAL REPORT
KAMOTO REDEVELOPMENT PROJECT
File reference - 701-001-01-0000-00-CM-0010 Page 19 of 204
Additional drill holes are needed in the southern region of the Kamoto Underground Resource Area to confirm and convert the high grade Inferred Resources into the Measured and Indicated categories. It is envisaged that initially ten (10) additional drill holes will be required. All future drill holes should be analysed for CaO, to better predict whether a rock type is dolomitic or siliceous, which has a significant impact on the recovery process. It is apparent from the densities obtained during the QA/QC programme that the density figures as supplied by Gécamines are in fact somewhat conservative, and that there may be some upside potential with regard to the calculated resource tonnages. In situ bulk density data is however required before higher density values can be used in the resource model. There is therefore a need to compile a bulk density database in order to confirm the in situ densities of different rock and ore types on the Property. There is also a need for detailed structural mapping of the DIMA-pits and Kamoto Mine underground faces, to enhance the very limited structural database. This is particularly relevant to the near mine ready faces in the underground areas of the Kamoto Mine.
4.0 INTRODUCTION The DRC (formerly known as Zaire) is located in South Central Africa, being bound by the Republic of Congo and the Atlantic Ocean to the west, Angola to the southwest, Zambia to the southeast, Tanzania, Burundi, Rwanda and Uganda to the east, Sudan to the northeast and the Central African Republic to the north and north-west (Figure 4-1).
Kamoto Copper Company
AMENDED TECHNICAL REPORT
KAMOTO REDEVELOPMENT PROJECT
File reference - 701-001-01-0000-00-CM-0010 Page 20 of 204
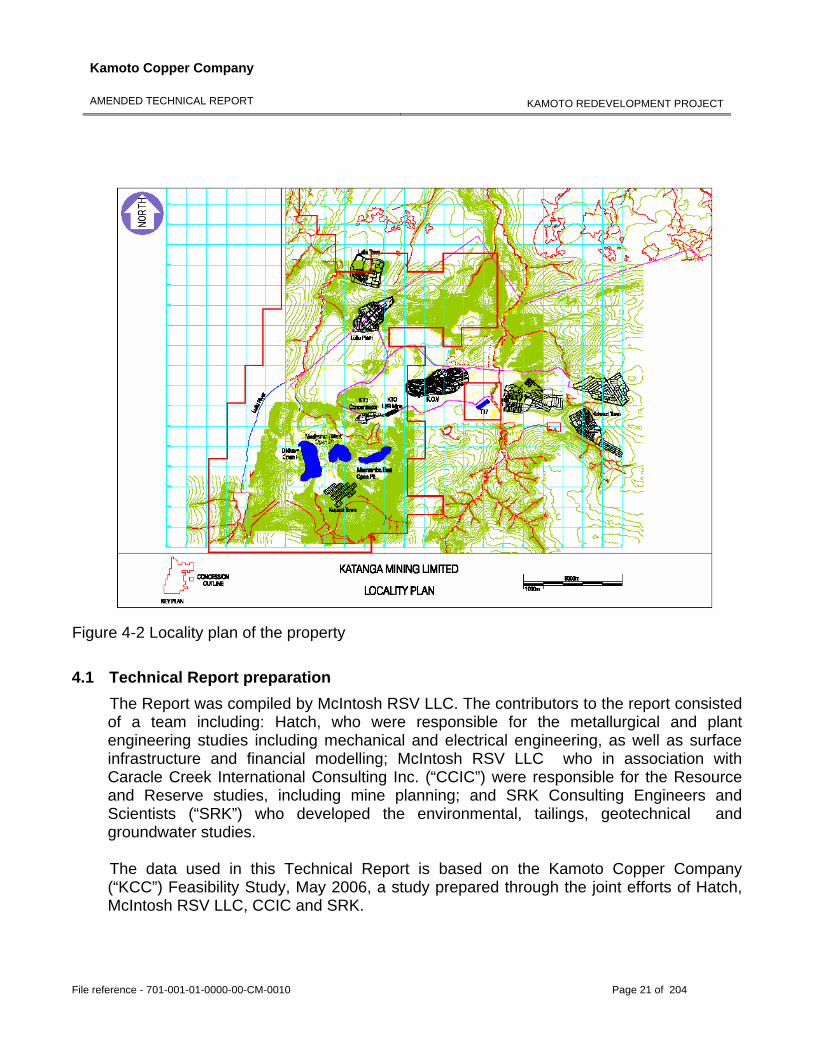
Figure 4-1 Map of the Democratic Republic of the Congo. BUR. = Burundi; RWA. = Rwanda From a geological viewpoint the DRC is a markedly under-explored country, and is not mature in terms of its mineral wealth’s exploration and exploitation. In the past few years, however, the country has become a major focus for exploration of base metals, and presently stands on the brink of major new investments that could make it Africa’s primary copper (“Cu”) and cobalt (“Co”) producer. As part of this new focus, Kinross Forrest Limited (“KFL”) are presently conducting a definitive feasibility study for the redevelopment of the Kamoto Mine (particularly the Kamoto Principal and Etang underground sections), Dikuluwe, Mashamba West and Mashamba East (“DIMA”) open pits, Musonoie-T17 West open pit, Kamoto Concentrator, Luilu Metallurgical plant and their related infrastructure (the “Property”). The Property is located in the southern DRC, within the province of Katanga (formerly Shaba) and the district of Kolwezi. It is situated about two-hundred and twenty (220) kilometres north-northeast of Lubumbashi, the capital of the Katanga Province, and between two (2) and ten (10) kilometres from the nearest town of Kolwezi (Figure 4-2). Geologically the Property lies within the north-eastern extent of the Neoproterozoic metallogenic province of Central Africa (the Zambian-DRC Central African Copperbelt; “CAC”), which contains world-class sedimentary-hosted stratiform concentrations of both copper and cobalt.
Kamoto Copper Company
AMENDED TECHNICAL REPORT
KAMOTO REDEVELOPMENT PROJECT
File reference - 701-001-01-0000-00-CM-0010 Page 21 of 204
Figure 4-2 Locality plan of the property
4.1 Technical Report preparation The Report was compiled by McIntosh RSV LLC. The contributors to the report consisted of a team including: Hatch, who were responsible for the metallurgical and plant engineering studies including mechanical and electrical engineering, as well as surface infrastructure and financial modelling; McIntosh RSV LLC who in association with Caracle Creek International Consulting Inc. (“CCIC”) were responsible for the Resource and Reserve studies, including mine planning; and SRK Consulting Engineers and Scientists (“SRK”) who developed the environmental, tailings, geotechnical and groundwater studies. The data used in this Technical Report is based on the Kamoto Copper Company (“KCC”) Feasibility Study, May 2006, a study prepared through the joint efforts of Hatch, McIntosh RSV LLC, CCIC and SRK.
Kamoto Copper Company
AMENDED TECHNICAL REPORT
KAMOTO REDEVELOPMENT PROJECT
File reference - 701-001-01-0000-00-CM-0010 Page 22 of 204
Scott Jobin-Bevans (CCIC) is the Qualified Person responsible for Sections 3.1-3.3, 3.4.2, 3.7.2, 4.0. Certain portions of 4.1 that apply to CCIC, 4.2 summary, 4.2.1, 4.3, 4.4.1, 6.1-6.5, 7.1-7.3, 8.0-17.0, 19.1-19.8, 19.9.2, 19.10, 20.0, 21.1, 22.2, 23.0, and 26.2. Malcolm Lotriet (RSV) is the Qualified Person responsible for the preparation of 3.4.1, Certain portions of 4.1 that apply to McIntosh RSV, 4.2.4, 4.4.2, 19.9.1, sections 25.1 (excluding 25.1.11-SRK) and 25.2 (excluding section 25.2.3-SRK) and the specific capital and operating costs contributed to Section 25.7. Christian Heili (Hatch) is the Qualified Person responsible for Sections 3.5, 3.6, 3.7.1, certain portions of 4.1 that apply to Hatch, 4.2.3, 4.4.3, 6.6, 7.5, 18.0, 22.1, 25.3, 25.4.1, 25.4.2, 25.4.4 – 25.4.6, 25.6, 25.7 (with the exception of the capital and operating cost information that is specified in Section 25.7 as having been provided by SRK Consultants, McIntosh RSV or KML), 25.8 and 25.9. Alan Naismith (SRK) is the Qualified Person responsible for Sections 25.1.11 and 25.2.3. Adriaan Meintjes (SRK) is the Qualified Person responsible for Sections 4.2.2, 4.2.3, 4.4.4, 6.7, 6.8, 7.4, 25.2.3, 25.4.3 and 25.5 and the specific capital and operating costs contributed to Section 25.7. Certificates of Qualifications for the authors are provided under Item 24. McIntosh RSV LLC “compiled” the Technical Report, including document assembly and composition of a single report from multiple sources. For clarity, McIntosh RSV LLC did not act in the capacity of an overall Qualified Person for the Technical Report nor did any other person acting on its behalf. McIntosh RSV LLC does not assume responsibility for any portion of this Report except as expressly set forth above. McIntosh RSV LLC is a Limited Liability Company, the members of which are McIntosh Engineering Inc. and Read, Swatman & Voigt (Pty) Ltd. Malcolm Lotriet is the Qualified Person on behalf of McIntosh RSV LLC. In respect of the open pit mining, expert opinion was also obtained from Mr. Jac van Heerden Pr.Eng. Mr. van Heerden is a mining engineer experienced in the planning and operation of open pit mines. He has been involved in this type of mining for six years. This Report is directed for the development and presentation of data with recommendations to allow for KFL to reach informed decisions. The Report was prepared by competent and professional individuals on behalf of KFL. This Report is intended to be read as a whole, and sections should not be read or relied upon out of context. This Report contains the expression of the professional opinions of McIntosh RSV, Hatch, and CCIC, based upon information available at the time of preparation. The quality of the information, conclusions and estimates contained herein is
Kamoto Copper Company
AMENDED TECHNICAL REPORT
KAMOTO REDEVELOPMENT PROJECT
File reference - 701-001-01-0000-00-CM-0010 Page 23 of 204
consistent with the intended level of accuracy as set out in this Report, as well as the circumstances and constraints under which the Report was prepared which are also set out herein. The Qualified Persons for this Report have reviewed various reports and other documentation (including those listed in Section 23 “References”) and statements supplied by various sources, including KCC and Gécamines personnel. This information included various published geological reports, flow sheets, overall plant plot plans, general arrangement drawings, equipment lists, pump schedules, electrical single line diagrams and process descriptions and discussions with representatives from KCC and Gécamines who are familiar with the Property and the area in general. McIntosh RSV, Hatch, and CCIC have assumed that all such information is substantially accurate and complete and have relied on such information in reaching the conclusions and recommendations contained herein. In the course of preparing this Report nothing has come to the attention of McIntosh RSV, Hatch or CCIC that has led the authors of this Report to believe that any such information is inaccurate. Apart from a feasibility study undertaken by Kumba Resources Limited in the late 1990’s, which was unavailable to the authors, McIntosh RSV, Hatch, and CCIC are unaware of any technical data that has not been made available to them by Gécamines, KFL or its agents. McIntosh RSV, Hatch, and CCIC have relied exclusively on information provided by KCC regarding land tenure and did not conduct any review of mineral title and ownership. In addition, in preparing the sections of this Report for which they are respectively responsible, each of McIntosh RSV, Hatch, and CCIC have relied on the conclusions arrived at by the other Qualified Persons for this Report. Except for the purposes legislated under provincial securities law, (a) any use of this Report by any third party is at that party's sole risk, and none of McIntosh RSV, Hatch, nor CCIC nor any of their directors, officers or employees shall have any liability to any third party for any such use for any reason whatsoever, including negligence, and (b) McIntosh RSV, Hatch, and CCIC disclaim responsibility for any indirect or consequential loss arising from any use of this Report or the information contained herein. McIntosh RSV, Hatch, and CCIC are not responsible for any omissions in, and do not guarantee, or
make any warranty as to the accuracy of information received from outside sources and McIntosh RSV,
Hatch, and CCIC disclaim all responsibility for missing or inaccurate Property information. McIntosh
RSV, Hatch, and CCIC have conducted this independent technical assessment in accordance with the
methodology and format outlined in National Instrument 43-101, companion policy NI 43-101CP and
Form 43-101F1.
Kamoto Copper Company
AMENDED TECHNICAL REPORT
KAMOTO REDEVELOPMENT PROJECT
File reference - 701-001-01-0000-00-CM-0010 Page 24 of 204
4.2 Purpose for which the Report was prepared
The purpose of this compiled report is to conduct an independent estimation of the Mineral Resources located on the Property and to produce an Independent Technical Report (the “Report”) in accordance with the guidelines set out in the new National Instrument 43-101 (NI 43-101), companion policy NI 43-101CP and Form 43-101F1 (which came into force on the 30th of December 2005). 4.2.1 CCIC CCIC, in conjunction with McIntosh RSV LLC, were retained by KFL to conduct an independent estimation of the Mineral Resources located on the property. In order to complete the Resource Estimate, CCIC has completed the following work:
A review of the historical mining and geological data on the Property and of the previous geological models and interpretations;
Numerous visits to the Property; A review of the diamond drill hole (“DDH”) database, and examination of diamond drill
cores from previous drilling programmes; Meetings with various personnel involved in the exploration programmes and mining; A review of the Quality Control/Quality Assurance (“QA/QC”) procedures (i.e.
laboratory, care and control of samples, storage etc); A review of previously utilized analytical procedures; A review of previous resource estimations; Generation of new geological models for the Resource Areas of the Property; Generation of block models and completion of a Resource Estimation; Completion of a Resource Classification in accordance with the “Canadian Institute of
Mining, Metallurgy and Petroleum Standards on Mineral Resources and Mineral Reserves Definition Guidelines” (CIM, 2000).
4.2.2 SRK Consulting SRK Consulting was retained by KFL to carry out various aspects of the Report including:
Tailings and solid waste disposal; An assessment of groundwater and surface water management requirements; An environmental impact statement; Environmental studies; Mining geotechnical and ground support studies; Mining backfill studies.
Kamoto Copper Company
AMENDED TECHNICAL REPORT
KAMOTO REDEVELOPMENT PROJECT
File reference - 701-001-01-0000-00-CM-0010 Page 25 of 204
4.2.3 Hatch Hatch was retained by KFL with responsibility for the following aspects of the Report including:
Metallurgical engineering and process studies for the Kamoto concentrator and Luilu plant;
Review of process performance over the life of both plants; Metallurgical test work aimed at identifying areas where the performance of the
existing operating plant (Kamoto concentrator) could be improved; Trade-off evaluations; Visits to the Property including meetings with various personnel from the plants; Surface infrastructure study; Establishment of the plant capital cost, compilation of the project capital cost and
financial modelling of the project. 4.2.4 McIntosh RSV McIntosh RSV LLC, were retained by KFL to conduct mine planning and to prepare an independent estimation of the Mineral Reserves located on the property. In addition, McIntosh RSV LLC was retained to compile this report. In order to complete the mine planning and Reserve Estimate, the following work has been completed:
Infrastructure studies including; Vertical shafts and hoisting systems Underground infrastructure including crushing, pumping and ventilation systems Mining surface workshops and offices studies Mining electrical infrastructure on surface and underground Mine planning, design and scheduling; Mineral Reserve Estimate Mining Capital and Operating Cost estimates
4.3 Sources of information
This Report is based on the following dataset as made available by La Générale des Carrières et des Mines (“Gécamines”) (Kolwezi Geological Survey and Kamoto Mine), public domain sources and various in-house and research reports:
Historical reviews of the Property; Diamond drill hole databases for Kamoto underground and the DIMA and Musonoie-
T17 West open pit areas; Diamond drill hole cores from the various Resource Areas;
Kamoto Copper Company
AMENDED TECHNICAL REPORT
KAMOTO REDEVELOPMENT PROJECT
File reference - 701-001-01-0000-00-CM-0010 Page 26 of 204
Geological interpretations from Gécamines geologists including geological cross-sections at 1/1000 scale;
Resource estimation for Kamoto and Musonoie-T17 completed by Gécamines personel (Katekesha, 1989);
Discussions held with Kamoto Copper Company management (Mr. R.Dye) and Gécamines geologists (Dr E. Bulundwe; Mr. Banza and Mr. Kapisu) and Forrest’s Dr J.Cailteux;
Various reports as listed in the References section (Item 23); Historical mine survey plans; Historical mine operational records.
4.4 Scope of the personal inspection of the Property
4.4.1 CCIC The Qualified Person for the Resource aspects of this Report is Dr. Scott Jobin-Bevans, Managing Director of CCIC Canada, and a geologist in good standing with the Association of Professional Geoscientists of Ontario (P. Geo. #0183). Dr. Jobin-Bevans has over 17 years experience in mineral exploration and has authored or co-authored numerous Independent Technical Reports (NI 43-101) or Competent Persons Reports for the purpose of listings on the TSX Venture Exchange of the Toronto Stock Exchange, and the Alternative Investment Market (AIM) and OFEX markets of the London Stock Exchange. Dr. Jobin-Bevans also has experience in geological and resource modelling, and in the management of QA/QC programs. Dr. Jobin Bevans completed a site visit on the 10th and 11th of November 2005. This included discussions with various Gécamines personnel, inspection of cores from the underground areas of the Kamoto Mine, DIMA and Musonoie-T17 West Resource Areas, and an underground visit to the Principal and Etang sections of the Kamoto Mine. Dr. Philip John Hancox is a co-author on this Report. Dr. Hancox is a member in good standing with the South African Council for Natural Scientific Professions (Pr. Sci. Nat. Registration Number 400224/04), and is a member of the Geological Society of South Africa. He has several years experience in African economic geology, in particular various sedimentary hosted stratiform ore deposits, as well as in the management of QA/QC programs. Dr. Hancox has visited the Property on three separate occasions, the first of which being between the 21st and 26th of August 2005. Subsequent trips were undertaken between the 16th and 21st of October 2005 and the 10th and 11th of November 2005. During these trips diamond drill cores from all of the areas on the Property were examined and re-logged to check for accuracy, and site visits were made to all the open pit exposures, as
Kamoto Copper Company
AMENDED TECHNICAL REPORT
KAMOTO REDEVELOPMENT PROJECT
File reference - 701-001-01-0000-00-CM-0010 Page 27 of 204
well as underground to the Principal and Etang sections of the Kamoto Mine. A tour of the sample preparation and assay facilities at the Luilu plant was also conducted. Contributions to this Report were also made by Mr. Desmond Subramani and Mr. Martin Tuchscherer. Mr. Subramani is the Mineral Resource Manager for CCIC South Africa and has specific expertise in geological modelling, resource calculations and audits, and pre-feasibility studies. Mr. Subramani visited the Property between the 21st and 26th of August 2005 and during this time concentrated on data acquisition and verification for the development of the resource models. Mr. Tuchscherer is French speaking, and accompanied Dr. Hancox and Mr. Subramani on the visit of the 16th to 21st of October 2005 as an interpreter and geologist. Following this visit a one day stopover was made by Mr. Tuchscherer to the Gécamines offices at Likasi to review the geological literature stored there, and to ascertain if any additional geological information existed. Mr. Tuchscherer also returned to Kolwezi between the 1st and 4th of February 2006 to undertake density measurements on various diamond drill hole cores. 4.4.2 McIntosh RSV LLC The Qualified Person for the mine planning and Mineral Reserve Estimates is Mr. Malcolm Paul Lotriet, a mining engineer and analyst of RSV. Mr. Lotriet is a registered Professional Engineer (No. 20040197) with the Engineering Council of South Africa (“ECSA”), and is a fellow of the South African Institute of Mining and Metallurgy (“SAIMM”). Mr. Lotriet has more than 22 years experience in mining operations management, planning and technical studies. Mr. Lotriet visited the Property between the 21st and 23rd of August 2005. The visit included site inspections of the open pit and underground operations, and discussions with mine management and engineers. The purpose of the visit was to assess the physical conditions of the various open pits and the underground operations of the Kamoto Mine. The site inspections and discussions provided a clear understanding of the historical mining operations in the open pits and underground mine. 4.4.3 Hatch Contributions to this Report were also made by Christian Heili of Hatch. Mr. Heili is a member in good standing of ECSA as a Professional Engineer, (No 900087), a Fellow of the SAIMM and a Member of the Society for Mining, Metallurgy and Exploration (SME), and has 24 years of wide ranging operational and consultancy mining engineering, management and business experience in the context of Southern Africa. Mr. Heili has visited the Property on two separate occasions, the first one during the period between the 21st and 26th of August 2005 and the second between the 18th and 23rd of September 2005. During both of these trips examination work and reviews were carried out at the Kamoto concentrator, Luilu plant and general infrastructure.
Kamoto Copper Company
AMENDED TECHNICAL REPORT
KAMOTO REDEVELOPMENT PROJECT
File reference - 701-001-01-0000-00-CM-0010 Page 28 of 204
4.4.4 SRK Consulting The Qualified Persons for the environmental and tailings and solid waste disposal aspects of this Report are Mr. Adriaan Meintjes and Richard Stuart of SRK. Mr Meintjes (Pr.Eng.) is a Partner at SRK Consulting, South Africa and is a professional person of good standing with ECSA (Pr.Eng. Registration No. 930308). Mr. Meintjes has over 20 years of experience in Geotechnics and Tailings Engineering, and has co-authored several Independent Audit, Due Diligence and Bankable Feasibility reports. Mr. Stuart (Pr.Tech. (Eng) is a Principal Consultant with SRK Consulting, South Africa, is a professional person of good standing with ECSA (Pr.Tech. (Eng) Registration No 8870059) and has 20 years experience in Tailings and Solid Waste Disposal. He has authored and presented eight technical papers on Tailings Disposal at International Conferences and has also co-authored several independent Audits and Due Diligence and Bankable Feasibility reports. Prior to the completion of the final reports of the KFL concession area and Kolwezi, a site inspection was made of the KFL concession area by Messer’s Meintjes and Stuart. The inspection by the two qualified persons took place during the period 23rd to 25th of January 2006. The object of the inspection was to review the study work carried out by SRK so that the technical reports could be signed off. The visit comprised an inspection of all the open pits forming part of the KFL concession area. The seven possible tailings dam sites initially investigated during the site selection study were also re-visited, and thereafter three sites, namely the Mupine Open Pit and existing Kamoto and Potopoto Tailings dams, were inspected in detail. The Kamoto and Luilu Plants were inspected including the surrounding areas, and the Luilu River and its tributary were inspected, including the two barrages and the return water pump station for the Luilu Metallurgical Plant. The KFL concession area was also inspected from the point of view of environmental concerns. Reports, drawings, test pit profiles, and laboratory test results forming part of the Feasibility Study documentation, were used during the detailed sign off visits.
5.0 RELIANCE ON OTHER EXPERTS Information contained in Sections 3.2, 6.3, 6.4, 6.5, 6.6, 7.5, 25.6, 25.7, 25.8 and 25.9 regarding mineral tenure, property title issues and taxes, royalties, duties and other levies in the DRC that are applicable to the Project was obtained from Gecamines and Katanga Mining Limited and was not independently verified by Hatch, McIntosh RSV, SRK or CCIC (and accordingly none of these parties take any responsibility for such information). Section 26.1 contains copies of the Mineral Concession Certificates.
Kamoto Copper Company
AMENDED TECHNICAL REPORT
KAMOTO REDEVELOPMENT PROJECT
File reference - 701-001-01-0000-00-CM-0010 Page 29 of 204
6.0 PROPERTY DESCRIPTION AND LOCATION 6.1 The area of the Property
The area under consideration (collectively referred to as the “Property”) forms part of Gécamines Group West area in the Kolwezi region. The currently identified Resource Areas consist of the underground workings at the original Kamoto Mine (including the Kamoto Principal and Etang areas) as well as three variously flooded open pit mine areas; Dikuluwe-Mashamba East and Mashamba West, and the dry Musonoie-T17 West area. The physical facilities include the Kamoto Concentrator and Luilu metallurgical plant, related shops, warehouses, railroads and power lines. The Property is made up of two separate land packages; the first containing 176 carrés1 and the second containing 4 carrés for a total concession area of 15,235 hectares.
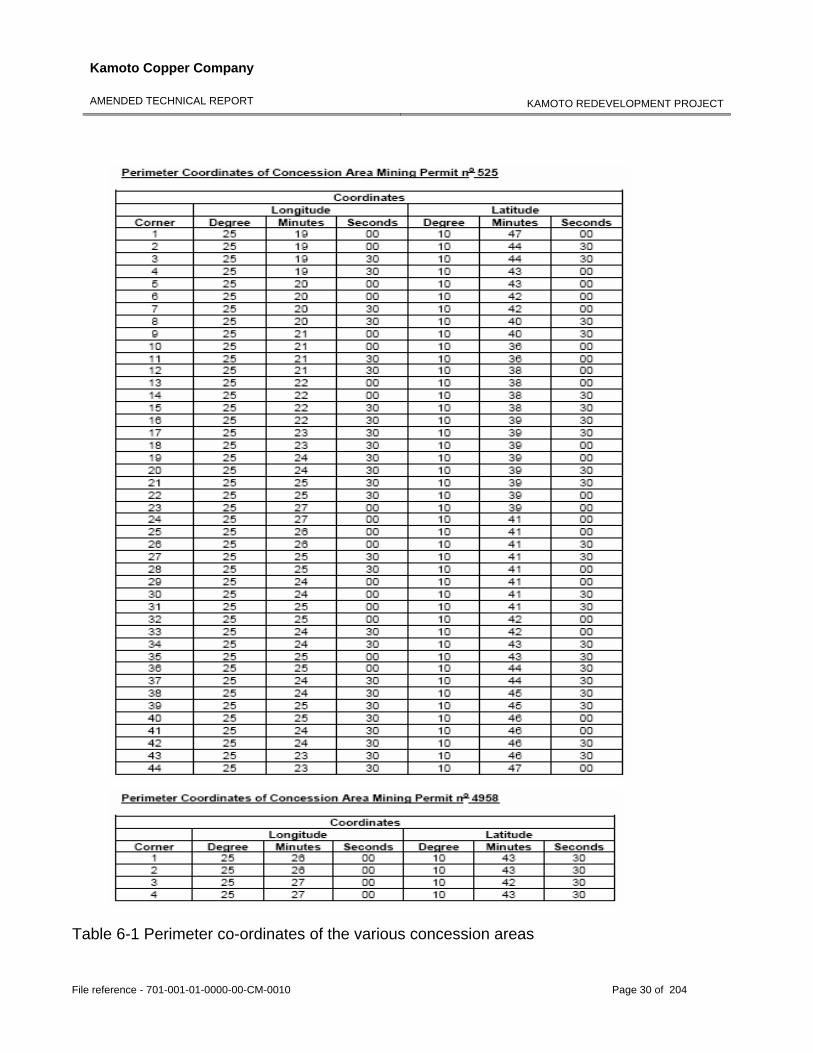
6.2 Location The Property is located in the western portion of the Group West at approximately 25-degree 25-minutes of longitude and 10-degree 39-minutes of latitude (Table 6-1). Unless otherwise mentioned, all coordinates in this Report are provided in the Lambert Gaussian co-ordinate system, or a local datum.
6.3 Type of mineral tenure Mining Permit no 525 has been granted to Gécamines by a Ministerial Arreté no 1024/CAB.MIN/MINES/01/2006 dated February 17, 2006. Mining Permit no 525 comprises 176 “carrés” registered by the “Cadastre Minier” as described by “Extrait de la carte de Retombe Minière” (Appendix 1). Mining Permit no 525 covers the Kamoto Mine underground deposit and facilities, the Kamoto and DIMA Concentrators, Luilu hydrometallurgical plants and all of the Dikuluwe-Mashamba (“DIMA”) deposits. With the Mining Permit, a Mining Certificate no CAMI/CC/2083/2006 was approved, signed and delivered by the “Cadastre Minier” General Manager. This Mining Certificate gives Gécamines the exclusive rights to operate on all the surface of Mining Permit no 525. Gécamines and KCC have signed a Leasing Contract (Contrat d’Amodiation) dated November 4, 2005 regarding Mining Permit no 525. With this contract, Gécamines leases all its rights to operate exclusively to KCC. The “Cadastre Minier” has approved and authenticated the Leasing Contract (Contrat d’Amodiation) by registration on February 20th, 2006. Mining Permit no 4958 has been granted for the 4 carrés that comprise the area around the Musonoie-T17 pit.
1 A “carrés” measures 920 x 920 meters.
Kamoto Copper Company
AMENDED TECHNICAL REPORT
KAMOTO REDEVELOPMENT PROJECT
File reference - 701-001-01-0000-00-CM-0010 Page 30 of 204
Table 6-1 Perimeter co-ordinates of the various concession areas
Kamoto Copper Company
AMENDED TECHNICAL REPORT
KAMOTO REDEVELOPMENT PROJECT
File reference - 701-001-01-0000-00-CM-0010 Page 31 of 204
6.4 The nature and extent of title
The Kamoto Joint Venture (“JV”) is governed by the Kamoto JV Agreement. The parties to the agreement are Gécamines, a DRC public enterprise incorporated under the laws of the DRC and Kinross Forrest Limited (“KFL”), a private company incorporated under the laws of the British Virgin Islands. Negotiations between Gécamines and KFL started in June 2001. The JV Agreement between Gécamines and KFL was signed in March 2004 and approved by Presidential Decree dated August 5, 2005 after all regulatory approvals were obtained. KFL and Gécamines have incorporated and organized a DRC company known as Kamoto Copper Company SARL2 (“KCC”) to hold the Kamoto JV assets. The objective of the JV Agreement is to restart copper and cobalt production from existing mines and beneficiation facilities in the Kolwezi area. To accomplish this, the underground areas of the Kamoto Mine, the DIMA deposits and the Musonoie-T17 West deposit, the concentrators of Kamoto and DIMA, and the Luilu plants will be refurbished or rehabilitated as required, and production restarted. The two partners in the JV participate in the project by contributing defined assets. Gécamines leases to KCC the Kamoto Mine, Kamoto and DIMA concentrators, the Luilu hydrometallurgy plant facilities, together with all their infrastructures and surface holdings, including the processing facilities, and all mobile equipment, together with all related files and records and all technical data. Gécamines also leases to KCC the Kamoto, Dikuluwe, Mashamba East and Mashamba West deposits, as well as the Musonoie-T17 West deposit, or any other deposits that will provide ores to ensure project profitability. KFL contributes the management expertise to operate the mines and the plants, and the technology and the organization of the equity and debt financing to start the project and to carry it through the life of the agreement. Gécamines remains the sole title holder and owner of the mines and the tailings, free of encumbrances towards third parties. The concessions confer to KFL the sole and exclusive right to mine. These rights include access all existing installations, the right to use all existing water resources for the use of the mining activities, the right to dispose of transport and sell all products and to conduct all necessary beneficiation activities and the right to build all installations necessary, related to the mineral resources existing on the property. The concessions are valid for a period terminating not earlier than 20-years after the signature of the JV Agreement. Thereafter, the validity can be extended for either the
2 KCC is a SARL company (25 per cent GCM, 75 per cent KFL) incorporated and registered in the Republic Democratic of Congo.
Kamoto Copper Company
AMENDED TECHNICAL REPORT
KAMOTO REDEVELOPMENT PROJECT
File reference - 701-001-01-0000-00-CM-0010 Page 32 of 204
life of the mines or a further period of 10-years, whichever of the two periods is the shorter. Gécamines is carrying 25 per cent of the shares of the joint venture and KFL 75 per cent. Gécamines 25 per cent cannot be diluted and does not create any obligation to participate in providing capital for the joint venture. The rights granted to KCC by Gécamines are exclusive to KCC and Gécamines shall not grant any rights to any third party without first having obtained the approval of KCC. KFL has the obligation to undertake the preparation of a Feasibility Study for the general purpose of arranging financing of the project. The study will define estimated investment costs, operating costs, and financial requirements to carry out the project. Production objectives to be defined in the feasibility study are to achieve:
Phase 1:Production rate of 25,000 tonnes of copper metal per year after one year of operations
Phase 2:Production rate of 60,000 tonnes of copper metal per year after two years of operations
Phase 3:Production rate of 105,000 tonnes of copper metal per year after four years of operations
Phase 4:Production rate of 150,000 tonnes of copper metal per year after six years of operations
The Feasibility Study will be completed within eight months after the Presidential decree has been issued. If the feasibility study shows a rate of return higher than 20 per cent, KCC shall manage the project. Operational control of KCC will be exercised by KFL according to direction of the Board of Directors. Kamoto Operating Company (“KOL”) a private company (SPRL) shall be appointed as the Operator. KML has been granted an option to purchase 100 per cent of the outstanding shares of KFL, pursuant to an option agreement dated July 29, 2005.
6.5 Property boundaries The property boundaries (Table 6-1) are identified by geographic co-ordinates recorded in the mining permit. CCIC understands that none of the mineral concessions have been surveyed; however these corners will be located in the field in the near future. Copies of the mineral concession certificates are provided in Appendix 1.
Areas of known mineralization, resources, mine workings, existing tailing ponds, waste deposits and important natural features and improvements, relative to the outside property boundaries are shown in Figure 4-2.
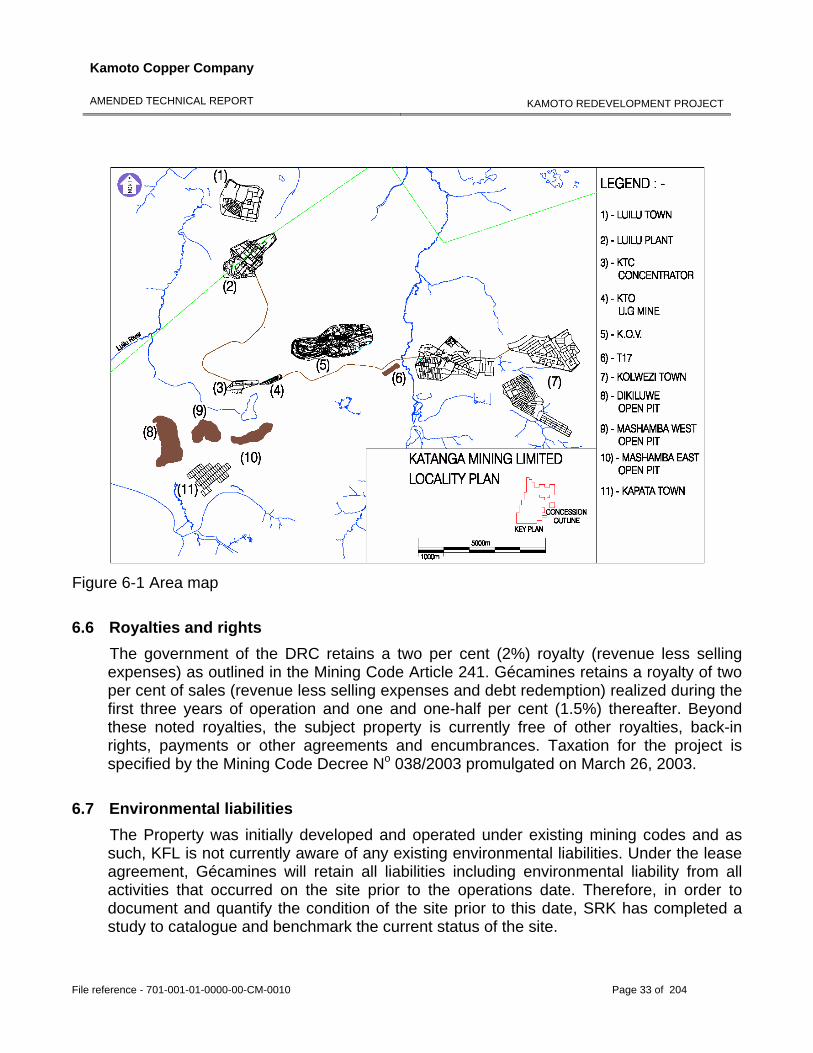
Kamoto Copper Company
AMENDED TECHNICAL REPORT
KAMOTO REDEVELOPMENT PROJECT
File reference - 701-001-01-0000-00-CM-0010 Page 33 of 204
Figure 6-1 Area map
6.6 Royalties and rights
The government of the DRC retains a two per cent (2%) royalty (revenue less selling expenses) as outlined in the Mining Code Article 241. Gécamines retains a royalty of two per cent of sales (revenue less selling expenses and debt redemption) realized during the first three years of operation and one and one-half per cent (1.5%) thereafter. Beyond these noted royalties, the subject property is currently free of other royalties, back-in rights, payments or other agreements and encumbrances. Taxation for the project is specified by the Mining Code Decree No 038/2003 promulgated on March 26, 2003.
6.7 Environmental liabilities The Property was initially developed and operated under existing mining codes and as such, KFL is not currently aware of any existing environmental liabilities. Under the lease agreement, Gécamines will retain all liabilities including environmental liability from all activities that occurred on the site prior to the operations date. Therefore, in order to document and quantify the condition of the site prior to this date, SRK has completed a study to catalogue and benchmark the current status of the site.
Kamoto Copper Company
AMENDED TECHNICAL REPORT
KAMOTO REDEVELOPMENT PROJECT
File reference - 701-001-01-0000-00-CM-0010 Page 34 of 204
6.8 Permitting The required operating permits under the DRC Mining code are the Mining Permit, Environmental Impact Statement (“EIS”) and Environmental Management Plan of the Project (“EMPP”). The Mining Permit has been obtained and as part of the feasibility study, KFL has completed an EIS and an EMPP as specified by the newly adopted mining code. These documents are currently being reviewed and will be submitted to the appropriate authorities in the near future.
7.0 ACCESSIBILITY, CLIMATE, LOCAL RESOURCES, INFRASTRUCTURE AND PHYSIOGRAPHY
7.1 Topography, elevation and vegetation Topographically the Property is generally fairly flat, although there are several small ranges of low hills in the surrounding area. According to the 1: 20 000 map of the area on display in the Kolwezi Geological Survey offices, the various resource areas of the Property, as well as the plant, are situated on rocks of the Roan Group. In this area the Roan Group is comprised of inter-bedded siliclastic and dolomitic units, with occasional occurrences of chert. In places the dolomitic units have been leached and silicified and where this has happened these silicified dolomites are relatively resistant to weathering, forming prominent ridges, such as is apparent around the Kamoto Olivera Virgule (“KOV”) pit, which lies to the north-east of the Kamoto Mine. Where less resistant lithologies are encountered the dolomites and siltstones have been eroded to form gently sloping hillsides and shallow valleys draining to the Luilu, Musonoie, Kalemba and Potopoto rivers. Due to the dolomitic nature of the host karstic topography is prevalent in the area, with weathering profiles known to be between 50-200m deep dependant on the orientation and position of structural controls. To the south lies the Manika Plateau, this has sandy soils with high permeability, resulting in a high ground water and surface water flow into the Kolwezi area. This flow drains through the Luilu and Musonoie rivers, which in turn converge into the Lualaba River. The Musonoie River flows towards the east. The town of Kolwezi is situated at a latitude of 11 degrees south and longitude of 25 degrees east at an altitude of approximately 1400m above mean sea level (“amsl”). On the Property the Kamoto Mine has an average surface elevation of 1445m amsl, the DIMA Resource Area 1448m amsl and the Musonoie-T17 West Resource Area 1435m amsl.
Kamoto Copper Company
AMENDED TECHNICAL REPORT
KAMOTO REDEVELOPMENT PROJECT
File reference - 701-001-01-0000-00-CM-0010 Page 35 of 204
At Kolwezi the vegetation is semi-tropical grassland with scattered trees and bushes. The surface soils are relatively well-drained and are extensively cultivated with cassava and peanut fields. Slopes at lower elevations on the Property are typically covered with small brush and grasses with the largest concentration of vegetation in swampy areas in the valleys. Slopes at higher elevations are generally bare with very little vegetation and are predominantly covered by talus.
7.2 Means of access to the Property The town of Kolwezi is accessible by paved and gravel roads from Lubumbashi, the capital city of the Katanga Province. Presently the 320km drive from Lubumbashi to Kolwezi takes approximately 6-7 hours. The road between Likasi and Kolwezi is in exceptionally poor condition apart from the final 30km outside (east) of Kolwezi itself. The distance from Likasi to Kolwezi is approximately 196km. The time taken to traverse this distance is between four to five hours on average. There are also three restrictions on the route, single lane bridges at distances of 70 and 80km from Likasi (these are not considered to be a problem as there are by-pass facilities at the bridge sites) and a bridge with a 20 ton load restriction where the road crosses the Nzilo lake, approximately 30km outside of Kolwezi. Loads in excess of 20 tons are re-routed to a pontoon to cross this section. Lubumbashi is the main airport for the Katanga Province and caters to various international flights, being serviced by both South African Airways and the Congolese airline Hewa Bora. The airport has refuelling facilities, but there are occasional problems obtaining fuel. Maintenance facilities are available. Customs and immigration procedures must be cleared at Lubumbashi. ITAB (an internal DRC company) operate regular flights from Lubumbashi to Kolwezi, with the flying time being approximately 45 minutes. The air field at Kolwezi is an asphalt topped strip 1750 meters long at 1500m asl. The condition of the strip is good and the air field is suitable for medium sized aircraft. There are no refuelling or maintenance facilities at the airstrip. From Kolwezi the Musonoi-T17 West site is a short (15 minute) automobile ride on a gravel road built by Gécamines. This same road traverses most of the Property, with the trip to the Kamoto Mine taking approximately 30 minutes and the DIMA pits approximately 45 minutes. Buses and taxis have access to this road and presently this is the main means of transport for the staff of the Kamoto Mine. Road access to the Property is sometimes affected by the heavy rains during the rainy season.
7.3 Proximity of the Property to a population centre [See section 7.2 above]
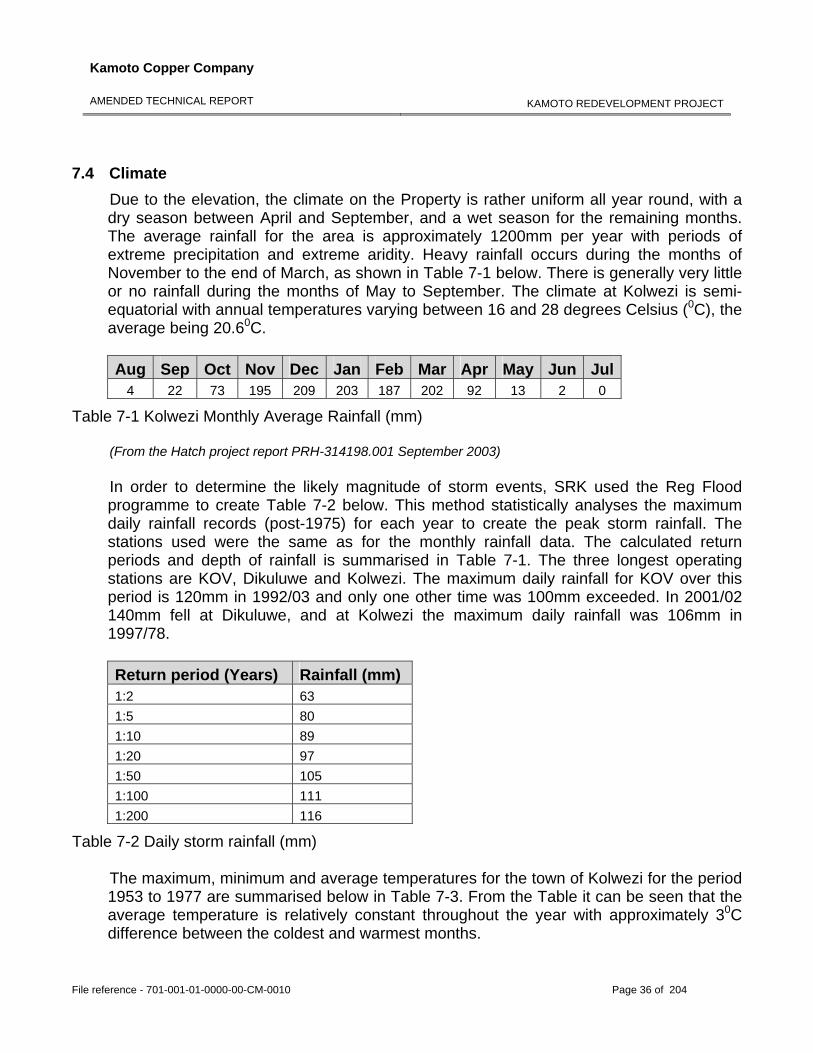
Kamoto Copper Company
AMENDED TECHNICAL REPORT
KAMOTO REDEVELOPMENT PROJECT
File reference - 701-001-01-0000-00-CM-0010 Page 36 of 204
7.4 Climate Due to the elevation, the climate on the Property is rather uniform all year round, with a dry season between April and September, and a wet season for the remaining months. The average rainfall for the area is approximately 1200mm per year with periods of extreme precipitation and extreme aridity. Heavy rainfall occurs during the months of November to the end of March, as shown in Table 7-1 below. There is generally very little or no rainfall during the months of May to September. The climate at Kolwezi is semi-equatorial with annual temperatures varying between 16 and 28 degrees Celsius (0C), the average being 20.60C.
Aug Sep Oct Nov Dec Jan Feb Mar Apr May Jun Jul
4 22 73 195 209 203 187 202 92 13 2 0
Table 7-1 Kolwezi Monthly Average Rainfall (mm)
(From the Hatch project report PRH-314198.001 September 2003) In order to determine the likely magnitude of storm events, SRK used the Reg Flood programme to create Table 7-2 below. This method statistically analyses the maximum daily rainfall records (post-1975) for each year to create the peak storm rainfall. The stations used were the same as for the monthly rainfall data. The calculated return periods and depth of rainfall is summarised in Table 7-1. The three longest operating stations are KOV, Dikuluwe and Kolwezi. The maximum daily rainfall for KOV over this period is 120mm in 1992/03 and only one other time was 100mm exceeded. In 2001/02 140mm fell at Dikuluwe, and at Kolwezi the maximum daily rainfall was 106mm in 1997/78.
Return period (Years) Rainfall (mm) 1:2 63 1:5 80 1:10 89 1:20 97 1:50 105 1:100 111 1:200 116
Table 7-2 Daily storm rainfall (mm) The maximum, minimum and average temperatures for the town of Kolwezi for the period 1953 to 1977 are summarised below in Table 7-3. From the Table it can be seen that the average temperature is relatively constant throughout the year with approximately 30C difference between the coldest and warmest months.
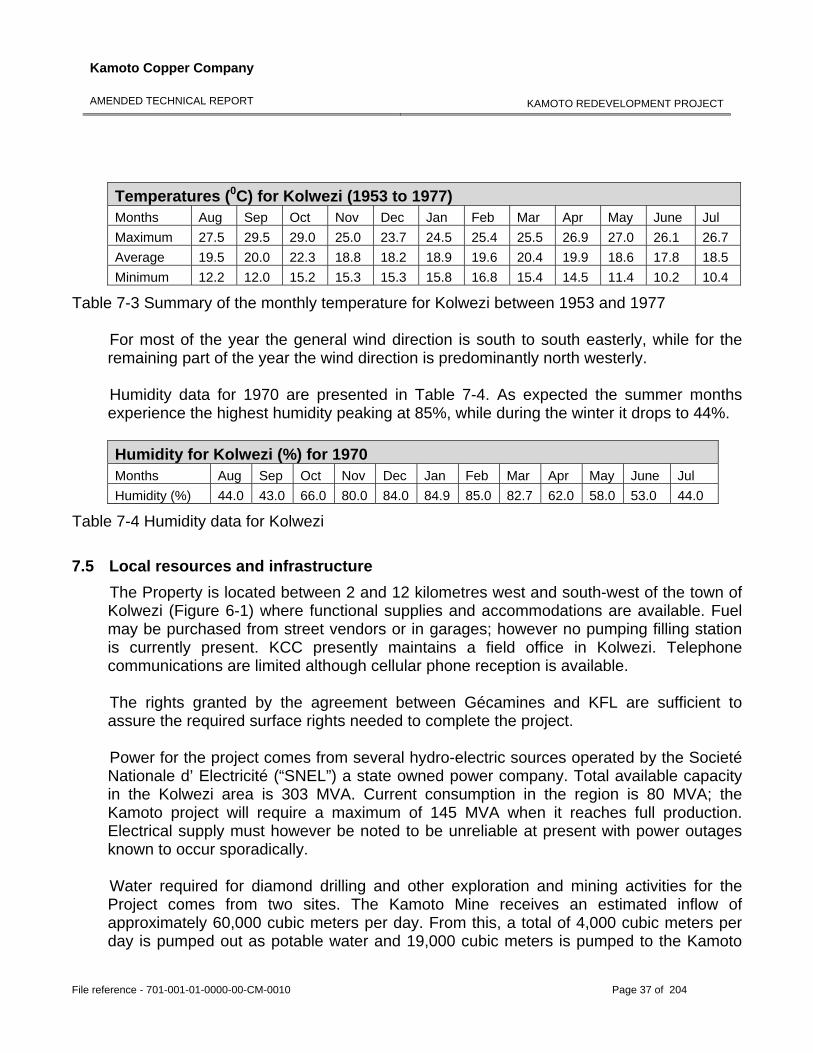
Kamoto Copper Company
AMENDED TECHNICAL REPORT
KAMOTO REDEVELOPMENT PROJECT
File reference - 701-001-01-0000-00-CM-0010 Page 37 of 204
Temperatures (0C) for Kolwezi (1953 to 1977) Months Aug Sep Oct Nov Dec Jan Feb Mar Apr May June Jul Maximum 27.5 29.5 29.0 25.0 23.7 24.5 25.4 25.5 26.9 27.0 26.1 26.7 Average 19.5 20.0 22.3 18.8 18.2 18.9 19.6 20.4 19.9 18.6 17.8 18.5 Minimum 12.2 12.0 15.2 15.3 15.3 15.8 16.8 15.4 14.5 11.4 10.2 10.4
Table 7-3 Summary of the monthly temperature for Kolwezi between 1953 and 1977 For most of the year the general wind direction is south to south easterly, while for the remaining part of the year the wind direction is predominantly north westerly. Humidity data for 1970 are presented in Table 7-4. As expected the summer months experience the highest humidity peaking at 85%, while during the winter it drops to 44%. Humidity for Kolwezi (%) for 1970 Months Aug Sep Oct Nov Dec Jan Feb Mar Apr May June Jul Humidity (%) 44.0 43.0 66.0 80.0 84.0 84.9 85.0 82.7 62.0 58.0 53.0 44.0
Table 7-4 Humidity data for Kolwezi
7.5 Local resources and infrastructure The Property is located between 2 and 12 kilometres west and south-west of the town of Kolwezi (Figure 6-1) where functional supplies and accommodations are available. Fuel may be purchased from street vendors or in garages; however no pumping filling station is currently present. KCC presently maintains a field office in Kolwezi. Telephone communications are limited although cellular phone reception is available. The rights granted by the agreement between Gécamines and KFL are sufficient to assure the required surface rights needed to complete the project. Power for the project comes from several hydro-electric sources operated by the Societé Nationale d’ Electricité (“SNEL”) a state owned power company. Total available capacity in the Kolwezi area is 303 MVA. Current consumption in the region is 80 MVA; the Kamoto project will require a maximum of 145 MVA when it reaches full production. Electrical supply must however be noted to be unreliable at present with power outages known to occur sporadically. Water required for diamond drilling and other exploration and mining activities for the Project comes from two sites. The Kamoto Mine receives an estimated inflow of approximately 60,000 cubic meters per day. From this, a total of 4,000 cubic meters per day is pumped out as potable water and 19,000 cubic meters is pumped to the Kamoto
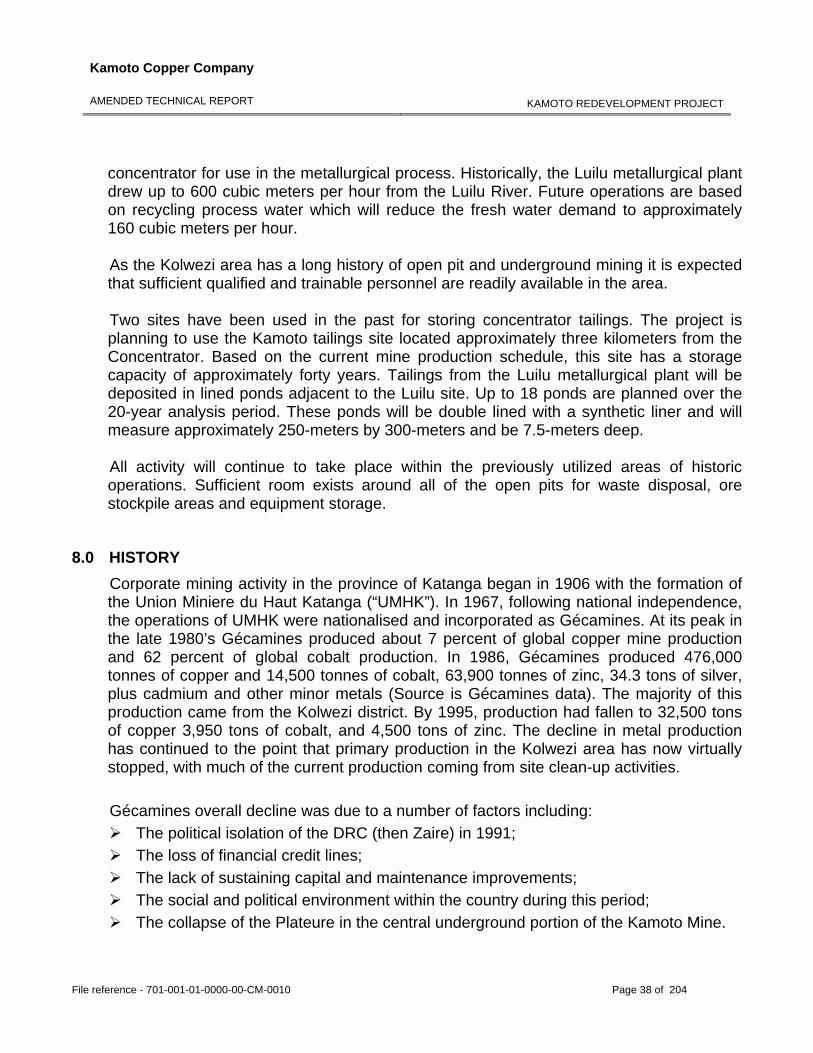
Kamoto Copper Company
AMENDED TECHNICAL REPORT
KAMOTO REDEVELOPMENT PROJECT
File reference - 701-001-01-0000-00-CM-0010 Page 38 of 204
concentrator for use in the metallurgical process. Historically, the Luilu metallurgical plant drew up to 600 cubic meters per hour from the Luilu River. Future operations are based on recycling process water which will reduce the fresh water demand to approximately 160 cubic meters per hour. As the Kolwezi area has a long history of open pit and underground mining it is expected that sufficient qualified and trainable personnel are readily available in the area. Two sites have been used in the past for storing concentrator tailings. The project is planning to use the Kamoto tailings site located approximately three kilometers from the Concentrator. Based on the current mine production schedule, this site has a storage capacity of approximately forty years. Tailings from the Luilu metallurgical plant will be deposited in lined ponds adjacent to the Luilu site. Up to 18 ponds are planned over the 20-year analysis period. These ponds will be double lined with a synthetic liner and will measure approximately 250-meters by 300-meters and be 7.5-meters deep. All activity will continue to take place within the previously utilized areas of historic operations. Sufficient room exists around all of the open pits for waste disposal, ore stockpile areas and equipment storage.
8.0 HISTORY Corporate mining activity in the province of Katanga began in 1906 with the formation of the Union Miniere du Haut Katanga (“UMHK”). In 1967, following national independence, the operations of UMHK were nationalised and incorporated as Gécamines. At its peak in the late 1980’s Gécamines produced about 7 percent of global copper mine production and 62 percent of global cobalt production. In 1986, Gécamines produced 476,000 tonnes of copper and 14,500 tonnes of cobalt, 63,900 tonnes of zinc, 34.3 tons of silver, plus cadmium and other minor metals (Source is Gécamines data). The majority of this production came from the Kolwezi district. By 1995, production had fallen to 32,500 tons of copper 3,950 tons of cobalt, and 4,500 tons of zinc. The decline in metal production has continued to the point that primary production in the Kolwezi area has now virtually stopped, with much of the current production coming from site clean-up activities.
Gécamines overall decline was due to a number of factors including: The political isolation of the DRC (then Zaire) in 1991; The loss of financial credit lines; The lack of sustaining capital and maintenance improvements; The social and political environment within the country during this period; The collapse of the Plateure in the central underground portion of the Kamoto Mine.
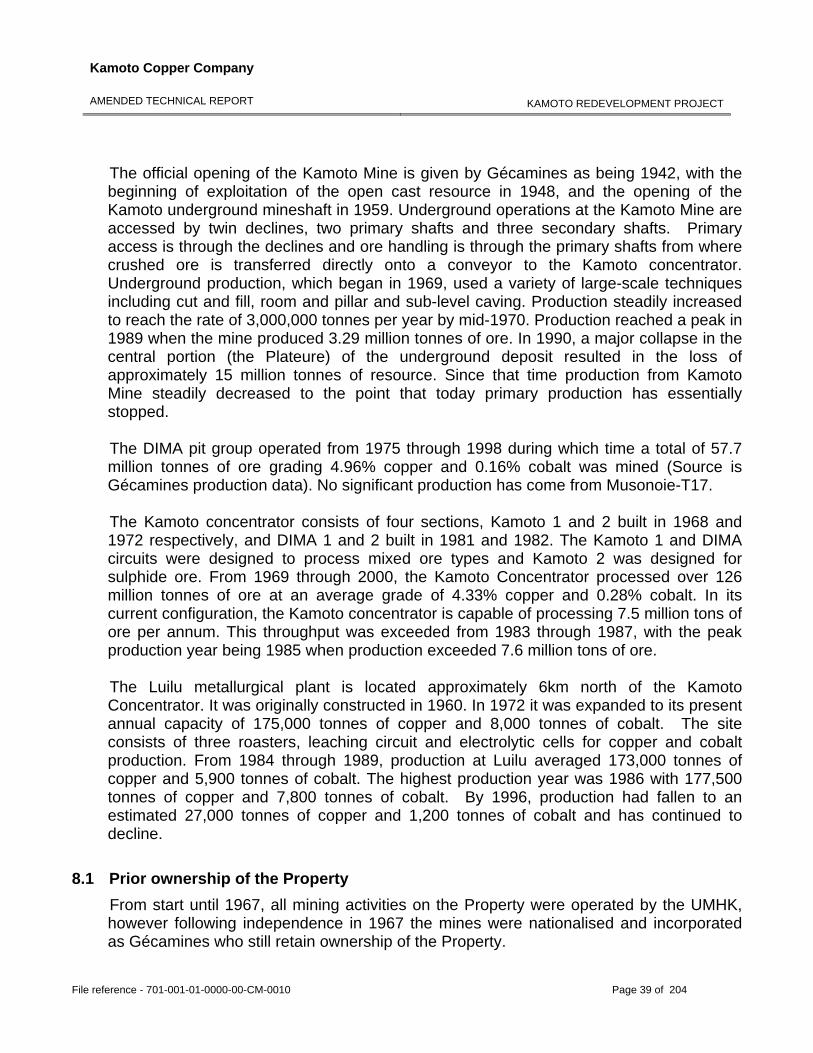
Kamoto Copper Company
AMENDED TECHNICAL REPORT
KAMOTO REDEVELOPMENT PROJECT
File reference - 701-001-01-0000-00-CM-0010 Page 39 of 204
The official opening of the Kamoto Mine is given by Gécamines as being 1942, with the beginning of exploitation of the open cast resource in 1948, and the opening of the Kamoto underground mineshaft in 1959. Underground operations at the Kamoto Mine are accessed by twin declines, two primary shafts and three secondary shafts. Primary access is through the declines and ore handling is through the primary shafts from where crushed ore is transferred directly onto a conveyor to the Kamoto concentrator. Underground production, which began in 1969, used a variety of large-scale techniques including cut and fill, room and pillar and sub-level caving. Production steadily increased to reach the rate of 3,000,000 tonnes per year by mid-1970. Production reached a peak in 1989 when the mine produced 3.29 million tonnes of ore. In 1990, a major collapse in the central portion (the Plateure) of the underground deposit resulted in the loss of approximately 15 million tonnes of resource. Since that time production from Kamoto Mine steadily decreased to the point that today primary production has essentially stopped. The DIMA pit group operated from 1975 through 1998 during which time a total of 57.7 million tonnes of ore grading 4.96% copper and 0.16% cobalt was mined (Source is Gécamines production data). No significant production has come from Musonoie-T17. The Kamoto concentrator consists of four sections, Kamoto 1 and 2 built in 1968 and 1972 respectively, and DIMA 1 and 2 built in 1981 and 1982. The Kamoto 1 and DIMA circuits were designed to process mixed ore types and Kamoto 2 was designed for sulphide ore. From 1969 through 2000, the Kamoto Concentrator processed over 126 million tonnes of ore at an average grade of 4.33% copper and 0.28% cobalt. In its current configuration, the Kamoto concentrator is capable of processing 7.5 million tons of ore per annum. This throughput was exceeded from 1983 through 1987, with the peak production year being 1985 when production exceeded 7.6 million tons of ore. The Luilu metallurgical plant is located approximately 6km north of the Kamoto Concentrator. It was originally constructed in 1960. In 1972 it was expanded to its present annual capacity of 175,000 tonnes of copper and 8,000 tonnes of cobalt. The site consists of three roasters, leaching circuit and electrolytic cells for copper and cobalt production. From 1984 through 1989, production at Luilu averaged 173,000 tonnes of copper and 5,900 tonnes of cobalt. The highest production year was 1986 with 177,500 tonnes of copper and 7,800 tonnes of cobalt. By 1996, production had fallen to an estimated 27,000 tonnes of copper and 1,200 tonnes of cobalt and has continued to decline.
8.1 Prior ownership of the Property From start until 1967, all mining activities on the Property were operated by the UMHK, however following independence in 1967 the mines were nationalised and incorporated as Gécamines who still retain ownership of the Property.
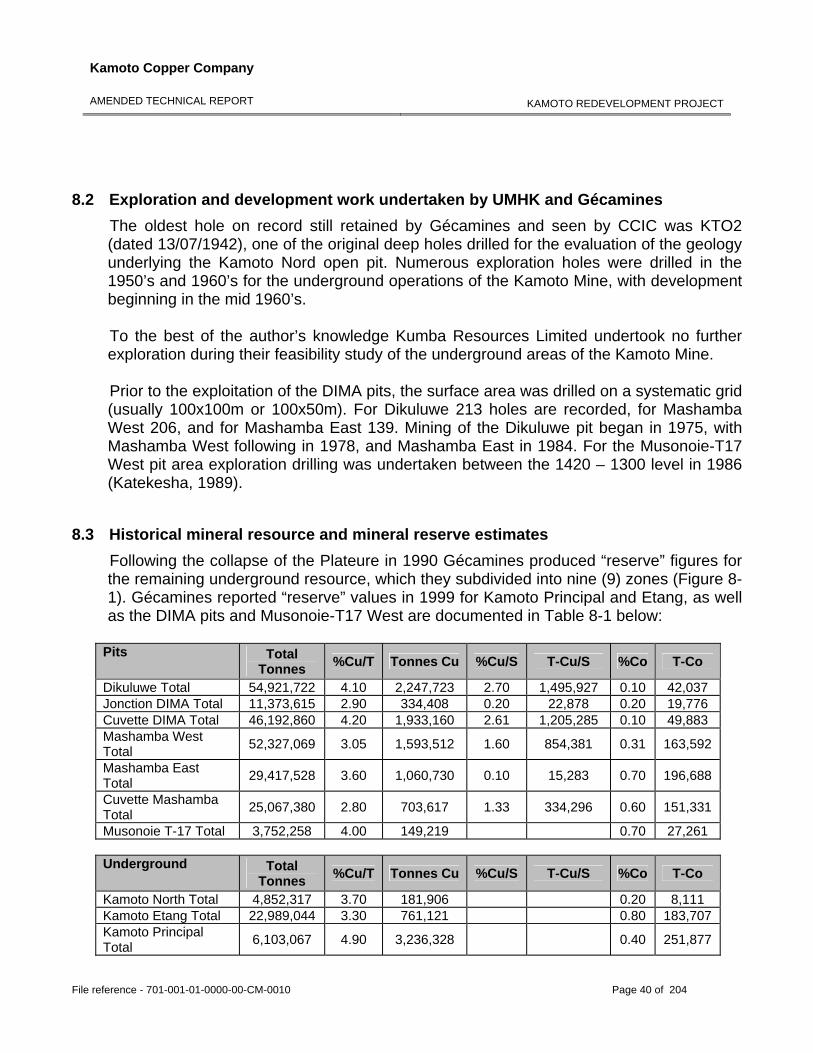
Kamoto Copper Company
AMENDED TECHNICAL REPORT
KAMOTO REDEVELOPMENT PROJECT
File reference - 701-001-01-0000-00-CM-0010 Page 40 of 204
8.2 Exploration and development work undertaken by UMHK and Gécamines
The oldest hole on record still retained by Gécamines and seen by CCIC was KTO2 (dated 13/07/1942), one of the original deep holes drilled for the evaluation of the geology underlying the Kamoto Nord open pit. Numerous exploration holes were drilled in the 1950’s and 1960’s for the underground operations of the Kamoto Mine, with development beginning in the mid 1960’s. To the best of the author’s knowledge Kumba Resources Limited undertook no further exploration during their feasibility study of the underground areas of the Kamoto Mine. Prior to the exploitation of the DIMA pits, the surface area was drilled on a systematic grid (usually 100x100m or 100x50m). For Dikuluwe 213 holes are recorded, for Mashamba West 206, and for Mashamba East 139. Mining of the Dikuluwe pit began in 1975, with Mashamba West following in 1978, and Mashamba East in 1984. For the Musonoie-T17 West pit area exploration drilling was undertaken between the 1420 – 1300 level in 1986 (Katekesha, 1989).
8.3 Historical mineral resource and mineral reserve estimates Following the collapse of the Plateure in 1990 Gécamines produced “reserve” figures for the remaining underground resource, which they subdivided into nine (9) zones (Figure 8-1). Gécamines reported “reserve” values in 1999 for Kamoto Principal and Etang, as well as the DIMA pits and Musonoie-T17 West are documented in Table 8-1 below:
Pits Total Tonnes %Cu/T Tonnes Cu %Cu/S T-Cu/S %Co T-Co
Dikuluwe Total 54,921,722 4.10 2,247,723 2.70 1,495,927 0.10 42,037 Jonction DIMA Total 11,373,615 2.90 334,408 0.20 22,878 0.20 19,776 Cuvette DIMA Total 46,192,860 4.20 1,933,160 2.61 1,205,285 0.10 49,883 Mashamba West Total 52,327,069 3.05 1,593,512 1.60 854,381 0.31 163,592
Mashamba East Total 29,417,528 3.60 1,060,730 0.10 15,283 0.70 196,688
Cuvette Mashamba Total 25,067,380 2.80 703,617 1.33 334,296 0.60 151,331
Musonoie T-17 Total 3,752,258 4.00 149,219 0.70 27,261
Underground Total Tonnes %Cu/T Tonnes Cu %Cu/S T-Cu/S %Co T-Co
Kamoto North Total 4,852,317 3.70 181,906 0.20 8,111 Kamoto Etang Total 22,989,044 3.30 761,121 0.80 183,707 Kamoto Principal Total 6,103,067 4.90 3,236,328 0.40 251,877
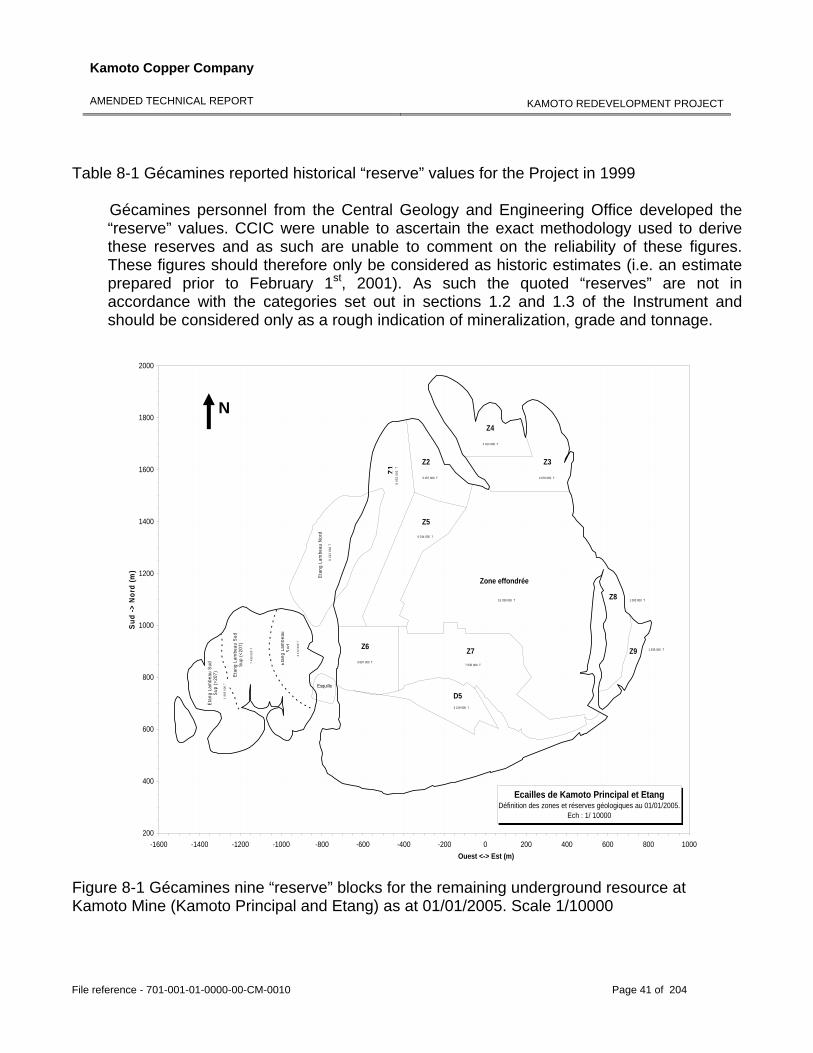
Kamoto Copper Company
AMENDED TECHNICAL REPORT
KAMOTO REDEVELOPMENT PROJECT
File reference - 701-001-01-0000-00-CM-0010 Page 41 of 204
Table 8-1 Gécamines reported historical “reserve” values for the Project in 1999 Gécamines personnel from the Central Geology and Engineering Office developed the “reserve” values. CCIC were unable to ascertain the exact methodology used to derive these reserves and as such are unable to comment on the reliability of these figures. These figures should therefore only be considered as historic estimates (i.e. an estimate prepared prior to February 1st, 2001). As such the quoted “reserves” are not in accordance with the categories set out in sections 1.2 and 1.3 of the Instrument and should be considered only as a rough indication of mineralization, grade and tonnage.
Ecailles de Kamoto Principal et EtangDéfinition des zones et réserves géologiques au 01/01/2005.
Ech : 1/ 10000
200
400
600
800
1000
1200
1400
1600
1800
2000
-1600 -1400 -1200 -1000 -800 -600 -400 -200 0 200 400 600 800 1000Ouest <-> Est (m)
Sud
-> N
ord
(m)
Zone effondrée
Z1
Z2 Z3
Z4
Z5
Z6 Z7
Z8
Z9
D5
8 05
2 00
0 T
3 157 000 T
4 014 000 T
4 076 000 T
15 330 000 T
6 014 000 T
3 897 000 T
1 535 000 T
1 003 000 T
7 535 000 T
3 219 000 T
Eta
ng L
ambe
au N
ord
9 22
2 00
0 T
4 17
2 00
0 T
Eta
ng L
ambe
au S
udS
up (>
207)
Eta
ng L
ambe
au
Sud
1 98
3 00
0 T
Eta
ng L
ambe
au S
udSu
p (<
207)
7 45
9 00
0 T
Esquille
Figure 8-1 Gécamines nine “reserve” blocks for the remaining underground resource at Kamoto Mine (Kamoto Principal and Etang) as at 01/01/2005. Scale 1/10000
N
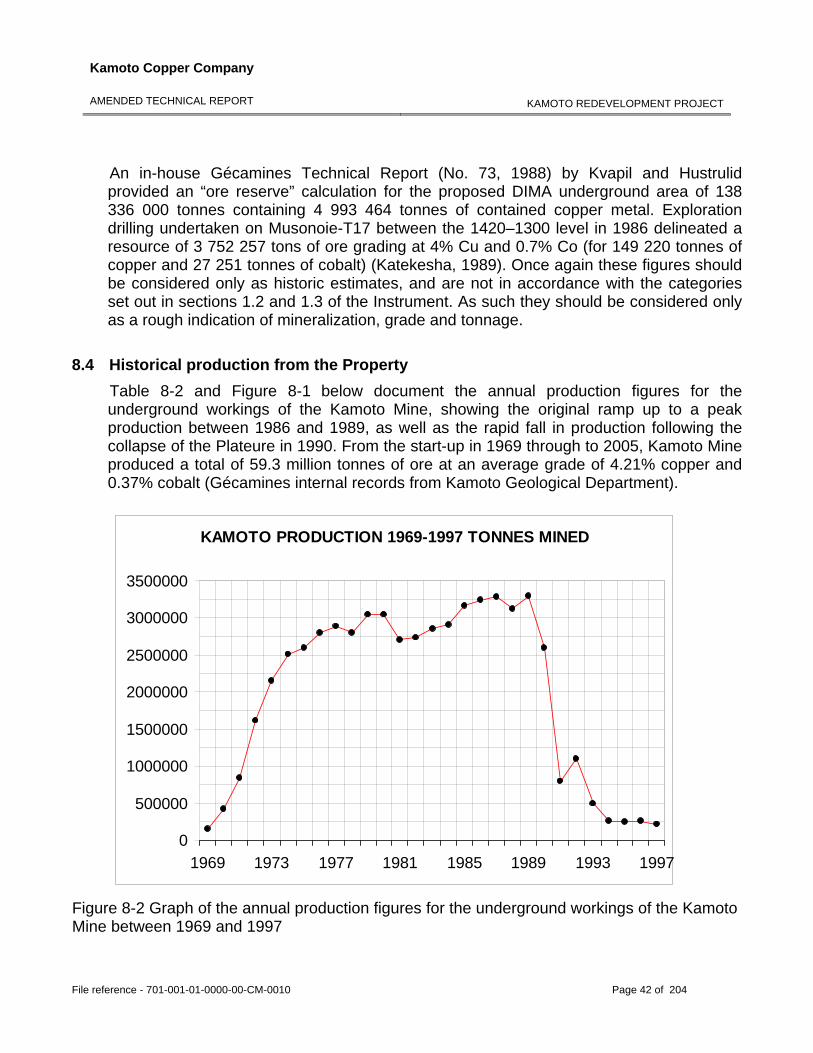
Kamoto Copper Company
AMENDED TECHNICAL REPORT
KAMOTO REDEVELOPMENT PROJECT
File reference - 701-001-01-0000-00-CM-0010 Page 42 of 204
An in-house Gécamines Technical Report (No. 73, 1988) by Kvapil and Hustrulid provided an “ore reserve” calculation for the proposed DIMA underground area of 138 336 000 tonnes containing 4 993 464 tonnes of contained copper metal. Exploration drilling undertaken on Musonoie-T17 between the 1420–1300 level in 1986 delineated a resource of 3 752 257 tons of ore grading at 4% Cu and 0.7% Co (for 149 220 tonnes of copper and 27 251 tonnes of cobalt) (Katekesha, 1989). Once again these figures should be considered only as historic estimates, and are not in accordance with the categories set out in sections 1.2 and 1.3 of the Instrument. As such they should be considered only as a rough indication of mineralization, grade and tonnage.
8.4 Historical production from the Property Table 8-2 and Figure 8-1 below document the annual production figures for the underground workings of the Kamoto Mine, showing the original ramp up to a peak production between 1986 and 1989, as well as the rapid fall in production following the collapse of the Plateure in 1990. From the start-up in 1969 through to 2005, Kamoto Mine produced a total of 59.3 million tonnes of ore at an average grade of 4.21% copper and 0.37% cobalt (Gécamines internal records from Kamoto Geological Department).
KAMOTO PRODUCTION 1969-1997 TONNES MINED
0
500000
1000000
1500000
2000000
2500000
3000000
3500000
1969 1973 1977 1981 1985 1989 1993 1997
Figure 8-2 Graph of the annual production figures for the underground workings of the Kamoto Mine between 1969 and 1997
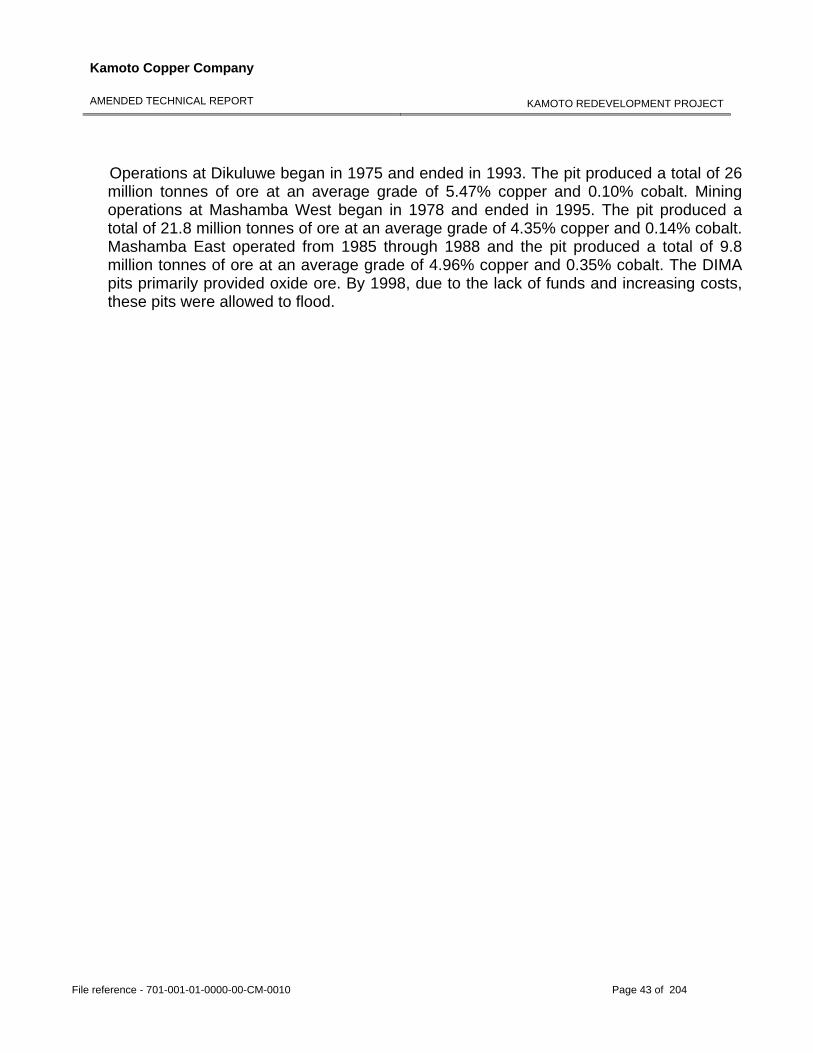
Kamoto Copper Company
AMENDED TECHNICAL REPORT
KAMOTO REDEVELOPMENT PROJECT
File reference - 701-001-01-0000-00-CM-0010 Page 43 of 204
Operations at Dikuluwe began in 1975 and ended in 1993. The pit produced a total of 26 million tonnes of ore at an average grade of 5.47% copper and 0.10% cobalt. Mining operations at Mashamba West began in 1978 and ended in 1995. The pit produced a total of 21.8 million tonnes of ore at an average grade of 4.35% copper and 0.14% cobalt. Mashamba East operated from 1985 through 1988 and the pit produced a total of 9.8 million tonnes of ore at an average grade of 4.96% copper and 0.35% cobalt. The DIMA pits primarily provided oxide ore. By 1998, due to the lack of funds and increasing costs, these pits were allowed to flood.
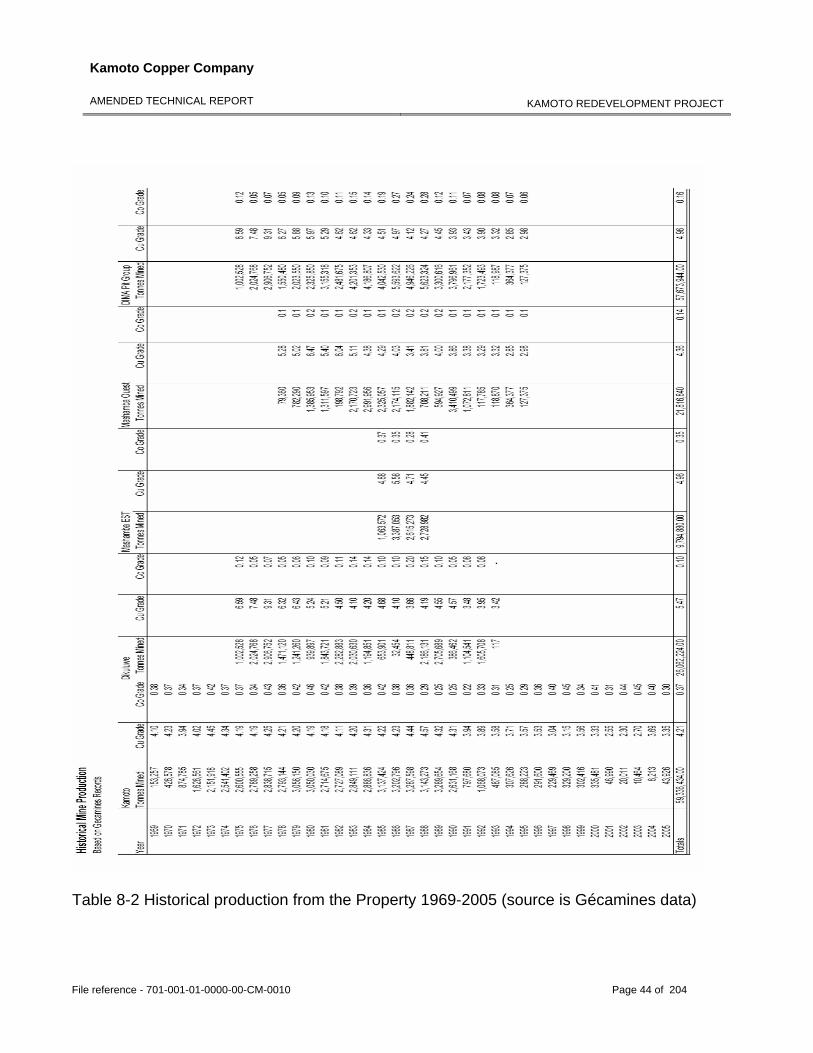
Kamoto Copper Company
AMENDED TECHNICAL REPORT
KAMOTO REDEVELOPMENT PROJECT
File reference - 701-001-01-0000-00-CM-0010 Page 44 of 204
Table 8-2 Historical production from the Property 1969-2005 (source is Gécamines data)
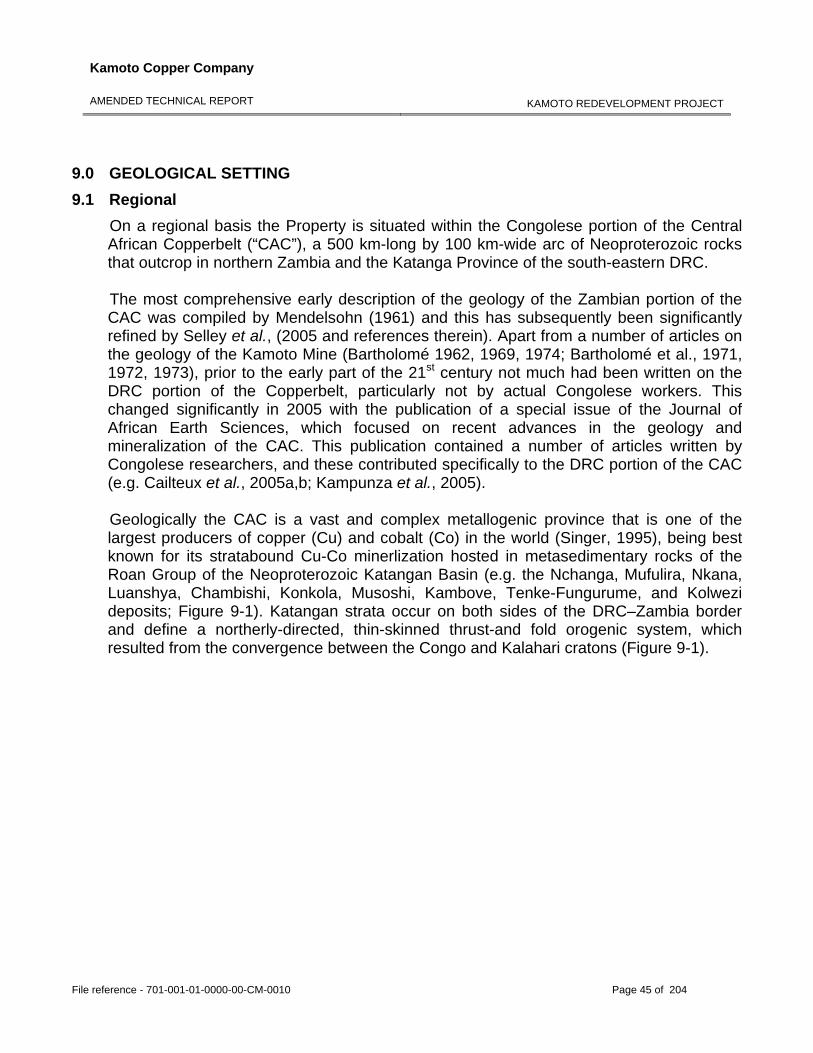
Kamoto Copper Company
AMENDED TECHNICAL REPORT
KAMOTO REDEVELOPMENT PROJECT
File reference - 701-001-01-0000-00-CM-0010 Page 45 of 204
9.0 GEOLOGICAL SETTING 9.1 Regional
On a regional basis the Property is situated within the Congolese portion of the Central African Copperbelt (“CAC”), a 500 km-long by 100 km-wide arc of Neoproterozoic rocks that outcrop in northern Zambia and the Katanga Province of the south-eastern DRC. The most comprehensive early description of the geology of the Zambian portion of the CAC was compiled by Mendelsohn (1961) and this has subsequently been significantly refined by Selley et al., (2005 and references therein). Apart from a number of articles on the geology of the Kamoto Mine (Bartholomé 1962, 1969, 1974; Bartholomé et al., 1971, 1972, 1973), prior to the early part of the 21st century not much had been written on the DRC portion of the Copperbelt, particularly not by actual Congolese workers. This changed significantly in 2005 with the publication of a special issue of the Journal of African Earth Sciences, which focused on recent advances in the geology and mineralization of the CAC. This publication contained a number of articles written by Congolese researchers, and these contributed specifically to the DRC portion of the CAC (e.g. Cailteux et al., 2005a,b; Kampunza et al., 2005). Geologically the CAC is a vast and complex metallogenic province that is one of the largest producers of copper (Cu) and cobalt (Co) in the world (Singer, 1995), being best known for its stratabound Cu-Co minerlization hosted in metasedimentary rocks of the Roan Group of the Neoproterozoic Katangan Basin (e.g. the Nchanga, Mufulira, Nkana, Luanshya, Chambishi, Konkola, Musoshi, Kambove, Tenke-Fungurume, and Kolwezi deposits; Figure 9-1). Katangan strata occur on both sides of the DRC–Zambia border and define a northerly-directed, thin-skinned thrust-and fold orogenic system, which resulted from the convergence between the Congo and Kalahari cratons (Figure 9-1).
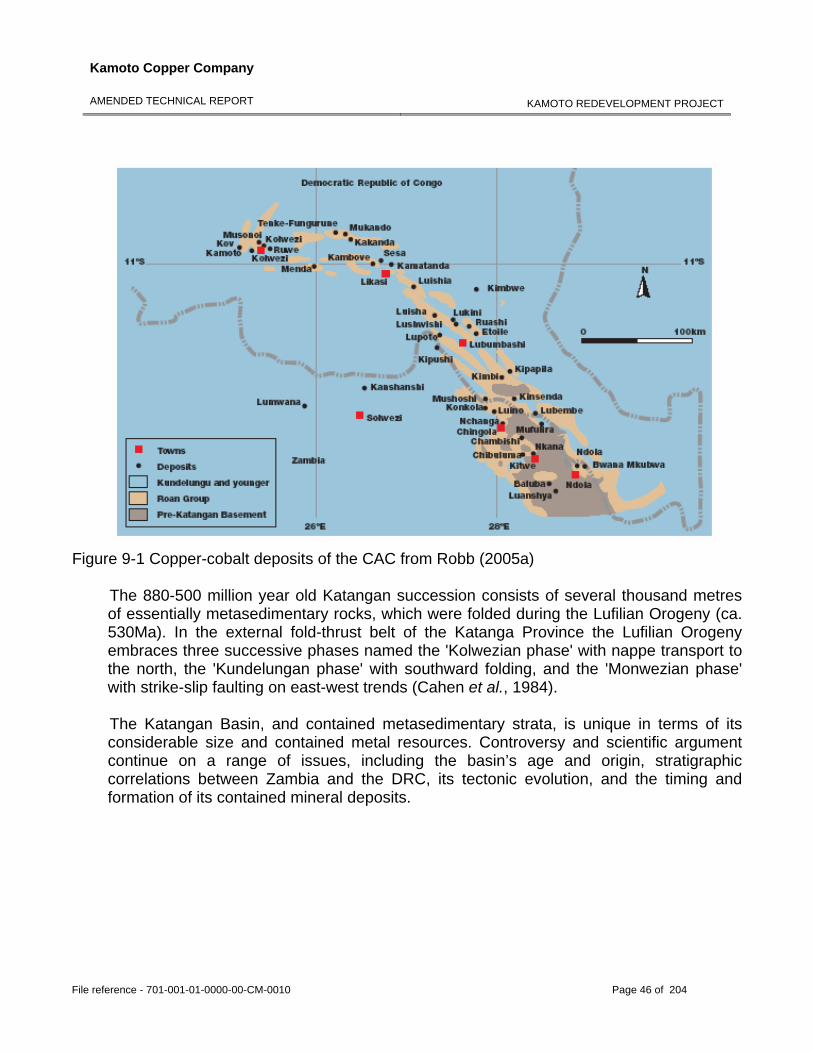
Kamoto Copper Company
AMENDED TECHNICAL REPORT
KAMOTO REDEVELOPMENT PROJECT
File reference - 701-001-01-0000-00-CM-0010 Page 46 of 204
Figure 9-1 Copper-cobalt deposits of the CAC from Robb (2005a)
The 880-500 million year old Katangan succession consists of several thousand metres of essentially metasedimentary rocks, which were folded during the Lufilian Orogeny (ca. 530Ma). In the external fold-thrust belt of the Katanga Province the Lufilian Orogeny embraces three successive phases named the 'Kolwezian phase' with nappe transport to the north, the 'Kundelungan phase' with southward folding, and the 'Monwezian phase' with strike-slip faulting on east-west trends (Cahen et al., 1984). The Katangan Basin, and contained metasedimentary strata, is unique in terms of its considerable size and contained metal resources. Controversy and scientific argument continue on a range of issues, including the basin’s age and origin, stratigraphic correlations between Zambia and the DRC, its tectonic evolution, and the timing and formation of its contained mineral deposits.
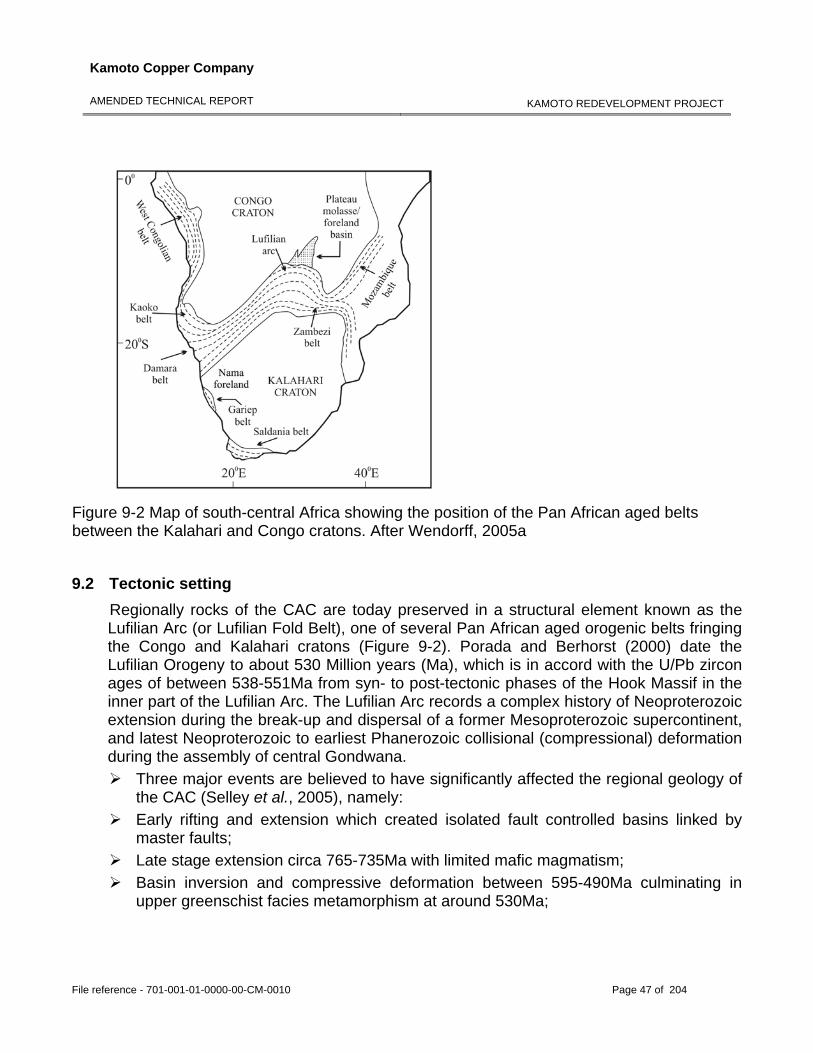
Kamoto Copper Company
AMENDED TECHNICAL REPORT
KAMOTO REDEVELOPMENT PROJECT
File reference - 701-001-01-0000-00-CM-0010 Page 47 of 204
Figure 9-2 Map of south-central Africa showing the position of the Pan African aged belts between the Kalahari and Congo cratons. After Wendorff, 2005a 9.2 Tectonic setting
Regionally rocks of the CAC are today preserved in a structural element known as the Lufilian Arc (or Lufilian Fold Belt), one of several Pan African aged orogenic belts fringing the Congo and Kalahari cratons (Figure 9-2). Porada and Berhorst (2000) date the Lufilian Orogeny to about 530 Million years (Ma), which is in accord with the U/Pb zircon ages of between 538-551Ma from syn- to post-tectonic phases of the Hook Massif in the inner part of the Lufilian Arc. The Lufilian Arc records a complex history of Neoproterozoic extension during the break-up and dispersal of a former Mesoproterozoic supercontinent, and latest Neoproterozoic to earliest Phanerozoic collisional (compressional) deformation during the assembly of central Gondwana.
Three major events are believed to have significantly affected the regional geology of the CAC (Selley et al., 2005), namely:
Early rifting and extension which created isolated fault controlled basins linked by master faults;
Late stage extension circa 765-735Ma with limited mafic magmatism; Basin inversion and compressive deformation between 595-490Ma culminating in
upper greenschist facies metamorphism at around 530Ma;
Kamoto Copper Company
AMENDED TECHNICAL REPORT
KAMOTO REDEVELOPMENT PROJECT
File reference - 701-001-01-0000-00-CM-0010 Page 48 of 204
9.3 Basement to the Katangan Basin The Katangan Basin overlies a composite basement made up of older, multiply deformed, and metamorphosed, polygenetic plutonic intrusives (mostly of granitic affinity) and supracrustal metavolcano-sedimentary sequences. This basement is largely around 2,100 to 1,900Ma (Palaeoproterozoic), although evidence now exists for even older (largely unexposed) Archaean basement in the DRC segment (Rainaud et al., 2005). Recent work by Armstrong et al. (2005) provides a new 880Ma age for the Nchanga granite (part of the basement to the Katangan Basin) which effectively constrains Katangan deposition to the Neoproterozoic, somewhat younger than previously thought.
9.4 Katangan Basin The Katangan Basin may have formed as Rodinia (a precursor supercontinent to Gondwana) began to fragment along a previously sutured corridor between the Kalahari and Congo cratons (Unrug, 1997), forming eastward younging basins from Namibia to Mozambique between 1100 and 850Ma. The metasedimentary rocks that host the Copperbelt ores form a sequence known as the Katanga Supergroup, the two major parts of which are the Roan and Kundelungu groups. The minimum age of the Katangan succession may be constrained between 602Ma and possibly 656Ma, on the basis of the age of post-Kundelungu uraninite veins and on the ages assigned to the mineralizing events (Master, 1998); the maximum age is constrained at 880Ma by the Nchanga granite, as noted above. The Katangan sequence in the CAC has historically been subdivided into the Roan, Lower Kundelungu and Upper Kundelungu units. Most authors now agree on the Katangan supracrustal succession being subdivided into three lithostratigraphic units (e.g. Cailteux, 2003 and references therein): Roan (code R), N’Guba (code Ng; formerly Lower Kundelungu Series or Kundelungu Inferieur (Ki)) and Kundelungu (code Ku; formerly Upper Kundelungu Series or Kundelungu Superieur (Ks)) groups (Table 9-1). The Roan Group is the major metalliferous horizon and was previously subdivided into four groups, which from the top down were the: Mwashya (R.4); Dipeta (R.3); Mines (R.2; the old “Serie des Mines”) and the RAT group (R1). A non-inclusive list of orebodies located in the Mines Series includes: Congo Star (Étoile du Congo), Ruashi, Luiswishi, Lukuni, Kasonta, Luishia, Kamatanda, Likasi, Kambove, west Kambove, Fungurume, Musonoie and Ruwe. Recent work has seen slight modifications to this nomenclature to bring it in line with international standards, with the four groups being given Subgroup status. The stratigraphic nomenclature followed for this Report is provided in Table 9-1.
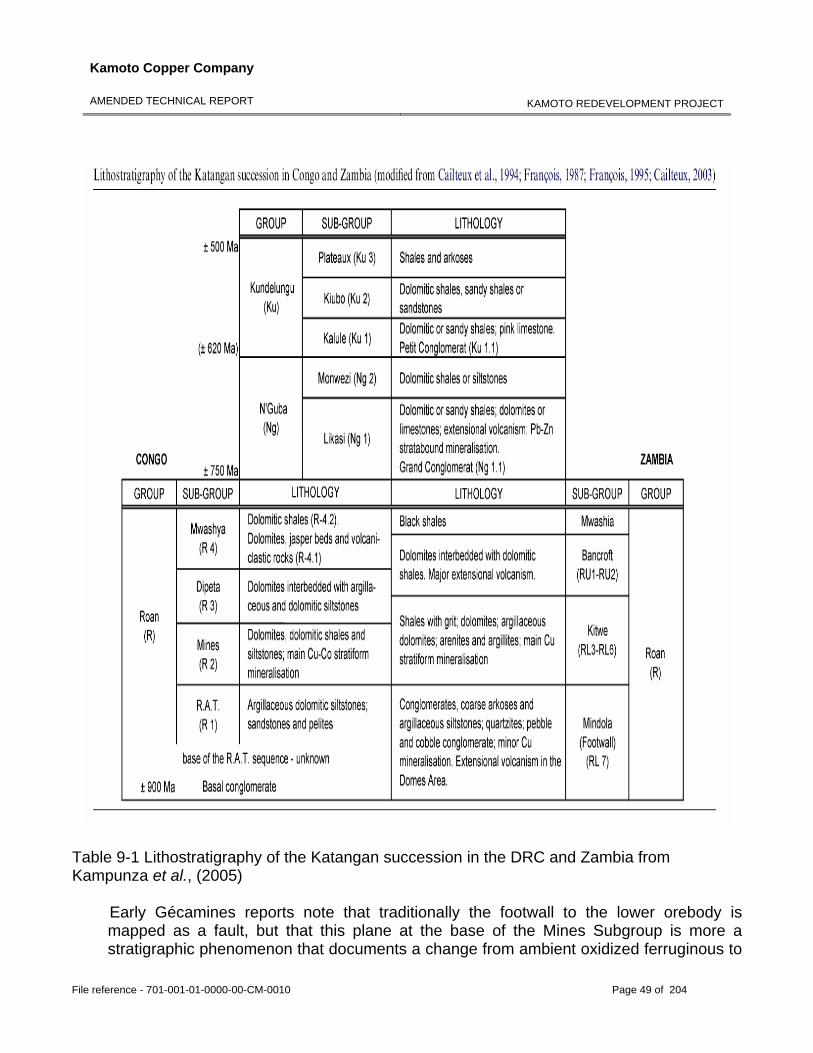
Kamoto Copper Company
AMENDED TECHNICAL REPORT
KAMOTO REDEVELOPMENT PROJECT
File reference - 701-001-01-0000-00-CM-0010 Page 49 of 204
Table 9-1 Lithostratigraphy of the Katangan succession in the DRC and Zambia from Kampunza et al., (2005)
Early Gécamines reports note that traditionally the footwall to the lower orebody is mapped as a fault, but that this plane at the base of the Mines Subgroup is more a stratigraphic phenomenon that documents a change from ambient oxidized ferruginous to
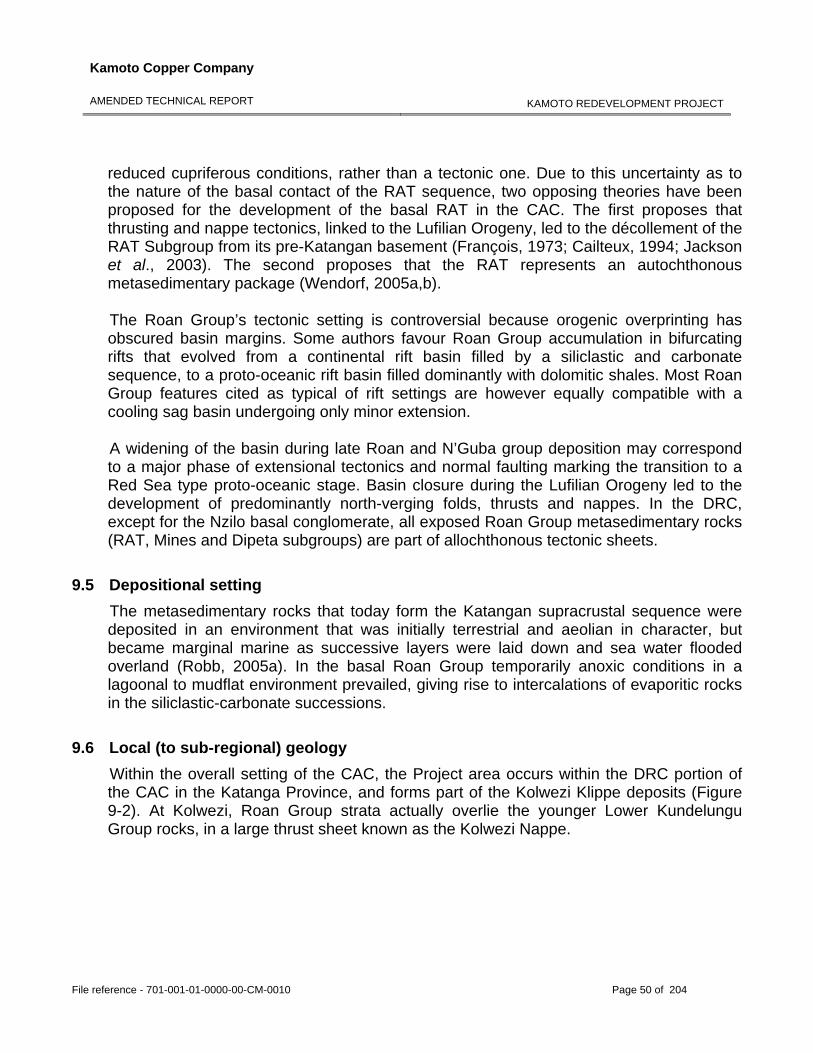
Kamoto Copper Company
AMENDED TECHNICAL REPORT
KAMOTO REDEVELOPMENT PROJECT
File reference - 701-001-01-0000-00-CM-0010 Page 50 of 204
reduced cupriferous conditions, rather than a tectonic one. Due to this uncertainty as to the nature of the basal contact of the RAT sequence, two opposing theories have been proposed for the development of the basal RAT in the CAC. The first proposes that thrusting and nappe tectonics, linked to the Lufilian Orogeny, led to the décollement of the RAT Subgroup from its pre-Katangan basement (François, 1973; Cailteux, 1994; Jackson et al., 2003). The second proposes that the RAT represents an autochthonous metasedimentary package (Wendorf, 2005a,b). The Roan Group’s tectonic setting is controversial because orogenic overprinting has obscured basin margins. Some authors favour Roan Group accumulation in bifurcating rifts that evolved from a continental rift basin filled by a siliclastic and carbonate sequence, to a proto-oceanic rift basin filled dominantly with dolomitic shales. Most Roan Group features cited as typical of rift settings are however equally compatible with a cooling sag basin undergoing only minor extension. A widening of the basin during late Roan and N’Guba group deposition may correspond to a major phase of extensional tectonics and normal faulting marking the transition to a Red Sea type proto-oceanic stage. Basin closure during the Lufilian Orogeny led to the development of predominantly north-verging folds, thrusts and nappes. In the DRC, except for the Nzilo basal conglomerate, all exposed Roan Group metasedimentary rocks (RAT, Mines and Dipeta subgroups) are part of allochthonous tectonic sheets.
9.5 Depositional setting The metasedimentary rocks that today form the Katangan supracrustal sequence were deposited in an environment that was initially terrestrial and aeolian in character, but became marginal marine as successive layers were laid down and sea water flooded overland (Robb, 2005a). In the basal Roan Group temporarily anoxic conditions in a lagoonal to mudflat environment prevailed, giving rise to intercalations of evaporitic rocks in the siliclastic-carbonate successions.
9.6 Local (to sub-regional) geology Within the overall setting of the CAC, the Project area occurs within the DRC portion of the CAC in the Katanga Province, and forms part of the Kolwezi Klippe deposits (Figure 9-2). At Kolwezi, Roan Group strata actually overlie the younger Lower Kundelungu Group rocks, in a large thrust sheet known as the Kolwezi Nappe.
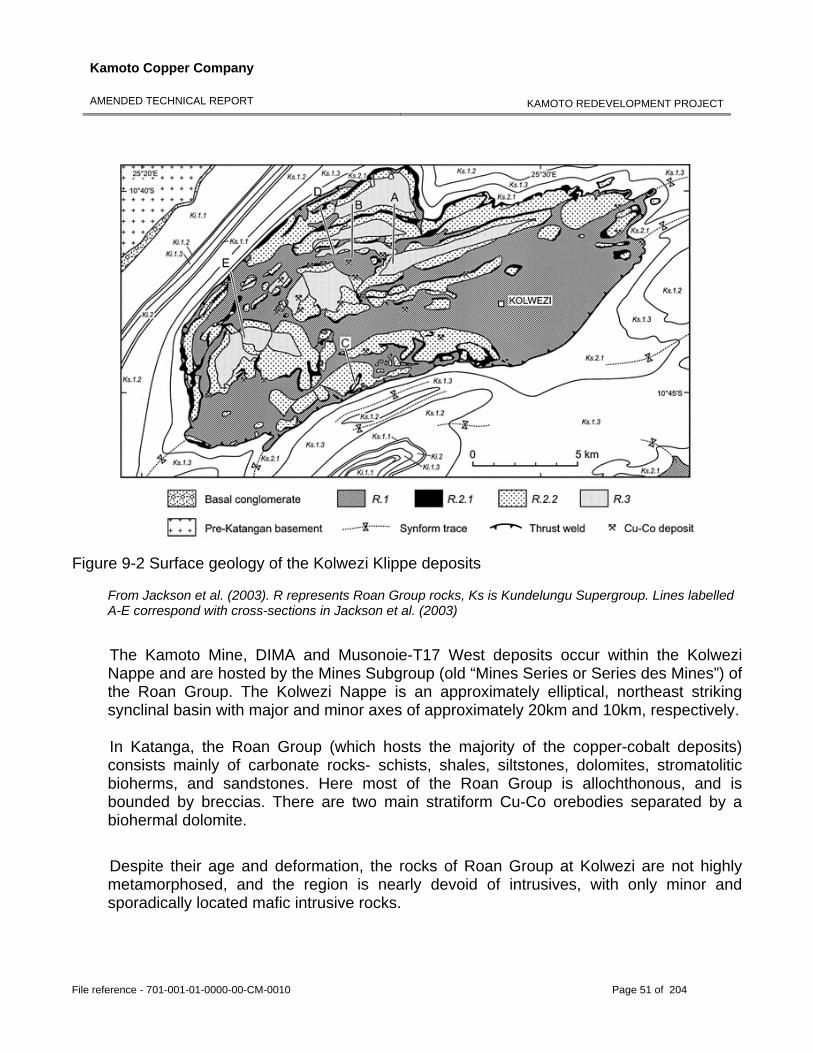
Kamoto Copper Company
AMENDED TECHNICAL REPORT
KAMOTO REDEVELOPMENT PROJECT
File reference - 701-001-01-0000-00-CM-0010 Page 51 of 204
Figure 9-2 Surface geology of the Kolwezi Klippe deposits From Jackson et al. (2003). R represents Roan Group rocks, Ks is Kundelungu Supergroup. Lines labelled A-E correspond with cross-sections in Jackson et al. (2003)
The Kamoto Mine, DIMA and Musonoie-T17 West deposits occur within the Kolwezi Nappe and are hosted by the Mines Subgroup (old “Mines Series or Series des Mines”) of the Roan Group. The Kolwezi Nappe is an approximately elliptical, northeast striking synclinal basin with major and minor axes of approximately 20km and 10km, respectively. In Katanga, the Roan Group (which hosts the majority of the copper-cobalt deposits) consists mainly of carbonate rocks- schists, shales, siltstones, dolomites, stromatolitic bioherms, and sandstones. Here most of the Roan Group is allochthonous, and is bounded by breccias. There are two main stratiform Cu-Co orebodies separated by a biohermal dolomite.
Despite their age and deformation, the rocks of Roan Group at Kolwezi are not highly metamorphosed, and the region is nearly devoid of intrusives, with only minor and sporadically located mafic intrusive rocks.
Kamoto Copper Company
AMENDED TECHNICAL REPORT
KAMOTO REDEVELOPMENT PROJECT
File reference - 701-001-01-0000-00-CM-0010 Page 52 of 204
9.7 General stratigraphy Table 9-2 shows a simplified lithostratigraphy of the RAT and Mines subgroups of the Katangan Belt.
Table 9-2 Lithostratigraphy of the RAT and mines subgroups in the Katangan belt of the DRC from Kampunza et al. (2005)
Most of the original stratigraphic nomenclature was derived from that used by local prospectors and miners. Although now often replaced, these terms are entrenched in the literature and mine jargon, and their usage is indicated here in parentheses for ease of reference. Figure 9-3 shows the general succession as used by Gécamines personnel at Kolwezi.
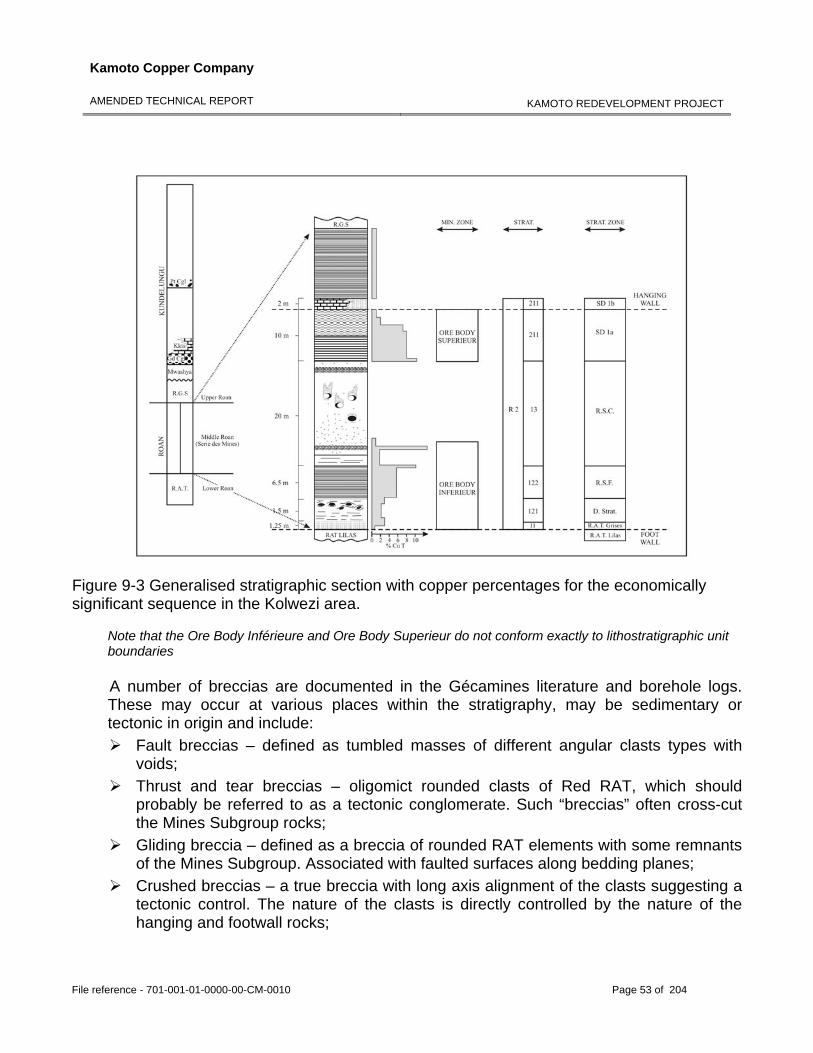
Kamoto Copper Company
AMENDED TECHNICAL REPORT
KAMOTO REDEVELOPMENT PROJECT
File reference - 701-001-01-0000-00-CM-0010 Page 53 of 204
Figure 9-3 Generalised stratigraphic section with copper percentages for the economically significant sequence in the Kolwezi area.
Note that the Ore Body Inférieure and Ore Body Superieur do not conform exactly to lithostratigraphic unit boundaries A number of breccias are documented in the Gécamines literature and borehole logs. These may occur at various places within the stratigraphy, may be sedimentary or tectonic in origin and include:
Fault breccias – defined as tumbled masses of different angular clasts types with voids;
Thrust and tear breccias – oligomict rounded clasts of Red RAT, which should probably be referred to as a tectonic conglomerate. Such “breccias” often cross-cut the Mines Subgroup rocks;
Gliding breccia – defined as a breccia of rounded RAT elements with some remnants of the Mines Subgroup. Associated with faulted surfaces along bedding planes;
Crushed breccias – a true breccia with long axis alignment of the clasts suggesting a tectonic control. The nature of the clasts is directly controlled by the nature of the hanging and footwall rocks;
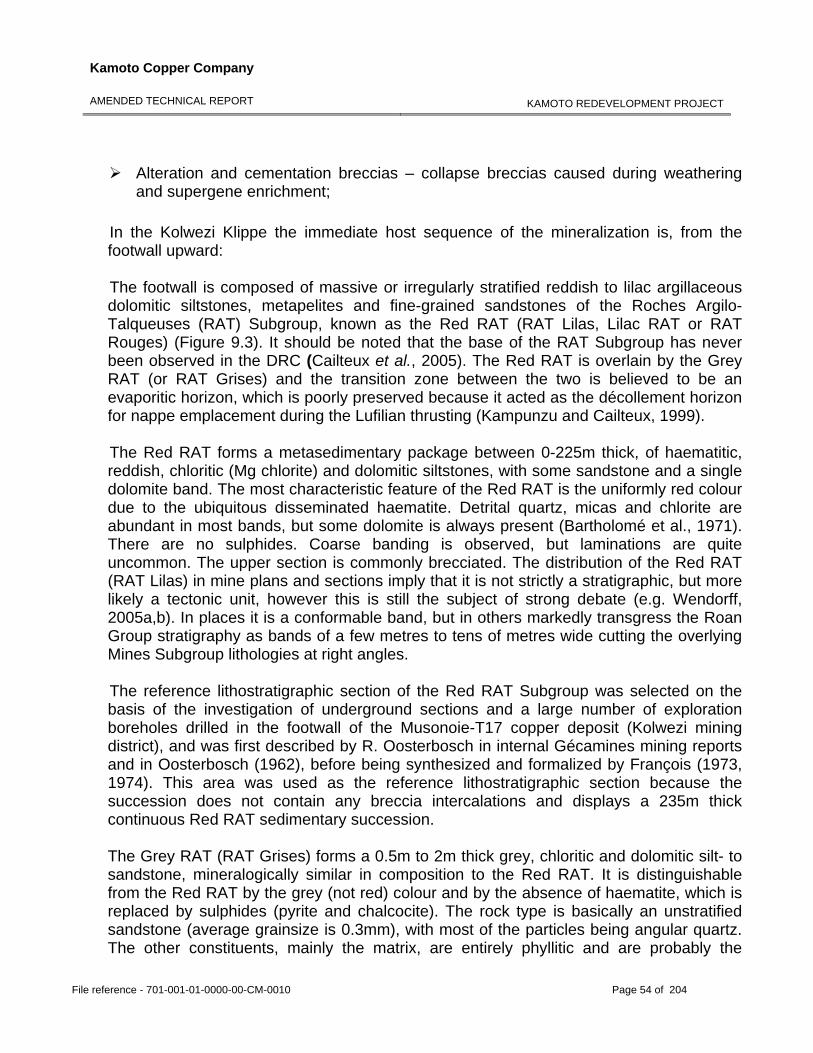
Kamoto Copper Company
AMENDED TECHNICAL REPORT
KAMOTO REDEVELOPMENT PROJECT
File reference - 701-001-01-0000-00-CM-0010 Page 54 of 204
Alteration and cementation breccias – collapse breccias caused during weathering and supergene enrichment;
In the Kolwezi Klippe the immediate host sequence of the mineralization is, from the footwall upward: The footwall is composed of massive or irregularly stratified reddish to lilac argillaceous dolomitic siltstones, metapelites and fine-grained sandstones of the Roches Argilo-Talqueuses (RAT) Subgroup, known as the Red RAT (RAT Lilas, Lilac RAT or RAT Rouges) (Figure 9.3). It should be noted that the base of the RAT Subgroup has never been observed in the DRC (Cailteux et al., 2005). The Red RAT is overlain by the Grey RAT (or RAT Grises) and the transition zone between the two is believed to be an evaporitic horizon, which is poorly preserved because it acted as the décollement horizon for nappe emplacement during the Lufilian thrusting (Kampunzu and Cailteux, 1999). The Red RAT forms a metasedimentary package between 0-225m thick, of haematitic, reddish, chloritic (Mg chlorite) and dolomitic siltstones, with some sandstone and a single dolomite band. The most characteristic feature of the Red RAT is the uniformly red colour due to the ubiquitous disseminated haematite. Detrital quartz, micas and chlorite are abundant in most bands, but some dolomite is always present (Bartholomé et al., 1971). There are no sulphides. Coarse banding is observed, but laminations are quite uncommon. The upper section is commonly brecciated. The distribution of the Red RAT (RAT Lilas) in mine plans and sections imply that it is not strictly a stratigraphic, but more likely a tectonic unit, however this is still the subject of strong debate (e.g. Wendorff, 2005a,b). In places it is a conformable band, but in others markedly transgress the Roan Group stratigraphy as bands of a few metres to tens of metres wide cutting the overlying Mines Subgroup lithologies at right angles. The reference lithostratigraphic section of the Red RAT Subgroup was selected on the basis of the investigation of underground sections and a large number of exploration boreholes drilled in the footwall of the Musonoie-T17 copper deposit (Kolwezi mining district), and was first described by R. Oosterbosch in internal Gécamines mining reports and in Oosterbosch (1962), before being synthesized and formalized by François (1973, 1974). This area was used as the reference lithostratigraphic section because the succession does not contain any breccia intercalations and displays a 235m thick continuous Red RAT sedimentary succession. The Grey RAT (RAT Grises) forms a 0.5m to 2m thick grey, chloritic and dolomitic silt- to sandstone, mineralogically similar in composition to the Red RAT. It is distinguishable from the Red RAT by the grey (not red) colour and by the absence of haematite, which is replaced by sulphides (pyrite and chalcocite). The rock type is basically an unstratified sandstone (average grainsize is 0.3mm), with most of the particles being angular quartz. The other constituents, mainly the matrix, are entirely phyllitic and are probably the
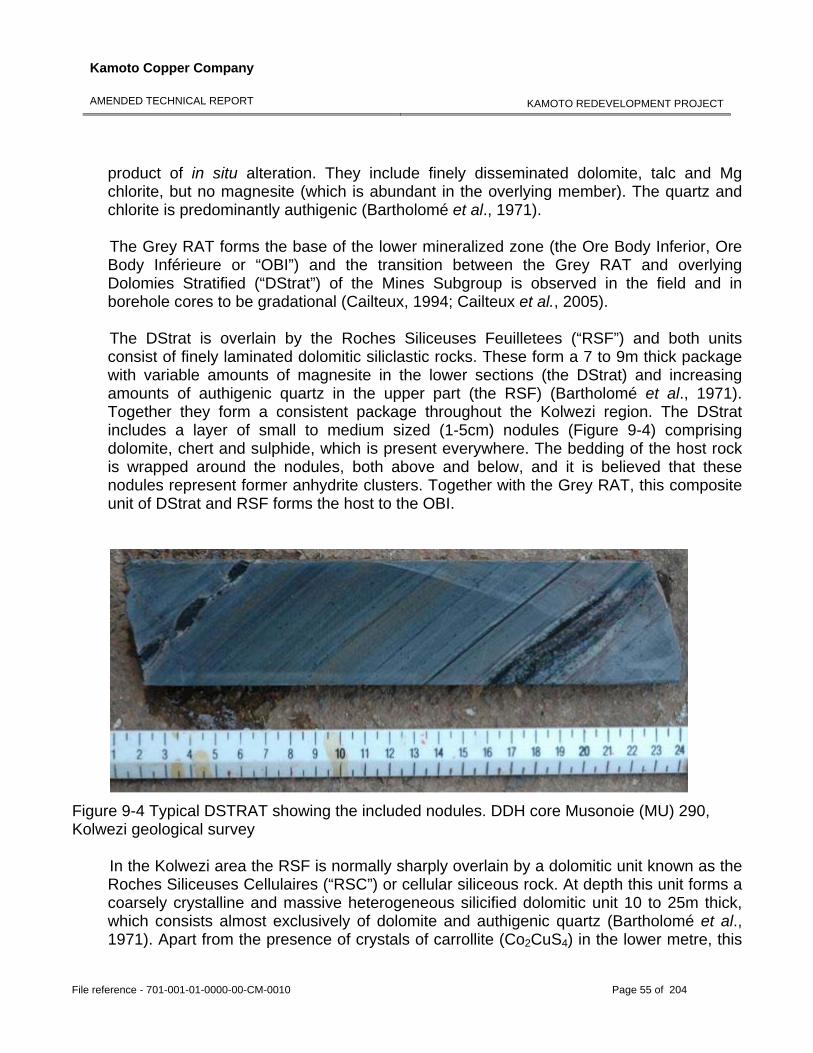
Kamoto Copper Company
AMENDED TECHNICAL REPORT
KAMOTO REDEVELOPMENT PROJECT
File reference - 701-001-01-0000-00-CM-0010 Page 55 of 204
product of in situ alteration. They include finely disseminated dolomite, talc and Mg chlorite, but no magnesite (which is abundant in the overlying member). The quartz and chlorite is predominantly authigenic (Bartholomé et al., 1971). The Grey RAT forms the base of the lower mineralized zone (the Ore Body Inferior, Ore Body Inférieure or “OBI”) and the transition between the Grey RAT and overlying Dolomies Stratified (“DStrat”) of the Mines Subgroup is observed in the field and in borehole cores to be gradational (Cailteux, 1994; Cailteux et al., 2005). The DStrat is overlain by the Roches Siliceuses Feuilletees (“RSF”) and both units consist of finely laminated dolomitic siliclastic rocks. These form a 7 to 9m thick package with variable amounts of magnesite in the lower sections (the DStrat) and increasing amounts of authigenic quartz in the upper part (the RSF) (Bartholomé et al., 1971). Together they form a consistent package throughout the Kolwezi region. The DStrat includes a layer of small to medium sized (1-5cm) nodules (Figure 9-4) comprising dolomite, chert and sulphide, which is present everywhere. The bedding of the host rock is wrapped around the nodules, both above and below, and it is believed that these nodules represent former anhydrite clusters. Together with the Grey RAT, this composite unit of DStrat and RSF forms the host to the OBI.
Figure 9-4 Typical DSTRAT showing the included nodules. DDH core Musonoie (MU) 290, Kolwezi geological survey
In the Kolwezi area the RSF is normally sharply overlain by a dolomitic unit known as the Roches Siliceuses Cellulaires (“RSC”) or cellular siliceous rock. At depth this unit forms a coarsely crystalline and massive heterogeneous silicified dolomitic unit 10 to 25m thick, which consists almost exclusively of dolomite and authigenic quartz (Bartholomé et al., 1971). Apart from the presence of crystals of carrollite (Co2CuS4) in the lower metre, this
Kamoto Copper Company
AMENDED TECHNICAL REPORT
KAMOTO REDEVELOPMENT PROJECT
File reference - 701-001-01-0000-00-CM-0010 Page 56 of 204
member is largely devoid of sulphides and of carbonaceous material, and usually has no laminations, in contrast to the beds above and below. Remnants of stromatolitic structures assignable to Collenia (Bartholomé et al., 1971) have been found within the member, but most of the rock is massive and coarse grained as a result of intense recrystallisation. Within the zone of weathering the dolomite may be partially dissolved, leaving a cellular siliceous rock, often with a honey-combed texture filled by malachite (Figure 9-5). Surface exposures may be siliceous in places with abundant cavities.
Figure 9-5 NQ sized DDH core from DIK 171 (Mashamba East) showing weathered RSC with secondary enrichment of malachite in the network cavity structure. Core length is 10cm
The RSC is sharply and abruptly overlain by another laminated dolomitic siliclastic sequence known as the Schistes Dolomitiques (“SD”) or dolomitic shale (Figure 9-6). In the Kolwezi area this unit may be between 30-100m thick and is mostly an alternation of laminated, locally carbonaceous, dolomitic mudrock and siltstone beds. Disseminated microscopic pyrite is present in most of the unit, and may be accompanied by chalcopyrite (Bartholomé et al., 1971).
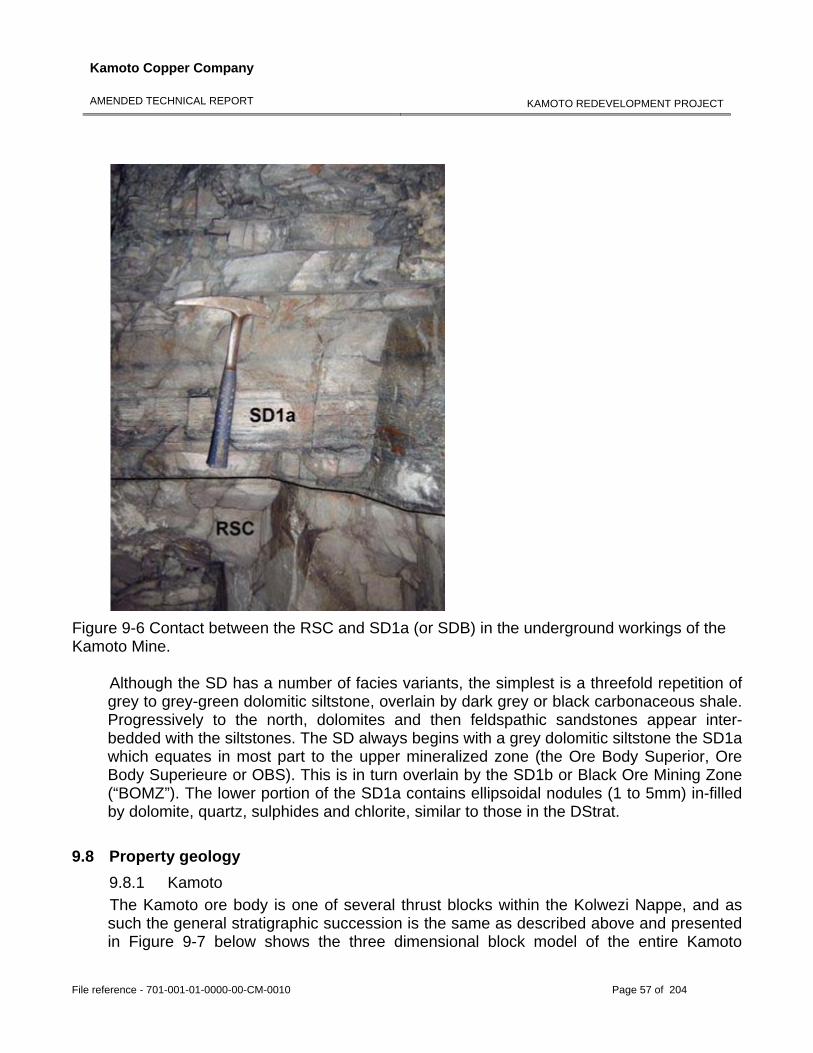
Kamoto Copper Company
AMENDED TECHNICAL REPORT
KAMOTO REDEVELOPMENT PROJECT
File reference - 701-001-01-0000-00-CM-0010 Page 57 of 204
Figure 9-6 Contact between the RSC and SD1a (or SDB) in the underground workings of the Kamoto Mine.
Although the SD has a number of facies variants, the simplest is a threefold repetition of grey to grey-green dolomitic siltstone, overlain by dark grey or black carbonaceous shale. Progressively to the north, dolomites and then feldspathic sandstones appear inter-bedded with the siltstones. The SD always begins with a grey dolomitic siltstone the SD1a which equates in most part to the upper mineralized zone (the Ore Body Superior, Ore Body Superieure or OBS). This is in turn overlain by the SD1b or Black Ore Mining Zone (“BOMZ”). The lower portion of the SD1a contains ellipsoidal nodules (1 to 5mm) in-filled by dolomite, quartz, sulphides and chlorite, similar to those in the DStrat.
9.8 Property geology 9.8.1 Kamoto The Kamoto ore body is one of several thrust blocks within the Kolwezi Nappe, and as such the general stratigraphic succession is the same as described above and presented in Figure 9-7 below shows the three dimensional block model of the entire Kamoto
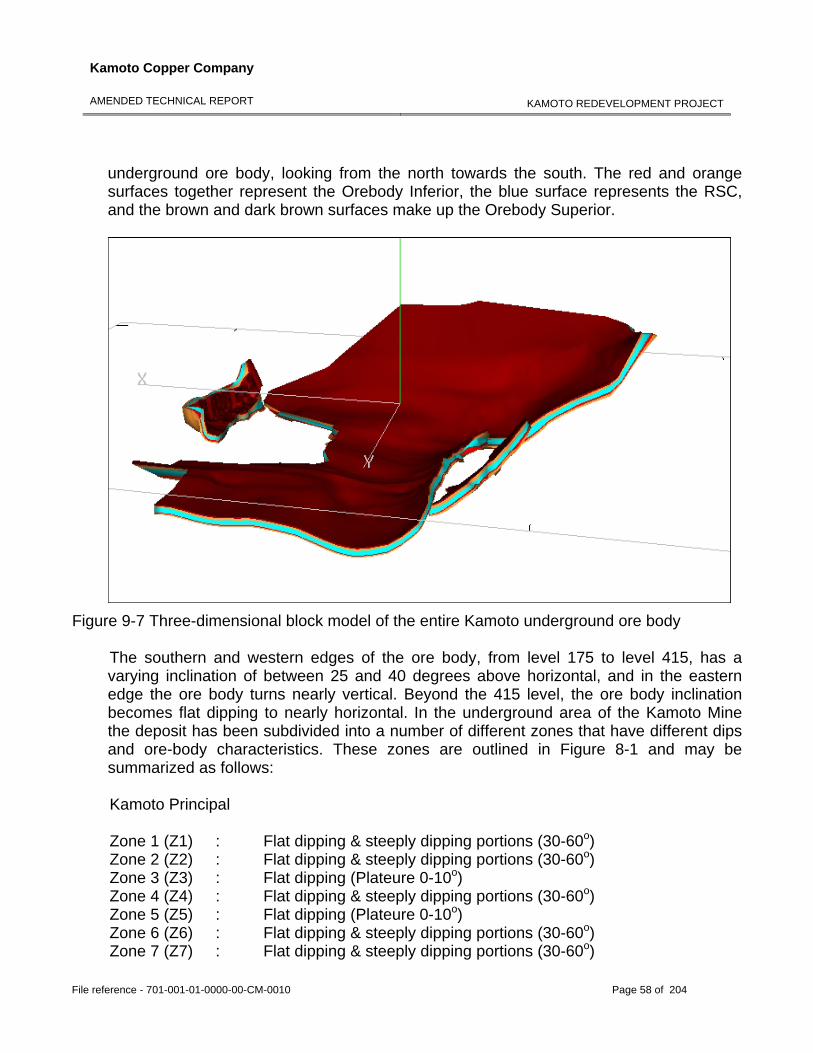
Kamoto Copper Company
AMENDED TECHNICAL REPORT
KAMOTO REDEVELOPMENT PROJECT
File reference - 701-001-01-0000-00-CM-0010 Page 58 of 204
underground ore body, looking from the north towards the south. The red and orange surfaces together represent the Orebody Inferior, the blue surface represents the RSC, and the brown and dark brown surfaces make up the Orebody Superior.
Figure 9-7 Three-dimensional block model of the entire Kamoto underground ore body
The southern and western edges of the ore body, from level 175 to level 415, has a varying inclination of between 25 and 40 degrees above horizontal, and in the eastern edge the ore body turns nearly vertical. Beyond the 415 level, the ore body inclination becomes flat dipping to nearly horizontal. In the underground area of the Kamoto Mine the deposit has been subdivided into a number of different zones that have different dips and ore-body characteristics. These zones are outlined in Figure 8-1 and may be summarized as follows: Kamoto Principal Zone 1 (Z1) : Flat dipping & steeply dipping portions (30-60o) Zone 2 (Z2) : Flat dipping & steeply dipping portions (30-60o) Zone 3 (Z3) : Flat dipping (Plateure 0-10o) Zone 4 (Z4) : Flat dipping & steeply dipping portions (30-60o) Zone 5 (Z5) : Flat dipping (Plateure 0-10o) Zone 6 (Z6) : Flat dipping & steeply dipping portions (30-60o) Zone 7 (Z7) : Flat dipping & steeply dipping portions (30-60o)
Kamoto Copper Company
AMENDED TECHNICAL REPORT
KAMOTO REDEVELOPMENT PROJECT
File reference - 701-001-01-0000-00-CM-0010 Page 59 of 204
Zone 8 (Z8) : Flat dipping (Plateure 0-10o) Zone 9 (Z9) : Near vertical (60o plus) Division 5 (D5) : Near vertical (60o plus) Etang Etang : Steeply dipping. Etang North : Steeply dipping. Most of Zone 1 is made up by, the shallowly dipping, north-northeast trending limb of a tight, plunging synclinal fold, with Zone 6 occupying the fold hinge, and Zone 7 representing the east-trending, northerly dipping limb. The fold axis plunges shallowly to the northeast. The angle between the two major lithological trends of these fold limbs is approximately 120°. The fold axis plunge decreases with increasing depth, similarly the dips of the fold decrease with depth and a flat dipping section of the ore body, Zone 5 is located immediately east of Zone 1, and north of Zone 6. A second, tighter synclinal axis separates the northern end of Zone 1 and Zone 2, which lies immediately to the east. The plunge of this north-trending synclinal axis also appears to shallow with depth, such that the deepest areas in the mine are flat dipping relative to the major fold limbs described above. Zone 2 has a complex form, best described as an elliptical hemi-conical shape, with the north-eastern sector of the cone removed. East of Zone 2 a broadly east-trending shallow dipping unit, Zone 4 is located, with a flatter dipping section, Zone 3 being located down dip of it. These two zones have complex outlines and are separated by fault loss areas from the other zones in the deposit. The south-eastern corner of the Kamoto Mine is defined by zones 8 and 9. Zone 9 dips very steeply to the north-west and is locally overturned. Zone 8 is almost flat dipping and is located down dip of Zone 9. It is not certain how the edges of the ore body are defined or delineated, as there are no borehole records known to allow an accurate definition of the ore body perimeters. According to an un-referenced Gécamines in-house report, three types of faults may be recognised in the underground workings of the Kamoto Mine. These consist of tranverse and longitudinal faults, thrust and low angle structures and gliding faults (faults brought about by movement along bedding planes). 9.8.2 DIMA Although the three pits are temporally separate, they are here treated as a single entity as they have similar geology and mineralization styles. Figure 9-8 below shows a west to
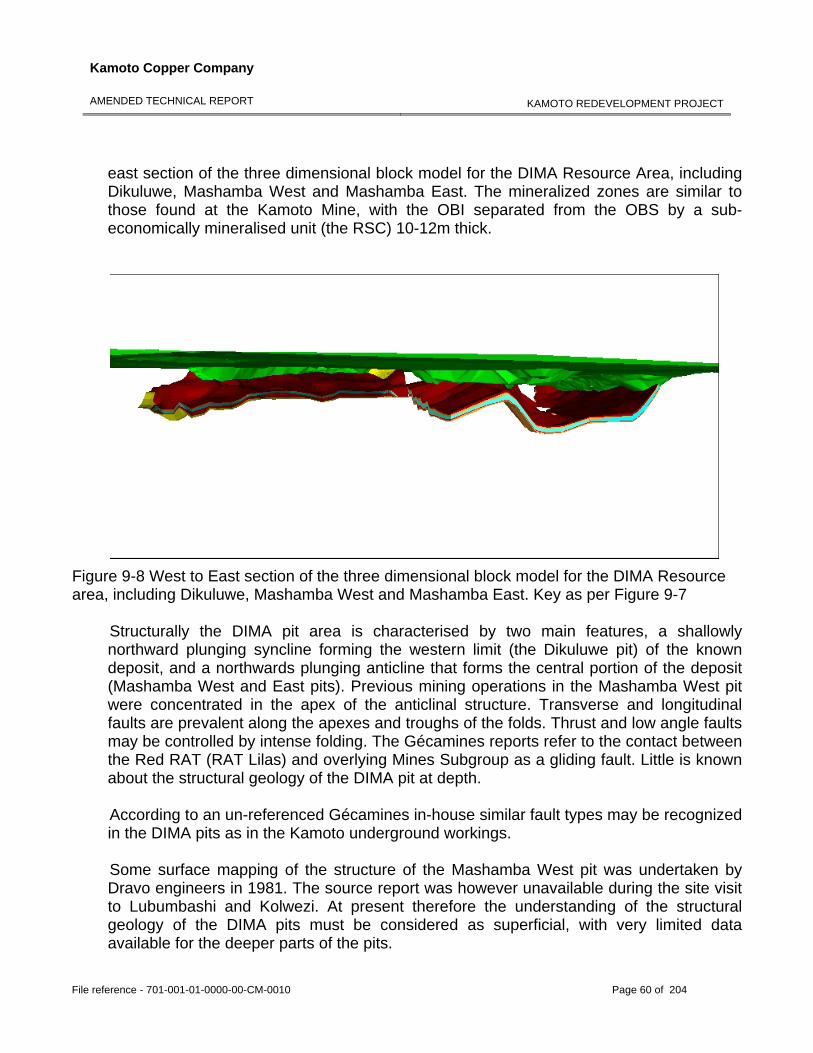
Kamoto Copper Company
AMENDED TECHNICAL REPORT
KAMOTO REDEVELOPMENT PROJECT
File reference - 701-001-01-0000-00-CM-0010 Page 60 of 204
east section of the three dimensional block model for the DIMA Resource Area, including Dikuluwe, Mashamba West and Mashamba East. The mineralized zones are similar to those found at the Kamoto Mine, with the OBI separated from the OBS by a sub-economically mineralised unit (the RSC) 10-12m thick.
Figure 9-8 West to East section of the three dimensional block model for the DIMA Resource area, including Dikuluwe, Mashamba West and Mashamba East. Key as per Figure 9-7
Structurally the DIMA pit area is characterised by two main features, a shallowly northward plunging syncline forming the western limit (the Dikuluwe pit) of the known deposit, and a northwards plunging anticline that forms the central portion of the deposit (Mashamba West and East pits). Previous mining operations in the Mashamba West pit were concentrated in the apex of the anticlinal structure. Transverse and longitudinal faults are prevalent along the apexes and troughs of the folds. Thrust and low angle faults may be controlled by intense folding. The Gécamines reports refer to the contact between the Red RAT (RAT Lilas) and overlying Mines Subgroup as a gliding fault. Little is known about the structural geology of the DIMA pit at depth. According to an un-referenced Gécamines in-house similar fault types may be recognized in the DIMA pits as in the Kamoto underground workings. Some surface mapping of the structure of the Mashamba West pit was undertaken by Dravo engineers in 1981. The source report was however unavailable during the site visit to Lubumbashi and Kolwezi. At present therefore the understanding of the structural geology of the DIMA pits must be considered as superficial, with very limited data available for the deeper parts of the pits.
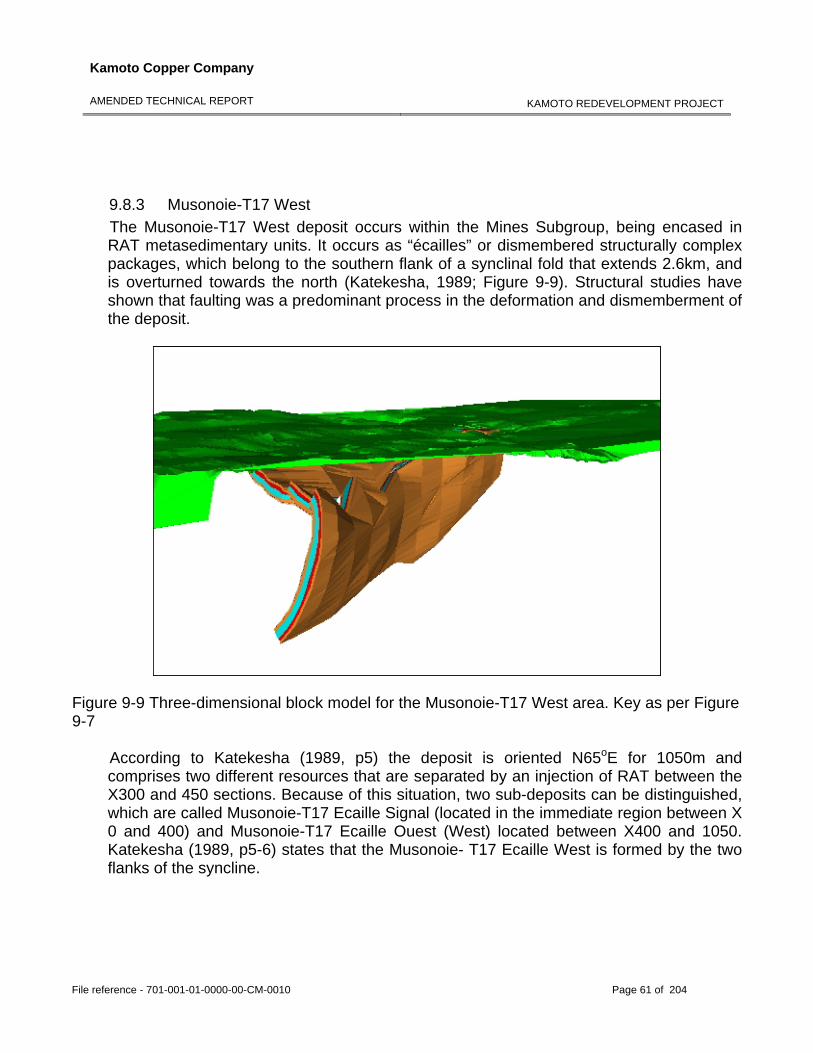
Kamoto Copper Company
AMENDED TECHNICAL REPORT
KAMOTO REDEVELOPMENT PROJECT
File reference - 701-001-01-0000-00-CM-0010 Page 61 of 204
9.8.3 Musonoie-T17 West The Musonoie-T17 West deposit occurs within the Mines Subgroup, being encased in RAT metasedimentary units. It occurs as “écailles” or dismembered structurally complex packages, which belong to the southern flank of a synclinal fold that extends 2.6km, and is overturned towards the north (Katekesha, 1989; Figure 9-9). Structural studies have shown that faulting was a predominant process in the deformation and dismemberment of the deposit.
Figure 9-9 Three-dimensional block model for the Musonoie-T17 West area. Key as per Figure 9-7
According to Katekesha (1989, p5) the deposit is oriented N65oE for 1050m and comprises two different resources that are separated by an injection of RAT between the X300 and 450 sections. Because of this situation, two sub-deposits can be distinguished, which are called Musonoie-T17 Ecaille Signal (located in the immediate region between X 0 and 400) and Musonoie-T17 Ecaille Ouest (West) located between X400 and 1050. Katekesha (1989, p5-6) states that the Musonoie- T17 Ecaille West is formed by the two flanks of the syncline.
Kamoto Copper Company
AMENDED TECHNICAL REPORT
KAMOTO REDEVELOPMENT PROJECT
File reference - 701-001-01-0000-00-CM-0010 Page 62 of 204
10.0 DEPOSIT TYPES 10.1 Mineral deposit type being investigated
The copper-cobalt minerals hosted in rocks of the Neoproterozoic Katangan Basin in the CAC metallogenic province of the DRC are a classic example of (low energy) sediment-hosted stratiform copper (“SSC”) ore system deposits. These deposits are economically significant, as they account for approximately 23% of the world’s copper production and known reserves (Singer, 1995) being second only to porphyry copper deposits in terms of copper production and the most important global cobalt resource (Robb, 2005b). Such deposits are composed of disseminated to veinlet copper (Cu) and copper-iron (Cu-Fe) sulphides in siliclastic or dolomitic sedimentary rocks, where sulphide mineralization conforms closely to the stratification of the host rocks (Kirkham, 1989). Mineralization in these deposits occurs from early diagenesis to basin inversion and late stage metamorphism, and is the product of evolving basin-scale (or sub-basin scale) fluid-flow systems. Mineralizing fluids are generally oxidized, but may display a range of chemical compositions in terms of their major cations (Na, Ca, K, Mg), their temperatures (50-400oC) and their salinities (moderate to hyper saline). Oxidation reduction reactions are believed to be the primary means of sulphide precipitation in this deposit type. Despite the large number of variables in the basinal settings of these deposits, most SSC deposits are remarkably similar in terms of their mineralization style, morphology and mineralogy and the critical factors in the exploration for economically viable and significant SSC deposits have been documented by Kirkham (2001). Hitzman et al. (2005) provide a list of the factors thought to be necessary to form such deposits.
10.2 Geological model SSC deposits occur in rocks ranging from the Early Protoerzoic to Late Tertiary in age (Hitzman et al., 2005). They are most abundant in strata of the Late Mesoproterozoic to Late Neoproterozoic, and Late Palaeozoic, as their formation seems to co-incide with periods of supercontinent amalgamation (Robb, 2005b). SSC deposits are well-described in the literature from the works of Gustafson and Williams (1981), Boyle et al. (1989), Jowett (1991) and Hitzman et al. (2005). Geological and economic data for such deposits worldwide are presented in Mosier et al. (1986), Kirkham (1989), Kirkham et al. (1994) and Cox et al. (2003). The elements of the SSC system at sites of metal production have been documented for the Zambian copperbelt by Mendelshon (1961), Annels (1979) and Selley et al. (2005), and for the DRC by Cahen (1954). The basic requirements of the model are that the ore-forming system must have a source of metal as well as a metal transporting fluid, a source of sulphur and a sulphur transporting fluid, and the correct physical and chemical conditions to trap the metals as sulphides in a spatially limited host rock. To form major deposits the combination of large
Kamoto Copper Company
AMENDED TECHNICAL REPORT
KAMOTO REDEVELOPMENT PROJECT
File reference - 701-001-01-0000-00-CM-0010 Page 63 of 204
volumes of metal bearing fluids, sulphur and reductant are required. A fundamental requirement is also a source of energy to drive fluid flow within the red-bed sequence. SSC deposits commonly occur in extensional basins that contain marine or large-scale lacustrine depositional systems tracts, containing evaporites directly overlying continental red-beds (Hitzman et al., 2005). They are thin (generally <30m and commonly less than 3m thick) sulphide bearing zones that are peneconcordant with the lithological stratification. Two main classification systems have been proposed for SSC deposits. Cox et al. (2003) favour a threefold subdivision based on the amount and type of reductant present, whereas Hitzman et al. (2005) prefer a simple twofold subdivision based on the position in the basinal setting. Within these classification systems, the deposits of the CAC are classified as either reduced facies (Cox et al., 2003) or Kupferschiefer (Hitzman et al., 2005) type.
In these models host rocks may be mudstone, siltstone, sandstone or dolomite, and typically overlie oxidized sequences of haematite bearing coarser grained continental siliclastics. Such sequences are generally generated during long lived transgressive system tracts, and due to this fact the deposits tend to have exceptional lateral extent and continuity, unless broken up by subsequent tectonic events. Most SSC copper deposits also have a common mineral zonation sequence from the contact with the underlying red-beds into the reduced ore zone. This zonation usually consists of barren/haematite-native copper-chalcocite-bornite-chalcopyrite-Pb/Zn/Co sulphides-pyrite (Robb, 2005b). In many deposits galena and sphalerite may occur with the chalcopyrite or between the chalcopyrite and pyrite zones. These are however usually of low grade and uneconomic.
The Fe3+-Cu-Pb-Zn-Fe2+ zoning, coupled with the oxide and sulphide mineral zoning, and paragenetic mineral sequence, strongly suggest that reduction of an originally haematite stable transporting fluid is the main cause of base metal sulphide precipitation. The sulphides and the associated non-sulphide minerals of the host rocks in such deposits display textures and fabrics that indicate precipitation after host-rock deposition and the early syngenetic models (e.g. Mendelshon, 1961) of copper and cobalt mineralization have now been discounted.
10.2.1 Metal and sulphur source Basins that host large SSC deposits commonly contain one or more sequences of continental red beds. These red-beds are generally coarse-grained arkosic to sub-arkosic sandstones and conglomerates, and may also contain nonmarine evaporite deposits. In
Kamoto Copper Company
AMENDED TECHNICAL REPORT
KAMOTO REDEVELOPMENT PROJECT
File reference - 701-001-01-0000-00-CM-0010 Page 64 of 204
many basins, particularly those initiated as rifts, the basal red-bed depositional tracts may contain bimodal, basalt dominated, volcanic rocks, which may provide an important source of copper and other metals, particularly where altered. While this may be the sole source of copper in some Kupferscheifer type deposits, in the CAC there does not seem to be enough red-bed development to account for the known metal endowment only by leaching of such sediments (Hitzman, 2000). The source of the sulphur is also problematic and four possible sources have been proposed: i) as sulphate directly from seawater, saline lacustrine waters or brines formed from the evaporation of these two; ii) diagenetic sulphides; iii) sulphate in brines derived from the dissolution of evaporates; and iv) hydrogen sulphide from petroleum. 10.2.2 Metal trap Geochemical studies and geological evidence in many SSC deposits indicates that reduction was the primary means of sulphate precipitation (Kirkham, 1989). The reductants in such basin settings are proposed to be in situ degraded organic matter, mobile hydrocarbons or pre-existing sulphides. For Kamoto the source of the in situ degraded organic matter has been proposed to be the cyanobacterial microbial mats in the laminated dolomites (Bartholomé et al., 1973; Hoy, 1989). 10.2.3 Fluid source and flow Enormous amounts of fluid are required to form a major sediment-hosted copper deposit, especially if the fluids are carrying 100ppm Cu or less (Hitzman et al., 2005). Fluids may be sourced from pore fluids within the sedimentary package (including various evolved brines and aqueous fluids produced during hydrocarbon maturation, gypsum dehydration, smectite-illite transformation and low grade burial metamorphic dehydration reaction) and meteoric inflow. Flow in closed basins by convection. Convection may be particularly favourable to producing large stratiform-hosted copper deposits, as convection allows for more protracted leaching of the copper bearing source rocks. Major stratiform-hosted copper deposits could also be formed by topography-driven gravity flow into a largely confined basin, with external fluid added to the basin from an uplifted basin edge. Such fluids would however need to dissolve halite along their path in order to reach the high salinities required for the leaching of copper metal from the source rocks. Dense brines produced outside of the red-bed sequence could also cause mineralization, particularly where dense fluids derived from an evaporitic sequence percolate downwards and pond against an impermeable barrier. Such a brine model would produce late diagenetic mineralization, and the brine may be available in the system until basin inversion ruptured the seal (late stage diagenesis to metamorphism).
Kamoto Copper Company
AMENDED TECHNICAL REPORT
KAMOTO REDEVELOPMENT PROJECT
File reference - 701-001-01-0000-00-CM-0010 Page 65 of 204
These different fluid generation and flow scenarios are not necessarily independent and may have acted in tandem over various periods of the basinal history. 10.2.4 Energy to drive the system External fluid flow may be sufficient to drive flow in hydrologically open systems, however closed systems require heat energy to initiate convection. This heat source may be provided by burial, extension accompanying continental break-up (as postulated for the CAC by Selley et al. 2005), or other igneous activity. The basins hosting the CAC contain evidence of thermo-tectonic pulses characterized by gabbroic intrusions, broadly co-incident with extension (Hitzman et al., 2005). In basins with significant salt tectonics, the thermal anomalies associated with salt diapirism may sufficient to initiate convection. To form a giant or supergiant deposit (such as the CAC) spatial and temporal confluence of several of the abovementioned factors is a requirement.
10.2.5 Model summary To form large sized economic SSC deposits the following factors are believed to be necessary (Hitzman et al., 2005):
The basin must somewhere contain thick (>0.5km) oxidized (haematite stable) sequences of siliclastic sediment, preferably with a mafic to intermediate signature;
The basin must contain (or have contained) a significant organic rich sequence capable of serving as a reductant to the oxidizing metal transporting fluids;
The basin must contain (or have contained) thick (several hundred metres) sulphate and halite bearing evaporites either within the red-bed sequence or in adjacent marine or lacustrine sequences;
Basin-wide fluid flow must have occurred that allowed for brine formation. Giant deposits form in basins that underwent multiple stage, or long term, progressive fluid flow;
Evidence of large scale alteration caused by fluid flow should occur; The basin should possess significant fluid channelling and containment structures; Ideally a triggering event should have occurred at the correct time in the basin history.
This trigger should have been capable of initiating basinal convection; The basin should contain abundant zones of trace to sub-economic copper
mineralization. Basins with giant deposits may have copper mineralization in a number of different locations including the basement, in the red-bed sequences and in the overlying marine sequences;
Kamoto Copper Company
AMENDED TECHNICAL REPORT
KAMOTO REDEVELOPMENT PROJECT
File reference - 701-001-01-0000-00-CM-0010 Page 66 of 204
To conclude, the most important elements of large scale SSC deposits are: the availability of significant amounts of reductant and reduced sulphur in a suitable host rock; multistage or prolonged metal carrying brine circulation; and fluid focusing via structural and stratigraphic architectural controls.
11.0 MINERALIZATION
Copper mineralization in the Zambian and DRC sectors of the CAC formed at multiple, possibly progressive stages and by different mechanisms during the evolution of the Katangan Basin. The textures, and history of mineralization are complex, not least because of Lufilian Arc associated greenschist facies (±400oC) metamorphism that post-dates the main stage of Cu introduction. Volumetrically, pre-folding disseminated and lesser vein hosted copper-cobalt sulphides are the most important mineral assemblage in the Project area, with the typical sulphide assemblage in the mineralized zones being chalcocite (Cu2S) –chalcopyrite (CuFeS2) - bornite (Cu5FeS4) with subsidiary pyrite (FeS2). The mineral assemblage of the CAC is unusual among SSC deposits in having abundant cobalt and low silver, zinc and lead concentrations. Two parallel to sub-parallel mineralized zones are encountered in the Kamoto Mine, DIMA and Musonoie-T17 West areas of the Property, which may be altered within the weathered zone, where supergene enrichment may refocus the main mineralized zones. In the underground workings at the Kamoto Mine, copper and cobalt occur as finely disseminated sulphide minerals, dominantly chalcocite and carrollite (Co2CuS4), with traces of bornite and chalcopyrite. The footwall to the lower mineralized zone (the OBI) is made up by the Red RAT (RAT Lilas) and is a haematitic unit devoid of sulphide mineralization. Within the OBI the main copper sulphide ore minerals are chalcocite and bornite and the main cobalt mineral is carrollite. The upper mineralized zone (the OBS) has a similar mineral assemblage to the lower mineralized zone, however chalcopyrite may also be present. The superior suffix has nothing to do with the grade of the mineralized zone, and relates purely to its stratigraphic position above the OBI. Above the OBS the sulphide fraction is gangue and consists mainly of pyrite with minor chalcopyrite. The upper and lower mineralized zones on the Property are separated by a poorly mineralized to unmineralized dolomitic unit, the RSC. Underground inspection of this unit at the Kamoto Mine (Etang Section) showed visible crystals of carrollite to be present in the lowermost metre, and this part of the unit may give elevated cobalt and copper grades (Figure 11-1).
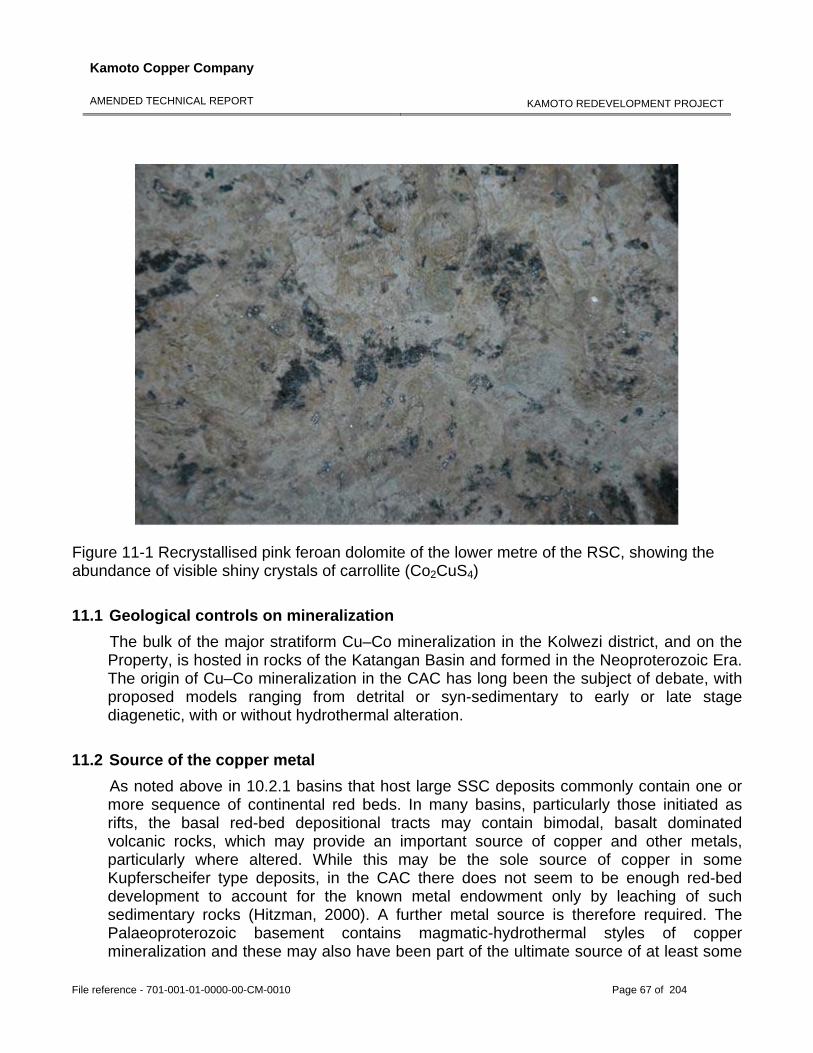
Kamoto Copper Company
AMENDED TECHNICAL REPORT
KAMOTO REDEVELOPMENT PROJECT
File reference - 701-001-01-0000-00-CM-0010 Page 67 of 204
Figure 11-1 Recrystallised pink feroan dolomite of the lower metre of the RSC, showing the abundance of visible shiny crystals of carrollite (Co2CuS4)
11.1 Geological controls on mineralization
The bulk of the major stratiform Cu–Co mineralization in the Kolwezi district, and on the Property, is hosted in rocks of the Katangan Basin and formed in the Neoproterozoic Era. The origin of Cu–Co mineralization in the CAC has long been the subject of debate, with proposed models ranging from detrital or syn-sedimentary to early or late stage diagenetic, with or without hydrothermal alteration.
11.2 Source of the copper metal
As noted above in 10.2.1 basins that host large SSC deposits commonly contain one or more sequence of continental red beds. In many basins, particularly those initiated as rifts, the basal red-bed depositional tracts may contain bimodal, basalt dominated volcanic rocks, which may provide an important source of copper and other metals, particularly where altered. While this may be the sole source of copper in some Kupferscheifer type deposits, in the CAC there does not seem to be enough red-bed development to account for the known metal endowment only by leaching of such sedimentary rocks (Hitzman, 2000). A further metal source is therefore required. The Palaeoproterozoic basement contains magmatic-hydrothermal styles of copper mineralization and these may also have been part of the ultimate source of at least some
Kamoto Copper Company
AMENDED TECHNICAL REPORT
KAMOTO REDEVELOPMENT PROJECT
File reference - 701-001-01-0000-00-CM-0010 Page 68 of 204
of the metals now concentrated in the great deposits of the Copperbelt itself (Robb, 2005a). Although the red bed leach is now accepted by a number of workers (e.g. Hitzman et al., 2005) for the CAC Cailteux et al. (2005, p 134) state that “There is no evidence to support models assuming that metals originated from: (1) Katangan igneous rocks and related hydrothermal processes or; (2) leaching of red beds underlying the orebodies.”
11.3 Mineralization models Most geological reports on the CAC published between 1950 and 1980 held the belief that the copper and cobalt metals had been precipitated either during or very soon after the sediments were deposited and became lithified – theories that were referred to as syngenetic and early-diagenetic. In such models mineralization was interpreted to have been emplaced prior to or during early diagenesis, in a near surface environment (Haynes, 1986). More recent work strongly suggests that regional fluid movement through the basin occurred subsequent to lithification, and was largely controlled by tectonism and deformation of the sediments. Within this model mineralization is diagenetic to late diagenetic, and this is evidenced by: the typical non-fracture controlled distribution of both the sulphide and gangue mineralization; replacive textures of copper and cobalt after diagenetic cements and pyrite; and an 815Ma Re-Os isochron age for sulphide precipitation at Konkola. Cu-Co sulphides also display complex textural relationships which are best explained by a model of multistage diagenetic ore formation. Ore parageneses indicates several generations of sulphides marking syngenetic, early diagenetic and late diagenetic processes. Sulphur isotopic data on sulphides suggest the derivation of sulphur essentially from the bacterial reduction of seawater sulphates, with the mineralizing brines generated from sea water in sabkhas or hypersaline lagoons during the deposition of the host rocks (Cailteux et al. 2005). In this model changes of Eh–pH and salinity were probably critical for concentrating copper–cobalt mineralization. Cailteux et al. (2005) further believes that compressional tectonics and related metamorphic processes, and supergene enrichment, played variable roles in the remobilisation and upgrading of the primary mineralization. Field and petrographic evidence strongly suggests that most (or much of) the mineralization appears to predate or be coeval with, the onset of Lufilian folding and metamorphism (Hanson, 2003). Pre-lithification sedimentary structures affecting disseminated sulphides indicate that metals were deposited before compaction and consolidation of the host sediment, however the exact timing of mineralization is not known, and there is still debate as to whether ores were deposited early, and controlled by sedimentary strata, or later and concentrated along bedding parallel structures (Robb, 2005a). It is, however, now generally accepted that the processes of mineralization in this huge metallogenic district were complex, long-lived and polygenetic.
Kamoto Copper Company
AMENDED TECHNICAL REPORT
KAMOTO REDEVELOPMENT PROJECT
File reference - 701-001-01-0000-00-CM-0010 Page 69 of 204
SSC deposits are in fact subtly discordant at the large scale and appear to be related to zones of contrasting redox (reduction-oxidation) potential in the rock strata (Robb, 2005a). Redox sensitive metals such as Cu and Co are transported in oxidised solutions, and are precipitated when they encounter reduced waters. Intervals immediately at, and beneath, the glacial deposits (where the sedimentary sequence would have been cut-off from the atmosphere for protracted periods) would have been highly reducing in character, contrasting with underlying sediments that were more oxidised. The regional distribution of the redox barriers that could be set-up during such a global ice-house scenario would help explain the huge size and extent of the mineralization in the CAC.
11.4 Supergene enrichment Late Cretaceous and Tertiary weathering has produced surficial to 300m deep secondary supergene enrichment in the Project area. Data from throughout the CAC indicate that late (Mesozoic-Tertiary) deep (locally over 1km) weathering and supergene oxidation has affected many ore bodies (Selley et al., 2005). These supergene processes seem to be responsible for the formation of much of the chalcocite in the ore bodies (calling into question the sulphide zonation noted by other workers). The high grades of many of the CAC ore bodies may therefore be due in a large part to supergene enrichment (Hitzman et al., 2005). Supergene enrichment is particularly prevalent in the DIMA pit areas and the upper parts of the Musonoie-T17 West area, where malachite (Cu2(CO3)(OH)2) chrysocolla (Cu,Al)2H2Si2O5(OH)4·n(H2O), azurite (Cu3(CO3)2(OH)2), psuedomalachite (Cu5(PO4)2(OH)) and cobalt oxides such as heterogenite (CoO(OH)) predominate, often filling vugs and cavities in the carbonate-rich units. Here the depth of weathering reaches to between 50–80m below the surface. In these deposits, the copper may migrate into the hanging and footwalls of the OBS and OBI. Superficial work at Musonoie-T17 (trenches, small wells, and drilling) has shown that the mineralization has been totally leached in the upper 25m interval (Katekesha, 1989).
12.0 EXPLORATION
No systematic exploration of the area has been carried out since the 1980’s and due to the fact that a 20-40 year resource was believed to already exist (Gécamines internal reports), evaluation of existing data was the focus of the Project, and no new exploration work was undertaken by, or on behalf of, the issuer.
13.0 DRILLING No exploration or confirmatory drilling was undertaken during the current study. Hard copy records of some 1337 diamond drill hole (“DDH”) cores were made available to
Kamoto Copper Company
AMENDED TECHNICAL REPORT
KAMOTO REDEVELOPMENT PROJECT
File reference - 701-001-01-0000-00-CM-0010 Page 70 of 204
CCIC from the Kamoto Mine (KTO Geology Department) and Kolwezi Geological Survey. Borehole collars exist for all boreholes. Of these DDH cores less than seventy physical cores still exist. Core is stored in wooden core boxes in a conventional manner with the core running from the top right to bottom left, with each piece individually numbered. The cores inspected by CCIC ranged from PQ (for the collars) down through NQ and BQ sizes. Since 2002 there has been no exploration or mine planning drilling. No deflections were drilled. For various reason (including the lack of a saw blade, that they were structural or stratigraphic holes or just that the geologist felt that they did not contain grade) certain holes were drilled but not sampled for assay.
13.1 Kamoto Mine
For the Kamoto Mine the DDH records are predominantly from fan drilling undertaken from underground galleries and developments in the Kamoto Principal underground section. Three holes were usually drilled from each gallery at varying angles between 15-53°. This procedure normally allowed for only one of the mineralized zones to be intersected per core, dependant on the direction of the drilling. Most of the Kamoto underground holes in the flat Plateure area intersected the ore body at, or close to, right angles to the mineralized zone/lithostratigraphic unit, such that drilled thicknesses equate approximately to the true thickness. Elsewhere however this is not the case and the drilled thicknesses are usually greater than the true thicknesses, being apparent thicknesses only. All of the KTO holes (surface boreholes) were also utilised. Core lengths for the Kamoto Mine underground and surface drill holes range from 15m to greater than 500m. Approximately 300 holes have been drilled since 1990 following the collapse of the Plateure. CCIC has been unable to determine what the operating procedures were for Gécamines personnel, other than that conveyed to the authors via discussions with previously employed staff. It seems that the standard procedure was to drill until the Red RAT was intersected, then approximately 15m into the footwall to make sure that the footwall contained no supergene or other mineralization.
13.2 DIMA For the Mashamba East pit drilling was undertaken from surface on 100mx100m spaced grid on a local co-ordinate system parallel to the strike of the mineralized zone. For the Dikuluwe and Mashamba West pits the spacing was 100m on strike and 50m on dip. Holes were mostly drilled vertical, so in places the mineralized zones were intersected close to normal, whereas at other places the hole ran along the strike of the mineralized zone, such that the intersect thickness far exceeded the true thickness.
Kamoto Copper Company
AMENDED TECHNICAL REPORT
KAMOTO REDEVELOPMENT PROJECT
File reference - 701-001-01-0000-00-CM-0010 Page 71 of 204
13.3 Musonoie – T17 West The Musonoie-T17 West deposit has been the subject of two diamond drilling programmes by Gécamines, with 3287.6m drilled between 1938 and 1954, and 8011.3m from 1986 to January 1988. Due to the near vertical nature of the Musonoie-T17 fragment, drilling was often along the strike of the mineralized zones, such that in certain DDH cores (e.g. MU316) intersect widths for the mineralized zones and parting are as much as 320m.
14.0 SAMPLING METHOD AND APPROACH Although no new drilling or sampling was undertaken for the project, replicate samples from the Kamoto Mine underground sections, as well as the DIMA pits and the Musonoie-T17 West pit, DDH core intersections were taken as part of the QA/QC program. Holes relogged and sampled for the QA/QC exercise include: DIK 504 (Dikuluwe); DIK477 (Mashamba West); DIK 171 (Mashamba East); F2418 (Kamoto Principal OBS); F2471 (Kamoto Principal OBI); F2391 (Kamoto Etang) and MU321 (Musonoie-T17). The basic approach was to try and replicate Gécamines sampling and assay results on cores from each of the Project Resource Areas to gain confidence in the reported assay values. Whilst it was difficult to get a good understanding of the original Gécamines sampling protocol and methodology, it seems that samples were taken for assay based mainly on lithology, and as such were of irregular lengths. The most popular sample length was between 1.5 and 2.0m, although individual sample lengths ranged from 0.02m to 10.0m. For the QA/QC programme the samples lengths were replicated and the half remaining core quartered. The remaining quarter cores were remarked with their original numbers. Samples were marked, cut and bagged under the supervision of Mr. M. Tuchscherer (CCIC) at the Kamoto Geological Department (KTO GEO). Samples were cut by CCIC or Gécamines personnel on a Wendt L18A B61936 saw with a 34cm diamond blade.
15.0 SAMPLE PREPARATION, ANALYSES AND SECURITY 15.1 Sample curatorship
Apart from sample curatorship in Lubumbashi, no aspect of the sample preparation was undertaken by an employee, officer, director or associate of the issuer, and the chain of custody of the samples remained unbroken from sampling through to sample preparation and analysis. The quarter remaining diamond drill hole from the QA/QC re-sampling exercise is now being stored in the Kamoto Geological Department (KTO GEO) at the Kamoto Mine.
Kamoto Copper Company
AMENDED TECHNICAL REPORT
KAMOTO REDEVELOPMENT PROJECT
File reference - 701-001-01-0000-00-CM-0010 Page 72 of 204
15.2 Sample preparation Fifty eight samples were taken from various boreholes for independent verification of the Gécamines copper and cobalt assay figures. These samples were sent to SGS Lakefield Research Africa (Pty) Ltd. (“SGS Lakefield”) for preparation and analysis, with renumbered pulps resubmitted to both SGS Lakefield and Set Point Laboratories (“Set Point”) of Isando Johannesburg as checks. Following cutting under the supervision of Mr. Martin Tuchscherer (CCIC) samples were placed in metal containers and sealed under lock and key in Mr. Tuchscherer’s presence. These were then trucked to Forrest’s Lubambashi offices where their custody rested in the hands of Mr. Jo Dassas until such time as they had passed customs inspection. Subsequently they were dispatched to South Africa and cleared by Dansas International Airfreight, who then delivered the sealed containers to SGS Lakefield laboratories in Booysens Johannesburg. At this time the containers were opened by Dr. P.J.Hancox and Mr. D.Subramani and the seals on the original sample containers checked. None had been tampered with as all of the seals integrities were intact. Following sample receiving the quarter cores were unpacked by SGS Lakefield staff and the sample identification’s checked against the provided sample list. A job card was created in SGS Lakefield’s LIMS system, which included the client details, the list of samples and the analyses required. The entire sample was crushed to <2mm and the crushed sample split, where necessary, to produce a portion of about 250g. The split (or entire crushed sample if <250g) was milled, bagged, labelled and stored in a box(es), which was logged into SGS Lakefield’s sample tracking system and stored on a shelf. The splits and resubmitted pulps are currently stored at SGS Lakefield and the check sample pulps at Set Point.
15.3 Preparation for analysis For analysis of copper oxides each sample was weighed and mixed with an aliquot of dilute sulphuric acid enriched with SO2. This mixture was agitated at room temperature for a set period of time and the sample residue filtered out of the solution. The solution was made up to volume and analyzed for Cu and Co by Atomic Absorption Spectroscopy (“AAS”). This yielded an assay of Cu and Co present as oxides. For analysis of copper Sulphides the residue the Cu oxide preparation was placed in a beaker and mixed with multiple acids, with the residue being digested in the acid mixture. The solution was made up to volume and analyzed for Cu and Co by AAS. This yielded an assay of Cu and Co present as sulphides.
Kamoto Copper Company
AMENDED TECHNICAL REPORT
KAMOTO REDEVELOPMENT PROJECT
File reference - 701-001-01-0000-00-CM-0010 Page 73 of 204
15.4 Quality control SGS Lakefield is currently accredited by SANAS for ISO 17025 for gold and Platinum Group Elements by Lead Collection Fire Assay, PGE’s by nickel sulphide Collection Fire Assay, sulphur and carbon by LECO, base metals by Xray Fluorescence (“XRF”) and AAS and major oxides by XRF. The SGS Lakefield results from the speciation of Cu sulphides and Cu oxides was based on information supplied to SGS Lakefield by CCIC, that the samples were largely made up of the oxides malachite and chrysocolla, and various sulphides. The methodology used on these samples gave a good idea of the Cu oxide and Cu sulphide contents, but typically, the speciation of Cu was not always perfect. It was also assumed that the Cu oxides were completely digested in the dilute acid leach and the residue from that procedure contained only copper sulphides. This is not however an accredited test.
15.5 Quality control measures
Following on the presentation of results, CCIC re-submitted nine samples to SGS Lakefield and the remainder of the original batch (49 samples) to Set Point as cross-checks on the original values. Sample pulps for re-submittal to SGS Lakefield were randomly selected using a random sample generation value in Microsoft Excel© and renumbered.
15.6 Adequacy of sample preparation It is CCIC’s professional opinion that the sample security, preparation and analytical procedures applied are of international standards, were reproducible and of high precision and accuracy, being basically replicated in the check samples (Table 16-1 and Table 16-2 below).
16.0 DATA VERIFICATION The original hard-copy data received from Gécamines was captured to Microsoft Excel© spreadsheets by CCIC, and verified and validated by CCIC, as well as by Maxwell GeoServices (“Maxwell”) during the creation of the master database. Maxwell set up a data management system that allowed for the standardization of data capture and storage across the organisation. This was undertaken so that due diligence reporting, and auditable database exports, could be created for third party evaluation purposes. Presently the master database (including all hard and electronic copies of historic, field, mine and laboratory data pertaining to the resource) is stored in the CCIC offices in Rosebank, Johannesburg, South Africa.
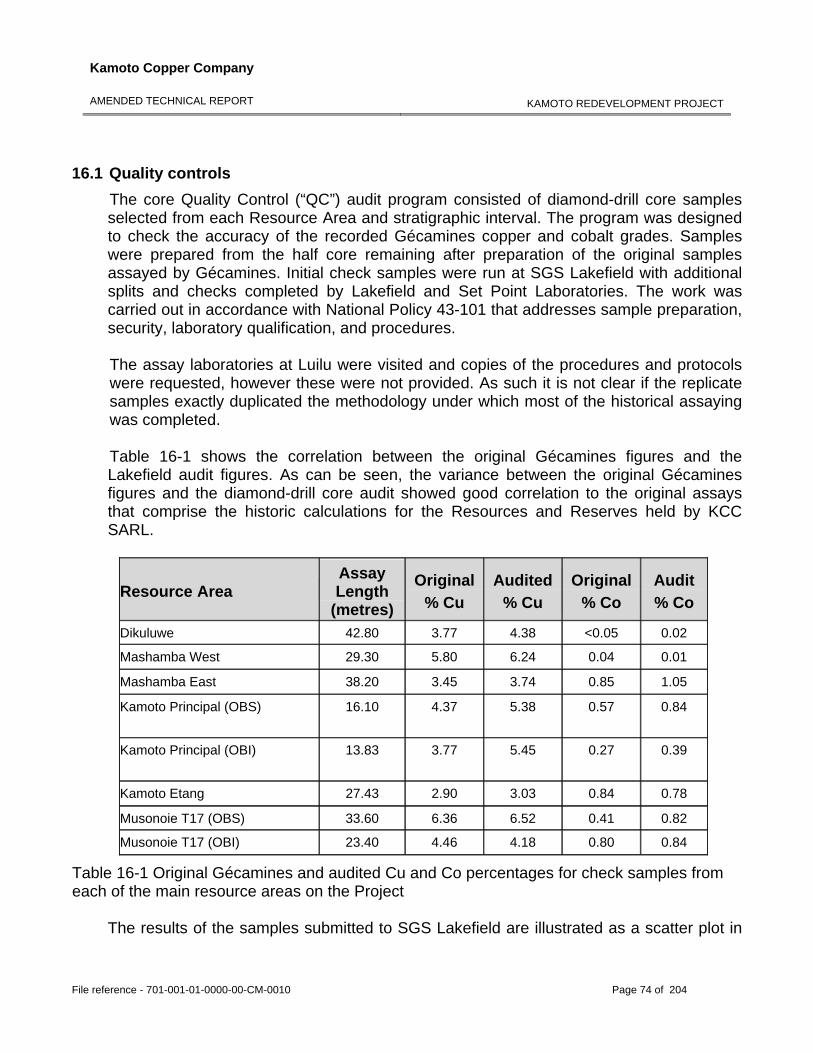
Kamoto Copper Company
AMENDED TECHNICAL REPORT
KAMOTO REDEVELOPMENT PROJECT
File reference - 701-001-01-0000-00-CM-0010 Page 74 of 204
16.1 Quality controls The core Quality Control (“QC”) audit program consisted of diamond-drill core samples selected from each Resource Area and stratigraphic interval. The program was designed to check the accuracy of the recorded Gécamines copper and cobalt grades. Samples were prepared from the half core remaining after preparation of the original samples assayed by Gécamines. Initial check samples were run at SGS Lakefield with additional splits and checks completed by Lakefield and Set Point Laboratories. The work was carried out in accordance with National Policy 43-101 that addresses sample preparation, security, laboratory qualification, and procedures. The assay laboratories at Luilu were visited and copies of the procedures and protocols were requested, however these were not provided. As such it is not clear if the replicate samples exactly duplicated the methodology under which most of the historical assaying was completed.
Table 16-1 shows the correlation between the original Gécamines figures and the Lakefield audit figures. As can be seen, the variance between the original Gécamines figures and the diamond-drill core audit showed good correlation to the original assays that comprise the historic calculations for the Resources and Reserves held by KCC SARL.
Resource Area Assay Length
(metres)
Original % Cu
Audited % Cu
Original % Co
Audit % Co
Dikuluwe 42.80 3.77 4.38 <0.05 0.02
Mashamba West 29.30 5.80 6.24 0.04 0.01
Mashamba East 38.20 3.45 3.74 0.85 1.05
Kamoto Principal (OBS) 16.10 4.37 5.38 0.57 0.84
Kamoto Principal (OBI) 13.83 3.77 5.45 0.27 0.39
Kamoto Etang 27.43 2.90 3.03 0.84 0.78
Musonoie T17 (OBS) 33.60 6.36 6.52 0.41 0.82
Musonoie T17 (OBI) 23.40 4.46 4.18 0.80 0.84
Table 16-1 Original Gécamines and audited Cu and Co percentages for check samples from each of the main resource areas on the Project
The results of the samples submitted to SGS Lakefield are illustrated as a scatter plot in
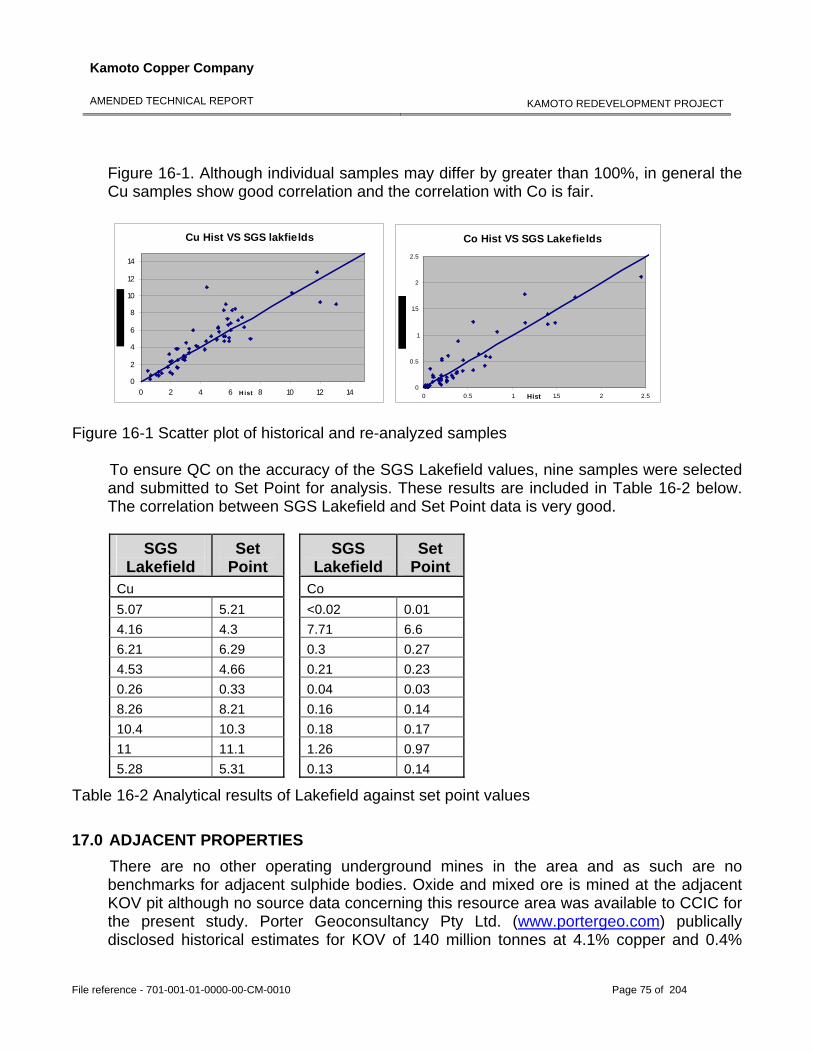
Kamoto Copper Company
AMENDED TECHNICAL REPORT
KAMOTO REDEVELOPMENT PROJECT
File reference - 701-001-01-0000-00-CM-0010 Page 75 of 204
Figure 16-1. Although individual samples may differ by greater than 100%, in general the Cu samples show good correlation and the correlation with Co is fair.
Cu Hist VS SGS lakfields
0
2
4
6
8
10
12
14
0 2 4 6 8 10 12 14H ist
Co Hist VS SGS Lakefields
0
0.5
1
1.5
2
2.5
0 0.5 1 1.5 2 2.5Hist
Figure 16-1 Scatter plot of historical and re-analyzed samples To ensure QC on the accuracy of the SGS Lakefield values, nine samples were selected and submitted to Set Point for analysis. These results are included in Table 16-2 below. The correlation between SGS Lakefield and Set Point data is very good.
SGS Lakefield
Set Point
SGS Lakefield
Set Point
Cu Co 5.07 5.21 <0.02 0.01 4.16 4.3 7.71 6.6 6.21 6.29 0.3 0.27 4.53 4.66 0.21 0.23 0.26 0.33 0.04 0.03 8.26 8.21 0.16 0.14 10.4 10.3 0.18 0.17 11 11.1 1.26 0.97 5.28 5.31 0.13 0.14
Table 16-2 Analytical results of Lakefield against set point values
17.0 ADJACENT PROPERTIES There are no other operating underground mines in the area and as such are no benchmarks for adjacent sulphide bodies. Oxide and mixed ore is mined at the adjacent KOV pit although no source data concerning this resource area was available to CCIC for the present study. Porter Geoconsultancy Pty Ltd. (www.portergeo.com) publically disclosed historical estimates for KOV of 140 million tonnes at 4.1% copper and 0.4%
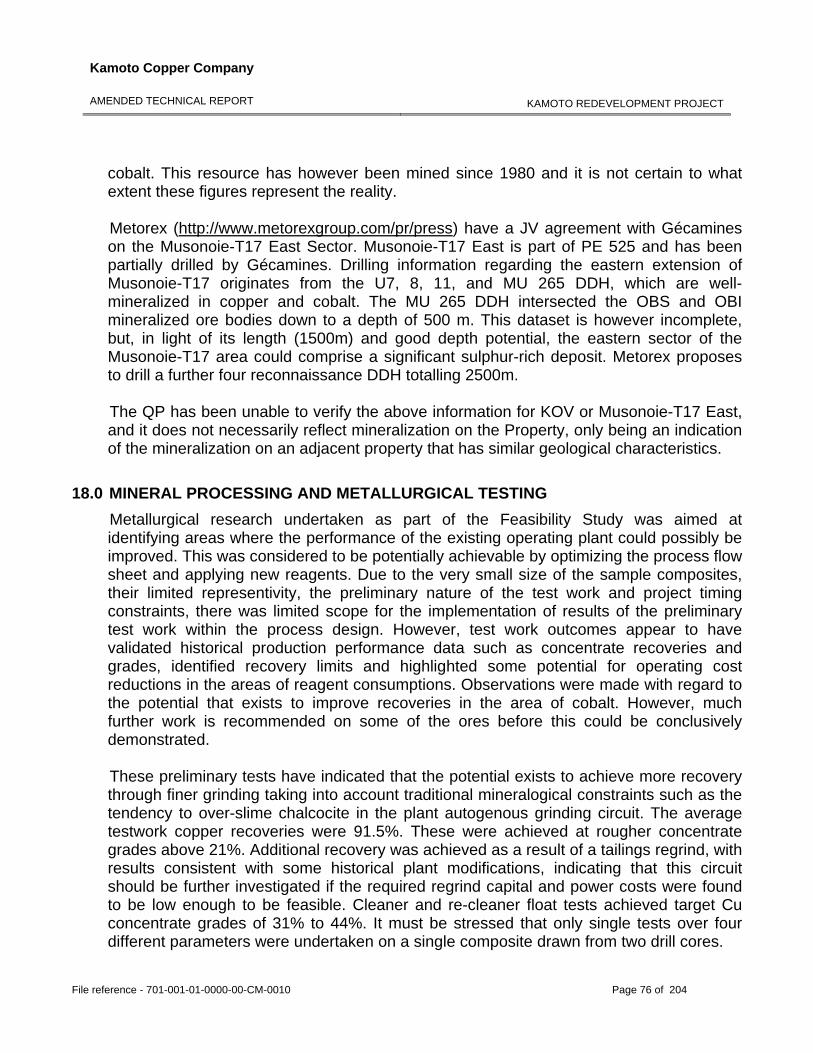
Kamoto Copper Company
AMENDED TECHNICAL REPORT
KAMOTO REDEVELOPMENT PROJECT
File reference - 701-001-01-0000-00-CM-0010 Page 76 of 204
cobalt. This resource has however been mined since 1980 and it is not certain to what extent these figures represent the reality. Metorex (http://www.metorexgroup.com/pr/press) have a JV agreement with Gécamines on the Musonoie-T17 East Sector. Musonoie-T17 East is part of PE 525 and has been partially drilled by Gécamines. Drilling information regarding the eastern extension of Musonoie-T17 originates from the U7, 8, 11, and MU 265 DDH, which are well-mineralized in copper and cobalt. The MU 265 DDH intersected the OBS and OBI mineralized ore bodies down to a depth of 500 m. This dataset is however incomplete, but, in light of its length (1500m) and good depth potential, the eastern sector of the Musonoie-T17 area could comprise a significant sulphur-rich deposit. Metorex proposes to drill a further four reconnaissance DDH totalling 2500m. The QP has been unable to verify the above information for KOV or Musonoie-T17 East, and it does not necessarily reflect mineralization on the Property, only being an indication of the mineralization on an adjacent property that has similar geological characteristics.
18.0 MINERAL PROCESSING AND METALLURGICAL TESTING
Metallurgical research undertaken as part of the Feasibility Study was aimed at identifying areas where the performance of the existing operating plant could possibly be improved. This was considered to be potentially achievable by optimizing the process flow sheet and applying new reagents. Due to the very small size of the sample composites, their limited representivity, the preliminary nature of the test work and project timing constraints, there was limited scope for the implementation of results of the preliminary test work within the process design. However, test work outcomes appear to have validated historical production performance data such as concentrate recoveries and grades, identified recovery limits and highlighted some potential for operating cost reductions in the areas of reagent consumptions. Observations were made with regard to the potential that exists to improve recoveries in the area of cobalt. However, much further work is recommended on some of the ores before this could be conclusively demonstrated. These preliminary tests have indicated that the potential exists to achieve more recovery through finer grinding taking into account traditional mineralogical constraints such as the tendency to over-slime chalcocite in the plant autogenous grinding circuit. The average testwork copper recoveries were 91.5%. These were achieved at rougher concentrate grades above 21%. Additional recovery was achieved as a result of a tailings regrind, with results consistent with some historical plant modifications, indicating that this circuit should be further investigated if the required regrind capital and power costs were found to be low enough to be feasible. Cleaner and re-cleaner float tests achieved target Cu concentrate grades of 31% to 44%. It must be stressed that only single tests over four different parameters were undertaken on a single composite drawn from two drill cores.
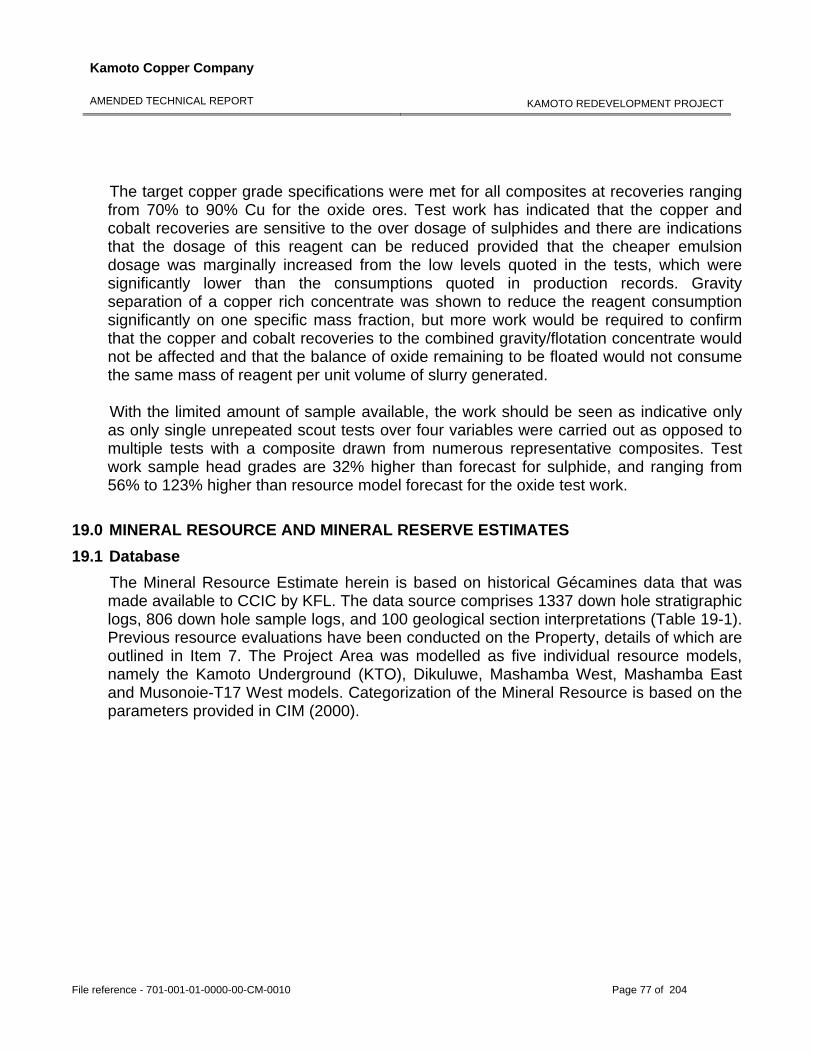
Kamoto Copper Company
AMENDED TECHNICAL REPORT
KAMOTO REDEVELOPMENT PROJECT
File reference - 701-001-01-0000-00-CM-0010 Page 77 of 204
The target copper grade specifications were met for all composites at recoveries ranging from 70% to 90% Cu for the oxide ores. Test work has indicated that the copper and cobalt recoveries are sensitive to the over dosage of sulphides and there are indications that the dosage of this reagent can be reduced provided that the cheaper emulsion dosage was marginally increased from the low levels quoted in the tests, which were significantly lower than the consumptions quoted in production records. Gravity separation of a copper rich concentrate was shown to reduce the reagent consumption significantly on one specific mass fraction, but more work would be required to confirm that the copper and cobalt recoveries to the combined gravity/flotation concentrate would not be affected and that the balance of oxide remaining to be floated would not consume the same mass of reagent per unit volume of slurry generated. With the limited amount of sample available, the work should be seen as indicative only as only single unrepeated scout tests over four variables were carried out as opposed to multiple tests with a composite drawn from numerous representative composites. Test work sample head grades are 32% higher than forecast for sulphide, and ranging from 56% to 123% higher than resource model forecast for the oxide test work.
19.0 MINERAL RESOURCE AND MINERAL RESERVE ESTIMATES 19.1 Database
The Mineral Resource Estimate herein is based on historical Gécamines data that was made available to CCIC by KFL. The data source comprises 1337 down hole stratigraphic logs, 806 down hole sample logs, and 100 geological section interpretations (Table 19-1). Previous resource evaluations have been conducted on the Property, details of which are outlined in Item 7. The Project Area was modelled as five individual resource models, namely the Kamoto Underground (KTO), Dikuluwe, Mashamba West, Mashamba East and Musonoie-T17 West models. Categorization of the Mineral Resource is based on the parameters provided in CIM (2000).
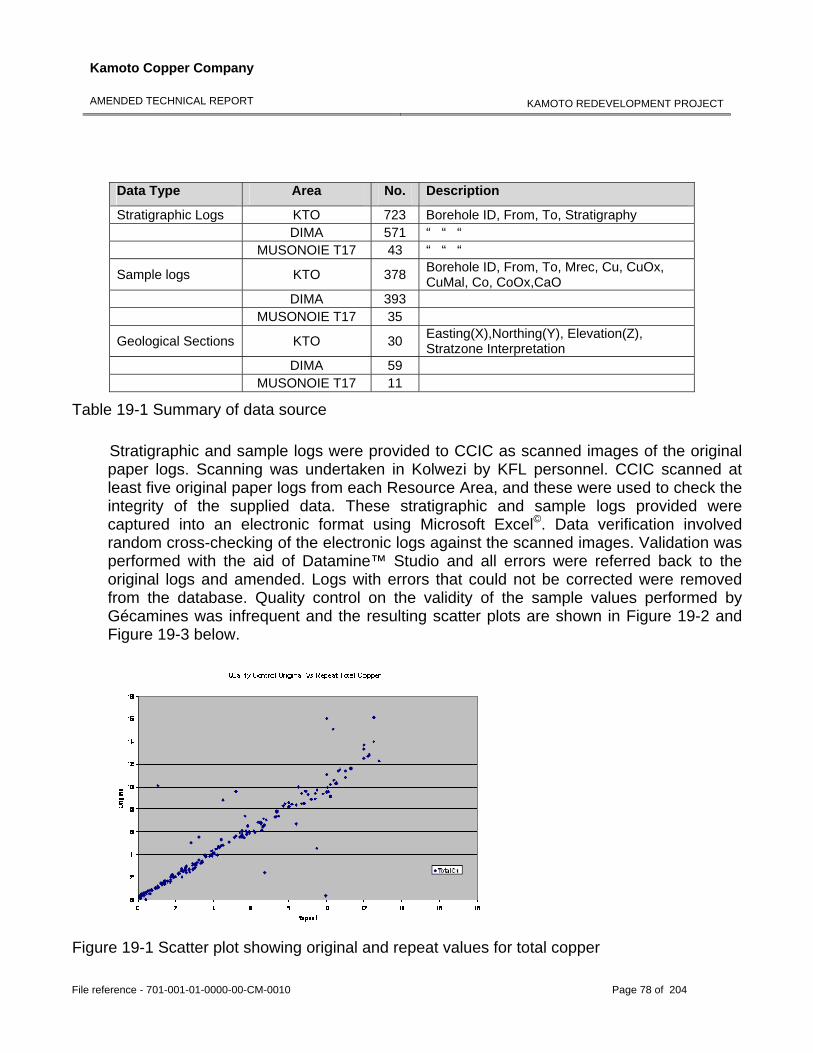
Kamoto Copper Company
AMENDED TECHNICAL REPORT
KAMOTO REDEVELOPMENT PROJECT
File reference - 701-001-01-0000-00-CM-0010 Page 78 of 204
Data Type Area No. Description
Stratigraphic Logs KTO 723 Borehole ID, From, To, Stratigraphy DIMA 571 “ “ “ MUSONOIE T17 43 “ “ “
Sample logs KTO 378 Borehole ID, From, To, Mrec, Cu, CuOx, CuMal, Co, CoOx,CaO
DIMA 393 MUSONOIE T17 35
Geological Sections KTO 30 Easting(X),Northing(Y), Elevation(Z), Stratzone Interpretation
DIMA 59 MUSONOIE T17 11
Table 19-1 Summary of data source
Stratigraphic and sample logs were provided to CCIC as scanned images of the original paper logs. Scanning was undertaken in Kolwezi by KFL personnel. CCIC scanned at least five original paper logs from each Resource Area, and these were used to check the integrity of the supplied data. These stratigraphic and sample logs provided were captured into an electronic format using Microsoft Excel©. Data verification involved random cross-checking of the electronic logs against the scanned images. Validation was performed with the aid of Datamine™ Studio and all errors were referred back to the original logs and amended. Logs with errors that could not be corrected were removed from the database. Quality control on the validity of the sample values performed by Gécamines was infrequent and the resulting scatter plots are shown in Figure 19-2 and Figure 19-3 below.
Figure 19-1 Scatter plot showing original and repeat values for total copper
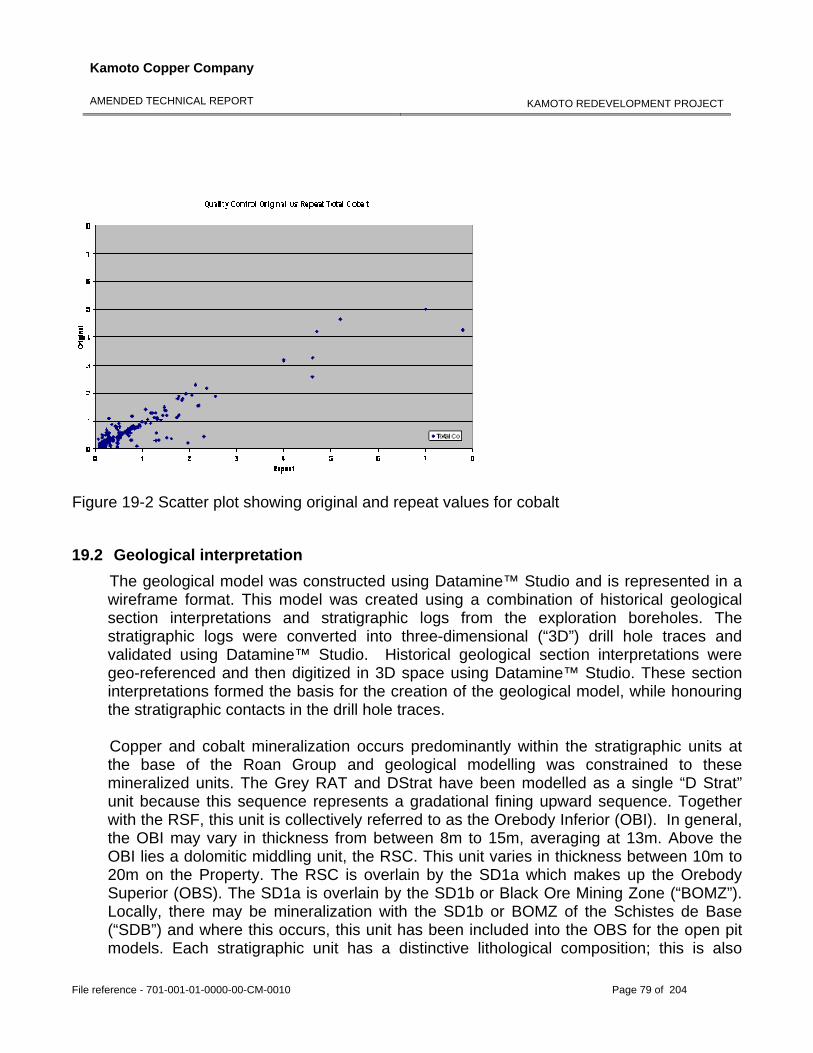
Kamoto Copper Company
AMENDED TECHNICAL REPORT
KAMOTO REDEVELOPMENT PROJECT
File reference - 701-001-01-0000-00-CM-0010 Page 79 of 204
Figure 19-2 Scatter plot showing original and repeat values for cobalt 19.2 Geological interpretation
The geological model was constructed using Datamine™ Studio and is represented in a wireframe format. This model was created using a combination of historical geological section interpretations and stratigraphic logs from the exploration boreholes. The stratigraphic logs were converted into three-dimensional (“3D”) drill hole traces and validated using Datamine™ Studio. Historical geological section interpretations were geo-referenced and then digitized in 3D space using Datamine™ Studio. These section interpretations formed the basis for the creation of the geological model, while honouring the stratigraphic contacts in the drill hole traces. Copper and cobalt mineralization occurs predominantly within the stratigraphic units at the base of the Roan Group and geological modelling was constrained to these mineralized units. The Grey RAT and DStrat have been modelled as a single “D Strat” unit because this sequence represents a gradational fining upward sequence. Together with the RSF, this unit is collectively referred to as the Orebody Inferior (OBI). In general, the OBI may vary in thickness from between 8m to 15m, averaging at 13m. Above the OBI lies a dolomitic middling unit, the RSC. This unit varies in thickness between 10m to 20m on the Property. The RSC is overlain by the SD1a which makes up the Orebody Superior (OBS). The SD1a is overlain by the SD1b or Black Ore Mining Zone (“BOMZ”). Locally, there may be mineralization with the SD1b or BOMZ of the Schistes de Base (“SDB”) and where this occurs, this unit has been included into the OBS for the open pit models. Each stratigraphic unit has a distinctive lithological composition; this is also
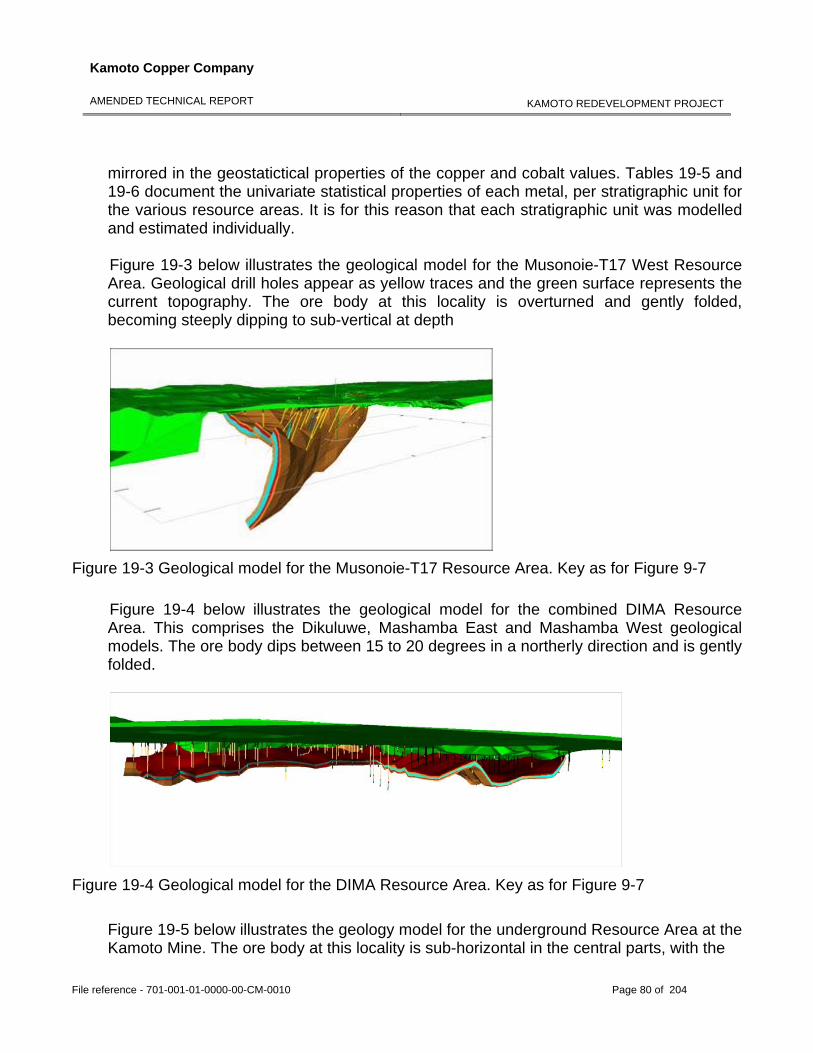
Kamoto Copper Company
AMENDED TECHNICAL REPORT
KAMOTO REDEVELOPMENT PROJECT
File reference - 701-001-01-0000-00-CM-0010 Page 80 of 204
mirrored in the geostatictical properties of the copper and cobalt values. Tables 19-5 and 19-6 document the univariate statistical properties of each metal, per stratigraphic unit for the various resource areas. It is for this reason that each stratigraphic unit was modelled and estimated individually. Figure 19-3 below illustrates the geological model for the Musonoie-T17 West Resource Area. Geological drill holes appear as yellow traces and the green surface represents the current topography. The ore body at this locality is overturned and gently folded, becoming steeply dipping to sub-vertical at depth
Figure 19-3 Geological model for the Musonoie-T17 Resource Area. Key as for Figure 9-7
Figure 19-4 below illustrates the geological model for the combined DIMA Resource Area. This comprises the Dikuluwe, Mashamba East and Mashamba West geological models. The ore body dips between 15 to 20 degrees in a northerly direction and is gently folded.
Figure 19-4 Geological model for the DIMA Resource Area. Key as for Figure 9-7
Figure 19-5 below illustrates the geology model for the underground Resource Area at the Kamoto Mine. The ore body at this locality is sub-horizontal in the central parts, with the
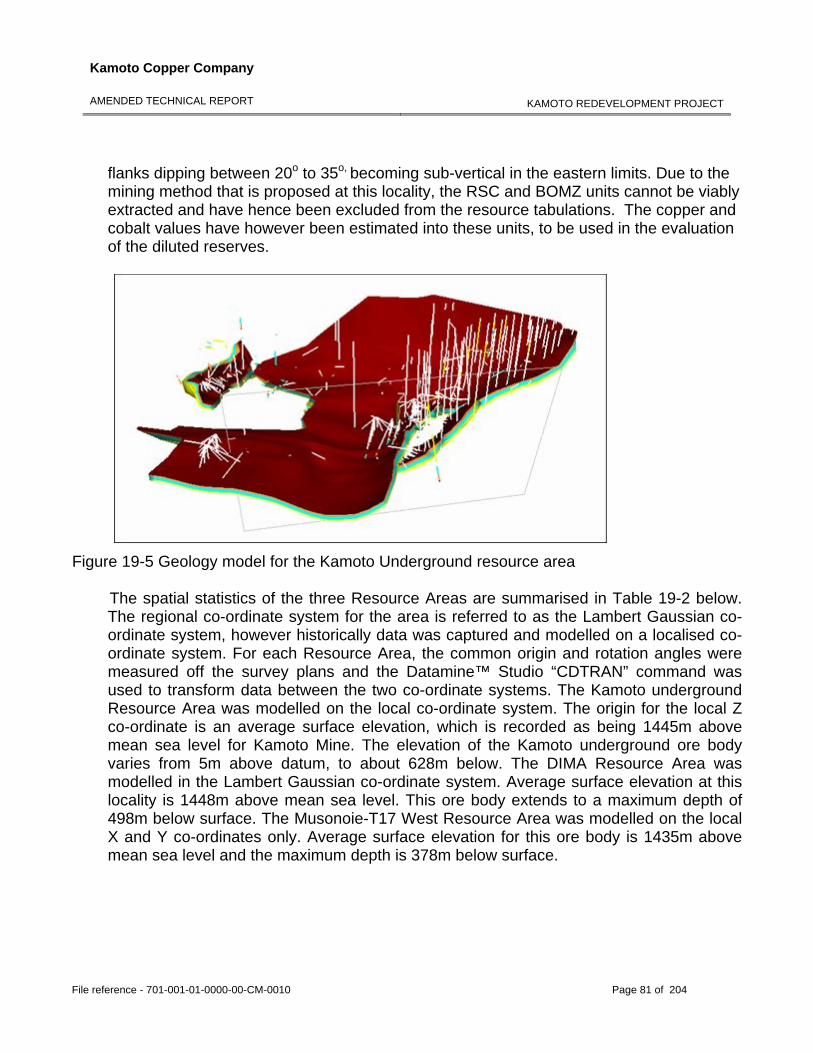
Kamoto Copper Company
AMENDED TECHNICAL REPORT
KAMOTO REDEVELOPMENT PROJECT
File reference - 701-001-01-0000-00-CM-0010 Page 81 of 204
flanks dipping between 20o to 35o, becoming sub-vertical in the eastern limits. Due to the mining method that is proposed at this locality, the RSC and BOMZ units cannot be viably extracted and have hence been excluded from the resource tabulations. The copper and cobalt values have however been estimated into these units, to be used in the evaluation of the diluted reserves.
Figure 19-5 Geology model for the Kamoto Underground resource area
The spatial statistics of the three Resource Areas are summarised in Table 19-2 below. The regional co-ordinate system for the area is referred to as the Lambert Gaussian co-ordinate system, however historically data was captured and modelled on a localised co-ordinate system. For each Resource Area, the common origin and rotation angles were measured off the survey plans and the Datamine™ Studio “CDTRAN” command was used to transform data between the two co-ordinate systems. The Kamoto underground Resource Area was modelled on the local co-ordinate system. The origin for the local Z co-ordinate is an average surface elevation, which is recorded as being 1445m above mean sea level for Kamoto Mine. The elevation of the Kamoto underground ore body varies from 5m above datum, to about 628m below. The DIMA Resource Area was modelled in the Lambert Gaussian co-ordinate system. Average surface elevation at this locality is 1448m above mean sea level. This ore body extends to a maximum depth of 498m below surface. The Musonoie-T17 West Resource Area was modelled on the local X and Y co-ordinates only. Average surface elevation for this ore body is 1435m above mean sea level and the maximum depth is 378m below surface.
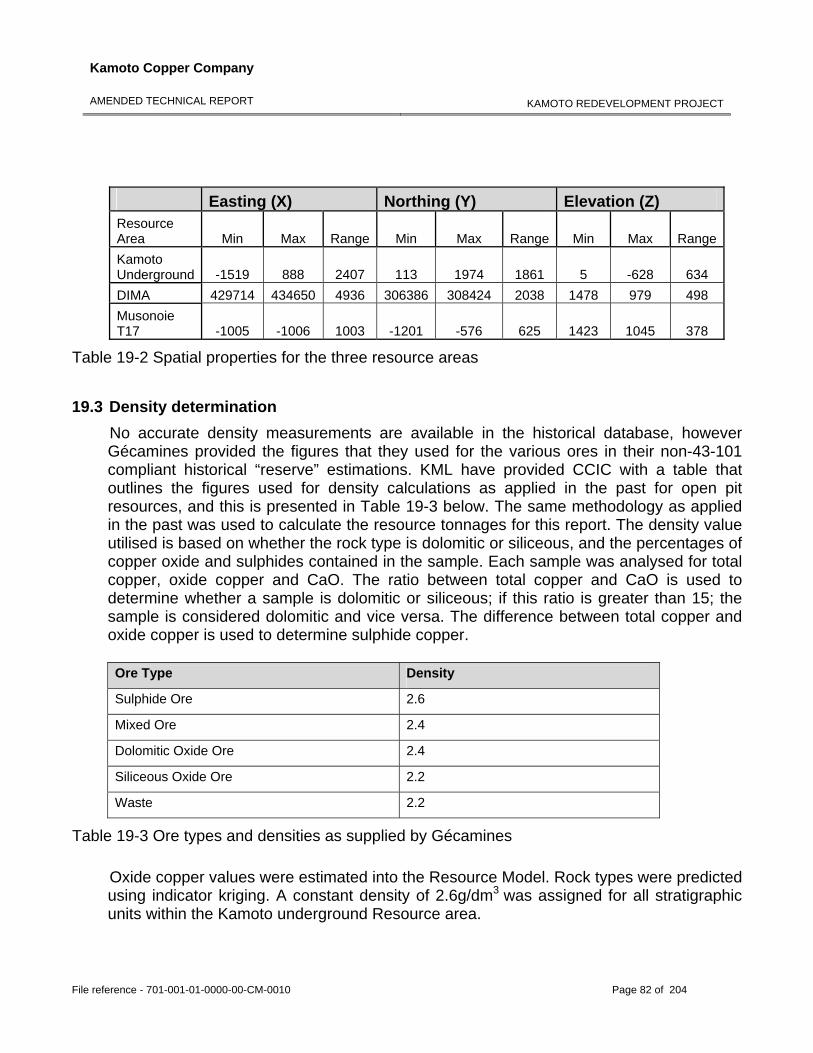
Kamoto Copper Company
AMENDED TECHNICAL REPORT
KAMOTO REDEVELOPMENT PROJECT
File reference - 701-001-01-0000-00-CM-0010 Page 82 of 204
Easting (X) Northing (Y) Elevation (Z) Resource Area Min Max Range Min Max Range Min Max RangeKamoto Underground -1519 888 2407 113 1974 1861 5 -628 634 DIMA 429714 434650 4936 306386 308424 2038 1478 979 498 Musonoie T17 -1005 -1006 1003 -1201 -576 625 1423 1045 378
Table 19-2 Spatial properties for the three resource areas
19.3 Density determination No accurate density measurements are available in the historical database, however Gécamines provided the figures that they used for the various ores in their non-43-101 compliant historical “reserve” estimations. KML have provided CCIC with a table that outlines the figures used for density calculations as applied in the past for open pit resources, and this is presented in Table 19-3 below. The same methodology as applied in the past was used to calculate the resource tonnages for this report. The density value utilised is based on whether the rock type is dolomitic or siliceous, and the percentages of copper oxide and sulphides contained in the sample. Each sample was analysed for total copper, oxide copper and CaO. The ratio between total copper and CaO is used to determine whether a sample is dolomitic or siliceous; if this ratio is greater than 15; the sample is considered dolomitic and vice versa. The difference between total copper and oxide copper is used to determine sulphide copper. Ore Type Density
Sulphide Ore 2.6
Mixed Ore 2.4
Dolomitic Oxide Ore 2.4
Siliceous Oxide Ore 2.2
Waste 2.2
Table 19-3 Ore types and densities as supplied by Gécamines
Oxide copper values were estimated into the Resource Model. Rock types were predicted using indicator kriging. A constant density of 2.6g/dm3 was assigned for all stratigraphic units within the Kamoto underground Resource area.
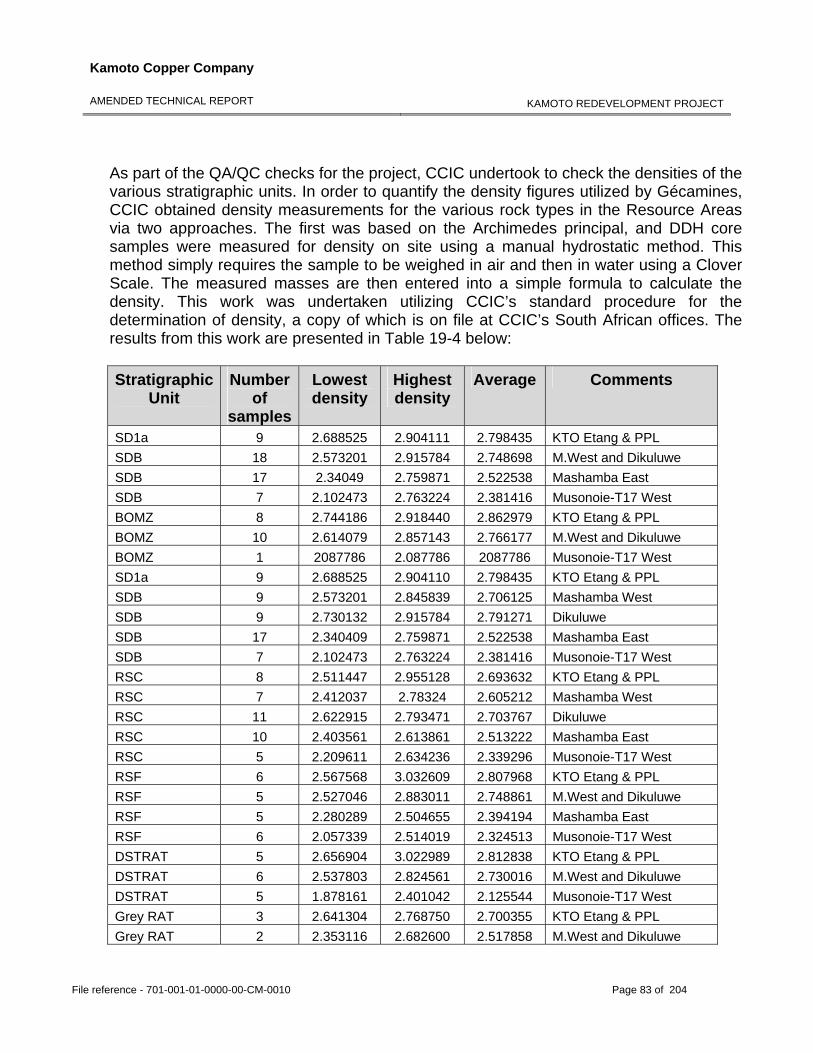
Kamoto Copper Company
AMENDED TECHNICAL REPORT
KAMOTO REDEVELOPMENT PROJECT
File reference - 701-001-01-0000-00-CM-0010 Page 83 of 204
As part of the QA/QC checks for the project, CCIC undertook to check the densities of the various stratigraphic units. In order to quantify the density figures utilized by Gécamines, CCIC obtained density measurements for the various rock types in the Resource Areas via two approaches. The first was based on the Archimedes principal, and DDH core samples were measured for density on site using a manual hydrostatic method. This method simply requires the sample to be weighed in air and then in water using a Clover Scale. The measured masses are then entered into a simple formula to calculate the density. This work was undertaken utilizing CCIC’s standard procedure for the determination of density, a copy of which is on file at CCIC’s South African offices. The results from this work are presented in Table 19-4 below: Stratigraphic
Unit Number
of samples
Lowest density
Highest density
Average Comments
SD1a 9 2.688525 2.904111 2.798435 KTO Etang & PPL SDB 18 2.573201 2.915784 2.748698 M.West and Dikuluwe SDB 17 2.34049 2.759871 2.522538 Mashamba East SDB 7 2.102473 2.763224 2.381416 Musonoie-T17 West BOMZ 8 2.744186 2.918440 2.862979 KTO Etang & PPL BOMZ 10 2.614079 2.857143 2.766177 M.West and Dikuluwe BOMZ 1 2087786 2.087786 2087786 Musonoie-T17 West SD1a 9 2.688525 2.904110 2.798435 KTO Etang & PPL SDB 9 2.573201 2.845839 2.706125 Mashamba West SDB 9 2.730132 2.915784 2.791271 Dikuluwe SDB 17 2.340409 2.759871 2.522538 Mashamba East SDB 7 2.102473 2.763224 2.381416 Musonoie-T17 West RSC 8 2.511447 2.955128 2.693632 KTO Etang & PPL RSC 7 2.412037 2.78324 2.605212 Mashamba West RSC 11 2.622915 2.793471 2.703767 Dikuluwe RSC 10 2.403561 2.613861 2.513222 Mashamba East RSC 5 2.209611 2.634236 2.339296 Musonoie-T17 West RSF 6 2.567568 3.032609 2.807968 KTO Etang & PPL RSF 5 2.527046 2.883011 2.748861 M.West and Dikuluwe RSF 5 2.280289 2.504655 2.394194 Mashamba East RSF 6 2.057339 2.514019 2.324513 Musonoie-T17 West DSTRAT 5 2.656904 3.022989 2.812838 KTO Etang & PPL DSTRAT 6 2.537803 2.824561 2.730016 M.West and Dikuluwe DSTRAT 5 1.878161 2.401042 2.125544 Musonoie-T17 West Grey RAT 3 2.641304 2.768750 2.700355 KTO Etang & PPL Grey RAT 2 2.353116 2.682600 2.517858 M.West and Dikuluwe
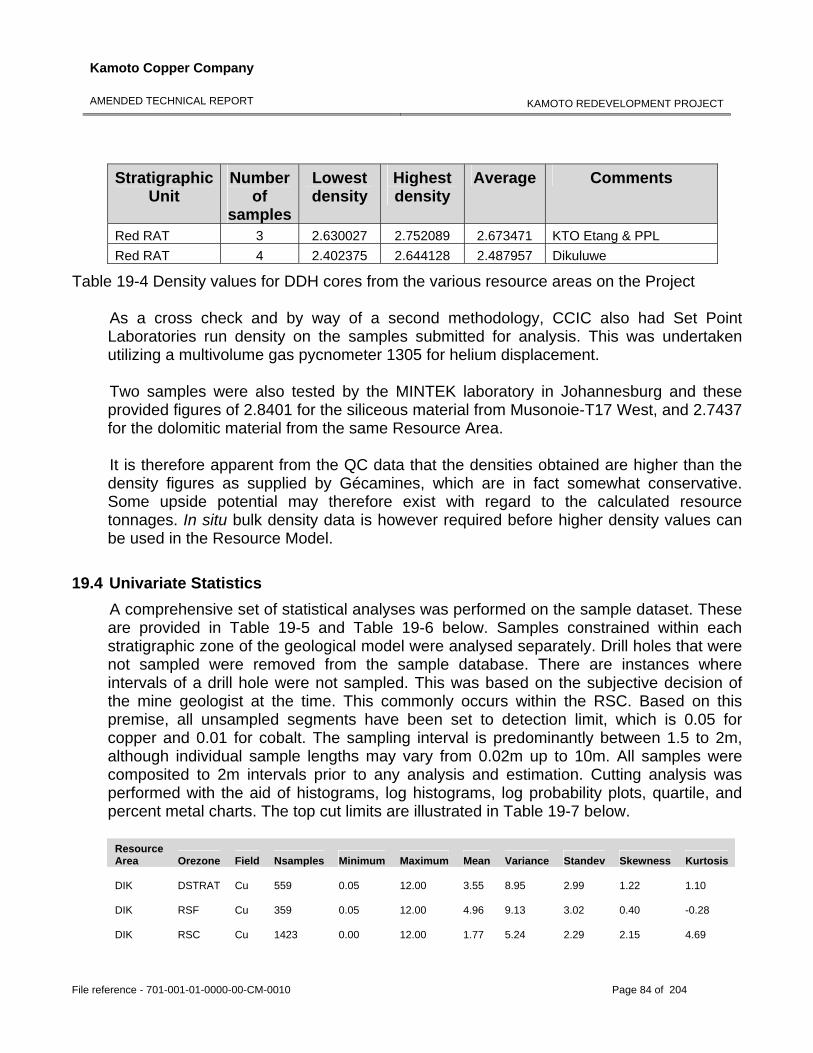
Kamoto Copper Company
AMENDED TECHNICAL REPORT
KAMOTO REDEVELOPMENT PROJECT
File reference - 701-001-01-0000-00-CM-0010 Page 84 of 204
Stratigraphic Unit
Number of
samples
Lowest density
Highest density
Average Comments
Red RAT 3 2.630027 2.752089 2.673471 KTO Etang & PPL Red RAT 4 2.402375 2.644128 2.487957 Dikuluwe
Table 19-4 Density values for DDH cores from the various resource areas on the Project As a cross check and by way of a second methodology, CCIC also had Set Point Laboratories run density on the samples submitted for analysis. This was undertaken utilizing a multivolume gas pycnometer 1305 for helium displacement. Two samples were also tested by the MINTEK laboratory in Johannesburg and these provided figures of 2.8401 for the siliceous material from Musonoie-T17 West, and 2.7437 for the dolomitic material from the same Resource Area. It is therefore apparent from the QC data that the densities obtained are higher than the density figures as supplied by Gécamines, which are in fact somewhat conservative. Some upside potential may therefore exist with regard to the calculated resource tonnages. In situ bulk density data is however required before higher density values can be used in the Resource Model.
19.4 Univariate Statistics A comprehensive set of statistical analyses was performed on the sample dataset. These are provided in Table 19-5 and Table 19-6 below. Samples constrained within each stratigraphic zone of the geological model were analysed separately. Drill holes that were not sampled were removed from the sample database. There are instances where intervals of a drill hole were not sampled. This was based on the subjective decision of the mine geologist at the time. This commonly occurs within the RSC. Based on this premise, all unsampled segments have been set to detection limit, which is 0.05 for copper and 0.01 for cobalt. The sampling interval is predominantly between 1.5 to 2m, although individual sample lengths may vary from 0.02m up to 10m. All samples were composited to 2m intervals prior to any analysis and estimation. Cutting analysis was performed with the aid of histograms, log histograms, log probability plots, quartile, and percent metal charts. The top cut limits are illustrated in Table 19-7 below. Resource Area Orezone Field Nsamples Minimum Maximum Mean Variance Standev Skewness Kurtosis
DIK DSTRAT Cu 559 0.05 12.00 3.55 8.95 2.99 1.22 1.10
DIK RSF Cu 359 0.05 12.00 4.96 9.13 3.02 0.40 -0.28
DIK RSC Cu 1423 0.00 12.00 1.77 5.24 2.29 2.15 4.69
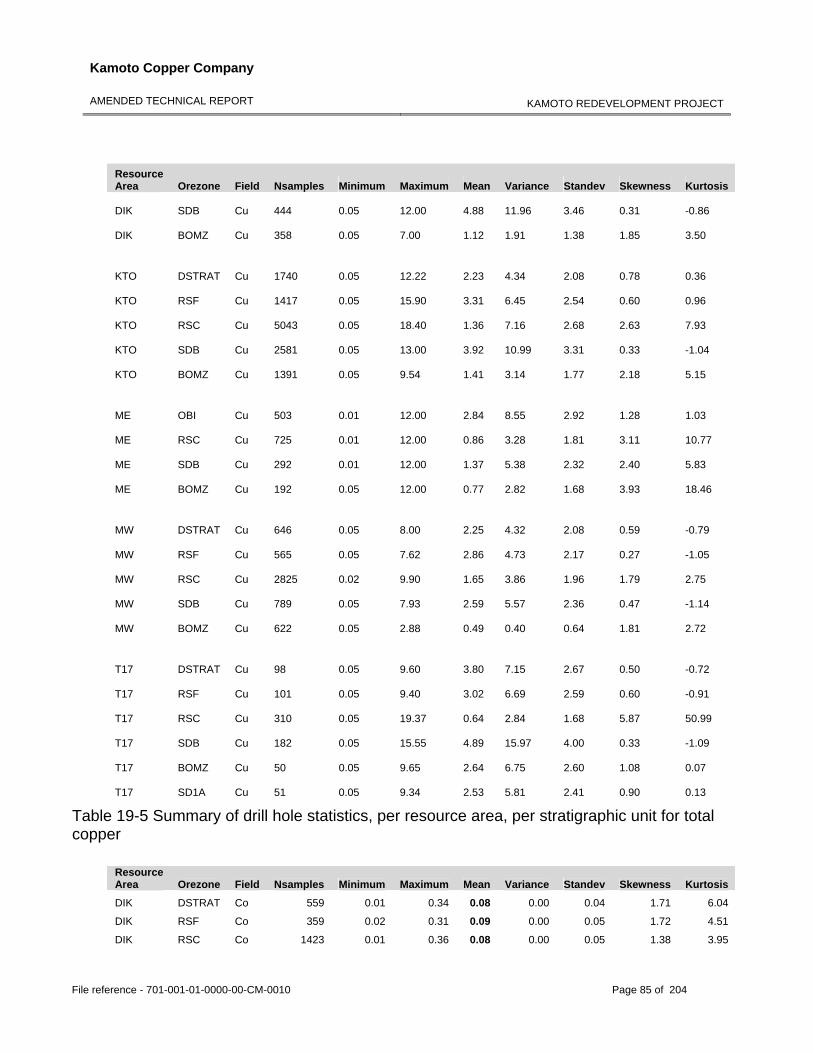
Kamoto Copper Company
AMENDED TECHNICAL REPORT
KAMOTO REDEVELOPMENT PROJECT
File reference - 701-001-01-0000-00-CM-0010 Page 85 of 204
Resource Area Orezone Field Nsamples Minimum Maximum Mean Variance Standev Skewness Kurtosis
DIK SDB Cu 444 0.05 12.00 4.88 11.96 3.46 0.31 -0.86
DIK BOMZ Cu 358 0.05 7.00 1.12 1.91 1.38 1.85 3.50
KTO DSTRAT Cu 1740 0.05 12.22 2.23 4.34 2.08 0.78 0.36
KTO RSF Cu 1417 0.05 15.90 3.31 6.45 2.54 0.60 0.96
KTO RSC Cu 5043 0.05 18.40 1.36 7.16 2.68 2.63 7.93
KTO SDB Cu 2581 0.05 13.00 3.92 10.99 3.31 0.33 -1.04
KTO BOMZ Cu 1391 0.05 9.54 1.41 3.14 1.77 2.18 5.15
ME OBI Cu 503 0.01 12.00 2.84 8.55 2.92 1.28 1.03
ME RSC Cu 725 0.01 12.00 0.86 3.28 1.81 3.11 10.77
ME SDB Cu 292 0.01 12.00 1.37 5.38 2.32 2.40 5.83
ME BOMZ Cu 192 0.05 12.00 0.77 2.82 1.68 3.93 18.46
MW DSTRAT Cu 646 0.05 8.00 2.25 4.32 2.08 0.59 -0.79
MW RSF Cu 565 0.05 7.62 2.86 4.73 2.17 0.27 -1.05
MW RSC Cu 2825 0.02 9.90 1.65 3.86 1.96 1.79 2.75
MW SDB Cu 789 0.05 7.93 2.59 5.57 2.36 0.47 -1.14
MW BOMZ Cu 622 0.05 2.88 0.49 0.40 0.64 1.81 2.72
T17 DSTRAT Cu 98 0.05 9.60 3.80 7.15 2.67 0.50 -0.72
T17 RSF Cu 101 0.05 9.40 3.02 6.69 2.59 0.60 -0.91
T17 RSC Cu 310 0.05 19.37 0.64 2.84 1.68 5.87 50.99
T17 SDB Cu 182 0.05 15.55 4.89 15.97 4.00 0.33 -1.09
T17 BOMZ Cu 50 0.05 9.65 2.64 6.75 2.60 1.08 0.07
T17 SD1A Cu 51 0.05 9.34 2.53 5.81 2.41 0.90 0.13
Table 19-5 Summary of drill hole statistics, per resource area, per stratigraphic unit for total copper
Resource Area Orezone Field Nsamples Minimum Maximum Mean Variance Standev Skewness Kurtosis
DIK DSTRAT Co 559 0.01 0.34 0.08 0.00 0.04 1.71 6.04
DIK RSF Co 359 0.02 0.31 0.09 0.00 0.05 1.72 4.51
DIK RSC Co 1423 0.01 0.36 0.08 0.00 0.05 1.38 3.95
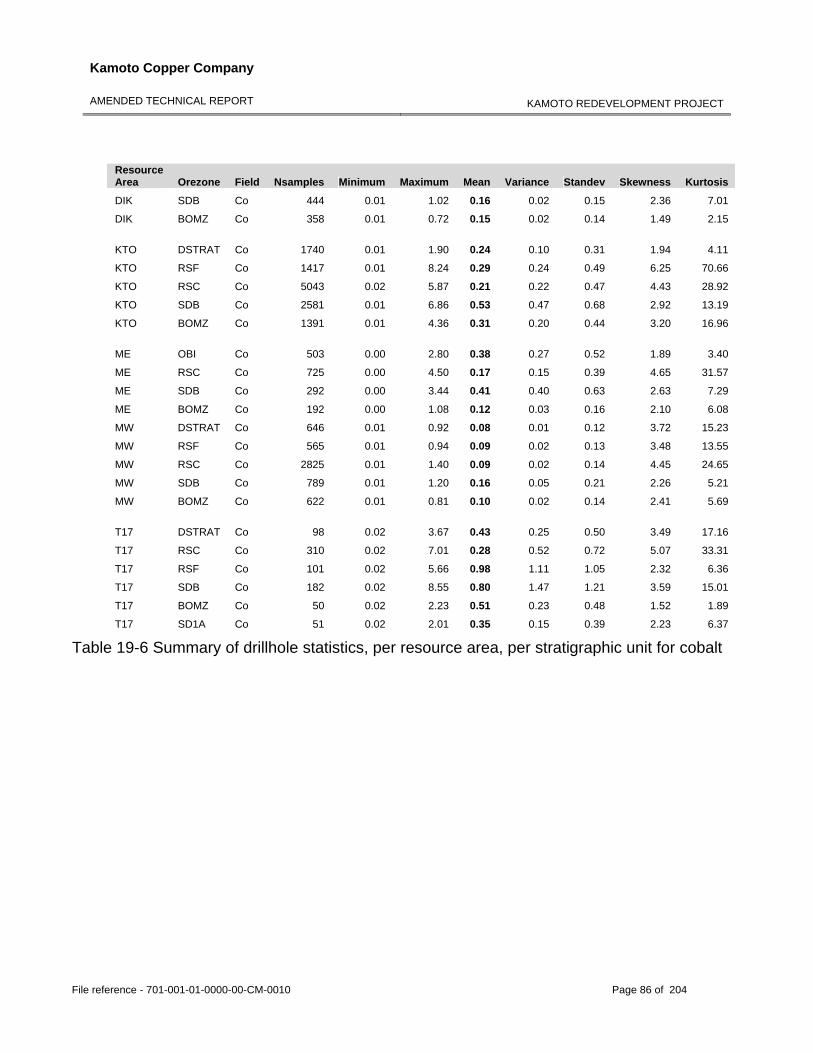
Kamoto Copper Company
AMENDED TECHNICAL REPORT
KAMOTO REDEVELOPMENT PROJECT
File reference - 701-001-01-0000-00-CM-0010 Page 86 of 204
Resource Area Orezone Field Nsamples Minimum Maximum Mean Variance Standev Skewness Kurtosis
DIK SDB Co 444 0.01 1.02 0.16 0.02 0.15 2.36 7.01
DIK BOMZ Co 358 0.01 0.72 0.15 0.02 0.14 1.49 2.15
KTO DSTRAT Co 1740 0.01 1.90 0.24 0.10 0.31 1.94 4.11
KTO RSF Co 1417 0.01 8.24 0.29 0.24 0.49 6.25 70.66
KTO RSC Co 5043 0.02 5.87 0.21 0.22 0.47 4.43 28.92
KTO SDB Co 2581 0.01 6.86 0.53 0.47 0.68 2.92 13.19
KTO BOMZ Co 1391 0.01 4.36 0.31 0.20 0.44 3.20 16.96
ME OBI Co 503 0.00 2.80 0.38 0.27 0.52 1.89 3.40
ME RSC Co 725 0.00 4.50 0.17 0.15 0.39 4.65 31.57
ME SDB Co 292 0.00 3.44 0.41 0.40 0.63 2.63 7.29
ME BOMZ Co 192 0.00 1.08 0.12 0.03 0.16 2.10 6.08
MW DSTRAT Co 646 0.01 0.92 0.08 0.01 0.12 3.72 15.23
MW RSF Co 565 0.01 0.94 0.09 0.02 0.13 3.48 13.55
MW RSC Co 2825 0.01 1.40 0.09 0.02 0.14 4.45 24.65
MW SDB Co 789 0.01 1.20 0.16 0.05 0.21 2.26 5.21
MW BOMZ Co 622 0.01 0.81 0.10 0.02 0.14 2.41 5.69
T17 DSTRAT Co 98 0.02 3.67 0.43 0.25 0.50 3.49 17.16
T17 RSC Co 310 0.02 7.01 0.28 0.52 0.72 5.07 33.31
T17 RSF Co 101 0.02 5.66 0.98 1.11 1.05 2.32 6.36
T17 SDB Co 182 0.02 8.55 0.80 1.47 1.21 3.59 15.01
T17 BOMZ Co 50 0.02 2.23 0.51 0.23 0.48 1.52 1.89
T17 SD1A Co 51 0.02 2.01 0.35 0.15 0.39 2.23 6.37
Table 19-6 Summary of drillhole statistics, per resource area, per stratigraphic unit for cobalt
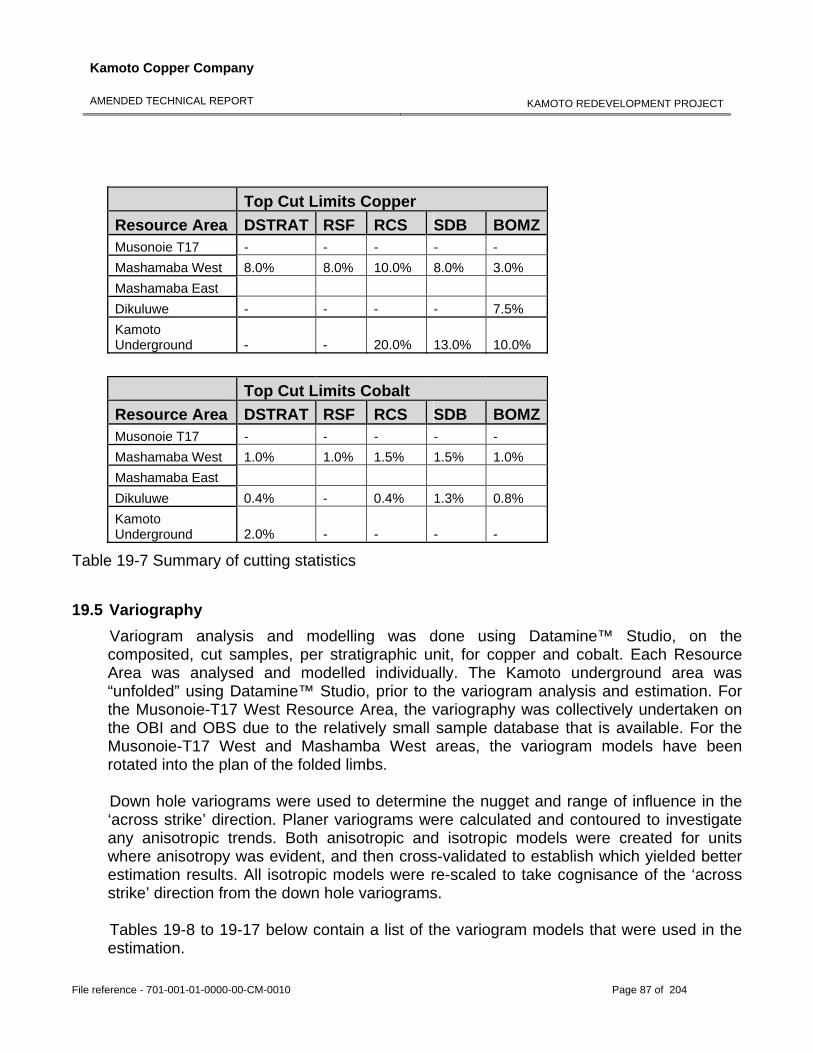
Kamoto Copper Company
AMENDED TECHNICAL REPORT
KAMOTO REDEVELOPMENT PROJECT
File reference - 701-001-01-0000-00-CM-0010 Page 87 of 204
Top Cut Limits Copper Resource Area DSTRAT RSF RCS SDB BOMZMusonoie T17 - - - - - Mashamaba West 8.0% 8.0% 10.0% 8.0% 3.0% Mashamaba East Dikuluwe - - - - 7.5% Kamoto Underground - - 20.0% 13.0% 10.0%
Top Cut Limits Cobalt Resource Area DSTRAT RSF RCS SDB BOMZMusonoie T17 - - - - - Mashamaba West 1.0% 1.0% 1.5% 1.5% 1.0% Mashamaba East Dikuluwe 0.4% - 0.4% 1.3% 0.8% Kamoto Underground 2.0% - - - -
Table 19-7 Summary of cutting statistics
19.5 Variography Variogram analysis and modelling was done using Datamine™ Studio, on the composited, cut samples, per stratigraphic unit, for copper and cobalt. Each Resource Area was analysed and modelled individually. The Kamoto underground area was “unfolded” using Datamine™ Studio, prior to the variogram analysis and estimation. For the Musonoie-T17 West Resource Area, the variography was collectively undertaken on the OBI and OBS due to the relatively small sample database that is available. For the Musonoie-T17 West and Mashamba West areas, the variogram models have been rotated into the plan of the folded limbs. Down hole variograms were used to determine the nugget and range of influence in the ‘across strike’ direction. Planer variograms were calculated and contoured to investigate any anisotropic trends. Both anisotropic and isotropic models were created for units where anisotropy was evident, and then cross-validated to establish which yielded better estimation results. All isotropic models were re-scaled to take cognisance of the ‘across strike’ direction from the down hole variograms. Tables 19-8 to 19-17 below contain a list of the variogram models that were used in the estimation.
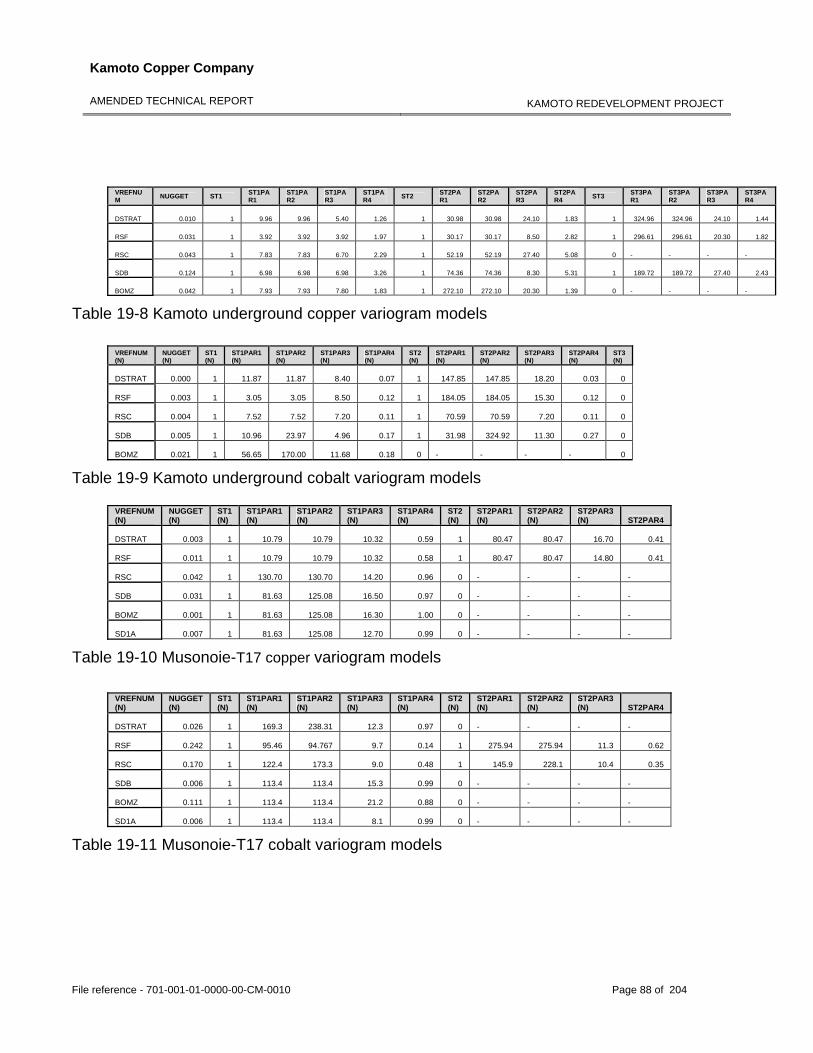
Kamoto Copper Company
AMENDED TECHNICAL REPORT
KAMOTO REDEVELOPMENT PROJECT
File reference - 701-001-01-0000-00-CM-0010 Page 88 of 204
VREFNUM NUGGET ST1 ST1PA
R1 ST1PAR2
ST1PAR3
ST1PAR4 ST2 ST2PA
R1 ST2PAR2
ST2PAR3
ST2PAR4 ST3 ST3PA
R1 ST3PAR2
ST3PAR3
ST3PAR4
DSTRAT 0.010 1 9.96 9.96 5.40 1.26 1 30.98 30.98 24.10 1.83 1 324.96 324.96 24.10 1.44
RSF 0.031 1 3.92 3.92 3.92 1.97 1 30.17 30.17 8.50 2.82 1 296.61 296.61 20.30 1.82
RSC 0.043 1 7.83 7.83 6.70 2.29 1 52.19 52.19 27.40 5.08 0 - - - -
SDB 0.124 1 6.98 6.98 6.98 3.26 1 74.36 74.36 8.30 5.31 1 189.72 189.72 27.40 2.43
BOMZ 0.042 1 7.93 7.93 7.80 1.83 1 272.10 272.10 20.30 1.39 0 - - - -
Table 19-8 Kamoto underground copper variogram models
VREFNUM (N)
NUGGET (N)
ST1 (N)
ST1PAR1 (N)
ST1PAR2 (N)
ST1PAR3 (N)
ST1PAR4 (N)
ST2 (N)
ST2PAR1 (N)
ST2PAR2 (N)
ST2PAR3 (N)
ST2PAR4 (N)
ST3 (N)
DSTRAT 0.000 1 11.87 11.87 8.40 0.07 1 147.85 147.85 18.20 0.03 0
RSF 0.003 1 3.05 3.05 8.50 0.12 1 184.05 184.05 15.30 0.12 0
RSC 0.004 1 7.52 7.52 7.20 0.11 1 70.59 70.59 7.20 0.11 0
SDB 0.005 1 10.96 23.97 4.96 0.17 1 31.98 324.92 11.30 0.27 0
BOMZ 0.021 1 56.65 170.00 11.68 0.18 0 - - - - 0
Table 19-9 Kamoto underground cobalt variogram models
VREFNUM (N)
NUGGET (N)
ST1 (N)
ST1PAR1 (N)
ST1PAR2 (N)
ST1PAR3 (N)
ST1PAR4 (N)
ST2 (N)
ST2PAR1 (N)
ST2PAR2 (N)
ST2PAR3 (N) ST2PAR4
DSTRAT 0.003 1 10.79 10.79 10.32 0.59 1 80.47 80.47 16.70 0.41
RSF 0.011 1 10.79 10.79 10.32 0.58 1 80.47 80.47 14.80 0.41
RSC 0.042 1 130.70 130.70 14.20 0.96 0 - - - -
SDB 0.031 1 81.63 125.08 16.50 0.97 0 - - - -
BOMZ 0.001 1 81.63 125.08 16.30 1.00 0 - - - -
SD1A 0.007 1 81.63 125.08 12.70 0.99 0 - - - -
Table 19-10 Musonoie-T17 copper variogram models
VREFNUM (N)
NUGGET (N)
ST1 (N)
ST1PAR1 (N)
ST1PAR2 (N)
ST1PAR3 (N)
ST1PAR4 (N)
ST2 (N)
ST2PAR1 (N)
ST2PAR2 (N)
ST2PAR3 (N) ST2PAR4
DSTRAT 0.026 1 169.3 238.31 12.3 0.97 0 - - - -
RSF 0.242 1 95.46 94.767 9.7 0.14 1 275.94 275.94 11.3 0.62
RSC 0.170 1 122.4 173.3 9.0 0.48 1 145.9 228.1 10.4 0.35
SDB 0.006 1 113.4 113.4 15.3 0.99 0 - - - -
BOMZ 0.111 1 113.4 113.4 21.2 0.88 0 - - - -
SD1A 0.006 1 113.4 113.4 8.1 0.99 0 - - - -
Table 19-11 Musonoie-T17 cobalt variogram models
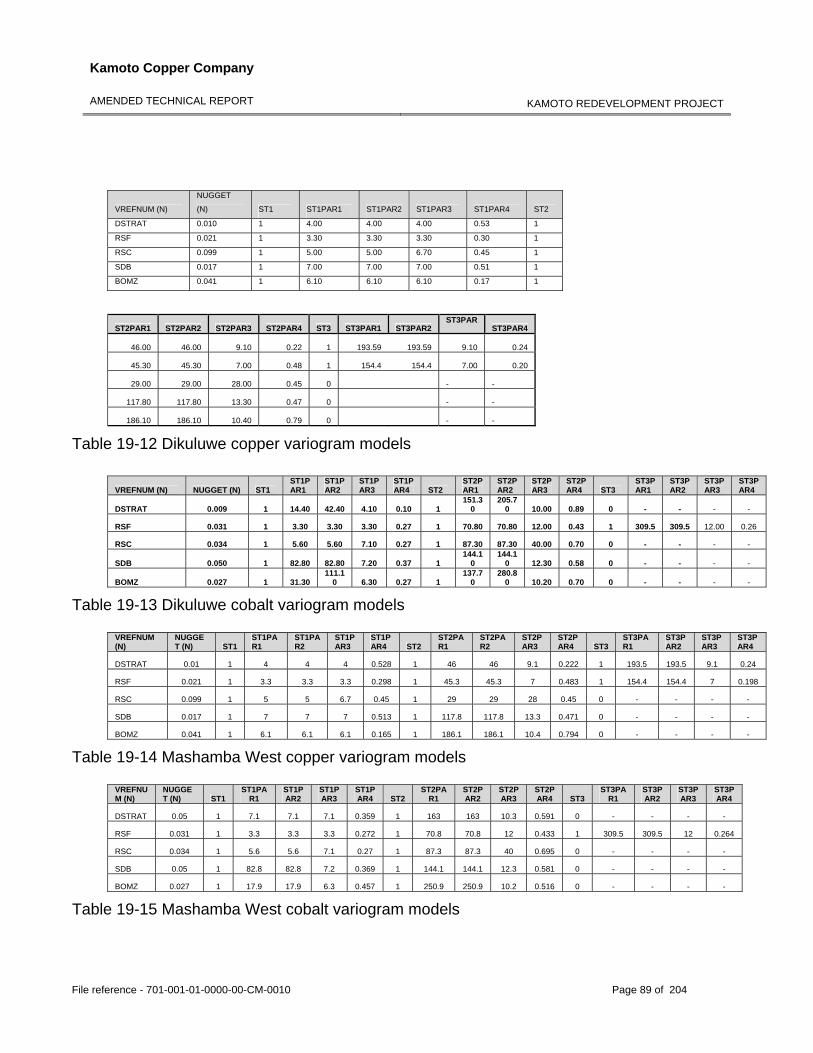
Kamoto Copper Company
AMENDED TECHNICAL REPORT
KAMOTO REDEVELOPMENT PROJECT
File reference - 701-001-01-0000-00-CM-0010 Page 89 of 204
VREFNUM (N)
NUGGET
(N) ST1 ST1PAR1 ST1PAR2 ST1PAR3 ST1PAR4 ST2 DSTRAT 0.010 1 4.00 4.00 4.00 0.53 1 RSF 0.021 1 3.30 3.30 3.30 0.30 1 RSC 0.099 1 5.00 5.00 6.70 0.45 1 SDB 0.017 1 7.00 7.00 7.00 0.51 1 BOMZ 0.041 1 6.10 6.10 6.10 0.17 1
ST2PAR1 ST2PAR2 ST2PAR3 ST2PAR4 ST3 ST3PAR1 ST3PAR2 ST3PAR
ST3PAR4
46.00 46.00 9.10 0.22 1 193.59 193.59 9.10 0.24
45.30 45.30 7.00 0.48 1 154.4 154.4 7.00 0.20
29.00 29.00 28.00 0.45 0
- -
117.80 117.80 13.30 0.47 0
- -
186.10 186.10 10.40 0.79 0
- -
Table 19-12 Dikuluwe copper variogram models
VREFNUM (N) NUGGET (N) ST1 ST1PAR1
ST1PAR2
ST1PAR3
ST1PAR4 ST2
ST2PAR1
ST2PAR2
ST2PAR3
ST2PAR4 ST3
ST3PAR1
ST3PAR2
ST3PAR3
ST3PAR4
DSTRAT 0.009 1 14.40 42.40 4.10 0.10 1 151.3
0 205.7
0 10.00 0.89 0 - - - -
RSF 0.031 1 3.30 3.30 3.30 0.27 1 70.80 70.80 12.00 0.43 1 309.5 309.5 12.00 0.26
RSC 0.034 1 5.60 5.60 7.10 0.27 1 87.30 87.30 40.00 0.70 0 - - - -
SDB 0.050 1 82.80 82.80 7.20 0.37 1 144.1
0 144.1
0 12.30 0.58 0 - - - -
BOMZ 0.027 1 31.30 111.1
0 6.30 0.27 1 137.7
0 280.8
0 10.20 0.70 0 - - - -
Table 19-13 Dikuluwe cobalt variogram models
VREFNUM (N)
NUGGET (N) ST1
ST1PAR1
ST1PAR2
ST1PAR3
ST1PAR4 ST2
ST2PAR1
ST2PAR2
ST2PAR3
ST2PAR4 ST3
ST3PAR1
ST3PAR2
ST3PAR3
ST3PAR4
DSTRAT 0.01 1 4 4 4 0.528 1 46 46 9.1 0.222 1 193.5 193.5 9.1 0.24
RSF 0.021 1 3.3 3.3 3.3 0.298 1 45.3 45.3 7 0.483 1 154.4 154.4 7 0.198
RSC 0.099 1 5 5 6.7 0.45 1 29 29 28 0.45 0 - - - -
SDB 0.017 1 7 7 7 0.513 1 117.8 117.8 13.3 0.471 0 - - - -
BOMZ 0.041 1 6.1 6.1 6.1 0.165 1 186.1 186.1 10.4 0.794 0 - - - -
Table 19-14 Mashamba West copper variogram models
VREFNUM (N)
NUGGET (N) ST1
ST1PAR1
ST1PAR2
ST1PAR3
ST1PAR4 ST2
ST2PAR1
ST2PAR2
ST2PAR3
ST2PAR4 ST3
ST3PAR1
ST3PAR2
ST3PAR3
ST3PAR4
DSTRAT 0.05 1 7.1 7.1 7.1 0.359 1 163 163 10.3 0.591 0 - - - -
RSF 0.031 1 3.3 3.3 3.3 0.272 1 70.8 70.8 12 0.433 1 309.5 309.5 12 0.264
RSC 0.034 1 5.6 5.6 7.1 0.27 1 87.3 87.3 40 0.695 0 - - - -
SDB 0.05 1 82.8 82.8 7.2 0.369 1 144.1 144.1 12.3 0.581 0 - - - -
BOMZ 0.027 1 17.9 17.9 6.3 0.457 1 250.9 250.9 10.2 0.516 0 - - - -
Table 19-15 Mashamba West cobalt variogram models
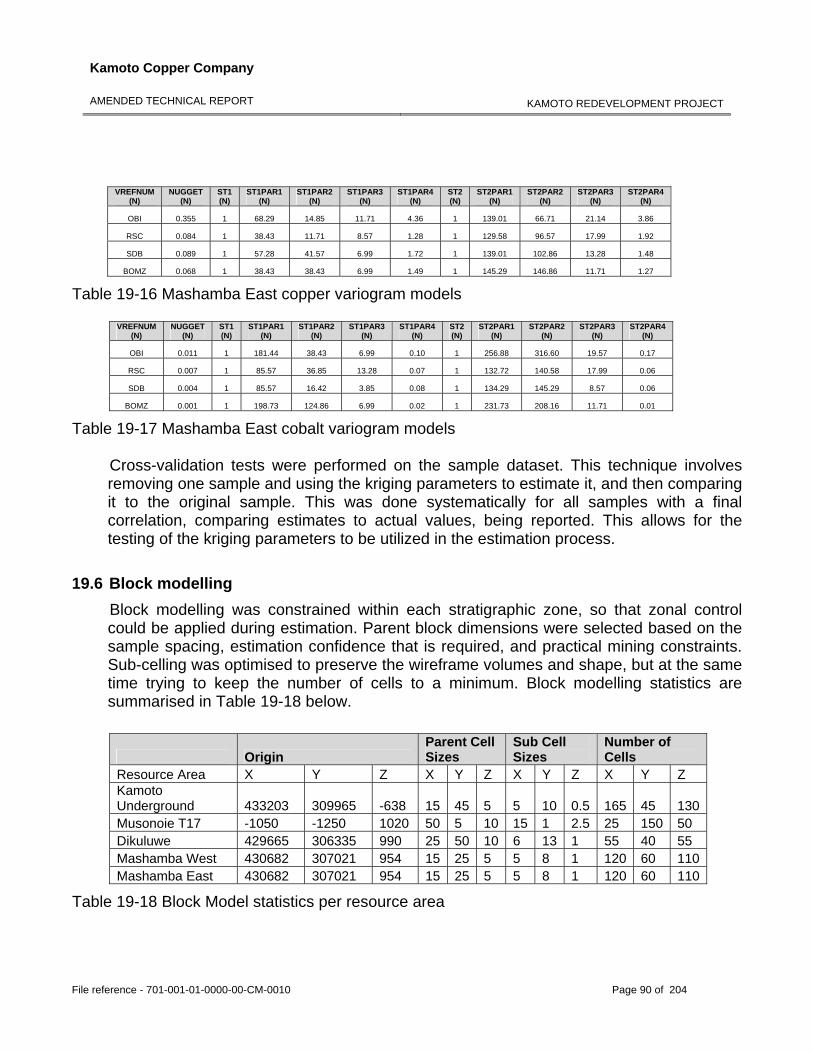
Kamoto Copper Company
AMENDED TECHNICAL REPORT
KAMOTO REDEVELOPMENT PROJECT
File reference - 701-001-01-0000-00-CM-0010 Page 90 of 204
VREFNUM
(N) NUGGET
(N) ST1 (N)
ST1PAR1 (N)
ST1PAR2 (N)
ST1PAR3 (N)
ST1PAR4 (N)
ST2 (N)
ST2PAR1 (N)
ST2PAR2 (N)
ST2PAR3 (N)
ST2PAR4 (N)
OBI 0.355 1 68.29 14.85 11.71 4.36 1 139.01 66.71 21.14 3.86
RSC 0.084 1 38.43 11.71 8.57 1.28 1 129.58 96.57 17.99 1.92
SDB 0.089 1 57.28 41.57 6.99 1.72 1 139.01 102.86 13.28 1.48
BOMZ 0.068 1 38.43 38.43 6.99 1.49 1 145.29 146.86 11.71 1.27
Table 19-16 Mashamba East copper variogram models
VREFNUM (N)
NUGGET (N)
ST1 (N)
ST1PAR1 (N)
ST1PAR2 (N)
ST1PAR3 (N)
ST1PAR4 (N)
ST2 (N)
ST2PAR1 (N)
ST2PAR2 (N)
ST2PAR3 (N)
ST2PAR4 (N)
OBI 0.011 1 181.44 38.43 6.99 0.10 1 256.88 316.60 19.57 0.17
RSC 0.007 1 85.57 36.85 13.28 0.07 1 132.72 140.58 17.99 0.06
SDB 0.004 1 85.57 16.42 3.85 0.08 1 134.29 145.29 8.57 0.06
BOMZ 0.001 1 198.73 124.86 6.99 0.02 1 231.73 208.16 11.71 0.01
Table 19-17 Mashamba East cobalt variogram models Cross-validation tests were performed on the sample dataset. This technique involves removing one sample and using the kriging parameters to estimate it, and then comparing it to the original sample. This was done systematically for all samples with a final correlation, comparing estimates to actual values, being reported. This allows for the testing of the kriging parameters to be utilized in the estimation process.
19.6 Block modelling Block modelling was constrained within each stratigraphic zone, so that zonal control could be applied during estimation. Parent block dimensions were selected based on the sample spacing, estimation confidence that is required, and practical mining constraints. Sub-celling was optimised to preserve the wireframe volumes and shape, but at the same time trying to keep the number of cells to a minimum. Block modelling statistics are summarised in Table 19-18 below.
Origin Parent Cell Sizes
Sub Cell Sizes
Number of Cells
Resource Area X Y Z X Y Z X Y Z X Y Z Kamoto Underground 433203 309965 -638 15 45 5 5 10 0.5 165 45 130Musonoie T17 -1050 -1250 1020 50 5 10 15 1 2.5 25 150 50 Dikuluwe 429665 306335 990 25 50 10 6 13 1 55 40 55 Mashamba West 430682 307021 954 15 25 5 5 8 1 120 60 110Mashamba East 430682 307021 954 15 25 5 5 8 1 120 60 110
Table 19-18 Block Model statistics per resource area
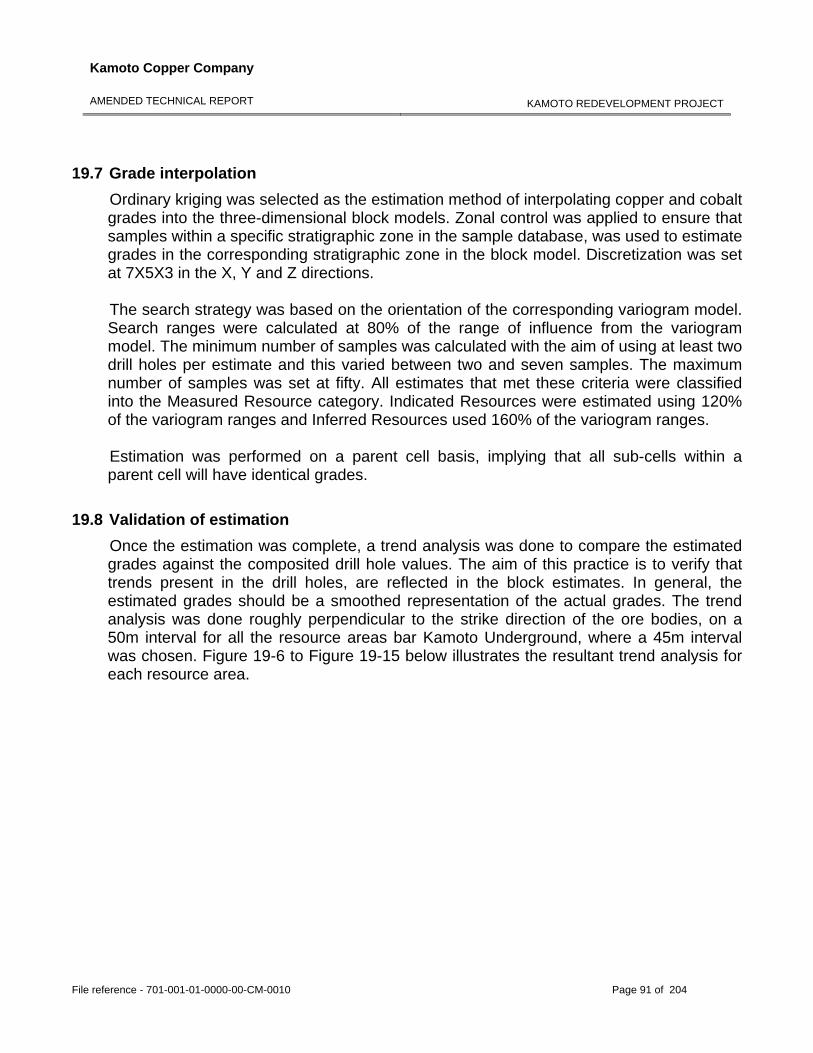
Kamoto Copper Company
AMENDED TECHNICAL REPORT
KAMOTO REDEVELOPMENT PROJECT
File reference - 701-001-01-0000-00-CM-0010 Page 91 of 204
19.7 Grade interpolation Ordinary kriging was selected as the estimation method of interpolating copper and cobalt grades into the three-dimensional block models. Zonal control was applied to ensure that samples within a specific stratigraphic zone in the sample database, was used to estimate grades in the corresponding stratigraphic zone in the block model. Discretization was set at 7X5X3 in the X, Y and Z directions. The search strategy was based on the orientation of the corresponding variogram model. Search ranges were calculated at 80% of the range of influence from the variogram model. The minimum number of samples was calculated with the aim of using at least two drill holes per estimate and this varied between two and seven samples. The maximum number of samples was set at fifty. All estimates that met these criteria were classified into the Measured Resource category. Indicated Resources were estimated using 120% of the variogram ranges and Inferred Resources used 160% of the variogram ranges. Estimation was performed on a parent cell basis, implying that all sub-cells within a parent cell will have identical grades.
19.8 Validation of estimation Once the estimation was complete, a trend analysis was done to compare the estimated grades against the composited drill hole values. The aim of this practice is to verify that trends present in the drill holes, are reflected in the block estimates. In general, the estimated grades should be a smoothed representation of the actual grades. The trend analysis was done roughly perpendicular to the strike direction of the ore bodies, on a 50m interval for all the resource areas bar Kamoto Underground, where a 45m interval was chosen. Figure 19-6 to Figure 19-15 below illustrates the resultant trend analysis for each resource area.
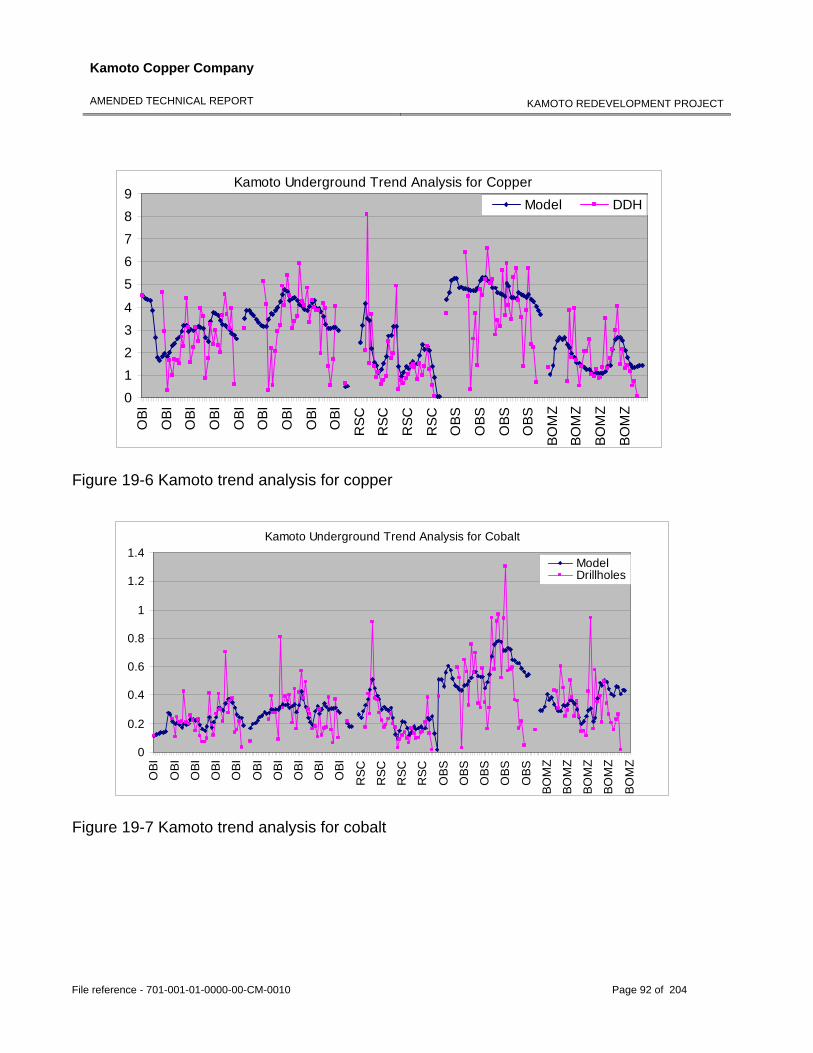
Kamoto Copper Company
AMENDED TECHNICAL REPORT
KAMOTO REDEVELOPMENT PROJECT
File reference - 701-001-01-0000-00-CM-0010 Page 92 of 204
Kamoto Underground Trend Analysis for Copper
01234
56789
OBI
OBI
OBI
OBI
OBI
OBI
OBI
OBI
OBI
RSC
RSC
RSC
RSC
OBS
OBS
OBS
OBS
BOM
Z
BOM
Z
BOM
Z
BOM
Z
Model DDH
Figure 19-6 Kamoto trend analysis for copper
Kamoto Underground Trend Analysis for Cobalt
0
0.2
0.4
0.6
0.8
1
1.2
1.4
OBI
OBI
OBI
OBI
OBI
OBI
OBI
OBI
OBI
OBI
RSC
RSC
RSC
RSC
OBS
OBS
OBS
OBS
OBS
BOM
Z
BOM
Z
BOM
Z
BOM
Z
BOM
Z
ModelDrillholes
Figure 19-7 Kamoto trend analysis for cobalt
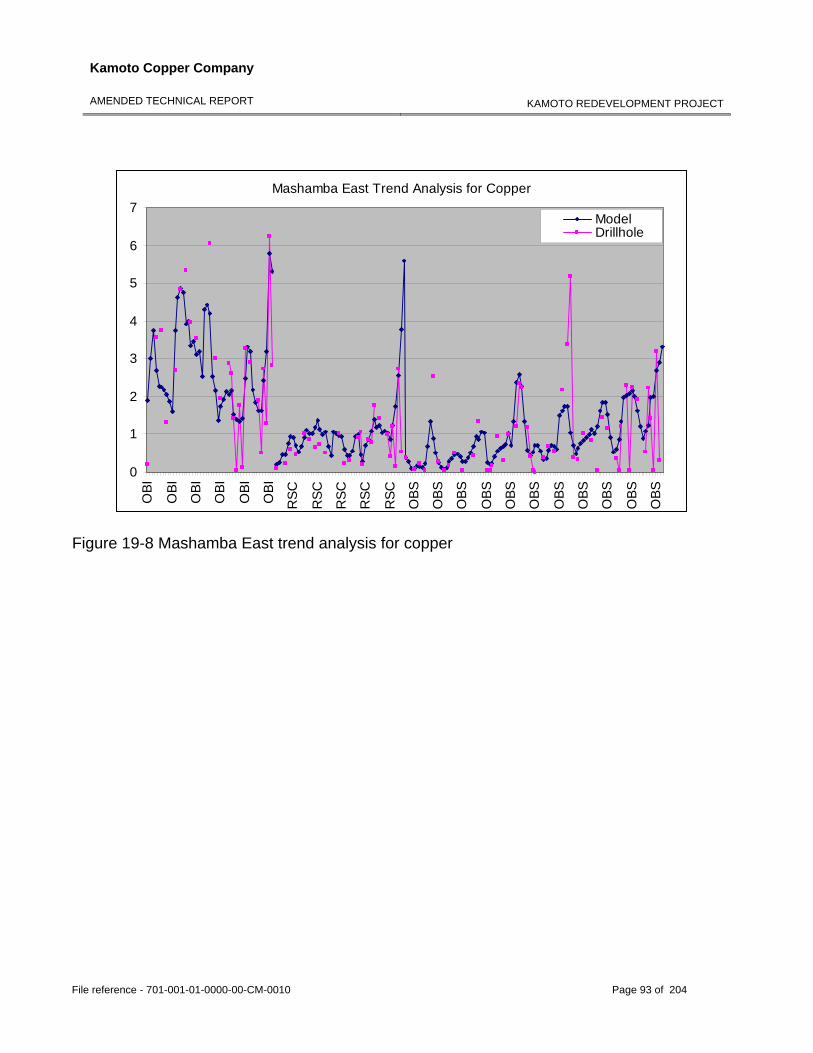
Kamoto Copper Company
AMENDED TECHNICAL REPORT
KAMOTO REDEVELOPMENT PROJECT
File reference - 701-001-01-0000-00-CM-0010 Page 93 of 204
Mashamba East Trend Analysis for Copper
0
1
2
3
4
5
6
7
OBI
OBI
OBI
OBI
OBI
OBI
RSC
RSC
RSC
RSC
RSC
OBS
OBS
OBS
OBS
OBS
OBS
OBS
OBS
OBS
OBS
OBS
ModelDrillhole
Figure 19-8 Mashamba East trend analysis for copper
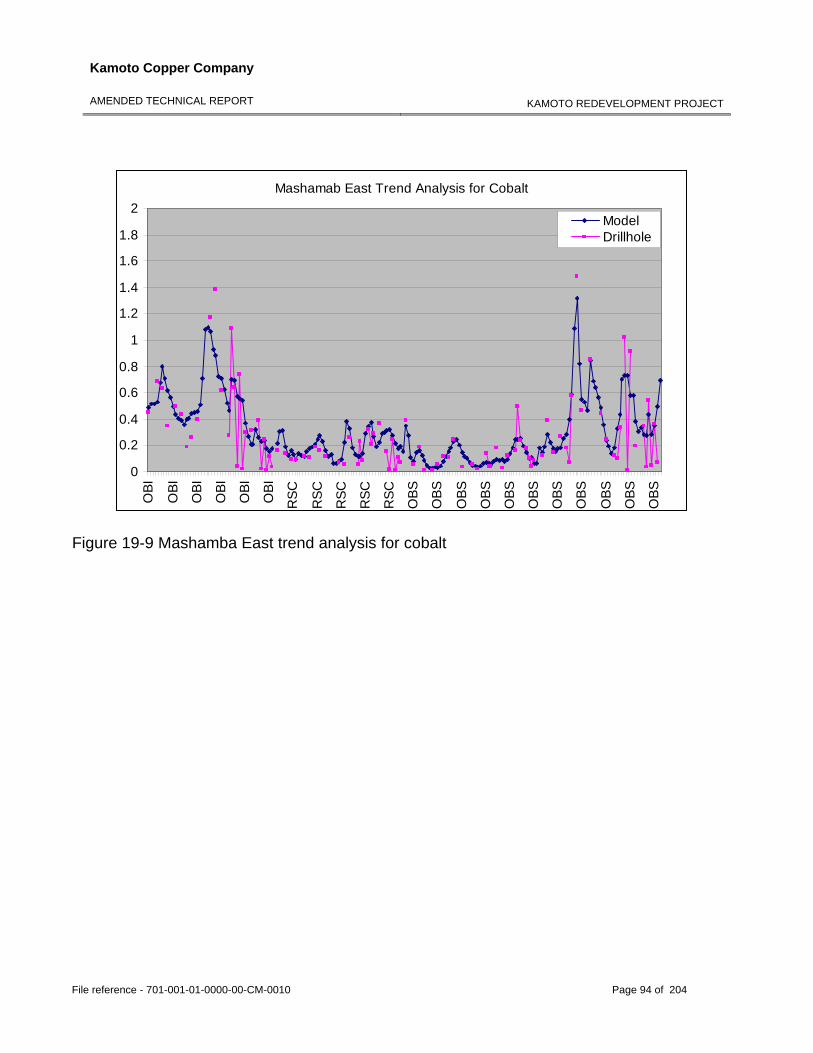
Kamoto Copper Company
AMENDED TECHNICAL REPORT
KAMOTO REDEVELOPMENT PROJECT
File reference - 701-001-01-0000-00-CM-0010 Page 94 of 204
Mashamab East Trend Analysis for Cobalt
0
0.2
0.4
0.6
0.8
1
1.2
1.4
1.6
1.8
2
OBI
OBI
OBI
OBI
OBI
OBI
RSC
RSC
RSC
RSC
RSC
OBS
OBS
OBS
OBS
OBS
OBS
OBS
OBS
OBS
OBS
OBS
ModelDrillhole
Figure 19-9 Mashamba East trend analysis for cobalt
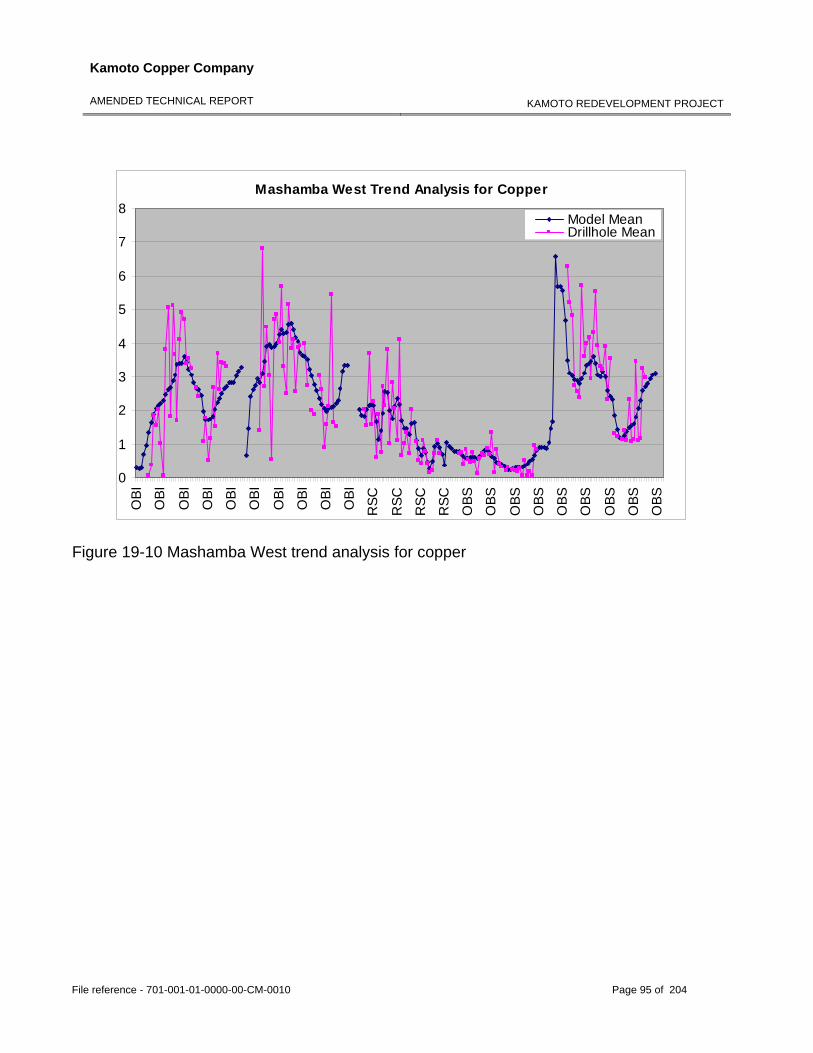
Kamoto Copper Company
AMENDED TECHNICAL REPORT
KAMOTO REDEVELOPMENT PROJECT
File reference - 701-001-01-0000-00-CM-0010 Page 95 of 204
Mashamba West Trend Analysis for Copper
0
1
2
3
4
5
6
7
8
OBI
OBI
OBI
OBI
OBI
OBI
OBI
OBI
OBI
OBI
RSC
RSC
RSC
RSC
OBS
OBS
OBS
OBS
OBS
OBS
OBS
OBS
OBS
Model MeanDrillhole Mean
Figure 19-10 Mashamba West trend analysis for copper
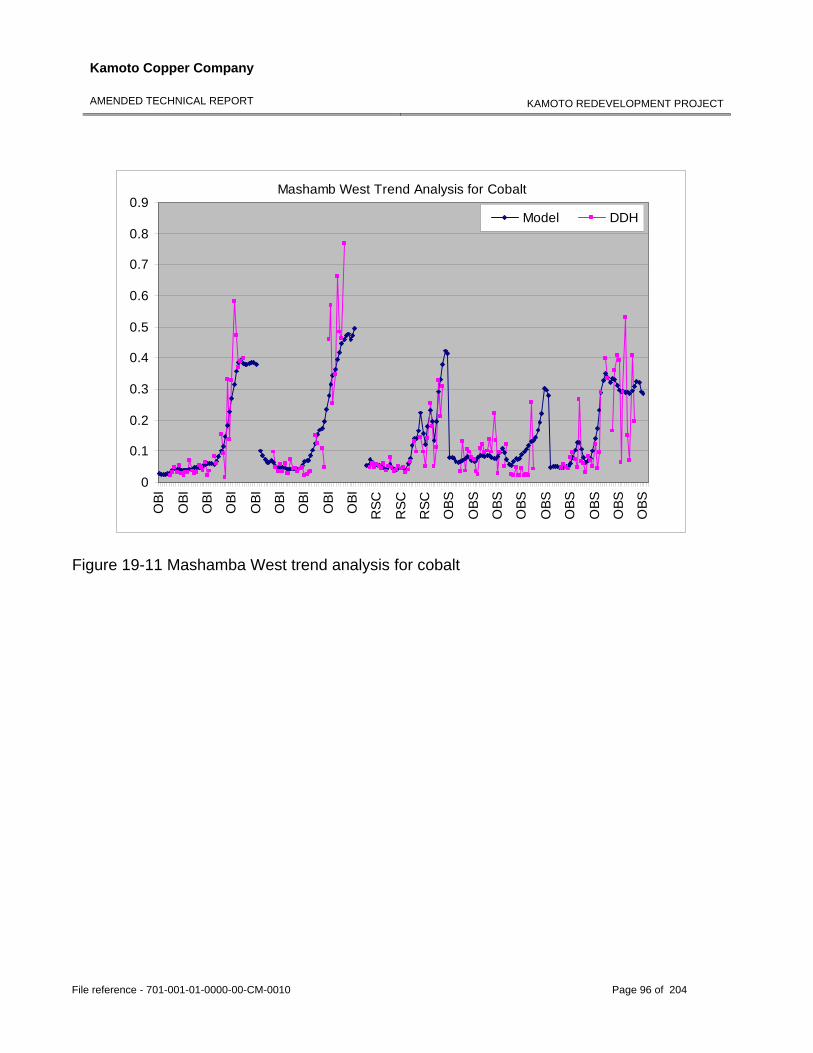
Kamoto Copper Company
AMENDED TECHNICAL REPORT
KAMOTO REDEVELOPMENT PROJECT
File reference - 701-001-01-0000-00-CM-0010 Page 96 of 204
Mashamb West Trend Analysis for Cobalt
0
0.1
0.2
0.3
0.4
0.5
0.6
0.7
0.8
0.9
OBI
OBI
OBI
OBI
OBI
OBI
OBI
OBI
OBI
RSC
RSC
RSC
OBS
OBS
OBS
OBS
OBS
OBS
OBS
OBS
OBS
Model DDH
Figure 19-11 Mashamba West trend analysis for cobalt
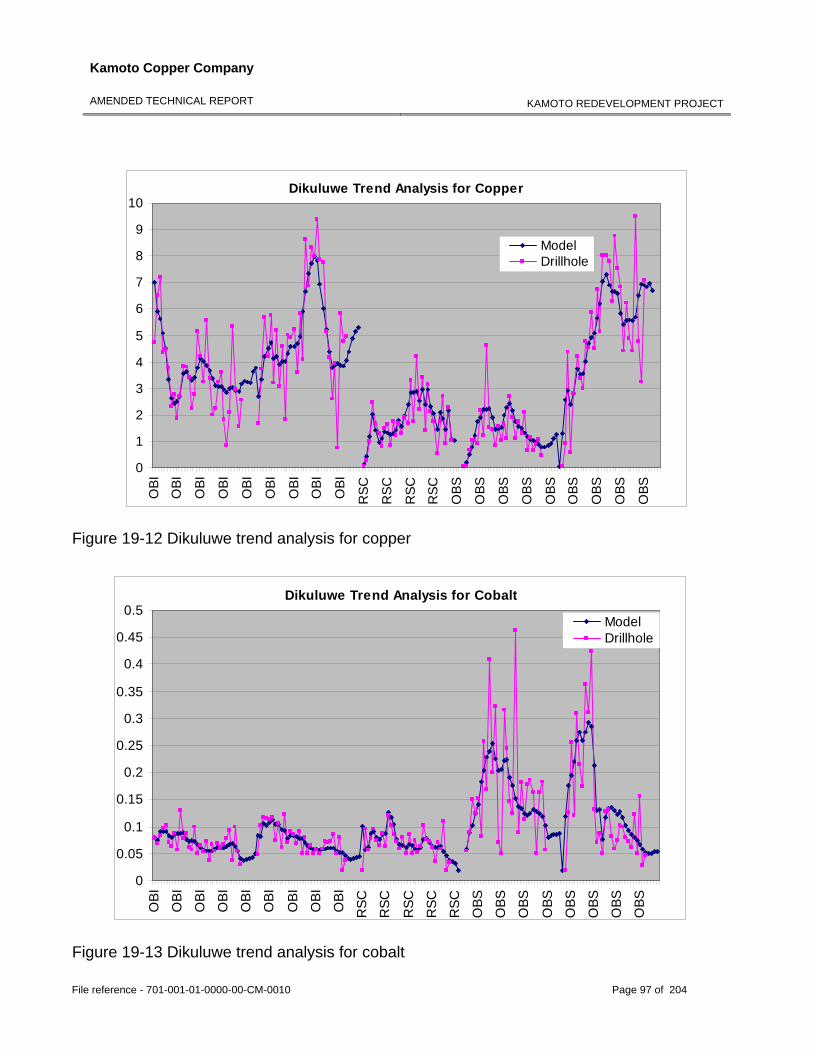
Kamoto Copper Company
AMENDED TECHNICAL REPORT
KAMOTO REDEVELOPMENT PROJECT
File reference - 701-001-01-0000-00-CM-0010 Page 97 of 204
Dikuluwe Trend Analysis for Copper
0
1
2
3
4
5
6
7
8
9
10
OBI
OBI
OBI
OBI
OBI
OBI
OBI
OBI
OBI
RSC
RSC
RSC
RSC
OBS
OBS
OBS
OBS
OBS
OBS
OBS
OBS
OBS
ModelDrillhole
Figure 19-12 Dikuluwe trend analysis for copper
Dikuluwe Trend Analysis for Cobalt
0
0.05
0.1
0.15
0.2
0.25
0.3
0.35
0.4
0.45
0.5
OBI
OBI
OBI
OBI
OBI
OBI
OBI
OBI
OBI
RSC
RSC
RSC
RSC
RSC
OBS
OBS
OBS
OBS
OBS
OBS
OBS
OBS
ModelDrillhole
Figure 19-13 Dikuluwe trend analysis for cobalt
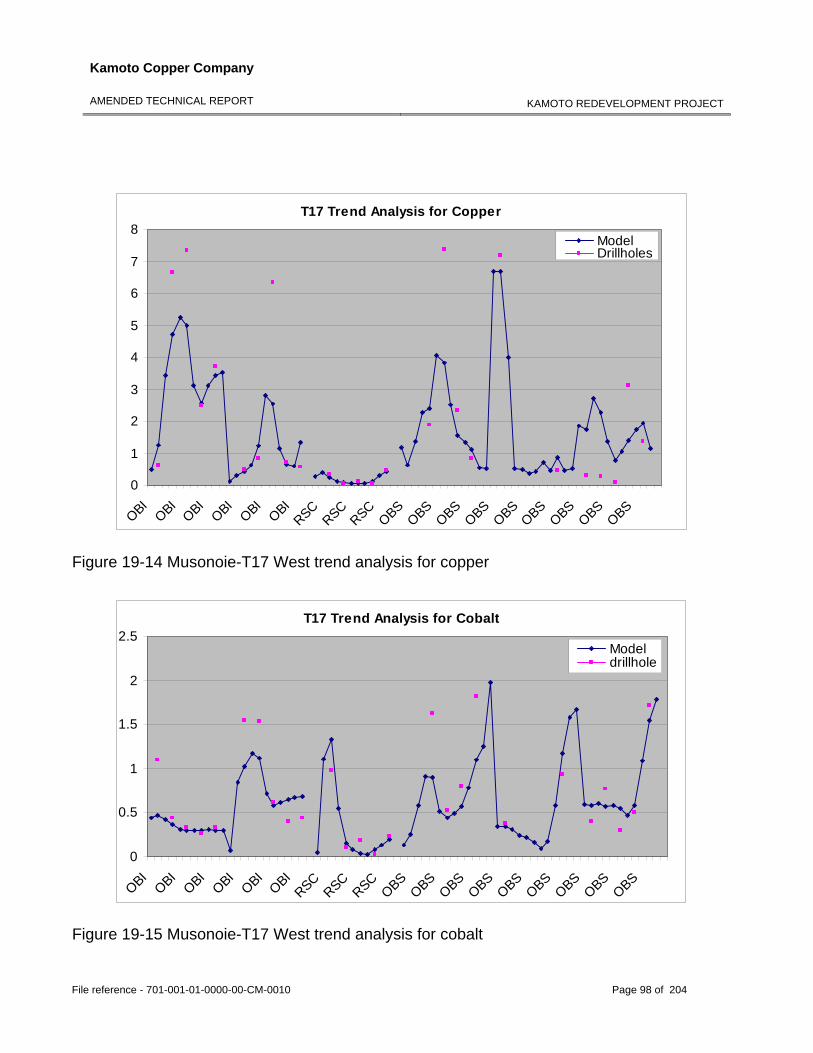
Kamoto Copper Company
AMENDED TECHNICAL REPORT
KAMOTO REDEVELOPMENT PROJECT
File reference - 701-001-01-0000-00-CM-0010 Page 98 of 204
T17 Trend Analysis for Copper
0
1
2
3
4
5
6
7
8
OBIOBI
OBIOBI
OBIOBI
RSCRSC
RSCOBS
OBSOBS
OBSOBS
OBSOBS
OBSOBS
ModelDrillholes
Figure 19-14 Musonoie-T17 West trend analysis for copper
T17 Trend Analysis for Cobalt
0
0.5
1
1.5
2
2.5
OBIOBI
OBIOBI
OBIOBI
RSCRSC
RSCOBS
OBSOBS
OBSOBS
OBSOBS
OBSOBS
Modeldrillhole
Figure 19-15 Musonoie-T17 West trend analysis for cobalt
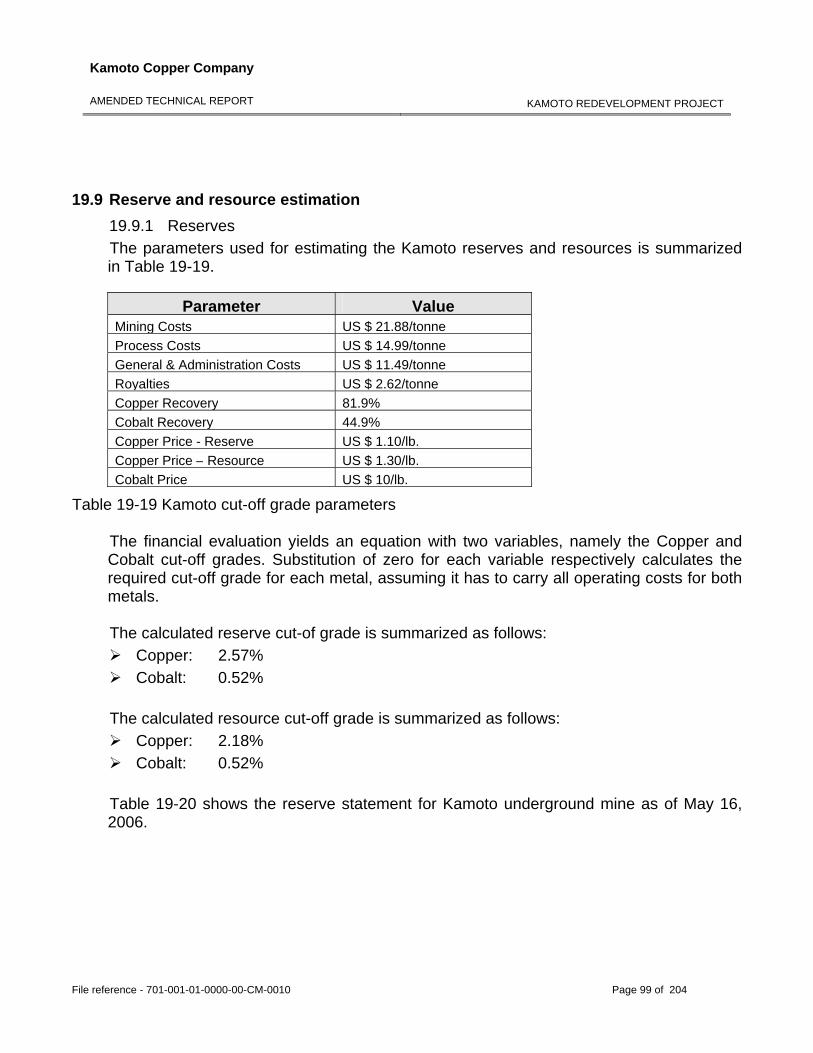
Kamoto Copper Company
AMENDED TECHNICAL REPORT
KAMOTO REDEVELOPMENT PROJECT
File reference - 701-001-01-0000-00-CM-0010 Page 99 of 204
19.9 Reserve and resource estimation
19.9.1 Reserves The parameters used for estimating the Kamoto reserves and resources is summarized in Table 19-19.
Parameter Value
Mining Costs US $ 21.88/tonneProcess Costs US $ 14.99/tonneGeneral & Administration Costs US $ 11.49/tonneRoyalties US $ 2.62/tonneCopper Recovery 81.9%Cobalt Recovery 44.9%Copper Price - Reserve US $ 1.10/lb.Copper Price – Resource US $ 1.30/lb.Cobalt Price US $ 10/lb.
Table 19-19 Kamoto cut-off grade parameters The financial evaluation yields an equation with two variables, namely the Copper and Cobalt cut-off grades. Substitution of zero for each variable respectively calculates the required cut-off grade for each metal, assuming it has to carry all operating costs for both metals. The calculated reserve cut-of grade is summarized as follows:
Copper: 2.57% Cobalt: 0.52%
The calculated resource cut-off grade is summarized as follows:
Copper: 2.18% Cobalt: 0.52%
Table 19-20 shows the reserve statement for Kamoto underground mine as of May 16, 2006.
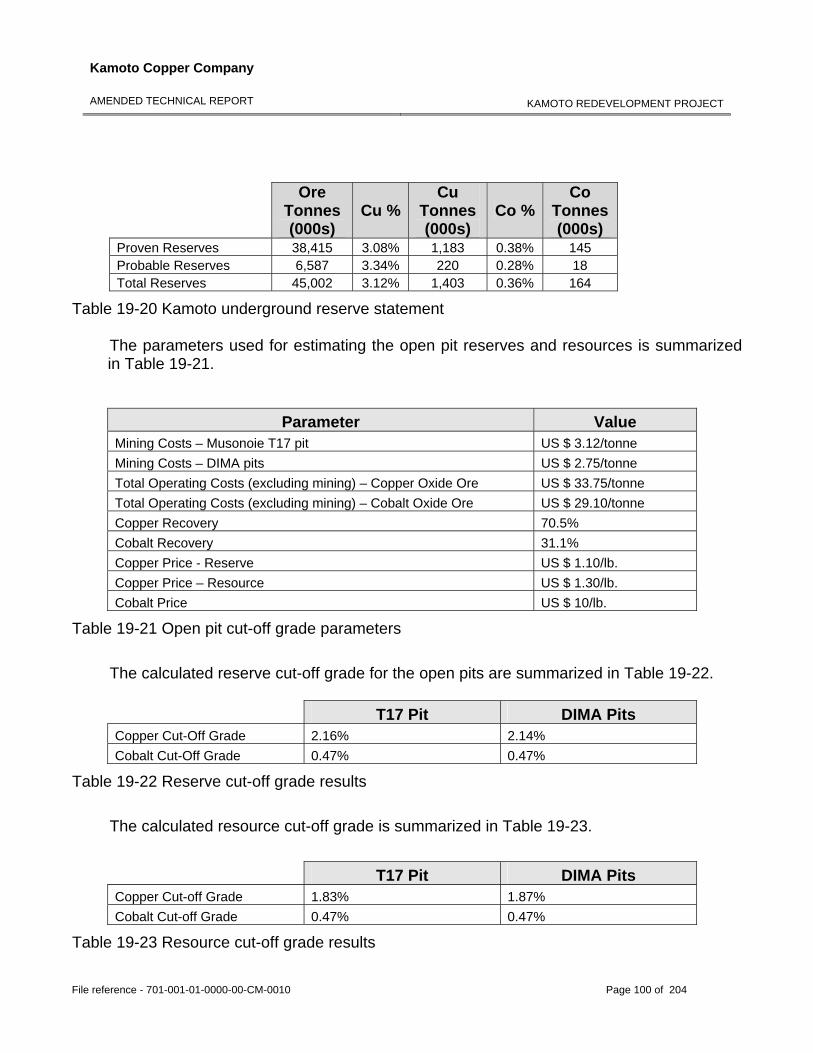
Kamoto Copper Company
AMENDED TECHNICAL REPORT
KAMOTO REDEVELOPMENT PROJECT
File reference - 701-001-01-0000-00-CM-0010 Page 100 of 204
Ore Tonnes (000s)
Cu %Cu
Tonnes (000s)
Co %Co
Tonnes (000s)
Proven Reserves 38,415 3.08% 1,183 0.38% 145 Probable Reserves 6,587 3.34% 220 0.28% 18 Total Reserves 45,002 3.12% 1,403 0.36% 164
Table 19-20 Kamoto underground reserve statement The parameters used for estimating the open pit reserves and resources is summarized in Table 19-21.
Parameter Value
Mining Costs – Musonoie T17 pit US $ 3.12/tonne Mining Costs – DIMA pits US $ 2.75/tonne Total Operating Costs (excluding mining) – Copper Oxide Ore US $ 33.75/tonne Total Operating Costs (excluding mining) – Cobalt Oxide Ore US $ 29.10/tonne Copper Recovery 70.5% Cobalt Recovery 31.1% Copper Price - Reserve US $ 1.10/lb. Copper Price – Resource US $ 1.30/lb. Cobalt Price US $ 10/lb.
Table 19-21 Open pit cut-off grade parameters
The calculated reserve cut-off grade for the open pits are summarized in Table 19-22.
T17 Pit DIMA Pits Copper Cut-Off Grade 2.16% 2.14% Cobalt Cut-Off Grade 0.47% 0.47%
Table 19-22 Reserve cut-off grade results
The calculated resource cut-off grade is summarized in Table 19-23.
T17 Pit DIMA Pits Copper Cut-off Grade 1.83% 1.87% Cobalt Cut-off Grade 0.47% 0.47%
Table 19-23 Resource cut-off grade results
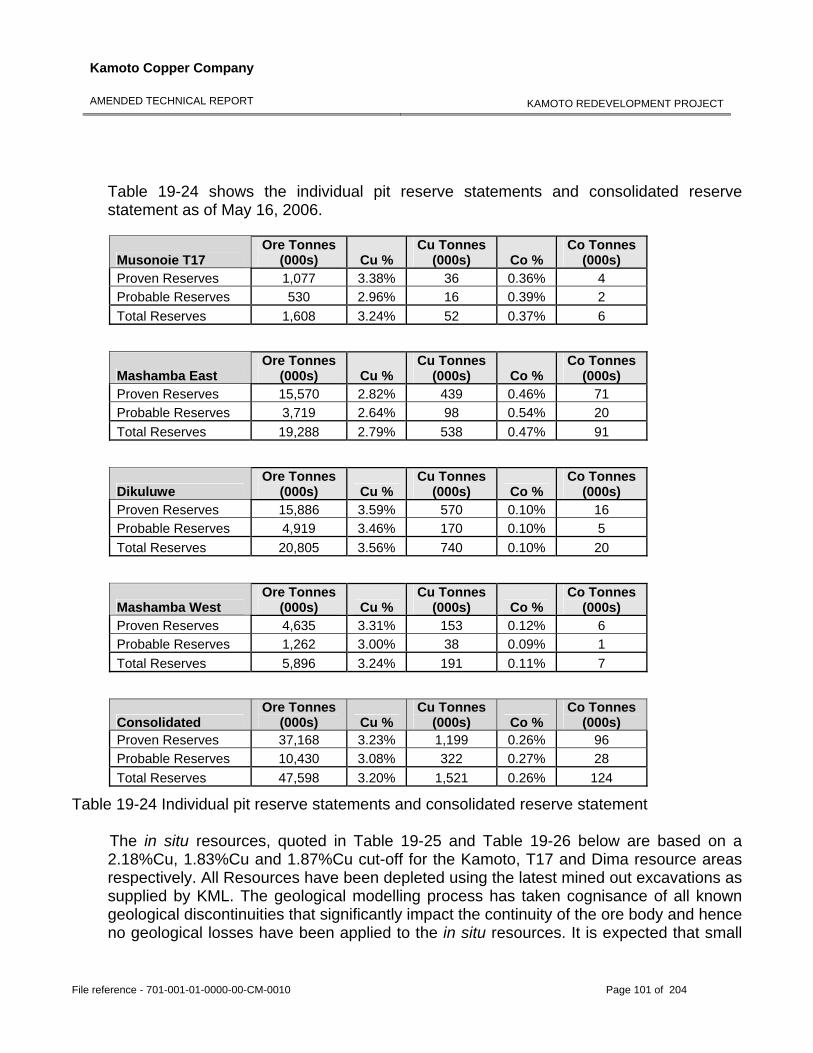
Kamoto Copper Company
AMENDED TECHNICAL REPORT
KAMOTO REDEVELOPMENT PROJECT
File reference - 701-001-01-0000-00-CM-0010 Page 101 of 204
Table 19-24 shows the individual pit reserve statements and consolidated reserve statement as of May 16, 2006.
Musonoie T17 Ore Tonnes
(000s) Cu % Cu Tonnes
(000s) Co % Co Tonnes
(000s) Proven Reserves 1,077 3.38% 36 0.36% 4 Probable Reserves 530 2.96% 16 0.39% 2 Total Reserves 1,608 3.24% 52 0.37% 6
Mashamba East Ore Tonnes
(000s) Cu % Cu Tonnes
(000s) Co % Co Tonnes
(000s) Proven Reserves 15,570 2.82% 439 0.46% 71 Probable Reserves 3,719 2.64% 98 0.54% 20 Total Reserves 19,288 2.79% 538 0.47% 91
Dikuluwe Ore Tonnes
(000s) Cu % Cu Tonnes
(000s) Co % Co Tonnes
(000s) Proven Reserves 15,886 3.59% 570 0.10% 16 Probable Reserves 4,919 3.46% 170 0.10% 5 Total Reserves 20,805 3.56% 740 0.10% 20
Mashamba West Ore Tonnes
(000s) Cu % Cu Tonnes
(000s) Co % Co Tonnes
(000s) Proven Reserves 4,635 3.31% 153 0.12% 6 Probable Reserves 1,262 3.00% 38 0.09% 1 Total Reserves 5,896 3.24% 191 0.11% 7
Consolidated Ore Tonnes
(000s) Cu % Cu Tonnes
(000s) Co % Co Tonnes
(000s) Proven Reserves 37,168 3.23% 1,199 0.26% 96 Probable Reserves 10,430 3.08% 322 0.27% 28 Total Reserves 47,598 3.20% 1,521 0.26% 124
Table 19-24 Individual pit reserve statements and consolidated reserve statement The in situ resources, quoted in Table 19-25 and Table 19-26 below are based on a 2.18%Cu, 1.83%Cu and 1.87%Cu cut-off for the Kamoto, T17 and Dima resource areas respectively. All Resources have been depleted using the latest mined out excavations as supplied by KML. The geological modelling process has taken cognisance of all known geological discontinuities that significantly impact the continuity of the ore body and hence no geological losses have been applied to the in situ resources. It is expected that small
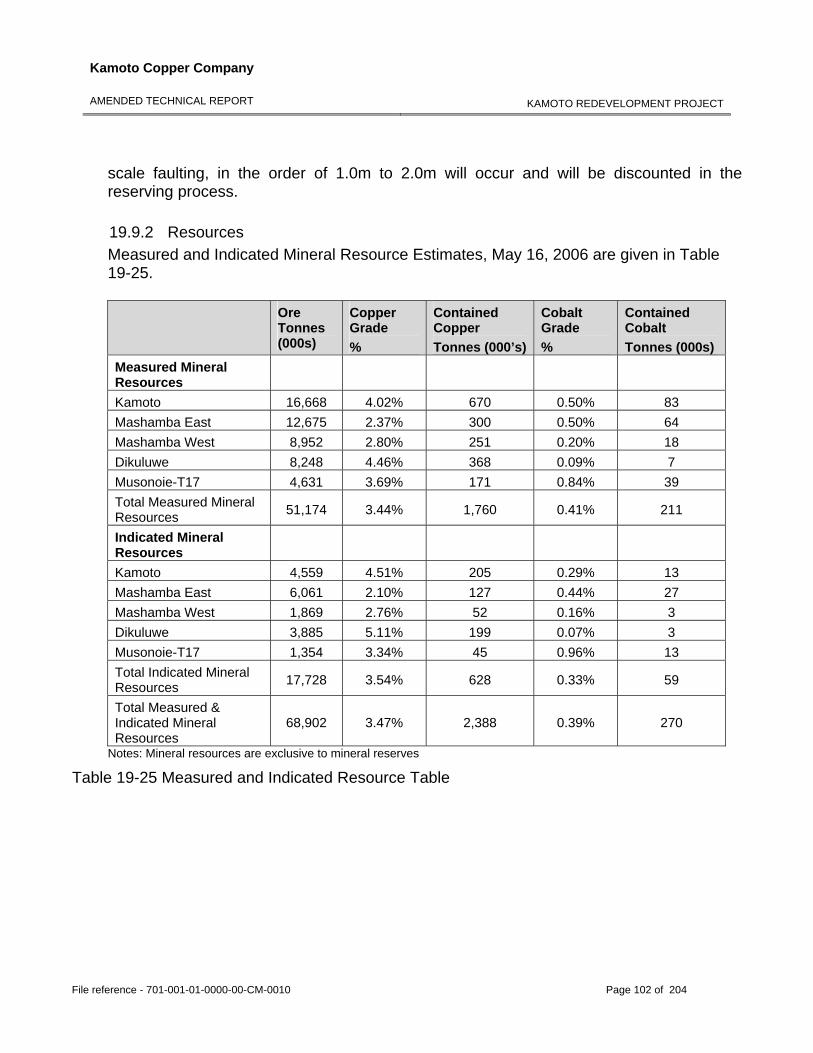
Kamoto Copper Company
AMENDED TECHNICAL REPORT
KAMOTO REDEVELOPMENT PROJECT
File reference - 701-001-01-0000-00-CM-0010 Page 102 of 204
scale faulting, in the order of 1.0m to 2.0m will occur and will be discounted in the reserving process. 19.9.2 Resources Measured and Indicated Mineral Resource Estimates, May 16, 2006 are given in Table 19-25. Ore
Tonnes (000s)
Copper Grade %
Contained Copper Tonnes (000’s)
Cobalt Grade %
Contained Cobalt Tonnes (000s)
Measured Mineral Resources
Kamoto 16,668 4.02% 670 0.50% 83 Mashamba East 12,675 2.37% 300 0.50% 64 Mashamba West 8,952 2.80% 251 0.20% 18 Dikuluwe 8,248 4.46% 368 0.09% 7 Musonoie-T17 4,631 3.69% 171 0.84% 39 Total Measured Mineral Resources 51,174 3.44% 1,760 0.41% 211
Indicated Mineral Resources
Kamoto 4,559 4.51% 205 0.29% 13 Mashamba East 6,061 2.10% 127 0.44% 27 Mashamba West 1,869 2.76% 52 0.16% 3 Dikuluwe 3,885 5.11% 199 0.07% 3 Musonoie-T17 1,354 3.34% 45 0.96% 13 Total Indicated Mineral Resources 17,728 3.54% 628 0.33% 59
Total Measured & Indicated Mineral Resources
68,902 3.47% 2,388 0.39% 270
Notes: Mineral resources are exclusive to mineral reserves
Table 19-25 Measured and Indicated Resource Table
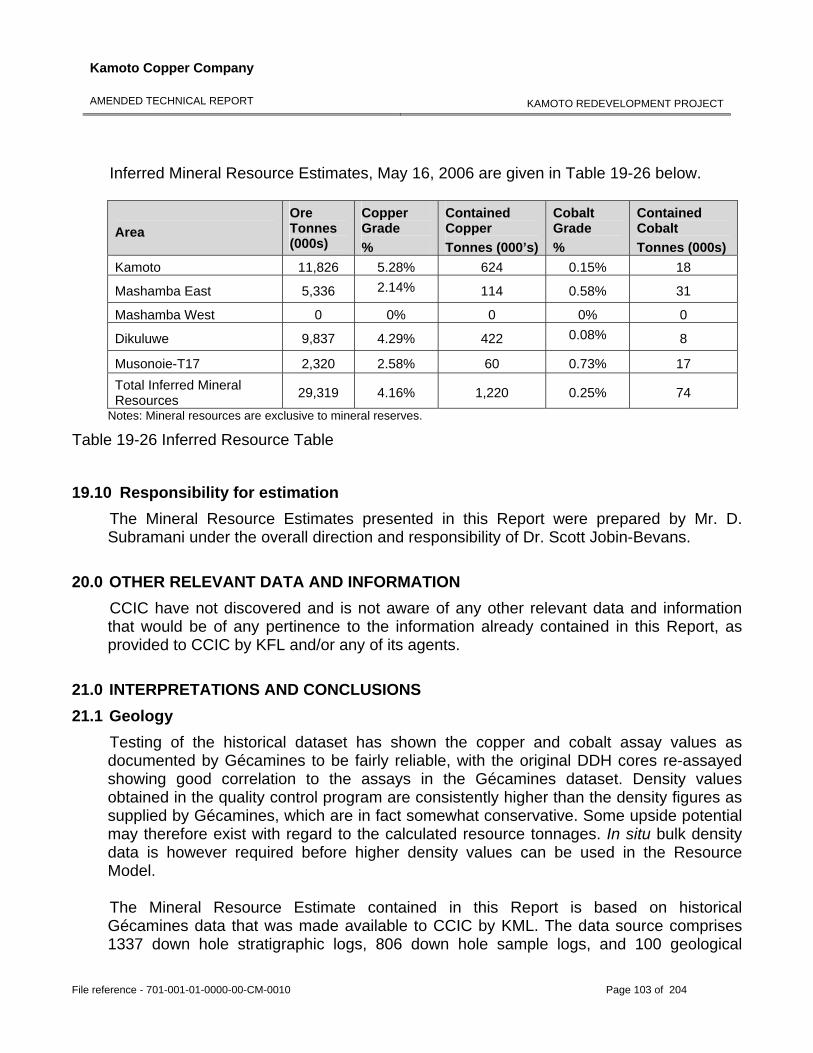
Kamoto Copper Company
AMENDED TECHNICAL REPORT
KAMOTO REDEVELOPMENT PROJECT
File reference - 701-001-01-0000-00-CM-0010 Page 103 of 204
Inferred Mineral Resource Estimates, May 16, 2006 are given in Table 19-26 below. Area
Ore Tonnes (000s)
Copper Grade %
Contained Copper Tonnes (000’s)
Cobalt Grade %
Contained Cobalt Tonnes (000s)
Kamoto 11,826 5.28% 624 0.15% 18
Mashamba East 5,336 2.14% 114 0.58% 31
Mashamba West 0 0% 0 0% 0
Dikuluwe 9,837 4.29% 422 0.08% 8
Musonoie-T17 2,320 2.58% 60 0.73% 17 Total Inferred Mineral Resources 29,319 4.16% 1,220 0.25% 74
Notes: Mineral resources are exclusive to mineral reserves.
Table 19-26 Inferred Resource Table 19.10 Responsibility for estimation
The Mineral Resource Estimates presented in this Report were prepared by Mr. D. Subramani under the overall direction and responsibility of Dr. Scott Jobin-Bevans.
20.0 OTHER RELEVANT DATA AND INFORMATION CCIC have not discovered and is not aware of any other relevant data and information that would be of any pertinence to the information already contained in this Report, as provided to CCIC by KFL and/or any of its agents.
21.0 INTERPRETATIONS AND CONCLUSIONS 21.1 Geology
Testing of the historical dataset has shown the copper and cobalt assay values as documented by Gécamines to be fairly reliable, with the original DDH cores re-assayed showing good correlation to the assays in the Gécamines dataset. Density values obtained in the quality control program are consistently higher than the density figures as supplied by Gécamines, which are in fact somewhat conservative. Some upside potential may therefore exist with regard to the calculated resource tonnages. In situ bulk density data is however required before higher density values can be used in the Resource Model. The Mineral Resource Estimate contained in this Report is based on historical Gécamines data that was made available to CCIC by KML. The data source comprises 1337 down hole stratigraphic logs, 806 down hole sample logs, and 100 geological
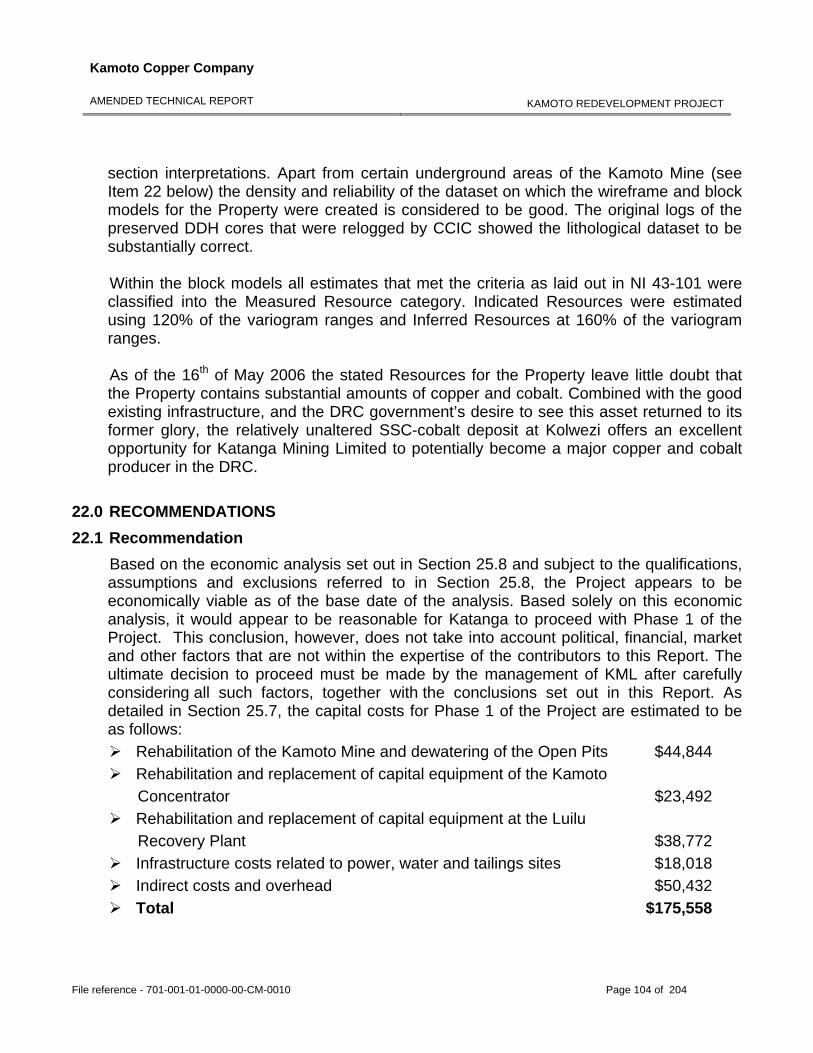
Kamoto Copper Company
AMENDED TECHNICAL REPORT
KAMOTO REDEVELOPMENT PROJECT
File reference - 701-001-01-0000-00-CM-0010 Page 104 of 204
section interpretations. Apart from certain underground areas of the Kamoto Mine (see Item 22 below) the density and reliability of the dataset on which the wireframe and block models for the Property were created is considered to be good. The original logs of the preserved DDH cores that were relogged by CCIC showed the lithological dataset to be substantially correct. Within the block models all estimates that met the criteria as laid out in NI 43-101 were classified into the Measured Resource category. Indicated Resources were estimated using 120% of the variogram ranges and Inferred Resources at 160% of the variogram ranges. As of the 16th of May 2006 the stated Resources for the Property leave little doubt that the Property contains substantial amounts of copper and cobalt. Combined with the good existing infrastructure, and the DRC government’s desire to see this asset returned to its former glory, the relatively unaltered SSC-cobalt deposit at Kolwezi offers an excellent opportunity for Katanga Mining Limited to potentially become a major copper and cobalt producer in the DRC.
22.0 RECOMMENDATIONS 22.1 Recommendation
Based on the economic analysis set out in Section 25.8 and subject to the qualifications, assumptions and exclusions referred to in Section 25.8, the Project appears to be economically viable as of the base date of the analysis. Based solely on this economic analysis, it would appear to be reasonable for Katanga to proceed with Phase 1 of the Project. This conclusion, however, does not take into account political, financial, market and other factors that are not within the expertise of the contributors to this Report. The ultimate decision to proceed must be made by the management of KML after carefully considering all such factors, together with the conclusions set out in this Report. As detailed in Section 25.7, the capital costs for Phase 1 of the Project are estimated to be as follows:
Rehabilitation of the Kamoto Mine and dewatering of the Open Pits $44,844 Rehabilitation and replacement of capital equipment of the Kamoto
Concentrator $23,492 Rehabilitation and replacement of capital equipment at the Luilu
Recovery Plant $38,772 Infrastructure costs related to power, water and tailings sites $18,018 Indirect costs and overhead $50,432 Total $175,558
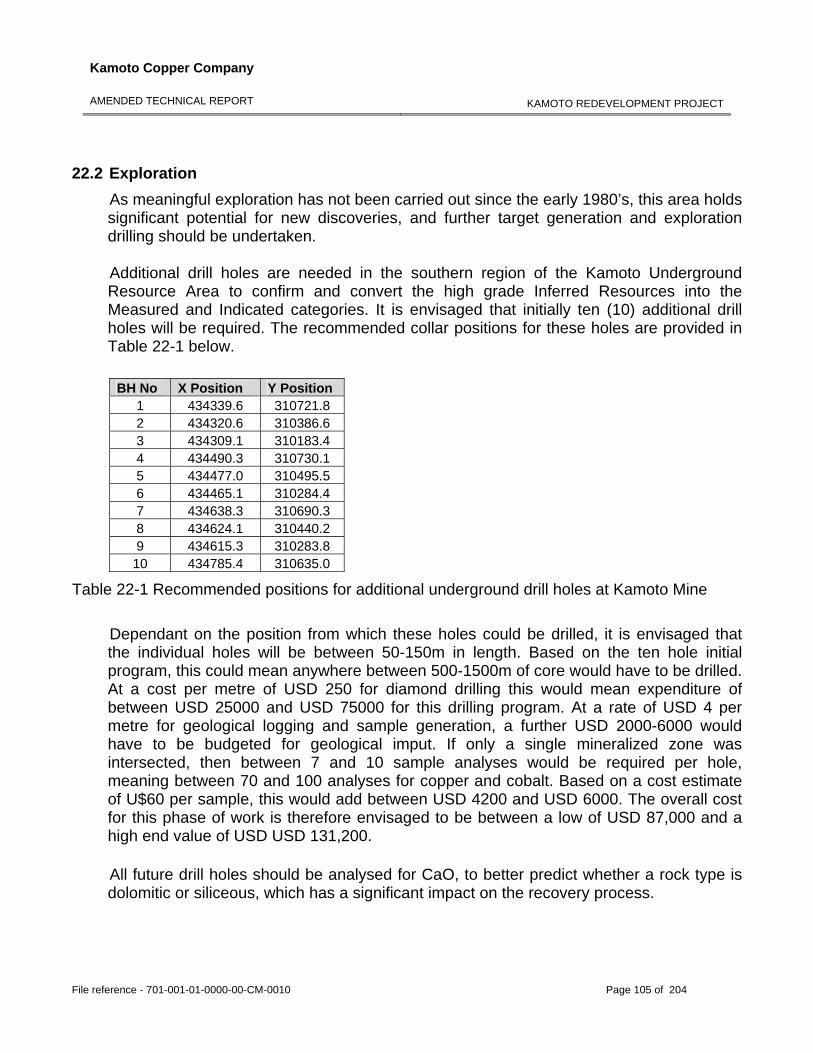
Kamoto Copper Company
AMENDED TECHNICAL REPORT
KAMOTO REDEVELOPMENT PROJECT
File reference - 701-001-01-0000-00-CM-0010 Page 105 of 204
22.2 Exploration As meaningful exploration has not been carried out since the early 1980’s, this area holds significant potential for new discoveries, and further target generation and exploration drilling should be undertaken. Additional drill holes are needed in the southern region of the Kamoto Underground Resource Area to confirm and convert the high grade Inferred Resources into the Measured and Indicated categories. It is envisaged that initially ten (10) additional drill holes will be required. The recommended collar positions for these holes are provided in Table 22-1 below.
BH No X Position Y Position 1 434339.6 310721.8 2 434320.6 310386.6 3 434309.1 310183.4 4 434490.3 310730.1 5 434477.0 310495.5 6 434465.1 310284.4 7 434638.3 310690.3 8 434624.1 310440.2 9 434615.3 310283.8
10 434785.4 310635.0
Table 22-1 Recommended positions for additional underground drill holes at Kamoto Mine Dependant on the position from which these holes could be drilled, it is envisaged that the individual holes will be between 50-150m in length. Based on the ten hole initial program, this could mean anywhere between 500-1500m of core would have to be drilled. At a cost per metre of USD 250 for diamond drilling this would mean expenditure of between USD 25000 and USD 75000 for this drilling program. At a rate of USD 4 per metre for geological logging and sample generation, a further USD 2000-6000 would have to be budgeted for geological imput. If only a single mineralized zone was intersected, then between 7 and 10 sample analyses would be required per hole, meaning between 70 and 100 analyses for copper and cobalt. Based on a cost estimate of U$60 per sample, this would add between USD 4200 and USD 6000. The overall cost for this phase of work is therefore envisaged to be between a low of USD 87,000 and a high end value of USD USD 131,200.
All future drill holes should be analysed for CaO, to better predict whether a rock type is dolomitic or siliceous, which has a significant impact on the recovery process.
Kamoto Copper Company
AMENDED TECHNICAL REPORT
KAMOTO REDEVELOPMENT PROJECT
File reference - 701-001-01-0000-00-CM-0010 Page 106 of 204
It is apparent from the densities obtained during the QA/QC programme that the density figures as supplied by Gécamines are in fact somewhat conservative, and that there may be some upside potential with regard to the calculated resource tonnages. In situ bulk density data is however required before higher density values can be used in the resource model. There is therefore a need to compile a bulk density database in order to confirm the in situ densities of different rock and ore types on the Property. There is also a need for detailed structural mapping of the DIMA-pits and Kamoto Mine underground faces, to enhance the very limited structural database. This is particularly relevant to the near mine ready faces in the underground areas of the Kamoto Mine. Future Resource evaluation exercises should incorporate a conditional simulation study, to access and quantify expected fluctuations in copper and cobalt grades. This risk assessment exercise should then be incorporated in the Resource classification. Future Resource evaluation exercises should also consider modelling the entire DIMA Resource area as a single entity, and then apply “unfolding” to improve the variogram analysis and grade interpolation.
23.0 REFERENCES Annels, A.E. 1979. The genetic relevance of recent studies at Mufulira Mine, Zambia. Annales de la Société Géologique de Belgique 102, 431-449. Armstrong, R.A. Master, S. and Robb, L.J. 2005. Geochronology of the Nchanga Granite, and constraints on the maximum age of the Katanga Supergroup, Zambian Copperbelt. Journal of African Earth Sciences 42 (2005) 32–40. Bartholomé, P. 1962. Les minerais cupro-cobaltiféres de Kamoto (Katanga-Ouest), I. Pétrographie—II. Paragenèses. Studia Universitatis ‘‘Lovanium’’. Unpublished thesis, Faculté des Sciences, University of Kinshasa, vol. 14, 40 p. and vol. 16, 24 p. Bartholomé, P. 1969. Kamoto (Katanga) et White Pine (Michigan): deux gisements stratiformes de cuivre. Académie Royale des Sciences d_Outre-Mer, Bulletin des Séances, pp. 397–410. Bartholomé, P. 1974. On the diagenetic formation of ores in sedimentary beds, with special reference to Kamoto, Shaba, Zaïre. In: Bartholomé, P. (Ed.). Gisements stratiformes et provinces cupriféres. Centenaire de la Société Géologique de Belgique, Liège, pp. 203–213.
Bartholomé, P., Katekesha, F., Lopez-Ruiz, J., 1971. Cobalt zoning in microscopic pyrite from Kamoto, Republic of the Congo. Mineralium Deposita 6, 167–176.
Kamoto Copper Company
AMENDED TECHNICAL REPORT
KAMOTO REDEVELOPMENT PROJECT
File reference - 701-001-01-0000-00-CM-0010 Page 107 of 204
Bartholome´, P., Evrard, P., Katekesha, F., Lopez-Ruiz, J., Ngongo,M., 1972. Diagenetic ore-forming processes at Kamoto, Katanga,Republic of the Congo. In: Amstutz, G.C., Bernard, A.J. (Eds.). Ores in Sediments. Springer-Verlag, Heidelberg, pp. 21–41. Bartholomé, P., Evrard, P., Katekesha, F., Lopez-Ruiz, J. and Ngongo, M. 1973. Diagenetic ore-forming processes at Kamoto, Katanga, Republic of the Congo. International Union of Geological Sciences Series A, 3, 21-41. Boyle, R.W., Brown, A.C., Jefferson, C.W., Jowett, E.C. and Kirkham, R.V. (Eds). 1989. Sediment-hosted stratiform copper deposits. Geological Association of Canada Special Paper 36, 710p. Cahen, L. 1954. Géologie des resources minerals exploitées. In: Géologie du Congo Belge. Imprimerie H.Vaillant-Carmanne, S.A., Liege, 493-528. English translation by M.Tuchscherer of CCIC. Cahen, L., Shelling, N.J., Delhal, J., Vail, J.R., Bonhomme, M. and Ledent, D., 1984. Geochronology and Evolution of Africa. Clarendon, Oxford, 512p. Cailteux, J.L.H. 1994. Lithostratigraphy of the Neopproterozoic Shaba-type (Zaire) Roan Supergroup and metallogenesis of associated stratiform mineralization. In: Kampunza A.B. & Lubala,R.T. (Eds.), Neoproterozoic belts of Zambia, Zaire and Namibia. Journal of African Earth Sciences 19(4), 279-301. Cailteux, J.L.H. 2003. Proterozoic sedimentary-hosted base-metal deposits of Western Gondwana. Conference and field workshop, Lubumbashi, p. 223. Cailteux J.L.H., Kampunzu, A.B.H. and Batumike, M.J. 2005a. Lithostratigraphic position and petrographic characteristics of RAT (‘‘Roches Argilo-Talqueuses’’) Subgroup, Neoproterozoic Katangan Belt (Congo). Journal of African Earth Sciences 42, 82–94. Cailteux, J.L.H., A.B. Kampunzu, A.B., Lerouge, C., Kaputo, A.K. and Milesi, J.P. 2005b. Genesis of sediment-hosted stratiform copper–cobalt deposits, central African Copperbelt. Journal of African Earth Sciences 42, 134-158. CIM, 2000. Canadian Institute of Mining, Metallurgy and Petroleum Standards on Mineral Resources and Mineral Reserves Definition Guidelines. Cox, D.P., Lindsey, D.A., Singer, D.A. and Diggles, M.F. 2003. Sediment-hosted copper deposits of the world: Deposit models and database. U.S. Geological Survey Open-File Report 03-107, 50p.
Kamoto Copper Company
AMENDED TECHNICAL REPORT
KAMOTO REDEVELOPMENT PROJECT
File reference - 701-001-01-0000-00-CM-0010 Page 108 of 204
François, A. 1973. L_extrémité occidentale de l_Arc cuprifére shabien. Etude Géologique, Gécamines, Likasi (Shaba-Zaïre), p. 120. François, A., 1974. Stratigraphie, tectonique et mine´ralisations dans l’Arc cuprife`re du Shaba (Rép.du Zaïre). In: Bartholomé, P. (Ed) Gisements stratiformes et provinces cupriféres. Centenaire de la Société Géologique de Belgique, Liége, pp. 79–101. Gustafson, L.B. and Williams, N. 1981. Sediment-hosted stratiform deposits of copper, lead and zinc. Economic Geology 75th Aniversary Volume, 139-178. Hatch project report PRH-314198.001 September 2003. Hanson, R.E. 2003. Proterozoic geochronology and tectonic evolution of southern Africa. Geological Society of London Special Publication 3, 273-290. Haynes, D.W., 1986. Stratiform copper deposits hosted by low-energy sediments. II. Nature of source rocks and composition of metal transporting water. Economic Geology 81, 226–280. Hitzman, M. 2000. Source basins for sediment-hosted stratiform copper deposits – implications for the structure of the Zambian Copperbelt. Journal of African Earth Sciences 30, 855-863. Hitzman, M., Kirkham, R., Broughton, D., Thorson, J. and Selley, D. 2005. The Sediment-Hosted Stratiform Copper Ore System. Economic Geology 100th Aniversary Volume, 609-642. Hoy, L.D. 1989. Geochemical investigations of the redbed-associated stratiform copper mineralization at Kamoto Principal (Central African Copperbelt), Zaire. Unpublished Ph.D. thesis, University Park, Pennsylvania State University, 226p. Jackson M.P.A., Warin, O.N. Woad, G.M. and Hudec, M.R. 2003. Neoproterozoic allochthonous salt tectonics during the Lufilian orogeny in the Katangan Copperbelt, central Africa. GSA Bulletin 115 (3), 314–330. Jowett, E.C. 1991. The evolution of ideas about the genesis of stratiform copper-silver deposits. Economic Geology Monograph 8, 117-132. Kamoto Copper Company Feasibility Study, May 2006. Kampunzu, A.B. and Cailteux, J. 1999. Tectonic evolution of the Lufilian Arc (Central Africa Copperbelt) during the Neoproterozoic Pan African orogenesis. Gondwana Research 2, 401–421.
Kamoto Copper Company
AMENDED TECHNICAL REPORT
KAMOTO REDEVELOPMENT PROJECT
File reference - 701-001-01-0000-00-CM-0010 Page 109 of 204
Kampunza, A.B., Cailteux, J.L.H., Moine, B. and Loris, H.N.B.T. 2005. Geochemical characterisation, provenance, source and depositional environment of ‘Roches Argilo-Talqueuses’ (RAT) and Mines Subgroups sedimentary rocks in the Neoproterozoic Katangan Belt (Congo): Lithostratigraphic implications. Journal of African Earth Sciences 42, 119–133. Katekesha, W.M. 1989. Musonoi T.17 Ouest estimation au-dessus du niveau 1300. Internal Gecamines Report E.297), December 1989, 1-9. English translation by M.Tuchscherer of CCIC. Kirkham, R.V. 1989. Distribution, settings and genesis of sediment-hosted stratiform copper deposits. Geological Association of Canada Special Paper 36, 3-38. Kirkham, R.V. 2001. Sediment-hosted stratiform copper (SSC), other stratabound base metal deposits and the importance of basinal brines and/or evaporites, halotectonics and halokinesis. In: Piestrzynski, A. (Ed). Mineral deposits at the beginning of the 21st century. Lisse, Swets and Zeitlinger, 15-18. Kirkham, R.V., Carriere, J.J., Laramee, R.M. and Garson, D.F. 1994. Global distribution of sediment-hosted stratiform copper deposits and occurrences. Geological Survey of Canada Open File 2915b, 256p. Kvapil, R. and Hustrulid, H. 1988. DIMA underground concept study 4.4 program 1987/1988. Gecamines Technical Report No.73, May 1988, 1-24. Master, S. 1998. New developments in understanding the origin of the Central African Copperbelt. Abstract, Mineral Deposits Studies Group Meeting, University of Greenwich, 5-6 January 1998. Mendelshon, F. (Ed) 1961. The geology of the northern Rhodesia Copperbelt. MacDonald, London, 523p. Mosier, D.L., Singer, D.A. and Cox, D.P. 1986. Grade and tonnage model of sediment-hosted copper. In: Cox, D.P. and Singer, D.A. (Eds). Mineral deposit models. U.S.Geological Survey Bulletin 1693, 205-208. Oosterbosch, R., 1962. Les minéralisations dans le système de Roan au Katanga. In: Lombard, J., Nicolini, P. (Eds.). Gisements stratiformes de cuivre en Afrique. Copenhagen, 1960. Association des Services Géologiques de l_Afrique, Paris, pp. 71–136.
Kamoto Copper Company
AMENDED TECHNICAL REPORT
KAMOTO REDEVELOPMENT PROJECT
File reference - 701-001-01-0000-00-CM-0010 Page 110 of 204
Porada, H. and Berhorst, V. 2000. Towards a new understanding of the Neoproterozoic-Early Palaeozoic Lufilian and northern Zambezi Belts in Zambia and the Democratic Republic of Congo. Journal of African Earth Sciences 30(3), 727-771. Rainaud, C., Master, S., Armstrong, R.A. and Robb, L.J. 2005. Geochronology and nature of the Palaeoproterozoic basement in the Central African Copperbelt (Zambia and the Democratic Republic of Congo), with regional implications. Journal of African Earth Sciences 42, 1–31. Robb, L. 2005a. Copper bottomed. Understanding the Central African Copperbelt. Materials World, June 2005, 24-26. Robb, L. 2005b. Introduction of Ore Forming Processes. Blackwell Publishing, 198-202. Selley, D., Broughton, D., Scott, R., Hitzman, M., Bull, S., Large, R., McGoldrick, P., Croaker, M., Pollington, N. and Barra, F. 2005. A New look at the geology of the Zambian copperbelt. Economic Geology 100th Anniversary Volume, 965-1000. Singer, D.A. 1995. World-class base and precious metal deposits: A quantitative analysis. Economic Geology 90, 88-104. Unrug, R. 1997, Rodinia to Gondwana: The geodynamic map of Gondwana supercontinent assembly. GSA Today 7, 2–6. Wendorff, M. 2005a. Sedimentary genesis and lithostratigraphy of Neoproterozoic megabreccia from Mufulira, Copperbelt of Zambia. Journal of African Earth Sciences 42, 61–81. Wendorff, M. 2005b. Evolution of Neoproterozoic-Lower Palaeozoic Lufilian arc, Central Africa: a new model based on syntectonic conglomerates. Journal of the Geological Society, London 162, 5-8.
24.0 DATE AND SIGNATURE PAGE Certificates with signatures for qualified persons are attached to the end of this report.
Kamoto Copper Company
AMENDED TECHNICAL REPORT
KAMOTO REDEVELOPMENT PROJECT
File reference - 701-001-01-0000-00-CM-0010 Page 111 of 204
25.0 REQUIREMENTS FOR TECHNICAL REPORTS ON DEVELOPMENT AND PRODUCTION PROPERTIES
25.1 Underground mining operations 25.1.1 Introduction The underground mining operations at the Kamoto Mine started in 1969 utilising a variety of massive mining techniques, such as room and pillar mining (with secondary benching), sub-level stoping (caving) and cut and fill mining. The Kamoto underground mine was a successful and profitable operating unit previously, which was largely due to a well-designed and constructed infrastructure, including vertical and decline shafts, underground truck ore tipping and crushing facilities, as well as other surface and underground facilities such as fully equipped workshops. The entire infrastructure is capable of returning the mine to a production rate of 280ktpm, with relatively minor refurbishment costs. 25.1.2 Historical and proposed methods 25.1.2.1 Ore body geometry In general, the Kamoto underground mine exploits the ore body from below 175m from surface, which is the area below the original Kamoto open pit mine. The ore body constitutes two mineralised layers each 12m to 15m in thickness (OBS and OBI respectively), which is separated by a waste parting (RSC) of between 15m and 25m in thickness. (Any reference made to levels indicate the depth below surface e.g. level 175 has a depth of 175m below surface) The southern and western edges of the ore body, from level 175 to 415, has a varying inclination of between 25 and 40 degrees above horizontal, and in the eastern edge the ore body turns nearly vertical. Beyond 415 level, the ore body inclination between current resource edges, becomes flat dipping to nearly horizontal. For the purposes of the mine design, the ore body is dived into three categories: Flat dipping areas : 0 – 12 degrees above horizontal Steeply dipping areas : 13 – 45 degrees above horizontal Near vertical or vertical areas : 46 -90 degrees above horizontal Figure 25-1 shows a three dimensional image of the entire ore body, looking from the south towards the north. Figure 25-2 shows a plan view of the ore body, divided into zones 1 – 9, Etang and Etang North, as well as division 5 (Mining areas determined by the previous management of Kamoto underground mine).
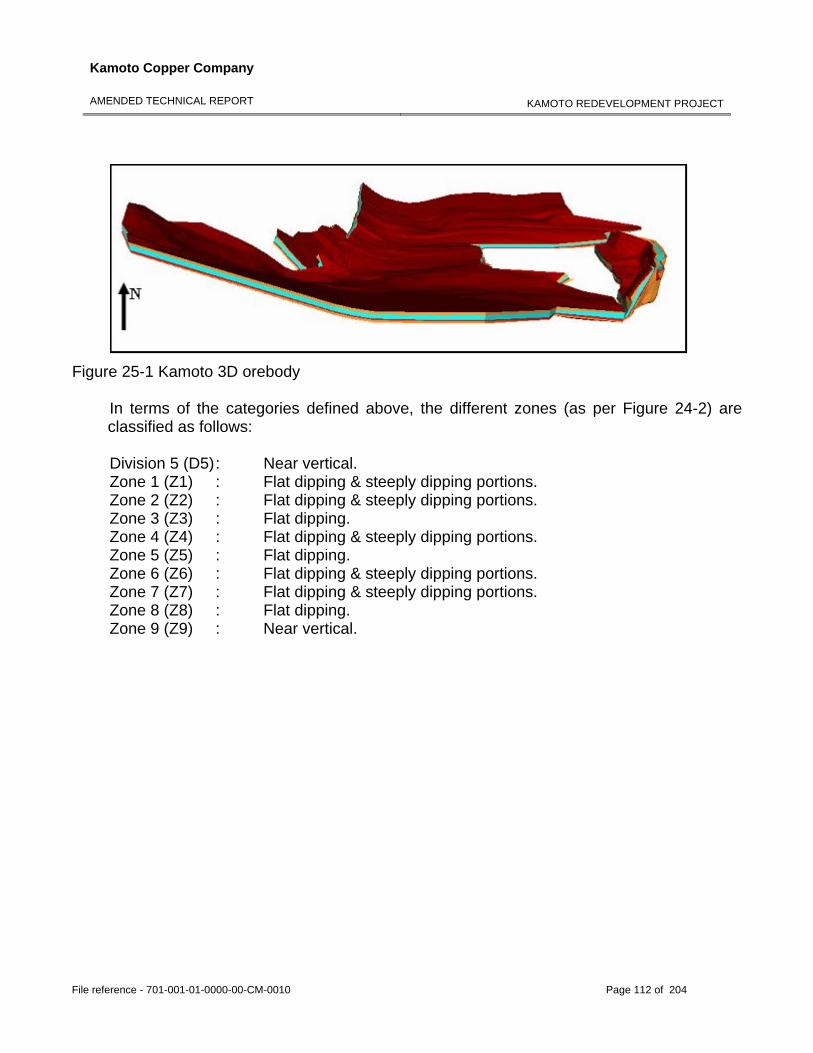
Kamoto Copper Company
AMENDED TECHNICAL REPORT
KAMOTO REDEVELOPMENT PROJECT
File reference - 701-001-01-0000-00-CM-0010 Page 112 of 204
Figure 25-1 Kamoto 3D orebody
In terms of the categories defined above, the different zones (as per Figure 24-2) are classified as follows: Division 5 (D5) : Near vertical. Zone 1 (Z1) : Flat dipping & steeply dipping portions. Zone 2 (Z2) : Flat dipping & steeply dipping portions. Zone 3 (Z3) : Flat dipping. Zone 4 (Z4) : Flat dipping & steeply dipping portions. Zone 5 (Z5) : Flat dipping. Zone 6 (Z6) : Flat dipping & steeply dipping portions. Zone 7 (Z7) : Flat dipping & steeply dipping portions. Zone 8 (Z8) : Flat dipping. Zone 9 (Z9) : Near vertical.
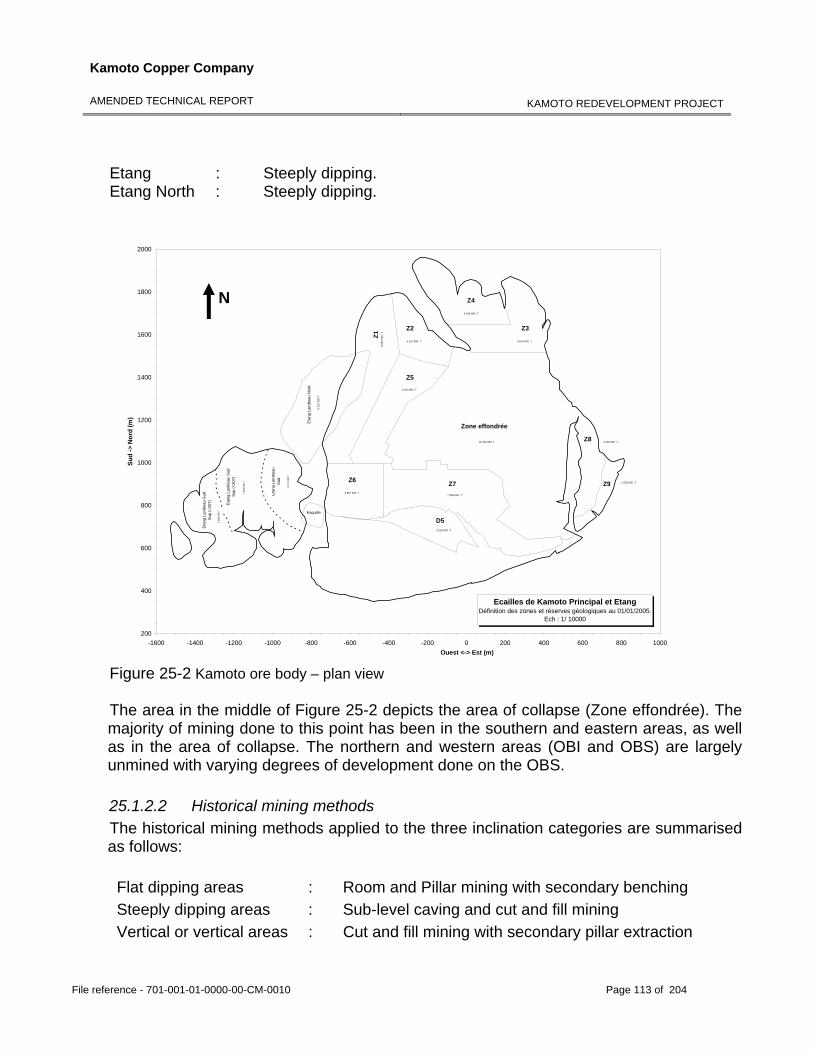
Kamoto Copper Company
AMENDED TECHNICAL REPORT
KAMOTO REDEVELOPMENT PROJECT
File reference - 701-001-01-0000-00-CM-0010 Page 113 of 204
Etang : Steeply dipping. Etang North : Steeply dipping.
Ecailles de Kamoto Principal et EtangDéfinition des zones et réserves géologiques au 01/01/2005.
Ech : 1/ 10000
200
400
600
800
1000
1200
1400
1600
1800
2000
-1600 -1400 -1200 -1000 -800 -600 -400 -200 0 200 400 600 800 1000Ouest <-> Est (m)
Sud
-> N
ord
(m)
Zone effondrée
Z1
Z2 Z3
Z4
Z5
Z6 Z7
Z8
Z9
D5
8 05
2 00
0 T
3 157 000 T
4 014 000 T
4 076 000 T
15 330 000 T
6 014 000 T
3 897 000 T
1 535 000 T
1 003 000 T
7 535 000 T
3 219 000 T
Etan
g La
mbe
au N
ord
9 22
2 00
0 T
4 17
2 00
0 T
Eta
ng L
ambe
au S
udSu
p (>
207)
Eta
ng L
ambe
au
Sud
1 98
3 00
0 T
Eta
ng L
ambe
au S
udS
up (<
207)
7 45
9 00
0 T
Esquille
Figure 25-2 Kamoto ore body – plan view The area in the middle of Figure 25-2 depicts the area of collapse (Zone effondrée). The majority of mining done to this point has been in the southern and eastern areas, as well as in the area of collapse. The northern and western areas (OBI and OBS) are largely unmined with varying degrees of development done on the OBS. 25.1.2.2 Historical mining methods The historical mining methods applied to the three inclination categories are summarised as follows: Flat dipping areas : Room and Pillar mining with secondary benching Steeply dipping areas : Sub-level caving and cut and fill mining Vertical or vertical areas : Cut and fill mining with secondary pillar extraction
N
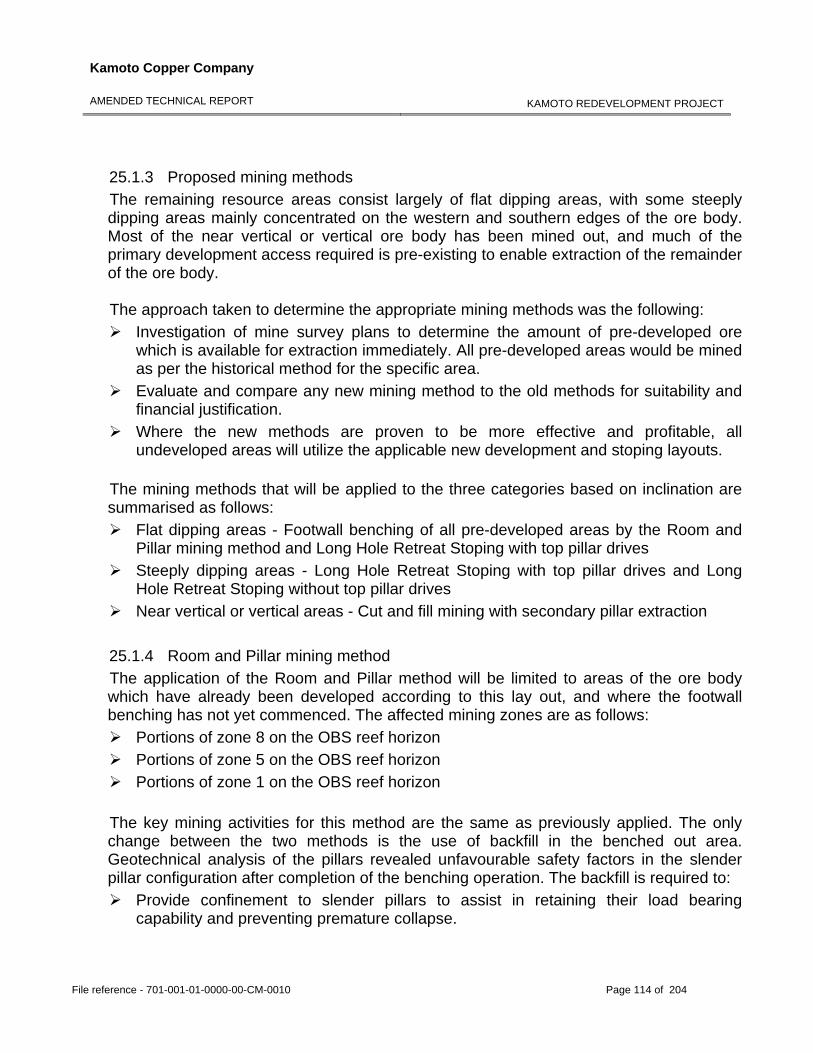
Kamoto Copper Company
AMENDED TECHNICAL REPORT
KAMOTO REDEVELOPMENT PROJECT
File reference - 701-001-01-0000-00-CM-0010 Page 114 of 204
25.1.3 Proposed mining methods The remaining resource areas consist largely of flat dipping areas, with some steeply dipping areas mainly concentrated on the western and southern edges of the ore body. Most of the near vertical or vertical ore body has been mined out, and much of the primary development access required is pre-existing to enable extraction of the remainder of the ore body. The approach taken to determine the appropriate mining methods was the following:
Investigation of mine survey plans to determine the amount of pre-developed ore which is available for extraction immediately. All pre-developed areas would be mined as per the historical method for the specific area.
Evaluate and compare any new mining method to the old methods for suitability and financial justification.
Where the new methods are proven to be more effective and profitable, all undeveloped areas will utilize the applicable new development and stoping layouts.
The mining methods that will be applied to the three categories based on inclination are summarised as follows:
Flat dipping areas - Footwall benching of all pre-developed areas by the Room and Pillar mining method and Long Hole Retreat Stoping with top pillar drives
Steeply dipping areas - Long Hole Retreat Stoping with top pillar drives and Long Hole Retreat Stoping without top pillar drives
Near vertical or vertical areas - Cut and fill mining with secondary pillar extraction 25.1.4 Room and Pillar mining method The application of the Room and Pillar method will be limited to areas of the ore body which have already been developed according to this lay out, and where the footwall benching has not yet commenced. The affected mining zones are as follows:
Portions of zone 8 on the OBS reef horizon Portions of zone 5 on the OBS reef horizon Portions of zone 1 on the OBS reef horizon
The key mining activities for this method are the same as previously applied. The only change between the two methods is the use of backfill in the benched out area. Geotechnical analysis of the pillars revealed unfavourable safety factors in the slender pillar configuration after completion of the benching operation. The backfill is required to:
Provide confinement to slender pillars to assist in retaining their load bearing capability and preventing premature collapse.
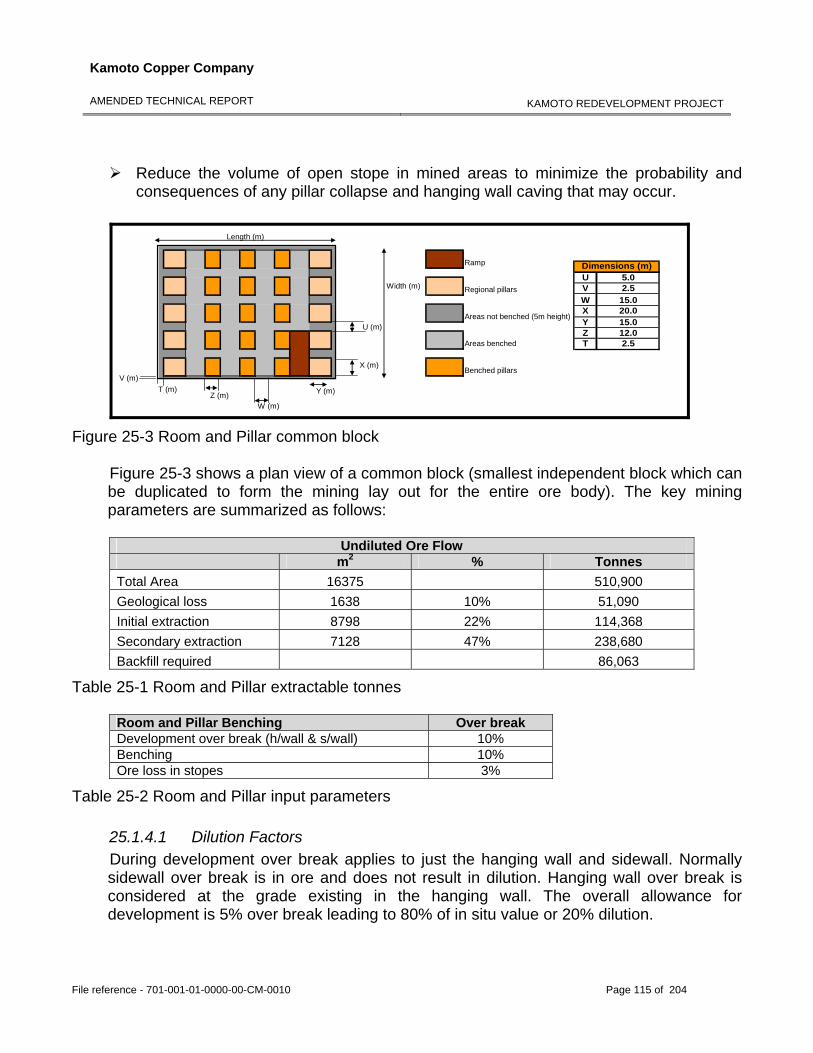
Kamoto Copper Company
AMENDED TECHNICAL REPORT
KAMOTO REDEVELOPMENT PROJECT
File reference - 701-001-01-0000-00-CM-0010 Page 115 of 204
Reduce the volume of open stope in mined areas to minimize the probability and consequences of any pillar collapse and hanging wall caving that may occur.
Ramp
Regional pillars
Areas not benched (5m height)
Areas benched
Benched pillarsX (m)
Y (m)Z (m)
U (m)
W (m)
V (m)
Length (m)
Width (m)
T (m)
U 5.0V 2.5W 15.0X 20.0Y 15.0Z 12.0T 2.5
Dimensions (m)
Figure 25-3 Room and Pillar common block
Figure 25-3 shows a plan view of a common block (smallest independent block which can be duplicated to form the mining lay out for the entire ore body). The key mining parameters are summarized as follows:
Undiluted Ore Flow
m2 % Tonnes Total Area 16375 510,900 Geological loss 1638 10% 51,090 Initial extraction 8798 22% 114,368 Secondary extraction 7128 47% 238,680 Backfill required 86,063
Table 25-1 Room and Pillar extractable tonnes Room and Pillar Benching Over break Development over break (h/wall & s/wall) 10% Benching 10% Ore loss in stopes 3%
Table 25-2 Room and Pillar input parameters 25.1.4.1 Dilution Factors During development over break applies to just the hanging wall and sidewall. Normally sidewall over break is in ore and does not result in dilution. Hanging wall over break is considered at the grade existing in the hanging wall. The overall allowance for development is 5% over break leading to 80% of in situ value or 20% dilution.
Kamoto Copper Company
AMENDED TECHNICAL REPORT
KAMOTO REDEVELOPMENT PROJECT
File reference - 701-001-01-0000-00-CM-0010 Page 116 of 204
Benching over break is taken at 5% being hanging wall dilution on widening and some footwall dilution at footwall contact. Benching over break is taken at 5%. This leads to an overall 95% of in situ value or 5% dilution. 25.1.4.2 Operations Initial development: All initial development is situated inside the mineralised ore zones. End sizes varied between 6 x 5m and 5 x 5m. Planning and lay-out of drive positions and direction is of critical importance to ensure superimposed pillars on both reef horizons for geotechnical stability. Support: The support used in the drives consisted of primary support (initial development) and secondary support (installed prior to widening of the drives). The primary support consisted of 2.4m grouted roof bolts, spaced on a 1 x 1m diamond pattern. The secondary support consisted of 4m grouted roof bolts, spaced on a 1 x 1m diamond pattern, which was superimposed on the primary support pattern to result in an extremely dense support regime. The roof bolts were installed primarily with electro-hydraulic roof bolters. Face drilling: The face drilling (Short hole drilling) was carried out mainly by electro hydraulic twin boom drill rigs. The hole burden and spacing was 75cm. The explosives used consisted mainly of Anfo and cartridge explosives used as a primer coupled with a non-electric initiation system. Benching operation: The mining method used for benching is based on the same method and equipment as is used for the development face drilling. Face Cleaning: Face cleaning was done utilizing a combination of Front End Loaders (FEL) and Load Haul Dumpers (LHD). The ore was loaded directly onto articulated dump trucks, which transported it to one of the two crushers, after which it was crushed and belted to the vertical rock winder shaft and hoisted to surface. Backfill: Waste rock generated by decline development will be loaded and transported to worked out benched stopes. 25.1.5 Long Hole Retreat Stoping with top pillar drives The Long Hole Retreat Stoping method (LHRS) is the preferred mining method for the remainder of the Kamoto ore body. The mining method is easily adaptable to either flat, steeply dipping or near vertical inclinations of the ore body, and is gaining popularity among other mines in the Copper belt region. The main advantages of the method are:
High ratio long hole drilled metres compared to more costly short hole drilled metres, to extract a given tonnage profile per month.
Increased utilization of ore body through improved total extraction rate.
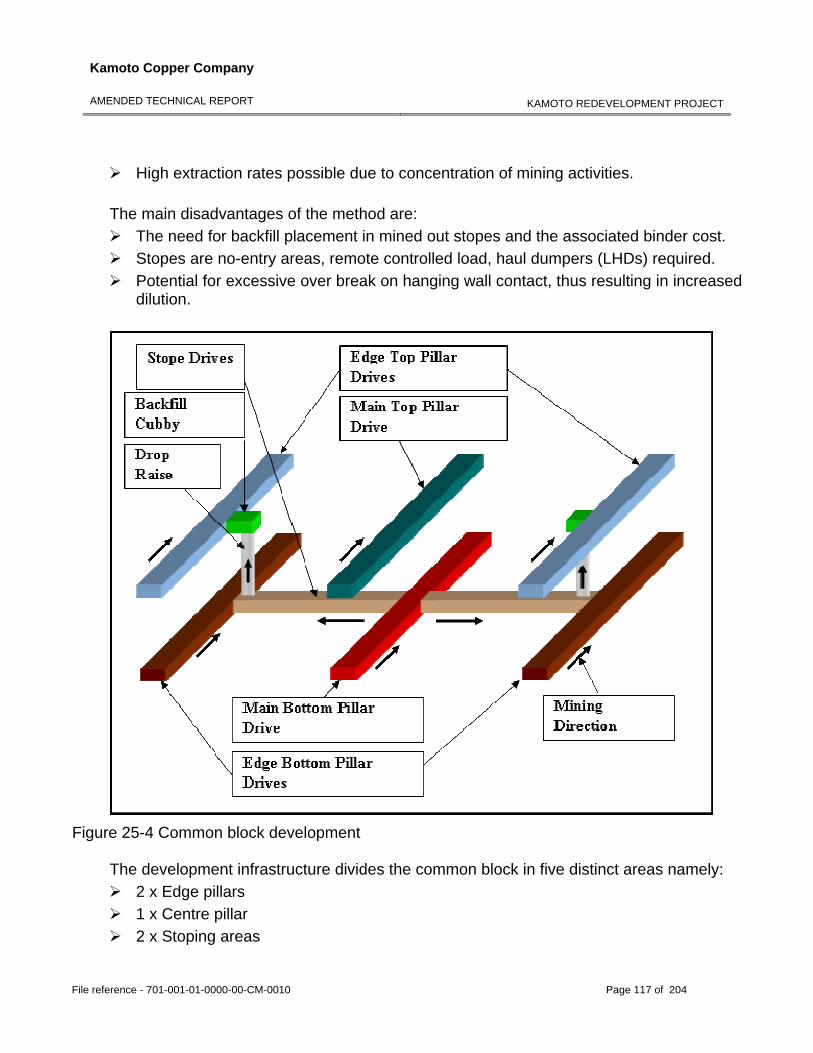
Kamoto Copper Company
AMENDED TECHNICAL REPORT
KAMOTO REDEVELOPMENT PROJECT
File reference - 701-001-01-0000-00-CM-0010 Page 117 of 204
High extraction rates possible due to concentration of mining activities. The main disadvantages of the method are:
The need for backfill placement in mined out stopes and the associated binder cost. Stopes are no-entry areas, remote controlled load, haul dumpers (LHDs) required. Potential for excessive over break on hanging wall contact, thus resulting in increased
dilution.
Figure 25-4 Common block development
The development infrastructure divides the common block in five distinct areas namely:
2 x Edge pillars 1 x Centre pillar 2 x Stoping areas
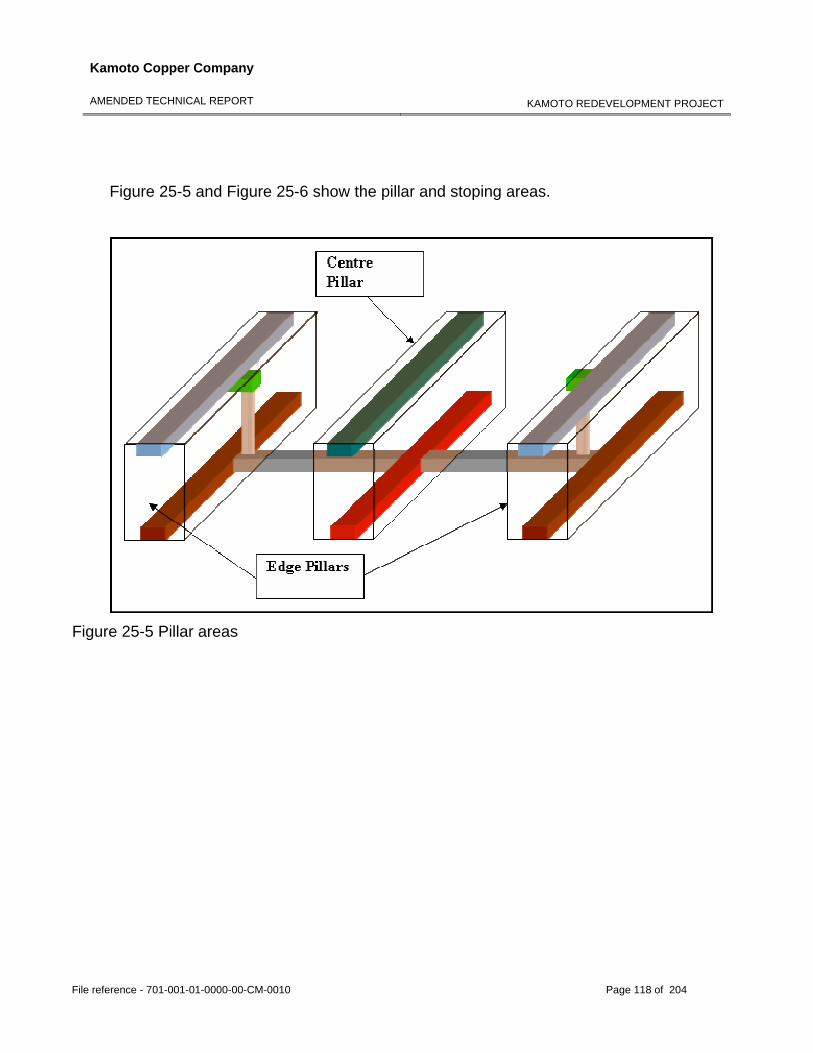
Kamoto Copper Company
AMENDED TECHNICAL REPORT
KAMOTO REDEVELOPMENT PROJECT
File reference - 701-001-01-0000-00-CM-0010 Page 118 of 204
Figure 25-5 and Figure 25-6 show the pillar and stoping areas.
Figure 25-5 Pillar areas
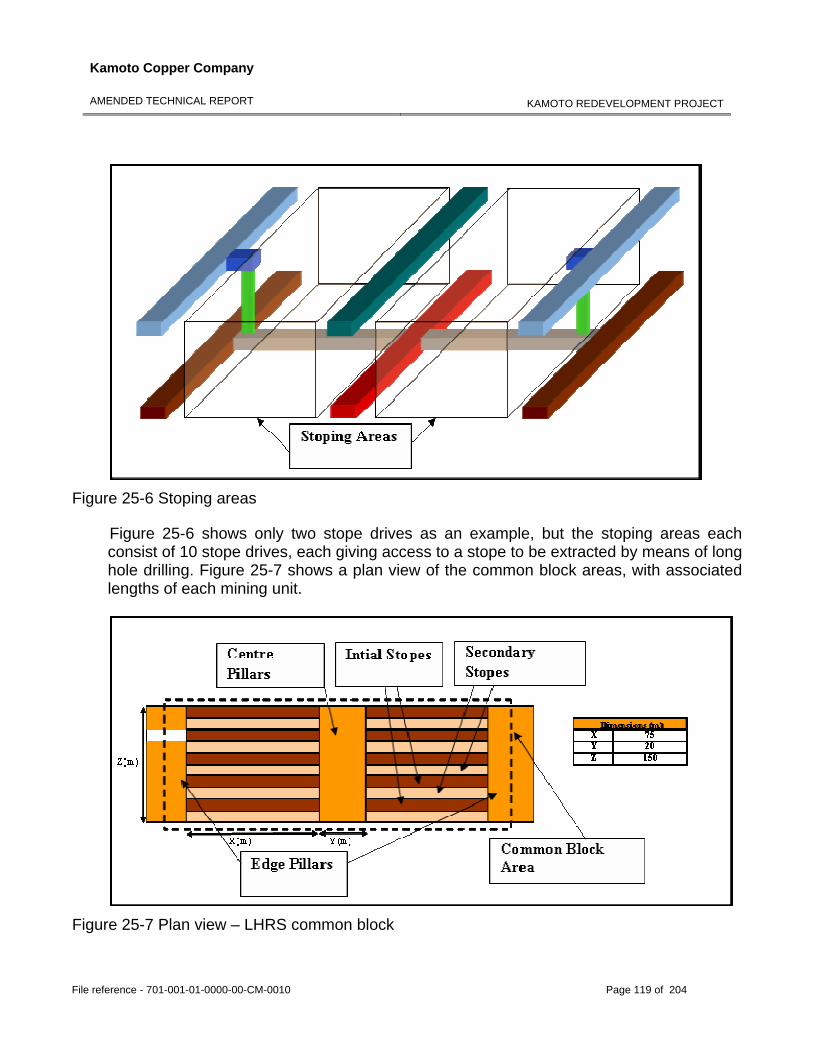
Kamoto Copper Company
AMENDED TECHNICAL REPORT
KAMOTO REDEVELOPMENT PROJECT
File reference - 701-001-01-0000-00-CM-0010 Page 119 of 204
Figure 25-6 Stoping areas
Figure 25-6 shows only two stope drives as an example, but the stoping areas each consist of 10 stope drives, each giving access to a stope to be extracted by means of long hole drilling. Figure 25-7 shows a plan view of the common block areas, with associated lengths of each mining unit.
Figure 25-7 Plan view – LHRS common block
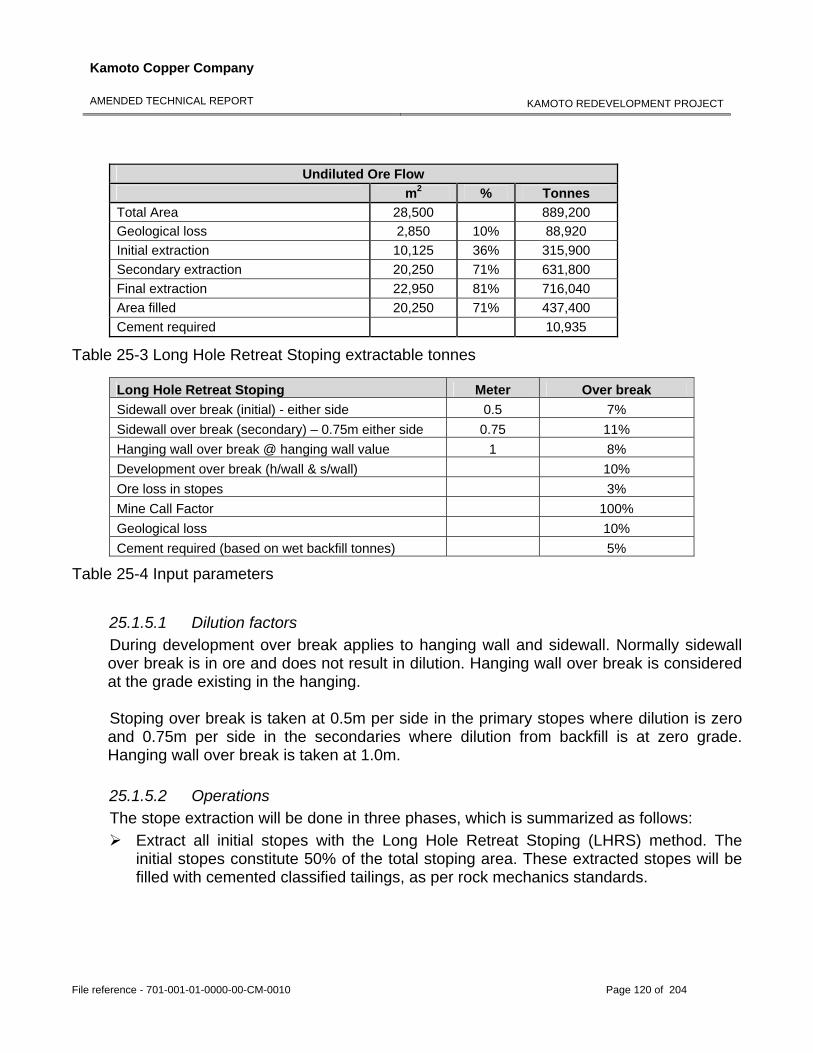
Kamoto Copper Company
AMENDED TECHNICAL REPORT
KAMOTO REDEVELOPMENT PROJECT
File reference - 701-001-01-0000-00-CM-0010 Page 120 of 204
Undiluted Ore Flow m2 % Tonnes Total Area 28,500 889,200 Geological loss 2,850 10% 88,920 Initial extraction 10,125 36% 315,900 Secondary extraction 20,250 71% 631,800 Final extraction 22,950 81% 716,040 Area filled 20,250 71% 437,400 Cement required 10,935
Table 25-3 Long Hole Retreat Stoping extractable tonnes
Long Hole Retreat Stoping Meter Over break Sidewall over break (initial) - either side 0.5 7% Sidewall over break (secondary) – 0.75m either side 0.75 11% Hanging wall over break @ hanging wall value 1 8% Development over break (h/wall & s/wall) 10% Ore loss in stopes 3% Mine Call Factor 100% Geological loss 10% Cement required (based on wet backfill tonnes) 5%
Table 25-4 Input parameters
25.1.5.1 Dilution factors During development over break applies to hanging wall and sidewall. Normally sidewall over break is in ore and does not result in dilution. Hanging wall over break is considered at the grade existing in the hanging. Stoping over break is taken at 0.5m per side in the primary stopes where dilution is zero and 0.75m per side in the secondaries where dilution from backfill is at zero grade. Hanging wall over break is taken at 1.0m. 25.1.5.2 Operations The stope extraction will be done in three phases, which is summarized as follows:
Extract all initial stopes with the Long Hole Retreat Stoping (LHRS) method. The initial stopes constitute 50% of the total stoping area. These extracted stopes will be filled with cemented classified tailings, as per rock mechanics standards.
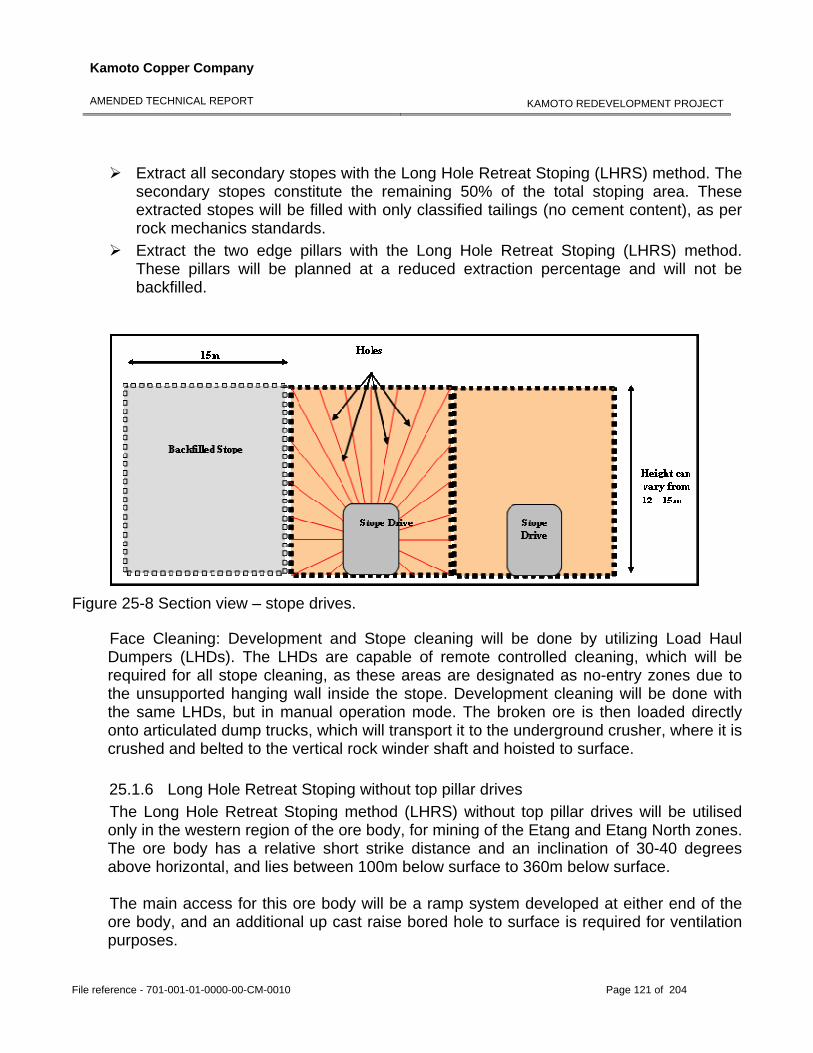
Kamoto Copper Company
AMENDED TECHNICAL REPORT
KAMOTO REDEVELOPMENT PROJECT
File reference - 701-001-01-0000-00-CM-0010 Page 121 of 204
Extract all secondary stopes with the Long Hole Retreat Stoping (LHRS) method. The secondary stopes constitute the remaining 50% of the total stoping area. These extracted stopes will be filled with only classified tailings (no cement content), as per rock mechanics standards.
Extract the two edge pillars with the Long Hole Retreat Stoping (LHRS) method. These pillars will be planned at a reduced extraction percentage and will not be backfilled.
Figure 25-8 Section view – stope drives.
Face Cleaning: Development and Stope cleaning will be done by utilizing Load Haul Dumpers (LHDs). The LHDs are capable of remote controlled cleaning, which will be required for all stope cleaning, as these areas are designated as no-entry zones due to the unsupported hanging wall inside the stope. Development cleaning will be done with the same LHDs, but in manual operation mode. The broken ore is then loaded directly onto articulated dump trucks, which will transport it to the underground crusher, where it is crushed and belted to the vertical rock winder shaft and hoisted to surface. 25.1.6 Long Hole Retreat Stoping without top pillar drives The Long Hole Retreat Stoping method (LHRS) without top pillar drives will be utilised only in the western region of the ore body, for mining of the Etang and Etang North zones. The ore body has a relative short strike distance and an inclination of 30-40 degrees above horizontal, and lies between 100m below surface to 360m below surface. The main access for this ore body will be a ramp system developed at either end of the ore body, and an additional up cast raise bored hole to surface is required for ventilation purposes.
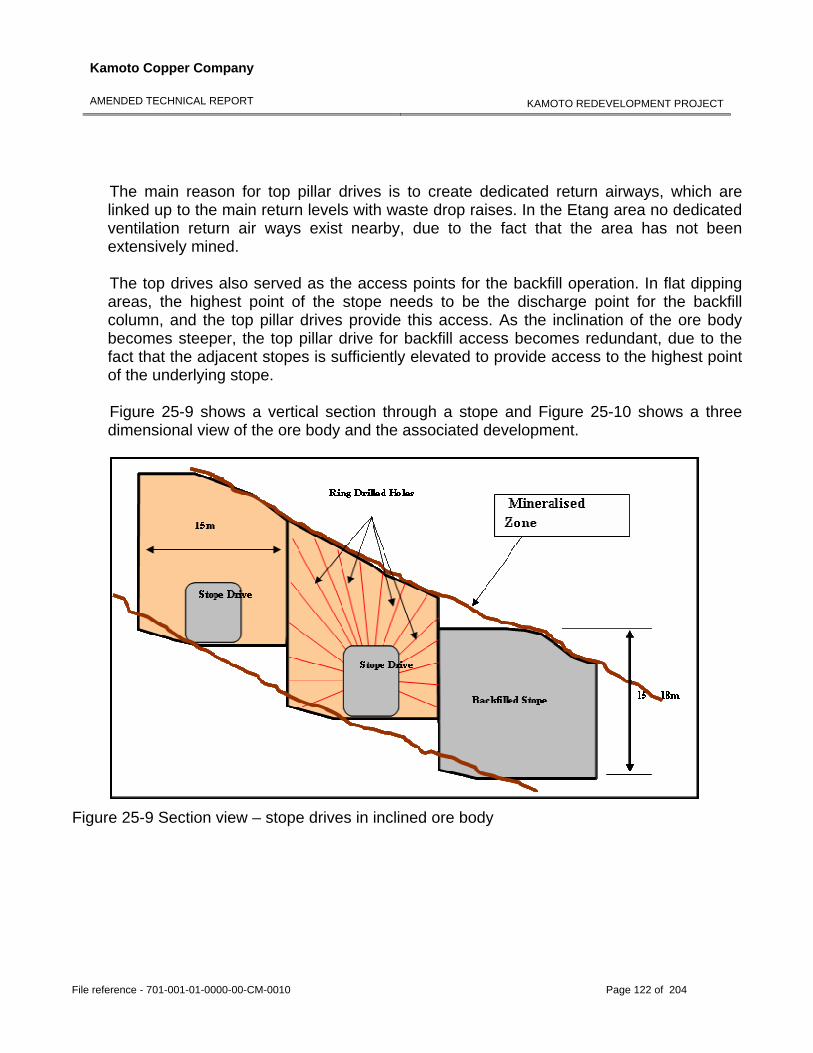
Kamoto Copper Company
AMENDED TECHNICAL REPORT
KAMOTO REDEVELOPMENT PROJECT
File reference - 701-001-01-0000-00-CM-0010 Page 122 of 204
The main reason for top pillar drives is to create dedicated return airways, which are linked up to the main return levels with waste drop raises. In the Etang area no dedicated ventilation return air ways exist nearby, due to the fact that the area has not been extensively mined. The top drives also served as the access points for the backfill operation. In flat dipping areas, the highest point of the stope needs to be the discharge point for the backfill column, and the top pillar drives provide this access. As the inclination of the ore body becomes steeper, the top pillar drive for backfill access becomes redundant, due to the fact that the adjacent stopes is sufficiently elevated to provide access to the highest point of the underlying stope. Figure 25-9 shows a vertical section through a stope and Figure 25-10 shows a three dimensional view of the ore body and the associated development.
Figure 25-9 Section view – stope drives in inclined ore body
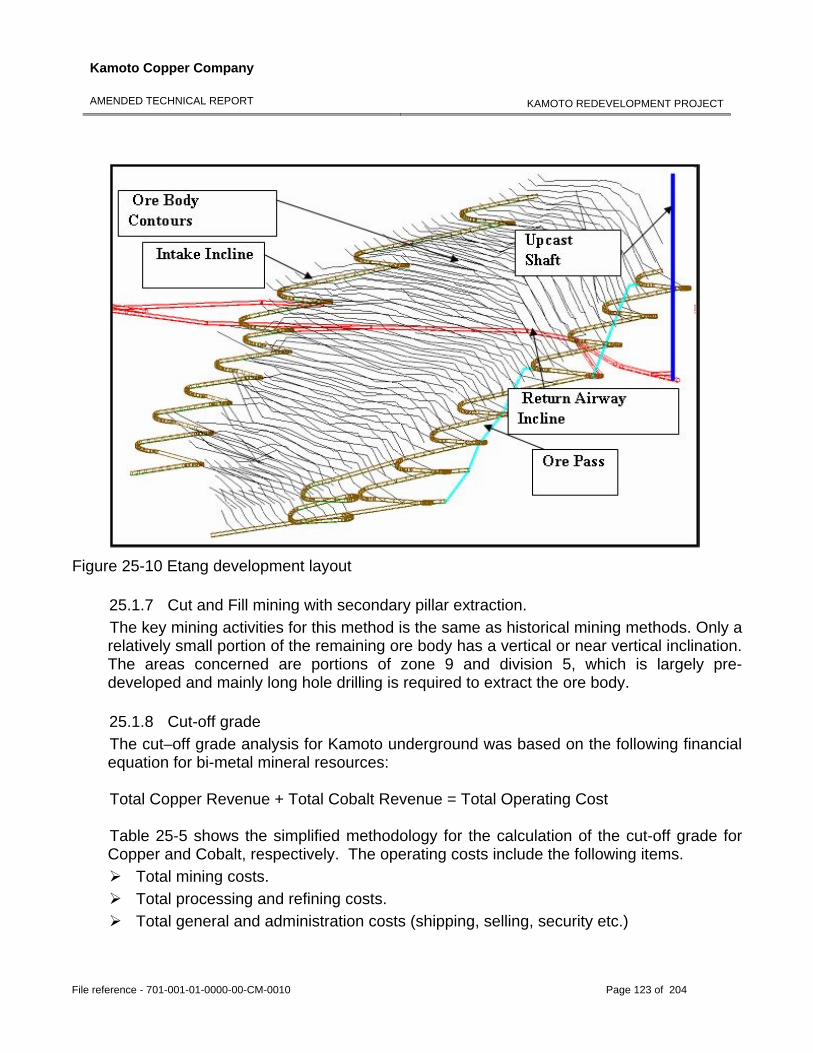
Kamoto Copper Company
AMENDED TECHNICAL REPORT
KAMOTO REDEVELOPMENT PROJECT
File reference - 701-001-01-0000-00-CM-0010 Page 123 of 204
Figure 25-10 Etang development layout
25.1.7 Cut and Fill mining with secondary pillar extraction. The key mining activities for this method is the same as historical mining methods. Only a relatively small portion of the remaining ore body has a vertical or near vertical inclination. The areas concerned are portions of zone 9 and division 5, which is largely pre-developed and mainly long hole drilling is required to extract the ore body. 25.1.8 Cut-off grade The cut–off grade analysis for Kamoto underground was based on the following financial equation for bi-metal mineral resources: Total Copper Revenue + Total Cobalt Revenue = Total Operating Cost Table 25-5 shows the simplified methodology for the calculation of the cut-off grade for Copper and Cobalt, respectively. The operating costs include the following items.
Total mining costs. Total processing and refining costs. Total general and administration costs (shipping, selling, security etc.)
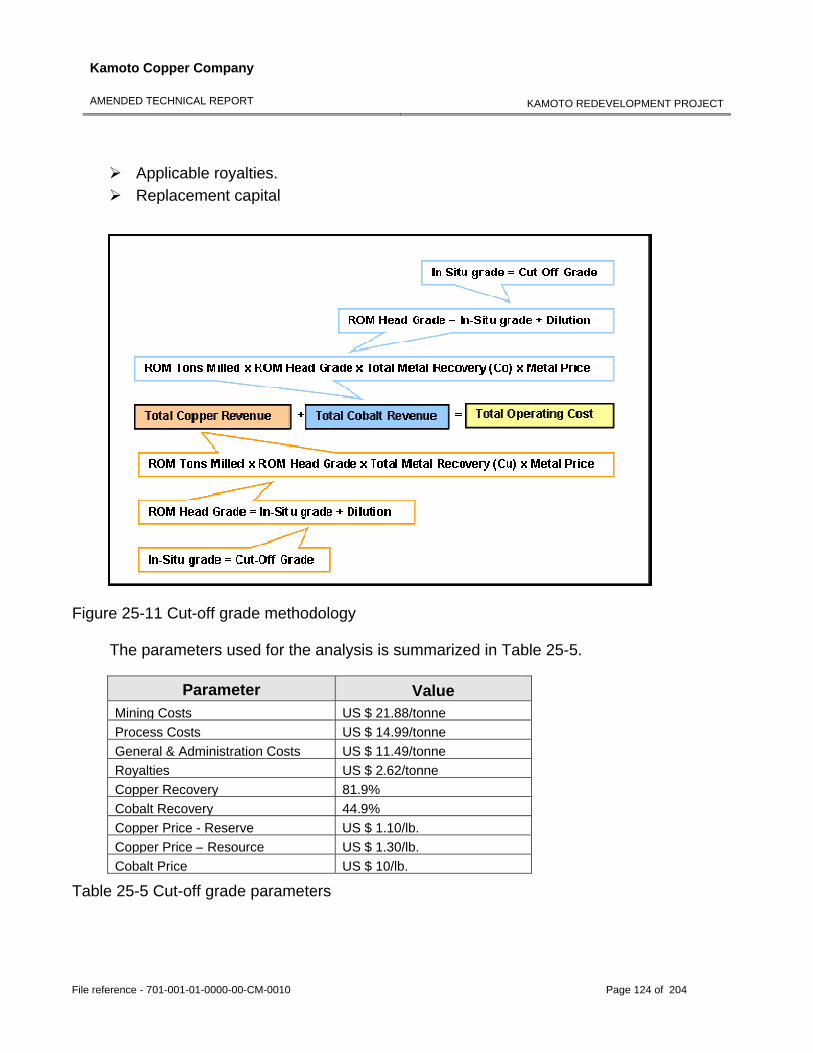
Kamoto Copper Company
AMENDED TECHNICAL REPORT
KAMOTO REDEVELOPMENT PROJECT
File reference - 701-001-01-0000-00-CM-0010 Page 124 of 204
Applicable royalties. Replacement capital
Figure 25-11 Cut-off grade methodology
The parameters used for the analysis is summarized in Table 25-5.
Parameter Value Mining Costs US $ 21.88/tonneProcess Costs US $ 14.99/tonneGeneral & Administration Costs US $ 11.49/tonneRoyalties US $ 2.62/tonneCopper Recovery 81.9%Cobalt Recovery 44.9%Copper Price - Reserve US $ 1.10/lb.Copper Price – Resource US $ 1.30/lb.Cobalt Price US $ 10/lb.
Table 25-5 Cut-off grade parameters
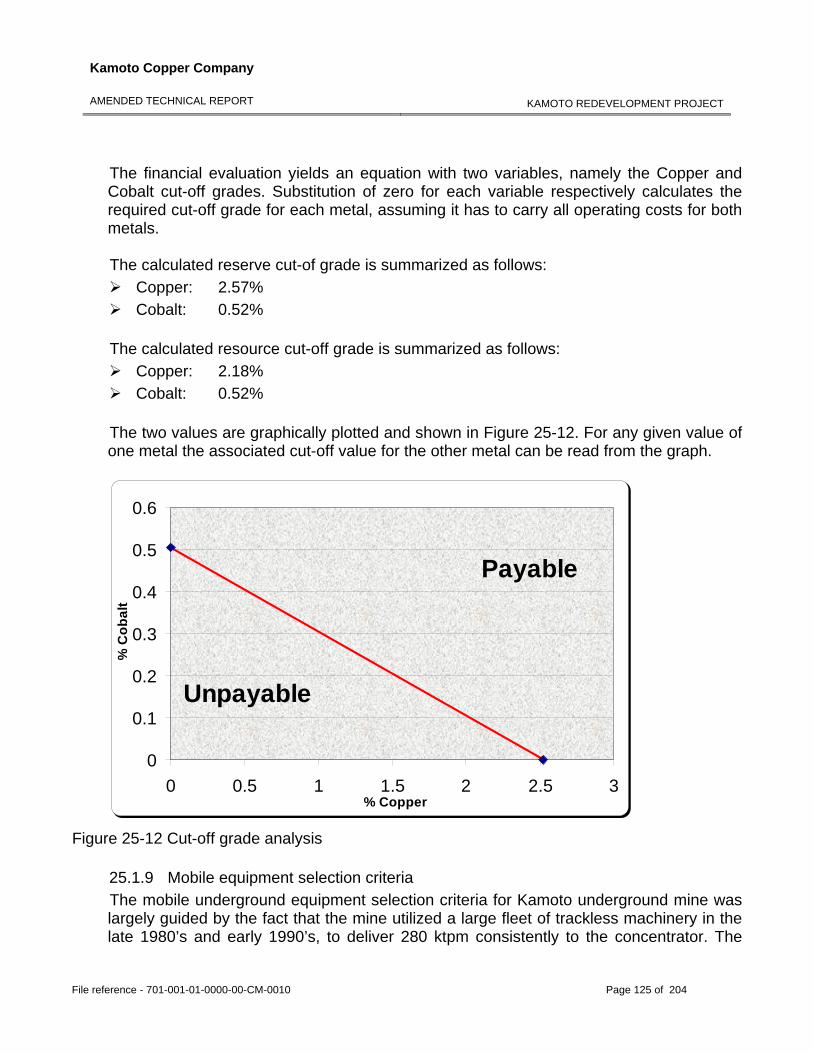
Kamoto Copper Company
AMENDED TECHNICAL REPORT
KAMOTO REDEVELOPMENT PROJECT
File reference - 701-001-01-0000-00-CM-0010 Page 125 of 204
The financial evaluation yields an equation with two variables, namely the Copper and Cobalt cut-off grades. Substitution of zero for each variable respectively calculates the required cut-off grade for each metal, assuming it has to carry all operating costs for both metals. The calculated reserve cut-of grade is summarized as follows:
Copper: 2.57% Cobalt: 0.52%
The calculated resource cut-off grade is summarized as follows:
Copper: 2.18% Cobalt: 0.52%
The two values are graphically plotted and shown in Figure 25-12. For any given value of one metal the associated cut-off value for the other metal can be read from the graph.
0
0.1
0.2
0.3
0.4
0.5
0.6
0 0.5 1 1.5 2 2.5 3% Copper
% C
obal
t
Unpayable
Payable
Figure 25-12 Cut-off grade analysis
25.1.9 Mobile equipment selection criteria The mobile underground equipment selection criteria for Kamoto underground mine was largely guided by the fact that the mine utilized a large fleet of trackless machinery in the late 1980’s and early 1990’s, to deliver 280 ktpm consistently to the concentrator. The
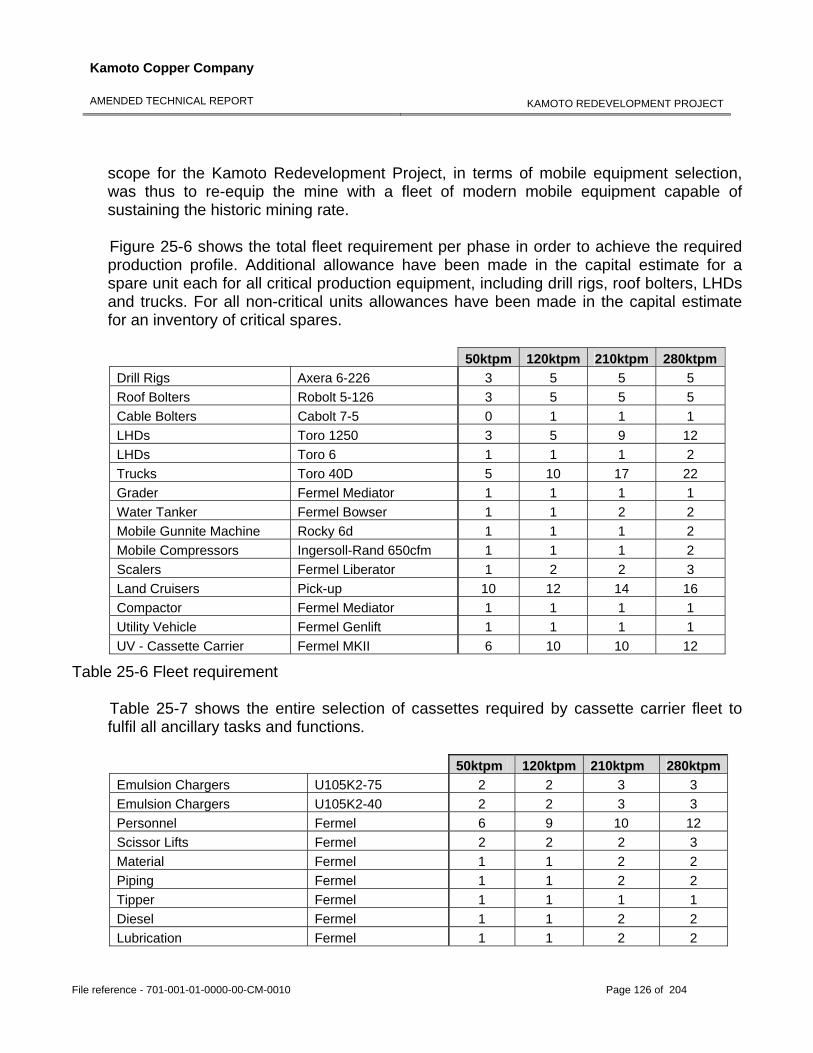
Kamoto Copper Company
AMENDED TECHNICAL REPORT
KAMOTO REDEVELOPMENT PROJECT
File reference - 701-001-01-0000-00-CM-0010 Page 126 of 204
scope for the Kamoto Redevelopment Project, in terms of mobile equipment selection, was thus to re-equip the mine with a fleet of modern mobile equipment capable of sustaining the historic mining rate. Figure 25-6 shows the total fleet requirement per phase in order to achieve the required production profile. Additional allowance have been made in the capital estimate for a spare unit each for all critical production equipment, including drill rigs, roof bolters, LHDs and trucks. For all non-critical units allowances have been made in the capital estimate for an inventory of critical spares. 50ktpm 120ktpm 210ktpm 280ktpm Drill Rigs Axera 6-226 3 5 5 5 Roof Bolters Robolt 5-126 3 5 5 5 Cable Bolters Cabolt 7-5 0 1 1 1 LHDs Toro 1250 3 5 9 12 LHDs Toro 6 1 1 1 2 Trucks Toro 40D 5 10 17 22 Grader Fermel Mediator 1 1 1 1 Water Tanker Fermel Bowser 1 1 2 2 Mobile Gunnite Machine Rocky 6d 1 1 1 2 Mobile Compressors Ingersoll-Rand 650cfm 1 1 1 2 Scalers Fermel Liberator 1 2 2 3 Land Cruisers Pick-up 10 12 14 16 Compactor Fermel Mediator 1 1 1 1 Utility Vehicle Fermel Genlift 1 1 1 1 UV - Cassette Carrier Fermel MKII 6 10 10 12
Table 25-6 Fleet requirement
Table 25-7 shows the entire selection of cassettes required by cassette carrier fleet to fulfil all ancillary tasks and functions.
50ktpm 120ktpm 210ktpm 280ktpmEmulsion Chargers U105K2-75 2 2 3 3 Emulsion Chargers U105K2-40 2 2 3 3 Personnel Fermel 6 9 10 12 Scissor Lifts Fermel 2 2 2 3 Material Fermel 1 1 2 2 Piping Fermel 1 1 2 2 Tipper Fermel 1 1 1 1 Diesel Fermel 1 1 2 2 Lubrication Fermel 1 1 2 2
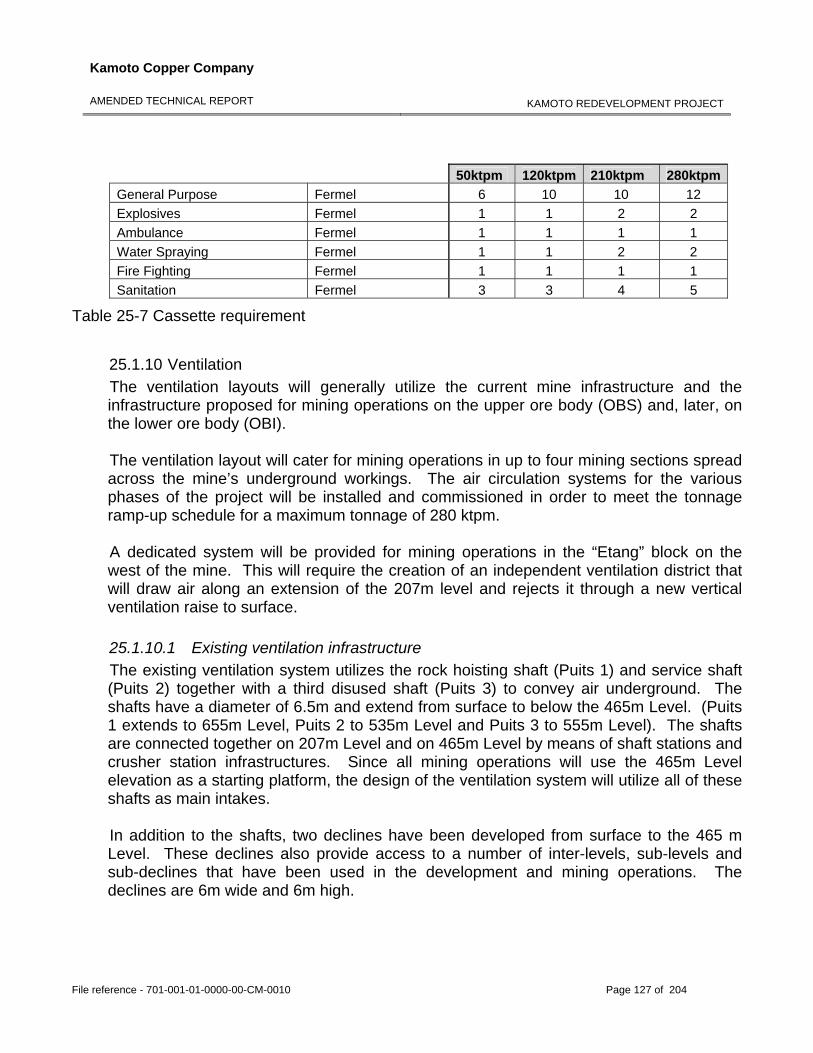
Kamoto Copper Company
AMENDED TECHNICAL REPORT
KAMOTO REDEVELOPMENT PROJECT
File reference - 701-001-01-0000-00-CM-0010 Page 127 of 204
50ktpm 120ktpm 210ktpm 280ktpmGeneral Purpose Fermel 6 10 10 12 Explosives Fermel 1 1 2 2 Ambulance Fermel 1 1 1 1 Water Spraying Fermel 1 1 2 2 Fire Fighting Fermel 1 1 1 1 Sanitation Fermel 3 3 4 5
Table 25-7 Cassette requirement
25.1.10 Ventilation The ventilation layouts will generally utilize the current mine infrastructure and the infrastructure proposed for mining operations on the upper ore body (OBS) and, later, on the lower ore body (OBI). The ventilation layout will cater for mining operations in up to four mining sections spread across the mine’s underground workings. The air circulation systems for the various phases of the project will be installed and commissioned in order to meet the tonnage ramp-up schedule for a maximum tonnage of 280 ktpm. A dedicated system will be provided for mining operations in the “Etang” block on the west of the mine. This will require the creation of an independent ventilation district that will draw air along an extension of the 207m level and rejects it through a new vertical ventilation raise to surface. 25.1.10.1 Existing ventilation infrastructure The existing ventilation system utilizes the rock hoisting shaft (Puits 1) and service shaft (Puits 2) together with a third disused shaft (Puits 3) to convey air underground. The shafts have a diameter of 6.5m and extend from surface to below the 465m Level. (Puits 1 extends to 655m Level, Puits 2 to 535m Level and Puits 3 to 555m Level). The shafts are connected together on 207m Level and on 465m Level by means of shaft stations and crusher station infrastructures. Since all mining operations will use the 465m Level elevation as a starting platform, the design of the ventilation system will utilize all of these shafts as main intakes. In addition to the shafts, two declines have been developed from surface to the 465 m Level. These declines also provide access to a number of inter-levels, sub-levels and sub-declines that have been used in the development and mining operations. The declines are 6m wide and 6m high.
Kamoto Copper Company
AMENDED TECHNICAL REPORT
KAMOTO REDEVELOPMENT PROJECT
File reference - 701-001-01-0000-00-CM-0010 Page 128 of 204
Overlaying the ore body is a network of return airways on the 425m Level elevation (RA 425). These have been designed to gather the return air to the north of the main shaft system and return it to positions on 350m L and 307m L elevations on the southern boundary of the ore body. From here a major return airway system spans the ore body on strike (207m Level) and conveys the air to the two upcast shafts:
Puits 4 to the east of the shaft complex, 4.5m in diameter and Puits 5 to the west of the main shaft complex, 5.5m in diameter.
Each shaft is served by two axial flow fans located on surface. Although all four units will operate full time in parallel, only one is currently operational. Figure 25-13 below indicates the extent of the existing and planned major airways. The proposed ventilation system will retain the existing infrastructure consisting of the main decline and shaft intake airways, the RA 425 return airway system and the two upcast shafts in order to provide air to the new mining sections. Extensions to the intake declines and returns leading to the RA 425 infrastructure will be necessary as production will increase in new sections of the mine. In addition to the above, air is provided to the shaft bottom areas at the rock loading facilities, at the No.1 crusher station where an extensive system of air ducts is used to extract dust-laden air from the four tipping stations and for the main workshop located on 360m Level where air is drawn from the decline downcast, coursed though the workshop and returned to the upcast directly.
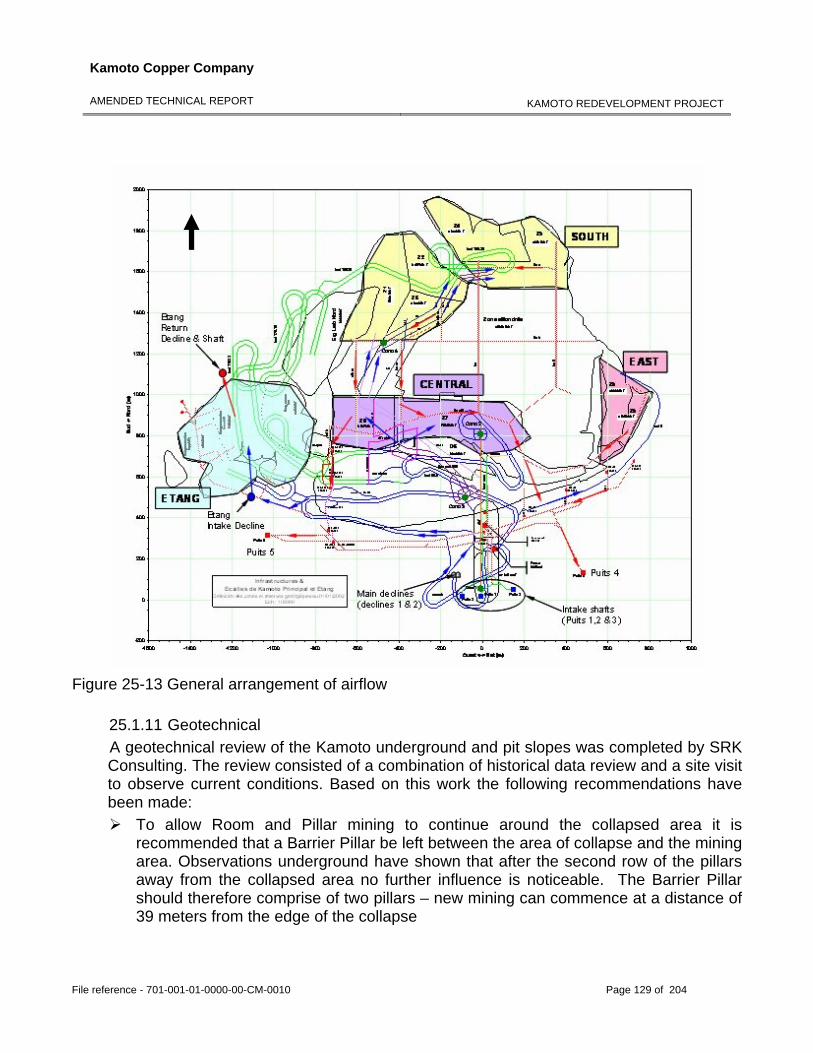
Kamoto Copper Company
AMENDED TECHNICAL REPORT
KAMOTO REDEVELOPMENT PROJECT
File reference - 701-001-01-0000-00-CM-0010 Page 129 of 204
Figure 25-13 General arrangement of airflow
25.1.11 Geotechnical A geotechnical review of the Kamoto underground and pit slopes was completed by SRK Consulting. The review consisted of a combination of historical data review and a site visit to observe current conditions. Based on this work the following recommendations have been made:
To allow Room and Pillar mining to continue around the collapsed area it is recommended that a Barrier Pillar be left between the area of collapse and the mining area. Observations underground have shown that after the second row of the pillars away from the collapsed area no further influence is noticeable. The Barrier Pillar should therefore comprise of two pillars – new mining can commence at a distance of 39 meters from the edge of the collapse
Kamoto Copper Company
AMENDED TECHNICAL REPORT
KAMOTO REDEVELOPMENT PROJECT
File reference - 701-001-01-0000-00-CM-0010 Page 130 of 204
New room and pillar workings will have similar dimensions to those existing in the mine
Long hole retreat stoping should commence at the centre of the stope and progress outwards towards the dip orientated barrier pillars
Primary panels are filled with cemented thickened tailings backfill that is designed to achieve a uniaxial compressive strength of 1MPa within 28 days
Secondary panels are mined between the backfilled primary panels. It is not intended to leave rib pillars between primary and secondary stopes and secondary stopes will have side walls formed from cemented fill
Secondary panels will be filled with cyclone classified tailings backfill to assist with regional support
As it will not be possible to install hanging wall support in the panels, the long hole retreat stoping method must be seen as a “no entry” method for personnel
It is recommended that all mining should be completed within the OBS before undermining in OBI takes place
It is recommended that detailed modelling of the mining sequence be undertaken.
Local modifications to the sequence may be made to minimise risk arising from stress conditions
25.1.11.1 Backfill criteria for primary stopes:
Attain a free standing and minimum stable height of 15 metres, and a maximum of 25 metres, within 28 days of placement. The height of 25 metres is taken as the maximum anticipated for Kamoto.
Achieve a tight contact against the hanging wall on placement. This requirement will be assisted if stopes are mined on a minor dip. System design should allow for secondary filling of primary stopes to ensure tight fill – this may require installation of barricades in the filling drives.
Undergo minimal shrinkage to ensure that hanging wall contact is maintained. Have sufficient strength and stiffness to provide stable abutment support for
secondary stope roof spans. Have sufficient strength to resist blasting damage and thereby minimize backfill
dilution due to blasting damage during mining of secondary stopes. The target strength is 1 MPa after 28 days – this will afford a safety factor of approximately 4 against shear failure within a filled panel 15 metres high.
Have minimal water runoff and zero potential for liquefaction. The stope hanging walls will not be supported and therefore crews will not be permitted to enter completed stopes to install drainage and decantation systems.
Kamoto Copper Company
AMENDED TECHNICAL REPORT
KAMOTO REDEVELOPMENT PROJECT
File reference - 701-001-01-0000-00-CM-0010 Page 131 of 204
25.1.11.2 Backfill for secondary stopes Provide lateral support to the side walls of backfilled primary stopes to prevent
premature collapse and assist with regional support. To achieve this, secondary stopes should be filled to at least 70% of their mined height.
25.1.11.3 For other applications:
Prevent collapse by providing support to the walls of pre-existing pillars that are in a potentially unstable condition, or are likely to be subjected to additional stress that may render them unstable.
Backfill bulkheads will be constructed according to existing industry practices. 25.1.12 Development and production mining schedule 25.1.12.1 Planning methodology The planning for Kamoto underground mine was done on the common block analysis which entails reducing a specific mining method to the smallest independent mining block, which can be duplicated to form the mining lay out for the entire ore body. The approach followed is summarized as follows:
Determine the total common block size in terms of in situ tonnage. Determine the total development requirements to be able to mine the entire block in
the preferred lay out, keeping in mind any geological and geotechnical considerations.
Determine the applicable end sizes to accommodate the anticipated mobile machinery as well as ventilation quantities required.
Determine the total tonnes extractable (hoisted to surface) out of the total block after the necessary modifying factors have been applied.
Determine the total volume to be backfilled as per the geotechnical guidelines. Calculation of the total tons extractable and total development requirements will yield
the ratio between the total development required to extract (hoist) any given tonnage. The tonnage extraction rate from a single common block is adjusted to suit the
logistical infrastructure, which will result in the total amount of active common blocks required during any period.
The active common blocks is positioned and planned throughout the mine to facilitate either a smooth logistical flow of mobile equipment, or to access high grade areas for early mining or grade blending purposes, or to reduce the geological and/or geotechnical risks and associated impact on the production profile.
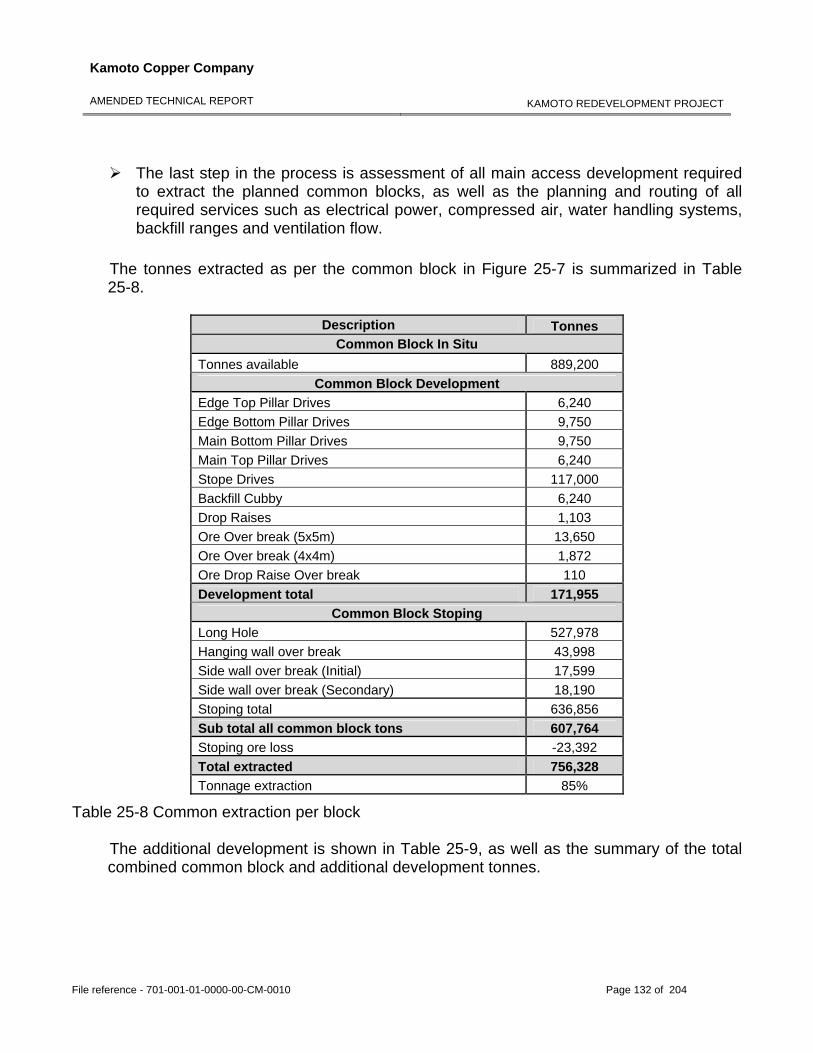
Kamoto Copper Company
AMENDED TECHNICAL REPORT
KAMOTO REDEVELOPMENT PROJECT
File reference - 701-001-01-0000-00-CM-0010 Page 132 of 204
The last step in the process is assessment of all main access development required to extract the planned common blocks, as well as the planning and routing of all required services such as electrical power, compressed air, water handling systems, backfill ranges and ventilation flow.
The tonnes extracted as per the common block in Figure 25-7 is summarized in Table 25-8.
Description Tonnes Common Block In Situ
Tonnes available 889,200 Common Block Development
Edge Top Pillar Drives 6,240 Edge Bottom Pillar Drives 9,750 Main Bottom Pillar Drives 9,750 Main Top Pillar Drives 6,240 Stope Drives 117,000 Backfill Cubby 6,240 Drop Raises 1,103 Ore Over break (5x5m) 13,650 Ore Over break (4x4m) 1,872 Ore Drop Raise Over break 110 Development total 171,955
Common Block Stoping Long Hole 527,978 Hanging wall over break 43,998 Side wall over break (Initial) 17,599 Side wall over break (Secondary) 18,190 Stoping total 636,856 Sub total all common block tons 607,764 Stoping ore loss -23,392 Total extracted 756,328 Tonnage extraction 85%
Table 25-8 Common extraction per block
The additional development is shown in Table 25-9, as well as the summary of the total combined common block and additional development tonnes.
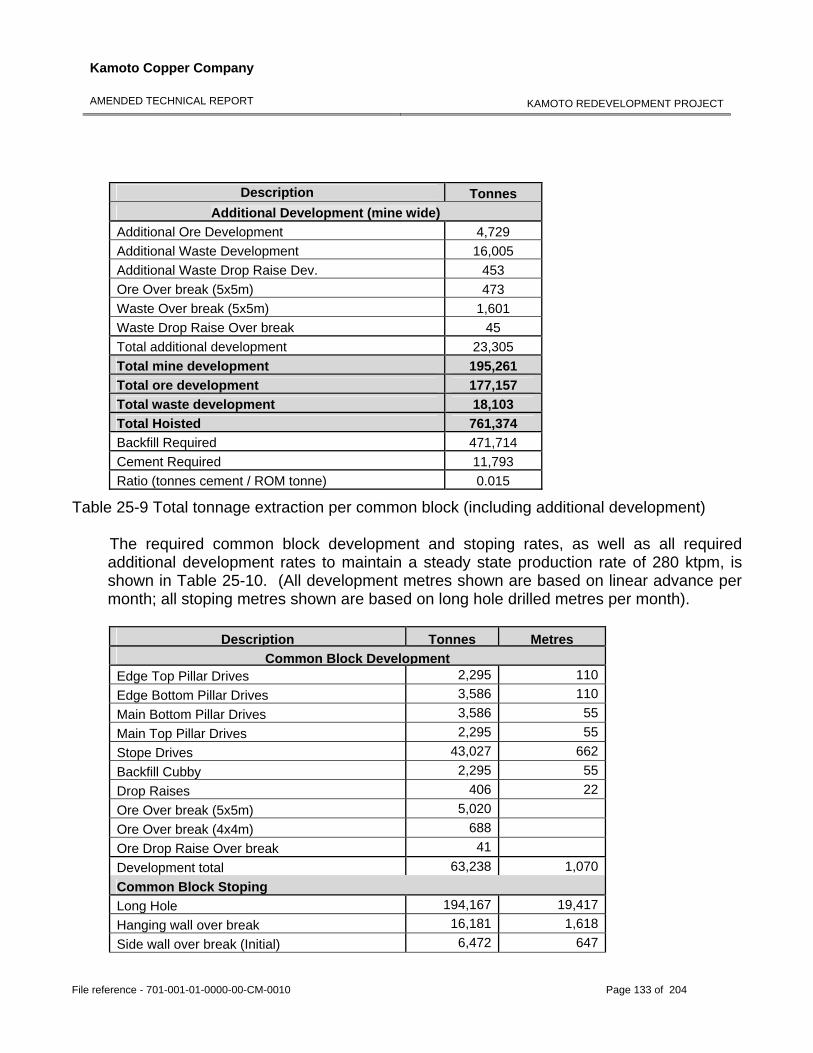
Kamoto Copper Company
AMENDED TECHNICAL REPORT
KAMOTO REDEVELOPMENT PROJECT
File reference - 701-001-01-0000-00-CM-0010 Page 133 of 204
Description Tonnes
Additional Development (mine wide) Additional Ore Development 4,729 Additional Waste Development 16,005 Additional Waste Drop Raise Dev. 453 Ore Over break (5x5m) 473 Waste Over break (5x5m) 1,601 Waste Drop Raise Over break 45 Total additional development 23,305 Total mine development 195,261 Total ore development 177,157 Total waste development 18,103 Total Hoisted 761,374 Backfill Required 471,714 Cement Required 11,793 Ratio (tonnes cement / ROM tonne) 0.015
Table 25-9 Total tonnage extraction per common block (including additional development)
The required common block development and stoping rates, as well as all required additional development rates to maintain a steady state production rate of 280 ktpm, is shown in Table 25-10. (All development metres shown are based on linear advance per month; all stoping metres shown are based on long hole drilled metres per month).
Description Tonnes Metres Common Block Development
Edge Top Pillar Drives 2,295 110 Edge Bottom Pillar Drives 3,586 110 Main Bottom Pillar Drives 3,586 55 Main Top Pillar Drives 2,295 55 Stope Drives 43,027 662 Backfill Cubby 2,295 55 Drop Raises 406 22 Ore Over break (5x5m) 5,020 Ore Over break (4x4m) 688 Ore Drop Raise Over break 41 Development total 63,238 1,070 Common Block Stoping Long Hole 194,167 19,417 Hanging wall over break 16,181 1,618 Side wall over break (Initial) 6,472 647
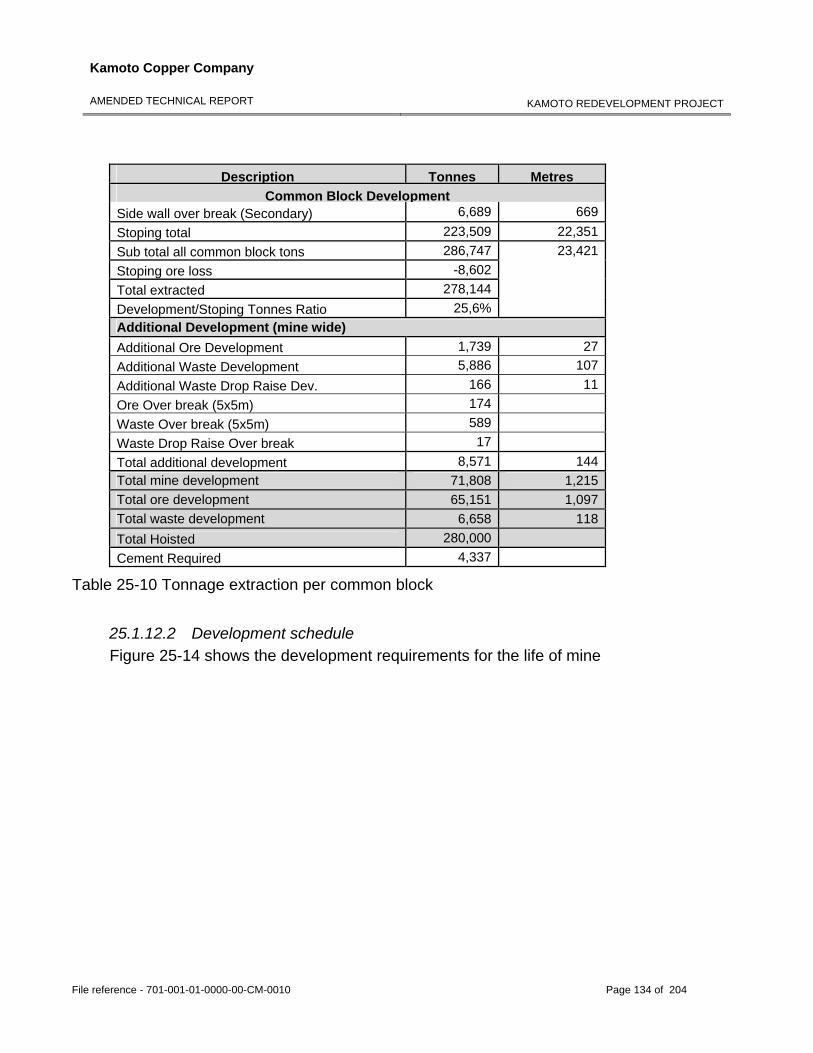
Kamoto Copper Company
AMENDED TECHNICAL REPORT
KAMOTO REDEVELOPMENT PROJECT
File reference - 701-001-01-0000-00-CM-0010 Page 134 of 204
Description Tonnes Metres Common Block Development
Side wall over break (Secondary) 6,689 669 Stoping total 223,509 22,351 Sub total all common block tons 286,747 23,421 Stoping ore loss -8,602 Total extracted 278,144 Development/Stoping Tonnes Ratio 25,6% Additional Development (mine wide) Additional Ore Development 1,739 27 Additional Waste Development 5,886 107 Additional Waste Drop Raise Dev. 166 11 Ore Over break (5x5m) 174 Waste Over break (5x5m) 589 Waste Drop Raise Over break 17 Total additional development 8,571 144 Total mine development 71,808 1,215 Total ore development 65,151 1,097 Total waste development 6,658 118 Total Hoisted 280,000 Cement Required 4,337
Table 25-10 Tonnage extraction per common block
25.1.12.2 Development schedule Figure 25-14 shows the development requirements for the life of mine
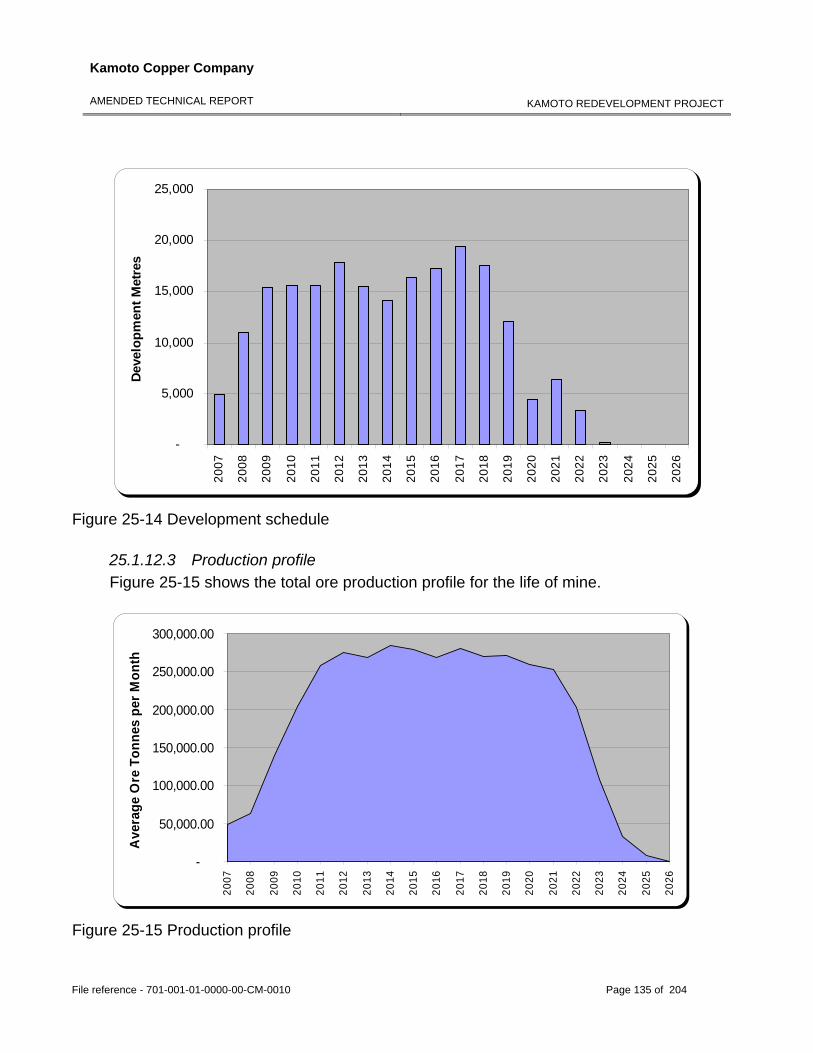
Kamoto Copper Company
AMENDED TECHNICAL REPORT
KAMOTO REDEVELOPMENT PROJECT
File reference - 701-001-01-0000-00-CM-0010 Page 135 of 204
-
5,000
10,000
15,000
20,000
25,000
2007
2008
2009
2010
2011
2012
2013
2014
2015
2016
2017
2018
2019
2020
2021
2022
2023
2024
2025
2026
Deve
lopm
ent M
etre
s
Figure 25-14 Development schedule
25.1.12.3 Production profile Figure 25-15 shows the total ore production profile for the life of mine.
-
50,000.00
100,000.00
150,000.00
200,000.00
250,000.00
300,000.00
2007
2008
2009
2010
2011
2012
2013
2014
2015
2016
2017
2018
2019
2020
2021
2022
2023
2024
2025
2026
Ave
rage
Ore
Ton
nes
per M
onth
Figure 25-15 Production profile
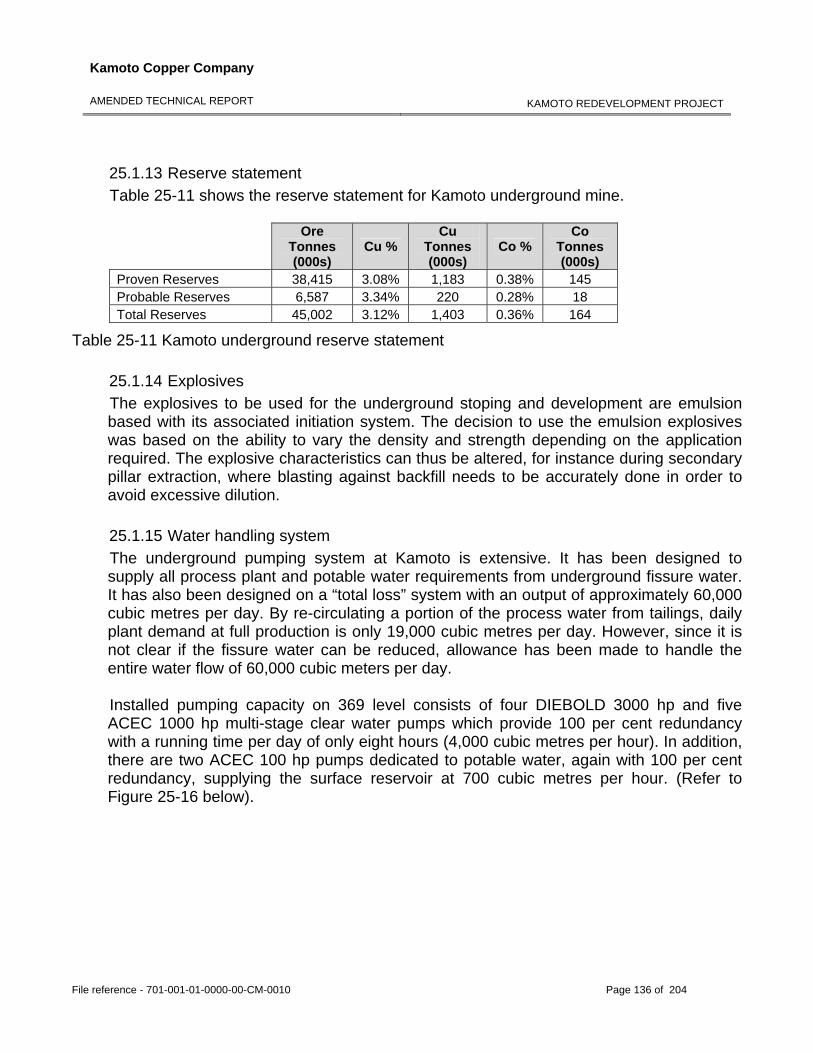
Kamoto Copper Company
AMENDED TECHNICAL REPORT
KAMOTO REDEVELOPMENT PROJECT
File reference - 701-001-01-0000-00-CM-0010 Page 136 of 204
25.1.13 Reserve statement Table 25-11 shows the reserve statement for Kamoto underground mine.
Ore Tonnes (000s)
Cu % Cu
Tonnes (000s)
Co % Co
Tonnes (000s)
Proven Reserves 38,415 3.08% 1,183 0.38% 145 Probable Reserves 6,587 3.34% 220 0.28% 18 Total Reserves 45,002 3.12% 1,403 0.36% 164
Table 25-11 Kamoto underground reserve statement 25.1.14 Explosives The explosives to be used for the underground stoping and development are emulsion based with its associated initiation system. The decision to use the emulsion explosives was based on the ability to vary the density and strength depending on the application required. The explosive characteristics can thus be altered, for instance during secondary pillar extraction, where blasting against backfill needs to be accurately done in order to avoid excessive dilution. 25.1.15 Water handling system The underground pumping system at Kamoto is extensive. It has been designed to supply all process plant and potable water requirements from underground fissure water. It has also been designed on a “total loss” system with an output of approximately 60,000 cubic metres per day. By re-circulating a portion of the process water from tailings, daily plant demand at full production is only 19,000 cubic metres per day. However, since it is not clear if the fissure water can be reduced, allowance has been made to handle the entire water flow of 60,000 cubic meters per day. Installed pumping capacity on 369 level consists of four DIEBOLD 3000 hp and five ACEC 1000 hp multi-stage clear water pumps which provide 100 per cent redundancy with a running time per day of only eight hours (4,000 cubic metres per hour). In addition, there are two ACEC 100 hp pumps dedicated to potable water, again with 100 per cent redundancy, supplying the surface reservoir at 700 cubic metres per hour. (Refer to Figure 25-16 below).
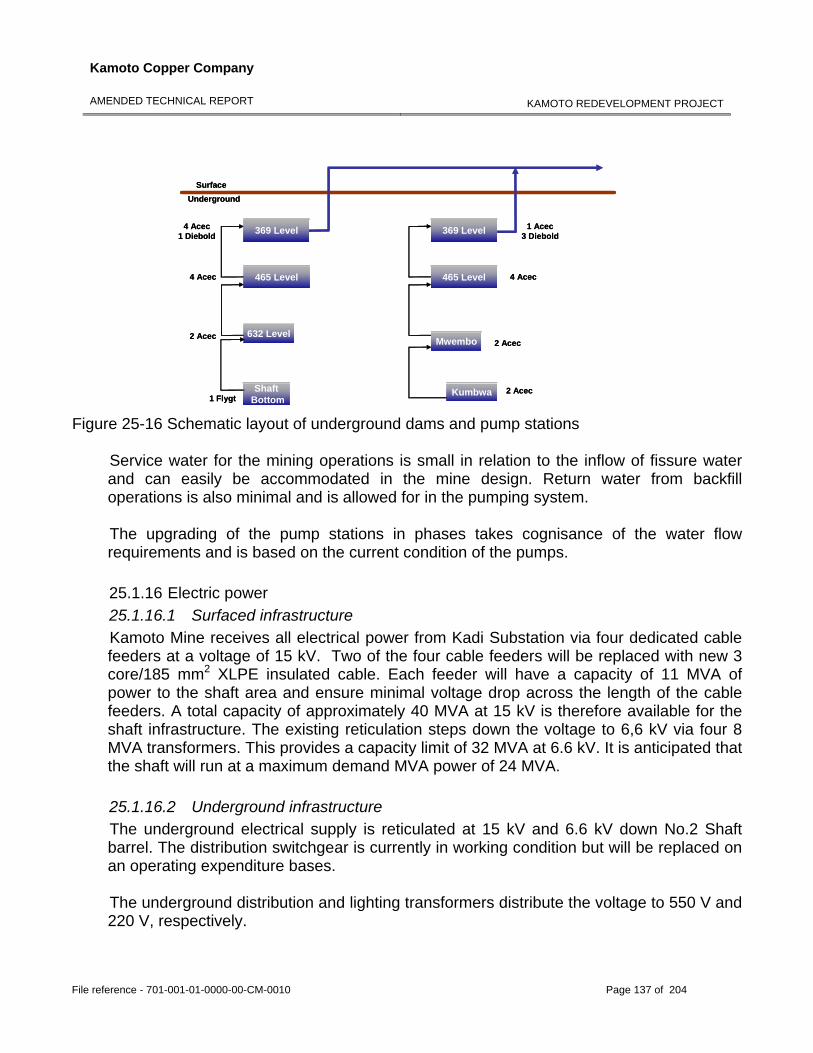
Kamoto Copper Company
AMENDED TECHNICAL REPORT
KAMOTO REDEVELOPMENT PROJECT
File reference - 701-001-01-0000-00-CM-0010 Page 137 of 204
4 Acec 1 Diebold 369 Level 369 Level
465 Level 465 Level
632 Level
ShaftBottom
Mwembo
Kumbwa
1 Acec 3 Diebold
4 Acec 4 Acec
2 Acec
1 Flygt
2 Acec
2 Acec
Surface Underground
4 Acec 1 Diebold 369 Level 369 Level
465 Level 465 Level
632 Level
ShaftBottom
Mwembo
Kumbwa
1 Acec 3 Diebold
4 Acec 4 Acec
2 Acec
1 Flygt
2 Acec
2 Acec
Surface Underground
Figure 25-16 Schematic layout of underground dams and pump stations
Service water for the mining operations is small in relation to the inflow of fissure water and can easily be accommodated in the mine design. Return water from backfill operations is also minimal and is allowed for in the pumping system. The upgrading of the pump stations in phases takes cognisance of the water flow requirements and is based on the current condition of the pumps.
25.1.16 Electric power 25.1.16.1 Surfaced infrastructure Kamoto Mine receives all electrical power from Kadi Substation via four dedicated cable feeders at a voltage of 15 kV. Two of the four cable feeders will be replaced with new 3 core/185 mm2 XLPE insulated cable. Each feeder will have a capacity of 11 MVA of power to the shaft area and ensure minimal voltage drop across the length of the cable feeders. A total capacity of approximately 40 MVA at 15 kV is therefore available for the shaft infrastructure. The existing reticulation steps down the voltage to 6,6 kV via four 8 MVA transformers. This provides a capacity limit of 32 MVA at 6.6 kV. It is anticipated that the shaft will run at a maximum demand MVA power of 24 MVA. 25.1.16.2 Underground infrastructure The underground electrical supply is reticulated at 15 kV and 6.6 kV down No.2 Shaft barrel. The distribution switchgear is currently in working condition but will be replaced on an operating expenditure bases. The underground distribution and lighting transformers distribute the voltage to 550 V and 220 V, respectively.
Kamoto Copper Company
AMENDED TECHNICAL REPORT
KAMOTO REDEVELOPMENT PROJECT
File reference - 701-001-01-0000-00-CM-0010 Page 138 of 204
The 369 Level pump station electrical infrastructure will be upgraded to allow for new 3000 hp and 700 hp motor starters. Additionally new motor control centres (MCC) for pumping at 465 Level will be installed to run the ancillary 465 level pumps at 550 V. General lighting and small power will be upgraded at the 369 Level pump station.
25.2 Open pit mining operations 25.2.1 Summary Historically open pit mining in the Kolwezi region was practiced on a large scale, and contributed significantly to the total copper production in the Katanga province and the Copper belt region as a whole. At peak production in the mid 1980’s, the open pit mines produced a total of 8.6 million tonnes of ore annually. The tonnage was extracted from a number of open pits in the area which is summarized as follows:
Mashamba West pit Mashamba East pit Dikuluwe pit Kamoto pit Kamoto North pit KOV pit Mupine pit
These pits were collectively known as the Siege de Kolwezi Mines (SKM). The Dikuluwe and Mashamba pits were collectively called the DIMA pits. Most of the production of these pits ended in the mid 1990’s, due to a lack of funds, and were allowed to flood. The open pit mines produce predominantly oxide ore in contrast to the underground mine’s sulphide ore production. For operating purposes oxide ore from the open pit mining is required by the Luilu metallurgical plant to balance the acid generation of the sulphide ore, in order to achieve an acid neutral plant. As the currently flooded pits will take several years to dewater, additional potential resource areas have had to be identified and explored. Musonoie-T17 pit has been selected for early mining. For the life of mine, the selected mining sequence is:
Musonoie-T17 West pit Mashamba East pit Mashamba West pit Dikuluwe pit
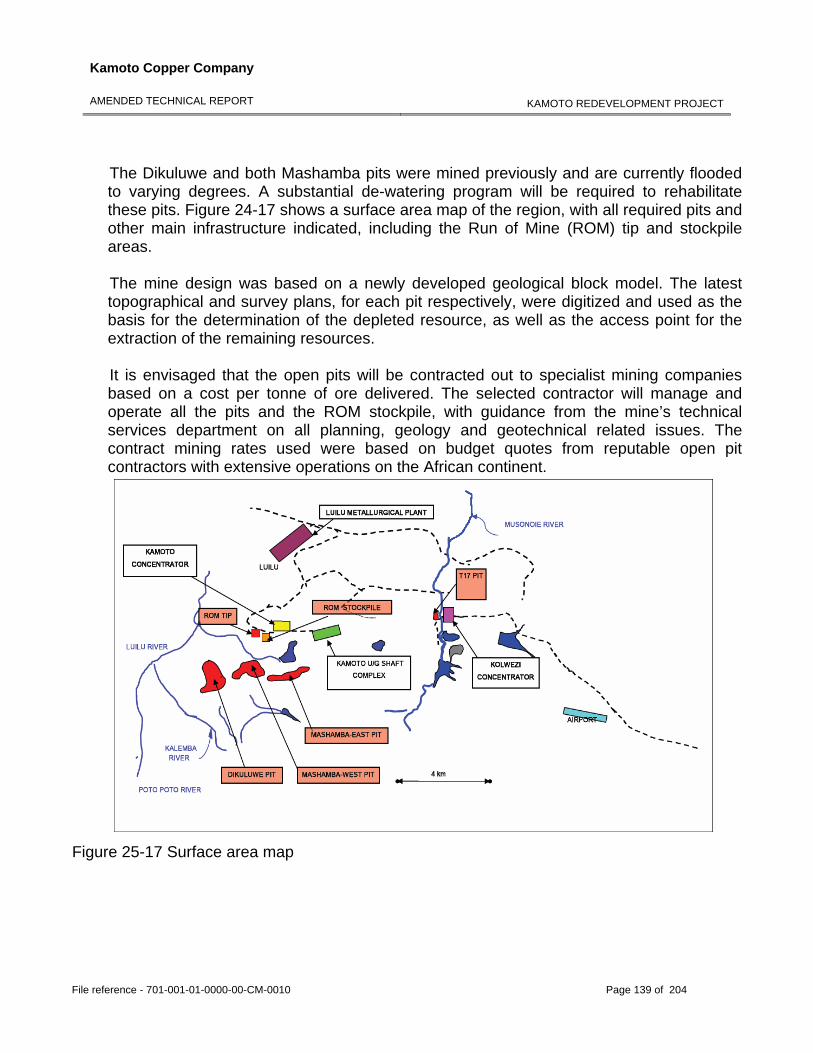
Kamoto Copper Company
AMENDED TECHNICAL REPORT
KAMOTO REDEVELOPMENT PROJECT
File reference - 701-001-01-0000-00-CM-0010 Page 139 of 204
The Dikuluwe and both Mashamba pits were mined previously and are currently flooded to varying degrees. A substantial de-watering program will be required to rehabilitate these pits. Figure 24-17 shows a surface area map of the region, with all required pits and other main infrastructure indicated, including the Run of Mine (ROM) tip and stockpile areas. The mine design was based on a newly developed geological block model. The latest topographical and survey plans, for each pit respectively, were digitized and used as the basis for the determination of the depleted resource, as well as the access point for the extraction of the remaining resources. It is envisaged that the open pits will be contracted out to specialist mining companies based on a cost per tonne of ore delivered. The selected contractor will manage and operate all the pits and the ROM stockpile, with guidance from the mine’s technical services department on all planning, geology and geotechnical related issues. The contract mining rates used were based on budget quotes from reputable open pit contractors with extensive operations on the African continent.
Figure 25-17 Surface area map
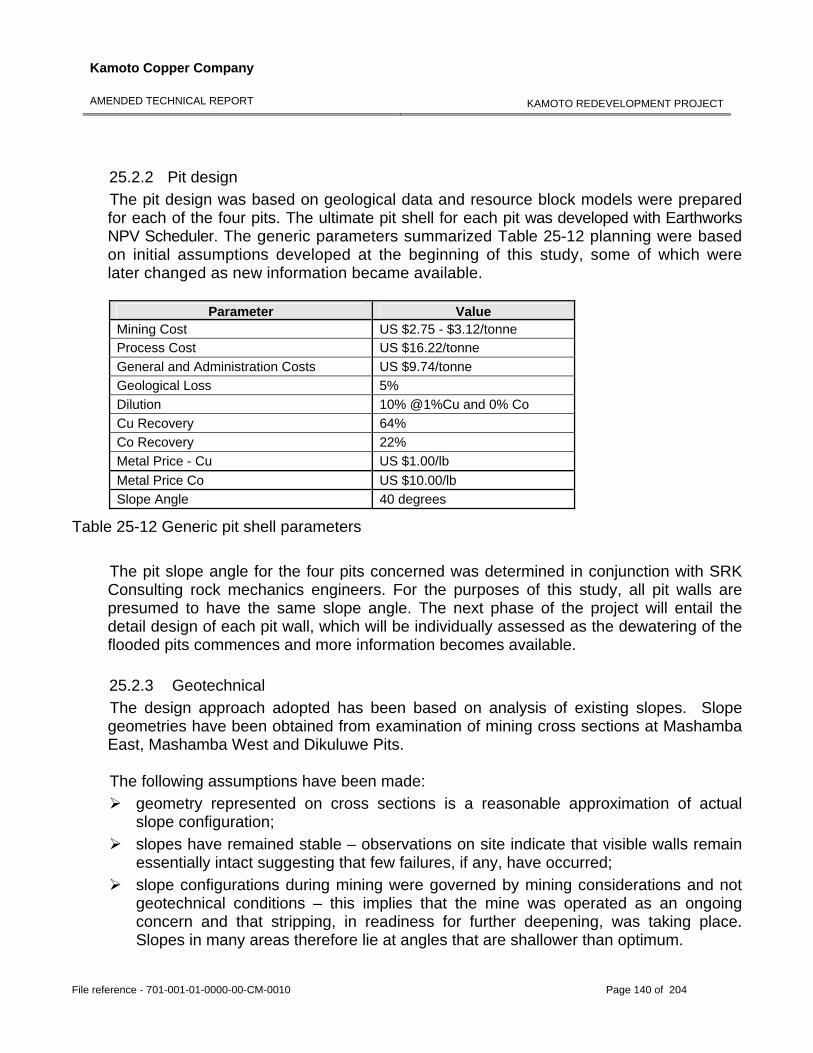
Kamoto Copper Company
AMENDED TECHNICAL REPORT
KAMOTO REDEVELOPMENT PROJECT
File reference - 701-001-01-0000-00-CM-0010 Page 140 of 204
25.2.2 Pit design The pit design was based on geological data and resource block models were prepared for each of the four pits. The ultimate pit shell for each pit was developed with Earthworks NPV Scheduler. The generic parameters summarized Table 25-12 planning were based on initial assumptions developed at the beginning of this study, some of which were later changed as new information became available.
Parameter Value Mining Cost US $2.75 - $3.12/tonne Process Cost US $16.22/tonne General and Administration Costs US $9.74/tonne Geological Loss 5% Dilution 10% @1%Cu and 0% Co Cu Recovery 64% Co Recovery 22% Metal Price - Cu US $1.00/lb Metal Price Co US $10.00/lb Slope Angle 40 degrees
Table 25-12 Generic pit shell parameters
The pit slope angle for the four pits concerned was determined in conjunction with SRK Consulting rock mechanics engineers. For the purposes of this study, all pit walls are presumed to have the same slope angle. The next phase of the project will entail the detail design of each pit wall, which will be individually assessed as the dewatering of the flooded pits commences and more information becomes available. 25.2.3 Geotechnical The design approach adopted has been based on analysis of existing slopes. Slope geometries have been obtained from examination of mining cross sections at Mashamba East, Mashamba West and Dikuluwe Pits. The following assumptions have been made:
geometry represented on cross sections is a reasonable approximation of actual slope configuration;
slopes have remained stable – observations on site indicate that visible walls remain essentially intact suggesting that few failures, if any, have occurred;
slope configurations during mining were governed by mining considerations and not geotechnical conditions – this implies that the mine was operated as an ongoing concern and that stripping, in readiness for further deepening, was taking place. Slopes in many areas therefore lie at angles that are shallower than optimum.
Kamoto Copper Company
AMENDED TECHNICAL REPORT
KAMOTO REDEVELOPMENT PROJECT
File reference - 701-001-01-0000-00-CM-0010 Page 141 of 204
For design purposes, an overall slope angle (including ramps) of 35º is recommended. Slope angles between ramps can be designed at angles up to 40º. Additional geotechnical data will be obtained from detailed face mapping and from borehole information to assist in optimising slope designs. Due to the current flooding of the pits and saturation of pit walls, any pumping and drawdown of in-pit water will most probably induce excess pore pressures in the slopes that could cause sloughing and failure. To prevent this, the system of dewatering wells will be re-commissioned and ground water levels in the slopes will be reduced at a similar rate to surface water levels. 25.2.4 Road design On completion of the optimized pit shell design, the access ramp system is designed into the proposed pit. Haul roads are typically designed according to the minimum operating width of the haul trucks. For this study, it has been assumed that the maximum haul trucks used would be 190t capacity units. The haul road conditions in the pits affected by flooding will be assessed after dewatering. The haul road dimensions and/or position will subsequently be addressed to reduce any risk related to haul road stability. 25.2.5 Waste dump design The three pits that were mined previously all have established waste dumps in close proximity. A new waste dump will be constructed for the Musonoie-T17 pit (T17), to the south of the proposed pit. The dump and stockpile will be constructed in a series of 10 m lifts. The total height shall not exceed three lifts for a total height of 30 m. The waste dump will be constructed by end dumping and allowing the material to assume its natural angle of repose, which is a function of the internal friction angle of the material being dumped. 25.2.6 Mining method It is envisioned that the mining operations at the Project will be carried out using conventional diesel powered mining equipment to excavate the ore and waste. For the purposes of this feasibility study, it has been assumed that all material will require drilling and blasting.
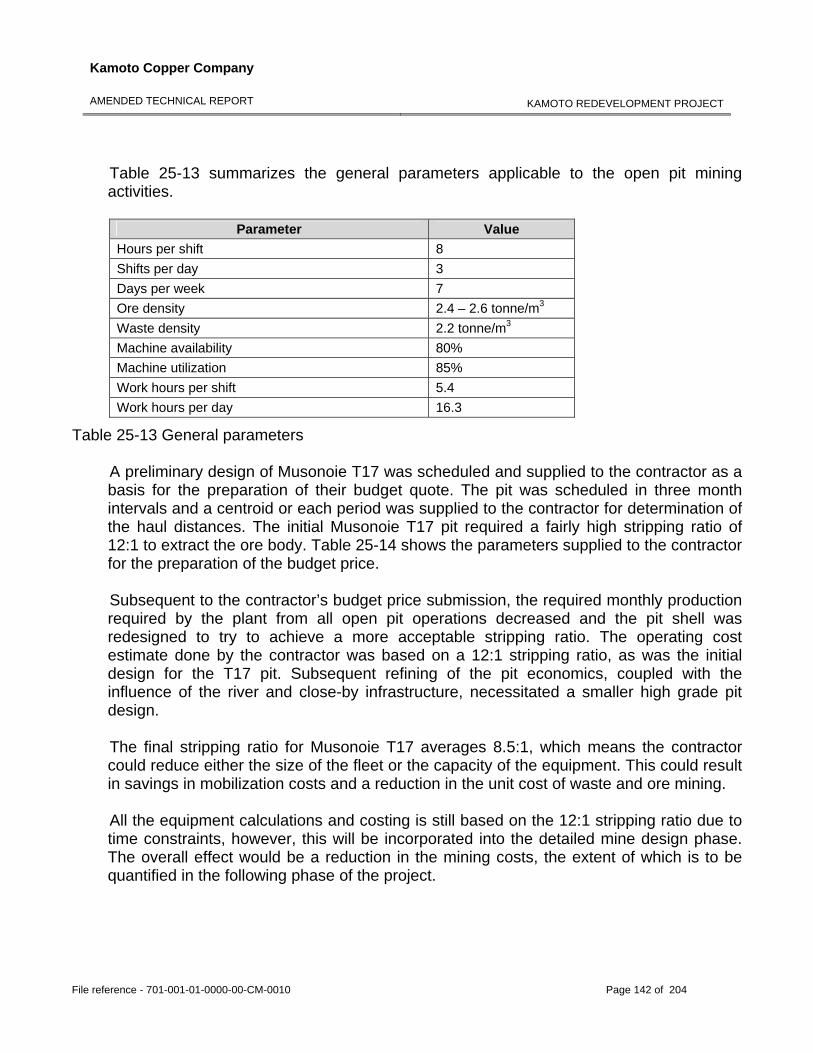
Kamoto Copper Company
AMENDED TECHNICAL REPORT
KAMOTO REDEVELOPMENT PROJECT
File reference - 701-001-01-0000-00-CM-0010 Page 142 of 204
Table 25-13 summarizes the general parameters applicable to the open pit mining activities.
Parameter Value Hours per shift 8 Shifts per day 3 Days per week 7 Ore density 2.4 – 2.6 tonne/m3 Waste density 2.2 tonne/m3 Machine availability 80% Machine utilization 85% Work hours per shift 5.4 Work hours per day 16.3
Table 25-13 General parameters A preliminary design of Musonoie T17 was scheduled and supplied to the contractor as a basis for the preparation of their budget quote. The pit was scheduled in three month intervals and a centroid or each period was supplied to the contractor for determination of the haul distances. The initial Musonoie T17 pit required a fairly high stripping ratio of 12:1 to extract the ore body. Table 25-14 shows the parameters supplied to the contractor for the preparation of the budget price. Subsequent to the contractor’s budget price submission, the required monthly production required by the plant from all open pit operations decreased and the pit shell was redesigned to try to achieve a more acceptable stripping ratio. The operating cost estimate done by the contractor was based on a 12:1 stripping ratio, as was the initial design for the T17 pit. Subsequent refining of the pit economics, coupled with the influence of the river and close-by infrastructure, necessitated a smaller high grade pit design. The final stripping ratio for Musonoie T17 averages 8.5:1, which means the contractor could reduce either the size of the fleet or the capacity of the equipment. This could result in savings in mobilization costs and a reduction in the unit cost of waste and ore mining. All the equipment calculations and costing is still based on the 12:1 stripping ratio due to time constraints, however, this will be incorporated into the detailed mine design phase. The overall effect would be a reduction in the mining costs, the extent of which is to be quantified in the following phase of the project.
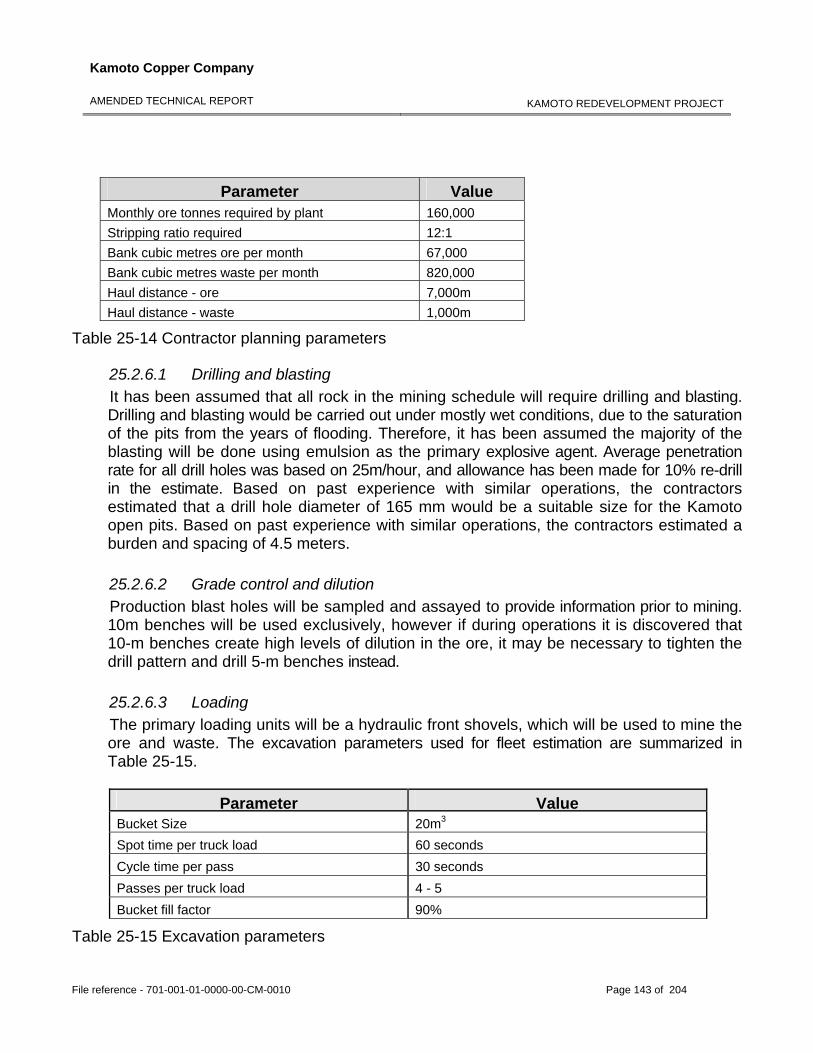
Kamoto Copper Company
AMENDED TECHNICAL REPORT
KAMOTO REDEVELOPMENT PROJECT
File reference - 701-001-01-0000-00-CM-0010 Page 143 of 204
Parameter Value Monthly ore tonnes required by plant 160,000 Stripping ratio required 12:1 Bank cubic metres ore per month 67,000 Bank cubic metres waste per month 820,000 Haul distance - ore 7,000m Haul distance - waste 1,000m
Table 25-14 Contractor planning parameters
25.2.6.1 Drilling and blasting It has been assumed that all rock in the mining schedule will require drilling and blasting. Drilling and blasting would be carried out under mostly wet conditions, due to the saturation of the pits from the years of flooding. Therefore, it has been assumed the majority of the blasting will be done using emulsion as the primary explosive agent. Average penetration rate for all drill holes was based on 25m/hour, and allowance has been made for 10% re-drill in the estimate. Based on past experience with similar operations, the contractors estimated that a drill hole diameter of 165 mm would be a suitable size for the Kamoto open pits. Based on past experience with similar operations, the contractors estimated a burden and spacing of 4.5 meters. 25.2.6.2 Grade control and dilution Production blast holes will be sampled and assayed to provide information prior to mining. 10m benches will be used exclusively, however if during operations it is discovered that 10-m benches create high levels of dilution in the ore, it may be necessary to tighten the drill pattern and drill 5-m benches instead. 25.2.6.3 Loading The primary loading units will be a hydraulic front shovels, which will be used to mine the ore and waste. The excavation parameters used for fleet estimation are summarized in Table 25-15.
Parameter Value Bucket Size 20m3 Spot time per truck load 60 seconds Cycle time per pass 30 seconds Passes per truck load 4 - 5 Bucket fill factor 90%
Table 25-15 Excavation parameters
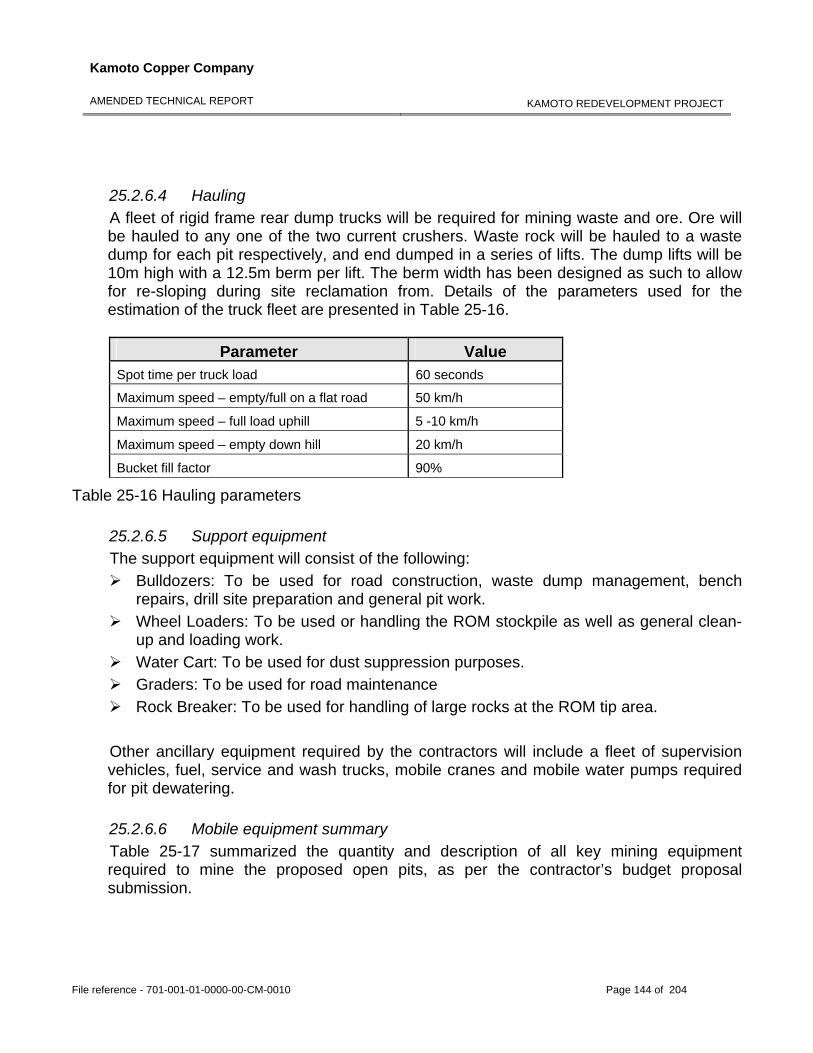
Kamoto Copper Company
AMENDED TECHNICAL REPORT
KAMOTO REDEVELOPMENT PROJECT
File reference - 701-001-01-0000-00-CM-0010 Page 144 of 204
25.2.6.4 Hauling A fleet of rigid frame rear dump trucks will be required for mining waste and ore. Ore will be hauled to any one of the two current crushers. Waste rock will be hauled to a waste dump for each pit respectively, and end dumped in a series of lifts. The dump lifts will be 10m high with a 12.5m berm per lift. The berm width has been designed as such to allow for re-sloping during site reclamation from. Details of the parameters used for the estimation of the truck fleet are presented in Table 25-16.
Parameter ValueSpot time per truck load 60 seconds
Maximum speed – empty/full on a flat road 50 km/h
Maximum speed – full load uphill 5 -10 km/h
Maximum speed – empty down hill 20 km/h
Bucket fill factor 90%
Table 25-16 Hauling parameters
25.2.6.5 Support equipment The support equipment will consist of the following:
Bulldozers: To be used for road construction, waste dump management, bench repairs, drill site preparation and general pit work.
Wheel Loaders: To be used or handling the ROM stockpile as well as general clean-up and loading work.
Water Cart: To be used for dust suppression purposes. Graders: To be used for road maintenance Rock Breaker: To be used for handling of large rocks at the ROM tip area.
Other ancillary equipment required by the contractors will include a fleet of supervision vehicles, fuel, service and wash trucks, mobile cranes and mobile water pumps required for pit dewatering. 25.2.6.6 Mobile equipment summary Table 25-17 summarized the quantity and description of all key mining equipment required to mine the proposed open pits, as per the contractor’s budget proposal submission.
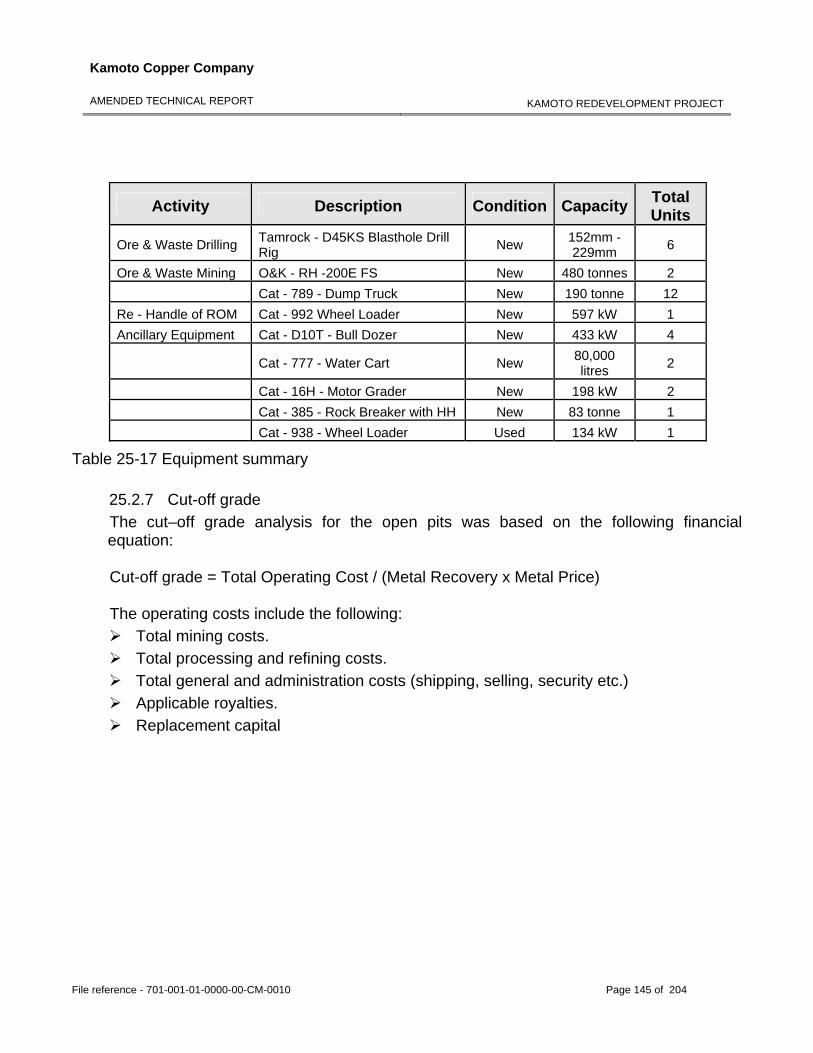
Kamoto Copper Company
AMENDED TECHNICAL REPORT
KAMOTO REDEVELOPMENT PROJECT
File reference - 701-001-01-0000-00-CM-0010 Page 145 of 204
Activity Description Condition Capacity Total Units
Ore & Waste Drilling Tamrock - D45KS Blasthole Drill Rig New 152mm -
229mm 6
Ore & Waste Mining O&K - RH -200E FS New 480 tonnes 2 Cat - 789 - Dump Truck New 190 tonne 12 Re - Handle of ROM Cat - 992 Wheel Loader New 597 kW 1 Ancillary Equipment Cat - D10T - Bull Dozer New 433 kW 4
Cat - 777 - Water Cart New 80,000 litres 2
Cat - 16H - Motor Grader New 198 kW 2 Cat - 385 - Rock Breaker with HH New 83 tonne 1 Cat - 938 - Wheel Loader Used 134 kW 1
Table 25-17 Equipment summary 25.2.7 Cut-off grade The cut–off grade analysis for the open pits was based on the following financial equation: Cut-off grade = Total Operating Cost / (Metal Recovery x Metal Price) The operating costs include the following:
Total mining costs. Total processing and refining costs. Total general and administration costs (shipping, selling, security etc.) Applicable royalties. Replacement capital
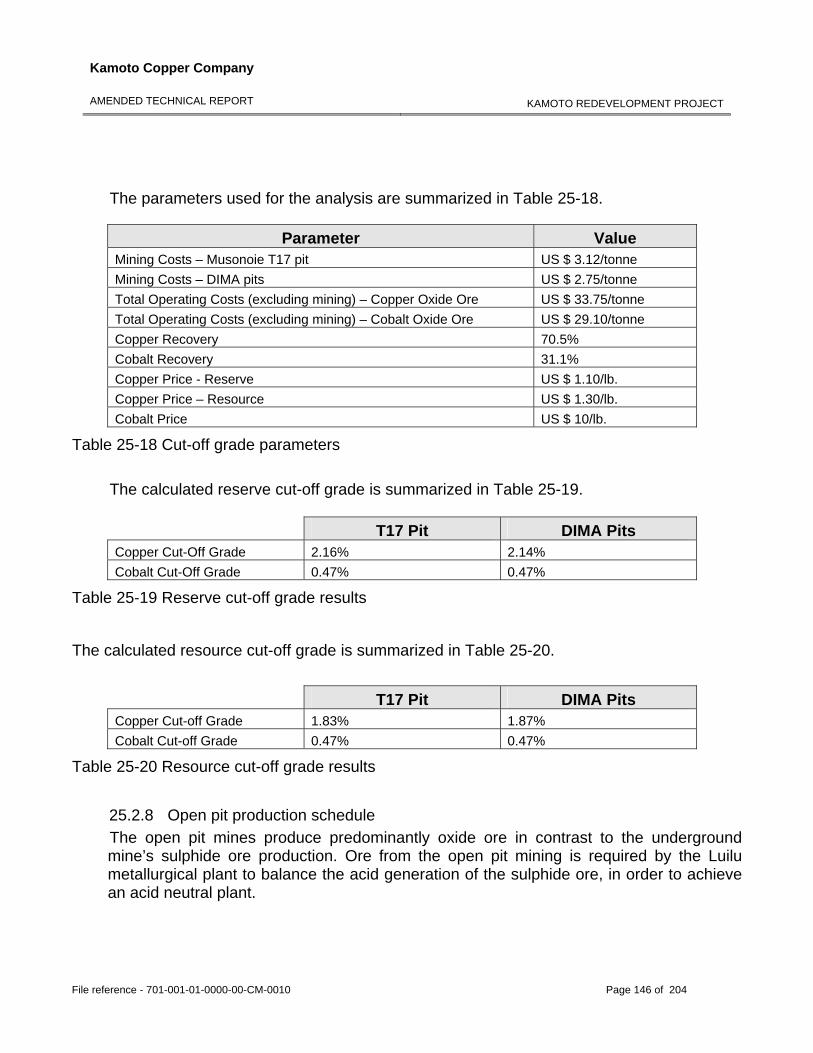
Kamoto Copper Company
AMENDED TECHNICAL REPORT
KAMOTO REDEVELOPMENT PROJECT
File reference - 701-001-01-0000-00-CM-0010 Page 146 of 204
The parameters used for the analysis are summarized in Table 25-18.
Parameter Value Mining Costs – Musonoie T17 pit US $ 3.12/tonne Mining Costs – DIMA pits US $ 2.75/tonne Total Operating Costs (excluding mining) – Copper Oxide Ore US $ 33.75/tonne Total Operating Costs (excluding mining) – Cobalt Oxide Ore US $ 29.10/tonne Copper Recovery 70.5% Cobalt Recovery 31.1% Copper Price - Reserve US $ 1.10/lb. Copper Price – Resource US $ 1.30/lb. Cobalt Price US $ 10/lb.
Table 25-18 Cut-off grade parameters
The calculated reserve cut-off grade is summarized in Table 25-19.
T17 Pit DIMA Pits Copper Cut-Off Grade 2.16% 2.14% Cobalt Cut-Off Grade 0.47% 0.47%
Table 25-19 Reserve cut-off grade results The calculated resource cut-off grade is summarized in Table 25-20.
T17 Pit DIMA Pits Copper Cut-off Grade 1.83% 1.87% Cobalt Cut-off Grade 0.47% 0.47%
Table 25-20 Resource cut-off grade results
25.2.8 Open pit production schedule The open pit mines produce predominantly oxide ore in contrast to the underground mine’s sulphide ore production. Ore from the open pit mining is required by the Luilu metallurgical plant to balance the acid generation of the sulphide ore, in order to achieve an acid neutral plant.
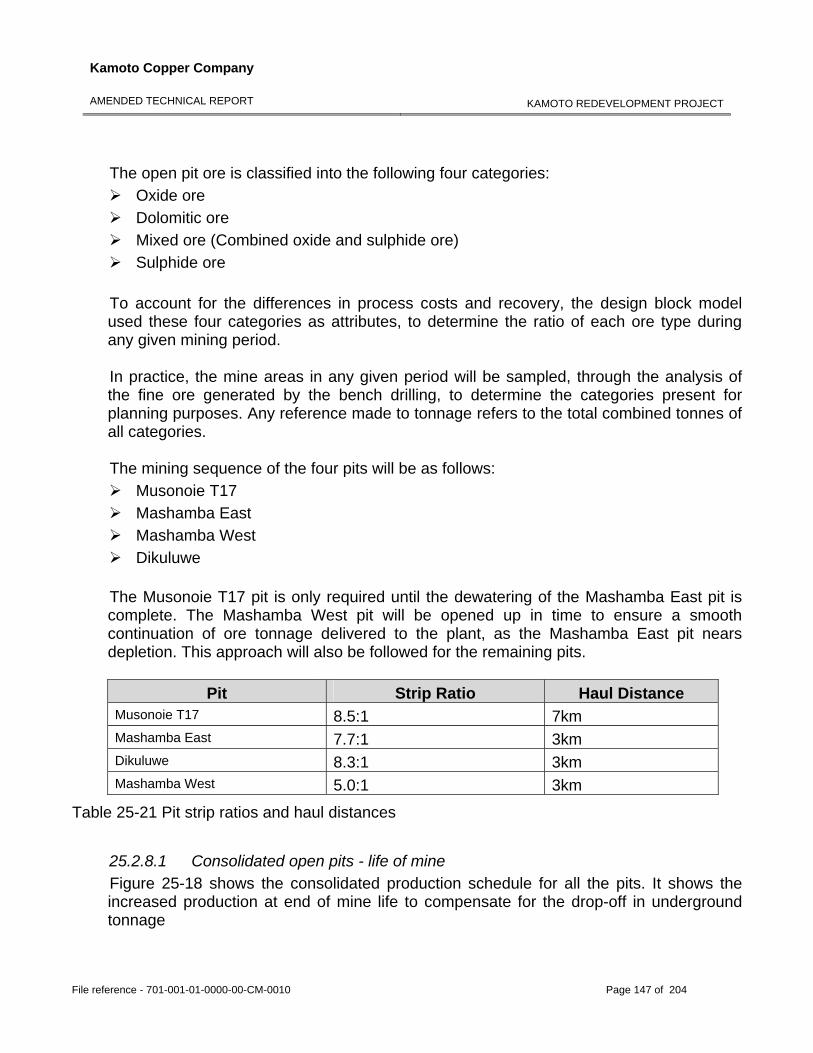
Kamoto Copper Company
AMENDED TECHNICAL REPORT
KAMOTO REDEVELOPMENT PROJECT
File reference - 701-001-01-0000-00-CM-0010 Page 147 of 204
The open pit ore is classified into the following four categories: Oxide ore Dolomitic ore Mixed ore (Combined oxide and sulphide ore) Sulphide ore
To account for the differences in process costs and recovery, the design block model used these four categories as attributes, to determine the ratio of each ore type during any given mining period. In practice, the mine areas in any given period will be sampled, through the analysis of the fine ore generated by the bench drilling, to determine the categories present for planning purposes. Any reference made to tonnage refers to the total combined tonnes of all categories. The mining sequence of the four pits will be as follows:
Musonoie T17 Mashamba East Mashamba West Dikuluwe
The Musonoie T17 pit is only required until the dewatering of the Mashamba East pit is complete. The Mashamba West pit will be opened up in time to ensure a smooth continuation of ore tonnage delivered to the plant, as the Mashamba East pit nears depletion. This approach will also be followed for the remaining pits.
Pit Strip Ratio Haul Distance Musonoie T17 8.5:1 7km Mashamba East 7.7:1 3km Dikuluwe 8.3:1 3km Mashamba West 5.0:1 3km
Table 25-21 Pit strip ratios and haul distances
25.2.8.1 Consolidated open pits - life of mine Figure 25-18 shows the consolidated production schedule for all the pits. It shows the increased production at end of mine life to compensate for the drop-off in underground tonnage
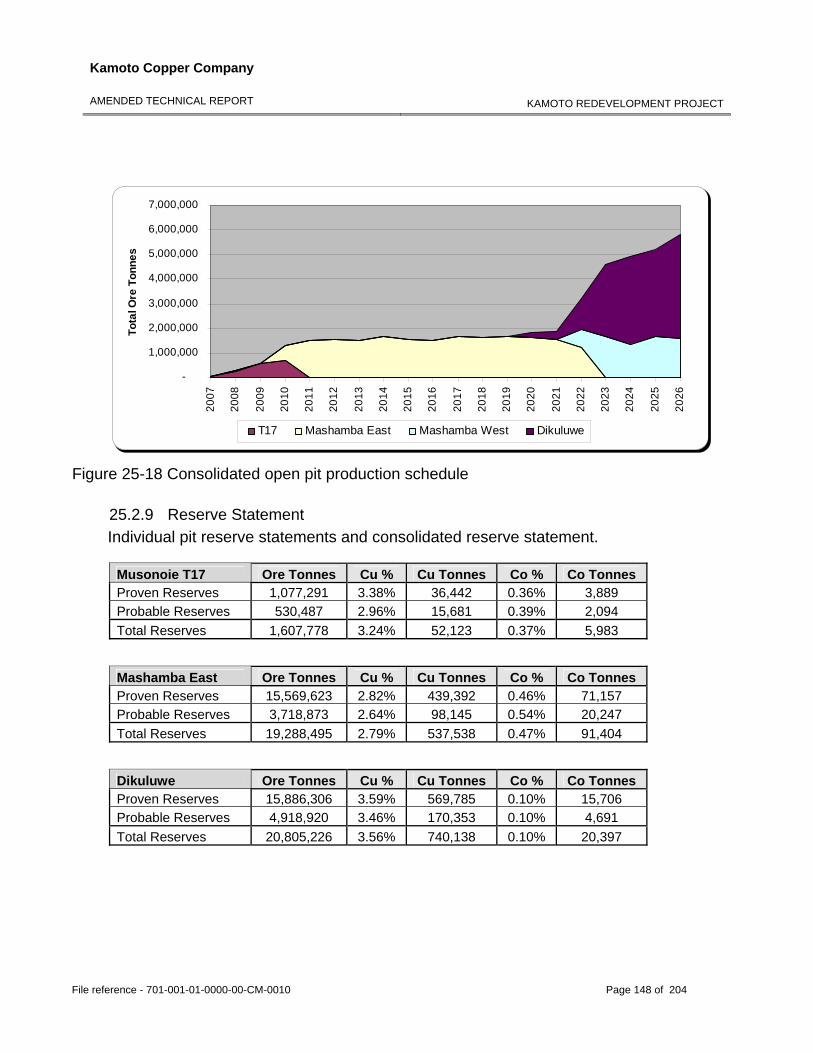
Kamoto Copper Company
AMENDED TECHNICAL REPORT
KAMOTO REDEVELOPMENT PROJECT
File reference - 701-001-01-0000-00-CM-0010 Page 148 of 204
-
1,000,000
2,000,000
3,000,000
4,000,000
5,000,000
6,000,000
7,000,00020
07
2008
2009
2010
2011
2012
2013
2014
2015
2016
2017
2018
2019
2020
2021
2022
2023
2024
2025
2026
Tota
l Ore
Ton
nes
T17 Mashamba East Mashamba West Dikuluwe
Figure 25-18 Consolidated open pit production schedule
25.2.9 Reserve Statement Individual pit reserve statements and consolidated reserve statement.
Musonoie T17 Ore Tonnes Cu % Cu Tonnes Co % Co Tonnes Proven Reserves 1,077,291 3.38% 36,442 0.36% 3,889 Probable Reserves 530,487 2.96% 15,681 0.39% 2,094 Total Reserves 1,607,778 3.24% 52,123 0.37% 5,983
Mashamba East Ore Tonnes Cu % Cu Tonnes Co % Co Tonnes Proven Reserves 15,569,623 2.82% 439,392 0.46% 71,157 Probable Reserves 3,718,873 2.64% 98,145 0.54% 20,247 Total Reserves 19,288,495 2.79% 537,538 0.47% 91,404
Dikuluwe Ore Tonnes Cu % Cu Tonnes Co % Co Tonnes Proven Reserves 15,886,306 3.59% 569,785 0.10% 15,706 Probable Reserves 4,918,920 3.46% 170,353 0.10% 4,691 Total Reserves 20,805,226 3.56% 740,138 0.10% 20,397
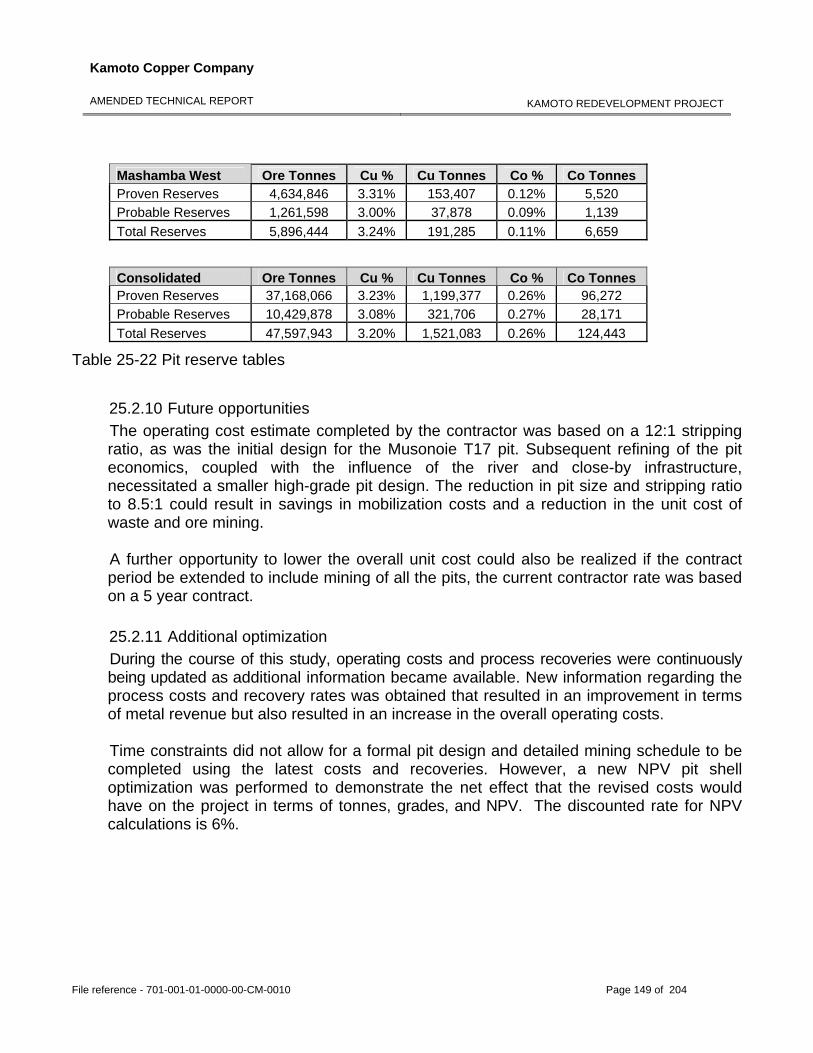
Kamoto Copper Company
AMENDED TECHNICAL REPORT
KAMOTO REDEVELOPMENT PROJECT
File reference - 701-001-01-0000-00-CM-0010 Page 149 of 204
Mashamba West Ore Tonnes Cu % Cu Tonnes Co % Co Tonnes Proven Reserves 4,634,846 3.31% 153,407 0.12% 5,520 Probable Reserves 1,261,598 3.00% 37,878 0.09% 1,139 Total Reserves 5,896,444 3.24% 191,285 0.11% 6,659
Consolidated Ore Tonnes Cu % Cu Tonnes Co % Co Tonnes Proven Reserves 37,168,066 3.23% 1,199,377 0.26% 96,272 Probable Reserves 10,429,878 3.08% 321,706 0.27% 28,171 Total Reserves 47,597,943 3.20% 1,521,083 0.26% 124,443
Table 25-22 Pit reserve tables
25.2.10 Future opportunities The operating cost estimate completed by the contractor was based on a 12:1 stripping ratio, as was the initial design for the Musonoie T17 pit. Subsequent refining of the pit economics, coupled with the influence of the river and close-by infrastructure, necessitated a smaller high-grade pit design. The reduction in pit size and stripping ratio to 8.5:1 could result in savings in mobilization costs and a reduction in the unit cost of waste and ore mining. A further opportunity to lower the overall unit cost could also be realized if the contract period be extended to include mining of all the pits, the current contractor rate was based on a 5 year contract. 25.2.11 Additional optimization During the course of this study, operating costs and process recoveries were continuously being updated as additional information became available. New information regarding the process costs and recovery rates was obtained that resulted in an improvement in terms of metal revenue but also resulted in an increase in the overall operating costs. Time constraints did not allow for a formal pit design and detailed mining schedule to be completed using the latest costs and recoveries. However, a new NPV pit shell optimization was performed to demonstrate the net effect that the revised costs would have on the project in terms of tonnes, grades, and NPV. The discounted rate for NPV calculations is 6%.
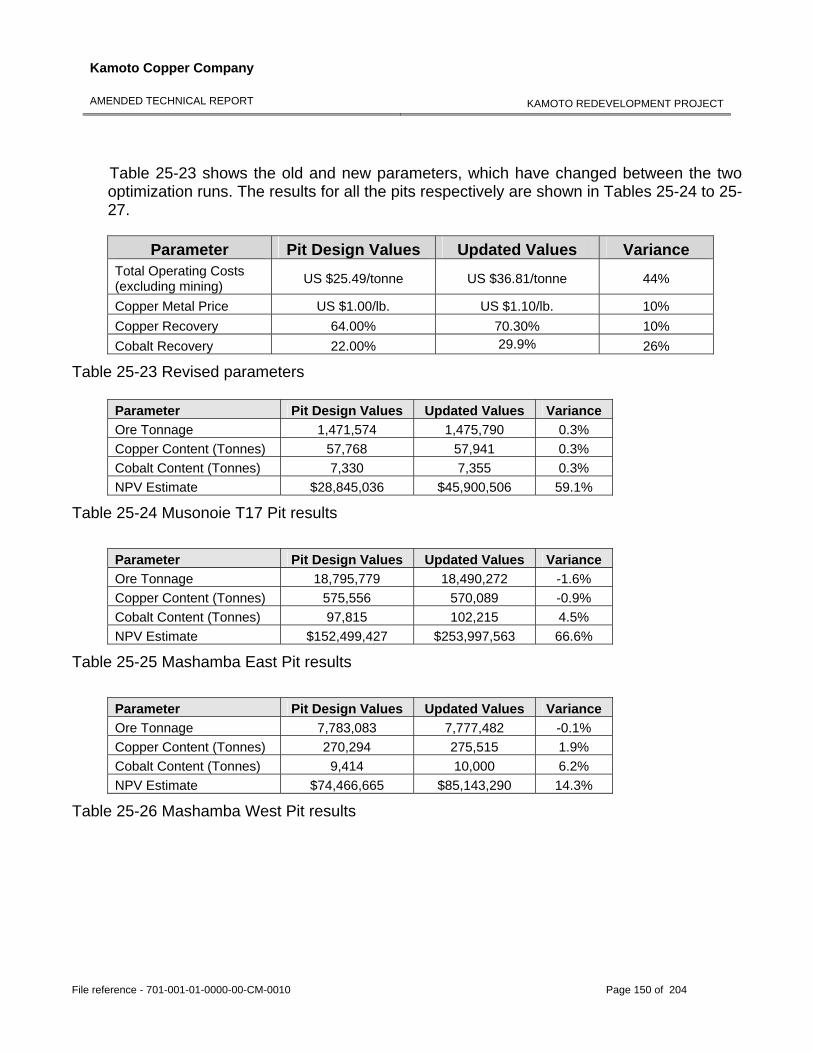
Kamoto Copper Company
AMENDED TECHNICAL REPORT
KAMOTO REDEVELOPMENT PROJECT
File reference - 701-001-01-0000-00-CM-0010 Page 150 of 204
Table 25-23 shows the old and new parameters, which have changed between the two optimization runs. The results for all the pits respectively are shown in Tables 25-24 to 25-27.
Parameter Pit Design Values Updated Values Variance
Total Operating Costs (excluding mining) US $25.49/tonne US $36.81/tonne 44%
Copper Metal Price US $1.00/lb. US $1.10/lb. 10% Copper Recovery 64.00% 70.30% 10% Cobalt Recovery 22.00% 29.9% 26%
Table 25-23 Revised parameters Parameter Pit Design Values Updated Values Variance Ore Tonnage 1,471,574 1,475,790 0.3% Copper Content (Tonnes) 57,768 57,941 0.3% Cobalt Content (Tonnes) 7,330 7,355 0.3% NPV Estimate $28,845,036 $45,900,506 59.1%
Table 25-24 Musonoie T17 Pit results
Parameter Pit Design Values Updated Values Variance Ore Tonnage 18,795,779 18,490,272 -1.6% Copper Content (Tonnes) 575,556 570,089 -0.9% Cobalt Content (Tonnes) 97,815 102,215 4.5% NPV Estimate $152,499,427 $253,997,563 66.6%
Table 25-25 Mashamba East Pit results
Parameter Pit Design Values Updated Values Variance Ore Tonnage 7,783,083 7,777,482 -0.1% Copper Content (Tonnes) 270,294 275,515 1.9% Cobalt Content (Tonnes) 9,414 10,000 6.2% NPV Estimate $74,466,665 $85,143,290 14.3%
Table 25-26 Mashamba West Pit results
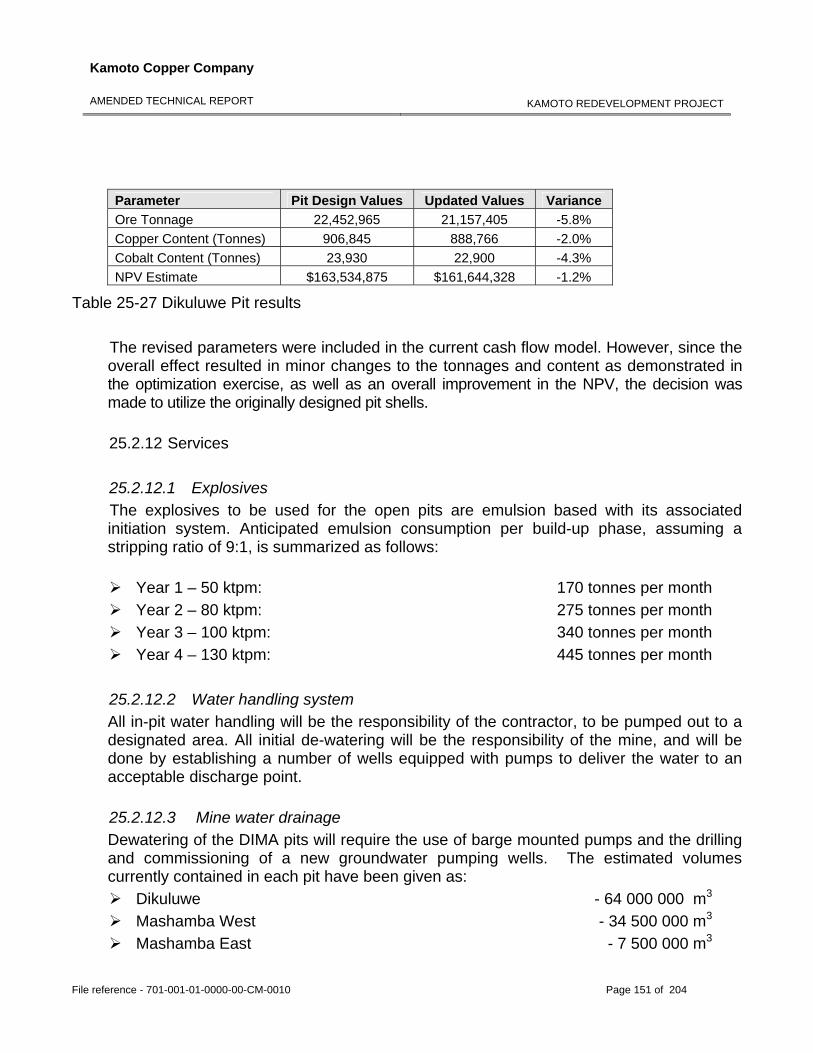
Kamoto Copper Company
AMENDED TECHNICAL REPORT
KAMOTO REDEVELOPMENT PROJECT
File reference - 701-001-01-0000-00-CM-0010 Page 151 of 204
Parameter Pit Design Values Updated Values Variance Ore Tonnage 22,452,965 21,157,405 -5.8% Copper Content (Tonnes) 906,845 888,766 -2.0% Cobalt Content (Tonnes) 23,930 22,900 -4.3% NPV Estimate $163,534,875 $161,644,328 -1.2%
Table 25-27 Dikuluwe Pit results
The revised parameters were included in the current cash flow model. However, since the overall effect resulted in minor changes to the tonnages and content as demonstrated in the optimization exercise, as well as an overall improvement in the NPV, the decision was made to utilize the originally designed pit shells. 25.2.12 Services 25.2.12.1 Explosives The explosives to be used for the open pits are emulsion based with its associated initiation system. Anticipated emulsion consumption per build-up phase, assuming a stripping ratio of 9:1, is summarized as follows:
Year 1 – 50 ktpm: 170 tonnes per month Year 2 – 80 ktpm: 275 tonnes per month Year 3 – 100 ktpm: 340 tonnes per month Year 4 – 130 ktpm: 445 tonnes per month
25.2.12.2 Water handling system All in-pit water handling will be the responsibility of the contractor, to be pumped out to a designated area. All initial de-watering will be the responsibility of the mine, and will be done by establishing a number of wells equipped with pumps to deliver the water to an acceptable discharge point. 25.2.12.3 Mine water drainage Dewatering of the DIMA pits will require the use of barge mounted pumps and the drilling and commissioning of a new groundwater pumping wells. The estimated volumes currently contained in each pit have been given as:
Dikuluwe - 64 000 000 m3 Mashamba West - 34 500 000 m3 Mashamba East - 7 500 000 m3
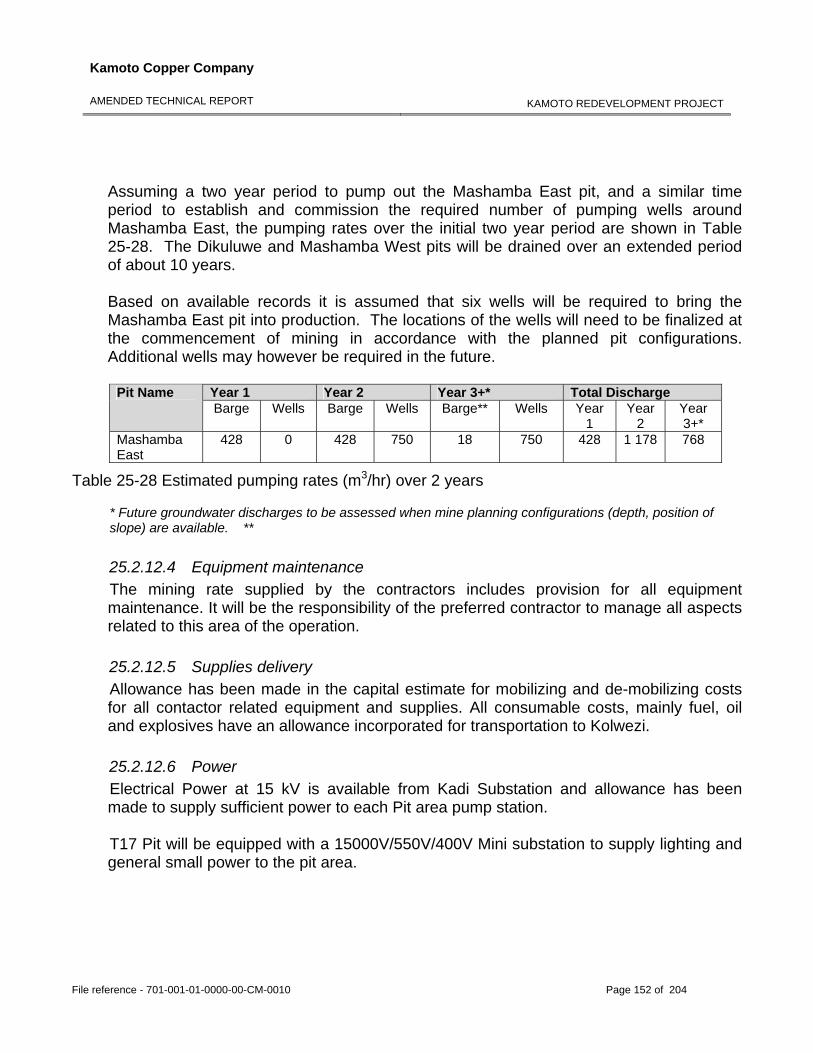
Kamoto Copper Company
AMENDED TECHNICAL REPORT
KAMOTO REDEVELOPMENT PROJECT
File reference - 701-001-01-0000-00-CM-0010 Page 152 of 204
Assuming a two year period to pump out the Mashamba East pit, and a similar time period to establish and commission the required number of pumping wells around Mashamba East, the pumping rates over the initial two year period are shown in Table 25-28. The Dikuluwe and Mashamba West pits will be drained over an extended period of about 10 years. Based on available records it is assumed that six wells will be required to bring the Mashamba East pit into production. The locations of the wells will need to be finalized at the commencement of mining in accordance with the planned pit configurations. Additional wells may however be required in the future.
Year 1 Year 2 Year 3+* Total Discharge Pit Name Barge Wells Barge Wells Barge** Wells Year
1 Year
2 Year 3+*
Mashamba East
428 0 428 750 18 750 428 1 178 768
Table 25-28 Estimated pumping rates (m3/hr) over 2 years * Future groundwater discharges to be assessed when mine planning configurations (depth, position of slope) are available. ** 25.2.12.4 Equipment maintenance The mining rate supplied by the contractors includes provision for all equipment maintenance. It will be the responsibility of the preferred contractor to manage all aspects related to this area of the operation. 25.2.12.5 Supplies delivery Allowance has been made in the capital estimate for mobilizing and de-mobilizing costs for all contactor related equipment and supplies. All consumable costs, mainly fuel, oil and explosives have an allowance incorporated for transportation to Kolwezi. 25.2.12.6 Power Electrical Power at 15 kV is available from Kadi Substation and allowance has been made to supply sufficient power to each Pit area pump station. T17 Pit will be equipped with a 15000V/550V/400V Mini substation to supply lighting and general small power to the pit area.
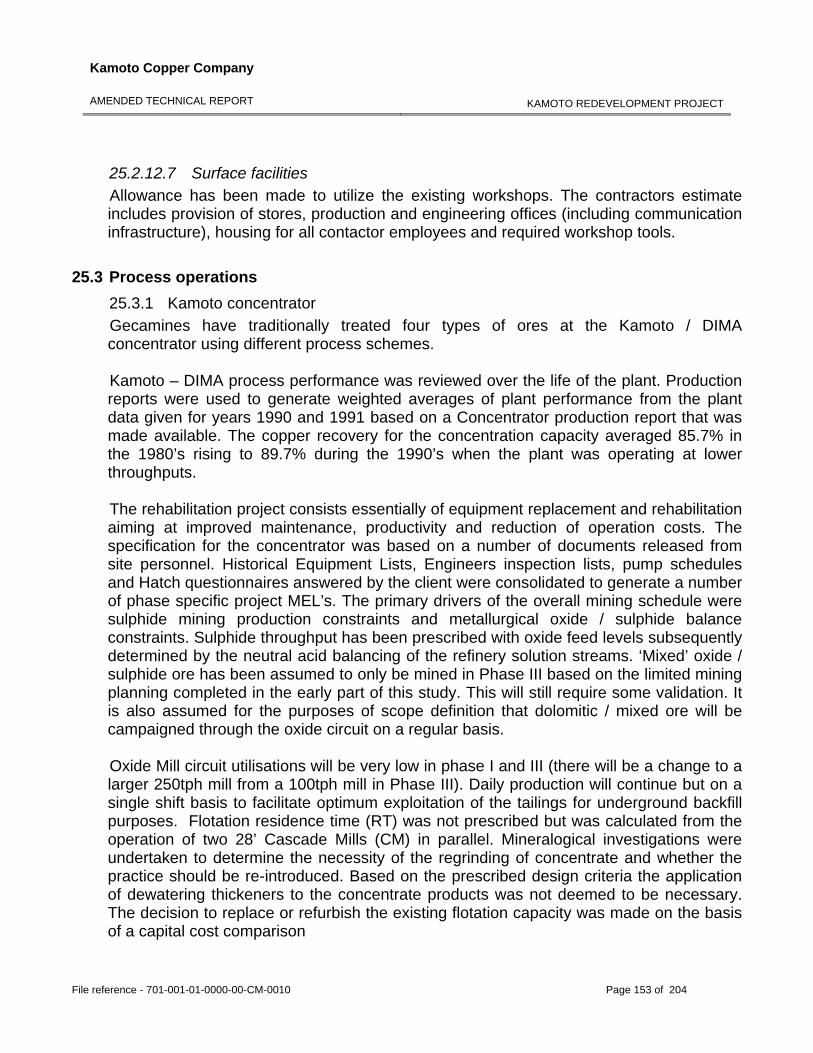
Kamoto Copper Company
AMENDED TECHNICAL REPORT
KAMOTO REDEVELOPMENT PROJECT
File reference - 701-001-01-0000-00-CM-0010 Page 153 of 204
25.2.12.7 Surface facilities Allowance has been made to utilize the existing workshops. The contractors estimate includes provision of stores, production and engineering offices (including communication infrastructure), housing for all contactor employees and required workshop tools.
25.3 Process operations
25.3.1 Kamoto concentrator Gecamines have traditionally treated four types of ores at the Kamoto / DIMA concentrator using different process schemes. Kamoto – DIMA process performance was reviewed over the life of the plant. Production reports were used to generate weighted averages of plant performance from the plant data given for years 1990 and 1991 based on a Concentrator production report that was made available. The copper recovery for the concentration capacity averaged 85.7% in the 1980’s rising to 89.7% during the 1990’s when the plant was operating at lower throughputs. The rehabilitation project consists essentially of equipment replacement and rehabilitation aiming at improved maintenance, productivity and reduction of operation costs. The specification for the concentrator was based on a number of documents released from site personnel. Historical Equipment Lists, Engineers inspection lists, pump schedules and Hatch questionnaires answered by the client were consolidated to generate a number of phase specific project MEL’s. The primary drivers of the overall mining schedule were sulphide mining production constraints and metallurgical oxide / sulphide balance constraints. Sulphide throughput has been prescribed with oxide feed levels subsequently determined by the neutral acid balancing of the refinery solution streams. ‘Mixed’ oxide / sulphide ore has been assumed to only be mined in Phase III based on the limited mining planning completed in the early part of this study. This will still require some validation. It is also assumed for the purposes of scope definition that dolomitic / mixed ore will be campaigned through the oxide circuit on a regular basis. Oxide Mill circuit utilisations will be very low in phase I and III (there will be a change to a larger 250tph mill from a 100tph mill in Phase III). Daily production will continue but on a single shift basis to facilitate optimum exploitation of the tailings for underground backfill purposes. Flotation residence time (RT) was not prescribed but was calculated from the operation of two 28’ Cascade Mills (CM) in parallel. Mineralogical investigations were undertaken to determine the necessity of the regrinding of concentrate and whether the practice should be re-introduced. Based on the prescribed design criteria the application of dewatering thickeners to the concentrate products was not deemed to be necessary. The decision to replace or refurbish the existing flotation capacity was made on the basis of a capital cost comparison
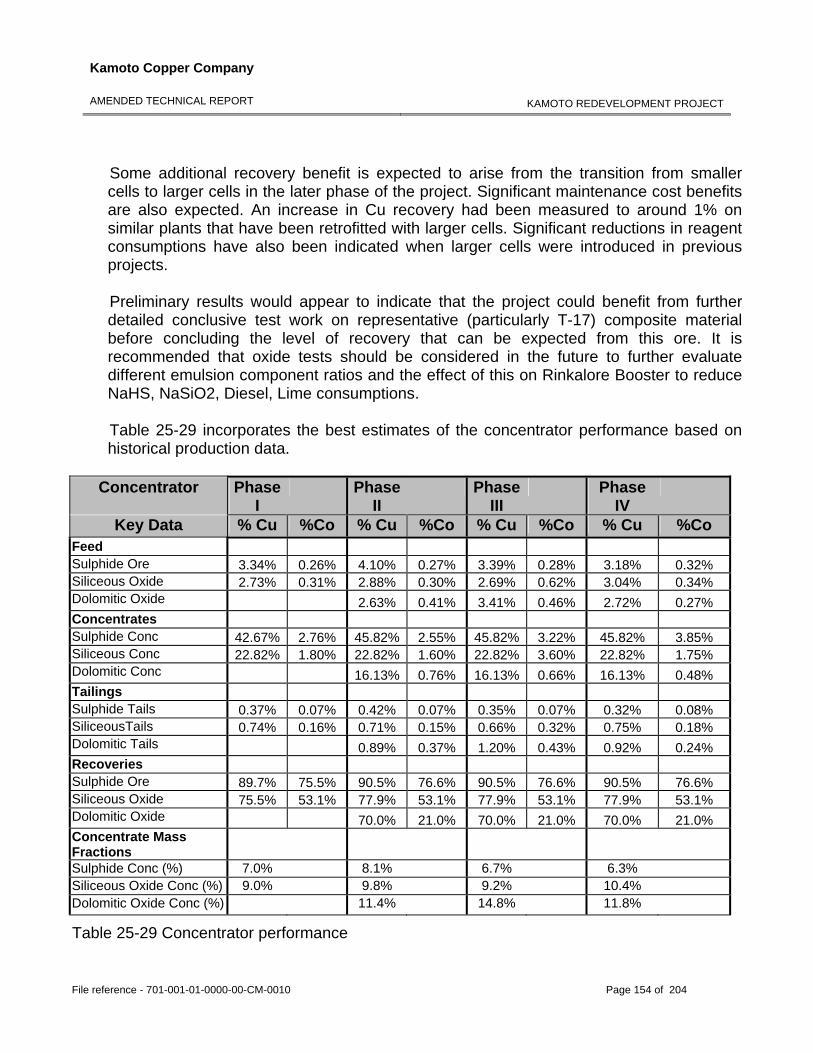
Kamoto Copper Company
AMENDED TECHNICAL REPORT
KAMOTO REDEVELOPMENT PROJECT
File reference - 701-001-01-0000-00-CM-0010 Page 154 of 204
Some additional recovery benefit is expected to arise from the transition from smaller cells to larger cells in the later phase of the project. Significant maintenance cost benefits are also expected. An increase in Cu recovery had been measured to around 1% on similar plants that have been retrofitted with larger cells. Significant reductions in reagent consumptions have also been indicated when larger cells were introduced in previous projects. Preliminary results would appear to indicate that the project could benefit from further detailed conclusive test work on representative (particularly T-17) composite material before concluding the level of recovery that can be expected from this ore. It is recommended that oxide tests should be considered in the future to further evaluate different emulsion component ratios and the effect of this on Rinkalore Booster to reduce NaHS, NaSiO2, Diesel, Lime consumptions. Table 25-29 incorporates the best estimates of the concentrator performance based on historical production data.
Concentrator Phase I
Phase II
Phase III
Phase IV
Key Data % Cu %Co % Cu %Co % Cu %Co % Cu %Co Feed Sulphide Ore 3.34% 0.26% 4.10% 0.27% 3.39% 0.28% 3.18% 0.32% Siliceous Oxide 2.73% 0.31% 2.88% 0.30% 2.69% 0.62% 3.04% 0.34% Dolomitic Oxide 2.63% 0.41% 3.41% 0.46% 2.72% 0.27% Concentrates Sulphide Conc 42.67% 2.76% 45.82% 2.55% 45.82% 3.22% 45.82% 3.85% Siliceous Conc 22.82% 1.80% 22.82% 1.60% 22.82% 3.60% 22.82% 1.75% Dolomitic Conc 16.13% 0.76% 16.13% 0.66% 16.13% 0.48% Tailings Sulphide Tails 0.37% 0.07% 0.42% 0.07% 0.35% 0.07% 0.32% 0.08% SiliceousTails 0.74% 0.16% 0.71% 0.15% 0.66% 0.32% 0.75% 0.18% Dolomitic Tails 0.89% 0.37% 1.20% 0.43% 0.92% 0.24% Recoveries Sulphide Ore 89.7% 75.5% 90.5% 76.6% 90.5% 76.6% 90.5% 76.6% Siliceous Oxide 75.5% 53.1% 77.9% 53.1% 77.9% 53.1% 77.9% 53.1% Dolomitic Oxide 70.0% 21.0% 70.0% 21.0% 70.0% 21.0% Concentrate Mass Fractions
Sulphide Conc (%) 7.0% 8.1% 6.7% 6.3% Siliceous Oxide Conc (%) 9.0% 9.8% 9.2% 10.4% Dolomitic Oxide Conc (%) 11.4% 14.8% 11.8%
Table 25-29 Concentrator performance
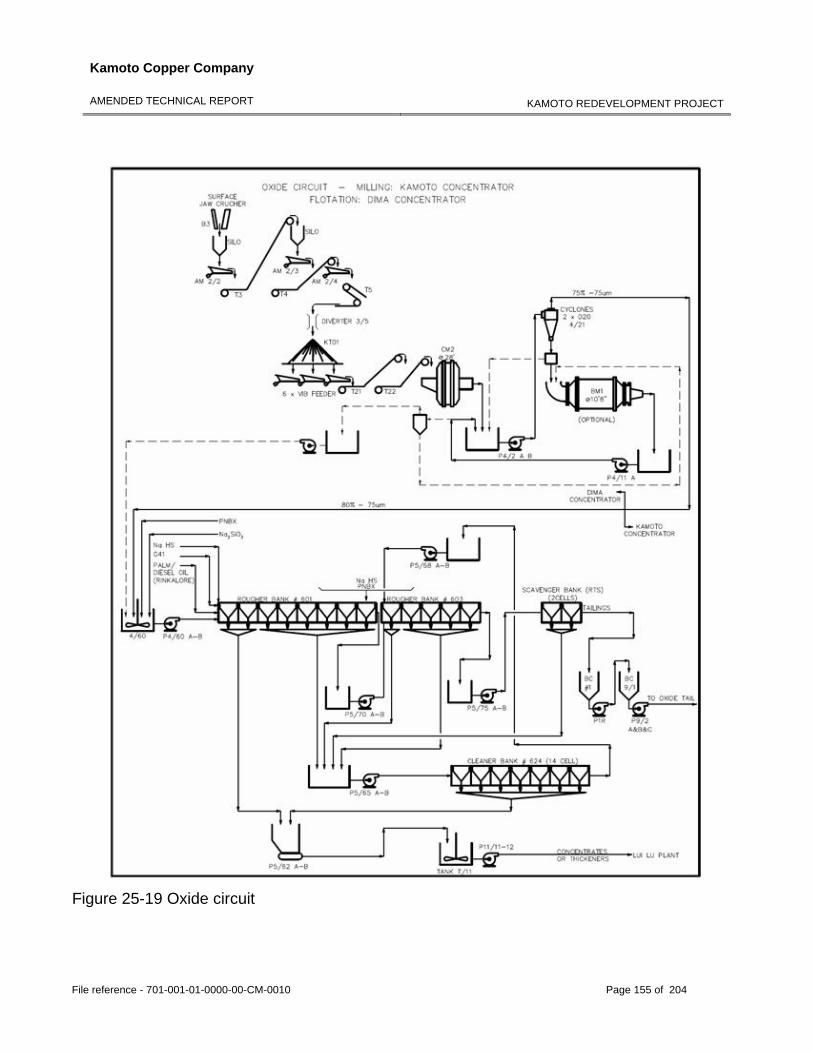
Kamoto Copper Company
AMENDED TECHNICAL REPORT
KAMOTO REDEVELOPMENT PROJECT
File reference - 701-001-01-0000-00-CM-0010 Page 155 of 204
Figure 25-19 Oxide circuit
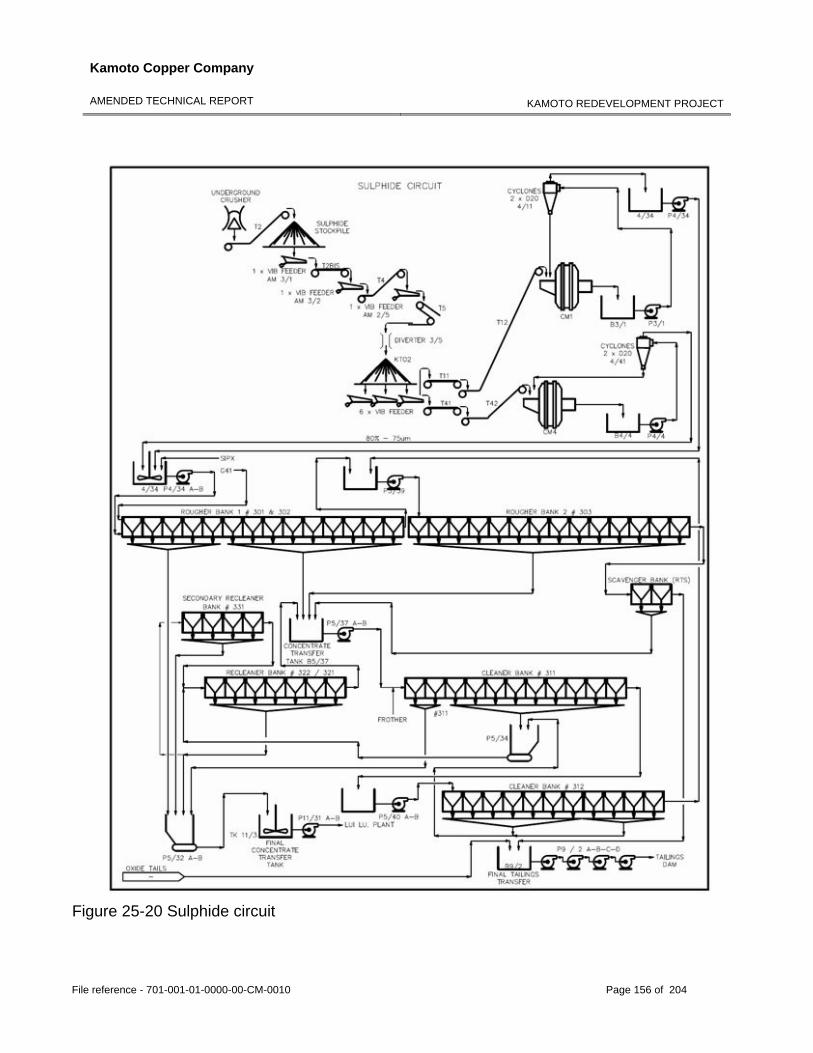
Kamoto Copper Company
AMENDED TECHNICAL REPORT
KAMOTO REDEVELOPMENT PROJECT
File reference - 701-001-01-0000-00-CM-0010 Page 156 of 204
Figure 25-20 Sulphide circuit
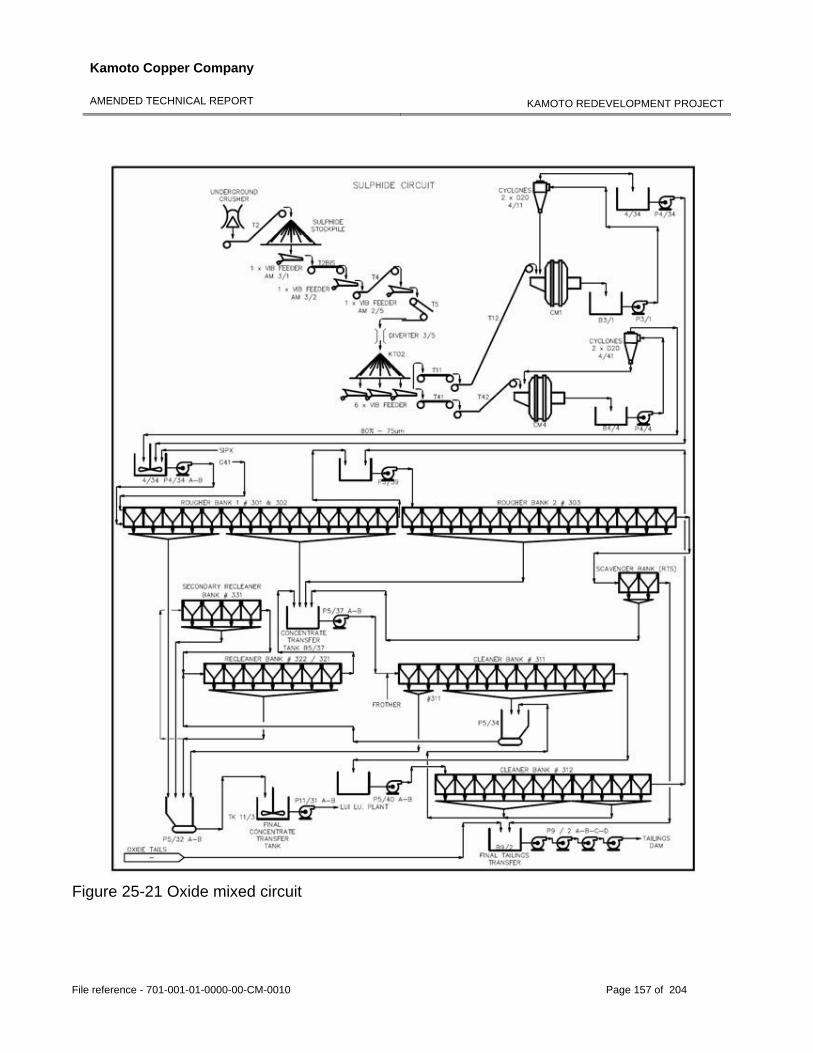
Kamoto Copper Company
AMENDED TECHNICAL REPORT
KAMOTO REDEVELOPMENT PROJECT
File reference - 701-001-01-0000-00-CM-0010 Page 157 of 204
Figure 25-21 Oxide mixed circuit
Kamoto Copper Company
AMENDED TECHNICAL REPORT
KAMOTO REDEVELOPMENT PROJECT
File reference - 701-001-01-0000-00-CM-0010 Page 158 of 204
25.3.2 Luilu The Luilu Plant is designed to recovery copper and cobalt from sulphide, oxide and dolomitic concentrates produced at the Kamoto concentrator. The operation uses roasting, leaching, and precipitation circuits to produce copper and cobalt via electrowinning. The principle of operation of the Luilu Plant is to use the acid generated by the roasting, leaching and electrowinning of copper from the sulphide concentrates to leach the oxide concentrates. Balancing the amounts of sulphide and oxide concentrates minimises the amounts of neutralizing agents or sulphuric acid needed to control the acidity of the process solutions and reduces the plant operating costs. Consequently, the proportion in which sulphide and oxide ores are mined, concentrated and presented to the refinery is a key process parameter. Process flowsheets, process design criteria and mass balances were developed for the plant, based on available historical information and in-house knowledge. The major change compared to historical operation is the implementation of a process control system which constantly monitors the process conditions in the plant. It is expected that this change, if correctly implemented, will positively impact overall metal recovery and product quality. Therefore, it is strongly recommended that after the Luilu Plant has reached stable operation after phase 1 plant start-up, a detailed process review is performed to verify plant operation based on the developed process design criteria and mass balance and update the design if required. The process environmental issues are limited to the roaster off gas system and tailings removal. The existing roasters are equipped with tail gas scrubbers, however it is unlikely that the sulphur removal efficiency of these scrubbers meets the applicable environmental legislative requirements. A dual-alkali off-gas scrubbing system is included for the newly installed roasters (during Phase 2 and 3). The off gas handling problem is therefore limited to Phase 1, when the existing roaster with tail gas scrubbers are in operation. The current Luilu plant design assumes that all waste streams generated in the process are disposed off in the tailings dam with no water recycle to the plant. Incorrect handling and monitoring of the tailings disposal area could result in downstream handling problems. Due to the need to balance the ratio between the oxide and the sulphide concentrate feeds, it is important that the roaster operation is reliable and the mine is able to produce the required ore ratios. The reliability of the roaster operation poses the main process risk for the refinery due to the very poor condition of the existing roaster. By installing two new roaster facilities during Phase 2 and 3, this risk is limited to Phase 1. It is not feasible to install a new roaster for Phase 1, due to the required lead time.
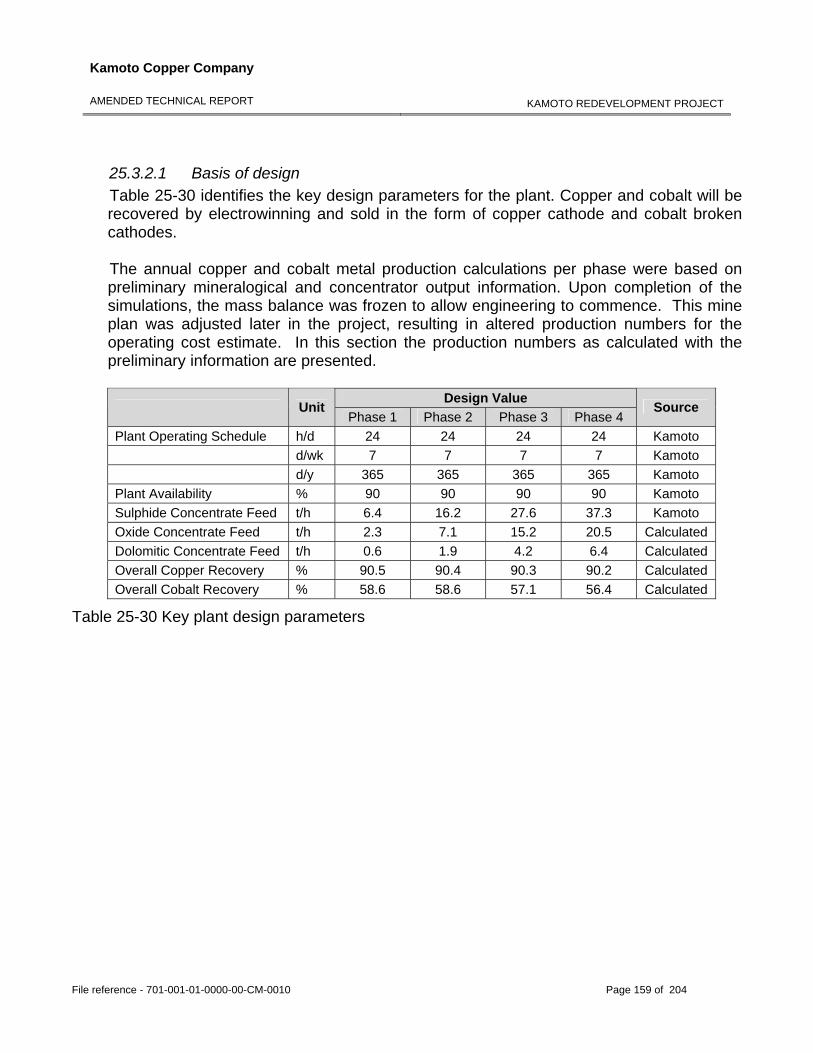
Kamoto Copper Company
AMENDED TECHNICAL REPORT
KAMOTO REDEVELOPMENT PROJECT
File reference - 701-001-01-0000-00-CM-0010 Page 159 of 204
25.3.2.1 Basis of design Table 25-30 identifies the key design parameters for the plant. Copper and cobalt will be recovered by electrowinning and sold in the form of copper cathode and cobalt broken cathodes. The annual copper and cobalt metal production calculations per phase were based on preliminary mineralogical and concentrator output information. Upon completion of the simulations, the mass balance was frozen to allow engineering to commence. This mine plan was adjusted later in the project, resulting in altered production numbers for the operating cost estimate. In this section the production numbers as calculated with the preliminary information are presented.
Design Value Unit Phase 1 Phase 2 Phase 3 Phase 4
Source
Plant Operating Schedule h/d 24 24 24 24 Kamoto d/wk 7 7 7 7 Kamoto d/y 365 365 365 365 Kamoto Plant Availability % 90 90 90 90 Kamoto Sulphide Concentrate Feed t/h 6.4 16.2 27.6 37.3 Kamoto Oxide Concentrate Feed t/h 2.3 7.1 15.2 20.5 Calculated Dolomitic Concentrate Feed t/h 0.6 1.9 4.2 6.4 Calculated Overall Copper Recovery % 90.5 90.4 90.3 90.2 Calculated Overall Cobalt Recovery % 58.6 58.6 57.1 56.4 Calculated
Table 25-30 Key plant design parameters
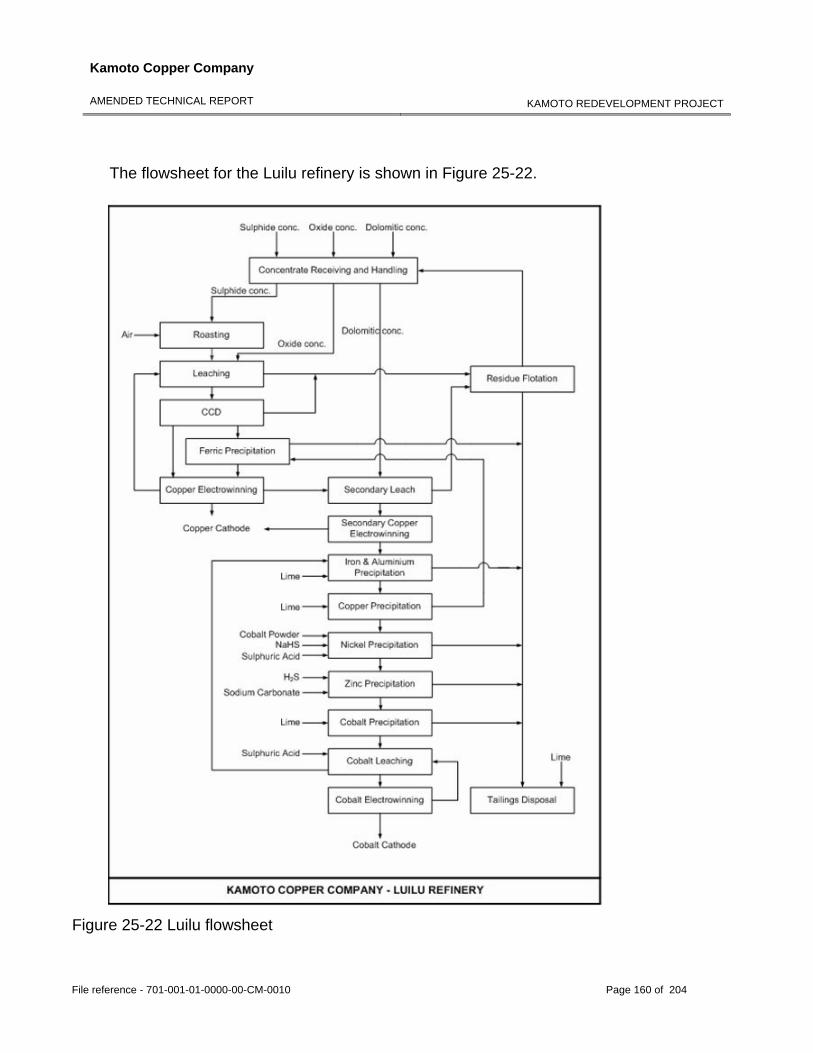
Kamoto Copper Company
AMENDED TECHNICAL REPORT
KAMOTO REDEVELOPMENT PROJECT
File reference - 701-001-01-0000-00-CM-0010 Page 160 of 204
The flowsheet for the Luilu refinery is shown in Figure 25-22.
Figure 25-22 Luilu flowsheet
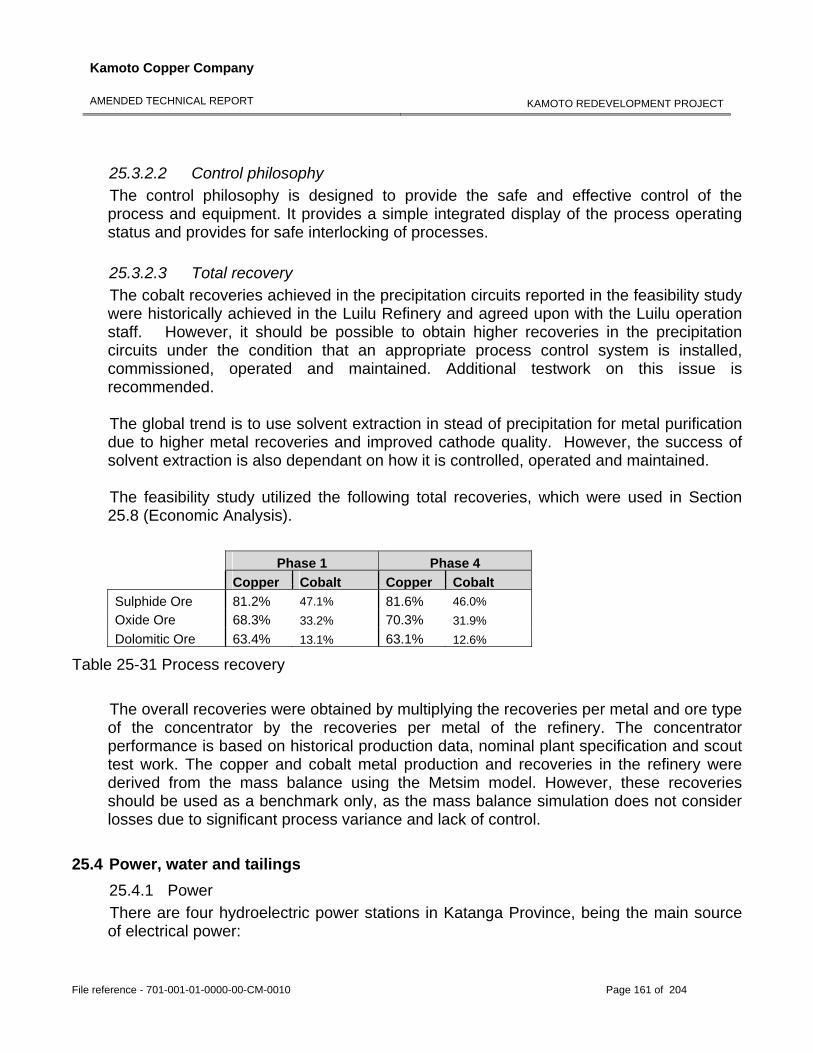
Kamoto Copper Company
AMENDED TECHNICAL REPORT
KAMOTO REDEVELOPMENT PROJECT
File reference - 701-001-01-0000-00-CM-0010 Page 161 of 204
25.3.2.2 Control philosophy The control philosophy is designed to provide the safe and effective control of the process and equipment. It provides a simple integrated display of the process operating status and provides for safe interlocking of processes. 25.3.2.3 Total recovery The cobalt recoveries achieved in the precipitation circuits reported in the feasibility study were historically achieved in the Luilu Refinery and agreed upon with the Luilu operation staff. However, it should be possible to obtain higher recoveries in the precipitation circuits under the condition that an appropriate process control system is installed, commissioned, operated and maintained. Additional testwork on this issue is recommended. The global trend is to use solvent extraction in stead of precipitation for metal purification due to higher metal recoveries and improved cathode quality. However, the success of solvent extraction is also dependant on how it is controlled, operated and maintained. The feasibility study utilized the following total recoveries, which were used in Section 25.8 (Economic Analysis).
Phase 1 Phase 4
Copper Cobalt Copper CobaltSulphide Ore 81.2% 47.1% 81.6% 46.0% Oxide Ore 68.3% 33.2% 70.3% 31.9% Dolomitic Ore 63.4% 13.1% 63.1% 12.6%
Table 25-31 Process recovery
The overall recoveries were obtained by multiplying the recoveries per metal and ore type of the concentrator by the recoveries per metal of the refinery. The concentrator performance is based on historical production data, nominal plant specification and scout test work. The copper and cobalt metal production and recoveries in the refinery were derived from the mass balance using the Metsim model. However, these recoveries should be used as a benchmark only, as the mass balance simulation does not consider losses due to significant process variance and lack of control.
25.4 Power, water and tailings 25.4.1 Power There are four hydroelectric power stations in Katanga Province, being the main source of electrical power:
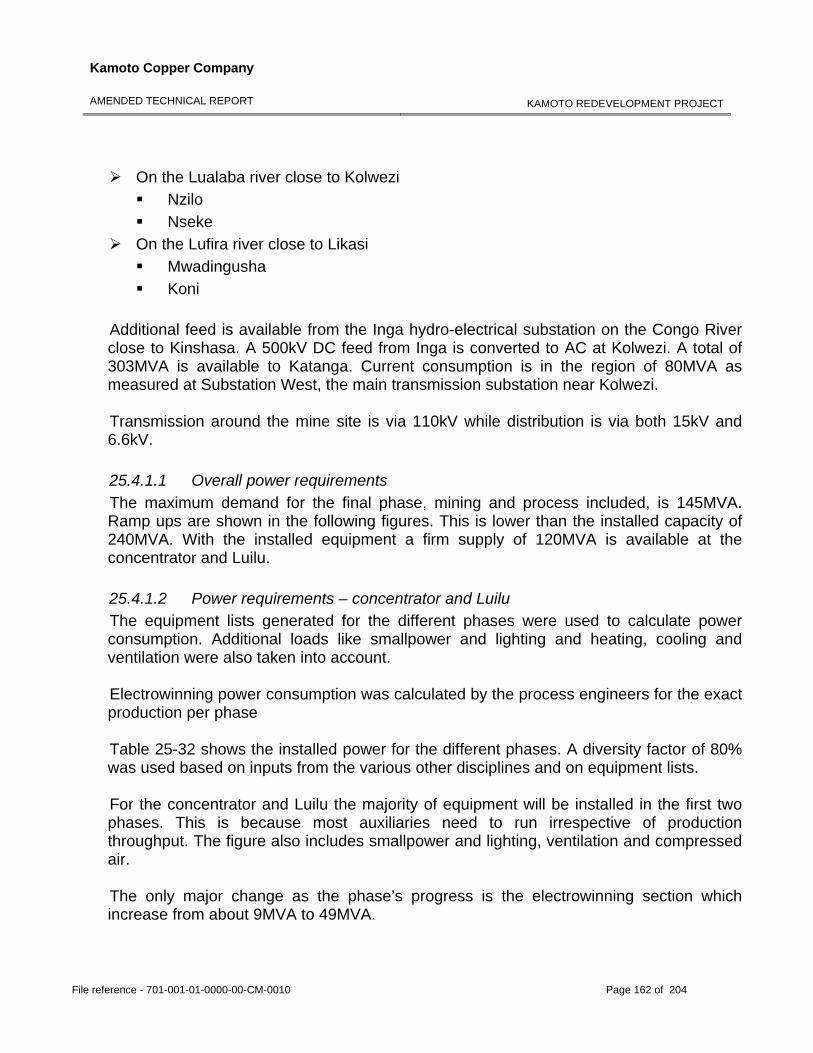
Kamoto Copper Company
AMENDED TECHNICAL REPORT
KAMOTO REDEVELOPMENT PROJECT
File reference - 701-001-01-0000-00-CM-0010 Page 162 of 204
On the Lualaba river close to Kolwezi Nzilo Nseke
On the Lufira river close to Likasi Mwadingusha Koni
Additional feed is available from the Inga hydro-electrical substation on the Congo River close to Kinshasa. A 500kV DC feed from Inga is converted to AC at Kolwezi. A total of 303MVA is available to Katanga. Current consumption is in the region of 80MVA as measured at Substation West, the main transmission substation near Kolwezi. Transmission around the mine site is via 110kV while distribution is via both 15kV and 6.6kV. 25.4.1.1 Overall power requirements The maximum demand for the final phase, mining and process included, is 145MVA. Ramp ups are shown in the following figures. This is lower than the installed capacity of 240MVA. With the installed equipment a firm supply of 120MVA is available at the concentrator and Luilu. 25.4.1.2 Power requirements – concentrator and Luilu The equipment lists generated for the different phases were used to calculate power consumption. Additional loads like smallpower and lighting and heating, cooling and ventilation were also taken into account. Electrowinning power consumption was calculated by the process engineers for the exact production per phase Table 25-32 shows the installed power for the different phases. A diversity factor of 80% was used based on inputs from the various other disciplines and on equipment lists. For the concentrator and Luilu the majority of equipment will be installed in the first two phases. This is because most auxiliaries need to run irrespective of production throughput. The figure also includes smallpower and lighting, ventilation and compressed air. The only major change as the phase’s progress is the electrowinning section which increase from about 9MVA to 49MVA.
Kamoto Copper Company
AMENDED TECHNICAL REPORT
KAMOTO REDEVELOPMENT PROJECT
File reference - 701-001-01-0000-00-CM-0010 Page 163 of 204
Power Consumption (MVA) Phase 1 Phase 2 Phase 3 Phase 4 Kamoto 11.8 13.1 15,1 15.2 DIMA 29.8 31.8 33.5 36.9 Luilu 12.3 16.0 18.7 20.3 Cu Electrowinning – Main 6.1 15.6 26.5 35.5 Cu Electrowinning - ES1 0.5 1.4 1.4 3.1 Cu Electrowinning - ES2 0.7 1.8 3.1 4.2 Co Electrowinning 1.3 3.3 4.8 6.1 Sub Total Consumption 62.7 83.0 103.0 121.2 Underground Consumption 8.0 14.0 19.0 24.0 Total Power Consumption 70.7 97.0 122.0 145.2
Table 25-32 Power consumption (MVA) By Phase 4 full operation, nominal power consumption is estimated to be just over 100MVA. 25.4.2 Water Process water for the Kamoto Concentrator is pumped from the Kamoto mine. The underground pumping system at Kamoto is extensive. It has been designed to supply all process plant and potable water requirements from underground fissure water. It has also been designed on a “total loss” system with an output of approximately 60,000 cubic metres per day. By re-circulating a portion of the process water from tailings, daily plant demand at full production is only 19,000 cubic metres per day. Water pumped from the open pits will be discharged into the Luilu River. Ground water pumped from the dewatering boreholes will be made available to the local potable distribution system. The Luilu metallurgical plant draws its fresh water from the Luilu River. Current capacity is approximately 600 cubic meters per hour. Planned recycling of water is expected to reduce the fresh water demand at Luilu to approximately 160 cubic meters per hour by phase 4. 25.4.3 Tailings Seven candidate sites were identified for the impoundment of tailings from the Kamoto Concentrator and two additional sites were located for the disposal of tailings and solid waste from the Luilu Metallurgical Plant.
Kamoto Copper Company
AMENDED TECHNICAL REPORT
KAMOTO REDEVELOPMENT PROJECT
File reference - 701-001-01-0000-00-CM-0010 Page 164 of 204
Field tests on both the Kamoto and Potopoto Tailings Dams have shown an average density of 1.4 t/m3 for the Kamoto Concentrator tailings at near surface and 0.950 t/m3 for the Luilu Tailings. 25.4.3.1 Kamoto concentrator The existing Kamoto Tailings Dam was selected for use by the Kamoto Concentrator. By extending the dam footprint downstream the site can impound the entire study tonnage. The preliminary design concepts involve the construction of two closure walls, the first across a tributary of the Luilu River. The second closure wall will be on the alignment of the current Kamoto Tailings Dam embankment. The construction of the closure walls will not only allow additional storage capacity on the Kamoto Tailings Dam area but it would enable the area downstream of the existing wall to be integrated into a larger dam footprint. The closure wall can be continually raised with selected material during the life of the impoundment to ensure adequate structural stability is maintained together with adequate freeboard in order to accommodate 1:100 year storm events impacting on the closure wall. Initially the pool formed from surface water will be formed close to the closure wall. Decant penstock towers will convey pool water from the dam. Both penstock and under-drainage discharge can be returned back to the Plant via a return water dam. Controlled tailings deposition will be used to develop the dam with the objective of moving the pools away from the closure walls to a point centrally located at each of the dam. This will be the position of the final penstock towers. It is also planned that the lower compartment will be raised more quickly than the existing dam area so that both compartments can be joined into one single dam with the final pool situated at the centre of the existing Kamoto Tailings Dam footprint. The return water dam will be located downstream of the closure wall from where the penstock and under-drainage discharge can be returned back to the Plant. The entire Kamoto Tailings Dam area will be isolated from the influence of storm events above the dam footprint area by the construction of storm water diversion structures. The introduction of the diversion facilities will redirect current stream water crossing the dam. It will also to reduce the volume of water on the dam that has to be dealt with in the event of a storm until such time as the tailings dam rises by about another 5m in elevation at the eastern end of the dam.
Kamoto Copper Company
AMENDED TECHNICAL REPORT
KAMOTO REDEVELOPMENT PROJECT
File reference - 701-001-01-0000-00-CM-0010 Page 165 of 204
25.4.3.2 Luilu The new tailings impoundments at Luilu will consist of individual ponds with internal floor dimensions of 250m by 300m. The floor and perimeter walls will be constructed of compacted clay to a height of 3 metres above natural ground level. Each impoundment will have an inner basin area excavated to a depth of 3 metres. The ponds will be built with a dual synthetic liner with an internal leak detection and drain system installed. Each basin will hold approximately one year of tailings production. Once filled, the basin will be capped with a local material to shed water. 25.4.4 General infrastructure KCC will develop a compound adjacent to the operations for housing construction personnel and ultimately its expatriate work force. It is anticipated that up to 80 housing units ranging from single to family status will be developed along with recreational, medical and canteen facilities. Beyond the housing compound, KCC will utilize the existing Gecamines facilities for offices, workshops, and operations. Required existing roadways will be refurbished and maintained throughout the project.
25.4.5 Markets Markets for copper and cobalt metal are well established and the mines of Kolwezi have been selling into these markets for a considerable period. It is expected that sales will be a combination of primary and secondary consumers. 25.4.6 Contracts At this time Kamoto Copper Company has not entered into any contracts for purchases, mining, operations or any other services related to the operation nor has KCC entered into any sales or hedging arrangements.
25.5 Environmental considerations 25.5.1 General The area around Kolwezi has been extensively mined since the early 1900’s. As a result of mining and metallurgical activities, over the last thirty five years mainly under the control of the state-owned mining company Gecamines, the area around the town of Kolwezi has numerous open pits, waste rock, tailings dams, concentrators and other mining-related infrastructure, which has led to extensive impacts on the environment.
Kamoto Copper Company
AMENDED TECHNICAL REPORT
KAMOTO REDEVELOPMENT PROJECT
File reference - 701-001-01-0000-00-CM-0010 Page 166 of 204
25.5.2 Environmental permitting An Environmental Impact Study (EIS) for the project has been compiled by SRK Consulting (SRK) for Kamoto in accordance with the requirements set out in Schedule IX of the Mining Environmental Guidelines of the Democratic Republic of the Congo (DRC). The EIS also contains an Environmental Management Plan of the Project (EMPP) as required by the Mining Regulations. These documents are currently being translated into French and will be submitted in the near future. 25.5.3 Key Environmental Issues Kamoto Copper Company (KCC) plans to refurbish and recommission parts of the exiting mining operation in the Kolwezi area. These facilities will be leased from Gecamines for the duration of the KCC operation, and will revert to Gecamines on closure of the operation. This situation provides the opportunity to use existing infrastructure, with negligible additional disturbance of land, to refurbish the economic benefits of the mining operation. With proper management of the physical impacts of the operation, incremental impacts on the biological environment will be negligible and there will be very significant potential for social and economic improvement of the area. This EIS report sets out the initial findings of the environmental work undertaken for the proposed KCC mining operation. It is intended that the following infrastructure will be included in the project:
The existing Kamoto underground infrastructure; The existing Kamoto tailings dam, extended to accommodate the proposed
production rate, and with improved surface water runoff management; The T17 pit which will be mined for oxide ores in the initial stages since this pit does
not require de-watering, as the case with all of the other open pits; The Dikuluwe, Mashamba East, and Mashamba West open pits, all of which require
dewatering; The Kamoto Concentrator; The Luilu plant; A new lined tailings facility to be developed to cater for tailings from Luilu. It is
intended that this new facility will be built on land with pre-existing impact to minimise impact on new land and to assist in managing the impact of the pre-existing condition, either on old tailings dams or in an area previously occupied by a series of earth containment ponds historically used as storage facilities for copper and cobalt rich solutions from the Luilu plant;
Kamoto Copper Company
AMENDED TECHNICAL REPORT
KAMOTO REDEVELOPMENT PROJECT
File reference - 701-001-01-0000-00-CM-0010 Page 167 of 204
The operation is one of re-furbishing and re-commissioning of existing facilities, with new tailings facilities on an area already substantially impacted. There will therefore be no significant increase in existing impacted footprints. The levels of existing contamination are being quantified and a separate report has been prepared to document the findings. This will allow KCC to establish a data base of existing known environmental liabilities. Public consultation, with the proposed operation described at conceptual level only, has been undertaken and a number of concerns and issues have been raised. These are summarized in this Report. All of the issues and concerns raised can be managed in terms of generally accepted practices. Issues such as water quality were not raised in terms of compliance with regulations and this will have to be considered in terms of the regulations themselves and sound management practices. Information provided to date on the proposed operation indicates that there will be some improvement in existing environmental conditions in the area due to improved operational facilities and management. However, in the short term, emissions from the existing roaster and n the longer term salt levels in the effluent from the Luilu facility will likely not meet DRC legislation or International best practice principles if standards contained in the environmental regulations are interpreted strictly. Where standards for particular components are not presently included a conservative approach is adopted. A risk based approach to the impacts is therefore proposed, which must ensure that risks to humans and the environment are kept within acceptable limits and reduced in terms of the current situation. In broad terms, it is concluded that:
There will be some water discharge of a quality that will not conform to international best practice principles environmental requirements;
Whilst every effort will be made to optimise water management and minimise releases to the environment, given the net positive water balance in the area, excess water will be generated requiring discharge to the surface water system Containment and recycling within the process water system will be included in the design;
Liming of the Luilu tailing stream will be undertaken to precipitate heavy metals within the tailings and to allow free water discharges to comply with DRC effluent discharge standards. The need for further water treatment is under detailed assessment;
The backfilling, tailings disposal and excess water discharge operations will be carefully monitored;
For the first year of operation it is not expected that there will be significant improvement in air quality associated with gaseous emissions from the Luilu plant. However, by the second year of operation, the first new roaster will be installed and the existing roaster will be decommissioned which will result in an improvement in emissions;
Kamoto Copper Company
AMENDED TECHNICAL REPORT
KAMOTO REDEVELOPMENT PROJECT
File reference - 701-001-01-0000-00-CM-0010 Page 168 of 204
Improved operational management and process optimisation will, result in improvement in terms of water and air quality in the medium to long term;
While the intention is to avoid disturbing undisturbed sites, no fatal flaws regarding the sites that could be utilized were identified;
In terms of socio-economic considerations, the area is desperately in need of socio-economic improvement and the envisaged project, if undertaken in terms of sound and responsible environmental management principles, will result in a net positive impact. To this end a detailed socio-economic study is currently underway which will inform the sustainable development plan required in terms of Article 127 of the regulations.
Final closure requirements and associated costs will be developed in consultation with Gecamines. Upon termination of the operating lease all properties and facilities will revert back to Gecamines. KCC will reclaim those facilities and operations that they have developed which Gecamines does not wish to preserve.
25.6 Taxes and royalties
Taxation and national royalties for the project are specified by the new mining code Decree No 038/2003 promulgated on March 26, 2003. The Democratic Republic of Congo retains a 2% royalty (revenue less selling expenses) as outlined in the Mining Code Article 241. Gecamines will retain a royalty of two percent (2.0%) of sales (revenue less selling expenses and debt redemption) realized during the first 3 years of operation and one and one-half percent (1.5%) after. Beyond these noted royalties, the subject property is currently free of other royalties, back-in rights, payments or other agreements and encumbrances. The primary taxes under the mining code that will affect the project include income tax which is charged at 30% of taxable profit, import duties vary from 2% to 5% depending upon the article and the time the item is purchased and export duties are charged at 1%.
25.7 Capital and operating costs 25.7.1 Capital cost estimate 25.7.1.1 Basis of estimate The following capital cost estimate has been prepared for the redevelopment and rehabilitation of the Kamoto mine, concentrator and Luilu refinery plant. The basis for the capital cost estimate is as follows:
The estimate has an intended level of accuracy to +30% / -0%. The estimate has a base date of March 2006.
Kamoto Copper Company
AMENDED TECHNICAL REPORT
KAMOTO REDEVELOPMENT PROJECT
File reference - 701-001-01-0000-00-CM-0010 Page 169 of 204
All costs are expressed in US Dollar (USD) terms. Other key qualifications, assumptions and exclusions are set out below.
Several site visits attended by mining, processing, engineering and environmental disciplines together with the lead estimator were carried out during the preparation of the feasibility study. Test work where necessary was done with reliable research institutions and major equipment costs were obtained from vendors and original equipment manufacturers (OME). As far as possible rates supplied by KML were used in the preparation of the cost estimate. Where KML rates were not available South African rates adjusted to allow for DRC conditions were used. The estimate consists of four distinct and separate phases in accordance with the production ramp-up and the cash flow generated accordingly. The cost estimate was developed by the individual consultancy companies with full responsibility for their respective section (McIntosh RSV LLC, SRK, and Hatch) and collated into one estimate by Hatch. The work of each company has not been verified by the other companies and McIntosh RSV LLC, SRK and Hatch take no responsibility for (a) the work of the other companies, or (b) for the costs provided by the Owner.
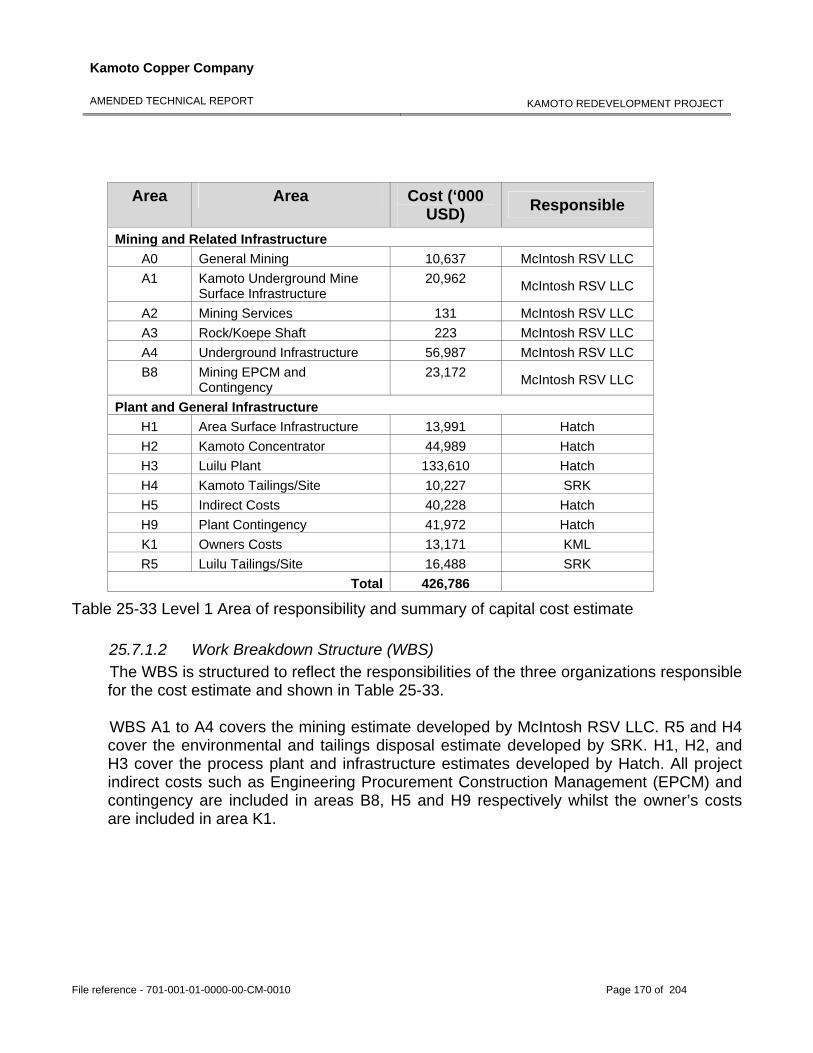
Kamoto Copper Company
AMENDED TECHNICAL REPORT
KAMOTO REDEVELOPMENT PROJECT
File reference - 701-001-01-0000-00-CM-0010 Page 170 of 204
Area Area Cost (‘000
USD) Responsible
Mining and Related Infrastructure A0 General Mining 10,637 McIntosh RSV LLC A1 Kamoto Underground Mine
Surface Infrastructure 20,962 McIntosh RSV LLC
A2 Mining Services 131 McIntosh RSV LLC A3 Rock/Koepe Shaft 223 McIntosh RSV LLC A4 Underground Infrastructure 56,987 McIntosh RSV LLC B8 Mining EPCM and
Contingency 23,172 McIntosh RSV LLC
Plant and General Infrastructure H1 Area Surface Infrastructure 13,991 Hatch H2 Kamoto Concentrator 44,989 Hatch H3 Luilu Plant 133,610 Hatch H4 Kamoto Tailings/Site 10,227 SRK H5 Indirect Costs 40,228 Hatch H9 Plant Contingency 41,972 Hatch K1 Owners Costs 13,171 KML R5 Luilu Tailings/Site 16,488 SRK
Total 426,786
Table 25-33 Level 1 Area of responsibility and summary of capital cost estimate 25.7.1.2 Work Breakdown Structure (WBS) The WBS is structured to reflect the responsibilities of the three organizations responsible for the cost estimate and shown in Table 25-33. WBS A1 to A4 covers the mining estimate developed by McIntosh RSV LLC. R5 and H4 cover the environmental and tailings disposal estimate developed by SRK. H1, H2, and H3 cover the process plant and infrastructure estimates developed by Hatch. All project indirect costs such as Engineering Procurement Construction Management (EPCM) and contingency are included in areas B8, H5 and H9 respectively whilst the owner’s costs are included in area K1.
Kamoto Copper Company
AMENDED TECHNICAL REPORT
KAMOTO REDEVELOPMENT PROJECT
File reference - 701-001-01-0000-00-CM-0010 Page 171 of 204
25.7.1.3 Direct cost estimate MECHANICAL EQUIPMENT SUPPLY The scope of work is based on general arrangement drawings, PFDs and mechanical equipment lists and work required as per inspection report prepared by consulting engineers and includes delivery to site and commissioning assistance by vendors. Budget quotations were obtained for the majority of new equipment. Mobile mining equipment is sourced from South Africa but based on US Dollar rates or Euro rates and priced as new. LABOUR FOR REFURBISHMENT AND INSTALLATION Labour and wage rates were supplied by KML. These rates were obtained from a reputable contractor, in the DRC and were used to develop a crew cost per hour which is inclusive of contractors Preliminary and General costs (P&G). A cost sheet was generated to calculate the labour cost for the refurbishment of typical and specialized equipment as well as for the installation of refurbished and new equipment by applying a crew manhour cost to estimated manhours. South African manhours were adjusted using a country factor of 1.2 to allow for productivity. PLATEWORK (BINS, CHUTES, LAUNDERS AND TANKS) Platework repairs were costed using a normalized DRC rate which was applied to quantities calculated from existing project drawings. Where drawings were not available, allowances were made for platework masses. CIVIL AND STRUCTURAL WORK Structural steel and cladding repair quantities were based on a site survey and costed by using rates supplied by KML as far as possible. Where KML rates were not available South African rates adjusted to allow for DRC conditions were used. ELECTRICAL WORK Electrical equipment refurbishment and cable replacement quantities were based on a site survey and costed by using South African installation rates which were adjusted to allow for DRC conditions. Budget quotations were obtained for major equipment such as for refurbishment of switchgear and servicing of transformers.
Kamoto Copper Company
AMENDED TECHNICAL REPORT
KAMOTO REDEVELOPMENT PROJECT
File reference - 701-001-01-0000-00-CM-0010 Page 172 of 204
CONTROL AND INSTRUMENTATION Control equipment and field instrumentation replacement and refurbishment quantities were based on a site survey. Installation costs are based on South African rates which were adjusted to allow for DRC conditions. Budget quotations were obtained for major equipment. 25.7.1.4 Indirect costs estimate
ENGINEERING PROCUREMENT CONSTRUCTION MANAGEMENT (EPCM) EPCM manhours were developed by means of an organogram and costed using a blended, all-inclusive manhour rate. Provision was made for travel to and from South Africa at intervals in accordance with Hatch Africa policies. SITE CONSTRUCTION VILLAGE Provision was made for a site construction village to accommodate expatriates, as well as the running of the village during the construction period. OWNER’S COST Owner’s costs were developed by the owner’s team. CAPITAL SPARES Provision was made for capital spares in accordance with recommendations of equipment suppliers. CONTINGENCY A contingency weighted allowance was made after evaluating both quantity and costs of budgeted items. The work primarily involves the refurbishment and rehabilitation of an existing facility with areas of greater uncertainty. Contingency included in the capital cost estimate is an allowance for expected variations in the cost and quantity for labour, material and equipment, for the given scope of work and the economic climate existing at the time the estimate was made. The contingency is an integral part of the cost estimate. It does not cover potential scope changes, force majeure, currency fluctuations and other project risks. DUTIES AND TAXES Duties and Taxes have been allowed for in accordance with the new customs system and tax of the mining code ruling as at the project base date.
Kamoto Copper Company
AMENDED TECHNICAL REPORT
KAMOTO REDEVELOPMENT PROJECT
File reference - 701-001-01-0000-00-CM-0010 Page 173 of 204
Phase 1- 2 per cent Phase 2- 5 per cent Phase 3-5 per cent Phase 4-5 per cent
TRANSPORT Indicative transport costs were obtained from a logistics specialist who has experience of the clearing, handling and transport costs from South Africa and Europe to Kolwezi. 25.7.1.5 Assumptions and exclusions
ASSUMPTIONS Conversion rates utilized in the estimate for other currencies are:
1 USD = 0.82 Euro 1 USD = 0.56 GBP 1 USD = 6.30 ZAR
No allowance has been made in the estimate for forecast fluctuations in exchange rates subsequently to the base date of the estimate. Where possible, equipment has been sourced from South Africa. Unless otherwise specified, quotations referred to above are not firm and, accordingly, the related pricing may be subject to variation. EXCLUSIONS The following items have not been included in the capital cost estimate and in each case may have a material impact on the accuracy of the estimate:
Feasibility Study costs and other sunk costs as of the base date of the estimate Cost for forward cover Export credit guarantees Interest on capital loans (included in the economic analysis) Insurance Allowances for any scope changes Costs associated with royalties and property tax (these are included in the economic
analysis) Environmental Impact assessment implications and associated costs Escalation after base date of the project
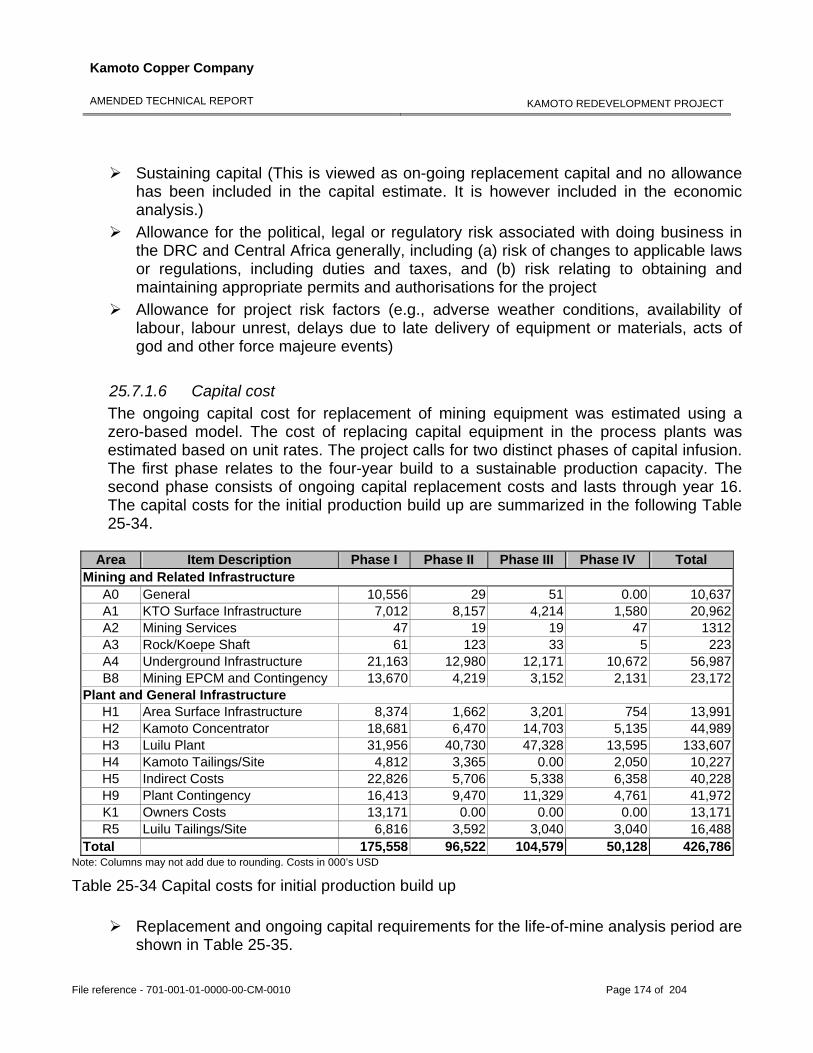
Kamoto Copper Company
AMENDED TECHNICAL REPORT
KAMOTO REDEVELOPMENT PROJECT
File reference - 701-001-01-0000-00-CM-0010 Page 174 of 204
Sustaining capital (This is viewed as on-going replacement capital and no allowance has been included in the capital estimate. It is however included in the economic analysis.)
Allowance for the political, legal or regulatory risk associated with doing business in the DRC and Central Africa generally, including (a) risk of changes to applicable laws or regulations, including duties and taxes, and (b) risk relating to obtaining and maintaining appropriate permits and authorisations for the project
Allowance for project risk factors (e.g., adverse weather conditions, availability of labour, labour unrest, delays due to late delivery of equipment or materials, acts of god and other force majeure events)
25.7.1.6 Capital cost The ongoing capital cost for replacement of mining equipment was estimated using a zero-based model. The cost of replacing capital equipment in the process plants was estimated based on unit rates. The project calls for two distinct phases of capital infusion. The first phase relates to the four-year build to a sustainable production capacity. The second phase consists of ongoing capital replacement costs and lasts through year 16. The capital costs for the initial production build up are summarized in the following Table 25-34.
Area Item Description Phase I Phase II Phase III Phase IV Total Mining and Related Infrastructure
A0 General 10,556 29 51 0.00 10,637A1 KTO Surface Infrastructure 7,012 8,157 4,214 1,580 20,962A2 Mining Services 47 19 19 47 1312A3 Rock/Koepe Shaft 61 123 33 5 223A4 Underground Infrastructure 21,163 12,980 12,171 10,672 56,987B8 Mining EPCM and Contingency 13,670 4,219 3,152 2,131 23,172
Plant and General Infrastructure H1 Area Surface Infrastructure 8,374 1,662 3,201 754 13,991H2 Kamoto Concentrator 18,681 6,470 14,703 5,135 44,989H3 Luilu Plant 31,956 40,730 47,328 13,595 133,607H4 Kamoto Tailings/Site 4,812 3,365 0.00 2,050 10,227H5 Indirect Costs 22,826 5,706 5,338 6,358 40,228H9 Plant Contingency 16,413 9,470 11,329 4,761 41,972K1 Owners Costs 13,171 0.00 0.00 0.00 13,171R5 Luilu Tailings/Site 6,816 3,592 3,040 3,040 16,488
Total 175,558 96,522 104,579 50,128 426,786Note: Columns may not add due to rounding. Costs in 000’s USD
Table 25-34 Capital costs for initial production build up
Replacement and ongoing capital requirements for the life-of-mine analysis period are shown in Table 25-35.
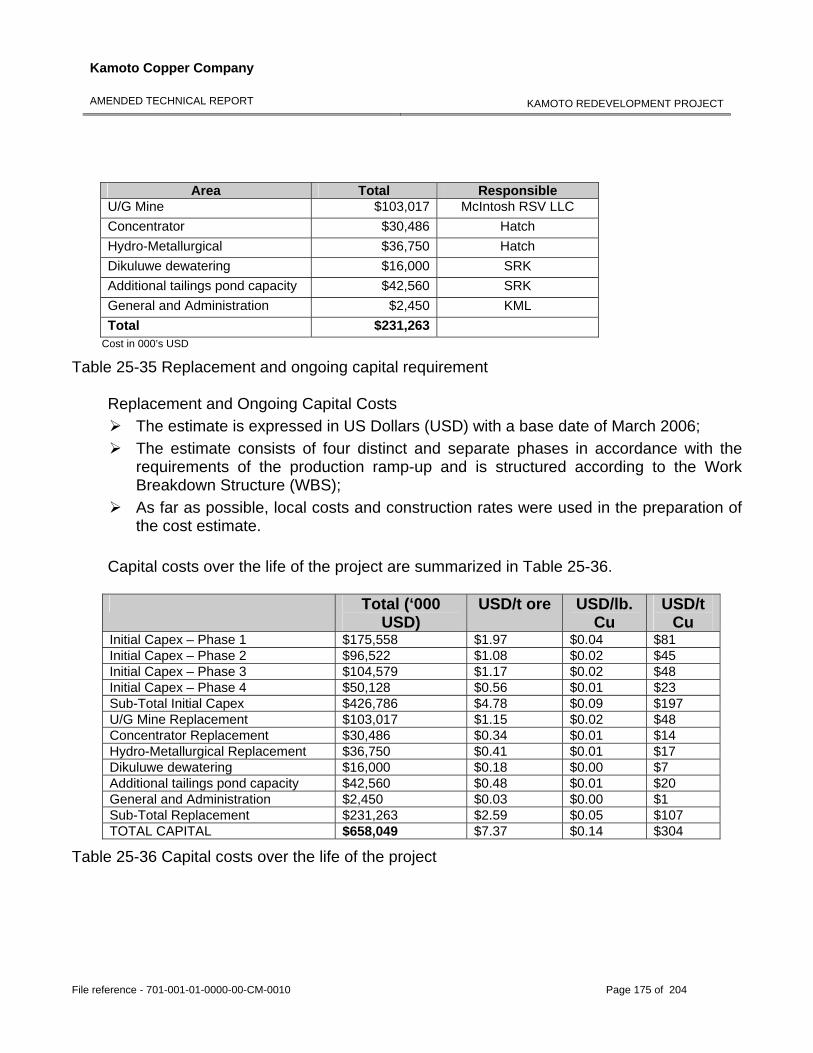
Kamoto Copper Company
AMENDED TECHNICAL REPORT
KAMOTO REDEVELOPMENT PROJECT
File reference - 701-001-01-0000-00-CM-0010 Page 175 of 204
Area Total Responsible
U/G Mine $103,017 McIntosh RSV LLC Concentrator $30,486 Hatch Hydro-Metallurgical $36,750 Hatch Dikuluwe dewatering $16,000 SRK Additional tailings pond capacity $42,560 SRK General and Administration $2,450 KML Total $231,263
Cost in 000’s USD
Table 25-35 Replacement and ongoing capital requirement Replacement and Ongoing Capital Costs
The estimate is expressed in US Dollars (USD) with a base date of March 2006; The estimate consists of four distinct and separate phases in accordance with the
requirements of the production ramp-up and is structured according to the Work Breakdown Structure (WBS);
As far as possible, local costs and construction rates were used in the preparation of the cost estimate.
Capital costs over the life of the project are summarized in Table 25-36.
Total (‘000 USD)
USD/t ore USD/lb. Cu
USD/t Cu
Initial Capex – Phase 1 $175,558 $1.97 $0.04 $81 Initial Capex – Phase 2 $96,522 $1.08 $0.02 $45 Initial Capex – Phase 3 $104,579 $1.17 $0.02 $48 Initial Capex – Phase 4 $50,128 $0.56 $0.01 $23 Sub-Total Initial Capex $426,786 $4.78 $0.09 $197 U/G Mine Replacement $103,017 $1.15 $0.02 $48 Concentrator Replacement $30,486 $0.34 $0.01 $14 Hydro-Metallurgical Replacement $36,750 $0.41 $0.01 $17 Dikuluwe dewatering $16,000 $0.18 $0.00 $7 Additional tailings pond capacity $42,560 $0.48 $0.01 $20 General and Administration $2,450 $0.03 $0.00 $1 Sub-Total Replacement $231,263 $2.59 $0.05 $107 TOTAL CAPITAL $658,049 $7.37 $0.14 $304
Table 25-36 Capital costs over the life of the project
Kamoto Copper Company
AMENDED TECHNICAL REPORT
KAMOTO REDEVELOPMENT PROJECT
File reference - 701-001-01-0000-00-CM-0010 Page 176 of 204
25.7.1.7 Operating costs The operating cost estimate was developed by the individual consultancy companies with full responsibility for their respective section (McIntosh RSV LLC, SRK, and Hatch) and collated into one estimate by Hatch. The work of each company has not been verified by the other companies and McIntosh RSV LLC, SRK, and Hatch take no responsibility for (a) the work of the other companies, or (b) for the costs provided by the Owner. The operating cost estimate is based on the phased mining and processing operations. Underground mining costs were developed by activity. Open pit costs are based on a rate per tonne on a contract-mining basis. Process costs were similarly developed based on first principles incorporating energy, reagent and manpower costs. No contingency was included in the operating cost estimate. The usage of individual consumables was calculated in proportion to their major drivers: sulphide ore milled, oxide ore milled, copper production, cobalt production and operating hours. The initial estimated operating costs are impacted by the plant throughput ramp-up and by the metals recovery ramp-up. The production schedule was driven by the capacity of the concentrator and hydro-metallurgical plants as well as the underground mine’s sulphide ore production rate. The sulphide to oxide concentrate balance in the hydro-metallurgical plant then effectively created an oxide and dolomitic ore demand which the surface mine plan strove to achieve. Ore that was defined as mixed (having sufficient sulphide and oxide to satisfy either definition) was allocated on a pro rata basis as being either sulphide or oxide. The mine plan was aligned to the sulphide and oxide demand of the plant. Due to the incidental nature of mining the dolomitic oxide, it was not possible to plan this ROM product. Operating costs were estimated for the Luilu Plant for four levels of production corresponding to the four phases of the project. The METSIM® mass balance was developed for these four discrete phases, and from this mass balance reagent and consumable consumption rates were generated per unit copper or cobalt production. The consumption rates of some reagents (principally sulphuric acid) in the plant are driven by the neutralising potential of the incoming ore. As the exact mineralogy of this ore and its distribution in the ore body is not accurately defined, the consumption rate estimates for this portion of the refinery are less certain. The four sets of consumption rates relationships developed by the METSIM® mass were applied to the relevant phases. This was done:
Kamoto Copper Company
AMENDED TECHNICAL REPORT
KAMOTO REDEVELOPMENT PROJECT
File reference - 701-001-01-0000-00-CM-0010 Page 177 of 204
before the mine plan was finalised, for only four discrete input concentration assumptions, while the mine plan varies
from month to month. Staffing estimates were developed for each section of the operation. These were done using the Patterson band grading system. An additional dimension was added to cater for both local and expatriate labour. Staffing compliments were reviewed by the client and adjustments made to take cogniscence of productivity and skills levels available in the DRC. The annual power consumption is based on the connected load of all operating equipment multiplied by a load, diversity and utilisation factors to obtain power consumption per phase. The unit power cost of 0.03 USD/kWh was supplied by KML. Maintenance costs are estimated based, where possible, on comparable operations, and also as a percentage of the capital costs required to establish a greenfields operation of similar capacity. Transport costs were estimated based on the mass of consumables being sourced multiplied by a relevant quote obtained from a transport operator. The transport cost for the Lubumbashi – Kolwezi leg of the journey is out of proportion to the distance travelled due to condition of that stretch of road. It has been assumed that this road will be upgraded. The cost of this leg post-Phase 1 has been assumed to be same USD per tonne kilometre cost as the Johannesburg - Lubumbashi leg; Water was assumed to be available from mine dewatering activities, and as such carried no cost except power for pumping. Import duties at three per cent for the duration of the project for all fuels, lubricants, reagents and consumables as per the DRC mining code. General and administration included:
The KML management fee based on a percentage agreement between KML and GMC.
Security based on a quote obtained by KML Labour cost based on compliments multiplied by a cost to company and burden. Annual estimates supplied by KML for insurance, training, protective equipment,
social development, communications and laboratory costs The selling price of goods are assumed to be CFR (Cost and Freight) using the average costs for sea freight from Durban to three possible destinations (Rotterdam, Antwerp and Perth). The Durban leg is an Indicative transport costs were obtained from a logistics specialist who has experience of the clearing, handling and transport costs from South
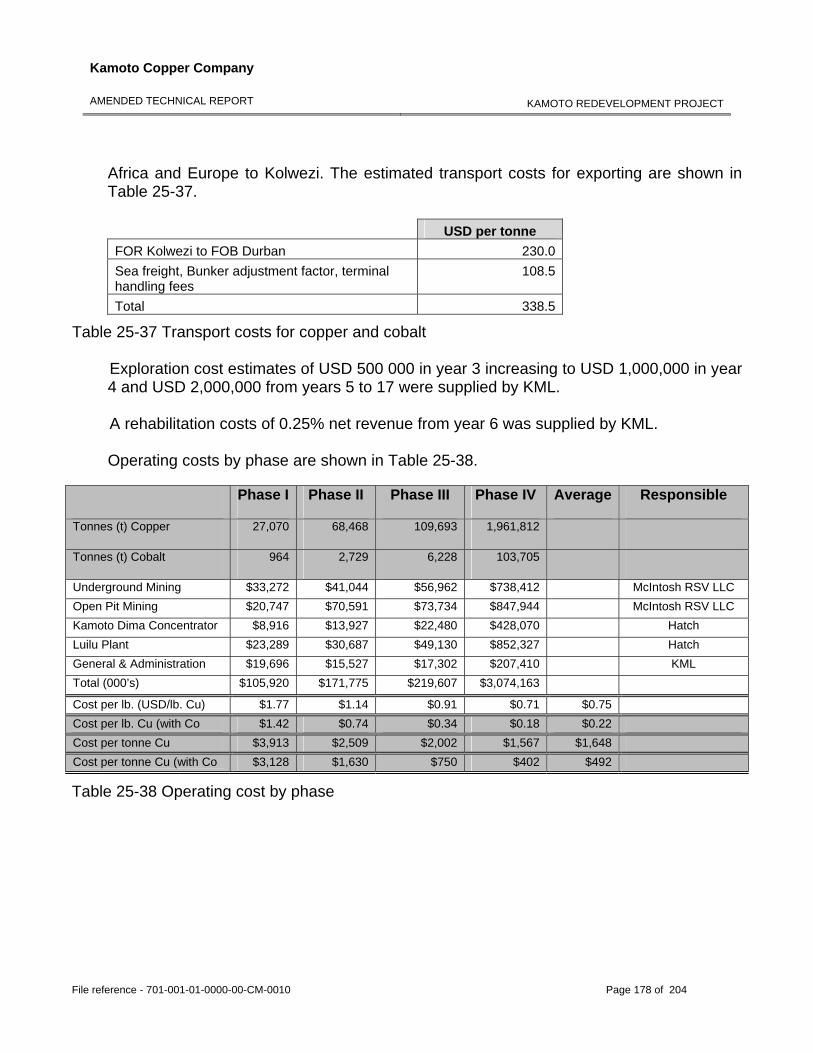
Kamoto Copper Company
AMENDED TECHNICAL REPORT
KAMOTO REDEVELOPMENT PROJECT
File reference - 701-001-01-0000-00-CM-0010 Page 178 of 204
Africa and Europe to Kolwezi. The estimated transport costs for exporting are shown in Table 25-37. USD per tonne FOR Kolwezi to FOB Durban 230.0Sea freight, Bunker adjustment factor, terminal handling fees
108.5
Total 338.5
Table 25-37 Transport costs for copper and cobalt Exploration cost estimates of USD 500 000 in year 3 increasing to USD 1,000,000 in year 4 and USD 2,000,000 from years 5 to 17 were supplied by KML. A rehabilitation costs of 0.25% net revenue from year 6 was supplied by KML. Operating costs by phase are shown in Table 25-38.
Phase I Phase II Phase III Phase IV Average Responsible
Tonnes (t) Copper 27,070 68,468 109,693 1,961,812
Tonnes (t) Cobalt 964 2,729 6,228 103,705
Underground Mining $33,272 $41,044 $56,962 $738,412 McIntosh RSV LLC Open Pit Mining $20,747 $70,591 $73,734 $847,944 McIntosh RSV LLC Kamoto Dima Concentrator $8,916 $13,927 $22,480 $428,070 Hatch Luilu Plant $23,289 $30,687 $49,130 $852,327 Hatch General & Administration $19,696 $15,527 $17,302 $207,410 KML Total (000’s) $105,920 $171,775 $219,607 $3,074,163
Cost per lb. (USD/lb. Cu) $1.77 $1.14 $0.91 $0.71 $0.75 Cost per lb. Cu (with Co $1.42 $0.74 $0.34 $0.18 $0.22 Cost per tonne Cu $3,913 $2,509 $2,002 $1,567 $1,648 Cost per tonne Cu (with Co $3,128 $1,630 $750 $402 $492
Table 25-38 Operating cost by phase
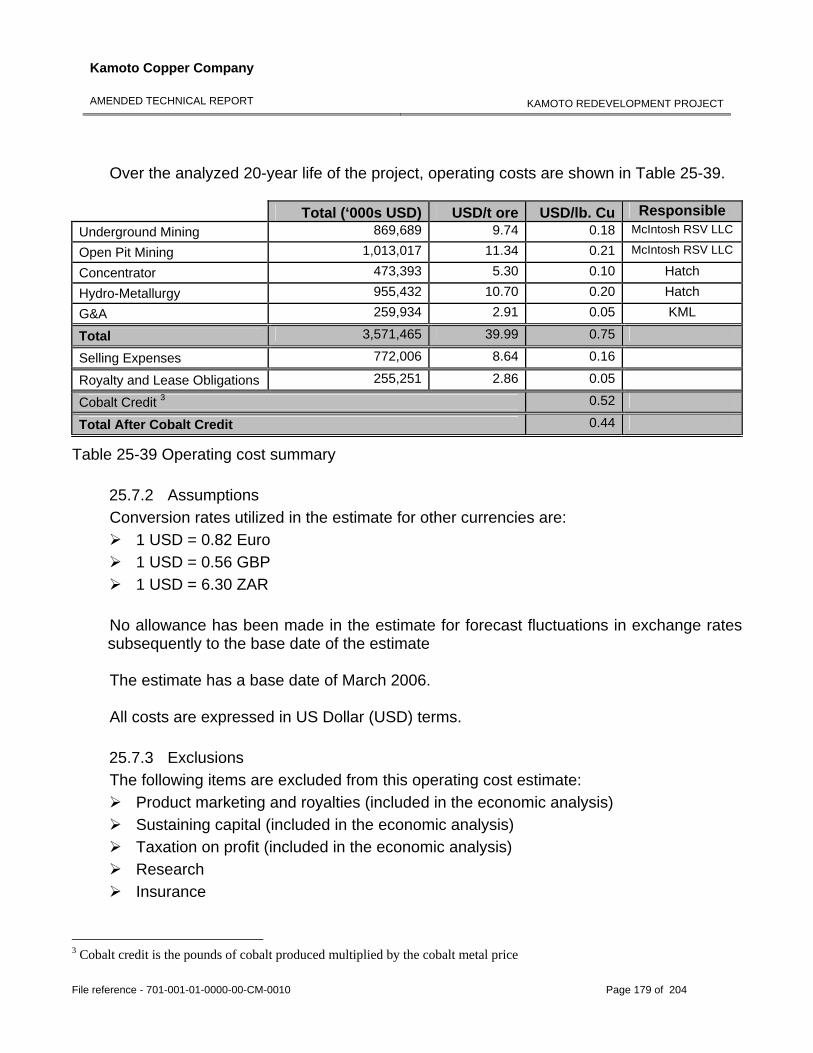
Kamoto Copper Company
AMENDED TECHNICAL REPORT
KAMOTO REDEVELOPMENT PROJECT
File reference - 701-001-01-0000-00-CM-0010 Page 179 of 204
Over the analyzed 20-year life of the project, operating costs are shown in Table 25-39.
Total (‘000s USD) USD/t ore USD/lb. Cu Responsible Underground Mining 869,689 9.74 0.18 McIntosh RSV LLC
Open Pit Mining 1,013,017 11.34 0.21 McIntosh RSV LLC
Concentrator 473,393 5.30 0.10 Hatch
Hydro-Metallurgy 955,432 10.70 0.20 Hatch
G&A 259,934 2.91 0.05 KML
Total 3,571,465 39.99 0.75
Selling Expenses 772,006 8.64 0.16
Royalty and Lease Obligations 255,251 2.86 0.05
Cobalt Credit 3 0.52
Total After Cobalt Credit 0.44
Table 25-39 Operating cost summary 25.7.2 Assumptions Conversion rates utilized in the estimate for other currencies are:
1 USD = 0.82 Euro 1 USD = 0.56 GBP 1 USD = 6.30 ZAR
No allowance has been made in the estimate for forecast fluctuations in exchange rates subsequently to the base date of the estimate The estimate has a base date of March 2006. All costs are expressed in US Dollar (USD) terms.
25.7.3 Exclusions The following items are excluded from this operating cost estimate:
Product marketing and royalties (included in the economic analysis) Sustaining capital (included in the economic analysis) Taxation on profit (included in the economic analysis) Research Insurance
3 Cobalt credit is the pounds of cobalt produced multiplied by the cobalt metal price
Kamoto Copper Company
AMENDED TECHNICAL REPORT
KAMOTO REDEVELOPMENT PROJECT
File reference - 701-001-01-0000-00-CM-0010 Page 180 of 204
Escalation after base date of the estimate Interest on capital loans (included in the economic analysis)
In general, all of the risk factors that are identified in exclusions from the capital cost estimate (see section 25.7.1.5) also apply to operations and no allowance for these risk factors has been included in the operating cost estimate.
25.8 Economic analysis 25.8.1 Introduction The financial model used in the Pre Feasibility study has been updated and expanded in the feasibility study in consultation with KML. The model has been developed in real terms i.e. no escalation in revenues or costs. The model takes monthly capital, operating costs and revenue into account. These values are than annualised before the income statement from which the project returns are calculated. The financial model allows the returns to the different entities (KCC, KML and GMC) to be calculated depending on the level of debt financing. The GMC valuation was based on Article 6 of the agreement between GMC and KCC. According to Article 6 of the agreement between Gecamines and KCC, ownership of the assets would continue to reside with GMC with any equipment and facilities acquired outside of the leased assets being ceded to GMC at an agreed upon rate at termination of the agreement. Consequently, no attempt was made to establish a value for the assets and any liabilities that may accrue with ownership. Rather, the focus of financial modelling was on estimating the costs and revenues that would be produced for the specified production schedule. The production schedule was driven by the capacity of the concentrator and hydro-metallurgical plants as well as the underground mine’s sulphide ore production rate. The sulphide to oxide concentrate balance in the hydro-metallurgical plant then effectively created an oxide and dolomitic ore demand which the surface mine plan strove to achieve. Revenue was estimated based on the grade of ore mined and the recovery achieved for the different ore types by the various plants. The shipping costs required to get the product to market were then subtracted to determine the net revenue. Capital cost comprised of both the cost of rehabilitating the Kamoto assets in four phases as well as the ongoing sustaining capital cost for replacement of mining equipment and maintaining the plants.
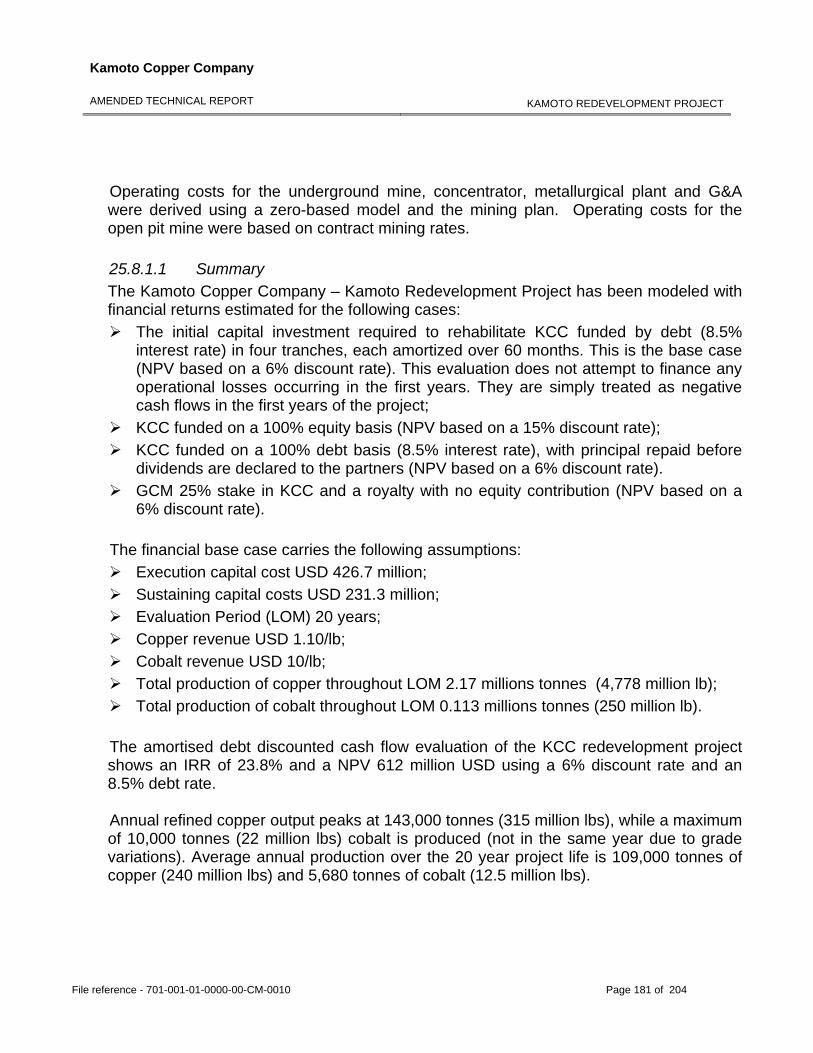
Kamoto Copper Company
AMENDED TECHNICAL REPORT
KAMOTO REDEVELOPMENT PROJECT
File reference - 701-001-01-0000-00-CM-0010 Page 181 of 204
Operating costs for the underground mine, concentrator, metallurgical plant and G&A were derived using a zero-based model and the mining plan. Operating costs for the open pit mine were based on contract mining rates. 25.8.1.1 Summary The Kamoto Copper Company – Kamoto Redevelopment Project has been modeled with financial returns estimated for the following cases:
The initial capital investment required to rehabilitate KCC funded by debt (8.5% interest rate) in four tranches, each amortized over 60 months. This is the base case (NPV based on a 6% discount rate). This evaluation does not attempt to finance any operational losses occurring in the first years. They are simply treated as negative cash flows in the first years of the project;
KCC funded on a 100% equity basis (NPV based on a 15% discount rate); KCC funded on a 100% debt basis (8.5% interest rate), with principal repaid before
dividends are declared to the partners (NPV based on a 6% discount rate). GCM 25% stake in KCC and a royalty with no equity contribution (NPV based on a
6% discount rate). The financial base case carries the following assumptions:
Execution capital cost USD 426.7 million; Sustaining capital costs USD 231.3 million; Evaluation Period (LOM) 20 years; Copper revenue USD 1.10/lb; Cobalt revenue USD 10/lb; Total production of copper throughout LOM 2.17 millions tonnes (4,778 million lb); Total production of cobalt throughout LOM 0.113 millions tonnes (250 million lb).
The amortised debt discounted cash flow evaluation of the KCC redevelopment project shows an IRR of 23.8% and a NPV 612 million USD using a 6% discount rate and an 8.5% debt rate. Annual refined copper output peaks at 143,000 tonnes (315 million lbs), while a maximum of 10,000 tonnes (22 million lbs) cobalt is produced (not in the same year due to grade variations). Average annual production over the 20 year project life is 109,000 tonnes of copper (240 million lbs) and 5,680 tonnes of cobalt (12.5 million lbs).
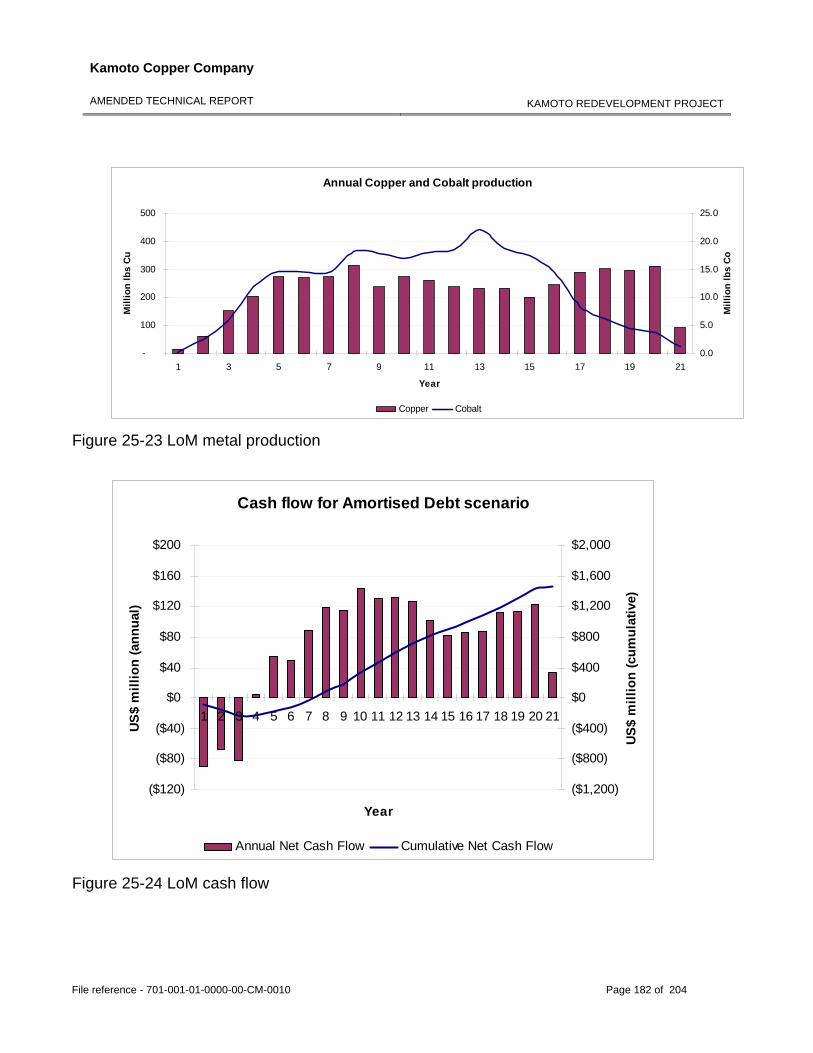
Kamoto Copper Company
AMENDED TECHNICAL REPORT
KAMOTO REDEVELOPMENT PROJECT
File reference - 701-001-01-0000-00-CM-0010 Page 182 of 204
Annual Copper and Cobalt production
-
100
200
300
400
500
1 3 5 7 9 11 13 15 17 19 21
Year
Mill
ion
lbs
Cu
0.0
5.0
10.0
15.0
20.0
25.0
Mill
ion
lbs
Co
Copper Cobalt
Figure 25-23 LoM metal production
Cash flow for Amortised Debt scenario
($120)
($80)
($40)
$0
$40
$80
$120
$160
$200
1 2 3 4 5 6 7 8 9 10 11 12 13 14 15 16 17 18 19 20 21
Year
US$
mill
ion
(ann
ual)
($1,200)
($800)
($400)
$0
$400
$800
$1,200
$1,600
$2,000
US$
mill
ion
(cum
ulat
ive)
Annual Net Cash Flow Cumulative Net Cash Flow
Figure 25-24 LoM cash flow
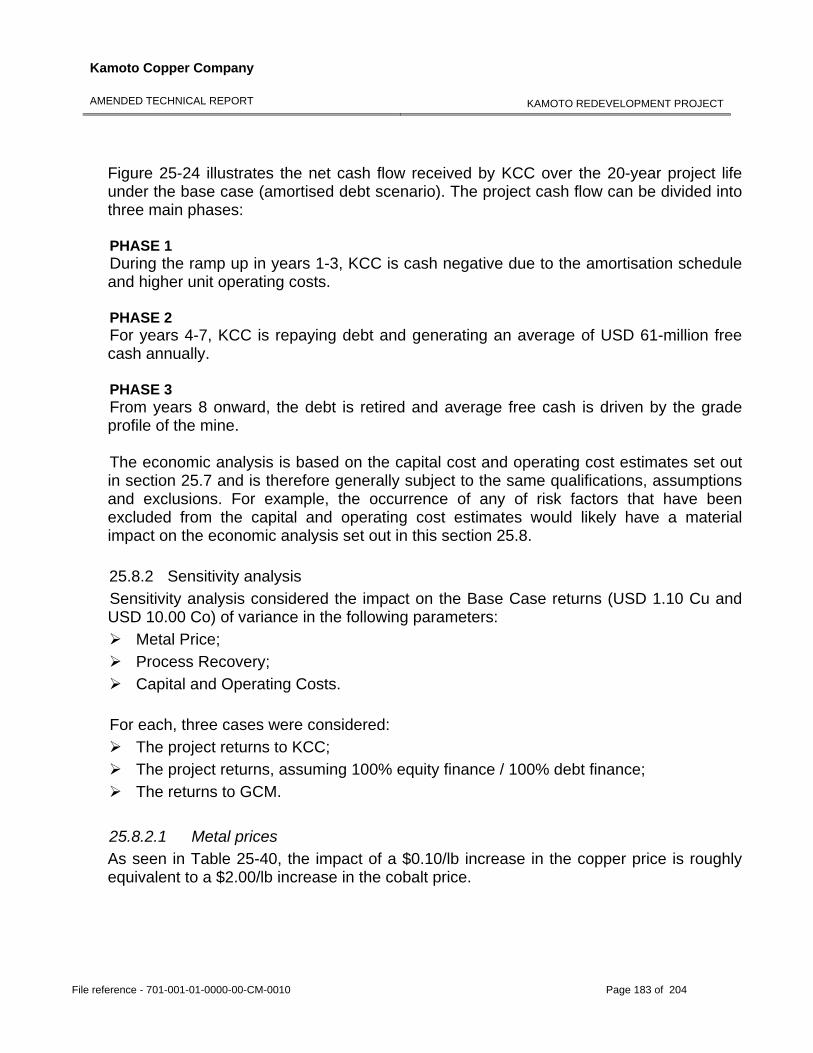
Kamoto Copper Company
AMENDED TECHNICAL REPORT
KAMOTO REDEVELOPMENT PROJECT
File reference - 701-001-01-0000-00-CM-0010 Page 183 of 204
Figure 25-24 illustrates the net cash flow received by KCC over the 20-year project life under the base case (amortised debt scenario). The project cash flow can be divided into three main phases: PHASE 1 During the ramp up in years 1-3, KCC is cash negative due to the amortisation schedule and higher unit operating costs. PHASE 2 For years 4-7, KCC is repaying debt and generating an average of USD 61-million free cash annually. PHASE 3 From years 8 onward, the debt is retired and average free cash is driven by the grade profile of the mine.
The economic analysis is based on the capital cost and operating cost estimates set out in section 25.7 and is therefore generally subject to the same qualifications, assumptions and exclusions. For example, the occurrence of any of risk factors that have been excluded from the capital and operating cost estimates would likely have a material impact on the economic analysis set out in this section 25.8.
25.8.2 Sensitivity analysis Sensitivity analysis considered the impact on the Base Case returns (USD 1.10 Cu and USD 10.00 Co) of variance in the following parameters:
Metal Price; Process Recovery; Capital and Operating Costs.
For each, three cases were considered:
The project returns to KCC; The project returns, assuming 100% equity finance / 100% debt finance; The returns to GCM.
25.8.2.1 Metal prices As seen in Table 25-40, the impact of a $0.10/lb increase in the copper price is roughly equivalent to a $2.00/lb increase in the cobalt price.
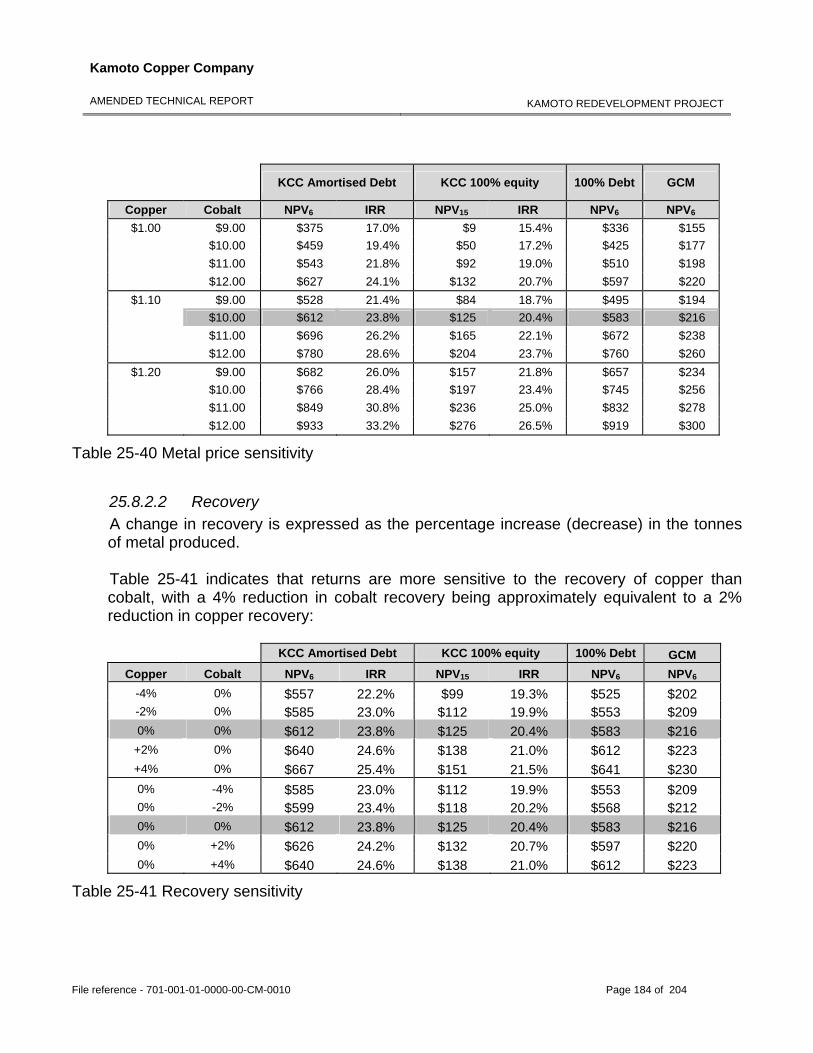
Kamoto Copper Company
AMENDED TECHNICAL REPORT
KAMOTO REDEVELOPMENT PROJECT
File reference - 701-001-01-0000-00-CM-0010 Page 184 of 204
KCC Amortised Debt KCC 100% equity 100% Debt GCM
Copper Cobalt NPV6 IRR NPV15 IRR NPV6 NPV6
$1.00 $9.00 $375 17.0% $9 15.4% $336 $155 $10.00 $459 19.4% $50 17.2% $425 $177 $11.00 $543 21.8% $92 19.0% $510 $198 $12.00 $627 24.1% $132 20.7% $597 $220
$1.10 $9.00 $528 21.4% $84 18.7% $495 $194 $10.00 $612 23.8% $125 20.4% $583 $216 $11.00 $696 26.2% $165 22.1% $672 $238 $12.00 $780 28.6% $204 23.7% $760 $260
$1.20 $9.00 $682 26.0% $157 21.8% $657 $234 $10.00 $766 28.4% $197 23.4% $745 $256 $11.00 $849 30.8% $236 25.0% $832 $278 $12.00 $933 33.2% $276 26.5% $919 $300
Table 25-40 Metal price sensitivity
25.8.2.2 Recovery A change in recovery is expressed as the percentage increase (decrease) in the tonnes of metal produced. Table 25-41 indicates that returns are more sensitive to the recovery of copper than cobalt, with a 4% reduction in cobalt recovery being approximately equivalent to a 2% reduction in copper recovery:
KCC Amortised Debt KCC 100% equity 100% Debt GCM Copper Cobalt NPV6 IRR NPV15 IRR NPV6 NPV6
-4% 0% $557 22.2% $99 19.3% $525 $202 -2% 0% $585 23.0% $112 19.9% $553 $209 0% 0% $612 23.8% $125 20.4% $583 $216
+2% 0% $640 24.6% $138 21.0% $612 $223 +4% 0% $667 25.4% $151 21.5% $641 $230 0% -4% $585 23.0% $112 19.9% $553 $209 0% -2% $599 23.4% $118 20.2% $568 $212 0% 0% $612 23.8% $125 20.4% $583 $216 0% +2% $626 24.2% $132 20.7% $597 $220 0% +4% $640 24.6% $138 21.0% $612 $223
Table 25-41 Recovery sensitivity
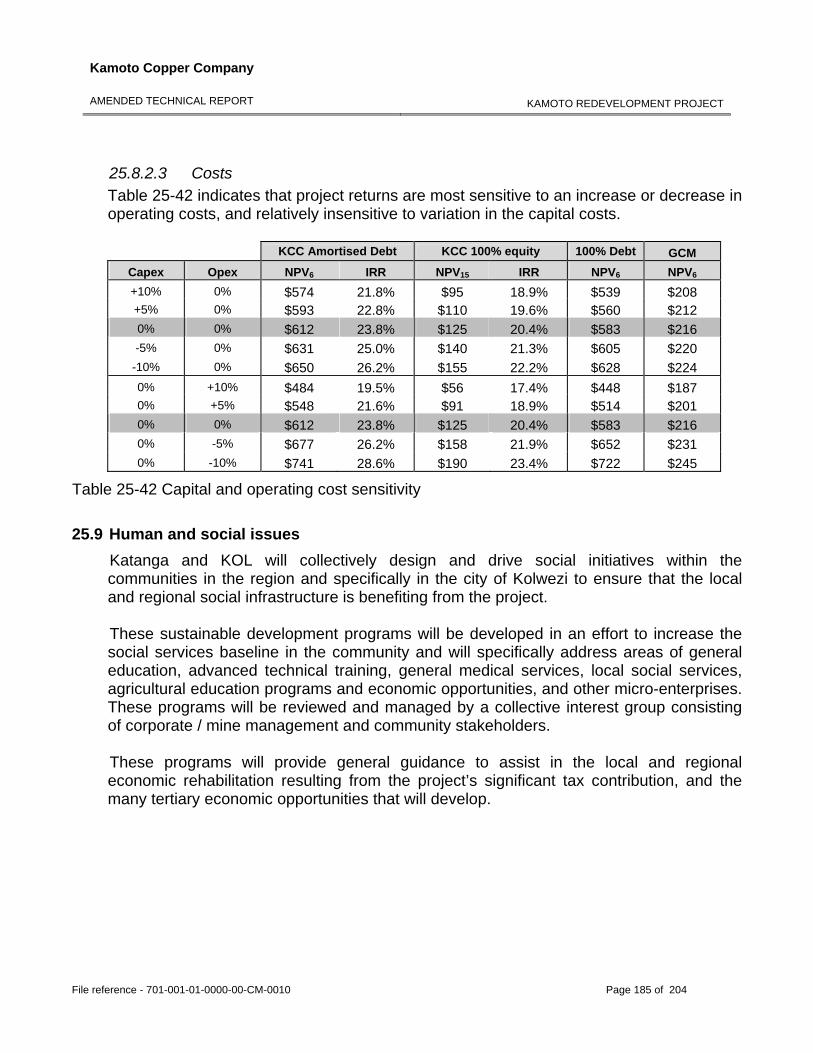
Kamoto Copper Company
AMENDED TECHNICAL REPORT
KAMOTO REDEVELOPMENT PROJECT
File reference - 701-001-01-0000-00-CM-0010 Page 185 of 204
25.8.2.3 Costs Table 25-42 indicates that project returns are most sensitive to an increase or decrease in operating costs, and relatively insensitive to variation in the capital costs.
KCC Amortised Debt KCC 100% equity 100% Debt GCM Capex Opex NPV6 IRR NPV15 IRR NPV6 NPV6
+10% 0% $574 21.8% $95 18.9% $539 $208 +5% 0% $593 22.8% $110 19.6% $560 $212 0% 0% $612 23.8% $125 20.4% $583 $216 -5% 0% $631 25.0% $140 21.3% $605 $220
-10% 0% $650 26.2% $155 22.2% $628 $224 0% +10% $484 19.5% $56 17.4% $448 $187 0% +5% $548 21.6% $91 18.9% $514 $201 0% 0% $612 23.8% $125 20.4% $583 $216 0% -5% $677 26.2% $158 21.9% $652 $231 0% -10% $741 28.6% $190 23.4% $722 $245
Table 25-42 Capital and operating cost sensitivity 25.9 Human and social issues
Katanga and KOL will collectively design and drive social initiatives within the communities in the region and specifically in the city of Kolwezi to ensure that the local and regional social infrastructure is benefiting from the project. These sustainable development programs will be developed in an effort to increase the social services baseline in the community and will specifically address areas of general education, advanced technical training, general medical services, local social services, agricultural education programs and economic opportunities, and other micro-enterprises. These programs will be reviewed and managed by a collective interest group consisting of corporate / mine management and community stakeholders. These programs will provide general guidance to assist in the local and regional economic rehabilitation resulting from the project’s significant tax contribution, and the many tertiary economic opportunities that will develop.
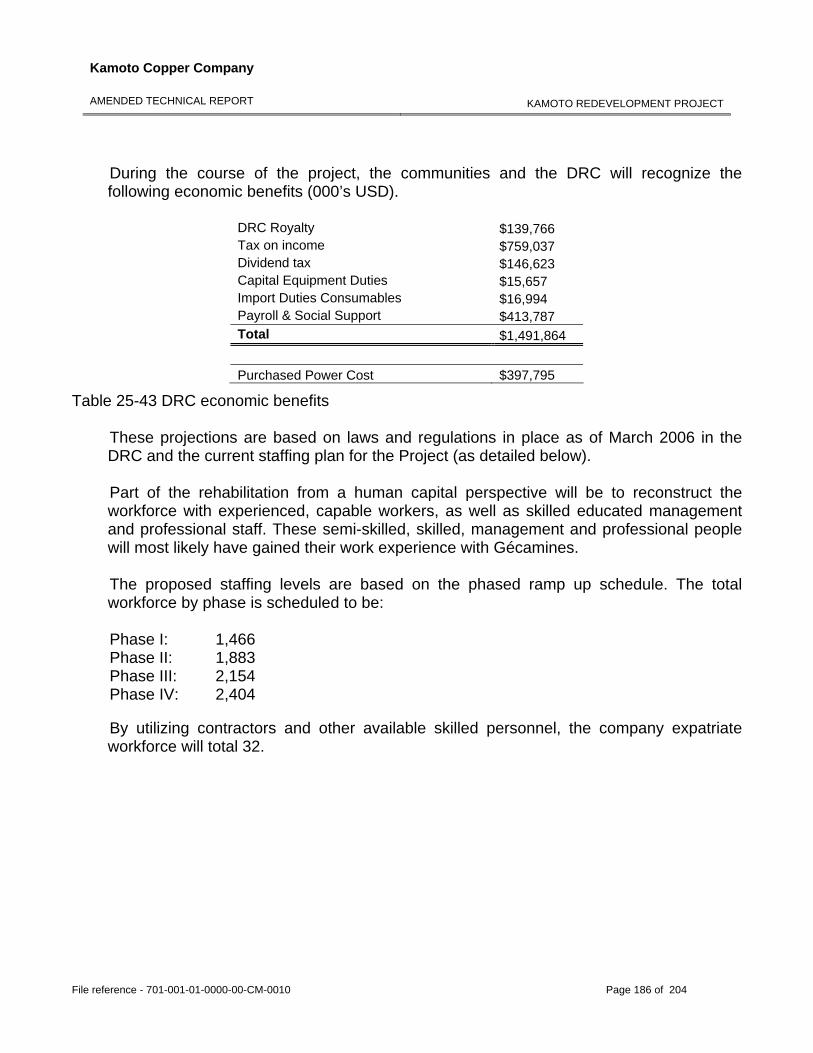
Kamoto Copper Company
AMENDED TECHNICAL REPORT
KAMOTO REDEVELOPMENT PROJECT
File reference - 701-001-01-0000-00-CM-0010 Page 186 of 204
During the course of the project, the communities and the DRC will recognize the following economic benefits (000’s USD).
DRC Royalty $139,766 Tax on income $759,037 Dividend tax $146,623 Capital Equipment Duties $15,657 Import Duties Consumables $16,994 Payroll & Social Support $413,787 Total $1,491,864 Purchased Power Cost $397,795
Table 25-43 DRC economic benefits These projections are based on laws and regulations in place as of March 2006 in the DRC and the current staffing plan for the Project (as detailed below). Part of the rehabilitation from a human capital perspective will be to reconstruct the workforce with experienced, capable workers, as well as skilled educated management and professional staff. These semi-skilled, skilled, management and professional people will most likely have gained their work experience with Gécamines. The proposed staffing levels are based on the phased ramp up schedule. The total workforce by phase is scheduled to be: Phase I: 1,466 Phase II: 1,883 Phase III: 2,154 Phase IV: 2,404
By utilizing contractors and other available skilled personnel, the company expatriate workforce will total 32.
Kamoto Copper Company
AMENDED TECHNICAL REPORT
KAMOTO REDEVELOPMENT PROJECT
File reference - 701-001-01-0000-00-CM-0010 Page 187 of 204
26.0 APPENDICES 26.1 Copies of Mineral Concession certificates
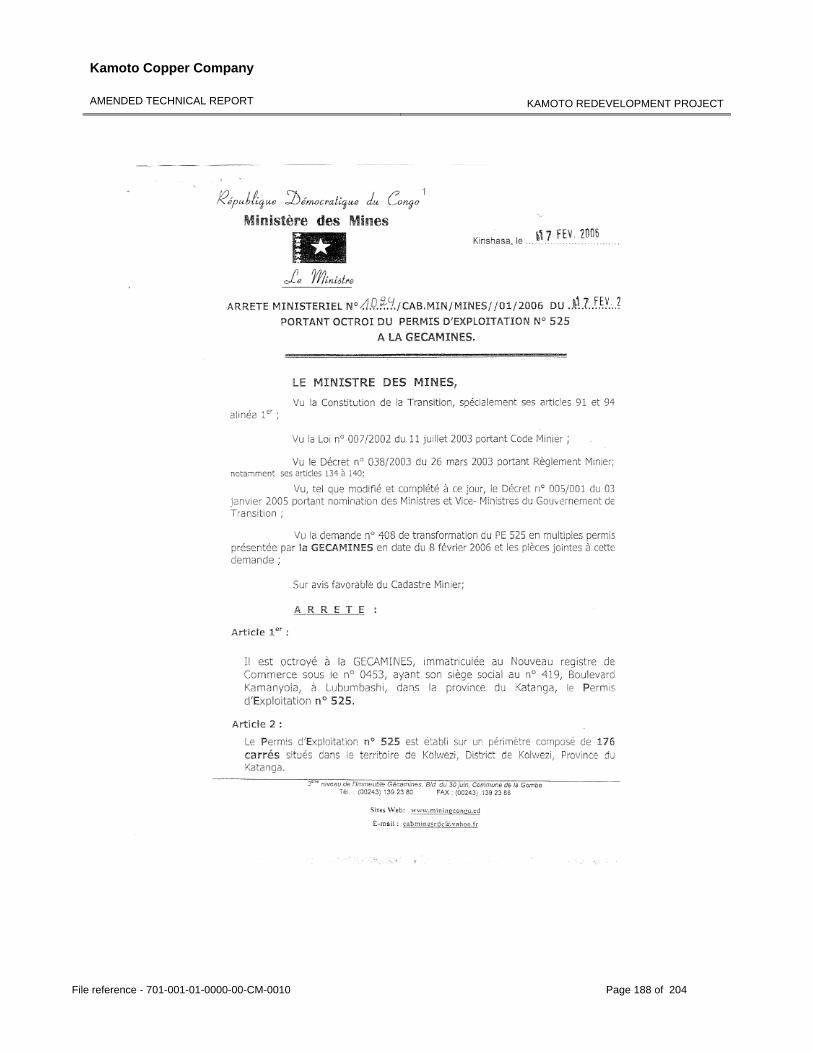
Kamoto Copper Company
AMENDED TECHNICAL REPORT
KAMOTO REDEVELOPMENT PROJECT
File reference - 701-001-01-0000-00-CM-0010 Page 188 of 204
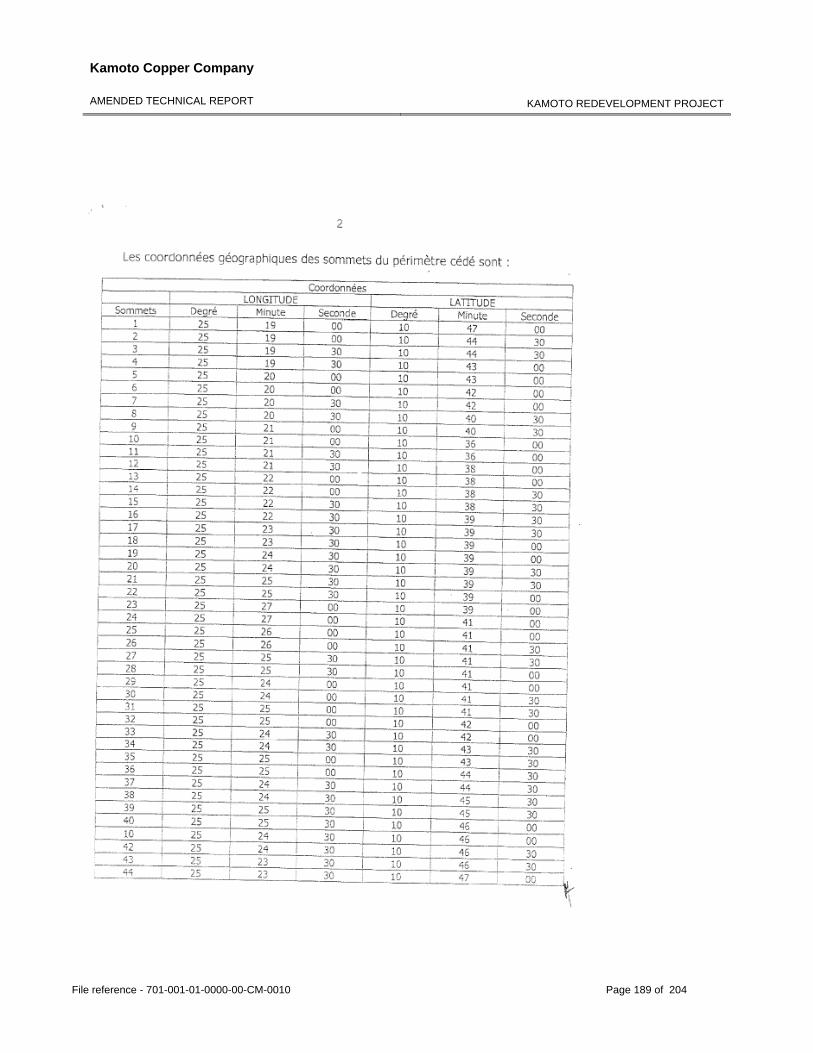
Kamoto Copper Company
AMENDED TECHNICAL REPORT
KAMOTO REDEVELOPMENT PROJECT
File reference - 701-001-01-0000-00-CM-0010 Page 189 of 204
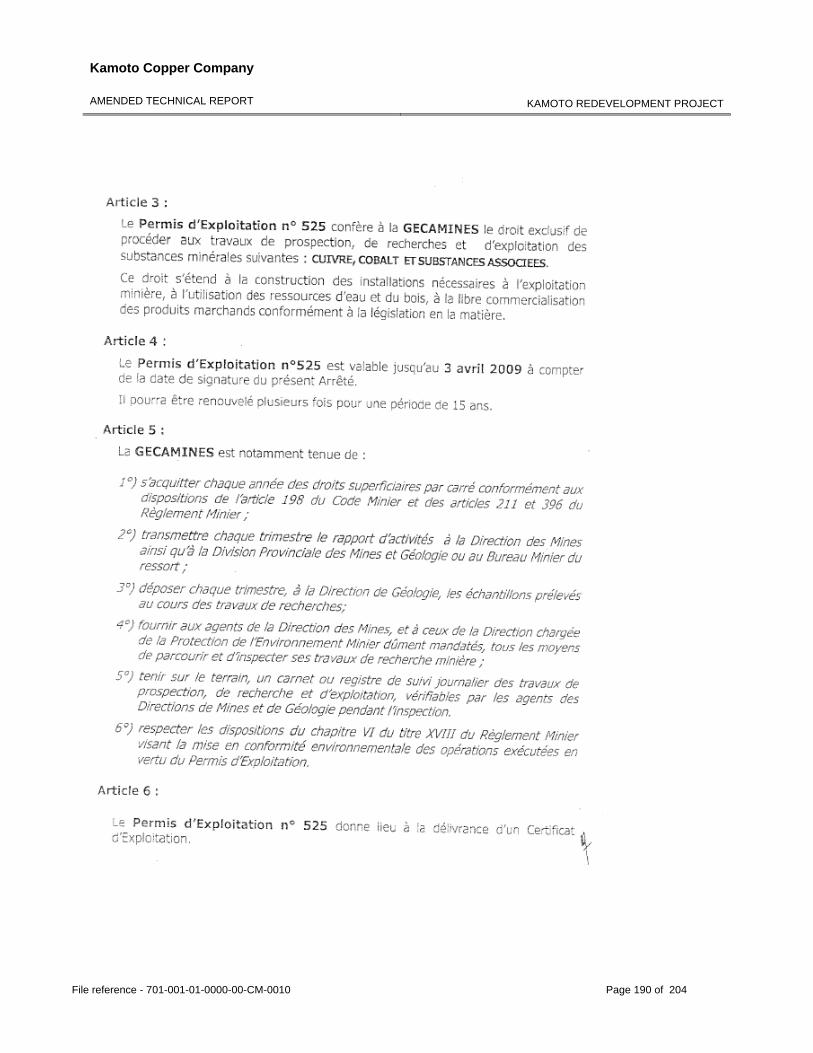
Kamoto Copper Company
AMENDED TECHNICAL REPORT
KAMOTO REDEVELOPMENT PROJECT
File reference - 701-001-01-0000-00-CM-0010 Page 190 of 204
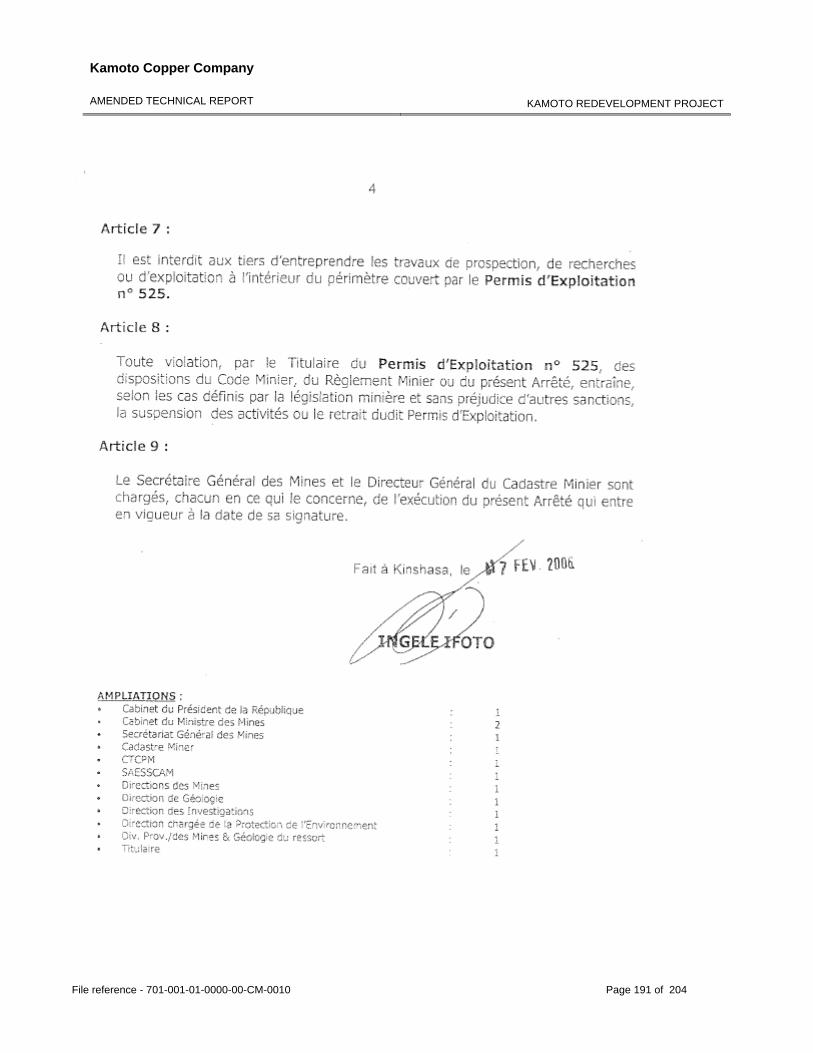
Kamoto Copper Company
AMENDED TECHNICAL REPORT
KAMOTO REDEVELOPMENT PROJECT
File reference - 701-001-01-0000-00-CM-0010 Page 191 of 204
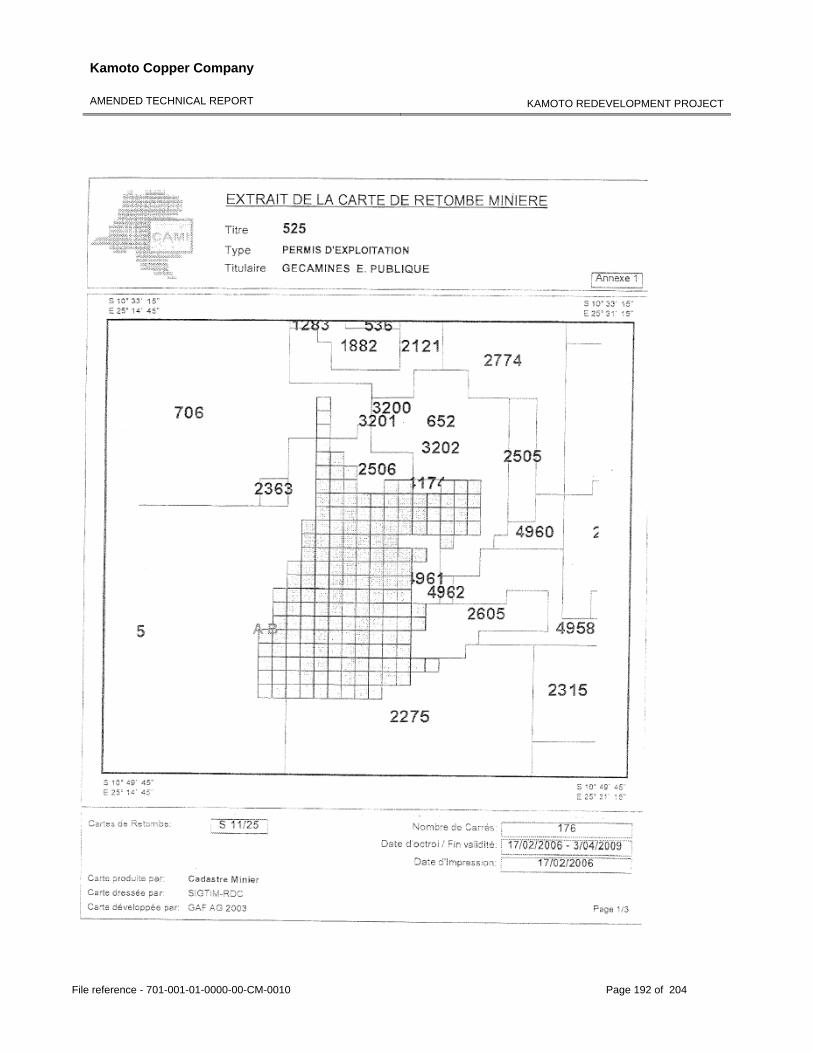
Kamoto Copper Company
AMENDED TECHNICAL REPORT
KAMOTO REDEVELOPMENT PROJECT
File reference - 701-001-01-0000-00-CM-0010 Page 192 of 204
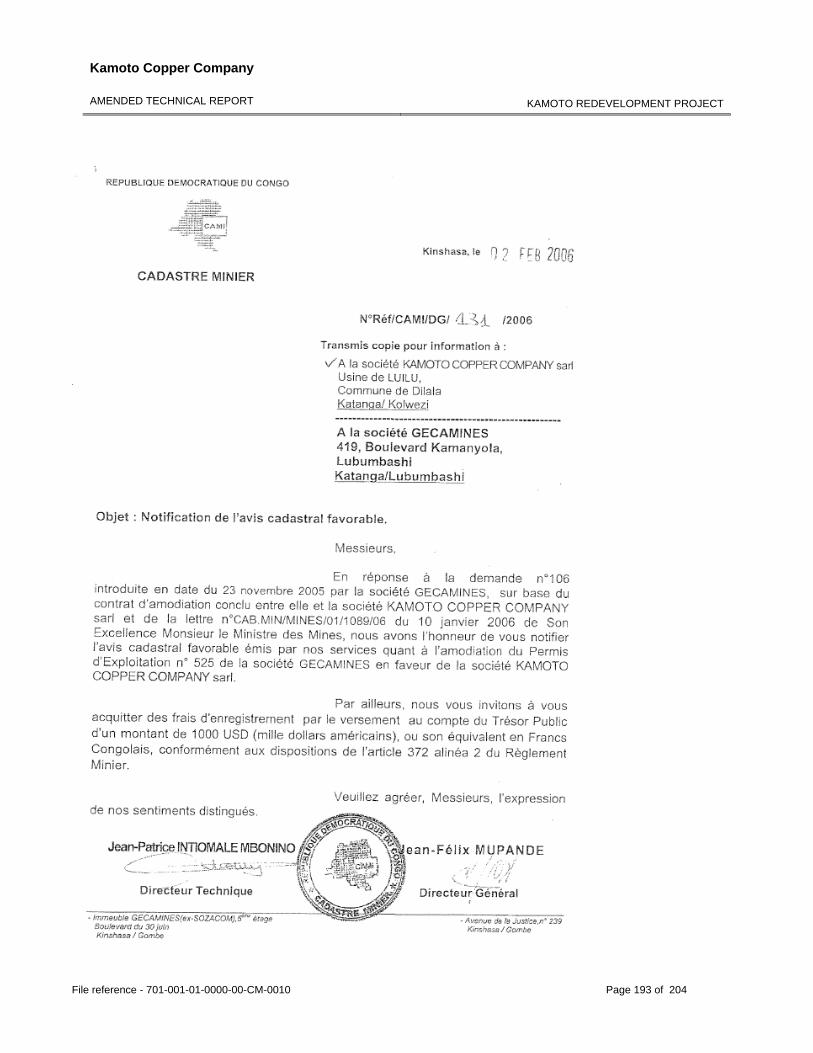
Kamoto Copper Company
AMENDED TECHNICAL REPORT
KAMOTO REDEVELOPMENT PROJECT
File reference - 701-001-01-0000-00-CM-0010 Page 193 of 204
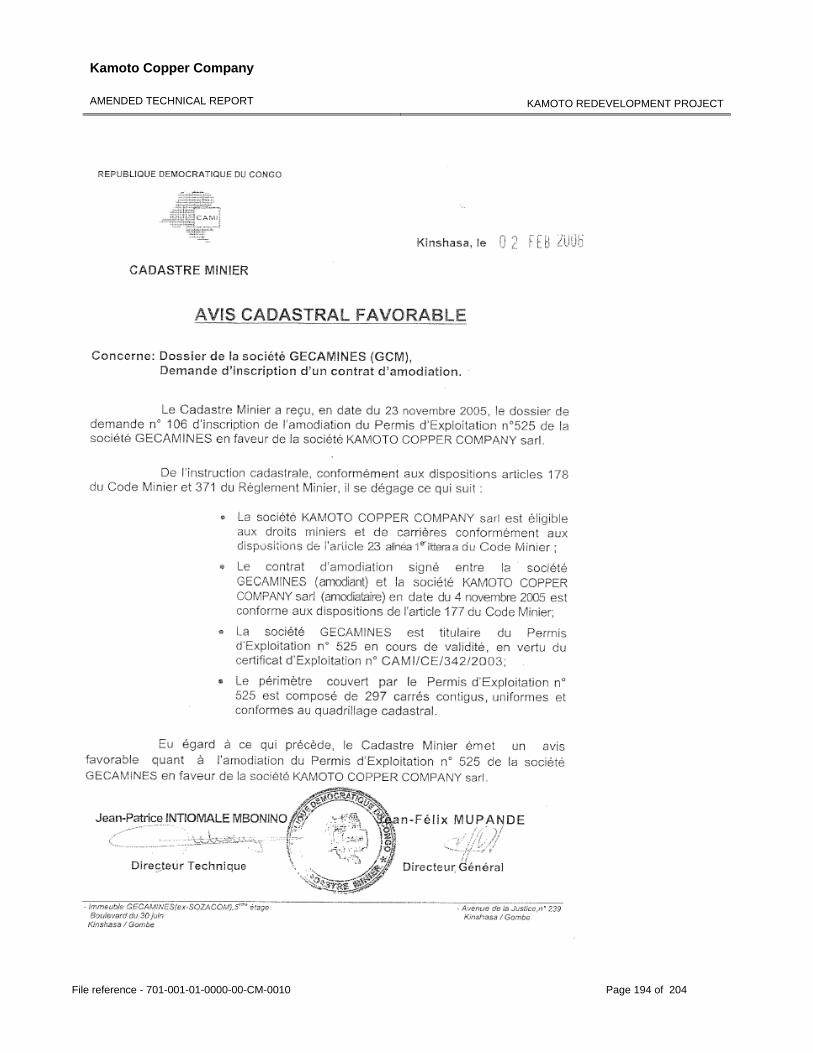
Kamoto Copper Company
AMENDED TECHNICAL REPORT
KAMOTO REDEVELOPMENT PROJECT
File reference - 701-001-01-0000-00-CM-0010 Page 194 of 204
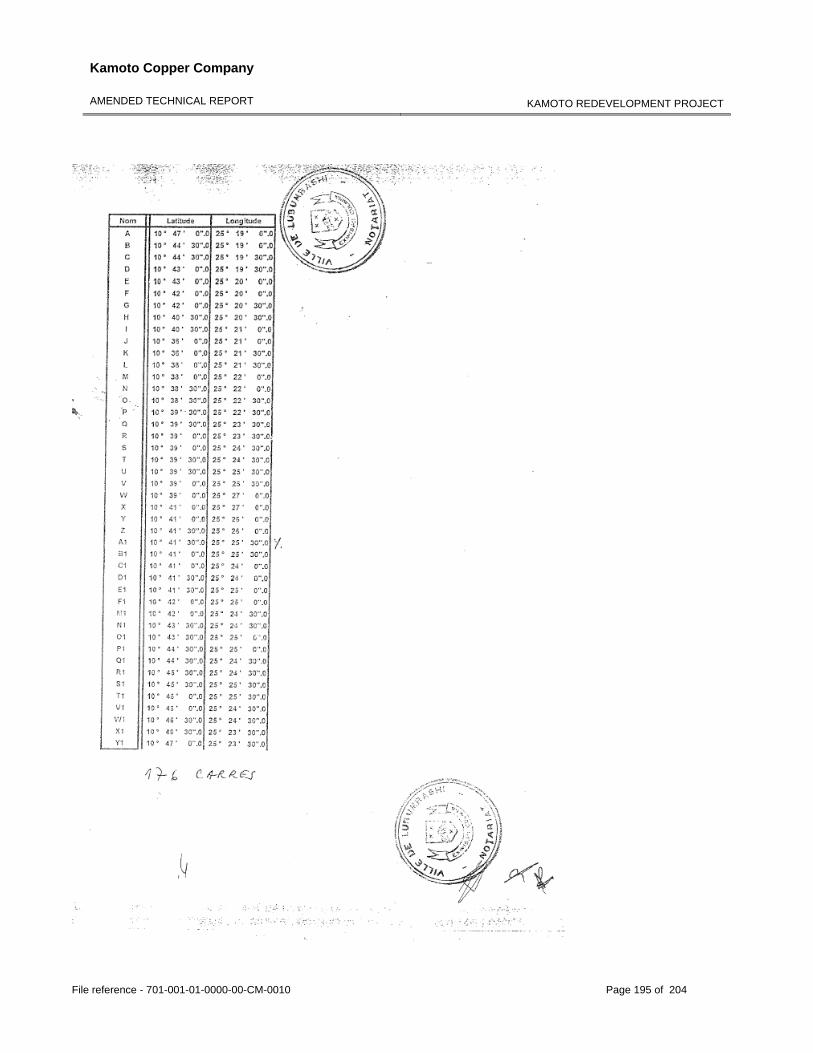
Kamoto Copper Company
AMENDED TECHNICAL REPORT
KAMOTO REDEVELOPMENT PROJECT
File reference - 701-001-01-0000-00-CM-0010 Page 195 of 204
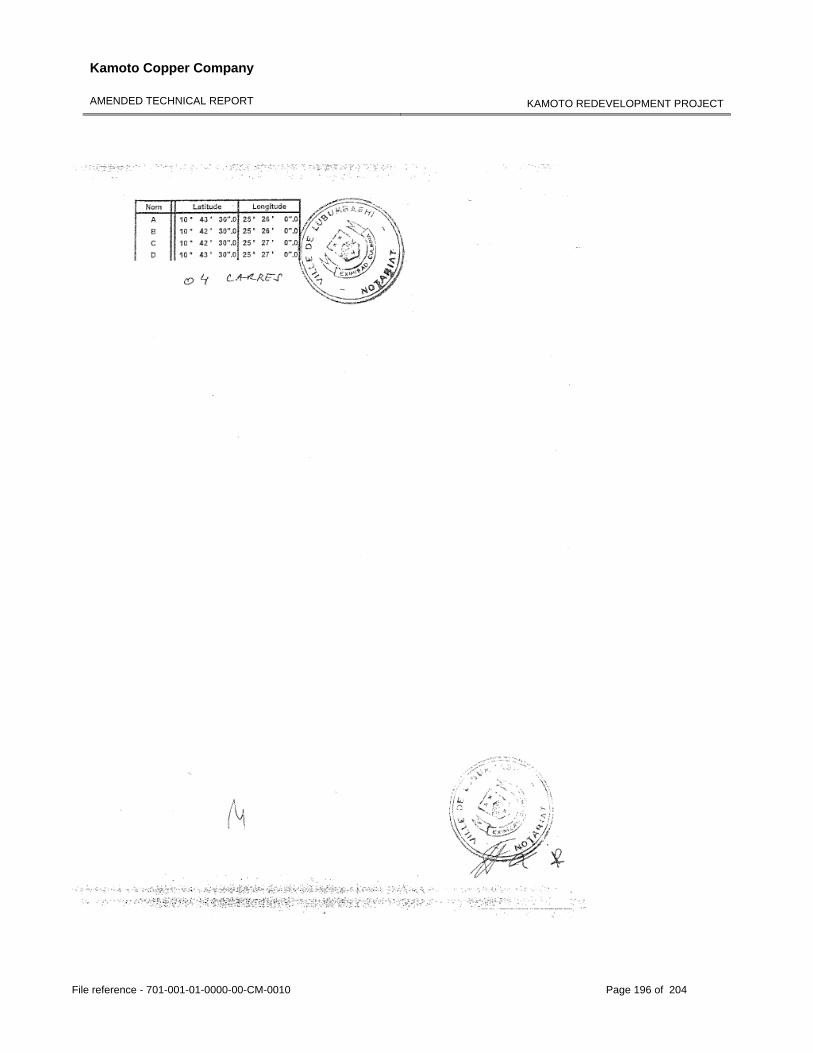
Kamoto Copper Company
AMENDED TECHNICAL REPORT
KAMOTO REDEVELOPMENT PROJECT
File reference - 701-001-01-0000-00-CM-0010 Page 196 of 204
Kamoto Copper Company
AMENDED TECHNICAL REPORT
KAMOTO REDEVELOPMENT PROJECT
File reference - 701-001-01-0000-00-CM-0010 Page 197 of 204
Kamoto Copper Company
AMENDED TECHNICAL REPORT
KAMOTO REDEVELOPMENT PROJECT
File reference - 701-001-01-0000-00-CM-0010 Page 198 of 204
Kamoto Copper Company
AMENDED TECHNICAL REPORT
KAMOTO REDEVELOPMENT PROJECT
File reference - 701-001-01-0000-00-CM-0010 Page 199 of 204
Kamoto Copper Company
AMENDED TECHNICAL REPORT
KAMOTO REDEVELOPMENT PROJECT
File reference - 701-001-01-0000-00-CM-0010 Page 200 of 204
26.2 Glossary 26.2.1 Terminology and unit conversion In Canada, the Metric System or SI System is the primary system of measure and length is generally expressed in kilometres, metres and centimetres, volume is expressed as cubic metres, mass expressed as metric tonnes, and nickel and copper grades are generally expressed as percent. The precious and platinum-group metals grades are generally expressed as ounce per ton but may also be in parts per billion or parts per million. Conversions from the SI or Metric System to the Imperial System are provided below and quoted where practical. Many of the geologic publications and more recent work assessment files now use the SI system but older work assessment files almost exclusively refer to the Imperial System. Metals and minerals acronyms in this report conform to mineral industry accepted usage and the reader is directed to an online source at www.maden.hacettepe.edu.tr/dmmrt/index.html.
Conversion factors utilized in this report include: 1 troy ounces/ton = 34.29 gram/tonne; 0.029 troy ounces/ton = 1 gram/tonne; 1 troy ounces/ton = 31.1035 gram/ton; 0.032 troy ounces/ton = 1 gram/ton; 1 gram = 0.0322 troy ounces; 1 troy ounce = 31.104 grams; 1 pound = 0.454 kilograms; 1 foot = 0.3048 metres; 1 mile = 1.609 kilometres; 1 acre = 0.405 hectares; and, 1 sq mile = 2.59 square kilometres. The term gram/tonne or g/t is expressed as “gram per tonne” where 1 gram/tonne = 1 ppm (part per million) = 1000 ppb (part per billion). Other abbreviations include ppb = parts per billion; ppm = parts per million; opt or oz/t = ounce per short ton; Moz = million ounces; Mt = million tonne; t = tonne (1000 kilograms); SG = specific gravity; lb/t = pound/tonne; and, st = short ton (2000 pounds). Dollars are expressed in United States currency (USD) unless otherwise noted. Nickel, copper and cobalt prices are stated as USD per pound (USD/lb) whereas gold, silver and platinum-group metals prices are stated in USD per troy ounce (USD/oz). (For more detailed descriptions or for geological, mining and mineral related terms not covered in this glossary, one should consult a reputable dictionary or source of related technical definitions) “aeolian” relating to or caused by wind “anomaly” an abnormal find or result “Archaean” a geological era greater than 2.5 Ga “assay” the analysis of minerals and mine products to determine the
concentration of their components
Kamoto Copper Company
AMENDED TECHNICAL REPORT
KAMOTO REDEVELOPMENT PROJECT
File reference - 701-001-01-0000-00-CM-0010 Page 201 of 204
“Au” gold “Bornite” copper iron sulphide (Cu5FeS4). An important copper ore mineral “basic” or “mafic” a term applied to any dark coloured igneous rock which has a high
proportion of pyroxene and olivine “breccia” coarse clastic sedimentary rock, the constituent clasts of which are
angular “Carrollite” copper cobalt sulphide (Cu2S). An important copper ore mineral “Chalcocite” copper sulphide (Cu2S). An important copper ore mineral “Chalcopyrite” copper sulphide (CuS2). A major ore of copper “clast” article of broken down rock “concentrate” a product in which valuable minerals have been enriched
(concentrated) through mineral processing “craton” a large portion of a continental plate that has been relatively
undisturbed since the Precambrian era and includes both shield and platform layers
“Cu” copper “cut-off grade” the break-even or lowest grade of ore in a deposit that will recover
its total mining costs “decline” access to underground via a downward incline or sloping roadway “dip” direction or angle that the plane of a rock formation makes with the
horizontal “dolomite” a chemical sedimentary rock composed largely of calcium
magnesium carbonate (CaMg (CO3)2) “dyke” a sheet-like body of igneous rock cutting across bedding planes of
rock
Kamoto Copper Company
AMENDED TECHNICAL REPORT
KAMOTO REDEVELOPMENT PROJECT
File reference - 701-001-01-0000-00-CM-0010 Page 202 of 204
“flotation process” the process of mixing ground ore with water, chemical reagents and air to separate mineral particles from waste rock., so that the particles stick to air bubbles, which are then skimmed off as an enriched froth (concentrate).
“fire assay” an analytical smelting procedure for determining the precious metal
content in rock and mine products “g/t” grams per tonne (1000 kilogram) “Ga” a thousand million years “gabbro” a coarse grained igneous rock “grade” the element or metal content per unit of material “ha” hectare “Igneous rock” rock formed by crystallization or solidification of magma “Ma” a million years “mafic” general term used to describe rocks containing ferromagnesian
minerals “magma” molten rock material formed within the earth’s crust “metamorphism the processes by which changes are brought about in rocks within
the Earth’s crust through heat, pressure and chemically active fluids “metasomatism” a metamorphic change which involves the introduction of material
from an external source “mineral” a naturally occurring inorganic substance typically with a crystalline
structure “nappe” a large sheet-like body of rock that has been moved far from its
original position “ore” a mineral or rock that can be worked economically “outcrop” rock unit exposure at surface
Kamoto Copper Company
AMENDED TECHNICAL REPORT
KAMOTO REDEVELOPMENT PROJECT
File reference - 701-001-01-0000-00-CM-0010 Page 203 of 204
“Pb” lead “polymetallic” several metals “porphyry” a medium to coarse-grained intrusive felsic igneous rock “Pyrite” iron sulphide mineral “Reserve” that part of a Resource which can be mined at a profit under
reasonably expected economic conditions as defined by the JORC Code
“Resource” mineralised body for which there is sufficient sampling information
and geological understanding to outline a deposit of potential economic merit
“roasting” the thermal oxidation of sulphides at atmospheric pressure “SAMREC” The South African Code for Reporting of Mineral Resources and
Mineral Reserves (the ‘SAMREC Code’ or ‘the Code’) sets out minimum standards, recommendations and guidelines for Public Reporting of exploration results, Mineral Resources and Mineral Reserves in South Africa
“sill” a sheet-like body of igneous rock which conforms to bedding
planes of rock “strata-bound” contained within a stratum “stratiform” strata like “strike” a horizontal level direction or bearing of an inclined rock bed,
structure, vein or stratum surface. The direction is perpendicular to the direction of dip
“strip ratio” ratio of waste rock to ore mined in open cast (pit) mining “sub-outcrop” rock unit exposure below the surface “sulphidation” a relative classification of ore forming environments principally
hydrothermal fluidisation
Kamoto Copper Company
AMENDED TECHNICAL REPORT
KAMOTO REDEVELOPMENT PROJECT
File reference - 701-001-01-0000-00-CM-0010 Page 204 of 204
“sulphide” a mineral in which the element sulphur is in combination with one or more metallic elements
“tailings” the waste products resulting from the processing of ore material “Zn” Zinc
Kamoto Copper Company
AMENDED TECHNICAL REPORT
KAMOTO REDEVELOPMENT PROJECT
File reference - 701-001-01-0000-00-CM-0010
Qualified Person Letters Dr. Scott Jobin-Bevans, P. Geo.; CCIC Mr. Malcolm Paul Lotriet; Pr. Eng., FSAIMM; RSV Mr. Christian Heili, Pr. Eng., FSAIMM; Hatch Mr. Adriaan Meintjes; SRK Mr. Alan Naismith; SRK
Scott Jobin-Bevans Suite 203 – 210 Cedar Street
Sudbury, Ontario, Canada, P3B 1M6 Telephone: 705-671-1801, Fax: 705-671-3665
Email: [email protected]
CERTIFICATE of AUTHOR
I, Scott Jobin-Bevans, P.Geo., do hereby certify that: 1. I am Managing Director (The Americas, Europe and Asia) and Senior Geologist of:
Caracle Creek International Consulting Inc. Suite 203 – 210 Cedar Street, Sudbury, Ontario, Canada, P3B 1M6
2. I graduated with a B.Sc. (Hons) Geology degree from the University of Manitoba in 1995. In addition,
I have obtained a M.Sc. Geology in 1997 from the University of Manitoba and Ph.D. Geology in 2004 from the University of Western Ontario.
3. I am a registered Professional Geoscientist with the Association of Professional Geoscientists of
Ontario (#0183) and a member in good standing of the Society of Economic Geologists, the Prospectors and Developers Association of Canada, and the Canadian Institute of Mining, Metallurgy and Petroleum.
4. I have worked in the minerals industry for more than 17 years and as a Geologist for more than 10
years since my graduation from university. 5. I have read the definition of “qualified person” set out in National Instrument 43-101 (“NI 43-101”)
and certify that by reason of my education, affiliation with a professional association (as defined in NI 43-101) and past relevant work experience, I fulfill the requirements to be a “qualified person” for the purposes of NI 43-101.
6. I am responsible for the preparation of Sections 3.1-3.3, 3.4.2, 3.7.2, 4.0. Certain portions of 4.1 that
apply to CCIC, 4.2 summary, 4.2.1, 4.3, 4.4.1, 6.1-6.5, 7.1-7.3, 8.0-17.0, 19.1-19.8, 19.9.2, 19.10, 20.0, 21.1, 22.2, 23.0, and 26.2, of the technical report titled "Amended Technical Report for Kamoto Copper Company Kolwezi, Katanga Province, Democratic Republic of the Congo” and dated June 23rd, 2006 (the “Technical Report”), relating to the underground areas of the Kamoto Mine and the DIMA and Musonoi-T17 West open pits. I visited the Kamoto Mine, DIMA and Musonoi-T17 open pits (the "Property") on November 10th and 11th, 2005 for 2 days.
7. I have not had prior involvement with the properties that are the subject of the Technical Report. 8. I am independent of the issuer in accordance with section 1.4 of National Instrument 43-101. 9. I have read National Instrument 43-101 and Form 43-101F1, and the Technical Report has been
prepared in compliance with that instrument and form. 10. I also certify that as of the date of this certificate, to the best of my knowledge, information and belief,
the Technical Report contains all scientific and technical information that is required to be disclosed to make the Technical Report not misleading.
11. I consent to the filing of the Technical Report with any stock exchange and other regulatory authority
and any publication by them for regulatory purposes, including electronic publication in the public company files on their websites accessible by the public, of the Technical Report.
Dated this 23rd Day of June, 2006. ____________________________________ Scott Jobin-Bevans, Ph.D., P.Geo.
SRK House 265 Oxford Road, Illovo 2196 Johannesburg PO Box 55291 Northlands 2116 South Africa e-Mail: [email protected] URL: http://www.srk.co.za Tel: +27 (11) 441 1111 Fax: +27 (11) 880 8086
Certificate of Author Mein Amended Partners MJ Braune, JM Brown, JAC Cowan, CD Dalgliesh, M Harley, T Hart, NM Holdcroft, PR Labrum, RRW McNeill, HAC Meintjes, BJ Middleton, MJ Morris, GP Murray, VS Reddy, PN Rosewarne, PE Schmidt, PJ Shepherd, AA Smithen, OKH Steffen, PJ Terbrugge, KM Uderstadt, DJ Venter, HG Waldeck, A Wood Directors AJ Barrett, PR Labrum, BJ Middleton, E Molobi, PE Schmidt, PJ Terbrugge, MB Zungu Associates JCJ Boshoff, SA McDonald, DM Duthe, LGA Maclear, GP Nel, JP Odendaal, D Visser, AC White, AC Woodford Consultants AC Burger, BSc (Hons), IS Cameron-Clarke, PrSci Nat, MSc; JH de Beer, PrSci Nat, MSc; GA Jones, PrEng, PhD; WD Ortlepp, PrEng, MEng; K Owen, MSc Eng, DIC; RP Plasket, PrEng, MSc; TR Stacey, PrEng, DSc; RJ Stuart, PrTech Eng, GDE; DW Warwick, PrSci Nat, BSc (Hons)
Cape Town +27 (0) 21 659 3060
Durban +27 (0) 31 312 1355
East London +27 (0) 43 748 6292
Harare +263 (4) 496 182
Johannesburg +27 (0) 11 441 1111
Pietermaritzburg +27 (0) 33 345 6311
Corporate Shareholder: Kagiso Enterprises (Pty) Ltd SRK Consulting (South Africa) (Pty) Ltd
Reg No 1995.012890.07
Port Elizabeth +27 (0) 41 581 1911
Pretoria +27 (0) 12 361 9821
Rustenburg +27 (0) 14 594 1280
CERTIFICATE OF AUTHOR
I, Hendrik Adriaan Cloete Meintjes, Pr Eng do hereby certify that:
1. I am Partner of:
SRK Consulting
SRK House
265 Oxford Road
Illovo
2. I graduated with a degree in Civil Engineering (B Eng Civil) from the University of Stellenbosch in
1981. In addition, I have obtained an Hons B Eng Civil, Stellenbosch (1982); M Eng Civil, Stellenboch,
(1983); M Eng Soil Mechanics, University of London (1987); Diploma of Imperial College University of
London (1987).
3. I am a member (fellow) of the Chartered Engineer of ECSA 930308, South African Institute of Civil
Engineering.
4. I have worked as a Professional Engineer for a total of 25 years since my graduation from university.
5. I have read the definition of “qualified person” set out in National Instruments 43-101 (“NI 43-101”)
and certify that by reason of my education, affiliation with a professional association (as defined in NI
43-101) and past relevant work experience, I fulfil the requirements to be a “qualified person” for the
purposes of NI 43-101.
SRK Consulting Page 2 of 2
STUA/bhaw G:\ENGEO\356391-Kamoto\Report\Certificate\Certificate of Author Mein Amended.doc March 2006
6. I am responsible for the preparation of section 4.2.2, 4.2.3, 4.4.4, 6.7, 6.8, 7.4, 25.2.3, 25.4.3 and 25.5
and the specific capital and operating costs contributed to Section 25.7 of the Technical Report titled
“Amended Technical report for Kamoto Copper Company, Kolwezi, Katanga Province, Democratic
Republic of the Congo” and dated June 23, 2006 (the “Technical Report”) relating to the Kamoto Mine
(particularly the Plateure, Etang and Ecaille underground sections), DIMA (Dikuluwe, Mashamba West
and Mashamba East) open pits and Musonoi-T17 Open Pit property. I visited the Kamoto Mine property
on 23rd to 25th January 2006 for 3 days.
7. I have not had prior involvement with the property (ies) that is (are) the subject of the Technical Report.
8. I am independent of the issuer in accordance with section 1.4 of National Instrument 43-101.
9. I have read National Instrument 43-101 Form 43-101F1, and the Technical report has been prepared in
compliance with the instrument and form.
10. I also certify that as of the date of certificate, to the best of my knowledge, information and belief, the
Technical Report contains all scientific and technical information that is required to be disclosed to make
the Technical Report not misleading.
11. I consent to the filing of the Technical Report with any stock, exchange and other regulatory authority
and any publication by them for regulatory purposes, including electronic publication in the public
company file on their website by the public, of the Technical Report.
Dated this 23 day of June, 2006
Hendrik Adriaan Cloete Meintjes Pr. Eng. ECSA 930308
SRK House 265 Oxford Road, Illovo 2196 Johannesburg PO Box 55291 Northlands 2116 South Africa e-Mail: [email protected] URL: http://www.srk.co.za Tel: +27 (11) 441 1111 Fax: +27 (11) 880 8086
Certificate of Author Nais Amended Partners MJ Braune, JM Brown, JAC Cowan, CD Dalgliesh, M Harley, T Hart, NM Holdcroft, PR Labrum, RRW McNeill, HAC Meintjes, BJ Middleton, MJ Morris, GP Murray, VS Reddy, PN Rosewarne, PE Schmidt, PJ Shepherd, AA Smithen, OKH Steffen, PJ Terbrugge, KM Uderstadt, DJ Venter, HG Waldeck, A Wood Directors AJ Barrett, PR Labrum, BJ Middleton, E Molobi, PE Schmidt, PJ Terbrugge, MB Zungu Associates JCJ Boshoff, SA McDonald, DM Duthe, LGA Maclear, GP Nel, JP Odendaal, D Visser, AC White, AC Woodford Consultants AC Burger, BSc (Hons), IS Cameron-Clarke, PrSci Nat, MSc; JH de Beer, PrSci Nat, MSc; GA Jones, PrEng, PhD; WD Ortlepp, PrEng, MEng; K Owen, MSc Eng, DIC; RP Plasket, PrEng, MSc; TR Stacey, PrEng, DSc; RJ Stuart, PrTech Eng, GDE; DW Warwick, PrSci Nat, BSc (Hons)
Cape Town +27 (0) 21 659 3060
Durban +27 (0) 31 312 1355
East London +27 (0) 43 748 6292
Harare +263 (4) 496 182
Johannesburg +27 (0) 11 441 1111
Pietermaritzburg +27 (0) 33 345 6311
Corporate Shareholder: Kagiso Enterprises (Pty) Ltd SRK Consulting (South Africa) (Pty) Ltd
Reg No 1995.012890.07
Port Elizabeth +27 (0) 41 581 1911
Pretoria +27 (0) 12 361 9821
Rustenburg +27 (0) 14 594 1280
CERTIFICATE OF AUTHOR
I, William Alan Naismith, do hereby certify that:
1. I am Principal Engineer of:
SRK Consulting
SRK House
265 Oxford Road
Illovo
2. I graduated with a degree in BSc (Hons) Engineering Geology from the University of Portsmouth
Polytechnic, UK in 1972. In addition, I have obtained an MSc Rock Mechanics and Excavation
Engineering, Newcastle University, England (1973); MBA, Witwatersrand University, Johannesburg
South Africa (1989).
3. I am a fellow of South African Institute of Mining and Metallurgy (SAIMM) and South African National
Institute of Rock Engineering (SANIRE).
4. I have worked Professionally in Mining Geotechnics for a total of 33 years since my graduation from
university.
5. I have read the definition of “qualified person” set out in National Instruments 43-101 (“NI 43-101”)
and certify that by reason of my education, affiliation with a professional association (as defined in NI
43-101) and past relevant work experience, I fulfil the requirements to be a “qualified person” for the
purposes of NI 43-101.
SRK Consulting Page 2 of 2
STUA/bhaw G:\ENGEO\356391-Kamoto\Report\Certificate\Certificate of Author Nais Amended.doc March 2006
6. I am responsible for the preparation of sections 25.1.11 and 25.2.3 of the Technical Report titled
“Amended Technical Report for Kamoto Copper Company, Kolwezi, Katanga Province, Democratic
Republic of the Congo” and dated June 23, 2006 (the “Technical Report”) relating to the Kamoto Mine
(particularly the Plateure, Etang and Ecaille underground sections), DIMA (Dikuluwe, Mashamba West
and Mashamba East) open pits and Musonoi-T17 Open Pit property. I have not visited the Kamoto Mine
property, but have been responsible for the management of various professional geotechnical engineers
sent from SRK Consulting South Africa practise to carry out various investigations at Kolwezi.
7. I have not had prior involvement with the property (ies) that is (are) the subject of the Technical Report.
8. I am independent of the issuer in accordance with section 1.4 of National Instrument 43-101.
9. I have read National Instrument 43-101 Form 43-101F1, and the Technical report has been prepared in
compliance with the instrument and form.
10. I also certify that as of the date of certificate, to the best of my knowledge, information and belief, the
Technical Report contains all scientific and technical information that is required to be disclosed to make
the Technical Report not misleading.
11. I consent to the filing of the Technical Report with any stock, exchange and other regulatory authority
and any publication by them for regulatory purposes, including electronic publication in the public
company file on their website by the public, of the Technical Report.
Dated this 23 day of June, 2006
William Alan Naismith FSAIMM