Embed Size (px)
Citation preview
Air Impact Assessment
in Myanmar Development
Projects
Moh Moh Thant ZinEnvironmental Consultant
M. Sc ( Environmental Toxicology, Technology & Management), B.Pharm
1
Global Air Pollution
Urban outdoor air pollution - 1.3 million
deaths worldwide annually by WHO.
The global burden of disease from
respiratory infections, heart disease,
and lung cancer - reduced by
controlling ambient air pollution.
2
Air Pollution in Myanmar
Nowadays, in Myanmar, new economic developments and investments are blooming over time.
The energy sector - the most important sector in greenhouse gas (GHGs) emission as GHGs are emitted from combustion of fuel and fugitive emission from fossil fuel production ( Myanmar Initial National Communication under UNFCCC, 2012)
Moreover, there is rapid influx of new developments like oil and gas explorations along with pipeline constructions, gas engine and gas turbine projects across the country.
3
Baseline Ambient Air Monitoring
in Myanmar
Ambient air parameters
- Particulates : TSPM, PM10, PM2.5
- Gases : NO2, SO2, CO, VOC, O3,
CH4, NH3
Meteorology : Temperature, Relative
Humidity, Wind speed, Wind direction
Atomic Radiation
4
WHO, USEPA, IFC & other reliable reference
(i) The sensor intakes – sitting criteria (approx. 3 meters above the ground level) – breathing zone (40 CFR 58 Appendix E - Probe Sitting Criteria for Ambient Air Quality Monitoring)
(ii) Location - within 2km radius around the proposed project site. (assumed as no significant air impact beyond it )
(iii)Sampling time and frequency - monitor 24hr continuously
5
Baseline Ambient Air Monitoring
in Myanmar
State of Air Quality in Myanmar
6
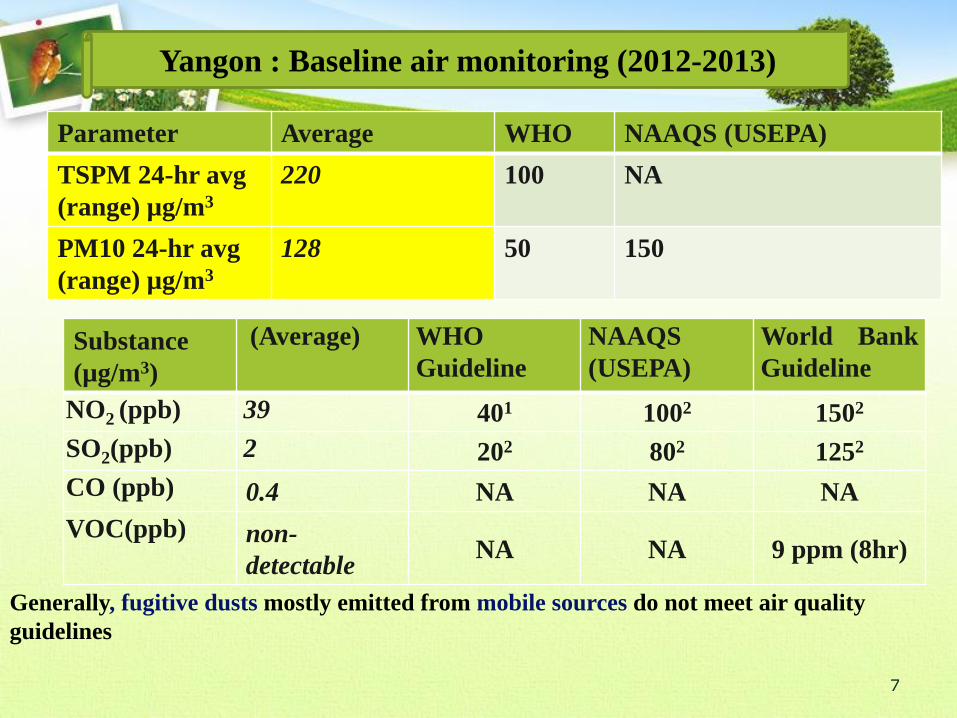
Parameter Average WHO NAAQS (USEPA)
TSPM 24-hr avg
(range) µg/m3
220 100 NA
PM10 24-hr avg
(range) µg/m3
128 50 150
Substance
(µg/m3)
(Average) WHO
Guideline
NAAQS
(USEPA)
World Bank
Guideline
NO2 (ppb) 39 401 1002 1502
SO2(ppb) 2 202 802 1252
CO (ppb) 0.4 NA NA NA
VOC(ppb) non-
detectableNA NA 9 ppm (8hr)
Yangon : Baseline air monitoring (2012-2013)
Generally, fugitive dusts mostly emitted from mobile sources do not meet air quality
guidelines
7
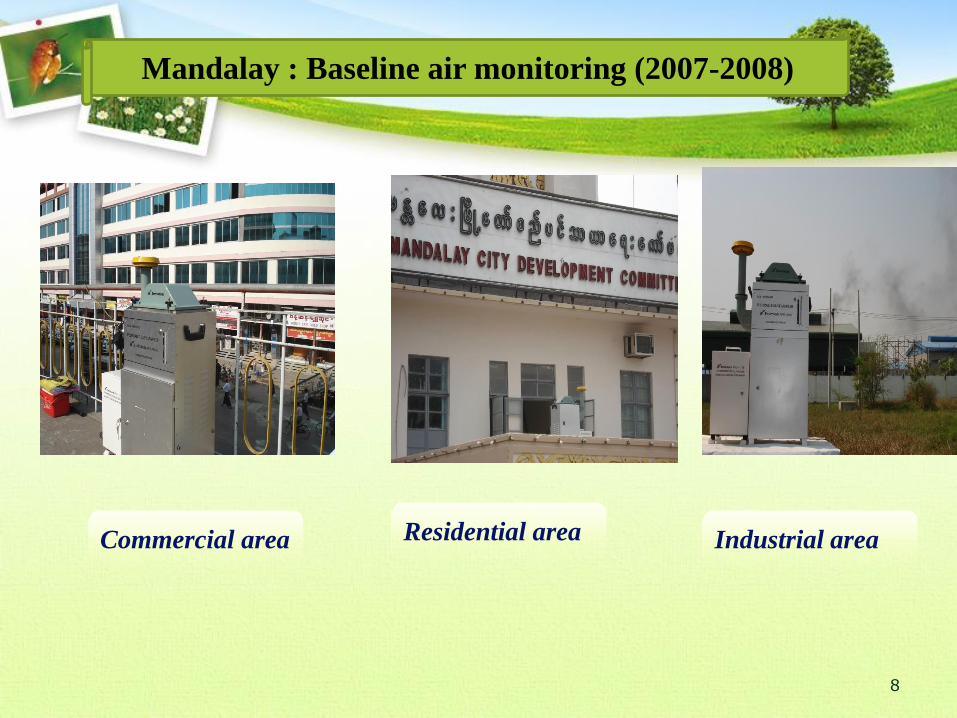
Commercial area Residential area Industrial area
8
Mandalay : Baseline air monitoring (2007-2008)
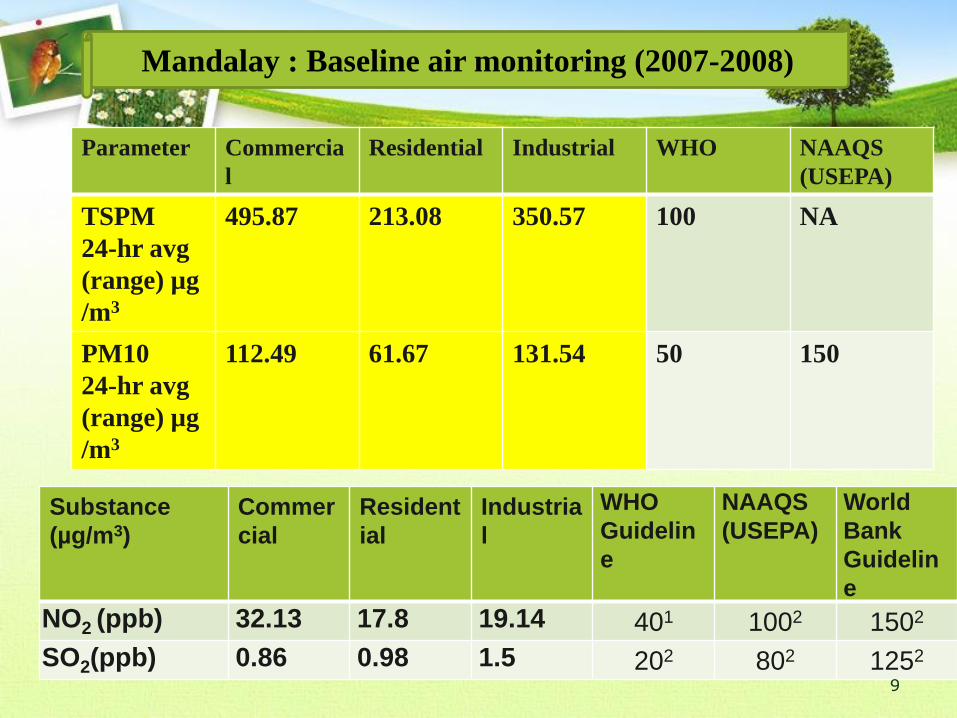
Parameter Commercia
l
Residential Industrial WHO NAAQS
(USEPA)
TSPM
24-hr avg
(range) µg
/m3
495.87 213.08 350.57 100 NA
PM10
24-hr avg
(range) µg
/m3
112.49 61.67 131.54 50 150
Substance
(µg/m3)
Commer
cial
Resident
ial
Industria
l
WHO
Guidelin
e
NAAQS
(USEPA)
World
Bank
Guidelin
e
NO2 (ppb) 32.13 17.8 19.14 401 1002 1502
SO2(ppb) 0.86 0.98 1.5 202 802 1252
9
Mandalay : Baseline air monitoring (2007-2008)

(MANDALAY REGION)
Nyaung Oo ( Bagan)/ Kyaukpadayng
10
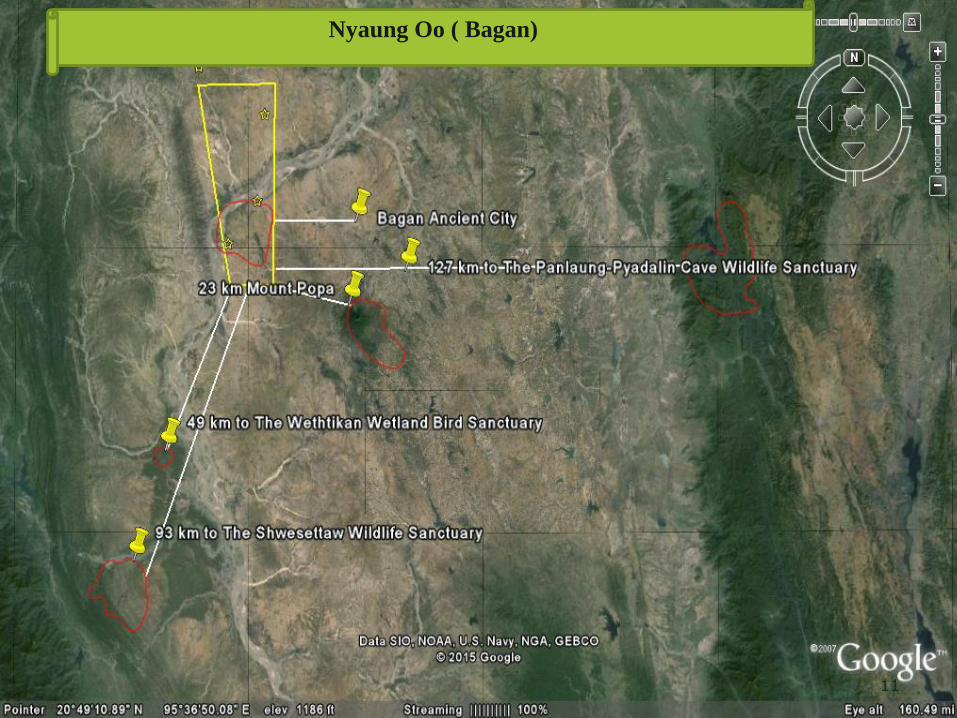
Nyaung Oo ( Bagan)
11
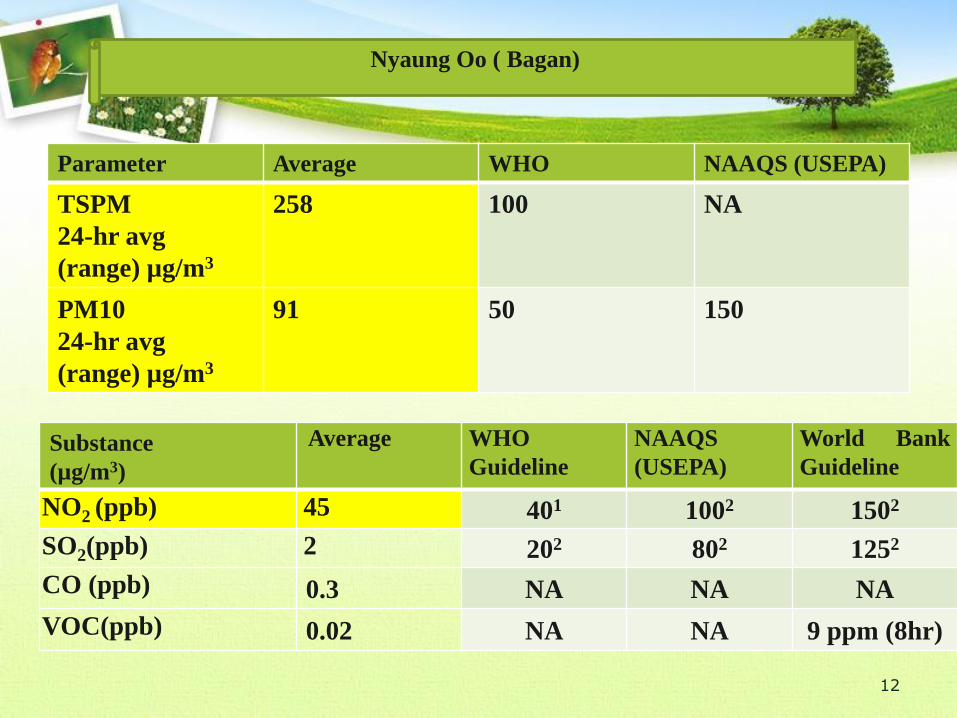
Parameter Average WHO NAAQS (USEPA)
TSPM
24-hr avg
(range) µg/m3
258 100 NA
PM10
24-hr avg
(range) µg/m3
91 50 150
Substance
(µg/m3)
Average WHO
Guideline
NAAQS
(USEPA)
World Bank
Guideline
NO2 (ppb) 45 401 1002 1502
SO2(ppb) 2 202 802 1252
CO (ppb) 0.3 NA NA NA
VOC(ppb) 0.02 NA NA 9 ppm (8hr)
Nyaung Oo ( Bagan)
12
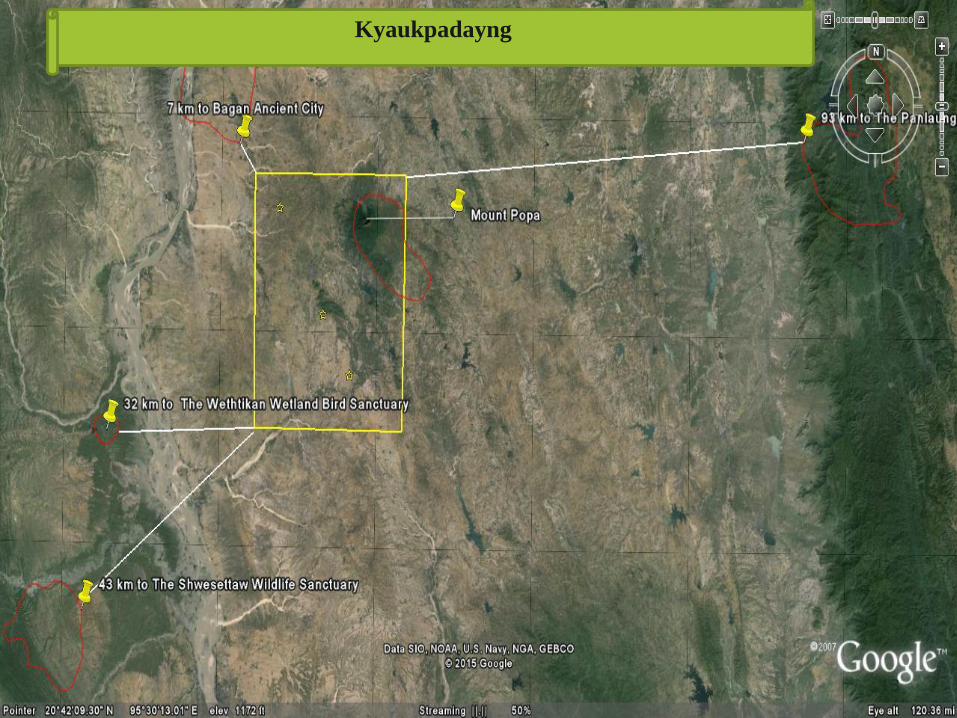
Kyaukpadayng
13
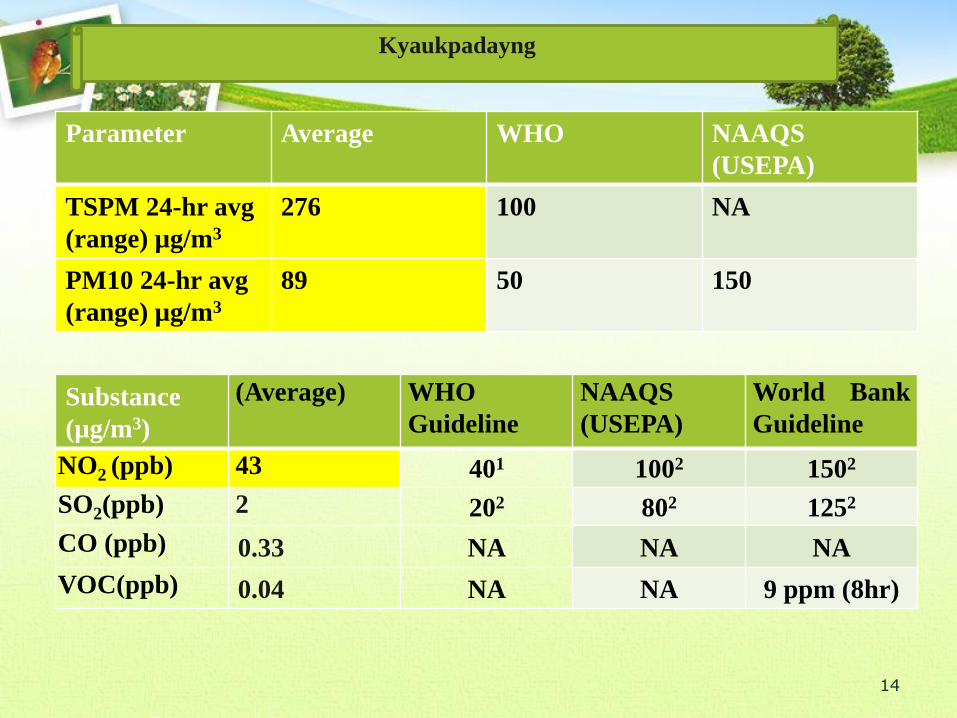
Parameter Average WHO NAAQS
(USEPA)
TSPM 24-hr avg
(range) µg/m3
276 100 NA
PM10 24-hr avg
(range) µg/m3
89 50 150
Substance
(µg/m3)
(Average) WHO
Guideline
NAAQS
(USEPA)
World Bank
Guideline
NO2 (ppb) 43 401 1002 1502
SO2(ppb) 2 202 802 1252
CO (ppb) 0.33 NA NA NA
VOC(ppb) 0.04 NA NA 9 ppm (8hr)
Kyaukpadayng
14
(MAGWE REGION)
Aung Lan/ Meikhtila/ Myanaung/ Kyangin
15
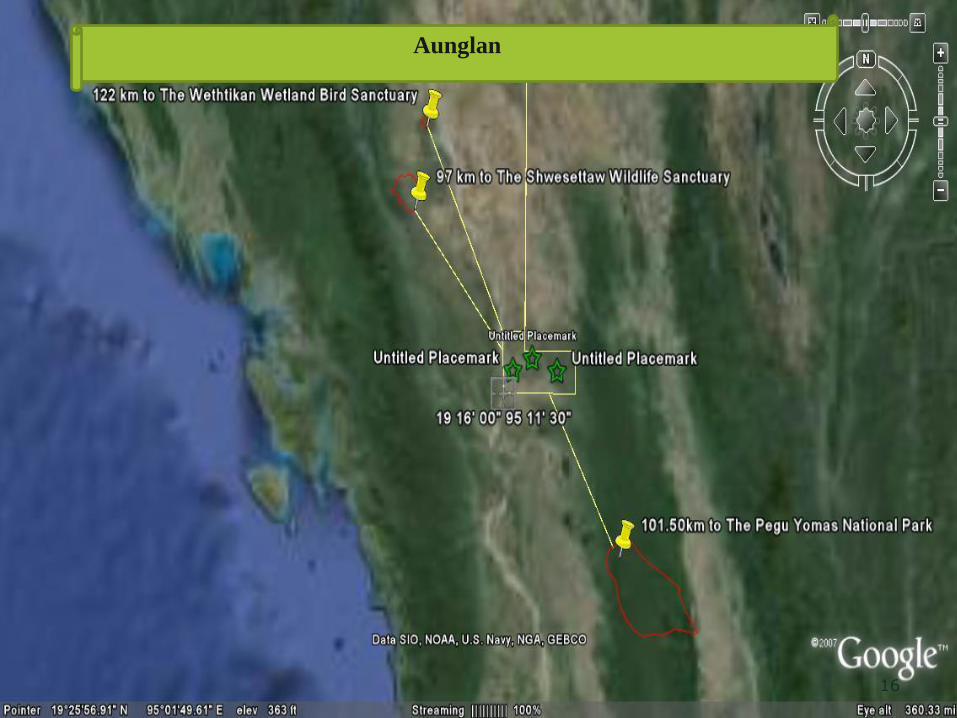
Aunglan
16
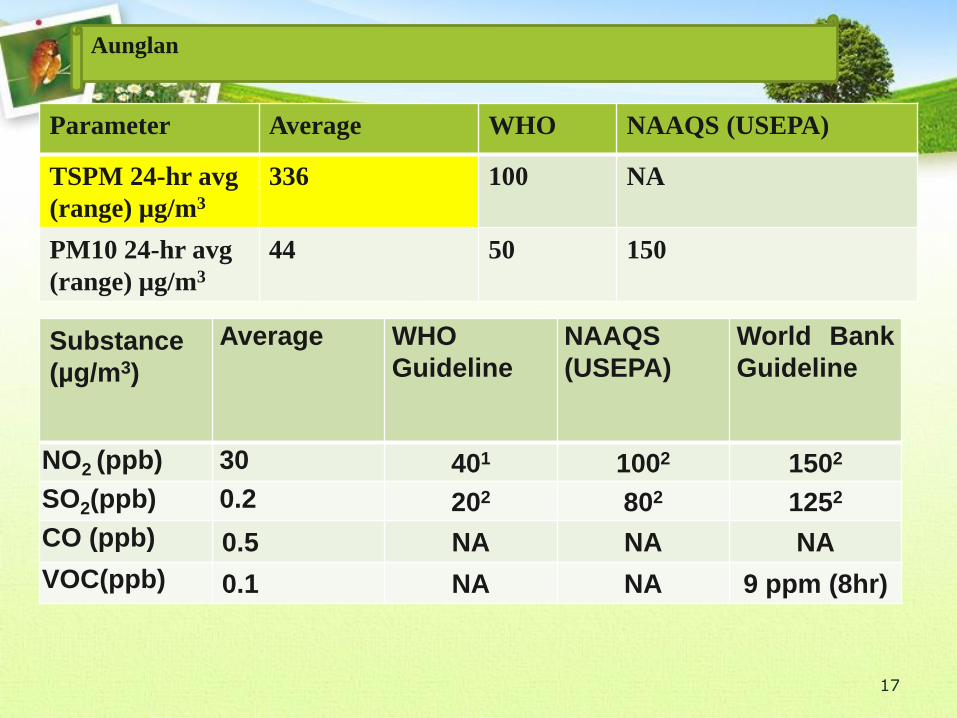
Parameter Average WHO NAAQS (USEPA)
TSPM 24-hr avg
(range) µg/m3
336 100 NA
PM10 24-hr avg
(range) µg/m3
44 50 150
Substance
(µg/m3)
Average WHO
Guideline
NAAQS
(USEPA)
World Bank
Guideline
NO2 (ppb) 30 401 1002 1502
SO2(ppb) 0.2 202 802 1252
CO (ppb) 0.5 NA NA NA
VOC(ppb) 0.1 NA NA 9 ppm (8hr)
Aunglan
17
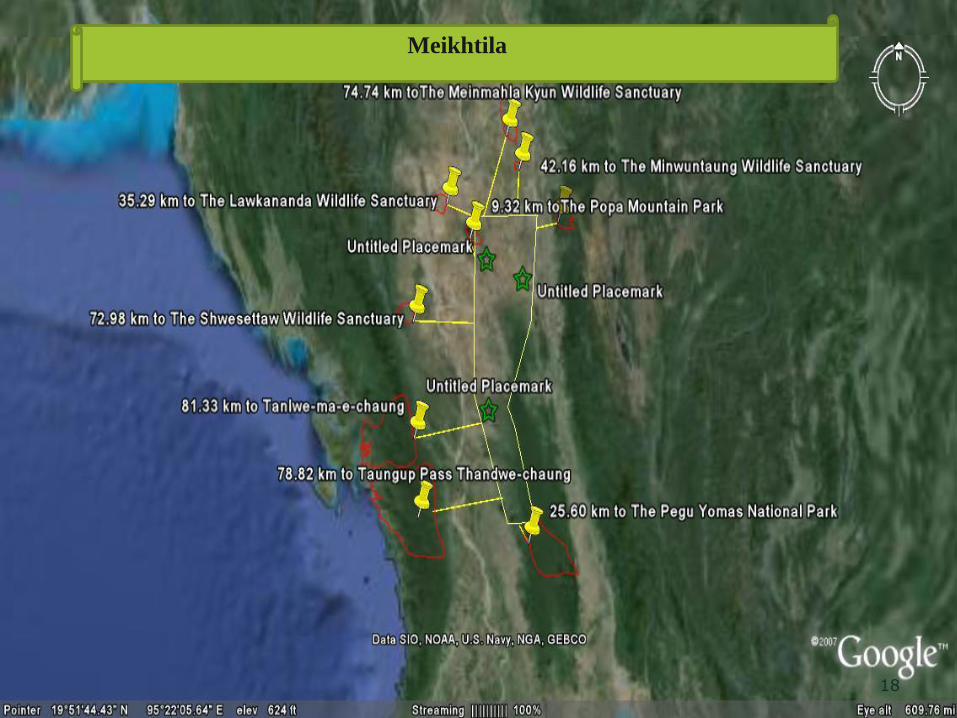
Meikhtila
18
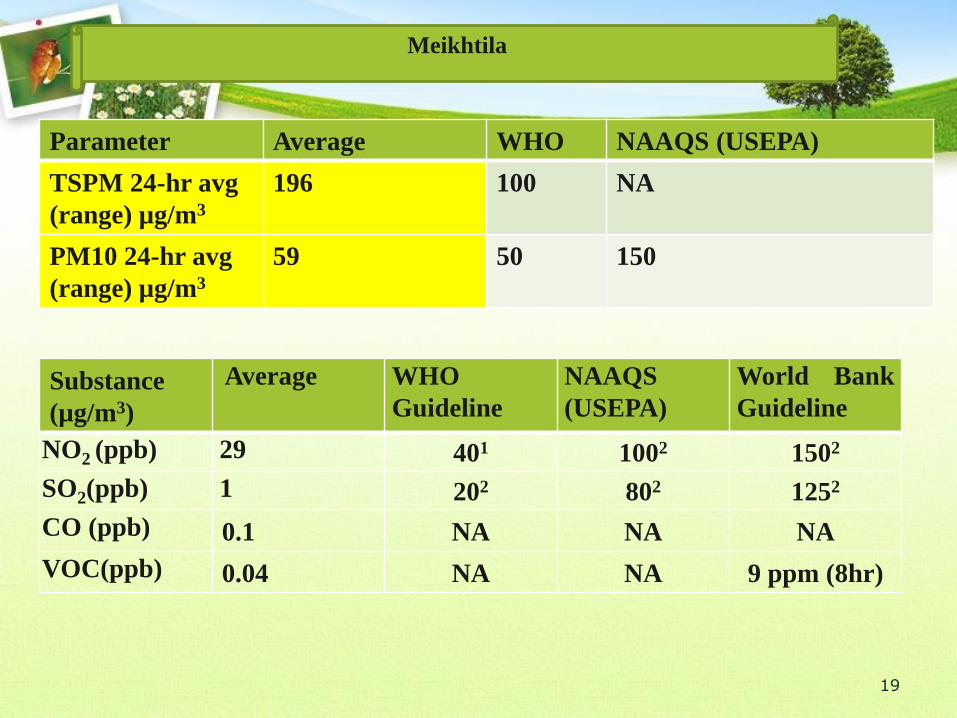
Parameter Average WHO NAAQS (USEPA)
TSPM 24-hr avg
(range) µg/m3
196 100 NA
PM10 24-hr avg
(range) µg/m3
59 50 150
Substance
(µg/m3)
Average WHO
Guideline
NAAQS
(USEPA)
World Bank
Guideline
NO2 (ppb) 29 401 1002 1502
SO2(ppb) 1 202 802 1252
CO (ppb) 0.1 NA NA NA
VOC(ppb) 0.04 NA NA 9 ppm (8hr)
Meikhtila
19
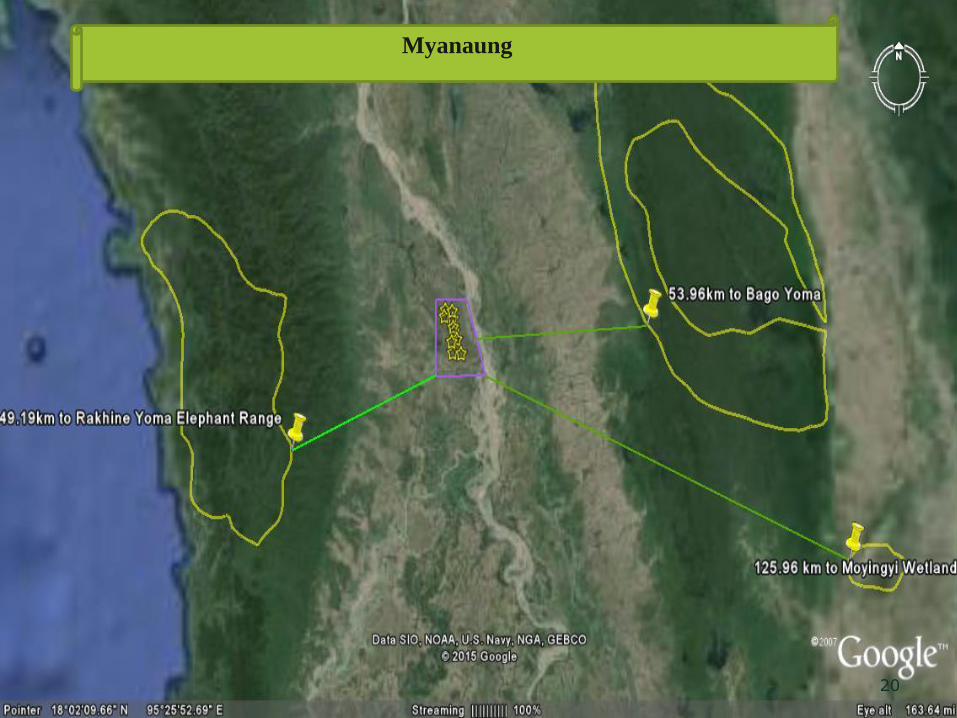
Myanaung
20
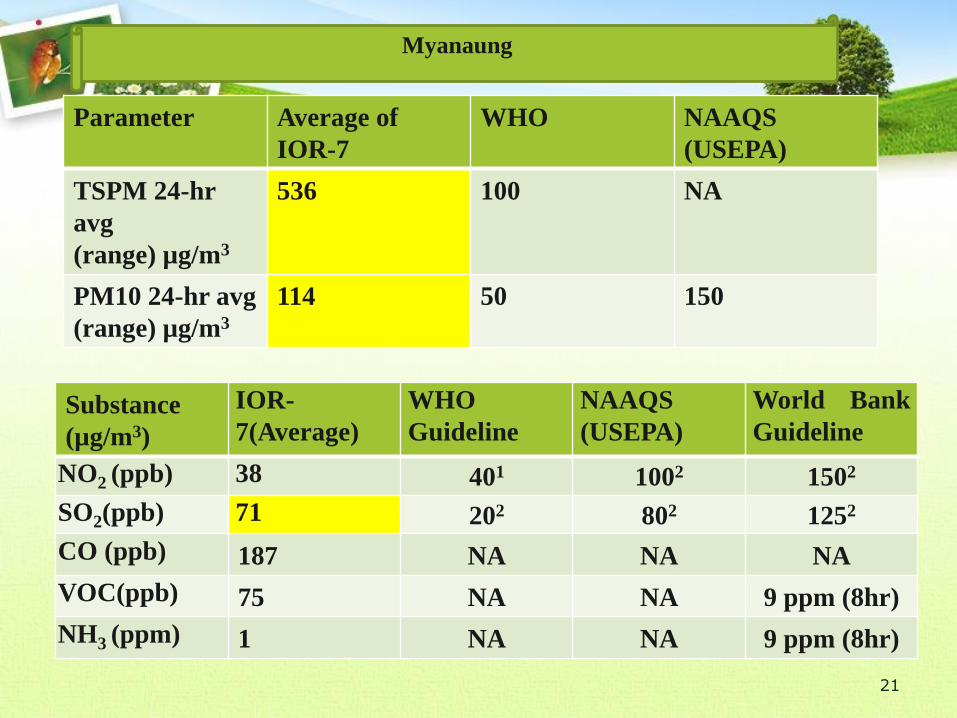
Parameter Average of
IOR-7
WHO NAAQS
(USEPA)
TSPM 24-hr
avg
(range) µg/m3
536 100 NA
PM10 24-hr avg
(range) µg/m3
114 50 150
Substance
(µg/m3)
IOR-
7(Average)
WHO
Guideline
NAAQS
(USEPA)
World Bank
Guideline
NO2 (ppb) 38 401 1002 1502
SO2(ppb) 71 202 802 1252
CO (ppb) 187 NA NA NA
VOC(ppb) 75 NA NA 9 ppm (8hr)
NH3 (ppm) 1 NA NA 9 ppm (8hr)
Myanaung
21
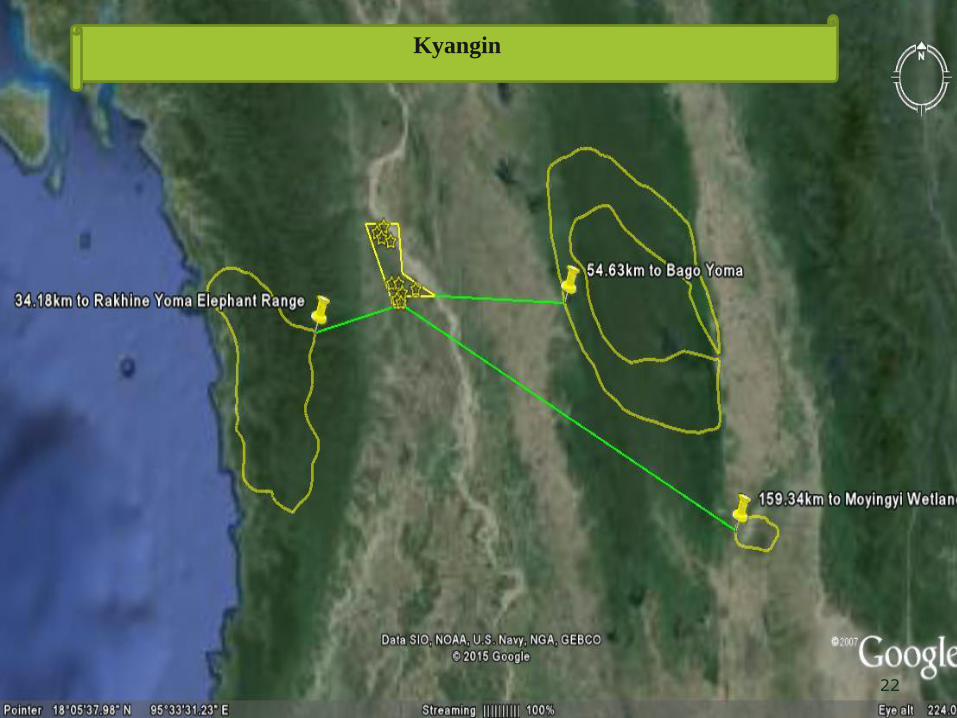
Kyangin
22
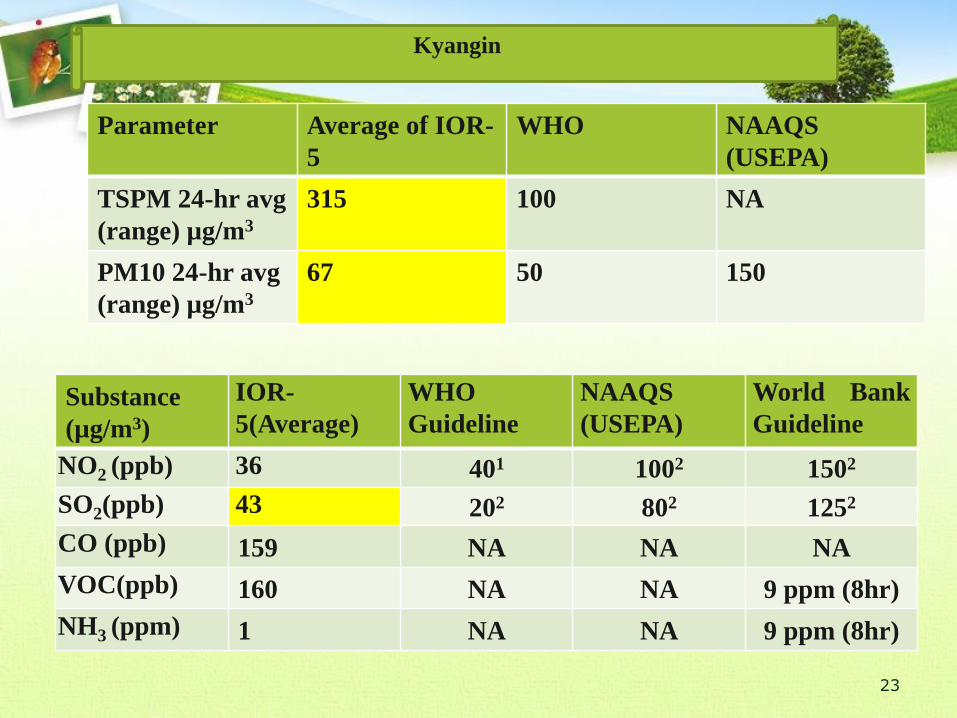
Parameter Average of IOR-
5
WHO NAAQS
(USEPA)
TSPM 24-hr avg
(range) µg/m3
315 100 NA
PM10 24-hr avg
(range) µg/m3
67 50 150
Substance
(µg/m3)
IOR-
5(Average)
WHO
Guideline
NAAQS
(USEPA)
World Bank
Guideline
NO2 (ppb) 36 401 1002 1502
SO2(ppb) 43 202 802 1252
CO (ppb) 159 NA NA NA
VOC(ppb) 160 NA NA 9 ppm (8hr)
NH3 (ppm) 1 NA NA 9 ppm (8hr)
Kyangin
23
Air Impact Assessment
To identify the Environmental, Socio-Economic
impacts of a proposed project before decision
making
To identify the potential air quality impacts due
to emissions from proposed projects
To set priorities for pollution control
24
• To consider alternative project design at an early
stage and identification of the most suitable site
in terms of benefit maximization and harmful
minimization
• To compliance with air pollution control
regulations
• To formulate environmentally sound air policies
and plans
Air Impact Assessment
25
WHO guidelines
USEPA, NAAQS
Ambient Air Quality Standards in industrialized
countries
- IFC guideline
Ambient Air Quality Standards
Evaluation of air quality
26
Needs for Air Monitoring
National Ambient air quality standards
Guidelines for Emission
27
Air Impact Assessment
Construction Phase
Operation Phase
Decommissioning Phase
28
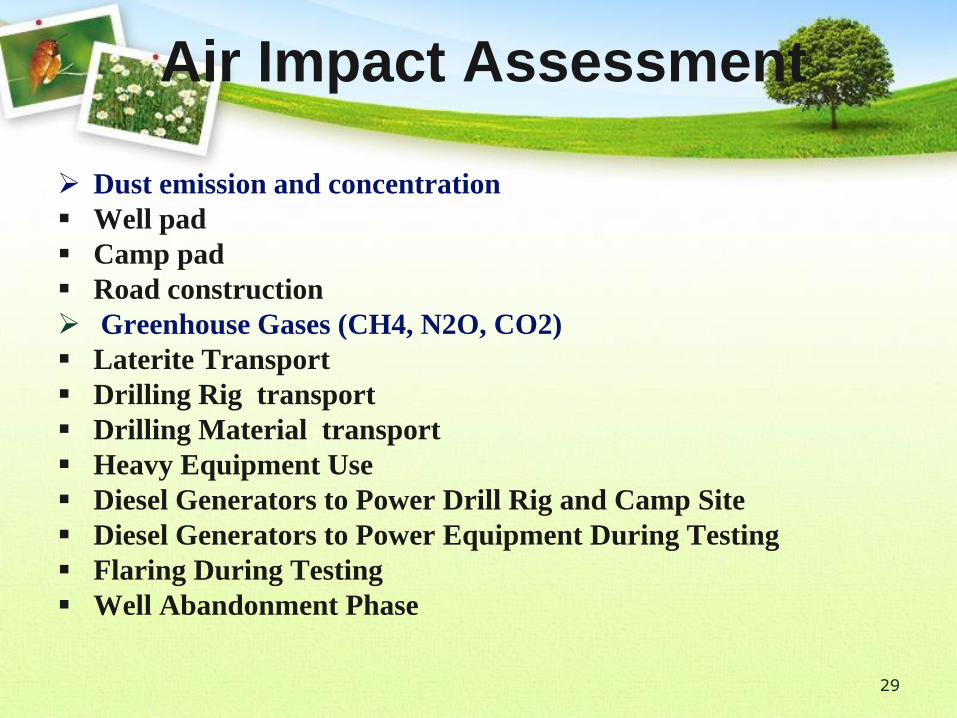
Air Impact Assessment
Dust emission and concentration
Well pad
Camp pad
Road construction
Greenhouse Gases (CH4, N2O, CO2)
Laterite Transport
Drilling Rig transport
Drilling Material transport
Heavy Equipment Use
Diesel Generators to Power Drill Rig and Camp Site
Diesel Generators to Power Equipment During Testing
Flaring During Testing
Well Abandonment Phase
29
Significance = Characteristics x Importance
Impact Characteristics =Magnitude + Extent + Duration
Based on the scoring,
Impact Significance – High, Medium, Low
Identification of Potential
Significant Impacts
30
Modeling
Simulation modeling is used to forecast the impacts , which is not yet in operation.
A mathematical description of the meteorological transport and dispersion processes, for a specific period
Realistic Estimates of pollutant concentration and impacts for specific locations and times
31
U.S. EPA’s SCREEN3 Gaussian Air Dispersion modeling
Ground level concentrations (GLC) - calculated on the
automated distance array option extending from within 200 m to
50 km radius from the point source
The calculation of 1hr, 24 hour and annual emission rates shall
be based on both normal 100% operating loads as the worst case
scenario and conservative approach
Screening & Regulatory approach
Air Dispersion Modeling
32
33
34
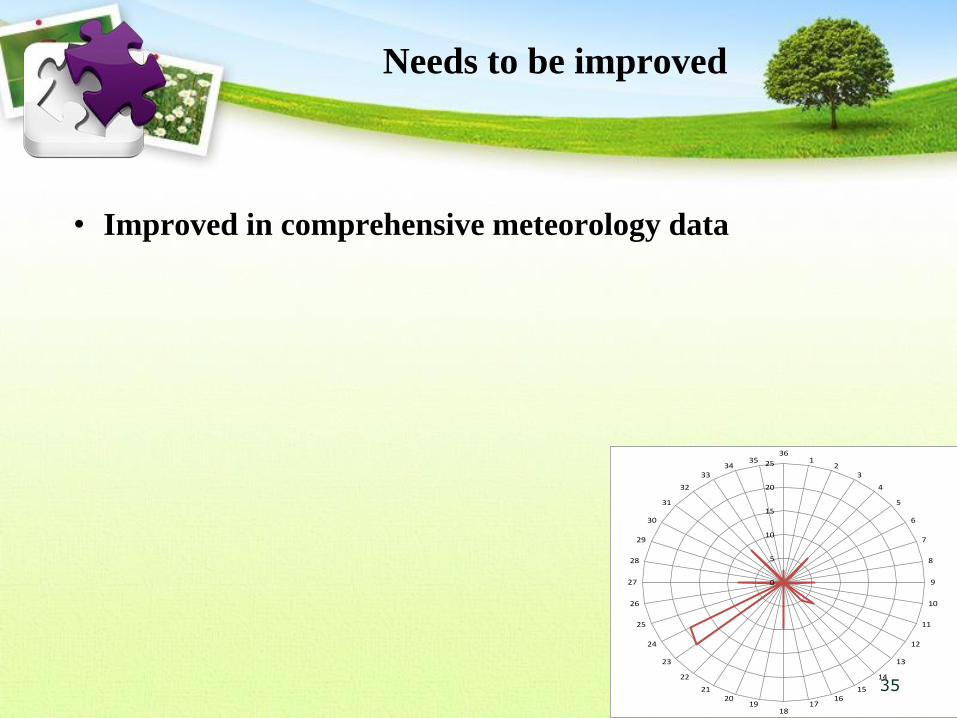
Needs to be improved
• Improved in comprehensive meteorology data
0
5
10
15
20
25
361
23
4
5
6
7
8
9
10
11
12
13
14
1516
1718
1920
21
22
23
24
25
26
27
28
29
30
31
32
3334
35
35
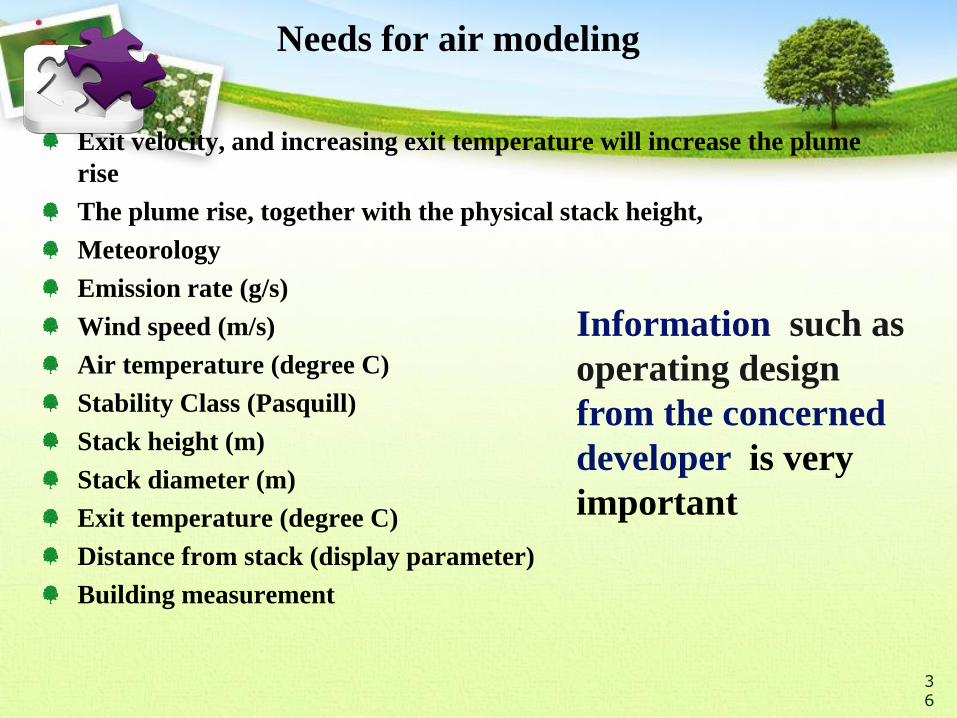
Exit velocity, and increasing exit temperature will increase the plume
rise
The plume rise, together with the physical stack height,
Meteorology
Emission rate (g/s)
Wind speed (m/s)
Air temperature (degree C)
Stability Class (Pasquill)
Stack height (m)
Stack diameter (m)
Exit temperature (degree C)
Distance from stack (display parameter)
Building measurement
Needs for air modeling
36
Information such as
operating design
from the concerned
developer is very
important
References:Nigel Rossouw (2003); Sippe (1999); and United Nations University (2007). The Environmental. Impact
Assessment Guidance.
Noel De Nevers, 2000. Air pollution control engineering. McGRAW-HILL international editions 2000.
Ohnmar May Tin Hlaing et al., 2009. Air Quality Monitoring in Yangon and Mandalay City during 2007-2008:
The State of Ambient Air Quality in Selected Urban Areas in Myanmar Health Research Congress, 2009 Abst.
P-55
Part III 40 CFR Part 51 Revision to the Guideline on Air Quality Models: Adoption of a Preferred General
Purpose (Flat and Complex Terrain) Dispersion Model and Other Revisions; Final Rule, 2005. Environmental
Protection Agency, November 9, 2005. Source: www.cabq.gov/airquality/pdf/aqd_model_guidelines.pdf
SCREEN3 Model User's Guide, 1995, EPA-454/B-95-004 U.S. Environmental Protection Agency, Office of Air
Quality Planning and Standards, Emissions, Monitoring, and Analysis Division Research, September 1995
USEPA, National Ambient Air Quality Standards, Source: http://www.epa.gov/air/criteria.html
Villalvazo, L., Davila, E., and Reed, G., 2007, Guidance for Air Dispersion Modeling. Source:
www.valleyair.org/busind/pto/tox.../Modeling%20Guidance.pdf
WHO air quality guidelines 2005
IPCC (2006)
EMEP/EEA air pollutant emission inventory guidebook (2009)
http://www.eea.europa.eu/publications/emep-eea-emission-inventory-guidebook-2009/part-b-sectoral-
guidance-chapters/1-energy/1-a-combustion/1-a-3-b-road-transport.pdf
http://www.grida.no/publications/other/ipcc_tar/
US.EPA, “Compilation of Air Pollution Emission Factors, Volume 1, Stationary Point and Area Sources”, Fifth
Edition, January 1995; http://www.epa.gov/ttn/chief/ap42/ch03/bgdocs/b03s03.pdf.
IEA (2004), Density of Oil Products, Energy Statistics Working Group Meeting
37

Thank You
38