Embed Size (px)
Citation preview

Amateur Radio Astronomy Measurements of Galactic Neutral Hydrogen Distribution
© Dr. David Morgan 2011 Page 1
Introduction This article describes measurements carried out in August 2006 to March 2007 to map the distribution of atomic hydrogen in part of the Milky Way, visible at that time from an observatory in South Wales UK. The Hydrogen Line, as it is known, was predicted by Van de Hulst in1945 and first observed in 1951. It arises due to quantum effect where low energy radio photon emission is caused by a spin transition in the ground state of the neutral hydrogen atom. This radiation has a narrow bandwidth - in practice much less than 1 MHz -and is detectable by a modest-sized antenna connected to a stable high gain receiver system tuned to 1420.4MHz. Figure 1 3m diameter F.28 dish with cylindrical waveguide feed The intensity of the signal observed is related in a complex way to the ‘volume’ of hydrogen seen within the receive beam. In theory it is possible to use this signal to plot the distribution of hydrogen in the Galaxy.
1.4204GHz emission

Amateur Radio Astronomy Measurements of Galactic Neutral Hydrogen Distribution
© Dr. David Morgan 2011 Page 2
Measurements An example of a received signal at ~1420MHz using the antenna shown in Figure 1 above can be seen in the next diagram. Figure 2 shows the variation in signal strength as a function of time and Right Ascension as the stationary transit antenna beam sweeps across the Galactic Plane. Figure 2 A strong Hydrogen Line signal from the Galactic Plane The signal at the ‘H Line’ frequency is quite strong within the Galactic Plane and is much easier to detect than the broad spectrum background synchrotron emission at nearby frequencies.* In the receiving system described here the raw ‘H Line’ signal may be as much as 1.5dB above receiver system noise. The narrowness of the ‘H Line’ means that the signal from the Galactic Plane will consist of resolvable multiple frequencies due to the Doppler shift imposed by the velocities of neutral hydrogen regions in different parts of the Galaxy. The maximum spread of the Doppler shifted ‘H lines’ is usually within the range 1420.0 to 1421 MHz. * Subject of a companion article on the RAG website If we wish to measure the total signal intensity due to hydrogen in the Galaxy we would need to have a 1MHz RF bandwidth in the receiver to integrate signals from all Doppler shifted components. If this approach is taken, we lose the wealth of information about the intensity of each velocity component and forfeit the ability to discriminate between fast moving regions of hydrogen in the various spiral arms.
1 7:00 18:00 190 0 20 :00 2 1:00 222:0016:00
19:0 0 20 :00 21:00 22:0 0 23:00 00:0018 :00
Strong signal as antennaSweeps through Galactic Plane
Tim e BST
RA
1 7:00 18:00 190 0 20 :00 2 1:00 222:0016:00
19:0 0 20 :00 21:00 22:0 0 23:00 00:0018 :00
Strong signal as antennaSweeps through Galactic Plane
1 7:00 18:00 190 0 20 :00 2 1:00 222:0016:00
19:0 0 20 :00 21:00 22:0 0 23:00 00:0018 :00
1 7:00 18:00 190 0 20 :00 2 1:00 222:0016:00
19:0 0 20 :00 21:00 22:0 0 23:00 00:0018 :00
1 7:00 18:00 190 0 20 :00 2 1:00 222:0016:00 1 7:00 18:00 190 0 20 :00 2 1:00 222:0016:00 1 7:00 18:00 190 0 20 :00 2 1:00 222:0016:00
19:0 0 20 :00 21:00 22:0 0 23:00 00:0018 :00 19:0 0 20 :00 21:00 22:0 0 23:00 00:0018 :00
Strong signal as antennaSweeps through Galactic Plane
Tim e BST
RA

Amateur Radio Astronomy Measurements of Galactic Neutral Hydrogen Distribution
© Dr. David Morgan 2011 Page 3
Figure 3 below shows a typical example of an H Line spectrum between 1420 and 1421MHz. It shows a number of components at different frequencies from regions of hydrogen moving at different velocities.
Figure 3 A complex H Line spectrum This graph was produced with a swept frequency Icom IC-R7000 receiver with a narrow bandwidth of 6kHz.
Amateur Radio Astronomy Measurements of Galactic Neutral Hydrogen Distribution
© Dr. David Morgan 2011 Page 4
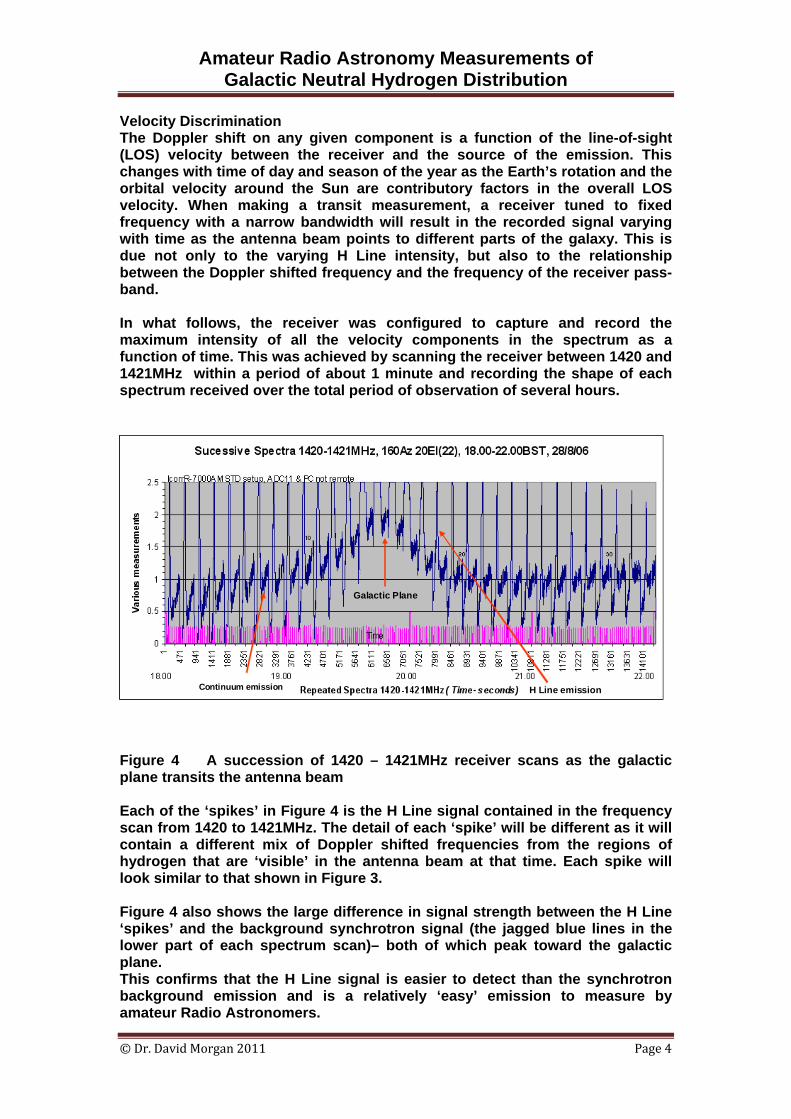
Velocity Discrimination The Doppler shift on any given component is a function of the line-of-sight (LOS) velocity between the receiver and the source of the emission. This changes with time of day and season of the year as the Earth’s rotation and the orbital velocity around the Sun are contributory factors in the overall LOS velocity. When making a transit measurement, a receiver tuned to fixed frequency with a narrow bandwidth will result in the recorded signal varying with time as the antenna beam points to different parts of the galaxy. This is due not only to the varying H Line intensity, but also to the relationship between the Doppler shifted frequency and the frequency of the receiver pass-band. In what follows, the receiver was configured to capture and record the maximum intensity of all the velocity components in the spectrum as a function of time. This was achieved by scanning the receiver between 1420 and 1421MHz within a period of about 1 minute and recording the shape of each spectrum received over the total period of observation of several hours. Figure 4 A succession of 1420 – 1421MHz receiver scans as the galactic plane transits the antenna beam Each of the ‘spikes’ in Figure 4 is the H Line signal contained in the frequency scan from 1420 to 1421MHz. The detail of each ‘spike’ will be different as it will contain a different mix of Doppler shifted frequencies from the regions of hydrogen that are ‘visible’ in the antenna beam at that time. Each spike will look similar to that shown in Figure 3. Figure 4 also shows the large difference in signal strength between the H Line ‘spikes’ and the background synchrotron signal (the jagged blue lines in the lower part of each spectrum scan)– both of which peak toward the galactic plane. This confirms that the H Line signal is easier to detect than the synchrotron background emission and is a relatively ‘easy’ emission to measure by amateur Radio Astronomers.
Continuum emission H Line emission
Galactic Plane
Continuum emission H Line emission
Galactic Plane

Amateur Radio Astronomy Measurements of Galactic Neutral Hydrogen Distribution
© Dr. David Morgan 2011 Page 5
It would be possible to analyse this wealth of repeated spectral data for each frequency / Doppler shift / LOS velocity in the spectrum. The LOS Doppler shift due the motion of the Earth as function of time during the observation could be calculated and removed enabling the signal intensity from emission regions with known velocities to be plotted. This extensive task is rather beyond the reach of the average amateur observer and has not been attempted here. The analysis shown below was produced by deriving the maximum signal envelope as the transit scan progresses. This makes sure that strong H Line components at any Doppler frequency are included in the measurement of signal strength. Figure 5 Calculated envelope of maximum H Line emission at all Doppler shifts The maximum signal envelope shown in Figure 5 is calculated using Microsoft EXCEL. These envelope data are produced and assembled for a number of transit scans at various Declinations and Right Ascensions on different days. From these data a false colour map can be generated – in this case using Stanford Chart software. Map Generation From this process we can produce a map of the maximum intensity of Galactic Hydrogen (at any Doppler shift / velocity) over the range ( -100 to +600 Declination and 17 to 22hours Right Ascension) visible from the observatory location. It can be seen in Figure 6 below, that the emission is strong along the Galactic plane and increases in intensity toward the Galactic centre and the Cygnus Spiral arm.
H Line emission
Galactic Plane(away from Galactic centre)
Peak spectrum level
H Line emission
Galactic Plane(away from Galactic centre)
Peak spectrum level

Amateur Radio Astronomy Measurements of Galactic Neutral Hydrogen Distribution
© Dr. David Morgan 2011 Page 6
Figure 6 Map of intensity of Galactic Hydrogen (including components from all Doppler shifted sources with signals in the range 1420 to 1421MHz) The map in Figure 6 can be converted from Right Ascension and Declination to Galactic coordinates using equations available on the internet http://scienceworld.wolfram.com/astronomy/GalacticCoordinates.html . This enables the generation of Figure 7 showing the radio plot superimposed on an optical picture of the Milky Way from galactic longitude l =200 to 1000 . There is a good correlation of the radio features with the optical image.

Amateur Radio Astronomy Measurements of Galactic Neutral Hydrogen Distribution
© Dr. David Morgan 2011 Page 7
Figure 7 Supposition of Hydrogen Line Radio image and Optical image of the Milky Way Finally, in Figures 8 and 9 we are able to see similarities in the amateur Radio Map above and professional measurements shown below. The expanded cut- out section of the professional map shows similar features to those found in the amateur one.

Amateur Radio Astronomy Measurements of Galactic Neutral Hydrogen Distribution
© Dr. David Morgan 2011 Page 8
TowardGalactic Centre
CygnusArm
Professional map of Neutral Hydrogen Distribution
TowardGalactic Centre
CygnusArm
TowardGalactic Centre
CygnusArm
Professional map of Neutral Hydrogen Distribution
Figure 8 Region observed in amateur map Figure 9 Expanded section of professional H Line map
Professional map of Neutral Hydrogen Distribution
L =200L =1000
Professional map of Neutral Hydrogen Distribution
L =200L =100 0

Amateur Radio Astronomy Measurements of Galactic Neutral Hydrogen Distribution
© Dr. David Morgan 2011 Page 9
Conclusion With a 3m diameter antenna and carefully temperature-stabilised receiving equipment, it is possible for an amateur radio astronomer to make a number of transit scans of the Milky Way over a period of several days and combine these to produce a map of the neutral hydrogen distribution in our Galaxy. Whilst the spatial resolution is lower than professionally produced maps – due to the limited size of the antenna – the results obtainable have many of the features to be seen in the professional maps. Amateurs should be encouraged to make observations such as these and to perfect the careful measurement techniques required to do so. Dr David Morgan www.dmradas.co.uk


![Amateur Operato Advanced - Australian Maritime College · Amateur Operato Advanced Syllabus and Examination. The Amateur Licence (amateur advanced station) [the Advanced Amateur Licence]](https://img.pdfslide.us/doc/110x75/5f072ed67e708231d41bb822/amateur-operato-advanced-australian-maritime-college-amateur-operato-advanced.jpg)