Embed Size (px)
Citation preview
Amadeus Jan-Jun 2018 Results
July 27, 2018
© 2
018
Am
adeu
s IT
Ho
ldin
g an
d it
s af
filia
tes
and
su
bsi
dia
rie
s
_ This presentation may contain certain statements which are not purely historical facts, including statements about anticipated orexpected future revenue and earnings growth. Any forward-looking statements in this presentation are based upon informationavailable to Amadeus on the date of this presentation. Any forward-looking statements involve risks and uncertainties that couldcause actual events or results to differ materially from the events or results described in the forward-looking statements. Amadeusundertakes no obligation to publicly update or revise any forward-looking statements, whether as a result of new information, futureevents or otherwise. Readers are cautioned not to place undue reliance on forward-looking statements.
_ This presentation has to be accompanied by a verbal explanation. A simple reading of this presentation without the appropriateverbal explanation could give rise to a partial or incorrect understanding.
2
Disclaimer
Operating review
© 2
018
Am
adeu
s IT
Gro
up
an
d it
s af
filia
tes
and
su
bsi
dia
rie
s
© 2
018
Am
adeu
s IT
Gro
up
an
d it
s af
filia
tes
and
su
bsi
dia
rie
s
Operating Review
Luis MarotoPresident & CEO

4
© 2
018
Am
adeu
s IT
Gro
up
an
d it
s af
filia
tes
and
su
bsi
dia
rie
s
H1 2018
Note: H1 2017 figures displayed throughout this presentation have been restated for IFRS 15 and 9, as well as for a building and facilities expense reallocation to indirect costs, which we applied since January 1, 2018 (see section 3.1 of January-June 2018 Management Review for further details). H1 2018 growth rates have been therefore calculated over 2017 restated figures.
1. We are early adopters of IFRS 16, which we applied since January 1, 2018. 2017 figures will not be restated for IFRS 16. In the first half of 2018, IFRS 16 had a positive €22.5 million impact on EBITDA. See section 3.1 of January-June 2018 Management Review for further details.
_ Revenue +4.1% (Ex.FX: high single-digit growth %)
• Negative FX impact
_ EBITDA +8.2% (Ex.FX & IFRS161: high single-digit
growth %)
• Positive FX and IFRS 161 impact on costs
• Ex-FX and IFRS 161: broadly stable margin
_ Adjusted profit +6.1%• Adjusted EPS +8.2%
_ Free Cash Flow +2.7%
_ Leverage 1.10x461
1,078
2,477
607
In €
millio
ns
RevenueEBITDA
Adj. profitFree CF

5
Recent business highlights
© 2
018
Am
adeu
s IT
Gro
up
an
d it
s af
filia
tes
and
su
bsi
dia
rie
s
Airline Distribution
_ Renewed / signed 15 distribution agreements in Q2 2018, including United Airlines, Scandinavian Airlines, Alitalia and Ethiopian Airlines.
_ Expanded airlines’ merchandizing capabilities in the indirect channel
• Amadeus Airline Ancillary Services – 145 contracted airlines (6 new customers in Q2 2018).
• Amadeus Airline Fare Families – 75 contracted airlines (4 new customers in Q2 2018).
Airline IT
_ Russia’s second largest airline, S7 Airlines, signed for the full Altéasuite (approximately 14m PB migration expected by year-end).
_ Royal Jordanian renewed Altéa and signed additional products, including Amadeus Altéa NDC.
_ Scandinavian Airlines renewed Altéa and Amadeus Revenue Management while also signing up for the Amadeus Payment Platform.
_ LATAM Airlines implemented Altéa Departure Control Flight Management.
_ Hawaiian Airlines contracted for Altéa DCS Flight Management, Garuda Indonesia for Amadeus Customer Experience Management and Malaysia Airlines for Amadeus Revenue Accounting.
Hospitality
_ We are progressing in the roll-out of the Guest Reservation System with InterContinental Hotels Group.
• Full deployment is expected for late 2018 to early 2019.
NDC
_ Level 3 NDC certification as an aggregator from IATA, following existing level 3 NDC certification as an IT provider,making Amadeus one of the first with dual level 3 certification.
_ Amadeus NDC-X program aims to bring together all the NDC efforts across Amadeus.
_ Evolution of Amadeus' travel platform, bringing together all relevant content from any source to be distributed through any user interface or device.
6
© 2
016
Am
adeu
s IT
Ho
ldin
g a
nd
its
affi
liate
s an
d s
ub
sid
iari
es
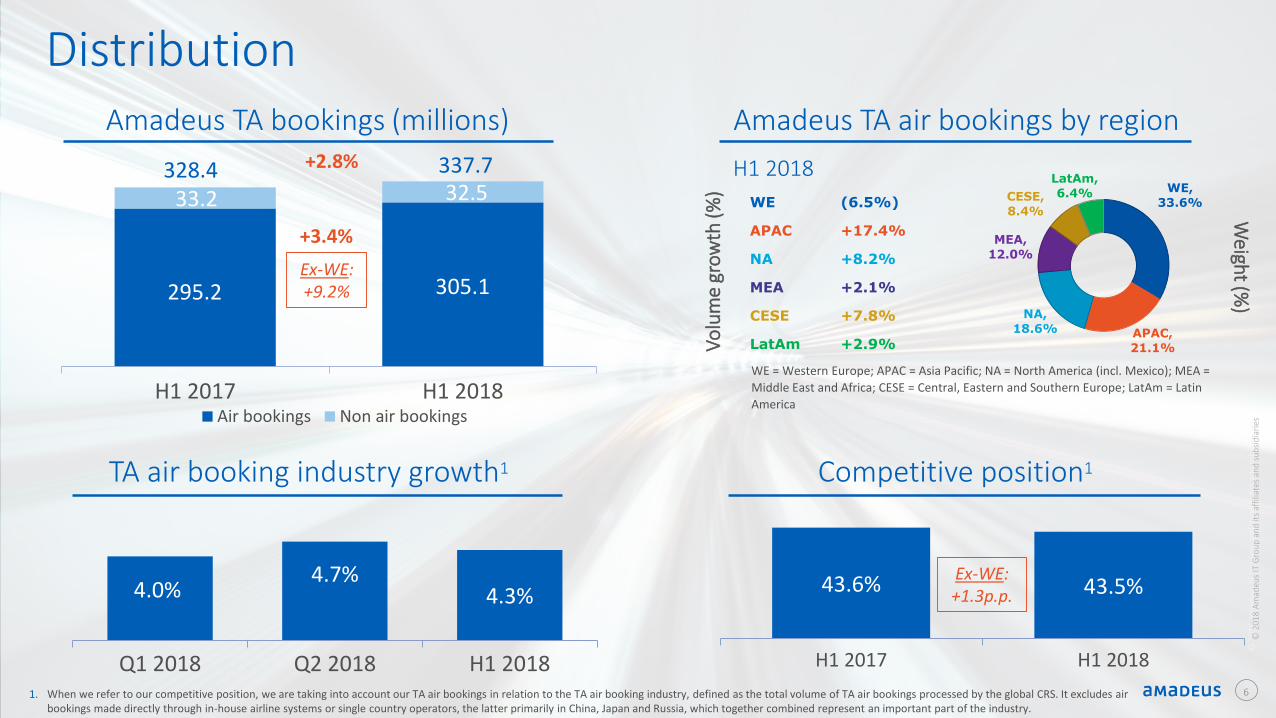
1. When we refer to our competitive position, we are taking into account our TA air bookings in relation to the TA air booking industry, defined as the total volume of TA air bookings processed by the global CRS. It excludes air bookings made directly through in-house airline systems or single country operators, the latter primarily in China, Japan and Russia, which together combined represent an important part of the industry.
295.2 305.1
33.2 32.5
H1 2017 H1 2018Air bookings Non air bookings
Vo
lum
e gr
ow
th (%
)
WE = Western Europe; APAC = Asia Pacific; NA = North America (incl. Mexico); MEA =
Middle East and Africa; CESE = Central, Eastern and Southern Europe; LatAm = Latin
America
4.0%4.7%
4.3%
Q1 2018 Q2 2018 H1 2018
Distribution
TA air booking industry growth1
Amadeus TA air bookings by region
Competitive position1
WE,
33.6%
APAC,
21.1%
NA,
18.6%
MEA,
12.0%
CESE,
8.4%
LatAm,
6.4%WE (6.5%)
APAC +17.4%
NA +8.2%
MEA +2.1%
CESE +7.8%
LatAm +2.9%
Amadeus TA bookings (millions)
Weigh
t (%)
+3.4%
+2.8% 337.7328.4
6
© 2
018
Am
adeu
s IT
Gro
up
an
d it
s af
filia
tes
and
su
bsi
dia
rie
s
43.6% 43.5%
H1 2017 H1 2018
Ex-WE: +9.2%
H1 2018
Ex-WE: +1.3p.p.
777
© 2
018
Am
adeu
s IT
Gro
up
an
d it
s af
filia
tes
and
su
bsi
dia
rie
s
WE = Western Europe; APAC = Asia Pacific; NA = North America (incl. Mexico); MEA =
Middle East and Africa; CESE = Central, Eastern and Southern Europe; LatAm = Latin
America
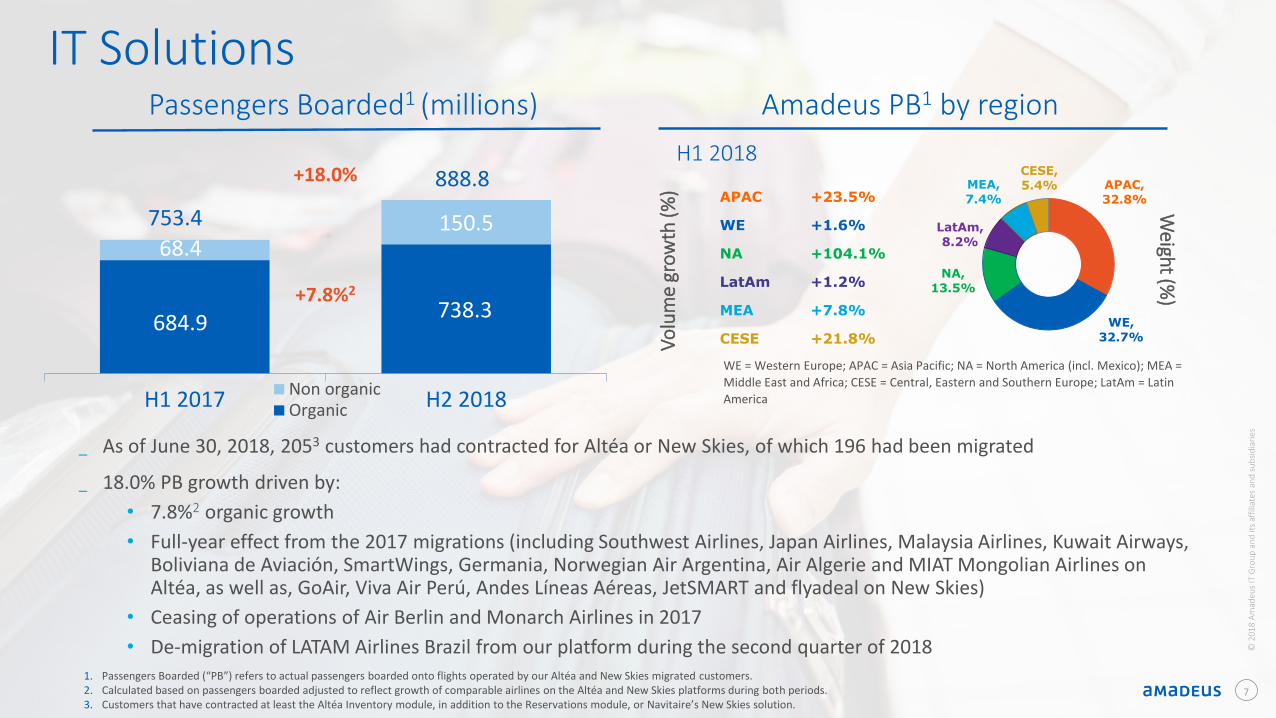
IT SolutionsAmadeus PB1 by region
APAC +23.5%
WE +1.6%
NA +104.1%
LatAm +1.2%
MEA +7.8%
CESE +21.8%
APAC,
32.8%
WE,
32.7%
NA,
13.5%
LatAm,
8.2%
CESE,
5.4%MEA,
7.4%
Passengers Boarded1 (millions)
684.9738.3
68.4150.5
H1 2017 H2 2018Non organicOrganic
Vo
lum
e gr
ow
th (%
)
Weigh
t (%)
_ As of June 30, 2018, 2053 customers had contracted for Altéa or New Skies, of which 196 had been migrated
_ 18.0% PB growth driven by:
• 7.8%2 organic growth
• Full-year effect from the 2017 migrations (including Southwest Airlines, Japan Airlines, Malaysia Airlines, Kuwait Airways, Boliviana de Aviación, SmartWings, Germania, Norwegian Air Argentina, Air Algerie and MIAT Mongolian Airlines on Altéa, as well as, GoAir, Viva Air Perú, Andes Líneas Aéreas, JetSMART and flyadeal on New Skies)
• Ceasing of operations of Air Berlin and Monarch Airlines in 2017
• De-migration of LATAM Airlines Brazil from our platform during the second quarter of 20181. Passengers Boarded (“PB”) refers to actual passengers boarded onto flights operated by our Altéa and New Skies migrated customers. 2. Calculated based on passengers boarded adjusted to reflect growth of comparable airlines on the Altéa and New Skies platforms during both periods. 3. Customers that have contracted at least the Altéa Inventory module, in addition to the Reservations module, or Navitaire’s New Skies solution.
753.4
+7.8%2
888.8
7
+18.0%H1 2018

© 2
018
Am
adeu
s IT
Gro
up
an
d it
s af
filia
tes
and
su
bsi
dia
rie
s
Financial highlights
Ana de Pro CFO

Revenue growth by segment
999
2,378.5 2,477.0
H1 2017 H1 2018
+4.1%
Group revenue (€ millions)
Distribution IT Solutions
Segment revenue (€ millions)
© 2
018
Am
adeu
s IT
Gro
up
an
d it
s af
filia
tes
and
su
bsi
dia
rie
s
_ Group revenue expanded by 4.1%, supported by the performances across our Distribution and IT Solutions segments. Per segment, Distribution revenue grew 2.6% and IT Solutions grew 6.8%. Revenue was negatively impacted by FX effects. Excluding FX, Group revenue grew at a high single-digit growth rate:
_ Distribution: volume growth coupled with expansive revenue per booking, driven by booking mix (increasing weight of global bookings, non-air bookings weight decline) and customer renegotiations.
_ IT Solutions: volume expansion coupled with (i) dilutive PSS average pricing from increasing weight of low-cost and hybrid carriers, (ii) slower than PB growth revenue increase from other airline IT revenue lines, as well as (iii) a positive performance of our new businesses (double-digit growth rate ex-FX), supported by customer implementations and organic growth.
1,523.3 1,563.3
H1 2017 H1 2018
855.2 913.7
H1 2017 H1 2018
+2.6% +6.8%
Ex-FX: high single-digit growth %
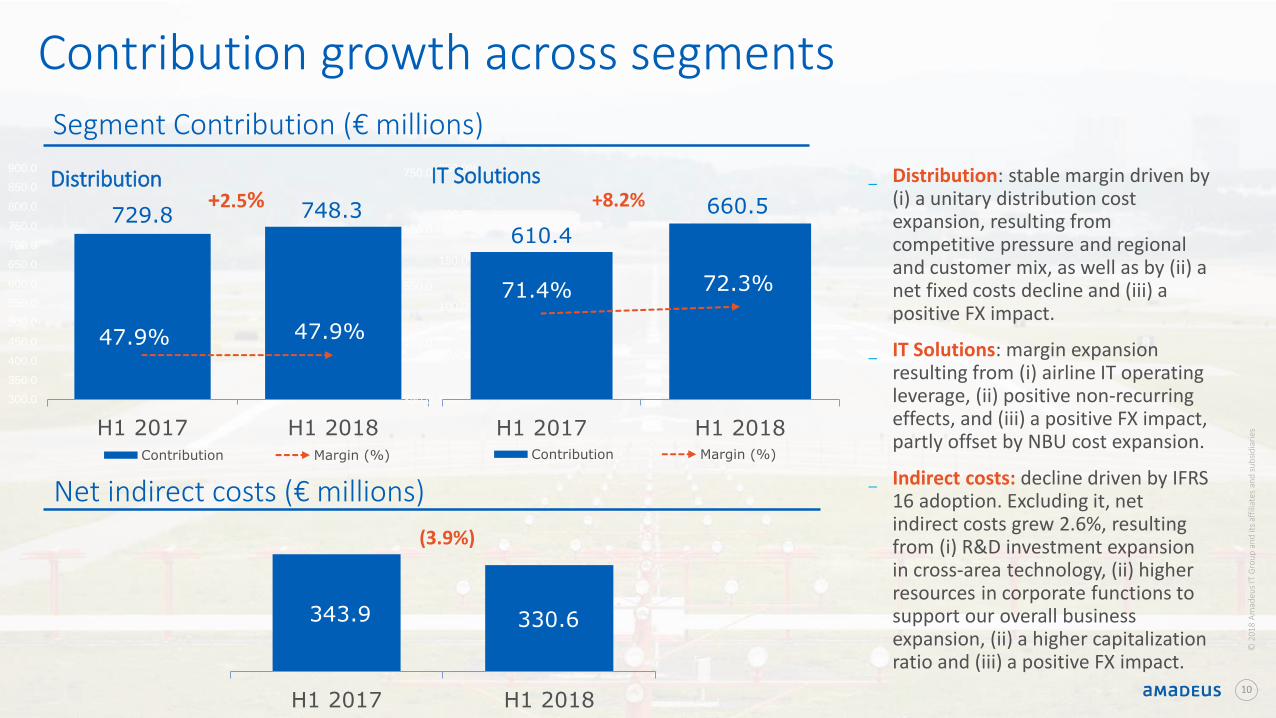
729.8 748.3
47.9% 47.9%
0.0%
50.0%
100.0%
150.0%
200.0%
250.0%
300.0
350.0
400.0
450.0
500.0
550.0
600.0
650.0
700.0
750.0
800.0
850.0
900.0
H1 2017 H1 2018Contribution Margin (%)
610.4
660.5
71.4% 72.3%
60.0%
65.0%
70.0%
75.0%
80.0%
85.0%
90.0%
350.0
450.0
550.0
650.0
750.0
H1 2017 H1 2018Contribution Margin (%)
Contribution growth across segments
101010
343.9 330.6
H1 2017 H1 2018
(3.9%)
Segment Contribution (€ millions)
Distribution+2.5%
IT Solutions+8.2%
_ Distribution: stable margin driven by (i) a unitary distribution cost expansion, resulting from competitive pressure and regional and customer mix, as well as by (ii) a net fixed costs decline and (iii) a positive FX impact.
_ IT Solutions: margin expansion resulting from (i) airline IT operating leverage, (ii) positive non-recurring effects, and (iii) a positive FX impact, partly offset by NBU cost expansion.
_ Indirect costs: decline driven by IFRS 16 adoption. Excluding it, net indirect costs grew 2.6%, resulting from (i) R&D investment expansion in cross-area technology, (ii) higher resources in corporate functions to support our overall business expansion, (ii) a higher capitalization ratio and (iii) a positive FX impact.
Net indirect costs (€ millions)
© 2
018
Am
adeu
s IT
Gro
up
an
d it
s af
filia
tes
and
su
bsi
dia
rie
s
EBITDA and Adjusted EPS growth
111111
572.2 606.8
€1.31€1.41
0.00
0.20
0.40
0.60
0.80
1.00
1.20
1.40
1.60
200.0
210.0
220.0
230.0
240.0
250.0
260.0
270.0
280.0
290.0
300.0
310.0
320.0
330.0
340.0
350.0
360.0
370.0
380.0
390.0
400.0
410.0
420.0
430.0
440.0
450.0
460.0
470.0
480.0
490.0
500.0
510.0
520.0
530.0
540.0
550.0
560.0
570.0
580.0
590.0
600.0
610.0
620.0
630.0
640.0
650.0
660.0
670.0
680.0
690.0
700.0
710.0
720.0
730.0
740.0
750.0
H1 2017 H1 2018
Adjusted Profit Adjusted EPS
+6.1%
1. Excluding after-tax impact of the following items: (i) accounting effects derived from PPA exercises and impairment losses, (ii) non-operating exchange gains (losses) and (iii) other non-recurring items.
2. EPS corresponding to the Adjusted profit attributable to the parent company. Calculated based on weighted average outstanding shares of the period.
11
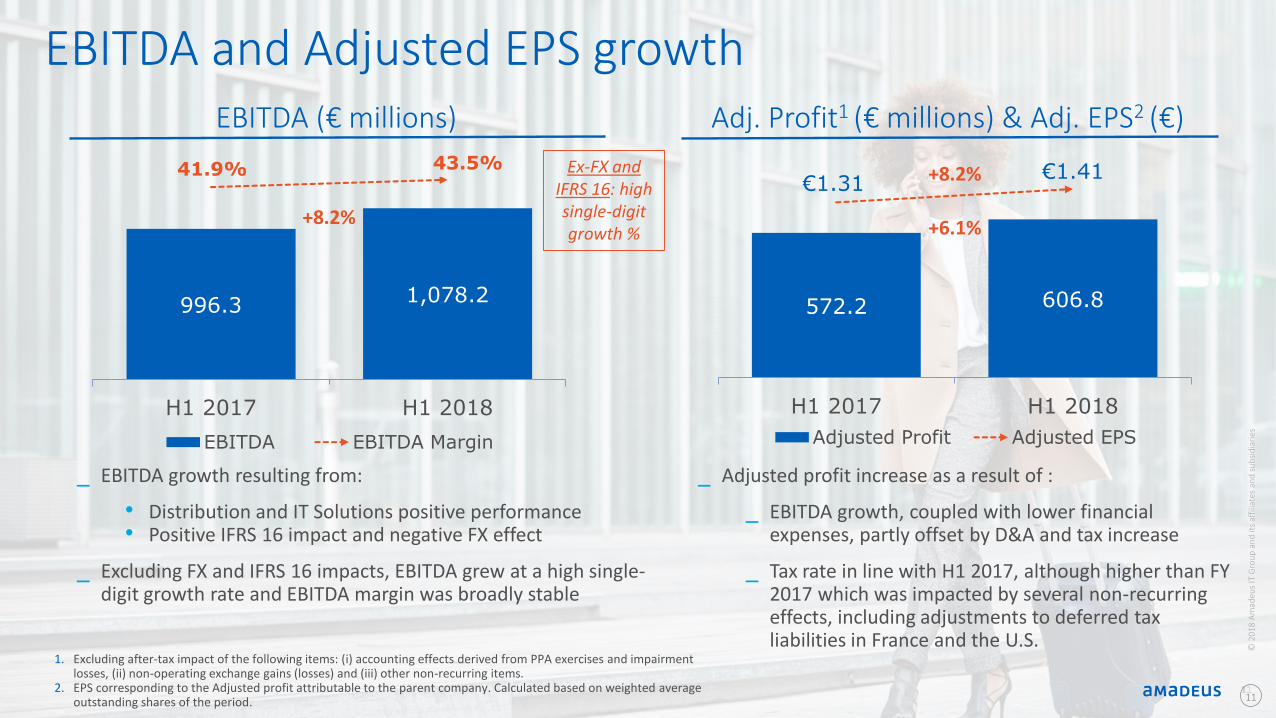
_ Adjusted profit increase as a result of :
_ EBITDA growth, coupled with lower financial expenses, partly offset by D&A and tax increase
_ Tax rate in line with H1 2017, although higher than FY 2017 which was impacted by several non-recurring effects, including adjustments to deferred tax liabilities in France and the U.S.
+8.2%
_ EBITDA growth resulting from:
• Distribution and IT Solutions positive performance• Positive IFRS 16 impact and negative FX effect
_ Excluding FX and IFRS 16 impacts, EBITDA grew at a high single-digit growth rate and EBITDA margin was broadly stable
11
© 2
018
Am
adeu
s IT
Gro
up
an
d it
s af
filia
tes
and
su
bsi
dia
rie
s
EBITDA (€ millions) Adj. Profit1 (€ millions) & Adj. EPS2 (€)
996.31,078.2
41.9% 43.5%
0.00
0.05
0.10
0.15
0.20
0.25
0.30
0.35
0.40
400.0
410.0
420.0
430.0
440.0
450.0
460.0
470.0
480.0
490.0
500.0
510.0
520.0
530.0
540.0
550.0
560.0
570.0
580.0
590.0
600.0
610.0
620.0
630.0
640.0
650.0
660.0
670.0
680.0
690.0
700.0
710.0
720.0
730.0
740.0
750.0
760.0
770.0
780.0
790.0
800.0
810.0
820.0
830.0
840.0
850.0
860.0
870.0
880.0
890.0
900.0
910.0
920.0
930.0
940.0
950.0
960.0
970.0
980.0
990.0
1000.0
1010.0
1020.0
1030.0
1040.0
1050.0
1060.0
1070.0
1080.0
1090.0
1100.0
1110.0
1120.0
1130.0
1140.0
1150.0
1160.0
1170.0
1180.0
1190.0
1200.0
H1 2017 H1 2018
EBITDA EBITDA Margin
+8.2%
Ex-FX and IFRS 16: high single-digit growth %

Investment in R&D and Capex
236.0283.6
54.958.9
12.2%13.8%
H1 2017 H1 2018Intangible Assets Property, plant and equipment % of Revenue
360.6
401.3
15.2% 16.2%
H1 2017 H1 2018
R&D % of Revenue
+11.3% +17.8 %
1. Net of research tax credit.
_ R&D investment related to: (i) product portfolio expansion and evolution, (ii) customer implementations, and (iii) cross-area technological projects
_ R&D investment represented 16.2% of revenue
_ Increase in capex in intangible assets, resulting from higher software capitalizations and signing bonuses paid
_ Capex represented 13.8% of revenue
Capex (€ millions) R&D investment1 (€ millions)
342.5290.8
12
© 2
018
Am
adeu
s IT
Gro
up
an
d it
s af
filia
tes
and
su
bsi
dia
rie
s

Free cash flow generation and leverage
449.1 461.2
H1 2017 H1 2018
2,083.3 2,128.6
Dec 31, 2017 Jun 30, 2018
1.10x1.12x+2.7%
Net debt (€ millions) and leverage (x)2
1. Free cash flow defined as EBITDA, less capex, plus changes in operating working capital, less taxes paid, less interests and financial fees paid.2. Covenant net financial debt and leverage based on the definition included in the senior credit agreement covenants. Leverage calculated as covenant net financial debt divided
by LTM covenant EBITDA.131313
_ Increased free cash flow generation, as a result of higher EBITDA and lower interests and taxes paid, partly offset by higher capex and working capital needs.
_ Net debt increase resulting from shareholder remuneration (including our share repurchases) and cash generation.
Free cash flow1 (€ millions)
© 2
018
Am
adeu
s IT
Gro
up
an
d it
s af
filia
tes
and
su
bsi
dia
rie
s

© 2
016
Am
adeu
s IT
Gro
up
an
d it
s af
filia
tes
and
su
bsi
dia
rie
s
Q2 2018 Highlights

15
141.0 145.1
16.2 15.4
Q2 2017 Q2 2018Air Bookings Non-air bookings
1. Passengers Boarded (“PB”) refers to actual passengers boarded onto flights operated by our Altéa and New Skies migrated airlines.2. Calculated based on passengers boarded adjusted to reflect growth of comparable airlines on the Altéa and New Skies platforms
during both periods
160.5+2.1%
+2.9%
157.2
Amadeus TA Air Bookings by regionAmadeus TA Bookings1 (in millions)
Passengers Boarded1 (in millions) Amadeus PB1 by region
Q2 Volumes
367.1 395.8
46.676.0
Q2 2017 Q2 2018Organic Non organic
413.7471.9+14.0%
+7.8%2
Vo
lum
e gr
ow
th (%
)
WE = Western Europe; CESE = Central, Eastern and Southern Europe; MEA =
Middle East and Africa; LatAm = Latin America; NA = North America (incl. Mexico)
WE,
31.8%
APAC,
21.4%
NA,
18.7%
MEA,
12.9%
CESE,
8.6%
LatAm,
6.5%WE (6.4%)
APAC +16.5%
NA +6.5%
MEA +5.2%
CESE +2.7%
LatAm (0.4%)
Weigh
t (%)
Vo
lum
e gr
ow
th (%
)
WE = Western Europe; CESE = Central, Eastern and Southern Europe; MEA =
Middle East and Africa; LatAm = Latin America; NA = North America (incl. Mexico)
WE,
35.3%
APAC,
31.2%
NA,
13.5%
LatAm,
7.1%
MEA,
7.1%
CESE,
5.9%WE +1.5%
APAC +23.1%
NA +54.7%
LatAm (4.7%)
MEA +5.5%
CESE +24.1%
Weigh
t (%)
Q2 revenue by segment
161616
1,186.0 1,247.0
Q2 2017 Q2 2018
744.3 767.9
Q2 2017 Q2 2018
441.7 479.1
Q2 2017 Q2 2018
+5.1%
Group Revenue (in € millions)
Distribution+3.2%
IT Solutions+8.5%
Segment Revenue (in € millions)
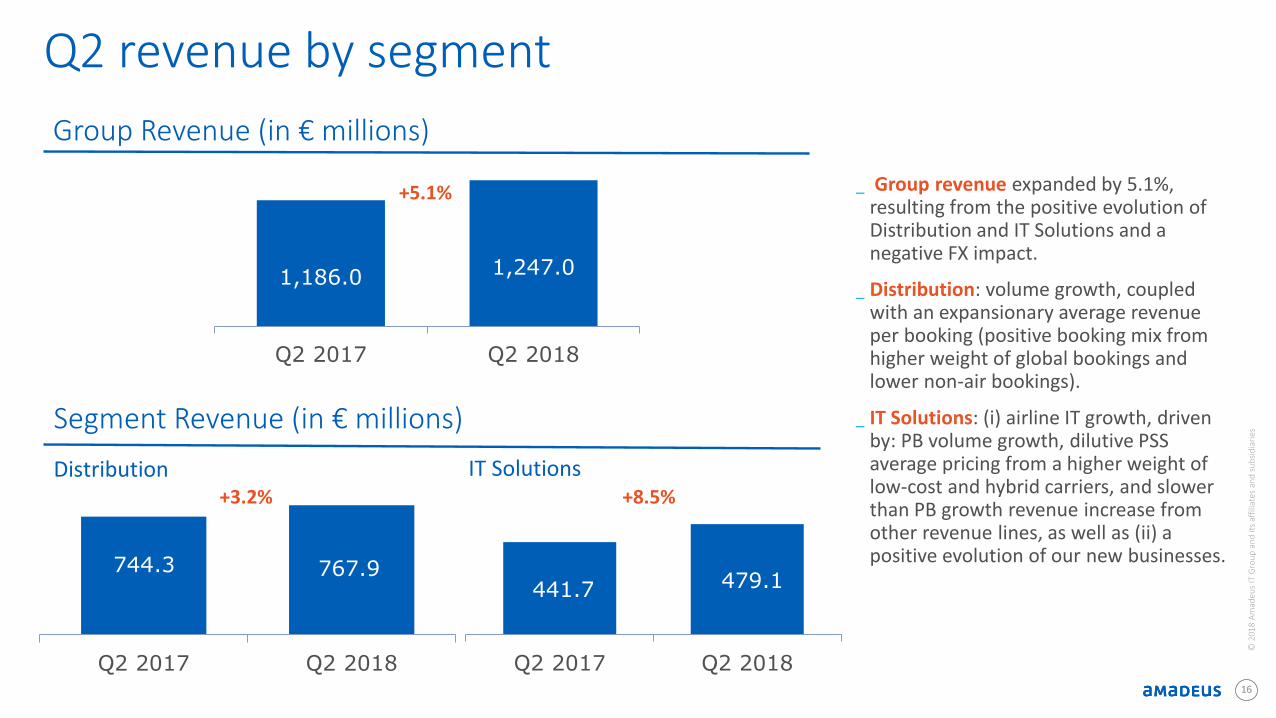
_ Group revenue expanded by 5.1%, resulting from the positive evolution of Distribution and IT Solutions and a negative FX impact.
_ Distribution: volume growth, coupled with an expansionary average revenue per booking (positive booking mix from higher weight of global bookings and lower non-air bookings).
_ IT Solutions: (i) airline IT growth, driven by: PB volume growth, dilutive PSS average pricing from a higher weight of low-cost and hybrid carriers, and slower than PB growth revenue increase from other revenue lines, as well as (ii) a positive evolution of our new businesses.
© 2
018
Am
adeu
s IT
Gro
up
an
d it
s af
filia
tes
and
su
bsi
dia
rie
s

17
Support materials
© 2
018
Am
adeu
s IT
Gro
up
an
d it
s af
filia
tes
and
su
bsi
dia
rie
s
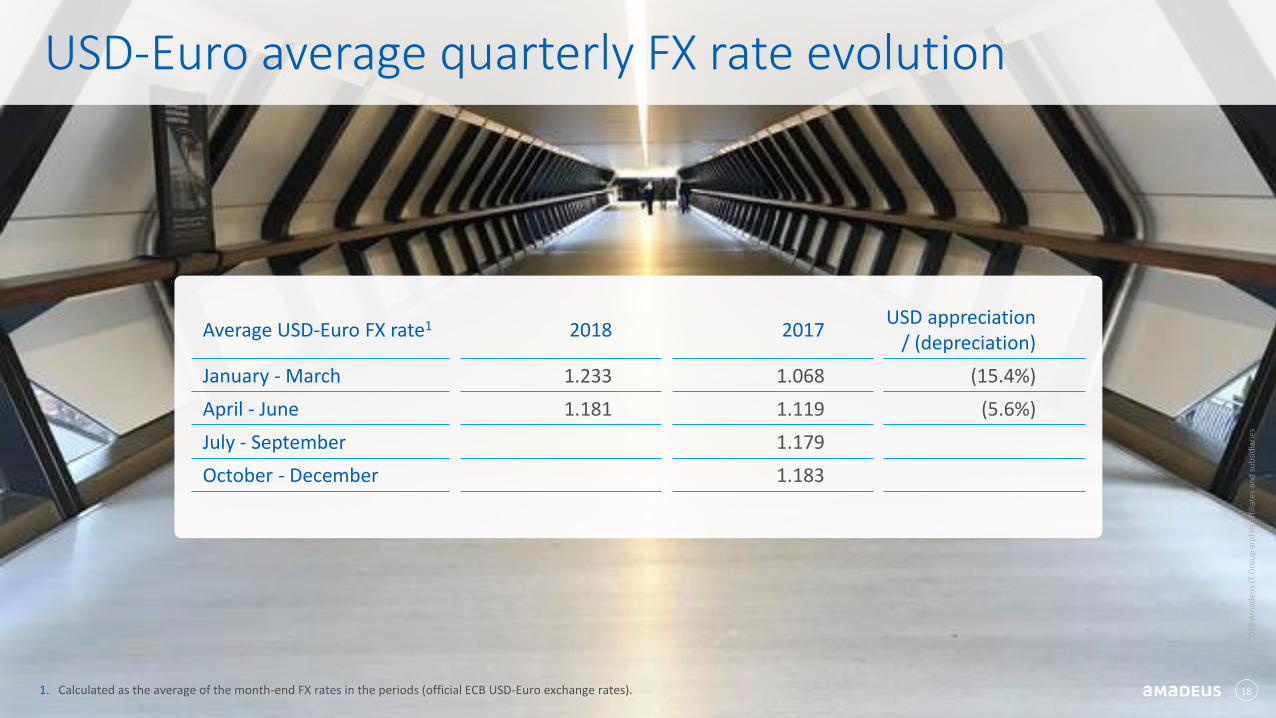
Average USD-Euro FX rate1 2018 2017USD appreciation
/ (depreciation)
January - March 1.233 1.068 (15.4%)
April - June 1.181 1.119 (5.6%)
July - September 1.179
October - December 1.183
USD-Euro average quarterly FX rate evolution
18
© 2
018
Am
adeu
s IT
Gro
up
an
d it
s af
filia
tes
and
su
bsi
dia
rie
s
1. Calculated as the average of the month-end FX rates in the periods (official ECB USD-Euro exchange rates).
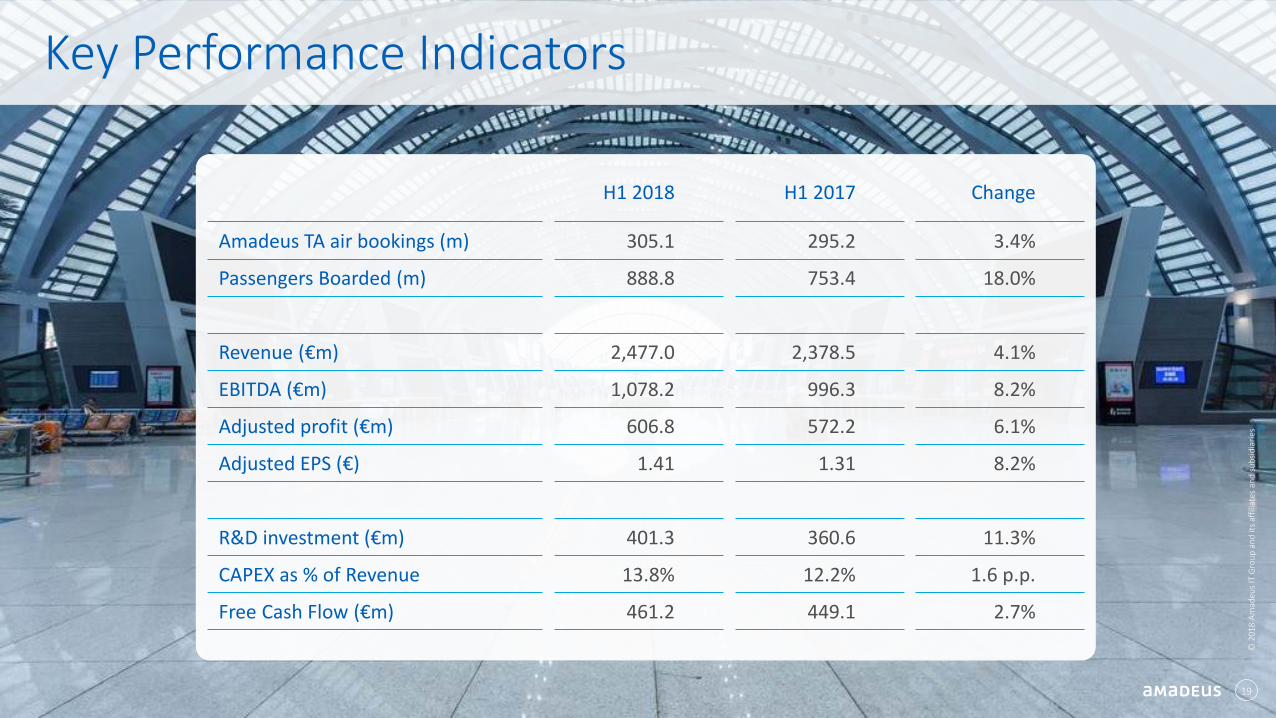
H1 2018 H1 2017 Change
Amadeus TA air bookings (m) 305.1 295.2 3.4%
Passengers Boarded (m) 888.8 753.4 18.0%
Revenue (€m) 2,477.0 2,378.5 4.1%
EBITDA (€m) 1,078.2 996.3 8.2%
Adjusted profit (€m) 606.8 572.2 6.1%
Adjusted EPS (€) 1.41 1.31 8.2%
R&D investment (€m) 401.3 360.6 11.3%
CAPEX as % of Revenue 13.8% 12.2% 1.6 p.p.
Free Cash Flow (€m) 461.2 449.1 2.7%
Key Performance Indicators
19
© 2
018
Am
adeu
s IT
Gro
up
an
d it
s af
filia
tes
and
su
bsi
dia
rie
s

Thank you!
You can follow us on:
AmadeusITgroupamadeus.comamadeus.com/blog
© 2
018
Am
adeu
s IT
Gro
up
an
d it
s af
filia
tes
and
su
bsi
dia
rie
s