Embed Size (px)
Citation preview

ALUMINUM WATER TREATMENT RESIDUALS FOR REDUCING PHOSPHORUS
LOSS FROM MANURE-IMPACTED, HIGH-WATERTABLE SOILS
By
THOMAS J. REW
A THESIS PRESENTED TO THE GRADUATE SCHOOL OF THE UNIVERSITY OF FLORIDA IN PARTIAL FULFILLMENT
OF THE REQUIREMENTS FOR THE DEGREE OF MASTER OF SCIENCE
UNIVERSITY OF FLORIDA
2006

Copyright 2006
by
Thomas J. Rew

To my Granddad, my partner in crime, for all the summers he encouraged my passion for agriculture, the environment, and life

iv
ACKNOWLEDGMENTS
I thank Dr. D.A. Graetz for his guidance and assistance over the past five years
through both my undergraduate and graduate studies. I also would like to thank the other
members of my committee: Drs. V.D. Nair, G.A. O’Connor, and L.E. Sollenberger for
their support and guidance. Special thanks go to the crew who helped collect my soil
sample and prepare the rainfall simulation boxes: Jacob Butler, Eric Smith, Leighton
Walker, and Steve Robinson.
I would also like to thank Dawn Lucas for her help with laboratory experiments,
calculations, and controlling emotions when using the AA; Julie, Lacey, Justin, and Ryan
for their help in the lab (dishes); the CALS Ambassadors and Agronomy and Soils Club
for allowing me to become more than just a student of UF. In addition, I need to thank
the faculty and staff of the University of Florida Soil and Water Science Department
giving me the opportunity to expand my knowledge.
Most importantly, I want to thank my family and friends for the support and advice
they have given me over the past three years. Mom and Dad, I’m finally done; Courtney
Maibach, it is your turn to read my thesis and I promise, I’ll finish arguing yours soon.
Finally, Kelly Aynes, thank you for allowing me to setup an office in your house. I could
not have finished without your love, patience, and understanding. I can only hope I can
return love and support over the next two years of vet school. Thank you.

v
TABLE OF CONTENTS page
ACKNOWLEDGMENTS ................................................................................................. iv
LIST OF TABLES............................................................................................................ vii
LIST OF FIGURES ........................................................................................................... ix
ABSTRACT.........................................................................................................................x
CHAPTER
1 INTRODUCTION ........................................................................................................1
2 LITERATURE REVIEW .............................................................................................6
Forms of Phosphorus in Soil.........................................................................................6 Water Treatment Residuals as Soil Amendments ......................................................10 Aluminum Toxicity ....................................................................................................14 Rainfall Simulation.....................................................................................................17
3 MATERIALS AND METHODS ...............................................................................20
Project Description .....................................................................................................20 Site Description and Soil Collection ...................................................................20 Aluminum Water Treatment Residual Collection...............................................21 Construction of Runoff Boxes.............................................................................21 Rainfall Simulation..............................................................................................23 Experimental Design ...........................................................................................26 Soil Sampling and Forage Harvest ......................................................................27
Analytical Methods.....................................................................................................27 Soil.......................................................................................................................27 Aluminum Water Treatment Residuals ...............................................................28 Forage ..................................................................................................................29 Runoff, Subsurface Flow, Leachate ....................................................................29 Quality Assurance and Quality Control ..............................................................31 Statistical Analysis ..............................................................................................31
4 RESULTS AND DISCUSSION.................................................................................32
Initial Soil P Concentrations and pH ..........................................................................32

vi
Aluminum Water Treatment Residual Characteristics ...............................................32 Runoff, Subsurface Flow, and Leachate Characteristics ............................................33
Volume ................................................................................................................33 pH ........................................................................................................................34 Phosphorus ..........................................................................................................34 Nitrate- and Ammonium-Nitrogen ......................................................................42 Total Calcium, Magnesium, Iron, and Aluminum Concentrations .....................43
Pre- and Post-simulation Comparisons.......................................................................44 Soil Phosphorus ...................................................................................................44 Soil pH.................................................................................................................45
Forage .........................................................................................................................46
5 CONCLUSIONS ........................................................................................................51
LIST OF REFERENCES...................................................................................................53
BIOGRAPHICAL SKETCH .............................................................................................61

vii
LIST OF TABLES
Table page 4-1 Initial soil mean values of P concentrations and pH of the Immokalee fine sand
used in the study. ......................................................................................................32
4-2 Selected characteristics of the Manatee County Al-WTR. ......................................33
4-3 Average runoff, subsurface flow, and leachate volumes as influenced by treatment from six simulations of runoff, five simulations of subsurface flow, and two simulations of leachate. ..............................................................................34
4-4 Average soluble P concentrations by treatment in runoff (six events), subsurface flow (five events), and leachate (two events)...........................................................36
4-5 Average soluble P concentrations in runoff, subsurface flow, and leachate after 4 wk of flooded conditions (Simulation 7)..................................................................39
4-6 Runoff, subsurface flow, and leachate collected during simulation 7(A) Volume. (B) pH......................................................................................................40
4-7 Soluble P mass loss (SP concentration * volume) per box averaged over six rainfall events and estimated SP loss per hectare per rainfall event. .......................41
4-8 Total, soluble, and particulate P concentrations in runoff for each treatment averaged over six rainfall events. .............................................................................42
4-9 Average N concentrations in runoff, subsurface flow, and leachate from six, five, and two simulations, respectively. (A) NH4-N. (B) NO3-N............................43
4-10 Average total Ca, Mg, Fe, and Al concentrations in runoff, subsurface flow, and leachate from six, five, and two simulations, respectively. (A) Runoff. (B) Subsurface flow. (C) Leachate. ...............................................................................44
4-11 Pre- and post-simulation water extractable P concentrations in the 0-10 and 10-20 cm soil layers.......................................................................................................45
4-12 Pre- and post-simulation Mehlich-P concentrations in the 0-10 and 10-20 cm soil layers..................................................................................................................45

viii
4-13 Pre- and post-simulation soil pH values in the 0-10 and 10-20 cm soil layers. .......46
4-14 Stargrass shoot biomass harvested prior to each simulation. ...................................47

ix
LIST OF FIGURES
Figure page 3-1 Runoff box design. ...................................................................................................22
3-2 Schematic diagram of rainfall simulator. .................................................................24
3-3 Box placement under simulator................................................................................25
3-4 Treatment descriptions .............................................................................................26
4-1 Runoff, subsurface flow, and leachate pH values from six, five, and two simulations, respectively. .........................................................................................35
4-2 Average treatment SP concentrations and standard deviations from the three collection points.. .....................................................................................................38
4-3 Total shoot and root growth per treatment averaged over six simulations. .............47
4-4 Average stargrass TP concentrations per treatment averaged over all simulations. ..............................................................................................................48
4-5 Average stargrass TN concentrations per treatment averaged over all simulations. ..............................................................................................................49
4-6 Average stargrass Al concentrations per treatment averaged over all simulations.. .............................................................................................................50

x
Abstract of Thesis Presented to the Graduate School
of the University of Florida in Partial Fulfillment of the Requirements for the Degree of Master of Science
ALUMINUM WATER TREATMENT RESIDUALS FOR REDUCING PHOSPHORUS
LOSS FROM MANURE-IMPACTED, HIGH-WATERTABLE SOILS
By
Thomas J. Rew
December 2006
Chair: Donald Graetz Major Department: Soil and Water Science
Dairy and beef operations in the Lake Okeechobee watershed in Florida and across
the nation are receiving attention as a result of their contribution of phosphorus (P) to
surficial water bodies. Numerous efforts are being made to support the agricultural
industry by reducing P losses from the soil. One such effort involves the addition of
water treatment residuals (WTRs) to the soil. Prior research has shown that Al-WTRs are
capable of binding P and therefore reducing P loss through runoff and leaching. The
objective of this research was to evaluate the effect of Al-WTR on P loss from a manure-
impacted soil obtained from a dairy sprayfield using a rainfall simulation protocol. Soil
was removed from the field site as 0–10 and 10–20 cm depths. Both depths contained
high concentrations of water-soluble P and Mehlich-1 P; approximately 18 and 950 mg P
kg-1, respectively. After air drying and sieving, the soil was placed in rainfall simulation
boxes (100 cm x 30 cm x 20 cm) designed to collect runoff, subsurface flow, and
leachate. An Al-WTR was either surface applied or incorporated to 10 or 20 cm depths
xi
at a rate of 2.5% of soil dry weight. The soil was then sprigged with stargrass (Cynodon
nlemfuensis). Rainfall simulations were run six times at 3 wk intervals. Runoff was
collected for 30 min after initial runoff began. Subsurface flow and leachate were
collected (depths of 10 and 20 cm, respectively) after runoff ceased.
When Al-WTR was surface-applied, the SP concentration in runoff was reduced by
approximately 75% compared to untreated soil; however, SP concentrations in subsurface
flow and leachate did not decrease. When Al-WTR was incorporated into the soil at
depths of 0–10 or 0–20 cm, runoff SP concentrations were reduced by approximately
45%. Incorporation of Al-WTR to a depth of 10 cm decreased SP concentrations in
subsurface flow and leachate by 37 and 11%, respectively. However, with incorporation
of Al-WTR to a depth of 20 cm, both subsurface flow and leachate SP concentrations
were reduced by approximately 90%. The incorporated Al-WTR reduced soil water-
extractable P (WEP) by approximately 70%. However, Mehlich-1 P concentrations were
not affected by the incorporation of Al-WTR in the soil. Care must be taken to ensure
complete incorporation of Al-WTR throughout the P-impacted layer, as Al-WTR is only
effective in reducing SP concentrations when it is in contact with the impacted soil.
Shoot and root growth of stargrass were not adversely affected by the Al-WTR applied at
a rate of 2.5% of soil weight.

1
CHAPTER 1 INTRODUCTION
Over the past 5,000 yr, the Lake Okeechobee watershed has developed an
ecosystem to thrive under oligotrophic conditions. The watershed is approximately
12,000 km² and flows roughly from Orlando to the Everglades (SFWMD, 1997). On
average, the watershed receives 120 cm of rain annually (McCaffery et al., 1976). The
elevation in the watershed is predominately flat, with a range from 3.1 to 22.9 m above
mean sea level (Soil Survey, 2003). As a result, the watertable is naturally close to the
surface for much of the year. Prior to development and utilization of the land, much of
the watershed was completely saturated for one to two months a year (Gatewood and
Bedient, 1975).
The watershed is divided into six regions. The two most important regions are the
Lower Kissimmee River (LKR) and Taylor Creek/Nubbin Slough (TCNS) because they
contribute approximately 57% of the total phosphorus (P) load to Lake Okeechobee
(Fluck et al., 1992). Phosphorus discharge to surficial water bodies has recently become
a major concern in the watershed. One of the current major contributors to the situation
is waste from livestock which contains high amounts of P. As Florida has continued to
develop, land has become more valuable and farmers and ranchers have intensified their
operations by increasing the concentration of animals per acre. The resulting effect has
been increased discharge of P into the watershed.
Because of the warm climate and abundance of water, the agricultural community
has flourished, and land use practices in the LKR and the TCNS have intensified to

2
maximize production. In particular, the beef and dairy industries have, respectively,
amassed herds of 133,000 and 32,000 animals in Okeechobee County (Florida
Agriculture Statistical Directory, 2004). To support these herds, 31% of the land in the
LKR and 62% of the land area in the TCNS has been drained and converted to improved
pastures. Improved pasture area increased by 500% between 1950 and 1970. Currently,
improved pastures comprise approximately 87,000 ha in the LKR and the TCNS (Flaig
and Havens, 1995). Inorganic fertilizer used on improved pastures account for 34% of all
P imports to the watershed (Boggess et al., 1995). Additional P imports come from
mineral supplements and winter feed. The most intensive land use in the watershed is
dairy farming. From 1960 to 1990, dairies increased their imports of P in cattle feed from
360 t P yr-1 to 1200 t P yr-1 (Flaig and Havens, 1995; Boggess et al., 1995). Dairy feeds
constituent 35% of P imports into the watershed, but P impacts have been decreasing
since 1990 as a result of the dairy buyout program which closed 19 of 49 dairies in the
basin (Flaig and Reddy, 1995).
Phosphorus is a vital nutrient in both natural and agricultural environments and is
often imported to foster agricultural operations. Traditionally, P has been considered
relatively immobile in soils, primarily only subject to loss by erosion. However, P can
also move vertically or horizontally within some soil profiles and can be transported into
the surface water of canals, streams, and lakes. Graetz and Nair (1995) found residual P
from manure has the potential to leach laterally because of the surface horizon’s low P-
retention capacity in a Spodosol. The resulting soluble P in surface water often causes
detrimental impacts on native ecosystems.

3
Phosphorus occurs in soluble and insoluble compounds in both organic and
inorganic forms in the soil environment (Faulkner and Richardson, 1989). Organic forms
exist as both living plant tissue and in deposits of detrital material. Inorganic P is found
as insoluble phosphate and minerals adsorbed to clay particles, organic matter, and Fe
and Al hydroxides (Mitsch and Gosselink, 1993). Nevertheless, the majority of P is
unavailable to biota. Unlike nitrogen, P does not have any significant losses to the
atmosphere. Therefore, P remains in the soil or is transported by another mechanism
besides volatilization.
Soils in the watershed consist predominately of Spodosols, Entisols, and Histosols.
The Histosols occur primarily as small deposits in wetlands, where as Spodosols
dominate the northern portion of the watershed. The surface horizons are typically
between 0.08 and 0.20 m thick and are underlain by a spodic horizon at 0.5 to greater
than 2 m depth (USDA, 1990). The closer the spodic horizon is to the surface, the more
poorly drained the soil. Spodosols are characterized by high infiltration rates because of
the greater than 90% sand content. However, they have poor internal drainage because of
the low permeability of the spodic horizon. The Spodosols, Myakka (32%), Immokalee
(30%), and Pomello (2%) cover 64% of Okeechobee County (Soil Survey Staff, 2003).
The concern regarding the high watertable and high infiltration rates is that surface
horizons of Entisols and Spodosols have a limited capacity to retain P and, thus, are
susceptible to P loss.
The Bh (spodic horizon) in South Florida Spodosols contains Al and/or Fe and
organic material accumulated from the stripping of the E horizon. Spodosols in general
are naturally deficient in P (Hodges et al., 1967). Nevertheless, as a result of the

4
accumulation of material, the spodic has the ability to retain downward moving P onto Fe
and Al oxides (Nair et al., 1995). These eluvial materials enable the possible retention of
excess P from agricultural operations. Depth to Bh has an impact on the P leaching
potential of the soil. As the depth of the Bh increases the potential for P loss via
subsurface drainage increases. Moreover, as the depth of the spodic increases its P
adsorption capacity decreases (Nair et al., 1999).
Despite the sorption of P in the soil, it can still be highly mobile. The combination
of the fluctuating and perched watertable allows lateral movement of P through the soil
and into the surface water (Graetz and Nair, 1995). In fact P can move so readily, that
between 1973 and 1988, the concentration of P in Lake Okeechobee increased
approximately 250% (Neganban, 1993).
In an effort to reduce eutrophication and restore the Everglades to a system
resembling the past, larger releases of water to the Everglades and reductions in P loading
are mandatory. Therefore, to meet the requirements of the Comprehensive Everglades
Restoration Plan, the South Florida Water Management District, U.S. Army Corps of
Engineers, and other state agencies created massive water treatment areas, instituted use
of Best Management Practices (BMPs), and increased water flow to the Everglades
(SFWM, 1997). Representative BMPs include fencing off canals, adding water troughs
to pastures, and reducing P concentrations in feed.
These measures alone are not adequate to meet the acceptable P levels within the
watershed due to residual P levels remaining in soils highly impacted by manure. Recent
studies have suggested that the addition of soil amendments has the potential to reduce P
loss from soil. Investigations have included numerous amendments from differing

5
sources. One promising area of investigation is the land application of water treatment
residuals (WTRs). WTRs are the waste product from drinking water purification, and
typically contain Al, Ca, or Fe compounds used to remove nutrients and particulate
matter from source water. Land application of WTRs has the potential to help reduce
water soluble P (WSP) concentrations in P-impacted soils. Previous research has shown
that WTRs containing Al are the most efficient in reducing WSP in soils. Therefore, a
study was developed to evaluate the effect of an Al-WTR on soil P dynamics in a sandy
soil with a fluctuating watertable. The study had two main objectives:
1. To determine the effect of surface application, partial mixing, and complete mixing of Al-WTR with soil on P loss in runoff, subsurface flow, and leachate.
2. To determine the Al-WTR’s effect on forage growth.

6
CHAPTER 2 LITERATURE REVIEW
Forms of Phosphorus in Soil
Phosphorus (P) is commonly found in soils in small total quantities (Lindsay,
1989). Forms of P in soils can be either inorganic or organic. Phosphate minerals,
organometallic complexes, and P to bound metals and hydroxides are all inorganic forms
of P that may be present in the soils. Microbes, humus, and undecomposed litter make up
the organic P fraction (Gale et al., 1994). Reddy et al. (1996) identified five major pools
of P in soils: a) labile inorganic P, b) P bound to Fe and Al minerals, c) P bound to Ca
and Mg minerals, d) P bound in labile organic forms, and e) residual organic P.
The labile pool of P is of particular environmental concern because labile P can
potentially move laterally or vertically in the soil profile as a result of precipitation. The
Glossary of Soil Science Terms (SSSA, 2006) defines the labile pool of P as “that portion
which is readily solubilized or exchanged when the soil is equilibrated with a salt
solution,” and the available pool as “the amount of soil P in chemical forms accessible to
plant roots or compounds likely to be convertible to such forms during the growing
season.”
Oxalate-extractable Al and Fe dominate P retention in many soils and provide
strong sorption of P (Ballard and Fiskell, 1974). The retention of P by Fe/Al or Ca/Mg
depends on the soil’s pH. In acid and neutral soils, P retention is dominated by Fe and Al
compounds because P binds with protonated surfaces of hydroxides of Fe and Al (Olila
and Reddy, 1995). In alkaline soils, Ca and Mg compounds are more dominant in

7
retaining P because P sorption decreases due to competition between PO43- and OH-
anions. Anion exchange binds phosphates with Fe and Al hydroxides (Olila and Reddy,
1995). Because amorphous Al and Fe hydroxides have a larger number of singly
coordinated surface hydroxyl ions, they have a higher P sorption capacity than crystalline
oxides (Reddy and Smith, 1987). In reduced conditions, Fe stability is affected. As a
result of the reduced stability, P associated with Fe3+ maybe solubilized and released into
the soil solution. However, Al compounds associated with P are not affected by changing
oxidation and reduction conditions in the soil (Miner, 2001).
Labile organics represent the short term storage of P as living tissue in plants. This
P is quickly returned to the soil either through manure or decomposition, whereas,
residual organics represent long term storage of P as detrital tissue that is resistant to
decomposition (Reddy et al., 1996). Because of the P storage ability of plant tissue,
phytoremediation of warm-season perennial grasses has been examined. Warm-season
perennials have the ability to extract more P than warm-season annuals and cool-season
grasses because the potential dry matter yield of perennials is greater. Howard (2006)
estimates that adding nitrogen (N) to increase forage yields in hay production could
decrease soil P concentration 4 to 13 mg kg-1 annually.
The soil’s ability to retain P determines the risk of environmental consequences
related to P leaching. Therefore, the continued assessment of a soil’s capacity to retain P
remains a vital tool in environmental sustainability. Soluble forms of P react and form
less soluble compounds with soil components. The amount of P available to be removed
from solution depends on the quantity of P-reactive colloidal surfaces within the soil
(Holford et al., 1997). The sorption and desorption capacity of soils between horizons

8
has the potential to influence the movement of P within the profile (He et al., 1999).
Variations of P sorption are attributed to surface area variability based on particle size
(Atalay, 2001). Soil sorption and desorption mechanisms control the solution phase P
(Frossard et al., 1995).
Determining the movement and availability of P in soils and groundwater is
paramount in the preservation of natural resources. By using the Langmuir adsorption
isotherm equation, an estimate of P sorption capacity and strength can be determined in
the soil. Soil extractable P can be related to the P-sorbing capacity of a soil by using the
degree of P saturation test (DPS); DPS = (extractable soil P / P sorption maximum) * 100
(Breeuwsma and Silva, 1992). Degree of P saturation may also be expressed as a
percentage of double-acid extractable P (Mehlich-1) to the P sorption capacity of a soil
(Nair and Graetz, 2002).
When sorption equals desorption a system is at equilibrium. Therefore, if the
concentration of P in soil water decreases, desorption will occur until equilibrium is
reached. Likewise, if the P in soil water increases, sorption will occur until equilibrium is
attained (Froelich, 1988). The occurrence of no net sorption or desorption is known as
the equilibrium P concentration (EPC). Sharpley and Menzel (1987) found sorption
properties of the soil control the conversion from dissolved P to particulate P and back to
dissolved P. Therefore, the concentration of P controls the direction of exchange. A
prediction of loss or gain of P from solution can be determined using the EPC; soils with
low EPC values tend to sorb soluble P.
Graetz and Nair (1995) found that the A and E horizons of a manure-impacted
Spodosol had higher EPC values than the Bh horizon. Therefore, A and E horizons are

9
inferred to have a lower retention capacity than the Bh horizon. In manure-impacted
soils, high EPC values reflect high P loading. Graetz and Nair (1995) also found that
oxalate-extractable Al and total organic carbon accounted for approximately 69% of the
variability in the P retention maximum in the A, E, and Bh horizons forage, pasture, and
intensive areas. Maximum P retention capacity increases with depth. In fact, the Bh was
found to have a P retention capacity three to four times greater than the A and E horizons
(Reddy et al., 1996).
The high cost of inorganic N fertilization has prompted agriculture to better utilize
waste products through the application of biosolids and animal manures. These
amendments are typically applied to meet a crop’s N requirement. The result of this
common practice is an excessive accumulation of P in the soil. Soils with low P sorption
capacities, such as sandy soils, are more susceptible to P loss through runoff and
subsurface water movement. Kleinman and Sharpley (2003) evaluated P runoff from two
soils amended with three types of manure (applied at 6 rates ranging from 0–150 kg TP
ha-1) following the National P Protocol for rainfall simulation studies. Dissolved reactive
P (DRP) in runoff increased with increased manure application rate. Water-extractable P
(WEP) concentrations in the manures were directly related to DRP runoff concentrations.
Repeated rainfall events diminished DRP concentrations in runoff with all manure types
and application rates. This trend was attributed to both the translocation of manure P into
the profile and the loss of previous applied P by runoff.
A close association between soluble P (SP) concentration in land-applied manures
and P concentrations in runoff has been shown in recent studies. Moore et al. (1994) and
Withers et al. (2001) indicated that DRP loss from amended soils was proportional to the

10
soluble P content of the source. In addition, Kleinman et al. (2002) found the WSP
concentration of surface applied manure (dairy, swine, and poultry) was highly correlated
with DRP in runoff from three soils.
Water Treatment Residuals as Soil Amendments
Efforts to reduce P loss in agricultural sandy soils include several strategies:
reducing P loading, increasing the ambient P storage, and maximizing P retention. Many
soils with high P concentrations currently discharge P into surficial water bodies.
Phosphorus retention in highly impacted sandy soils could be improved with the addition
of amendments such as water treatment residuals (WTRs) derived from the treatment of
drinking water to remove color, taste, turbidity, and odor. The chemical composition of
WTRs depends on the metal salts used to clarify the water. The typical salts used are Al
(alum), Fe (ferric chloride), or Ca (CaCO3). The by-product of this water purification
process is solid material commonly referred to as WTR. The WTR is often considered a
waste product because it is currently being disposed in landfills, sanitary sewers, or in
lagoons (Ippolito et al., 2002). Water treatment residuals have historically had little
success as a soil substitute or soil amendment compared to their counterpart, biosolids
(Cornell and Westerhoff, 1981). However, recently WTRs have been considered as soil
amendments because of the P-sorbing characteristics.
Recently WTRs have been evaluated for use as both a soil substitute and a soil
amendment because their properties are similar to fine textured soils (Elliott et al., 1990).
These fine textured substances are comprised of sand, silt, and clay particles as well as
activated carbon, polymers, Al, Fe oxides, and calcium carbonate derived from the raw
water (Elliott and Dempsey, 1991). The WTRs have improved soil conditions in
numerous studies by increasing organic matter content, water holding capacity, and pH.

11
However, because of the high relative surface area of the amorphous Al and Fe
compounds, Al- and Fe-WTRs can cause P deficiencies in soils and reduce crop yields
(Bugsbee and Frink, 1985).
Dayton and Basta (2001) tested the beneficial properties of WTRs by evaluating 17
WTRs for use as a soil substitute by comparing their nutritive, physical, and chemical
properties with soil. The WTRs contained the full spectrum of available nutrients, except
P. A bioassay was performed with tomato seedlings (Lycopersicon esculentum) to
validate the results of soil tests used to measure P adequacy in the WTRs. All plants had
low tissue P (561–1840 mg kg-1; median 923 mg kg-1); 1000 mg kg-1 is considered
deficient. Vegetative yield was limited primarily because of P deficiencies and in some
cases, phytotoxic levels of NO2-N (>10 mg kg-1).
In an effort to utilize the positive aspects of organic wastes and minimize
detrimental effects, Gallimore et al. (1999) examined four surface application treatments
of Al-WTR (0, 11.2, 44.9 Mg ha-1 and 44.8 Mg ha-1 in a buffer strip at the end of the plot)
on bermudagrass plots receiving 6.72 Mg ha-1 of poultry litter. The plots received
simulated rainfall for 75 mins at 6.3 cm hr-1 within 24 hr of the application of the litter
and Al-WTR. Surficial runoff was collected and analyzed for TN, NH4-N, TP, SP,
dissolved Al, and dissolved solids. No reductions in SP concentrations were observed
with the 11.2 Mg ha-1 rate. Soluble P concentration was reduced from 15.0 mg L-1 in the
control to 8.6 mg L-1 in the 44.9 Mg ha-1 application rate. Similar results were obtained
when the WTR was applied just in the buffer strip. These reductions were attributed to
the amorphous Al in the Al-WTR. In addition, dissolved solids and Al content did not
increase in surface runoff with the application of the Al-WTR.

12
The potential P-sorption and precipitation capability of Al-, Ca-, and Fe-WTRs has
generated interest in their use as an amendment in highly P-impacted soils. O’Connor et
al. (2002) found that WTRs reduced P solubility and leaching in manure-amended soils.
Brown and Sartain (2000) reported that Fe-WTR was able to significantly reduce P
leaching on a simulated golf course using 2.5% by weight of the Fe-WTR. Al-WTRs
reduced P and NH4+ by 75% in surface runoff from land treated with poultry manure
(Basta and Sloan, 1999). All soluble P was adsorbed in an 8:1 mixture of Al-WTR and
biosolids (Fort Collins, CO). Increasing this ratio has the potential to adsorb all available
P in the biosolids and the soil P (Ippolito et al., 2002).
A rainfall simulation runoff study by Haustein et al. (2000) evaluated both Al-WTR
and HiClay Alumina (HCA-a byproduct of commercial alum production) to test P
adsorption capabilities in a soil highly impacted by P. The HCA P-adsorption capacity
was 20 times less than the Al-WTR P-adsorption capacity (86 vs. 1750 mmol kg-1). In
addition, the Al-WTR increased the total recoverable Al in the soil, while HCA did not
affect the recoverable Al concentration. These differences were attributed to the greater
total Al content of the Al-WTR compared to the HCA (159 vs. 46.7 g kg-1) .
The effect of WTR composition on P solubility and leaching was tested by Elliott
et al. (2002) in a sandy soil (Immokalee-Spodosol) after additions of biosolids and triple
superphosphate (TSP) to increase P concentrations in the soil. The study evaluated the
ability of Al-WTR, Fe-WTR, Ca-WTR, and pure hematite to reduce P loss from the soil.
Soluble P concentrations in the leachate decreased in the order: Al-WTR > Ca-WTR ≈
Fe-WTR>>hematite.

13
The retention mechanisms of an Al-WTR were studied by Ippolito et al. (2003).
The research involved shaking an Al-WTR for 1–211 d and analyzing the solution for
pH, Ca, Al, and P. The pH increased from 7.2 to 8.2 after shaking. Change in pH
beyond 84 d of shaking was not significant. In addition, the shaking increased Ca and Al
concentration and decreased P concentration. The average maximum pH of 8.15 and Ca
desorption suggest that the Al-WTR’s Ca source was the raw water used at the treatment
plant (South Platte River pH~7.5–8 and Ca = 41.9 g kg-1). Removal of P was attributed
primarily to chemisorption on the amorphous Al mineral phase.
Novak and Watts (2004) evaluated the impact of incorporating two Al-WTRs on
two Ultisols in a laboratory setting. The Al-WTRs were added at the following rates:
2.5, 5.0, 7.5, and 10.5% by weight. The Pmax values for both amended soils (175 and 85
mg P g-1) were significantly higher than Pmax values without the addition of Al-WTRs
(<1.0 mg P g-1). The results demonstrate the usability of Al-WTRs to increase P
adsorption in sandy soils. In addition, the findings suggest off-site P-transport could be
reduced by the implementation of this new chemical based BMP.
Application rate of an Al-WTR (0, 2.5, 5.0, and 10.0% by weight), the degree of
mixing of the Al-WTR with the soil, and the mixing of an un-impacted E-horizon with an
impacted A-horizon on P leaching was examined by Miyittah-Kporgbe (2004). Runoff
and leaching rates were determined via rainfall simulations and columns, respectively
(leachate was also collected from rainfall simulation.). Phosphorus leaching was reduced
by 87 to 99.7% when the Al-WTR was mixed completely with 15 cm of soil, compared
to partial mixing (7.5 cm of soil), which only reduced P leaching from 40 to 58%.
Improved P retention was attributed to increased contact of the Al-WTR with soil P. The

14
runoff results found that soluble P concentrations met the critical threshold of <0.03 mg
L-1 when Al-WTR was surface applied. However, due to limited contact between the
amendment and soluble P, the leachate soluble P concentrations exceeded the critical
value. Combining the impacted A-horizon with the un-impacted E-horizon increased the
Al-WTR efficiency. This increase in efficiency was attributed to the dilution of soluble
organic material, which can block P adsorption sites on the Al-WTR. Conclusions from
the data suggest Al-WTR must be in direct contact with soluble P to prevent loss by
leaching. In addition, an increase in surface application (10%) can be as effective as
mixing lower quantities (2.5%) of Al-WTR. Application and distribution of Al-WTR in
the soil must be made in accordance with anticipated P losses; surface application with
runoff or mixing with leaching.
Aluminum Toxicity
Aluminum toxicity to plants is a primary concerns when Al-WTR is applied to soil.
In acidic soils, Al toxicity has been shown to be one of the primary growth-limiting
factors (Foy et al., 1978). Mobility and phytotoxicity of Al in the soil solution as a result
of soil acidification (Taylor et al., 1989) is a potential problem. Soil acidity impacts
approximately 40% of the arable soil in the world (Haug, 1984). As a result, Al
phytotoxicity presents a serious agricultural concern (Van Wambeke, 1976). Symptoms
of Al toxicity, such as reduced root and shoot growth, mimic phosphate, Ca, and Fe
deficiencies (Foy, 1984). Extensive Al research has been conducted which indicates Al
toxicity primarily affects the roots: a) the observable symptoms of Al toxicity are the
reductions in root elongation (Osborne et al., 1981; Jarvis and Hatch, 1986); b) the
production of root biomass compared to shoot biomass is typically more sensitive to Al

15
(Buss et al., 1975; Zhang and Taylor 1988); c) in Al-stressed plants there is no correlation
between an accumulation of Al in the shoots and the supply of Al (Foy et al., 1972); and
d) the Al tolerance of a cultivar has been shown to be determined by the rootstock in
grafting experiments (Klimashe, 1970).
The visual appearance of mature roots is not the exclusive determination of Al
toxicity or tolerance. At the cellular level, Al influences leaf tissue metabolism (Ohki,
1986; Hoddinott and Richler, 1987; Sarkunan et al., 1984). Taylor et al. (1989)
suggested potential mechanisms of Al disruption on cell functions to be: a) disruption of
membrane structure and functions; b) inhibition of DNA synthesis and mitosis; c)
inhibition of cell elongation; d) disruption of mineral nutrition; and e) disruption of
phosphate and Ca metabolism. Taylor also suggested several possible immediate toxic
effects of Al. The membrane structure and/or function at the soil root interface maybe
altered. Membrane-bound enzymes will be affected. Aluminum may also reduce cell
elongation by affecting cell wall components or assembly. Phosphate in the DNA
appears to bind with Al in the cytosol. As a result, DNA synthesis will be inhibited
because of repressed template activity. Finally, toxic effects of enzyme-mediated
reactions in phosphate metabolism seem probable.
Aluminum occupies approximately 7% of the of earth’s crust. Based on the
toxicity issues described previously, it is fortunate the availability of Al is reduced by
ligands or the Al occurs in other nonphytotoxic forms (i.e., aluminosilicates and
precipitates) (Delhaize and Ryan, 1995). However, the solubilization of Al is enhanced
by low pH. Trivalent Al (Al3+) dominates in acidic conditions (pH<5), compared to
Al(OH)2+ and Al(OH)2+ that form as pH increases. Near neutral pH, the solid phase

16
gibbsite occurs (Al(OH)3) while in alkaline conditions, aluminate (Al(OH)4-) forms.
Many of the monomeric Al cations have the ability to bind with organic and inorganic
ligands, including: PO43-, SO4
2-, F-, organic acids, proteins, and lipids (Delhaize and
Ryan, 1995).
Since Al3+ is predominately restricted to acidic conditions and many trivalent
cations are toxic to plants, it is typically assumed to be the major phytotoxic species.
However, based on the complex nature of Al, this has been difficult to prove conclusively
(Delhaize, 1995). In addition, most of the monomeric Al species previously listed have
been considered toxic in one or more studies (Kinraide, 1991). To combat toxicity,
numerous strategies have been utilized. The method preferred in North America and
Europe has been the application of calcium carbonate (lime) to raise soil pH. As the pH
rises, the Al is converted to less toxic forms (Samac, 2003).
Aluminum toxicity and heavy metal contamination concerns have been raised
regarding the land application of Al-WTRs. Dayton and Basta (2001) tested 17 WTRs
(14 were alum based) for heavy metals and nutrients according to the U.S. Environmental
Protection Agency’s (EPA) toxicity characteristic leaching procedure (TCLP), a test
designed to determine the mobility of organic and inorganic analytes in liquids, solids,
and multiphasic wastes (U.S. EPA, 1988). The results of the test found that all of the
WTRs contained significantly lower than regulatory levels of the EPA’s TCLP and the
residuals were therefore, classified as nonhazardous wastes. Total N ranged 1.3 to 18.4 g
kg-1 with an average value of 7 g kg-1. Typical soil levels of soil total N range from 0.2 to
5.0 g kg-1 (Dayton and Basta, 2001). The sources of higher N levels in the WTRs are the
algae, detritus, etc. removed from raw water. Mineralization of organic N in the WTRs

17
may pose potential problems related to NO2- concentration in WTRs containing higher
than 10 g kg-1 total N. Most significantly, Dayton and Basta (2001) found soluble Al
levels at a median concentration of 0.054 mg L-1, with a range from 0.02 to 0.92 mg L-1.
Therefore, problems stemming from both Al toxicity and heavy metals are not expected
with WTR use. Elliot and Depsey (1991) found that unless the raw water source is
contaminated, the nutrient content of WTRs is generally low. As a result, the WTRs pose
only a minor threat to the environment.
Rainfall Simulation
Rainfall simulation studies over the past 40 yr have become popular because
irregular distribution of rainfall hampers the possibility of reasonable time periods for
study (Neff, 1979). Simulators were first used for erosion studies. The two primary
issues were raindrop size distribution and energy (Esteves, 2000). Through a variety of
research, two types of rainfall simulators have emerged: (i) drip formers (Farmer, 1973;
Romkens et al., 1975; Munn and Huntington, 1976) and (ii) nozzles (Meyer and McCune,
1958; Swanson, 1965; Miller, 1987; Riley and Hancock, 1997). Pressurized nozzle
systems have become the preferred method for large area field studies (10 to 500 m2)
(Esteves et al., 2000). Simplicity and speed are the basic requirements for the
movement and assembly of a rainfall simulator from one research location to another. As
a result, compromises have been made between technical constraints and the reproduction
of natural rainfall characteristics (Esteves et al., 2000).
A critical factor for experiments using rainfall simulators is the estimation of
rainfall at the ground level (Yu et al., 2003). As rain gauge’s catchment area is elevated
above the ground’s surface, the pressure of simulated rain from the nozzle decreases as
greater distances are reached. The elevated catchment area has the possibility to

18
overestimate rainfall volume. Overestimation without adjustment could range from six to
29 percent depending on catchment height (Yu et al., 2003). Additional variability can
occur due to water pressure differences, nozzle aging, and imperfect nozzle spray
overlap. Wind can also cause non-uniform spatial variation. Measures to avoid
variability include better pressure control, stainless steel nozzles, and the use of a
windbreak (Yu et al., 2003; Esteves et al., 2000).
An additional challenge for research is the comparability of experimental results
from different researchers. The potential for human error is enhanced by differing
sampling techniques, recording methods, measurements, and setup. To avoid differences
in results, the National Phosphate Research Project (NPRP, 2001) adapted a specific
design for rainfall simulators. The establishment of a single design for a simulator
expedites data collection, promotes comparable results, and attempts to maintain field
relevancy (Sharpley and Kleinman, 2003). The designs of Shelton et al. (1985) and
Miller (1987) are the basis of the portable rainfall simulator used by the NPRP (Humphry
et al., 2002).
Numerous studies across the nation have used the NPRP protocol for rainfall
simulations both for field and box studies to evaluate P loss under differing soils and
amendment treatments. Kleinman et al. (2003), Moore et al. (2000), and Withers et al.
(2001) have used rainfall simulators to demonstrate P loss in runoff. As our knowledge
base has increased with these studies so has the need with the design of the rainfall boxes.
Miyittah-Kporgbe (2004) has used NPRP’s runoff box design and added a false bottom to
collect leachate and examine WTR’s effect on both runoff and leachate. Further studies

19
are needed to investigate the impact on soluble P with the mixing of WTRs at differing
depths and the impacts on plant growth and chemical composition.

20
CHAPTER 3 MATERIALS AND METHODS
Project Description
Site Description and Soil Collection
Soil for this study was obtained from a tile-drained sprayfield at Larson Dairy Barn
5 near Okeechobee, Florida (N 27°16.088’, W 80°46.460’). The field had received
applications of dairy manure for several years. In addition, effluent from the farm’s
lagoon was applied to the field periodically as needed to maintain lagoon capacity. The
soil was an Immokalee fine sand (sandy, siliceous, hyperthermic Arenic Alaquods)
brought into agricultural production as a pasture. The site was planted with stargrass
(Cynodon nlemfuensis) for silage production in 1990. A series of surface soil samples
was taken over the entire field to select a sample site with relatively high P levels. These
samples were analyzed for water-soluble P using a HACH Orthophosphate Test Kit and
areas of high P levels were identified. Based on these results, an area within the field was
selected and a more intensive grid sampling was conducted to identify the final sampling
site. These samples were then analyzed for water soluble P (WSP) using a 1:10 soil to
solution ratio and Mehlich-1 extractant (Mehlich, 1953) to determine P concentration.
Bulk soil samples were obtained from 0–10 cm and 10–20 cm depths at the
selected site in a 6.5 x 1.5 m area after removal of above-ground vegetation. The soil was
transported to Gainesville, FL, air dried, and sieved (0.64 cm mesh) to remove debris and
to homogenize the soil. Five samples from the bulk dried and sieved soil were randomly

21
collected per depth (10 in total) and analyzed for WSP and Mehlich-1 P to evaluate
uniformity of the soils prior to packing the rainfall simulator boxes.
Aluminum Water Treatment Residual Collection
The aluminum water treatment residual (Al-WTR) for the study was obtained from
the Manatee County water treatment plant in Bradenton, FL. Slurry ponds were used to
hold the Al-WTR until it was dry enough to be moved with a front-end loader. The solid
material was then moved to spoil piles to continue to dry before it was disposed of at a
landfill. The Al-WTR samples used for this study were collected from the spoil piles.
Size distribution of the Al-WTR particles varied widely. Material ranged from clay sized
particles to 10 cm fragments. The Al-WTR was air dried for 2 wk under an open-sided
greenhouse, because of its high moisture content, before sieving to pass a 0.64 cm mesh.
Even after the material was dried and sieved, the moisture content was 29% because of
the high organic content of the Al-WTR. Five samples were randomly collected from the
bulk Al-WTR and analyzed for WSP, Mehlich-1 P, and TP.
Construction of Runoff Boxes
Runoff boxes (100 cm long by 30 cm wide and 20 cm deep) were constructed using
pine lumber (Fig. 3-1). A 4 cm rail was added to raise the bottom of the runoff box. A 2
cm lip surrounded the box on three sides to prevent loss of water through runoff and/or
splashing. One end of the box was 2 cm lower to allow runoff to be collected. The box
corners and sampling ports were sealed using latex caulk, and the entire box was covered
with a gel coat to make the box watertight. Ports used to collect subsurface flow and
leachate were covered with a double layer of garden weed screen to prevent blockage of
the ports with debris. Thirty-nine kg of the sieved 10–20 cm depth and then 39 kg of 0–
10 cm depth were added to replicate field soil depths.

22
A slit PVC pipe (5.6 cm ID by 40.6 cm length) with end caps was attached to one
end of the box to collect runoff. Gravity allowed the runoff water to be collected through
a port in the center of the pipe. Six drainage ports with attached Tygon tubing were
installed on the bottom of the boxes to monitor the watertable and to collect leachate (Fig.
3-1). The ports were located in pairs: 77.0, 38.5, and 5.6 cm from the runoff collection
end and 5.6 cm from the side walls. In addition, two ports with attached Tygon tubing
were placed at the end of the box between the two soil layers to collect subsurface flow.
Figure 3-1. Runoff box design.
1
1. Runoff collection point. 2. Subsurface drainage points. 3. Leachate drainage points.
2
3

23
Soil was placed in the boxes either as discrete 0–10 cm (39.5 kg) and 10–20 cm
(39.5 kg) depths or as a mixed layer at approximately 1.3 g cm-3 to mimic field conditions
as noted in the experimental design section below. Al-WTR from Manatee County was
applied to the appropriate treatments at a rate of 2.5% of dry soil weight (0.975 kg of Al-
WTR dry weight per 10 cm of soil treated). The Al-WTR and soil were mixed using a
cement mixer to evenly distribute the Al-WTR and/or soil in the appropriate boxes. After
establishing the appropriate treatments, stargrass cuttings obtained from an area adjacent
to the sampling site in the sprayfield were sprigged at 30 per box to simulate field density
of grass. Simulation boxes were kept in an open-sided greenhouse during the study to
protect them from rainfall.
Rainfall Simulation
Rainfall simulation was conducted according to a protocol developed by the
National Phosphorus Research Project (NPRP) to quantify soil P-runoff relationships
(NPRP, 2001). Rainfall intensity was uniformly applied at 7.1 cm h-1 (approximately 210
cm sec-1) from a height of 3 m above the soil surface. This is equivalent to a 10 yr, 24 hr
rain. Gainesville municipal water was adjusted from a pH of approximately 8.5 to 5
using 3 M HCl to mimic rainfall pH in South Florida. Rainfall was dispersed uniformly
using a TeeJetTM HH-SS50WSQ nozzle centered under a 3 x 3 x 3 meter frame protected
from wind (Fig. 3-2). Thirty cups were distributed in a grid to test rainfall distribution
uniformity. There were no significant differences in volume within the grid. Rainfall
simulations were repeated every 3 wk, for a total of 6 rainfall simulation events.
Analysis of the source water and rainfall (pH adjusted source water) was conducted
by inductively coupled plasma atomic emission spectroscopy; total Fe and Al were
approximately 0.15 and 0.45 mg L-1 respectively. Source water and rainfall also

24
contained Ca (14 mg L-1) and Mg (8 mg L-1). These Ca and Mg levels were expected
based on the municipality’s well field pumping water from the Floridan aquifer which
passes through both limestone and the Hawthorne formation. In addition, the
municipality treats the water with lime. Soluble P, TP, NO3-, and NH4
+ were below
detectable limits (0.03, 0.03, and 0.02, and 0.06 mg L-1, respectively).
Figure 3-2. Schematic diagram of rainfall simulator (NPRP, 2001).
Rainfall boxes were placed five at a time, under the simulator at a 1 to 2% slope
(See Figure 3-3). Thirty minutes of runoff (collection point out side of simulator) was
collected from the boxes via Tygon tubing connected to the runoff port. Runoff did not
start at the same time for each box; therefore each box was covered after 30 min of runoff
had been collected. The boxes were left in place under the simulator for approximately
half an hour while subsurface flow and leachate were collected. This was done by

25
draining the two side and two front leachate ports, respectively. All collected samples
were weighed and then sub-sampled. A 1 L sub-sample was taken from runoff, and 250
mL sub-samples were taken from subsurface flow and leachate. Two filtered (0.45 µm)
sub-samples (20 mL) were taken from each sub-sample, using a vacuum pump to obtain
approximately 40 mL aliquot for analysis. The sub-samples were refrigerated until P
analysis was performed, usually the following day. One 20 mL filtered sample was
acidified and refrigerated until NO3- and NH4
+ could be measured.
Figure 3-3. Box placement under simulator.
During the 3 wk intervals between the first six simulations, the soil was watered
with pH-adjusted water to saturation and the watertable was allowed to drop to the
bottom of the boxes before watering again. A seventh simulation was run to evaluate the
effect of maintaining the soil in a saturated condition during a 4 wk period after the sixth
simulation was run. After the sixth simulation, vegetation was cut to the soil surface and
the watertable was raised to cover the surface. Water was added as needed over 4 wk to
maintain soil saturation. A plastic cover was added to reduce evaporation from the
boxes. The watertable was allowed to subside approximately 5 cm during the 2 d prior to

26
the 7th simulation to facilitate moving the boxes to the simulator. The variation to the
study was made as a result of recent research at the MacArthur Agro-ecology Research
Center indicating that longer saturation times may elevate SP losses (Res. Comm., P.J.
Bohlen, MacArthur Agro-ecology Research Center).
Experimental Design
Five treatments, with four replications each were used (Fig. 3-4). Soil was placed
in the simulation boxes either as discrete layers (treatments C1, T1, and T2) or with the
two depths mixed (treatments C2 and T3). The Al-WTR was applied on the soil surface
(T1), mixed with the 0-10 cm soil depth (T2), or mixed with the combined soil depths to
a depth of 20 cm (T3).
Figure 3-4. Treatment descriptions
No Al-WTR applied. C2**
Al-WTR incorporated into 0-20 cm soil depth. T3**
Al-WTR incorporated into 0-10 cm soil depth. T2*
Al-WTR surface applied. T1*
No Al-WTR applied. C1*
*0-10 and 10-20 cm soil depths placed in box in sequence. **0-10 and 10-20 cm soil depths mixed prior to placement in box. 10-20 cm
0-10 cm
Al-WTR 0-20 cm

27
Soil Sampling and Forage Harvest
A soil core from each packed box from both depths (0–10 and 10–20 cm) was
taken prior to the start of rainfall simulations (refilled based on soil depth) and after the
sixth (5 boxes) or seventh rainfall simulations (16 boxes). Before each rainfall simulation,
the forage was harvested to a height of approximately 15 cm. The cuttings were dried,
weighed, ground to 1 mm, and stored. Upon completion of the sixth simulation, the roots
were harvested, dried, weighed, and ground from replicate 4. After the seventh
simulation, all other roots were harvested, dried, weighed, and ground. All vegetation
(initial sprigs, grass cuttings, and roots) were analyzed for total P, N, and Al.
Analytical Methods
Soil
The soil samples were dried and analyzed for WEP, TP, Mehlich-1 P, and pH.
Water extractable P in the soil was determined on air dried soil. Three grams of soil were
weighed into 50 mL centrifuge tubes and 30 mL of DDI water was added to obtain a soil
to water ratio of 1:10. The suspension was then continuously shaken on a mechanical
shaker for 1 hr and vacuum filtered (0.45 µm). Analysis was identical to the water
samples.
Soil TP was determined by the ignition method (Anderson, 1976). One gram of
soil was weighed into a 50 mL beaker and ashed in a muffle furnace. The furnace
temperature was raised to 250ºC and maintained for 30 min before ramping to 550ºC for
4 hr. After ashing, the samples were brought to room temperature in a desiccator and
weighed. The cooled ash was moistened with distilled dionized water (DDI) before
adding and evaporating 20 mL of 6.0 M HCl slowly on a hotplate at approximately
120ºC. Once digested, the ash was resolublized with 2.25 mL of 6.0 M HCl and

28
quantitatively transferred and filtered into 50 mL volumetric flasks using Whatman #41
paper. The beaker and the filter paper were each rinsed three times before bringing the
flask to volume (Anderson, 1976). Twenty milliliter sub-samples were taken and stored
in scintillation vials at room temperature. The Murphy-Riley method was used to
determine TP in solution using a Technicon TM Autoanalyzer, EPA Method 365.1 (EPA,
1993a).
Mehlich-1 extractable P, Fe, Al, Ca, and Mg were determined on air dried soil
samples from both depths (0–10 cm and 10–20 cm) of each box prior to simulations and
after simulation 7. Four grams of soil were weighed into 50 mL centrifuge tubes and 16
mL of Mehlich-1 solution (0.025 M HCl and 0.0125 M H2SO4) was added and shaken
continuously on a mechanical shaker for 5 min (Mehlich, 1953). The samples were then
vacuum filtered through a 0.45 µm filter and analyzed on a TechniconTM Autoanalyzer.
The pH of the soil was measured on the supernatant of a 1:2 soil to solution ratio (DDI).
The samples were stirred and allowed to equilibrate for 30 min before determining the pH
using an Orion pH electrode.
Aluminum Water Treatment Residuals
Total P (TP) in the Al-WTR was determined via the ignition (ashing) method
(Anderson, 1976) and analyzed for P following the Murphy and Riley (1962) method.
The Al-WTR samples were digested following the EPA method 3050A and analyzed for
Al, Fe, Ca, and Mg by inductively coupled plasma atomic emission spectroscopy (ICP)
(USEPA, 1993b). Standard methods were used to determine pH (1:2 soil to solution) and
percent solids (Page, 1982).
The pH of the Al-WTR samples was measured on the supernatant 1:2 soil to
solution ratio (DDI). The samples were stirred and allowed to equilibrate for 30 min

29
before the pH was taken by the Orion pH electrode. Percent solids were determined for
the Al-WTR by taking the oven dried weight over the air dried weight. This is a critical
factor in determining the air dried application rate of the Al-WTR. In addition, percent
solids were determined for all water samples during the TP procedure by taking the
evaporated beaker weight over the known volume, assuming 1 mL equals 1 g.
Forage
All forage samples were digested using a modification of the standard Kjeldahl
procedure at the Forage Evaluation Support Laboratory (FESL) at the University of
Florida. Ground samples (0.25 g) were weighed into 75 mL digestion tubes and 1.5 g of
the 9:1 catalyst (K2SO4:CuSO4) was added. Using 4.5 mL of H2SO4 and 2 mL of H2O2,
the forage was digested for at least 4 hr at 375° C (Gallaher et al., 1975). Upon
completion of the digestion, the samples were brought to volume and filtered using Fisher
screening column paper. A 20 mL sub-sample taken and was stored at room temperature
until it could be analyzed for total N (TN) by semiautomated colorimetry (Hambleton,
1977).
Runoff, Subsurface Flow, Leachate
All water samples (runoff, subsurface flow, and leachate) were vacuum filtered
through a 0.45 µm filter within 5 hr of collection and stored in 20 mL scintillation vials at
4° C. Soluble P (SP) was analyzed using the filtered runoff samples. Total P (TP) by
digestion (see ‘Soils’) and pH analysis were performed on the unfiltered sample. In
addition, the runoff, subsurface flow, and leachate were analyzed for total Al using
unfiltered samples. The data were used to determine particulate P (PP) in the runoff by
subtracting soluble P (SP) from TP (TP-SP=PP). Water soluble P was determined by

30
EPA Method 365.1 using a Technicon TM Autoanalyzer, (USEPA, 1993a). Analyses was
performed within 48 hr of sample collection.
Water total P (TP) was determined based on a variation of the ignition (ashing)
method (Anderson, 1976). Approximately 20 to 30 mL of water was poured into a 50
mL beaker and evaporated at 100ºC. The samples were then placed in a muffle furnace
and digested and sub-sampled identical to the soil samples. The Murphy-Riley method
was used to determine TP in sub-sample solution using a Technicon TM Autoanalyzer
(EPA Method 365.1, 1993a).
Total Al concentration of the water samples was determined by a nitric acid
digestion procedure (Clesceri et al., 1989). One hundred milliliters of runoff or 50 mL of
subsurface and leachate were measured into a 125 mL erlenmeyer flask with two or three
glass beads. Ten milliliters of 12 M HNO3 acid were added to the flask. The solution
was evaporated on a hot plate until approximately 10 to 20 mL remained. The flask was
then brought up to approximately 75 mL of solution using DDI water and 10 mL of 12 M
HNO3 acid was added again and allowed to evaporate to 10 to 20 mL of solution. The
solution was then filtered using Whatman #42 paper. Samples were then stored at room
temperature until analyzed for Al by atomic absorption spectroscopy.
All water samples were stored at 4ºC until the pH could be measured using an
Orion pH electrode (Orion Research Inc. Boston, MA), usually within a week of
collection. The duplicate filtered water samples in 20 mL scintillation vials were acidified
using H2SO4 and stored at 4° C until analysis for ammonium and nitrate. Ammonium
was analyzed on a TechniconTM Autoanalyzer following EPA method 350.1 (USEPA,

31
1993c). Nitrate was analyzed on an Alpkem Corp. Rapid Flow Analyzer following
method A303-S170 (Alpkem, 1990).
Quality Assurance and Quality Control
Quality assurance and quality control (QA/QC) were met though 10% repeats,
spikes, and blanks for each procedure. Certified external standards were used for quality
control, in addition to, standard calibration curves. A 10% relative standard deviation
was required for all repeats. Less than 5% of the total samples required re-runs because
few were out-of-range values. All spike values and quality control checks fell within 90-
110% acceptance levels.
Statistical Analysis
Statistical analysis was performed using SAS version 8.2 1999–2001 (SAS Institute
Inc., Cary, North Carolina, USA). A repeated measures model was explored to estimate
and examine time (simulation) effects as well as expected correlations between
treatments and their respective control for a given simulation. Normality was checked,
and log-transformation was performed on the data (variables) to achieve normal
distribution. The General Linear Model procedure was used in order to analyze the
changes (variables) over time (simulation), between treatments, and between type. The
means values for (variables) were compared by treatment/type/simulation using the
Waller-Duncan procedure. A paired-t test was conducted in order to compare the “pre”
and “post” values for the response variables measured.
32
CHAPTER 4 RESULTS AND DISCUSSION
Initial Soil P Concentrations and pH
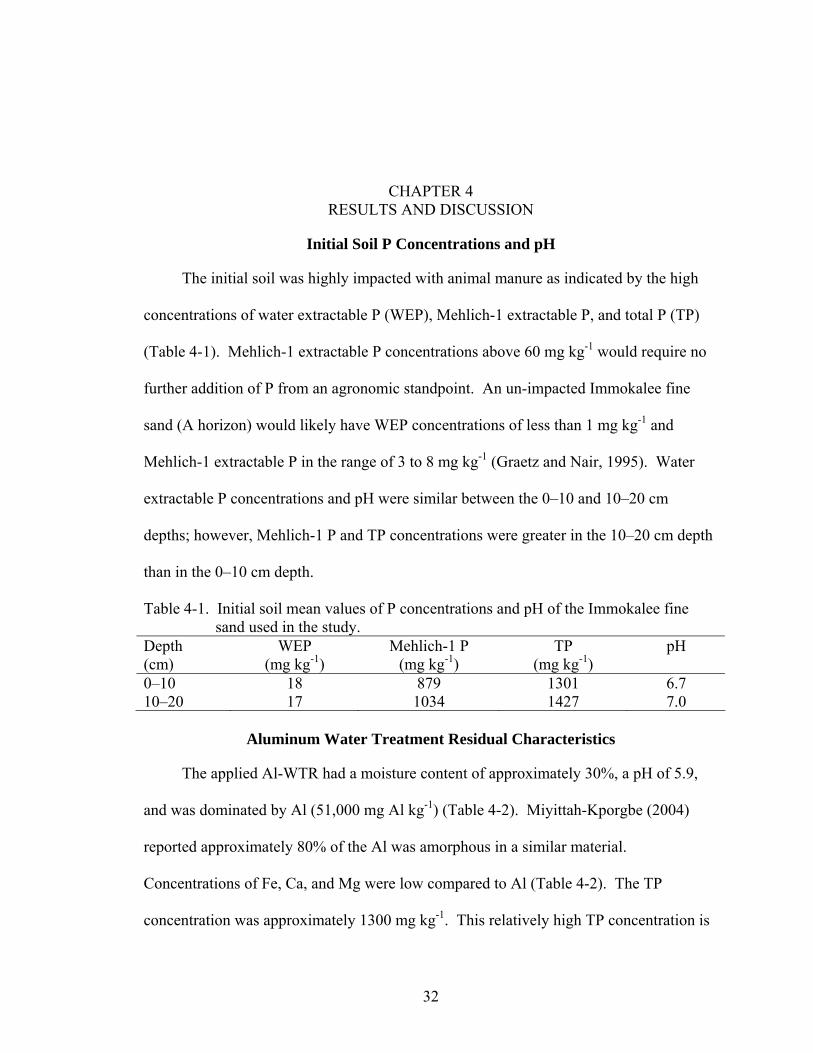
The initial soil was highly impacted with animal manure as indicated by the high
concentrations of water extractable P (WEP), Mehlich-1 extractable P, and total P (TP)
(Table 4-1). Mehlich-1 extractable P concentrations above 60 mg kg-1 would require no
further addition of P from an agronomic standpoint. An un-impacted Immokalee fine
sand (A horizon) would likely have WEP concentrations of less than 1 mg kg-1 and
Mehlich-1 extractable P in the range of 3 to 8 mg kg-1 (Graetz and Nair, 1995). Water
extractable P concentrations and pH were similar between the 0–10 and 10–20 cm
depths; however, Mehlich-1 P and TP concentrations were greater in the 10–20 cm depth
than in the 0–10 cm depth.
Table 4-1. Initial soil mean values of P concentrations and pH of the Immokalee fine sand used in the study.
Depth (cm)
WEP (mg kg-1)
Mehlich-1 P (mg kg-1)
TP (mg kg-1)
pH
0–10 18 879 1301 6.7 10–20 17 1034 1427 7.0
Aluminum Water Treatment Residual Characteristics
The applied Al-WTR had a moisture content of approximately 30%, a pH of 5.9,
and was dominated by Al (51,000 mg Al kg-1) (Table 4-2). Miyittah-Kporgbe (2004)
reported approximately 80% of the Al was amorphous in a similar material.
Concentrations of Fe, Ca, and Mg were low compared to Al (Table 4-2). The TP
concentration was approximately 1300 mg kg-1. This relatively high TP concentration is

33
not expected to affect the P dynamics in the soil because of its low availability. Makris
(2004) reported desorption of P by Al-WTR was less than 1%. A Hillsborough Al-WTR
as reported by O’Connor et al. (2002) had a low degree of P saturation (DPS: ≈0.032),
which suggests active Fe and Al for P retention.
Table 4-2. Selected characteristics of the Manatee County Al-WTR. % Solids pH Fe
mg kg-1 Al
mg kg-1 Ca
mg kg-1 Mg
mg kg-1 TP
mg kg-1 WEP
mg kg-1 71 5.9 1,790 51,000 580 120 1,300 BDL†
† Below detectable limit: 0.02 mg L-1.
Runoff, Subsurface Flow, and Leachate Characteristics
Volume
Runoff, subsurface flow, and leachate volumes were measured for each simulation
event to provide the basis for loading calculations (Table 4-3). Runoff volumes averaged
13.9 L per event with no differences in runoff volumes between treatments. Subsurface
flow volumes were considerably smaller than runoff volumes (1.2 L average) and were
uniform as well, except for treatment C2 which was greater than the other treatments.
The higher volume in C2 was attributed to slight differences in box construction1 and soil
packing, which resulted in slightly more standing water remaining in the C2 treatment
boxes after runoff ceased. Leachate from the bottom ports was collected only for
simulations 5 through 7. Leachate volume was smaller than subsurface flow volume but
was uniform between treatments. The uniformity of the runoff, subsurface flow, and
leachate indicate the Al-WTR does not significantly influence the soil’s water holding
capacity at the rate applied.
1 Treatment C2 was added to the study after boxes were already constructed for all other treatments. The boxes for treatment C2 were slightly taller than the other boxes, resulting in an increase of water held on the soil surface after runoff ceased. This was reflected in increased subsurface flow.

34
Table 4-3. Average runoff, subsurface flow, and leachate volumes as influenced by treatment from six simulations of runoff, five simulations of subsurface flow, and two simulations of leachate.
Treatments† C1 T1 T2 T3 C2 Average
Collection Point ----------------------------------L------------------------------------ Runoff 13.97a‡ 13.95a 13.76a 13.88a 13.79a 13.87 Subsurface Flow 1.18b 1.13b 1.12b 1.02b 1.54a 1.20 Leachate 0.40b 0.54b 0.39b 0.63a 0.63a 0.52 †C1, no Al-WTR, not mixed; T1, surface applied Al-WTR, not mixed; T2, Al-WTR mixed in 0–10 cm; T3, Al-WTR mixed in 0–20 cm; C2, no Al-WTR, mixed 0–20 cm. ‡ Means within a row and followed by the same letter are not significantly different by Waller-Duncan (p<0.05). pH
Runoff pH decreased from 6.76 for the first simulation to 6.02 in the sixth
simulation (Fig. 4-1A). In contrast, subsurface flow pH increased from 7.05 to 7.66
during the same period. Leachate pH, measured for the final two simulations, was slightly
greater, but similar to, subsurface flow pH. Averaged over the six simulations, there
were no differences in pH among treatments for any of the measured components
(p<0.05; Fig. 4-1B). Results showed pH was significantly different between collection
points during each simulation and averaged over all simulations.
Phosphorus
Soluble P concentrations in surface runoff were smaller than corresponding
concentrations in subsurface flow and leachate for all treatments (Table 4-4). Soluble P
concentrations in the subsurface flow and leachate were at least 10-fold greater than in
the runoff. This can be attributed to greater volumes of rainfall appearing as runoff
(diluting the SP) than appearing as subsurface flow and leachate and less interaction with
the P-impacted soil. Runoff SP concentration was reduced by 77% by the addition of Al-
WTR to the soil surface (T1). An approximately 45% reduction in runoff SP

35
concentration was observed when the Al-WTR was mixed with the 0–10 cm soil depth
(T2) and 0–20 cm soil depth (T3).
5
5.5
6
6.5
7
7.5
8
8.5
1 2 3 4 5 6
Simulation
pH
RunoffSubsurfaceLeachate
44.5
55.5
66.5
77.5
88.5
C1 T1 T2 T3 C2
Treatment
pH
RunoffSubsurface FlowLeachate
Figure 4-1. Runoff, subsurface flow, and leachate pH values from six, five, and two simulations, respectively. (A) Average treatment pH per. (B) Simulation averages for each treatment. C1, no Al-WTR, not mixed; T1, surface applied Al-WTR, not mixed; T2, Al-WTR mixed in 0–10 cm; T3, Al-WTR mixed in 0–20 cm; C2, no Al-WTR, mixed 0–20 cm. Error bars represent the standard deviation of 4 replicates. Mean pH value within a treatment followed by the same letter are not significantly different using the Waller-Duncan method (p<0.05).
a a a a a
(A)
(B)
b b b b b
c c c c c

36
Surface application of Al-WTR (T1) did not reduce SP concentrations in
subsurface drainage or leachate (Table 4-4). Phosphorus concentrations for subsurface
flow were reduced 37% by mixing the Al-WTR in the top 10 cm of soil (T2) and 90% by
mixing the Al-WTR with the whole soil depth (T3). This difference between T2 and T3
was unexpected because the subsurface flow was collected at a depth of 10 cm and it was
anticipated that SP concentrations in the subsurface flow would be influenced primarily
by SP concentration reductions in the 0-10 cm depth. However, it appears that the SP
concentration of the subsurface flow was influenced by both the 0-10 and 10-20 cm soil
depths. This may be explained by the fact that the watertable was moving upward
through the 10-20 cm depth during part of the simulation event allowing water from the
0-10 cm depth containing Al-WTR to mix with water from the untreated 10-20 cm depth.
The SP concentration in subsurface flow and leachate in T1 increased slightly (11%) for
some unexplained reason. Treatments C1, T1, and T2 had similar leachate SP
concentrations, whereas C2 and T3 SP concentrations were significantly different. Al-
WTR treatment of the complete profile (T3) had the greatest effect on subsurface
drainage and leachate SP concentrations with reductions of 90 and 95%, respectively.
Table 4-4. Average soluble P concentrations by treatment in runoff (six events), subsurface flow (five events), and leachate (two events).
Treatments† C1 T1 T2 T3 C2 Collection Point ------------------------------mg P L-1----------------------------- Runoff 0.34a 0.08d 0.18c 0.16c 0.29b Subsurface Flow 4.13b 4.57a 2.60c 0.41d 4.16b Leachate 4.52b 4.63b 4.02b 0.36c 6.85a † C1, no Al-WTR, not mixed; T1, surface applied Al-WTR, not mixed; T2, Al-WTR mixed in 0–10 cm; T3, Al-WTR mixed in 0–20 cm; C2, no Al-WTR, mixed 0–20 cm. ‡Means within a row and followed by the same letter are not significantly different by Waller-Duncan (p<0.05).

37
Soluble P concentrations in runoff, subsurface flow, and leachate for each
simulation event are shown in Fig. 4-2 A, B, and C, respectively. Concentrations were
greatest and most variable in the first two simulations in runoff, subsurface flow, and
leachate. These greater concentrations may be attributed to the presence of highly-labile
soil P that interacted with the rainfall during the first two simulation events. In addition,
disturbance of the soil during sampling and repacking of the simulator boxes likely
accounted for the variability observed during the first two simulations. After the first two
simulation events, concentrations of all treatments remained relatively stable for surface
runoff, subsurface flow. This consistency reinforces results from treatment averages
described previously.
Runoff SP concentrations (Figure 4-2A) were the greatest in the first two
simulations when compared to the following four simulations. In simulations 3 through
6, runoff SP concentrations in all treatments were stable and did not significantly differ
between treatments. After simulation 2, the control SP concentrations were not
significantly different and stabilized at approximately 0.3 mg L-1. When Al-WTR was
mixed with soil (T2 and T3), runoff SP concentration stabilized after two simulations at
approximately 0.15 mg L-1. When Al-WTR was surface-applied (T1), SP concentration
was less than 0.1 mg L-1 and was significantly lower than all other treatments for all
simulations.

38
0.0
0.1
0.2
0.3
0.4
0.5
0.6
1 2 3 4 5 6
SimulationS
P, m
g L-1
C1 T1 T2 T3 C2
0
12
3
4
56
7
2 3 4 5 6
Simulation
SP, m
g L-1
C1 T1 T2 T3 C2
0
2
4
6
8
10
12
5 6
Simulation
SP,
mg
L-1
C1 T1 T2 T3 C2
Figure 4-2. Average treatment SP concentrations and standard deviations from the three collection points. (A) Runoff: six simulations. (B) Subsurface flow: five simulations. (C) Leachate: two simulations. C1, no Al-WTR, not mixed; T1, surface applied Al-WTR, not mixed; T2, Al-WTR mixed in 0–10 cm; T3, Al-WTR mixed in 0–20 cm; C2, no Al-WTR, mixed 0–20 cm.
Similar stabilization occurred with SP concentrations in subsurface flow after
simulation 2 (Figure 4-2B) for all treatments. Soluble P concentrations stabilized at
approximately 4 mg L-1 after simulation 2 for the surface-applied Al-WTR (T1) and for
the controls (C1 and C2). When the Al-WTR was incorporated in to the soil (T2 and T3),
(B)
(C)
(A)

39
SP concentrations stabilized at 2.5 and 0.4 mg L-1, respectively. The decision to collect
leachate after simulation 4 limits interpretation of the leachate data. However, with the
exception of C2, the leachate SP concentrations were relatively consistent between
simulations 5 and 6. Soluble P concentrations for C2 were expected to be similar to C1,
but instead were higher. The reason for this is not obvious, but this difference might be
attributed to the higher water extractable P (WEP) and Mehlich-1 concentrations found in
C2 (Tables 4-11 and 4-12).
After simulation six, the soil was maintained in a flooded condition for 4 wk prior
to simulation seven. Contrary to expectations, flooding the soil reduced runoff SP
concentration by approximately 65% (Table 4-5) compared to the first six simulations
(Table 4-4). This effect was believed to be a result of longer interaction time with
soil/Al-WTR sorption sites. Starting the rainfall event with the soil flooded likely
minimized the rainfall interaction with the soil solution which resulted in lower P
concentrations in the runoff. Flooding of the soil also slightly reduced subsurface SP
concentrations compared to the previous six simulations. No impact of flooding on SP
concentrations was observed for the leachate.
Table 4-5. Average soluble P concentrations in runoff, subsurface flow, and leachate after 4 wk of flooded conditions (Simulation 7).
Treatments† C1 T1 T2 T3 C2 Collection Point ------------------------------mg P L-1----------------------------- Runoff 0.13a‡ 0.04b 0.04b 0.03b 0.15a Subsurface 3.53a 3.43a 1.61b 0.20c 2.69a Leachate 3.96b 4.20b 3.49bc 0.23c 7.95a † C1, no Al-WTR, not mixed; T1, surface applied Al-WTR, not mixed; T2, Al-WTR mixed in 0–10 cm; T3, Al-WTR mixed in 0–20 cm; C2, no Al-WTR, mixed 0–20 cm. ‡Means within a row and followed by the same letter are not significantly different by Waller-Duncan (p<0.05).

40
Runoff, subsurface flow, and leachate volumes for simulation 7 followed the same
trend of consistency between treatments as was observed for the first 6 simulations
(Table 4-6A). Flooding the soil lowered the average runoff pH from 6.8 (simulations 1-
6) to 6.3 (simulation 7) (Table 4-6B). Average subsurface flow and leachate pH values
decreased from approximately 7.6 to 7.3.
Table 4-6. Runoff, subsurface flow, and leachate collected during simulation 7. (A) Volume. (B) pH.
(A) Treatments† C1 T1 T2 T3 C2
Collection Point -----------------------------------L----------------------------------- Runoff 15.81b‡ 16.78b 15.23c 15.83b 16.63b Subsurface 0.77a 0.86a 1.07b 1.11ab 1.22b Leachate 0.42a 0.73a 0.36a 0.63a 0.57a
(B) Treatments† C1 T1 T2 T3 C2
Collection Point ---------------------------------pH---------------------------------- Runoff 6.34a‡ 6.10a 6.44a 6.30a 6.38a Subsurface 7.37b 7.42b 7.39b 7.31b 7.19b Leachate 7.44c 7.44c 7.59c 7.35c 7.34c † C1, no Al-WTR, not mixed; T1, surface applied Al-WTR, not mixed; T2, Al-WTR mixed in 0–10 cm; T3, Al-WTR mixed in 0–20 cm; C2, no Al-WTR, mixed 0–20 cm. ‡Means within a row and followed by the same letter are not significantly different by Waller-Duncan (p<0.05).
Soluble P loss per box from each treatment per rainfall event was calculated by
multiplying volume by concentration (Table 4-7). The same trend was observed as with
SP concentrations, which was expected based on volume similarities among treatments
(Table 4-6A). These results emphasize the importance of treating P-impacted soils to
reduce risk of P loss. Mixing 2.5% Al-WTR with the P-impacted soil can reduce field
loss of SP by approximately 80% compared to 30% by surface applied Al-WTR. Surface
application and partial mixing of the impacted zone (T1 and T2, respectively) had less
impact compared to total mixing of Al-WTR with the P-impacted soil (T3). The
relatively lower volumes of subsurface and leachate pose an equal risk of SP loss to that

41
of runoff because what is lacking in volume is compensated by concentration. A rough
estimate of SP loss on a hectare basis can be calculated, assuming that similar P losses
would be encountered over larger areas (Table 4-7). The expected loss per rainfall event
in an untreated field would be 350 to 500 g ha-1. Partial treatment of the impacted zone
could reduce P loss approximately 200 to 300 g ha-1. Soluble P loss could be reduced to
less than 100 g ha-1 if Al-WTR was incorporated throughout the P-impacted layer.
Soil mixing in C2 did not reduce P loss as was found by Miyittah (2004), because
both the 0–10 and 10–20 cm depths were highly P-impacted. Miyittah (2004) mixed a P-
impacted soil with an un-impacted E horizon, which in effect, diluted the P-impacted soil.
Table 4-7. Soluble P mass loss (SP concentration * volume) averaged over six rainfall events and estimated SP loss per hectare per rainfall event.
Treatments† Collection Point C1 T1 T2 T3 C2 Runoff (mg P box-1) 4.36a‡ 1.07d 2.22c 1.96c 3.68b Subsurface (mg P box-1) 4.75b 4.92b 2.76c 0.45d 6.07a Leachate (mg P box-1) 1.69b 2.37b 1.50b 0.20c 4.61a Total SP loss (mg P box-1) 10.80 8.36 6.48 2.61 14.36 SP loss (g P ha-1) 360 279 216 87 479 † C1, no Al-WTR, not mixed; T1, surface applied Al-WTR, not mixed; T2, Al-WTR mixed in 0–10 cm; T3, Al-WTR mixed in 0–20 cm; C2, no Al-WTR, mixed 0–20 cm. ‡Means within a row and followed by the same letter are not significantly different by Waller-Duncan (p<0.05).
Particulate P (PP) concentration was calculated in runoff, subsurface flow, and
leachate by subtracting SP from TP (Table 4-8). Runoff PP concentrations ranged from
0.1 to 0.3 mg L-1. On average, PP accounted for approximately 20 and 60% of TP in the
controls and the Al-WTR treatments, respectively. Therefore, PP should also be a
concern on minimally sloped landscapes, particularly if Al-WTR has been applied.
Particulate P concentrations in the subsurface flow and leachate were below detectable
limits. Although PP concentrations in runoff showed marked trends among treatments,
the differences were not significant because of the high standard deviations among

42
treatments. This is believed to be a result of small variations in soil surface levels
compared to the box edge rather than treatment effects. This would affect the amount of
particulate matter leaving, or conversely, retained, at the box edge where runoff was
collected.
Table 4-8. Total, soluble, and particulate P concentrations in runoff for each treatment averaged over six rainfall events.
Treatments† C1 T1 T2 T3 C2
--------------------------------mg P L-1------------------------------- Total P 0.47a‡ 0.21b 0.38ab 0.47a 0.34ab Soluble P 0.34a 0.08d 0.18c 0.16c 0.29b Particulate P 0.13a 0.13a 0.20a 0.31a 0.05a † C1, no Al-WTR, not mixed; T1, surface applied Al-WTR, not mixed; T2, Al-WTR mixed in 0–10 cm; T3, Al-WTR mixed in 0–20 cm; C2, no Al-WTR, mixed 0–20 cm. ‡Means within a row and followed by the same letter are not significantly different by Waller-Duncan (p<0.05). Nitrate- and Ammonium-Nitrogen
Ammonium-N concentrations in runoff, subsurface flow, and leachate averaged
less than 1 mg L-1 and there were no differences among treatments (Table 4-9A). Nitrate-
N concentrations (Table 4-9B) were also below 1 mg L-1 and showed no differences
between treatments with two exceptions. The exceptions were greater NO3-N
concentrations in subsurface flow and leachate in T1 compared to all other treatments.
There are no obvious explanations for these differences at this time. Under typical
production conditions, N fertilizer would be added to maintain production and forage
nutritive value. However, to simplify this experiment, no additional fertilization was
used.

43
Table 4-9. Average N concentrations in runoff, subsurface flow, and leachate from six, five, and two simulations, respectively. (A) NH4-N. (B) NO3-N.
(A) Treatments† C1† T1 T2 T3 C2 Collection Point --------------------------mg NH4-N L-1------------------------- Runoff 0.19a‡ 0.19a 0.18a 0.23a 0.19a Subsurface 0.38a 0.38a 0.35a 0.30a 0.33a Leachate 0.35a 0.36a 0.42a 0.47a 0.44a
(B) Treatments† C1† T1 T2 T3 C2 Collection Point --------------------------mg NO3-N L-1-------------------------- Runoff 0.15a‡ 0.14a 0.14a 0.13a 0.12a Subsurface 0.23b 0.77a 0.10b 0.14b 0.13b Leachate 0.12b 0.74a 0.11b 0.10b 0.08b † C1, no Al-WTR, not mixed; T1, surface applied Al-WTR, not mixed; T2, Al-WTR mixed in 0–10 cm; T3, Al-WTR mixed in 0–20 cm; C2, no Al-WTR, mixed 0–20 cm. ‡Means within a row and followed by the same letter are not significantly different by Waller-Duncan (p<0.05). Total Calcium, Magnesium, Iron, and Aluminum Concentrations
Calcium and Mg concentrations were in the order of runoff < subsurface flow <
leachate (Table 4-10). There were no significant differences in Ca and Mg
concentrations in runoff among treatments. Calcium and Mg concentrations were
different among treatments for subsurface flow and leachate. Aluminum-WTR
treatments had higher concentrations of Ca in subsurface flow and leachate which is
likely due to the Ca contained in the Al-WTR (580 mg L-1). Iron concentrations were
similar in runoff, subsurface flow, and leachate, and did not vary between treatments.
Total Al concentrations were highly variable and showed no meaningful differences
among treatments. However, a trend of higher Al concentrations was observed in
leachate from treatments where Al-WTR was incorporated into the soil (T2 and T3).
Random samples were tested for soluble Al from all collection points, treatments, and
simulations and all concentrations were below detection limits (0.3 mg L-1). This
suggests that essentially all of the Al was in particulate form.

44
Table 4-10. Average total Ca, Mg, Fe, and Al concentrations in runoff, subsurface flow, and leachate from six, five, and two simulations, respectively. (A) Runoff. (B) Subsurface flow. (C) Leachate.
(A) Runoff Ca Mg Fe Al
Treatments† --------------------------mg L-1-------------------------- C1 15.8 8.83 0.27 0.66 T1 16.3 8.90 0.53 1.06 T2 16.4 8.44 0.43 1.62 T3 17.6 8.68 0.51 2.68 C2 15.7 8.36 0.23 2.71
(B) Subsurface Flow
Ca Mg Fe Al Treatments† -------------------------mg L-1-------------------------
C1 64.3c‡ 22.1b 0.23 0.00b T1 80.2b 26.8ab 0.42 1.22a T2 91.1ab 30.6a 0.34 0.00b T3 95.9a 31.6a 0.38 0.00b C2 49.0d 16.4c 0.54 0.76a
(C) Leachate
Ca Mg Fe Al Treatments† -------------------------mg L-1-----------------------
C1 95.2b‡ 45.8b 0.19 0.00a T1 94.4b 48.7b 0.09 0.00a T2 138.8ab 67.9a 0.15 1.94b T3 199.3a 63.0a 1.14 5.67b C2 87.7b 28.1c 0.12 3.70b
† C1, no Al-WTR, not mixed; T1, surface applied Al-WTR, not mixed; T2, Al-WTR mixed in 0–10 cm; T3, Al-WTR mixed in 0–20 cm; C2, no Al-WTR, mixed 0–20 cm. ‡Means within a column and followed by the same letter are not significantly different by Waller-Duncan (p<0.05).
Pre- and Post-simulation Comparisons
Soil Phosphorus
When Al-WTR was incorporated into the soil, WEP decreased by approximately
70% i.e., T2 (0–10 cm depth) and both depths in T3, compared to the respective controls
(Table 4-11). There was no change in soil WEP concentrations in any of the treatments
prior to or after the study (paired T Test; p< 0.05).

45
Table 4-11. Pre- and post-simulation water extractable P concentrations in the 0-10 and 10-20 cm soil depths.
0–10 cm depth 10–20 cm depth Treatments† Pre-simulation‡§ Post-simulation Pre-simulation Post-simulation
-------------------------------mg P kg-1------------------------------ C1 21 a 20 a 24 a 26 a T1 14 c 14 b 24 a 23 ab T2 7 d 7 c 19 b 18 b T3 6 d 7 c 7 c 6 c C2 25 a 24 a 24 a 25 a
† C1, no Al-WTR, not mixed; T1, surface applied Al-WTR, not mixed; T2, Al-WTR mixed in 0–10 cm; T3, Al-WTR mixed in 0–20 cm; C2, no Al-WTR, mixed 0–20 cm. §Means within a column followed by the same letter are not significantly different by Waller-Duncan (p<0.05).
Application of Al-WTR had essentially no effect on Mehlich-1 extractable P (Table
4-12). Apparently, Mehlich-1 extractant removes P adsorbed to the soil as well as that
adsorbed to Al-WTR. There were few differences in pre- and post-simulation
concentrations statistically compared using the paired T Test (p<0.05).
Table 4-12. Pre- and post-simulation Mehlich-1 P concentrations in the 0-10 and 10-20 cm soil depths.
0–10 cm depth 10–20 cm depth Treatments† Pre-simulation‡§ Post-simulation Pre-simulation Post-simulation
------------------------------mg P kg-1------------------------------ C1 679 AB 785 B 882 A 882 BC T1 635 AB 774 B 825 AB 1017 A T2 614 B 709 B 760b AB 954a AB T3 779 A 770 B 720 B 795 C C2 777a A 958b A 823 AB 903 B
† C1, no Al-WTR, not mixed; T1, surface applied Al-WTR, not mixed; T2, Al-WTR mixed in 0–10 cm; T3, Al-WTR mixed in 0–20 cm; C2, no Al-WTR, mixed 0–20 cm. ‡ Means for each soil depth within a row followed by the same lower case letter are not significantly different by Waller-Duncan (p<0.05). § Means for each soil depth within a column followed by the same upper case letter are not significantly different by Waller-Duncan (p<0.05). Soil pH
Soil pH decreased slightly by the end of the study (Table 4-13). However,
application of Al-WTR had essentially no effect on soil pH before or after simulation

46
events. It appears the soil was well-buffered due to the Ca and Mg accumulated from the
manure applications.
Table 4-13. Pre- and post-simulation soil pH values in the 0-10 and 10-20 cm soil depths.
0–10 cm depth 10–20 cm depth Treatments† Pre-simulation‡§ Post-simulation Pre-simulation Post-simulation
C1 6.9a A 6.6b A 7.0a AB 6.7b A T1 6.7 AB 6.6 A 7.0a A 6.6b A T2 6.9 B 6.6 A 6.9a ABC 6.6b A T3 7.0a A 6.6b A 6.8 C 6.6 A C2 6.9a A 6.6b A 6.8a BC 6.6b A
† C1, no Al-WTR, not mixed; T1, surface applied Al-WTR, not mixed; T2, Al-WTR mixed in 0–10 cm; T3, Al-WTR mixed in 0–20 cm; C2, no Al-WTR, mixed 0–20 cm. ‡ Means for each soil depth within a row followed by the same lower case letter are not significantly different by Waller-Duncan (p<0.05). § Means for each soil depth within a column followed by the same upper case letter are not significantly different by Waller-Duncan (p<0.05).
Forage
Shoot yields were smaller for the surface-applied Al-WTR (T1) than for
incorporated Al-WTR (T2 and T3) treatments for the initial three harvests (Table 4-14).
This might suggest that surface-applied Al-WTR was detrimental to stargrass growth.
However, this same trend occurred for control C2. This suggests that the differences may
be due to initial stand establishment rather than toxicity effects. After the first two
simulations (63 d of growth), the stargrass became well-established. For simulations 4-6,
shoot yields were similar between treatments. There was no visual evidence of adverse
effects on stargrass shoot growth. In addition, root mass of all treatments was
approximately 30 g box-1 during the experiment (Figure 4-3). Root biomass was not
significantly different among treatments; therefore Al-WTR does not appear to adversely
affect stargrass roots.

47
Table 4-14. Stargrass shoot biomass harvested prior to each simulation. Treatments† Sim 1 Sim 2 Sim 3 Sim 4 Sim 5 Sim 6‡ Avg
-------------------------------------g box-1------------------------------------- C1 35a§ 17a 38a 16a 8a 57a 23 T1 17b 8b 24b 19a 4b 41a 14 T2 35a 21a 35ab 18a 7a 50a 23 T3 31a 14a 30ab 17a 7a 56a 20 C2 14b 6b 28ab 21a 9a 47a 15
† C1, no Al-WTR, not mixed; T1, surface applied Al-WTR, not mixed; T2, Al-WTR mixed in 0–10 cm; T3, Al-WTR mixed in 0–20 cm; C2, no Al-WTR, mixed 0–20 cm. ‡Simulation 6 data includes all above-ground biomass. Simulation 1–5 data are shoot biomass above 15 cm height. §Shoot biomass was compared (column) between treatments using a log transformation followed by Waller-Duncan method. Treatments with the same letter are not significantly different (p<0.05).
0
20
40
60
80
100
120
140
Gra
ms
Box
-1
Shoots
Figure 4-3. Total shoot anno Al-WTR, noWTR mixed in mixed 0–20 cmTreatments meanot significantl
Shoot and root P con
simulations were not differ
the stargrass contained app
approximately 0.5 mg unif
(Figure 4-4B). The origina
decline was expected base
a a a a
a a ab b b
a
C1 T1 T2 T3 C2
Treatment
Roots
d root growth per treatment averaged over six simulations. C1, t mixed; T1, surface applied Al-WTR, not mixed; T2, Al-0–10 cm; T3, Al-WTR mixed in 0–20 cm; C2, no Al-WTR, . Error bars represent the standard deviation of 4 replicates. ns within a plant fraction and followed by the same letter are
y different using the Waller-Duncan method (p<0.05).
centrations among all treatments averaged over the six
ent (p<0.05; Figure 4-4A). During the first two simulations,
roximately 3 mg of P g-1 of forage and declined by
ormly across all treatments by the end of the experiment
l planting material contained approximately 3.2 mg g-1. The
d on seasonal change in growth (August to January).

48
Simulation 1 began in August and simulation 6 ended in December. Root P
concentrations were approximately 1.7 mg g-1 and did not significantly vary among
treatments (Figure 4-4A).
0
1
2
3
4
C1 T1 T2 T3 C2
Treatments
TP, m
g g-1
ShootsRoots
0
1
2
3
4
1 2 3 4 5 6
Harvest
TP, m
g g-1
Figure 4-4. Average stargrass TP concentrations per treatment averaged over all
simulations (A) and per simulation averaged over all treatments (B). C1, no Al-WTR, not mixed; T1, surface applied Al-WTR, not mixed; T2, Al-WTR mixed in 0–10 cm; T3, Al-WTR mixed in 0–20 cm; C2, no Al-WTR, mixed 0–20 cm. Error bars represent the standard deviation of 4 replicates.
Shoot and root TN concentrations also were not affected by treatment (p <0.05;
Figure 4-5A). Shoot TN concentration was approximately 25 mg N g-1in the planting
material and for the first two simulations (Figure 4-5B). However, with no additional N
input, the N concentration declined to approximately 10 mg N g-1. Root TN
concentrations at the end of the study were similar for all treatments (Figure 4-5A).
(A)
(B)

49
Figure 4-5. AvsimuAl-Wmix0–2
Shoot Al
typically remai
low end of the
Root Al concen
within the typic
were no signifi
be a factor even
(A)
0
5
10
15
20
25
30
C1 T1 T2 T3 C2
Treatments
TN, m
g g-1
ShootsRoots
30
(B)0
5
10
15
20
25
1 2 3 4 5 6
Harvest
TN, m
g g-1
erage stargrass TN concentrations per treatment averaged over all lations (A) and per simulation averaged over all treatments (B). C1, no TR, not mixed; T1, surface applied Al-WTR, not mixed; T2, Al-WTR
ed in 0–10 cm; T3, Al-WTR mixed in 0–20 cm; C2, no Al-WTR, mixed 0 cm. Error bars represent the standard deviation of 4 replicates
concentrations fluctuated slightly between treatments and simulations, but
ned below 40 µg g-1 (Figure 4-6A, B). These concentrations were at the
typical range (60–14,500 ppm) for grasses (Pendias and Pendias, 2001).
trations ranged from 970 to 310 µg g-1 of forage. These values also fall
al range for forage plants. Because of the high standard deviation, there
cant differences among treatments (p<0.05). Contamination is believed to
though roots were washed multiple times to remove soil and Al-WTR

50
particles. No stunted roots were observed. Aluminum concentration (Figure 4-6B)
exhibited a decline that was similar to P and N concentrations in simulations 3 through 5.
The increase in concentration in simulation 6 is attributed to shoot contamination when
cutting shoots close to the soil surface; which is supported by the large standard
deviation.
0
200
400
600
800
1000
1200
1400
1600
C1 T1 T2 T3 C2Treatments
Tota
l Al,
µg g
-1
ShootsRoots
0
50
100
150
200
250
1 2 3 4 5 6
Harvest
Tota
l Al,
µg g
-1
Figure 4-6. Average stargrass Al concentrations per treatment averaged over all simulations (A) and per simulation averaged over all treatments (B). C1, no Al-WTR, not mixed; T1, surface applied Al-WTR, not mixed; T2, Al-WTR mixed in 0–10 cm; T3, Al-WTR mixed in 0–20 cm; C2, no Al-WTR, mixed 0–20 cm. Error bars represent the standard deviation of 4 replicates. Treatments means within the root fraction and followed by the same letter are not significantly different using the Waller-Duncan method (p<0.05).
b a ab b b
(A)
(B)

51
CHAPTER 5 CONCLUSIONS
Previous research has shown that land applying Al-WTR is effective in reducing
soluble P loss from agricultural fields. This study was developed to provide Al-WTR
management information on manure-impacted sandy soils with a fluctuating high
watertable. The research evaluated different methods of applying Al-WTR (surface and
incorporated) as well as different incorporation depths, P loss over time, and potential
effects on forage productivity and chemical composition. Runoff boxes were filled with
a P-impacted sandy soil and the respective Al-WTR application treatments. The rate of
Al-WTR application (2.5% of dry weight of soil) was selected based on Miyittah’s
(2004) recommendation for a practical field application rate that would significantly
reduce soluble P concentrations in the soil solution. Boxes were placed under a rainfall
simulator to create uniform rainfall distribution at known intervals and duration.
Phosphorus loss was examined from the three collection points (runoff, subsurface flow,
and leachate) because of potential water movement above a restricting layer (spodic).
Concerns about P deficiency and Al toxicity in stargrass were addressed throughout the
duration of the study.
The application of Al-WTR, whether surface applied or mixed within the profile,
impacted SP loss. Surface applied Al-WTR was more effective in reducing SP in runoff
than when incorporated. However, incorporated Al-WTR was more effective in reducing
SP in subsurface flow and leachate than was surface Al-WTR application. Care must be
taken to ensure complete incorporation of Al-WTR throughout the P-impacted layer, as

52
Al-WTR is only effective in reducing SP concentrations when it is in contact with the
impacted soil. To achieve the best results for reducing P loss in both surface runoff and
subsurface flow/leachate from highly impacted soils, Al-WTR should be first mixed with
the impacted soil depth to reduce subsurface flow/leachate P loss AND then added to the
soil surface to minimize P loss in runoff. For an un-impacted area with low initial soil P
concentration intended for manure application, surface application of Al-WTR would
likely suffice to minimize P loss.
Application of Al-WTR at 2.5% of soil weight did not adversely affect forage yield
or quality of stargrass, based on the uniform values of yield and P, N, and Al
concentrations between treatments. Field scale forage studies are needed to validate box-
scale results.
Effective P control on intensively managed agricultural land is imperative. The use
of Al-WTRs is not a single source solution. Rather, it is an effective management tool in
an intricate comprehensive management plan. This study attempted to mimic field
conditions to provide realistic results. However, short- and long -term field studies are
needed before Al-WTR application can be included in best management practices.
53
LIST OF REFERENCES
Alpkem Corp. 1990. Rapid Flow Analyzer Methodology. Method A303-S170. Clackamas, OR.
Anderson, D.L., O.H. Tuovinen, A. Faber, and I. Ostrokowski. 1995. Use of soil amendments to reduce soluble phosphorus in dairy soils. Ecol. Eng. 5: 229–246.
Atalay, A. 2001. Variation in phosphorus sorption with soil particle size. Soil and Sed. Contam. 10: 317–335.
Basta, N.T., and J.J. Sloan. 1999. Bioavailability of heavy metals in strongly acidic soils treated with exceptional quality biosolids. J. Environ. Qual. 28: 633–638.
Ballard, R., and J.G.A. Fiskell. 1974. Phosphorus retention in coastal-plain forest soils: Relationship to soil properties. Soil Sci. Soc. of Amer. J. 38: 250–255.
Boggess, C.F., E.G. Flaig, and R.C. Fluck. 1995. Phosphorus budgets for Lake Okeechobee tributary watersheds. Ecol. Eng. 5: 143–162.
Breeuwsma, A., and S. Silva. 1992. Phosphorus fertilization and environmental effects in the Netherlands and the Po regions (Italy). Rep. 57. Agric. Res. Dep., The Winand Staring Centre for Integrated Land, Soil, and Water Res., Wageningen, the Netherlands.
Brown, E., and J.B. Sartain. 2000. Phosphorus retention in United States Golf Association (USGA) greens. Soil Crop Sci. Soc. Florida Proc. 59: 112–117.
Bugsbee, G.J., and C.R. Frink. 1985. Alum sludge as a soil amendment: Effects on soil properties and plant growth. New Haven Connecticut Agric. Exp. Stn. Bull. 827.
Buss, G.R., J.A. Lutz, Jr., and G.W. Hawkins. 1975. Yield response of alfalfa cultivars and clones to several pH levels in Tatum subsoil. Agron. J. 67: 331–334.
Clesceri, L.S., A.E. Greenberg, and R.R. Trussell (ed.). 1989. 3030D, Preliminary digestion for metals. In: Standard Methods for the Examination of Water and Wastewater: 17th ed. Amer. Public Health Assoc. Washington, D.C.
Cornell, D.A., and G.P. Westerhoff. 1981. Management of water treatment plant sludges. In: Sludge and its Ultimate Disposal. (Ed. J.A. Borchardt). Ann Arbor Sci. Publishers. Ann Arbor, MI.

54
Dayton, E.A., and N.T. Basta. 2001. Characterization of drinking water treatment residuals for use as a soil substitute. Water Environment Research 73: 52–57.
Delhaize, E., and P.R. Ryan. 1995. Aluminum toxicity and tolerance in plants. Plant Physiol. 107: 315–321.
Elliott, H.A., and B.A. Dempsey. 1991. Agronomic effects of land application of water-treatment sludges. J. Amer. Water Works Assoc. 83: 126–131.
Elliott, H.A., G.A. O’Connor, P. Lu, and S. Brinton. 2002. Influence of water treatment residuals on phosphorus solubility and leaching. J. Environ. Qual. 31: 1362–1369.
Elliott, H.A., B.A. Dempsey, D.W. Hamilton, and J.R. Dewolfe. 1990. Land application of water treatment sludges; Impacts and management. Amer. Water Works Assoc. Res. Denver, CO.
Esteves, M., O. Planchon, J.M. Lapetite, N. Silvera, and P. Cadet. 2000. The ‘emire’ large rainfall simulator: design and field testing. Earth Surf. Processes Landforms 25: 681–690.
Farmer, EE. 1973. Relative detachability of soil particles by simulated rainfall. Soil Sci. Soc. of Amer Proc. 37: 629–633.
Faulkner, S.P., and C.J. Richardson. 1989. Physical and chemical characteristics of freshwater wetland soils. pp. 41–72. In: Hammer, D.A. (ed.). Constructed Wetlands for Wastewater Treatment. Lewis Publishers. Chelsea, MI.
Foy, C.D. 1984. Physiological effects of hydrogen, aluminum, and manganese toxicities in acid soils. In: Soil acidity and liming, (Ed. F. Adams). pp. 57–97. Agron. Monograph. 12, 2nd ed. Amer. Soc. Agron., Crop. Sci. Soc. Amer., and Soil Soc. Amer., Madison, WI.
Foy, C.D., R.L. Chaney, and M.C. White. 1978. Physiology of metal toxicity in plants. Ann. Rev. Plant Physiol. 29: 511–566.
Foy, C.D., A.L. Fleming, and G.C. Gerloff. 1972. Differential aluminum tolerance in two snapbean varieties. Agron. J. 64: 815–818.
Flaig, E.G., and K.R. Reddy. 1995. Fate of phosphorus in the Lake Okeechobee watershed, FL, USA: overview and recommendations. Ecol. Eng. 5: 127–142.
Flaig, E.G., and K.E. Havens. 1995. Historical trends in the Lake Okeechobee ecosystem. I. Land use and nutrient loading. Arch. Hydrobiol. Suppl. 107: 1–24.
Florida Agriculture Statistical Directory. 2004. Florida Department of Agricultural and Consumer Services. Tallahassee, FL.

55
Fluck, R.C., C. Fonyo, and E. Flaig. 1992. Land-use-based phosphorus balances for Lake Okeechobee, Florida, drainage watersheds. Appl. Eng. Agric. 8: 813–820.
Froelich, P.N. 1988. Kinetic control of dissolved phosphate in natural rivers and estuaries: A primer on the phosphate buffer mechanism. Limnol. Oceanogr. 33: 649–668.
Frossard, E., M. Brossard, M.J. Hedley, and A.K. Metherell. 1995. Reactions controlling the cycling of P in soils. In: Phosphorus in the Global Environment Transfers, Cycles, and Management. (Ed. H. Tiessen). John Wiley & Sons, New York, NY.
Gale, P.M., K.R. Reddy, and D.A. Graetz. 1994. Phosphorus retention by wetland soils used for treated wastewater disposal. J. Environ. Qual. 23: 370–377.
Gallaher, R.N., C.O. Weldon, and J.G. Futral. 1975. An aluminum block digester for plant and soil analysis. Soil Sci. Soc. Amer. Proc. 39: 803–806.
Gallimore, L.E., N.T. Basta, D.E. Storm, M.E. Payton, R. H. Huhnke, and M.D. Smolen. 1999. Water treatment residual to reduce nutrients in surface runoff from agricultural land. J. Environ. Qual. 28: 1474–1478.
Gatewood, S.E., and P.B. Bedient. 1975. Drainage density in the Lake Okeechobee drainage area. Report, Division of State Planning, Florida Department of Administration. Tallahassee, FL.
Graetz, D.A., and V.D. Nair. 1995. Fate of phosphorus in Florida Spodosols contaminated with cattle manure. Ecol. Eng. 5: 163–182.
Hambleton, L.G. 1977. Semiautomated method for simultaneous determination of phosphorus, calium, and crude protein in animal feeds. J.A.O.A.C. 60: 845–852.
Haustein, G.K., T.C. Daniel, D.M. Miller, P.A. Moore, Jr., and R.W. McNew. 2000. Aluminum-containing residuals influence high-phosphorus soils and runoff water quality. J. Environ. Qual. 29: 1954–1959.
Haug, A. 1984. Molecular aspects of aluminum toxicity. CRC Crit. Rev. Plant Sci. 1: 345–373.
He, Z.L., A.K. Alva, Y.C. Li, D.V. Calvert, and D.J. Banks. 1999. Sorption-desorption and solution concentration of phosphorus in a fertilized sandy soil. J. Environ. Qual. 28: 1804–1810.
Hoddinott, J., and C. Richter. 1987. The influence of aluminum on photosynthesis and translocation in french bean. J. Plant Nutr. 10: 443–454.

56
Hodges, J.R., G.K. Kirk, R.L. Shirley, F.M. Peacock, J.F. Easley, H.L. Breland, and F.G. Martin, 1967. Phosphorus fertilization of pangola grass pastures, direct and residual effects. Research Report, Range Experiment Station, Univ. of FL, Ona, FL.
Holford, I.C.R., C. Hird, and R. Lawie. 1997. Effects of animal effluents on the phosphorus sorption characteristics of soils. Aust. J. Soil Res. 35: 365–373.
Howard, F. 2006. Pulling out P. Hay and Forage. March 2006: 52.
Humphry, J.B., T.C. Daniel, D.R. Edwards, and A.N. Sharpley. 2002. A portable rainfall simulator for plot-scale runoff studies. Appl. Eng. Agric. 18: 199–204.
Ippolito, J.A., K.A. Barbarick, D.M. Heil, J.P. Chandler, and E.F. Redente. 2003. Phosphorus retention mechanisms of a water treatment residual. J. Environ. Qual. 32: 1857–1864.
Ippolito, J.A., K.A. Barbarick, and E.F. Redente. 2002. Combinations of water treatment residuals and biosolids affect two range grasses. Commun. Soil Sci. Plant Anal. 33: 831–844.
Jarvis, S.C., and D.J. Hatch. 1986. The effects of low concentrations of aluminum on the growth and uptake of nitrate-N by white clover. Plant Soil 95: 43–55.
Kinraide, T.B. 1991. Identity of the rhizotoxic aluminium species. Plant Soil. 134: 167–178.
Kleinman, P.J.A., and A.N. Sharpley. 2003. Effect of broadcast manure on runoff phosphorus concentration over successive rainfall events. J. Environ. Qual. 32: 1072–1081.
Kleninman, P.J.A., A.N. Sharpley, B.G. Moyer, and G.F. Elwinger. 2002. Effect of mineral and manure phosphorus sources on runoff phosphorus. J. Environ. Qual. 31: 2026–2033.
Klimashe, E.L. 1970. On role of roots as determining different tolerance of genetically related plant forms toward Al3+. Agrochimica 14: 232–241.
Lindsay, W.L., P.L.G. Vlek, and S.H. Chien. 1989. Phosphate minerals. pp. 1089–1130. In: Minerals in Soils Environments. (Ed. J.B. Dixon, and S.B. Weed). Soil Sci. Soc. Amer. J., Madison, WI.
McCaffery, P.M., W.M. Hinkley, R. MacGill, and G.D. Cherr. 1976. Report of investigations in the Kissimmee-Lake Okeechobee Watershed. FL Dept. Environ. Reg. Tech. Series, Vol. 2, No. 2, Tallahassee, FL.
Mehlich, A. 1953. Determination of P, Ca, Mg, K, Na, and NH4. Soil Testing Div. Publ. 1–53. North Carolina Department of Agriculture, Raleigh.

57
Meyer, L.D.,and D.L. McCune. 1958. Rainfall simulator for runoff plots. Agric. Eng. 39: 644–648.
Miller, W.P. 1987. A solenoid-operated, variable intensity rainfall simulator. Soil Sci. Soc. of Amer. J. 51: 832–834.
Miner, C.L. 2001. Storage and partitioning of soil phosphorus in the Orlando Easterly Wetland treatment system. M.Sci. Thesis, Univ. of FL, Gainesville, FL. 32611-0510.
Mitsch, W.J., and J.G. Gosselink. 1993. Wetlands, 2nd ed. Van Nostrand Reinhold Company, NY.
Miyittah-Kporgbe, M. 2004. Phosphorus immobilization in manure-impacted soil with aluminum-based drinking water treatment residual. M.Sci. Thesis, Univ. of FL, Gainesville, FL. 32611-0510.
Moore, P.A., Jr., P.B. DeLaune, D.E. Carman, T.C. Daniel, and A.N. Sharpley. 2000. Development of phosphorus index for pastures. pp. 158–165. In: Proc. 2000 Natl. Poultry Waste Management Symp. (Ed. J.P. Blake, and P.H. Patterson). Auburn Press, Auburn, AL.
Moore, P.A. Jr., D.M. Miller, T.C. Daniel, B.R. Shreve, and D.R. Edwards. 1994. Decreasing phosphorus solubility and inhibiting ammonia volatilization in poultry litter with alum. Poultry Science 73: 151.
Munn, J.R., and G.L. Huntington. 1976. A portable rainfall simulator for erodibility and infiltration measurements on rugged terrain. Soil Sci. Soc. of Amer. J. 40: 622–624.
Murphy, J., and J.P. Riley. 1962. A modified single solution method for the determination of phosphate in natural waters. Anal. Chem. Acta. 27: 31–36.
Nair, V.D., and D.A. Graetz. 2002. Phosphosrus saturation in spodosols impacted by manure. J. Environ. Qual. 31: 1279–1285.
Nair, V.D., D.A. Graetz, and K.M. Portier. 1995. Forms of phosphorus in soil profiles from dairies of south Florida. Soil Sci. Amer. J. 59: 1244–1249.
Nair, V.D., R.R. Villapando, and D.A. Graetz. 1999. Phosphorus retention capacity of the spodic horizon under varying environmental conditions. J. Environ. Qual. 28: 1308–1313.
National Phosphorus Research Project (NPRP). 2001. Rain simulator protocols. (Accessed 11/3/06). http://www.sera17.ext.vt.edu/Documents/National_P_protocol.pdf.

58
Neff, E.L. 1979. Why rainfall simulation? In: Proceedings of Rainfall Simulator Workshop. Tucson, AZ. USDA-SEA ARM-W-10: 3–7.
Novak, J.M., and D.W. Watts. 2004. Increasing the phosphorus sorption capacity of southeastern coastal plain soils using water treatment residuals. Soil Sci. Soc. Amer. 169: 206–214.
O’Connor, G.A., H.A. Elliott, and P. Lu. 2002. Characterizing water treatment residuals phosphorus retention. Soil and Crop Sci. Soc. FL Proc. 61: 67–73.
Ohki, K. 1986. Photosynthesis, chlorophyll, and transpiration responses in aluminum stressed wheat and sorghum. Crop Sci. 26: 572–575.
Olila, O.G., and K.R. Reddy. 1995. Influence of pH on phosphorus retention in oxidized lake sediments. Soil Sci. Soc. of Amer. J. 59: 946–959.
Osborne, G.J., J.E. Pratley, and W.P. Stewart. 1981. The tolerance of subterranean clover (Trifolium-Subterraneum L) to aluminum and manganese. Field Crops Res. 3: 347–358.
Page, A.L. 1982. Methods of Soil Analysis. Part 2. Chemical and Microbiological Properties. 2nd ed. Agron. Monogr. 9. ASA and SSSA. Madison, WI.
Reddy, K.R., E.G. Flaig, and D.A. Graetz. 1996. Phosphorus storage capacity of uplands, wetlands and streams of the Lake Okeechobee watershed, Florida. Agric. Ecosystems & Environ. 59: 203–216.
Reddy, K.R., and W.H. Smith (ed). 1987. Aquatic plants for water treatment and resource recovery. Magnolia Publishing, Orlando, FL.
Riley, S.J., and Hancock F. 1997. A rainfall simulator for hydrologic and erosion experiments on mines, with an example of its applications at Ranger Uranium Mine, Northern Territory, Australia. The Australasian Institute of Mining and Metallurgy Proceedings. 1: 3–8.
Romkens, M.J.M., L.F. Glenn, D.W. Nelson, and C.B. Roth. 1975. A laboratory rainfall simulator for infiltration and soil detachment studies. Soil Sci. Soc. of Amer. Proc. 39: 158–160.
SAS Institute, 2001. The SAS System for Windows. Version 8 Release 8.2 SAS Inst. Cary, NC.
Samac, D.A., and M. Tesfaye. 2003. Plant improvement for tolerance to aluminum in acid soils - a review. Plant Cell, Tissue and Organ Culture 75: 189–207
Sarkunan, V., C.C. Biddapa, and S.K. Nayak. 1984. Physiology of aluminum toxicity in rice. Curr. Sci. 53: 822–824.

59
Sharpley, A.N., and P. Kleinman. 2003. Effect of rainfall simulator and plot scale on overland flow and phosphorus transport. J. Environ. Qual. 32: 2172–2179.
Sharpley, A.N., and R. Menzel. 1987. The impact of soil and fertilizer phosphorus on the environment. Advances in Agron. 41: 297–324.
Shelton, C.H., R.D. von Bernuth, and S.P. Rajbhandari. 1985. A continuous-application rainfall simulator. Trans. ASAE 28: 1115–1119.
Soil Science Society of America (SSSA). 2006. Soil science terms glossary [Online]. Available at http://www.soils.org/sssagloss/index.php. (verified 5/16/06). SSSA, Madison, WI.
Soil Survey Staff. 2003. Soil Survey of Okeechobee County, FL. U.S. Gov. Print. Office. Washington D.C.
South Florida Water Management District (SFWMD). 1997. Surface water improvements and management plan – Update for Lake Okeechobee. Planning document. West Palm Beach, FL.
Swanson, N.P. 1965. Rotating boom rainfall simulator. Trans. the Amer. Soc. of Agric. Eng. 8: 71–72.
Taylor, G.J., A.H. Adriano, and A.H. Johnson (ed.). 1989. Acidic Precipitation: Biological and Ecological Effects. Springer Verlag, New York, NY. pp. 327–361.
United States Department of Agriculture (USDA). 1990. State soil geographic database for Florida. U.S. Dept. of Agric., Soil Conservation Service, Gainesville, FL.
U.S. Environmental Protection Agency (US EPA). 1988. Test methods for evaluating solid waste. Volume IC: Laboratory Manual Physical, Chemical Methods. 3rd ed., PB 8-239223, SW-846. Off. Solid Waste Emerg. Resp., Washington, D.C.
U.S. Environmental Protection Agency (US EPA). 1993a. Methods for determination of inorganic substances in environmental samples. 356.1. Revision 2.0.
U.S. Environmental Protection Agency (US EPA). 1993b. Test methods for evaluating solid waste, physical/chemical methods. Method 3050A. 3rd ed.
U.S. Environmental Protection Agency (US EPA). 1993c. Test methods for evaluating solid waste, physical/chemical methods. Method 350.1. 3rd ed.
Van Wambeke, A. 1976. Formation, distribution, and consequences of acid soils in agricultural development. In: Plant adaptation to mineral stress in problem soils (Ed. M.J. Wright and S.A. Ferrari). Cornell Univ. Agric. Exp. Sta. pp. 15–24.

60
Withers, P.J.A., S.D. Clay, and V.G. Breeze. 2001. Phosphorus transfer in runoff following application of fertilizer manure and sewage sludge. J. Environ. Qual. 30: 180–188.
Yu, B., C.A.A. Ciesiolka, and P. Langford. 2003. Calibration of oscillating nozzle-type rainfall simulator. Earth Surf. Process. Landforms 28: 1483–1490.
Zhang, G.C., and G.J. Taylor. 1988. Effect of aluminum on growth and distribution of aluminum in tolerant and sensitive cultivars of Triticum-Aestivum L. Comm. Soil Sci. Plant Anal. 19: 1195–1205.

61
BIOGRAPHICAL SKETCH
Thomas J. Rew (“TJ”) was born on August 15, 1981. He is the first child of Tom
and Diana Rew. TJ grew up in a military family and attended eight schools before
earning his undergraduate degree from the University of Florida in Environmental
Management in Agriculture with a Land and Water Specialization (August 2003). While
a high school and undergraduate student, TJ spent his summers and holidays working on
the family cattle ranch, Hayman’s 711 Ranch. It was here he developed a love of the
outdoors. This experience led TJ to develop an interested in the interdependency of the
environment, agriculture, and the world’s growing population. In August of 2003, TJ
began his master’s work in soil and water science, focusing on phosphorus loss from
manure impacted soils, at the University of Florida.