Embed Size (px)
Citation preview

Alternatives Screening Memo Honolulu High-Capacity Transit Corridor Project
October 24, 2006
Prepared for:
City and County of Honolulu
Prepared by: Parsons Brinckerhoff


TABLE OF CONTENTS EXECUTIVE SUMMARY .......................................................................................................S-1
CHAPTER 1 INTRODUCTION.............................................................................................. 1-1 Description of the Corridor............................................................................................................................... 1-1 The Purpose and Need for a Major Transit Investment ................................................................................ 1-4
Improved mobility for travelers facing increasingly severe traffic congestion. ............................................. 1-4 Improved transportation system reliability..................................................................................................... 1-5 Accessibility to new development in ‘Ewa/Kapolei/Makakilo as a way of supporting policy to develop the area as a second urban center. ........................................................................................................................ 1-5 Improved transportation equity for all travelers. ............................................................................................ 1-5
Purpose of the Report........................................................................................................................................ 1-6
CHAPTER 2 ANALYSIS APPROACH .................................................................................. 2-1 Development of Goals and Objectives.............................................................................................................. 2-2 Initial Alternatives Screening Process.............................................................................................................. 2-5 Scoping Meeting Comments.............................................................................................................................. 2-6 Refinement of Alternatives................................................................................................................................ 2-7
CHAPTER 3 CONCEPTUAL AND TECHNOLOGY ALTERNATIVES CONSIDERED3-1 Initial Concepts .................................................................................................................................................. 3-1
Overview of Concepts Considered................................................................................................................. 3-1 Concept Screening ............................................................................................................................................. 3-2
Travel Demand Modeling .............................................................................................................................. 3-5 Concept Screening Results................................................................................................................................ 3-5
Improve Mobility ........................................................................................................................................... 3-6 Provide faster, more reliable transit service ................................................................................................... 3-6 Provide an alternative to private automobile travel........................................................................................ 3-7 Improve linkages within the corridor ............................................................................................................. 3-7 Moderate traffic congestion ........................................................................................................................... 3-8
Technology Alternatives.................................................................................................................................... 3-9 Overview of Technologies Considered .......................................................................................................... 3-9 Technologies Screening ................................................................................................................................3-12 Technologies Screening Results Summary ...................................................................................................3-20
CHAPTER 4 FIXED GUIDEWAY ALTERNATIVE ALIGNMENT ANALYSIS........... 4-1 Alignment Descriptions and Analysis .............................................................................................................. 4-2
Section 1: Kapolei to Fort Weaver Road....................................................................................................... 4-4 Section 2: Fort Weaver Road to Leeward Community College .................................................................... 4-7 Section 3: Leeward Community College to Aloha Stadium ........................................................................4-10 Section 4: Aloha Stadium to Ke‘ehi Interchange .........................................................................................4-13 Section 5: Ke‘ehi Interchange / Moanalua Stream to Iwilei.........................................................................4-17 Section 6: Iwilei to Ward Avenue ................................................................................................................4-20 Section 7: Ward Avenue to Kalākaua Avenue .............................................................................................4-24 Section 8: Kalākaua Avenue to UH, Mānoa ................................................................................................4-27
Final Alternatives Screening Memo Page i Honolulu High-Capacity Transit Corridor Project

CHAPTER 5 ALTERNATIVES PRESENTED AT SCOPING............................................ 5-1 Alternatives Resulting from the Screening Process ........................................................................................ 5-1
Alternative 1: No Build Alternative .............................................................................................................. 5-1 Alternative 2: TSM Alternative..................................................................................................................... 5-1 Alternative 3: Managed Lanes Alternative.................................................................................................... 5-2 Alternative 4: Fixed-Guideway Alternative .................................................................................................. 5-4
CHAPTER 6 POST SCOPING ALTERNATIVE REFINEMENT...................................... 6-1 Changes to the Managed Lane Alternative ..................................................................................................... 6-1 Refinements to Fixed Guideway Alternative Alignments............................................................................... 6-1
Ala Moana Boulevard .................................................................................................................................... 6-2 Section 4: Nimitz Highway (at-grade) ........................................................................................................... 6-3 Section 6: Nimitz Highway to Halekauwila Street (elevated)........................................................................ 6-3 Fort Weaver Road Alignment ........................................................................................................................ 6-3 Camp Catlin Road .......................................................................................................................................... 6-4
Selected Fixed Guideway Alignments and Presentation of Alignment Options by Section ........................ 6-4
REFERENCES.......................................................................................................................... R-1
APPENDIX A CORRIDOR POPULATION AND EMPLOYMENT STATISTICS ........ A-1
APPENDIX B CONCEPT SCREENING BY CRITERIA..............................................B-1
APPENDIX C CONCEPT SCREENING MODEL RESULTS SUMMARIZED BY CONCEPT C-1
Concept 1: TSM Screening Results ..................................................................................................................C-2 Concept 2: Managed Lane Screening Results .................................................................................................C-4 Concept 3: Pearl Harbor Tunnel Screening Results.......................................................................................C-6 Concept 4: Fixed Guideway Screening Results ...............................................................................................C-8
Final Alternatives Screening Memo Page ii Honolulu High-Capacity Transit Corridor Project

LIST OF TABLES Table S-1: Potential Fixed Guideway Alignments by Section ........................................................4 Table 3-1: Summary of Concept Screening................................................................................. 3-6 Table 3-2: Summary of Technology Screening......................................................................... 3-22 Table 4-1 : Alternatives Level 1 Alignment Screening ............................................................. 4-31 Table 4-2: Alternatives Level 1 Alignment Screening .............................................................. 4-32 Table 4-3: Alternatives Level 1 Alignment Screening .............................................................. 4-33 Table 4-4: Alternatives Level 1 Alignment Screening .............................................................. 4-34 Table 4-5: Alternatives Level 1 Alignment Screening .............................................................. 4-36 Table 4-6: Alternatives Level 1 Alignment Screening .............................................................. 4-37 Table 4-7: Alternatives Level 1 Alignment Screening .............................................................. 4-39 Table 4-8: Alternatives Level 1 Alignment Screening .............................................................. 4-41 Table 5-1: Fixed Guideway Alternative Sections and Alignments After Scoping...................... 6-5
LIST OF FIGURES Figure 1-1: Study Corridor........................................................................................................... 1-3 Figure 2-1: The HHCTC Screening Process including projected timeline.................................. 2-2 Figure 4-1: Corridor Map With 8 Sections .................................................................................. 4-3 Figure 4-2 : Section 1 Map With All Alignments........................................................................ 4-6 Figure 4-3: Section 2 Map With All Alignments......................................................................... 4-8 Figure 4-4: Section 3 Map With All Alignments....................................................................... 4-12 Figure 4-5: Section 4 Map With All Alignments....................................................................... 4-15 Figure 4-6: Section 5 Map With All Alignments....................................................................... 4-19 Figure 4-7: Section 6 Map With All Alignments....................................................................... 4-22 Figure 4-8: Section 7 Map With All Alignments....................................................................... 4-26 Figure 4-9: Section 8 Map With All Alignments....................................................................... 4-29 Figure 5-1: Alternative 3: Managed Lanes .................................................................................. 5-3 Figure 5-2: Alternative 4a: Fixed Guideway Alternative, Kapolei Parkway/Kamokila
Boulevard/Salt Lake Boulevard/King Street/Hotel Street/Alakea Street/Kapi'olani Boulevard/UH-Mānoa Lower Campus Alignment .............................................................. 5-5
Figure 5-3: Alternative 4b: Fixed Guideway Alternative, Kapolei Parkway/North-South Road/Camp Catlin Road/King Street/Queen Street/Kapi‘olani Boulevard/UH-Mānoa Lower Campus Alignment............................................................................................................... 5-7
Figure 5-4: Alternative 4c: Fixed Guideway Alternative, Kapolei Parkway/Fort Weaver Road/Farrington Highway/Kamehameha Highway/Dillingham Boulevard/Ka‘aahi Street/Beretania Street/King Street/Kai aliu Street/UH-Mānoa Lower Campus Alignment5-9
Figure 5-5: Alternative 4d: Fixed Guideway Alternative, Kapolei Parkway/North-South Road/Farrington Highway/Kamehameha Highway/Airport/Dillingham Boulevard/Hotel Street/Kapi‘olani Boulevard/UH-Mānoa Lower Campus with Waikīkī Branch Alignment5-11
Final Alternatives Screening Memo Page iii Honolulu High-Capacity Transit Corridor Project
Acronyms AA Alternatives Analysis
AVO Average Vehicle Occupancy
AVR Average Vehicle Ridership
BRT Bus Rapid Transit
DEIS Draft Environmental Impact Statement
DMU Diesel Multiple Unit
EIS Environmental Impact Statement
FTA Federal Transit Administration
HHCTC Honolulu High-Capacity Transit Corridor
HOV High Occupancy Vehicle
ITS Intelligent Transportation System
LOS Level-of-Service
LPA Locally Preferred Alternative
LRT Light Rail Transit
MAGLEV Magnetic Levitation (rail technology)
MOE Measures of Effectiveness
NEPA National Environmental Policy Act
NOI Notice of Intent
OMPO O‘ahu Metropolitan Planning Organization
ORTP O‘ahu Regional Transportation Plan
PPHPD Passengers per hour per direction
PRT Personal Rapid Transit
PUC Primary Urban Center
ROW Right-of-way
Final Alternatives Screening Memo Page iv Honolulu High-Capacity Transit Corridor Project

RTP Regional Transportation Plan
SOV Single Occupancy Vehicle
TAZ Transportation Analysis Zone
TOD Transit Oriented Development
TDFM Traffic Demand Forecasting Model
TDM Transportation Demand Management
TSM Transportation Systems Management
VHT Vehicle Hours Traveled
VMT Vehicle Miles Traveled
Final Alternatives Screening Memo Page v Honolulu High-Capacity Transit Corridor Project


Executive Summary The City and County of Honolulu has initiated the preparation of an Alternatives Analysis, to be followed by preparation of a Draft Environmental Impact Statement, for the Honolulu High-Capacity Transit Corridor Project. This report describes the initial screening of alternative modes, technologies and alignments for the 23-mile-long corridor between Kapolei and the University of Hawai‘i at Mānoa.
Approach to Screening
The screening of initial alternatives consisted of several steps. First, background information was assembled for conducting the screening, which included the following:
• A literature review of previously prepared studies, including the island-wide O‘ahu Transportation Study in 1967, the Honolulu Rapid Transit Development Project in 1985, the O‘ahu Trans 2K Island Wide Mobility Concept Study in 1998 and the Primary Transportation Corridor Study in 2000,
• A review of work completed by the O‘ahu Metropolitan Planning Organization
(OMPO) for its Draft 2030 Regional Transportation Plan, • A literature review of various technology modes that might be used in the corridor, • An extensive field review of the study corridor to evaluate engineering, right-of-way,
environmental and other alignment considerations, and • An analysis of current housing and employment data for the corridor.
Second, project goals and objectives were established, specifying the criteria that were to be used for conducting the screening process. The project goals are as follows:
• Improve corridor mobility,
• Encourage patterns of smart growth and economic development,
• Find cost-effective solutions,
• Provide equitable solutions,
• Develop feasible solutions,
• Minimize community and environmental impacts, and
• Ensure consistency with other planning efforts.
Final Alternatives Screening Memo Page S-1 Honolulu High-Capacity Transit Corridor Project

Based on these goals, criteria were defined for the screening process to highlight differences among options. With these criteria, the ability of each mode, technology and alignment option to meet the goals of the system could be evaluated. The screening process considered both intrinsic characteristics of the option and comparative performance of the option against other options considered. The result was a comprehensive screening based on merit and relative performance. Modal alternatives, technologies and alignments were considered separately in order to clearly evaluate the characteristics of each without being limited by constraints of technical implementation. Once the evaluations were completed, the modal, technology and alignment options were matched to create the alternatives that will be carried forward into detailed analysis.
Modal Screening
The third step in the screening process consisted of a general comparative analysis of modal alternatives. This screening considered a broad range of modal improvement concepts and compared the performance of each concept against the other concepts. Concepts included (1) improvements to the existing highway network, (2) a new tunnel across Pearl Harbor, (3) improvements to the bus transit system, (4) a new fixed-guideway transit system, and (5) construction of a “managed” two-lane elevated structure for transit vehicles and potentially carpools, as well as single occupant vehicles willing to pay a congestion-based toll. The modal analysis showed that a new tunnel across Pearl Harbor would not meet the goals of this project as well as would a new managed lane system or a new fixed-guideway system. Therefore, the tunnel option was dropped and the other options were carried forward for further analysis.
Technology Screening
The fourth step consisted of screening technologies. The screening evaluated options within three main technological categories: rail, bus, and ferry. The bus and rail technologies evaluated included conventional bus, guided bus, light rail transit (LRT), personal rapid transit (PRT), monorail, magnetic levitation (MAGLEV), rapid rail, commuter rail, and several different emerging rail technologies. Evaluation criteria for the transit technologies included technical maturity, line capacity, performance, maneuverability, costs/affordability, environmental, safety, supplier competition, implementation time, and accessibility for those with physical disabilities.
With the exception of PRT, commuter rail and emerging rail technologies, the rail options consistently rated higher than other options within the corridor in terms of performance, passenger capacity, environmental and safety. Ferries do not provide enough line capacity or flexibility to serve the entire corridor, so they will not be considered as a primary mass transit technology. Retained technologies, in addition to conventional and guided bus, are LRT, MAGLEV, people mover, monorail and rapid rail for line haul service. Certain bus and rail technologies will also be retained for feeder service to the line-haul system.
Page S-2 Final Alternatives Screening Memo Honolulu High-Capacity Transit Corridor Project
Although some specific rail technologies were rated more highly than others, a specific technology will not be selected at this point. The specific technology will be selected later in the process of developing and implementing the final alternative selected.
Alignment Screening
The alignment screening evaluated 75 different fixed guideway alignment options throughout the corridor. To facilitate the assessment of alignment options, the 23-mile-long corridor was divided into eight geographic sections. The sections, identified in the direction from Wai‘anae to Koko Head, were defined based on logical termini and the network of existing transportation facilities, travel origins and destinations, and/or neighborhood boundaries. The alignments were screened on how well they met the defined criteria, both intrinsically and relatively. Population and employment data were considered within ¼-mile of the proposed alignments to provide insight to the potential ridership for each alignment. Within each section, one or more alignments were retained for consideration in the final alternative definition. The resulting section alignments provide the basis for identifying corridor-length alignment options.
Developing the Alternatives
Finally, the results of all three tiers of screening were considered simultaneously to develop the final alternatives that would be carried forward for further analysis. This screening process identified four alternatives, with four alignment options within one of the alternatives. These alternatives were presented at scoping meetings for public input. Input from the scoping process was the final step for screening. Comments on the proposed alternatives recommended that instead of corridor-length alignments, a mix and match process would allow for greater flexibility to determine the best alternative. For the record, this report will retain the alternatives as they were presented at scoping meetings and list the mix-and-match options used in further analysis.
Alternatives Recommended for Further Study
The following alternatives will be carried forward for detailed analysis:
1. No Build Alternative, which would include existing transit and highway facilities and committed transportation projects to the year 2030.
2. Transportation System Management (TSM) Alternative, which would provide an
enhanced bus system based on a hub-and-spoke route network, community bus circulators, and relatively low-cost capital improvements on selected roadway facilities to provide priority to buses.
3. Managed Lane Alternative, which would include construction of a two-lane grade-separated facility between the Waiawa Interchange and Iwilei for use in a bus rapid transit (BRT) operation. Bus operations would be restructured and enhanced by using the managed lanes to provide additional service between Kapolei and other points ‘Ewa of Downtown. The entire managed lane facility would be managed to maintain free-flow speeds for buses. Provided enough capacity exists, high-occupancy vehicles (HOVs) and
Final Alternatives Screening Memo Page S-3 Honolulu High-Capacity Transit Corridor Project
toll-paying single-occupant vehicles would also be allowed to use the facility. Tolls would be variable and set so as to ensure free flow conditions on the facility. Intermediate access points would be provided in the vicinity of Aloha Stadium and the Ke‘ehi Interchange. Two design and operational variations of the Managed Lane Alternative will be evaluated: a two-direction facility (one lane in each direction) and a two-lane reversible direction facility.
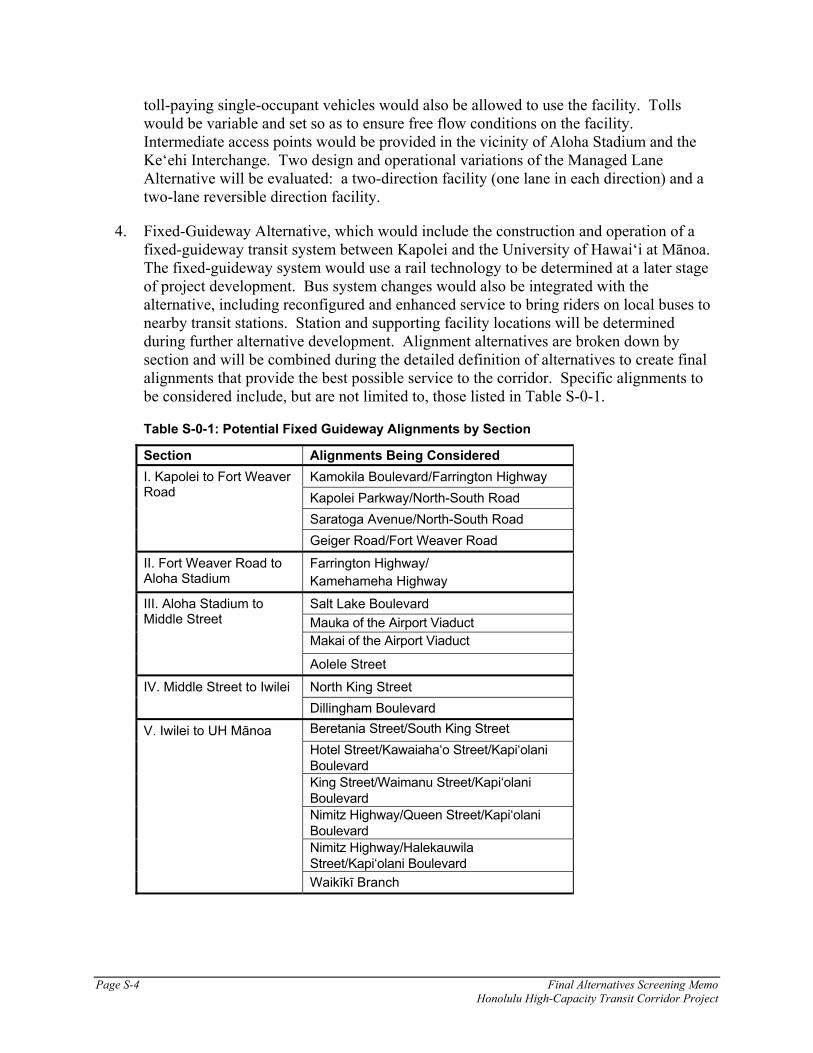
4. Fixed-Guideway Alternative, which would include the construction and operation of a fixed-guideway transit system between Kapolei and the University of Hawai‘i at Mānoa. The fixed-guideway system would use a rail technology to be determined at a later stage of project development. Bus system changes would also be integrated with the alternative, including reconfigured and enhanced service to bring riders on local buses to nearby transit stations. Station and supporting facility locations will be determined during further alternative development. Alignment alternatives are broken down by section and will be combined during the detailed definition of alternatives to create final alignments that provide the best possible service to the corridor. Specific alignments to be considered include, but are not limited to, those listed in Table S-0-1.
Table S-0-1: Potential Fixed Guideway Alignments by Section
Section Alignments Being Considered Kamokila Boulevard/Farrington Highway I. Kapolei to Fort Weaver
Road Kapolei Parkway/North-South Road Saratoga Avenue/North-South Road Geiger Road/Fort Weaver Road
II. Fort Weaver Road to Aloha Stadium
Farrington Highway/ Kamehameha Highway
Salt Lake Boulevard III. Aloha Stadium to Middle Street Mauka of the Airport Viaduct Makai of the Airport Viaduct
Aolele Street
IV. Middle Street to Iwilei North King Street Dillingham Boulevard
V. Iwilei to UH Mānoa Beretania Street/South King Street
Hotel Street/Kawaiaha‘o Street/Kapi‘olani Boulevard
King Street/Waimanu Street/Kapi‘olani Boulevard
Nimitz Highway/Queen Street/Kapi‘olani Boulevard
Nimitz Highway/Halekauwila Street/Kapi‘olani Boulevard
Waikīkī Branch
Page S-4 Final Alternatives Screening Memo Honolulu High-Capacity Transit Corridor Project

Chapter 1 Introduction This report presents the results of the initial alternatives identification and screening process for the Honolulu High-Capacity Transit Corridor Project (HHCTC) Alternatives Analysis (AA). This analysis considered a wide range of modal, technology and alignment options aimed at serving corridor transportation needs between Kapolei and the University of Hawai‘i at Mānoa (UH Mānoa). Based on the information developed for the AA as well as further public input, the Honolulu City Council will make a decision on a Locally Preferred Alternative (LPA) once the analysis is complete.
Description of the Corridor The study corridor extends from Kapolei in the west (Wai‘anae or ‘Ewa direction) to UH Mānoa in the east (Koko Head direction), and is confined by the Wai‘anae and Ko‘olau Mountain Ranges to the north (mauka direction) and the Pacific Ocean to the south (makai direction).
The corridor is constrained geographically to a narrow band between the mountains and ocean. In the Pearl City, Waimalu, and ‘Aiea area, the corridor’s width is less than one mile between the Pacific Ocean and the base of the Ko‘olau Mountains.
The General Plan for the City and County of Honolulu directs future population and employment growth to the ‘Ewa and Primary Urban Center Development Plan areas and the Central O‘ahu Sustainable Communities Plan area. The highest rate of growth is planned for the ‘Ewa area. The largest increases in population and employment are projected in the ‘Ewa, Waipahu, Downtown, and Kaka‘ako districts, which are all located in the corridor.
Currently, 63 percent of the population and 81 percent of the employment on O‘ahu are located within the study corridor. By 2030 this distribution will increase to 69 percent of the population and 84 percent of the employment as development continues to be concentrated into the Primary Urban Center (PUC) and ‘Ewa Development Plan areas.
Kapolei is the center of the ‘Ewa Development Plan area. It is located in a plain of former sugar cane fields and is rapidly developing. To date, residential development has outpaced commercial development, placing additional commuter pressure on the constrained roadway system serving the area. Kapolei has been designated O‘ahu’s “second city,” and City and State government offices have opened there. The Kalaeloa Community Development District (formerly known as Barbers Point Naval Air Station) covers 3,700 acres adjacent to Kapolei. Several alternatives exist for the redevelopment of this area, including the possibility of developing some of the area for the onshore support of an aircraft carrier with a homeport at Pearl Harbor. The University of Hawai‘i is developing a master plan for a new West O‘ahu campus in Kapolei. The Department of Hawaiian Home Lands is also a major landowner in the area and has plans for residential and retail development. In addition, developers have several proposals to continue the construction of residential subdivisions.
Final Alternatives Screening Memo Page 1-1 Honolulu High-Capacity Transit Corridor Project

Continuing Koko Head, the corridor follows Farrington and Kamehameha Highways through a mixture of low-density commercial and residential development. This part of the corridor passes through the makai portion of the Central O‘ahu Sustainable Communities Plan area, which lies at the bottom of the valley between the Wai‘anae and Ko‘olau Mountain Ranges. Farrington Highway and the H-1 Freeway are the principal ‘Ewa–Koko Head routes through this part of the corridor.
Moving farther Koko Head, the corridor enters the PUC Development Plan area. Commercial and residential densities begin to increase in the vicinity of Aloha Stadium. The H-1 Freeway, Kamehameha Highway, Salt Lake Boulevard, and Moanalua Freeway are the principal ‘Ewa–Koko Head roadways in the western portion of the PUC Development Plan area. The Pearl Harbor Naval Reserve, Hickam Air Force Base, and Honolulu International Airport border the corridor on the makai side. Military and civilian housing are the dominant land uses mauka of the H-1 Freeway, with a concentration of high-density housing along Salt Lake Boulevard.
As the corridor continues Koko Head across Moanalua Stream, the land use becomes increasingly dense. There are four principal transportation links through this portion of the corridor: Nimitz Highway, Dillingham Boulevard, North King Street, and the H-1 Freeway. Industrial and port land uses dominate along the harbor, shifting to primarily commercial uses along Dillingham Boulevard, changing to a mixture of residential and commercial uses along North King Street, with primarily residential use mauka of the H-1 Freeway.
Page 1-2 Final Alternatives Screening Memo Honolulu High-Capacity Transit Corridor Project

Figure 1-1: Study Corridor
Koko Head of Nu‘uanu Stream, the corridor continues through Chinatown and Downtown. The Chinatown and Downtown areas have the highest employment density in the corridor. Streets in this area form an urban grid pattern, with traffic spread over several arterials. The Kaka‘ako and Ala Moana neighborhoods, comprised historically of low-rise industrial and commercial uses, are being revitalized with several high-rise residential towers currently under construction. Ala Moana Center, both a major transit hub and shopping destination, is served by more than 2,000 weekday bus trips and visited by more than 56 million shoppers annually.
The corridor continues to Waikīkī and also through the McCully neighborhood to the University of Hawai‘i. Today, Waikīkī has more than 20,000 residents and provides more than 44,000 jobs. It is one of the densest tourist areas in the world, serving approximately 72,000 visitors daily (DBEDT, 2003). UH Mānoa is the other major destination at the Koko Head end of the corridor. It has an enrollment of more than 20,000 students and approximately 6,000 staff (UH, 2005). Approximately 60 percent of students do not live within walking distance of campus (UH, 2002) and must travel by vehicle or transit to attend classes.
Final Alternatives Screening Memo Page 1-3 Honolulu High-Capacity Transit Corridor Project

The Purpose of and Need for a Major Transit Investment The purpose of the Honolulu High-Capacity Transit Corridor Project is to provide improved mobility for persons traveling in the highly congested east-west transportation corridor between Kapolei and UH Mānoa, confined by the Wai‘anae and Ko‘olau Mountain Ranges to the north and the Pacific Ocean to the south. The project would provide faster, more reliable public transportation services in the corridor than those currently operating in mixed-flow traffic. The project would also provide an alternative to private automobile travel and improve linkages between Kapolei, the urban core, UH Mānoa, Waikīkī, and the urban areas in between. Implementation of the project, in conjunction with other improvements included in the O‘ahu Regional Transportation Plan (ORTP), would moderate anticipated traffic congestion in the corridor. The project also supports the goals of the O‘ahu General Plan and the ORTP by serving areas designated for urban growth.
Improved mobility for travelers facing increasingly severe traffic congestion. The existing transportation infrastructure in the corridor between Kapolei and UH Mānoa is overburdened handling current levels of travel demand. Motorists experience substantial traffic congestion and delay at most times of the day during both the weekdays and weekends, and average weekday peak period speeds on H-1 are currently less than 20 mph in many places (Table 1-4) and will degrade even further in most places by 2030. Transit vehicles are caught in the same congestion. Travelers on O‘ahu’s roadways currently experience 51,000 vehicle hours of delay on a typical weekday, which is projected to increase to more than 71,000 daily vehicle hours of delay by 2030, assuming the implementation of all planned improvements listed in the ORTP (except for a fixed guideway system), and as specified in Chapter 2 as this project’s No Build Alternative. Without these improvements, the ORTP indicates that vehicle hours of delay could increase to as much as 326,000. Current morning peak-period travel times for motorists from West O‘ahu to Downtown average between 58 and 81 minutes. By 2030, after including all of the planned roadway improvements in the 2030 O‘ahu Regional Transportation Plan (OMPO, 2006), this travel time is projected to increase to between 62 and 83 minutes. Average bus speeds in the system have been decreasing steadily as congestion has increased (Figure 1-6). Currently, express bus travel times from ‘Ewa Beach to Downtown range from 45 to 76 minutes, and local bus travel times from ‘Ewa Beach to Downtown range from 65 to 110 minutes during the peak period. By 2030, these travel times are projected to increase by 20 percent also on an average weekday. However, as facilities approach their carrying capacity, the flow of traffic becomes increasingly unstable. Under these conditions even a minor incident, such as a driver unexpectedly braking, can have a ripple effect and cause significant delays. The highly volatile nature of travel conditions and the resulting high variation in travel times and delay are not reflected in the travel-demand forecasting models that predict average conditions only. Within the urban core, most major arterial streets will experience increasing peak-period congestion, including Ala Moana Boulevard, Dillingham Boulevard, Kalākaua Avenue, Kapi‘olani Boulevard, King Street, and Nimitz Highway. Expansion of the roadway system between Kapolei and UH Mānoa is constrained by physical barriers and by dense urban neighborhoods that abut many existing roadways.
Page 1-4 Final Alternatives Screening Memo Honolulu High-Capacity Transit Corridor Project

Given the current and increasing levels of congestion, a need exists to offer an alternative way to move within the corridor independent of current and projected highway congestion.
Improved transportation system reliability. As roadways become more congested, they become more susceptible to substantial delays caused by incidents, such as traffic accidents or heavy rain. Because of the operating conditions in the study corridor, current travel times are not reliable for either transit or automobile trips. To get to their destination on time, travelers must allow extra time in their schedules to account for the uncertainty of travel time. This is inefficient and results in lost productivity. Because the bus system primarily operates in mixed-traffic, transit users experience the same level of travel time uncertainty as automobile users. Recent statistics from TheBus indicate that on a systemwide basis, for all classes of bus routes, 45 percent of buses were on time, 27 percent were more than five minutes late, and 28 percent more than one minute early. During the morning peak period, express buses were on time 27 percent of the time, were late 38 percent of the time, and were early 35 percent of the time. A need exists to reduce the variability of transit travel times and provide a system with increased predictability and reliability.
Accessibility to new development in ‘Ewa/Kapolei/Makakilo as a way of supporting policy to develop the area as a second urban center.
Consistent with the General Plan for the City and County of Honolulu, the highest population growth rates for the island are projected in the ‘Ewa Development Plan area (comprised of the ‘Ewa, Kapolei and Makakilo communities), which is expected to grow by 170 percent between 2000 and 2030. This growth represents nearly 50 percent of the total growth projected for the entire island. Within this area, Kapolei, which is developing as a “second city” to Downtown Honolulu, is projected to grow by 475 percent, the ‘Ewa neighborhood by 100 percent, and Makakilo by 125 percent between 2000 and 2030. Accessibility to the overall ‘Ewa Development Plan area is currently severely impaired by the congested roadway network, which will only get worse in the future. This area is less likely to develop as planned unless it is accessible to Downtown and other parts of O‘ahu; therefore, the ‘Ewa, Kapolei, and Makakilo area needs improved accessibility to support its future growth as planned.
Improved transportation equity for all travelers. Many lower-income and minority workers live in the corridor outside of the urban core and commute to work in the Primary Urban Center Development Plan area. Many lower-income workers also rely on transit because of its affordability. In addition, daily parking costs in Downtown Honolulu are among the highest in the United States (Colliers, 2005), further limiting this population’s access to Downtown. Improvements to transit capacity and reliability will serve all transportation system users, including low-income and under-represented populations.
Final Alternatives Screening Memo Page 1-5 Honolulu High-Capacity Transit Corridor Project

Purpose of the Report Given the need to improve transportation mobility within the corridor, the purpose of this report is to document the screening process and the identification of an initial set of study alternatives. This initial screening is intended to refine all possible and reasonable alternatives into those that will meet corridor needs, have been identified as technically feasible, and are viable for further study. The screening process has included input from City staff, elected officials, community groups, the general public, and the consultant team.
This report is one of a number of documents that will be produced for the purpose of providing early information to the Federal Transit Administration (FTA), the City and County of Honolulu and others interested in the project. The alternatives recommended at the conclusion of this report will subsequently be examined in more detail and comparatively evaluated using a broad set of criteria. These criteria will include, but not be limited to, the following: environmental concerns, ridership forecasts, engineering, capital and operating costs, economic and cost-effectiveness considerations, traffic impacts, and opportunities for transit-oriented development. How well each alternative does or does not help achieve local goals and objectives will play a major role in the selection of a Locally Preferred Alternative at the conclusion of the study.
Page 1-6 Final Alternatives Screening Memo Honolulu High-Capacity Transit Corridor Project

Chapter 2 Analysis Approach The alternatives screening was approached through a top-down analysis completed in five major steps. The first step was to gather input needed for the analysis. The input included the stated purpose and need for the project, past studies and their recommendations, requirements of the FTA process, adopted community and area plans, and a visual assessment of the entire corridor as it currently exists. The second step used the information gathered to identify a comprehensive list of potential alternatives. The third step included developing screening criteria and undertaking the initial screening of all potential alternatives to identify those that address the needs of the corridor and do not have any “fatal flaws.” Those surviving alternatives were then presented to the public and interested public agencies and officials for comment through a scoping process in the fourth step. Finally, input from the scoping process was collected and analyzed and refinements were made to the alternatives. The resulting final alternatives are those that will be analyzed in further detail, with results to be documented later in the Alternative Analysis report.
Multiple sources were accessed for input to determine the initial options screened. The goal was to screen as broad a range of feasible alternatives as possible to ensure that the best solutions for the corridor would be captured. Primary resources were past transit studies the City had commissioned over the last 30 years. These included the island-wide O‘ahu Transportation Study in 1967, the Honolulu Rapid Transit Development Project in 1985, and the O‘ahu Trans 2K Island Wide Mobility Concept Study in 1998 followed by the Primary Transportation Corridor Study in 2000. Adopted community and area plans and associated zoning were considered in addition to current policies that would affect development and growth within the corridor. Also considered was work completed by the O‘ahu Metropolitan Planning Organization (OMPO) for its Draft 2030 Regional Transportation Plan.
A long list of alternatives was developed based on these previous studies, a field review of the study corridor, an analysis of current housing and employment data for the corridor and a literature review of modal technologies. This list of alternatives was narrowed down by determining which alternatives met the defined purpose and need as indicated through the application of screening criteria based on the project goals and objectives. Figure 2-1 illustrates the process followed to identify and screen the alternatives.
Final Alternatives Screening Memo Page 2-1 Honolulu High-Capacity Transit Corridor Project

Needs
Criteria
NeedsCriteria
Initial Screening
Refinement of Alternatives
Scoping Input
Mode and Technology Screening
Alignment Screening
Mode and Technology ScreeningAlignment Screening
The Screening Process
Consultant TeamInput
City and CountyDefined Needs
Public Input FTA Requirements
Boundaries of Analysis
Recommended list of alternatives
Possible Alternatives
Previous Study Data
Dec ‘05
Fall ’05 –Winter ‘06
Winter –Spring ‘06
Timeline
Figure 2-1: The HHCTC Screening Process, including Projected Timeline
The alternatives discussed in this analysis include a No Build Alternative, a Transportation Systems Management (or Baseline) Alternative, and a number of “build” alternatives. Transit technologies that were examined included conventional bus, guided bus, light rail transit (LRT), personal rapid transit (PRT), people movers, monorail, magnetic levitation (MAGLEV), rapid rail, commuter rail and waterborne ferry service. Several highway improvements included in OMPO’s 2030 RTP planning process were also considered for their ability to improve transit capacity and reliability, including a bridge or tunnel crossing of Pearl Harbor to connect ‘Ewa with the PUC, and the construction of a 10-mile, two-lane elevated structure from the Waiawa Interchange to the Ke‘ehi Interchange, which would be used by transit vehicles, and potentially carpools and single occupant vehicles willing to pay a congestion-based toll.
Development of Goals and Objectives To ensure that the alternatives considered would meet the stated purpose and need of the project, a set of study goals based on the purpose and need was established at the outset of the study. Additionally, objectives associated with each goal were identified. The degree to which a proposed solution met the objectives indicated how well it achieved the overall goals. The alternatives screening criteria were developed based on these goals and vary slightly for each tier of the screening process, as discussed in the following section. A summary of the goals and corresponding objectives is listed below.
Page 2-2 Final Alternatives Screening Memo Honolulu High-Capacity Transit Corridor Project

Goal #1: Improve Corridor Mobility Discussion: Improved corridor mobility is defined as improved travel times and reliability for corridor person trips, and improved accessibility between residents and desired destinations.
Objectives:
• Reduce corridor person trip travel times, • Improve corridor travel time reliability, • Provide convenient, attractive and effective transit service within the corridor, • Provide transit corridor travel times competitive with auto travel times, • Provide capability to increase corridor peak-period person-throughput to serve
future demand increases, • Connect major trip attractors/generators within the corridor, • Maximize the number of persons within convenient access of transit, and • Provide safe and convenient access to corridor transit stations.
Goal #2: Encourage Patterns of Smart Growth and Economic Development
Discussion: Patterns of smart growth will be encouraged through the strategic location of transit alignments, stations, and other access points in areas of high density or those designated for growth. Transit placement will be minimized in areas earmarked for non-growth. Economic development effects will also be considered in terms of both regional and site-specific economic development.
Objectives:
• Provide transit service to designated corridor transit nodes, • Encourage transit-oriented development in existing and new growth areas, • Use corridor land use policies/opportunities related to economic development, and • Support economic development of major regional economic centers.
Goal #3: Find Cost-Effective Solutions
Discussion: A cost-effective solution is defined as one that meets the project purpose and need and provides a relatively high level of benefit in comparison to its cost.
Objectives:
• Provide solutions with benefits commensurate with their costs, and • Provide solutions which meet the project purpose and needs while minimizing total
costs.
Final Alternatives Screening Memo Page 2-3 Honolulu High-Capacity Transit Corridor Project

Goal #4: Provide Equitable Solutions
Discussion: This goal is aimed at ensuring that costs and benefits are distributed fairly across different population groups, with particular emphasis in serving transit-dependent communities.
Objectives:
• Costs and benefits are distributed fairly across different population groups, • Avoid disproportionate impacts on low income and minority population groups, and • Provide effective transit options to transit-dependent communities.
Goal #5: Develop Feasible Solutions
Discussion: In relation to this goal, feasibility relates to both financial and engineering aspects, including the level of certainty of the availability of required right-of-way (ROW).
Objectives:
• The cost of building, operating and maintaining the alternative is within the range of likely available funding, and
• The alternative is feasible in terms of constructability and ROW availability.
Goal #6: Minimize Community and Environmental Impacts
Discussion: This goal relates to a wide range of potential effects of proposed alternatives. In addition to minimizing the community and environmental impacts of any proposed transit solution, benefits of the alternatives to community and environmental resources will also be assessed.
Objectives:
• Minimize impacts on natural and cultural resources, • Minimize the displacement of homes and businesses, • Provide a solution that enhances safety in the corridor, • Minimize disruption to traffic operations, • Minimize conflicts with utilities, • Minimize construction impacts, • Minimize impacts to community and community amenities, • Reduce energy consumption, and • Minimize impacts to future development.
Page 2-4 Final Alternatives Screening Memo Honolulu High-Capacity Transit Corridor Project

Goal #7: Achieve Consistency with Other Planning Efforts
Discussion: The Honolulu High-Capacity Transit Corridor Project will ensure that the study effort is consistent with past and current planning efforts. Consistency with other planning efforts and adopted plans implies a reasonable level of public acceptance and observance of the planning process.
Objectives:
• Achieve consistency with adopted community plans, • Achieve consistency with adopted regional plans, and • Achieve consistency with adopted state plans.
Initial Alternatives Screening Process The initial alternatives screening analysis was conducted as a three-part evaluation. The first part screened the potential modal solutions to identify the modal alternatives that would be most effective in addressing the purpose and need of the project. The second examined the potential technologies available to operate within the screened modal selections. Finally, the third part studied the potential fixed guideway alignment options to serve the corridor. This three-part approach offered the flexibility for tailoring the screening process to best illustrate the key differences among the options assessed within each of the evaluations.
The screening process within each of the three parts varied slightly. The processes used are described in detail in the respective screening discussions. In general, all possible options for each evaluation process were compared to each other and evaluated based on their intrinsic merits. Options that were assessed to have a fatal flaw were eliminated from further analysis. The options that scored well relative to other options were included in the final alternatives definition.
Each evaluation part was conducted independently using criteria based on the goals and objectives stated previously. The criteria varied slightly for each evaluation so that the analysis could focus on illustrating the differences among the options assessed in that particular evaluation part. For example, an explicit criterion related to the goal of achieving consistency with other planning efforts was not developed for the technology assessment but was used for the alignment screening. This is because there were not perceived to be significant differences between the ways different technologies would achieve this goal; however, there would be differences with transit alignments, which are specifically included in many of the planning efforts referenced. The specific criteria used for each of the screening evaluations are described in detail in the respective screening discussions.
For clarity, a summary is provided below of the goals that were used or not used in development of the criteria for each screening evaluation.
Final Alternatives Screening Memo Page 2-5 Honolulu High-Capacity Transit Corridor Project
• Modal Screening: All goals addressed,
• Technology Screening: Consistency with other planning efforts – not used as a base for criteria, and
• Alignment Screening: All goals addressed – cost efficiency and feasibility consolidated within one criterion.
Scoping Meeting Comments An important element of the screening process was the consideration of comments received during the public scoping process. The input received was considered during the definition and refinement of alternatives to be considered during the study.
Public scoping meetings were held on December 13 and 14, 2005, and comments were received by the Department of Transportation Services (DTS) through January 9, 2006. Public agencies and major stakeholders were invited to attend an agency meeting from 2:00 to 4:00 p.m. on December 13, 2005. Approximately 20 agencies were represented at the meeting. To obtain input from the local community, meetings were held in Downtown Honolulu the evening of December 13, 2005, and in Kapolei the evening of December 14, 2005. Approximately 650 people attended the two public meetings. The public identified many issues to be considered during this phase of the study. The key issues related to alternatives are summarized below. Several alternatives were identified that involve the construction of non-transit related facilities. However, those alternatives failed to meet the stated purpose and need of the project and are not being considered.
The only alignment identified that had not previously been reviewed during screening was Ala Moana Boulevard. It was subsequently evaluated using the same criteria previously used to evaluate all of the other alignments.
Several comments suggested either near-term or long-term improvements to the existing bus and handi-van transit system. No alternative alignments were proposed related to Alternative 3 (Managed Lanes) except for general comments suggesting that the system should be more widespread and applied to existing freeway lanes. Comments were received indicating that elevated bus-only lanes should be constructed. Other comments suggested that Alternative 3 should be evaluated as a reversible two-lane system rather than providing one lane in each direction of travel.
Commentors recommended the evaluation of fixed-guideway alignments along several routes. Aside, from the Ala Moana alignment, all suggested alignments were previously evaluated as part of the screening analysis documented in this report. Several comments and questions were asked about the configuration of the alternatives, and if alignments proposed as part of one alternative in a specific section could be combined with alignments proposed as part of a different alternative in other sections. Various comments pertained to profiles, enquiring about elevated, at-grade, and underground sections. Several suggestions for station locations along the fixed-guideway alternative were also included in the comments.
Page 2-6 Final Alternatives Screening Memo Honolulu High-Capacity Transit Corridor Project

Comments made on fixed-guideway technologies included a request to reconsider personal rapid transit. Speed and noise were two issues of concern that were identified for the technology alternatives.
Refinement of Alternatives The consolidated scoping meeting comments were critically analyzed to determine what changes should be made to the alternatives to be carried forward into the detailed alternative analysis. All recommendations and comments were considered, and the decisions resulting from the initial screening were re-evaluated in light of the scoping comments. The changes that resulted from the scoping meeting comments are described in Chapter 6, Post Scoping Alternative Refinement.
Final Alternatives Screening Memo Page 2-7 Honolulu High-Capacity Transit Corridor Project


Chapter 3 Concept and Technology Alternatives Considered
This chapter describes the concepts considered and the screening process used to develop the short list of those alternatives to be carried forward into more detailed analysis. The chapter includes a discussion of the screening of potential conceptual solutions and various types of transit technologies that can be used in the corridor regardless of the specific alignment location. Recommendations resultant from the concept and technology screening will be carried forward as the basis for deriving the alternatives considered in the Alternatives Analysis (AA).
Initial Concepts As a starting point for identifying potential solutions to address the needs of this project, the projects evaluated in the O‘ahu Regional Transportation Plan (ORTP) were referenced. The ORTP offers strategic packages that consider the islandwide transportation system impacts of various concepts. Based on these concepts, options were identified that were applicable within the corridor for this project, specifically between Kapolei and the University of Hawai‘i at Mānoa (UH Mānoa), confined by the Wai‘anae and Ko‘olau Mountain Ranges to the north and the Pacific Ocean to the south. All reasonable concepts were considered for their potential ability to meet the needs of the corridor. Most ground-based modes of transport were considered: highway, tunnels, and rail. Air and sea-based modes of transport were not considered because they do not offer a high enough frequency of service nor do they connect the variety of areas within the corridor well enough to be considered reasonable concepts. The concepts considered represent a range of reasonable alternatives to address the transportation issues identified in the corridor.
The reasonable concepts were evaluated in detail and analyzed for their ability to meet the needs of this project. Each concept was compared against the need to screen out those that did not meet the needs of this project. The concepts that meet all of the needs as defined in Chapter 1 will be carried forward for additional development and analysis as alternative solutions to be evaluated for the Honolulu High-Capacity Transit Corridor Project. Concepts that do not meet the needs of the project will be dropped from further consideration.
Overview of Concepts Considered This section describes the concepts that were developed for the screening analysis. Specific transportation improvement projects were grouped together to compare the performance of different transportation modes. Each of the alternatives is designed to focus on the specific transportation modes in response to the forecast congestion in the corridor in 2030.
The concept packages described below are the starting point for evaluation of effectiveness of different approaches to resolving the major transportation problems in the corridor.
Final Alternatives Screening Memo Page 3-1 Honolulu High-Capacity Transit Corridor Project

• No Build (included in each alternative) – Projects include improvements contained in the adopted 2025 O‘ahu Regional Transportation Plan, such as intelligent transportation system (ITS) projects, transportation demand management (TDM) projects, bicycle projects, and elements of the ‘Ewa Master Plan roadway system. These improvements are included in the aforementioned, fiscally constrained long-range plan and are expected to be implemented by 2025.
• Concept 1: TSM – The Transportation System Management (TSM) concept was designed to respond to the transportation issues in the corridor. These improvements are in lieu of major capital investment (i.e., fixed-guideway transit). The different types of projects in this alternative include contraflow lanes for high-occupancy vehicles (HOV) and buses on the H-1 freeway, regional bus rapid transit and major upgrades and improvements to the bus system.
• Concept 2: Managed Lane – This concept focuses on adding managed lanes for buses, HOVs, and toll-paying single-occupant vehicles (SOVs). The emphasis of these managed lanes is to provide an alternative to the fixed guideway along approximately the same alignment. This facility is reversible based on the peak direction of vehicle demand and consists of a two-lane elevated highway from the Waiawa Interchange to Iwilei with an intermediate access point at Aloha Stadium.
• Concept 3: Pearl Harbor Tunnel – This concept adds a combination of tunnels across Pearl Harbor to provide an alternative means of access from Kapolei/‘Ewa to Downtown Honolulu. The Pearl Harbor Tunnel is a toll facility with a flat rate per vehicle regardless of the number of occupants. This alternative also includes non-toll tunnels in the vicinity of Sand Island.
• Concept 4: Fixed Guideway – The main focus of this concept is the addition of a rapid transit fixed-guideway system to the corridor. The guideway runs from Kapolei to Downtown Honolulu and on to UH Mānoa.
Concept Screening To clearly distinguish which concepts would meet the needs of the project, they were evaluated in detail. The criteria used to evaluate the alternatives were based directly on the needs of the project. Each concept was screened on a pass/fail basis. If it met the needs as defined below, it passed. If it did not meet the needs, it failed. This initial screening intended to identify potential solutions to the problem. It is not intended to be a complete analysis. Therefore, as long as a concept did not worsen conditions and met the defined needs, it was viewed as having potential to improve the situation. A concept that failed to meet one or more needs would fail overall and would not be considered further. If a concept failed to meet the basic needs of the project, it would not warrant consideration as a potential solution, regardless of comparative performance. Quantitative measures were designed, where applicable, to provide measures of the effectiveness (MOEs) of the concept. Specifically, quantitative measures were designed to evaluate if the needs of improving mobility, providing faster, more reliable transit service and moderating traffic congestion were met by each concept. Where quantitative
Page 3-2 Final Alternatives Screening Memo Honolulu High-Capacity Transit Corridor Project

assessment was not feasible, a qualitative analysis was conducted to determine if the concept would pass or fail. The criteria are defined below:
• Improve mobility in the corridor: This quantitative criterion is designed to measure the overall effectiveness of the proposed concepts in improving mobility by increasing travel time savings and reducing vehicle hours of delay. If the concept does improve travel time savings and reduces the vehicle hours of delay, it “passes.” If it does not, it “fails.” Improving mobility is quantified through application of the following MOEs:
• Travel Time Savings – Travel time savings (relative to the 2030 No Build condition) was calculated from the model for travel from various parts of the island to two destinations of interest: Downtown Honolulu and Kapolei. This measure was evaluated for the morning peak period. The time savings was determined by calculating the change in travel time in minutes averaged across every model transportation analysis zone (TAZ) to Downtown Honolulu and to Kapolei.
• Vehicle Hours of Delay – Vehicle hours of delay, defined as the difference between vehicle hours traveled under congested conditions and vehicle hours of travel that would otherwise be expected under free-flow conditions, was calculated from OMPO model forecast data. This measure was evaluated on an islandwide daily basis.
• Provide faster, more reliable public transit service than currently exists: This quantitative criterion is designed to measure the concept’s effectiveness in providing faster and more reliable transit service than the current system can provide. All of the MOEs provide an indication of how well the transit system is performing. For example, a higher mode split for transit would indicate that the transit system is working well and enticing people to use it. Each MOE contributes to the overall picture of how well the transit system performs in each concept. This is a pass/fail evaluation. As long as concept performance is improved or constant across all MOEs compared to the existing system, it “passes.” If a concept performs worse on any MOE, it “fails.” The transit system MOEs are as follows:
• Mode Split – Mode split is the number of person trips made by single-occupant vehicles, carpool vehicles, transit, bicycle, and walk, as estimated by the OMPO Traffic Demand Forecasting Model (TDFM). This measure was evaluated on an islandwide daily basis for resident trips.
• Transit Ridership – Transit ridership statistics reveal the effectiveness of improvements made to the transit system. Projections of islandwide daily transit system ridership were obtained from the OMPO model.
• Average Vehicle Occupancy (AVO) – Average vehicle occupancy is a measure of travel efficiency obtained by dividing the number of persons
Final Alternatives Screening Memo Page 3-3 Honolulu High-Capacity Transit Corridor Project

traveling in private vehicles by the total number of private vehicle trips. This measure was evaluated for home-to-work peak-period trips.
• Average Vehicle Ridership (AVR) – Average vehicle ridership is another measure of travel efficiency, commonly used in air quality analyses. AVR is obtained by dividing the total person trips by total private vehicle trips. This measure was evaluated for home-to-work peak-period trips.
• Vehicle Miles Traveled (VMT) – Vehicle miles traveled were calculated from the OMPO model. VMT was evaluated on an islandwide daily basis.
• Vehicle Hours Traveled (VHT) – Vehicle hours of travel were calculated from the OMPO model. VHT was evaluated on an islandwide daily basis.
• Average Travel Time (minutes per trip) – Average travel time per vehicle trip was obtained by dividing the total daily vehicle hours of travel by the total daily vehicle trips islandwide.
Many of these MOEs are interrelated. For example, by encouraging higher mode split percentages for alternative modes, higher AVR and AVO would be achieved and VMT, VHT, and average travel time would be reduced.
• Provide an alternative to private automobile travel: This qualitative criterion is a pass/fail evaluation. If the concept does provide priority for transit vehicles, it is evaluated “pass.” Currently, transit vehicles experience the same delays and congestion as private vehicles. This is because the transit system current operates in mixed-flow traffic without specific priority. In order to truly provide an alternative to private vehicles, the transit system would have to provide, in some manner, prioritized use of facilities for transit vehicles. If the concept does not provide priority for transit vehicles, it does not provide a viable means of travel other than private vehicles and it is evaluated “fail.” That is, if the primary users of the system are private automobiles and there is no system priority for transit vehicles, it does not provide an alternative to private autos.
• Improve linkages within the corridor: This qualitative criterion is a pass/fail evaluation. There are four specific areas identified that need to be connected via this system. Although it is unlikely that one particular system will connect all possible combinations, any concept that will be considered must connect some of them. If a concept connects some of the areas specified, it will “pass.” If a concept does not connect any of the areas, it will “fail.”
• Moderate traffic congestion: This quantitative criterion is designed to measure the overall effectiveness of the proposed concepts in moderating traffic congestion. Congestion is defined as the condition when the demand for a facility exceeds a desired service capacity. Congestion can be measured by volume-to-capacity ratio and level-of-service (LOS) and by travel delay. If the number of screenlines operating at a poor LOS does not increase over the existing
Page 3-4 Final Alternatives Screening Memo Honolulu High-Capacity Transit Corridor Project

conditions, the concept “passes.” If the number of screenlines operating at poor LOS increases, the concept “fails.” Congestion moderation is quantified through the following MOEs:
• Screenline Level-of-Service – LOS was calculated for all major arterials crossing 11 screenlines located along the corridor to identify locations with congested operations. The analysis was conducted for both morning peak hour and afternoon peak hour conditions in both directions across each screenline. Traffic volumes used in the screenline LOS calculations were derived by extracting traffic volumes from the model for the morning and afternoon peak periods and converting the peak-period volumes to peak-hour volumes.
• The screenline LOS performance measure was evaluated by tallying the number of occasions when the screenlines are projected to operate at LOS E or F during either the a.m. peak hour or the p.m. peak hour in either direction. Thus, any given screenline could be counted as many as four times in the evaluation if it was projected to operate at LOS E or F in one or both directions during one or both peak hours.
Travel Demand Modeling The measures of effectiveness were calculated using a mathematical model representing the transportation system islandwide. The data were obtained from the OMPO TDFM. The OMPO model was used to forecast transportation conditions for the 2030 No Build and for each of the transportation concepts. The conditions were evaluated for three different time periods: daily, morning peak period, and afternoon peak period.
The OMPO model was modified to reflect the highway and transit improvement projects included in each of the concepts. Depending on the nature of the improvement, these modifications included programming new highway or transit links, modification of selected highway or transit attributes (for example, number of lanes or transit service frequency), programming new interchanges, etc.
For those concepts including highway toll facilities (the Managed Lane project in Concept 2 and the Pearl Harbor Tunnel in Concept 3), a one-way toll of $2.00 was assumed. For the rail transit project in Alternative 4, a one-way fare of $2.00 was assumed, with typical headways of 5 minutes and 10 minutes in the peak and off-peak periods, respectively, and average operating speeds of 30 miles per hour west of Downtown and 20 miles per hour from Downtown to UH-Mānoa/Waikīkī.
Concept Screening Results Table 3-1 summarizes the results of the concept screening. Each concept is listed with the resultant pass or fail for each screening criterion. The Pearl Harbor Tunnel concept is the only concept that fails to meet the needs of the project. It fails because it does not provide an alternative to private automobile travel and it does not directly connect any of the critical areas within the corridor. All other concepts meet the needs of the project. Detailed consideration of the performance results for each concept shows that some
Final Alternatives Screening Memo Page 3-5 Honolulu High-Capacity Transit Corridor Project

concepts may be better than others at improving the overall system performance, but they meet the needs of the project and have the potential to improve conditions. Table 3-1: Summary of Concept Screening
Criteria/ Need
Improve
Concept
Mobility
Faster, More
reliable Public Transit
Alternative to private
auto
Improve linkages
in corridor
Moderate traffic
congestion
Support growth
TSM Pass Pass Pass Pass Pass Pass Managed Lane Pass Pass Pass Pass Pass Pass
Pearl Harbor Tunnel Pass Pass Fail Fail Pass Pass
Fixed Guideway Pass Pass Pass Pass Pass Pass
Improve Mobility The quantitative analysis of this need indicated that all of the concepts improve mobility over the existing conditions. Each concept was compared to the 2030 No Build condition. The data from the No Build acted as a benchmark against which the concepts were compared. This provided an indication of how well each concept was able to improve mobility compared to the conditions if no project was completed.
The TSM concept decreased travel time the least – it is only 1.5 minutes faster than the No Build for trips into Downtown. The Fixed Guideway concept improved travel times the most, decreasing average travel time to Downtown by 5.6 minutes (a 16% improvement). The Managed Lane concept increased the travel time to Kapolei from other areas of the island by an average of 0.1 minute per trip, a 0.5% increase in travel time. However, this is such a small increase in the average, it does not warrant a fail for this criterion.
Vehicle hours of delay also decreased for all concepts. Again, the TSM improved the situation the least, and the Fixed Guideway improved it the most. TSM decreased the hours of delay by 11,000 hours per day, and the Fixed Guideway decreased the hours of delay by 33,000 hours per day (a 32.4% improvement). The Managed Lane and the Pearl Harbor Tunnel decreased the hours of delay by 19,000 and 25,000 hours per day, respectively. The model results are summarized in Table B-1 in Appendix B.
Provide faster, more reliable transit service Transit conditions do not worsen for all four concepts considered; therefore all four concepts pass the screening. Seven measures of effectiveness collectively expressed the performance of the concepts compared to the No Build. The data from the No Build
Page 3-6 Final Alternatives Screening Memo Honolulu High-Capacity Transit Corridor Project

acted as a benchmark against which the concepts were judged. This provided an indication of how well each concept was able to improve mobility from what would occur if no project was completed.
The Fixed Guideway concept illustrated the best improvement to the transit system. The mode split for transit increased by 42.4% over existing for a total of 8.4% of all trips on the island being made by transit. Transit ridership increased by 95,000 people per day (a 37.5% increase). The vehicle hours traveled (VHT) decreased by 52,000 hours per day (a 12.2% decrease). All of these values indicate that the Fixed Guideway is an effective transit system and is fast enough and reliable enough to attract new riders; it passes screening for this criteria. The TSM concept slightly improves the transit mode split (by 0.5%), vehicle miles traveled (VMT) by 0.8%, and VHT by 3.3%. Although these are not striking improvements, it passes screening because conditions do not worsen.
The Managed Lane and Pearl Harbor Tunnel concepts do not improve the transit characteristics of the system; none of the MOEs related to transit improve from current conditions. The Managed Lane results in an increase in the number of VMT, but an overall decrease in VHT. This indicates that this alternative actually encourages automobile transit, but improves the system enough that a higher volume of vehicles can be throughput per day. Although the direct transit-related MOEs do not improve, conditions do not worsen. The Pearl Harbor Tunnel improves the average travel time the most of all the concepts. Average travel time decreases from 12.4 minutes per vehicle trip in the No Build to 9.5 minutes per vehicle trip for the tunnel concept. All other MOEs do not improve appreciably, but conditions do not worsen. Therefore, the Managed Lane and Pearl Harbor Tunnel pass the screening for this need. The model results are summarized in Table B-2 in Appendix B.
Provide an alternative to private automobile travel
All concepts except the Pearl Harbor Tunnel provide alternatives to private automobile travel. The TSM, Managed Lane, and Fixed Guideway concepts provide priority for transit vehicles. The TSM and Managed Lane primarily operate buses and the Fixed Guideway operates a form of bus or rail technology. The Pearl Harbor Tunnel does not provide for transit vehicles as the primary user. Transit vehicles may be a secondary beneficiary of the tunnel system, but they would have to compete with private automobiles and be subject to the same travel conditions. The tunnel option does not give priority to transit vehicles and does not explicitly support priority for transit operations. Therefore, the tunnel option does not provide an alternative to private automobile travel and it fails the screening for this criteria. Table B-3 in Appendix B summarizes the screening.
Improve linkages within the corridor
The TSM and Fixed Guideway concepts both connect a majority of the critical areas within the corridor. The TSM is best able to service all areas because of the flexibility of the bus routes. The Fixed Guideway directly connects most of the critical areas and offers station stops to service the need for connecting all of the areas. One item of note is that the Fixed Guideway would connect all of the critical areas, including Waikīkī, to UH Mānoa if a Waikīkī spur is included in the project.
Final Alternatives Screening Memo Page 3-7 Honolulu High-Capacity Transit Corridor Project

The Managed Lane concept connects Kapolei and the Primary Urban Core directly and improves the connectivity to UH Mānoa and Waikīkī by decreasing the overall travel time from Kapolei to UH and Waikīkī. The Pearl Harbor Tunnel improves travel times islandwide, but does not improve travelers’ ability to access critical areas within the corridor. It does not provide better access to any of the critical areas. It provides better access between the ‘Ewa plain and Pearl Harbor, but after that point it does not provide other options or better connectivity to critical areas within the corridor. Table B-4 in Appendix B summarizes the screening
Moderate traffic congestion
The screenline levels-of-service indicate that none of the concepts make existing congestion worse. Therefore, all four concepts pass this screening criterion. The build concepts decrease the number of screenlines with an LOS of E or F, which illustrates that those concepts may aid in moderating traffic congestion compared to existing conditions. The TSM concept does not decrease the number of screenlines operating at LOS E or F; however, it does not worsen the situation and will be considered as a potential solution to addressing the project needs. Table B-5 in Appendix B summarizes the screening. Table B-6 in Appendix B provides an overall summary of the quantitative conceptual screening analysis.
Page 3-8 Final Alternatives Screening Memo Honolulu High-Capacity Transit Corridor Project

Technology Alternatives The development and screening of alternative transit technology options is documented in the Final Technology Options Memo (DTS, 2006). A summary of the process and its results follows.
A variety of alternative transit technologies were identified for the screening evaluation. These included conventional bus, guided bus, light rail transit (LRT), personal rapid transit (PRT), people movers, monorail, magnetic levitation (MAGLEV), rapid rail, commuter rail, other emerging rail concepts, and waterborne ferry service. The bus and rail modes operate in a number of different urban environments, including the following:
• Low-Speed in Mixed Traffic,
• Low/Medium-Speed in Limited Mixed Traffic,
• Medium-Speed in exclusive right-of-way, and
• High-Speed in exclusive right-of-way.
While the two mixed traffic types of service operate at-grade, the two exclusive right-of-way types of service can operate on elevated structure, at-grade, and/or in a tunnel.
Overview of Technologies Considered A brief overview of the functional characteristics of each technology that was considered in the corridor is provided below.
Conventional Bus
This technology category consists of conventional buses that include standard buses, which are12 meters (40 feet) in length, or articulated vehicles, which are 18 meters (60 feet) in length. A bus provides its own power from an on-board power plant (such as a diesel engine or diesel-electric hybrid) or obtains electric power from overhead catenary wires (trolleybus). Conventional buses are sometimes used in a Bus Rapid Transit (BRT) operating mode.
Guided Bus
The guided bus technology is similar to a conventional bus but it also includes features that allow for operations with guidance for precision docking or reduced guideway width operations. Examples range in length from 12 to 24 meters (40 to 80 feet). Guidance can be provided in a variety of ways, including a slot in the pavement, side guidance, embedded magnets, or stripes on the pavement. As with a conventional bus, a guided bus can be used in a BRT operating mode.
Final Alternatives Screening Memo Page 3-9 Honolulu High-Capacity Transit Corridor Project

Honolulu High-Capacity Transit Corridor Project
(LRT)Light Rail Transit
logy category has 18- to 27-meter (60- to 90-foot) long vehicles that can be combined
shorter
t lectric po
tions.
Personal Rapid Transit (PRT)
The steel rail-based techno
into multi-vehicle trains. Most examples include articulation to improve maneuverability. Versions of this technology that are sometimes narrower and have sections between articulations may be termed Streetcar Trams. Power is usually obtained from overhead catenary wires (required for mixed traffic operations), buthird rail applications also exist. Onboard diesel-eDiesel Multiple Units configured for light-rail-type applica
wer plants also exist on
nded to operate directly between a passenger’s origin and destination with short PRT is a technology that is inte
headways between vehicles. The mode envisions using a large number of automated, small vehicles (two to ten passengers) on an exclusive, separated guideway. One small system is operating today in Morgantown, West Virginia, and several other concepts are under development.
People Movers
has a wide range of vehicle lengths. For the Honolulu application only medium-length
, ed
m
This technology
vehicles of about 12 meters (40 feet) in length are considered. These vehicles operate in an automaticdriverless mode on rubber tires that can be combininto short, multi-vehicle trains. Power is obtained froa third rail.
Monorail
This is a technology that features trains that straddle an elevated guideway beam with rubber load and
ird
guide tires running along the beam beneath the cars. Both large and medium-sized versions of these trains exist. Large versions feature wider, longer and higher vehicles. Power is obtained from a thrail.
Page 3-10 Final Alternatives Screening Memo

Honolulu High-Capacity Transit Corridor Project
agnetic LevitationM
hat uses magnetic force to support the vehicle above guide rails and linear
ed
top
apid Rail Transit
This is a technology t
induction motors to propel them. Power is obtainfrom a third rail. As related to other MAGLEV applications, the technology under consideration in this study is “low speed MAGLEV” which has aspeed of about 80 to 100 kilometers per hour (50 to 62 miles per hour).
R
ased technology category that features vehicles 15 to 23 meters (50 to 75 feet) in
into arge
This is a steel rail-b
length, without articulations, that can be combinedlong trains operating at high speeds. Medium and lversions of these vehicles also exist with the difference being the individual vehicle lengths. Power is usually obtained from a third rail.
Commuter Rail
This is a rail technology with trains consisting of one or mcars pulled by a locomotive. The locomotive is typically a diesel-electric. Station
thers.
ore non-powered passenger
spacing is typically four or more miles apart. The trains are compatible with freight rail trains (track gauge) and typically operate in mixed-rail traffic over track owned by o
Other Emerging Rail Concepts
This technology category includes technology concepts that are still in the developmental stages. These technologies include the Futrex monorail, Cybertran Group Rapid Transit, Aeromovel, and Aerobus suspended monorail.
Waterborne Ferry Service
This ship-based technology category provides point-to-point waterborne transit service for
or nal
sels and n
locations proximate to bodies of water. It is typically applied in locations of special needsconstraints that are not well served by traditiobus or rail systems. Specific waterborne technologies within the Ferry Service category include Mono Hull vessels, Dual Hull vesHydrofoils. Mono Hull vessels are most commoand operate at slower speeds with 150-foot long
Final Alternatives Screening Memo Page 3-11
vessels. Dual Hull vessels, also known as Catamarans, are typically built of lighter weight materials with 150 to 200-foot vessels operating at moderate speeds. Hydrofoiltravel above the water surface on metal struts called foils that allow higher operatingspeeds. Hydrofoil vessels are relatively expensive and require deep channels.
s
Technologies Screening s goals and objectives as identified in Chapter 2, all potential
m
the d that
• Technical maturity
To achieve the project’technologies were assessed in a two-step screening process against criteria derived frothe stated goals and objectives. In the first step, all technologies were screened against five initial criteria that identified fatal flaws and illuminated major operational differences between the identified technologies. If the technology did not meetminimum low rating in any one of these categories, it was considered a fatal flaw antechnology was eliminated from further consideration.
The initial level screening criteria were as follows:
: The technology category should be beyond the prototype
ity
•
development stages and its use demonstrated. Service-proven technologies increase the certainty of project cost and reduce schedule risk. This criterionprovides an indication of how well the goals of cost-effectiveness and feasibilcan be met.
Line capacity: The technology category should be capable of a moderately high
it is
ther
•
minimum line capacity of passengers per hour per direction (pphpd) to meet the preliminarily projected low end of passenger ridership estimates for the planninghorizon of year 2030. At this stage of the project a detailed travel-demand estimate has not been produced; however, from earlier work in the corridor assumed that a minimum threshold of between 3,000 and 5,000 pphpd will need to be accommodated by the technology. Passenger capacity will be measured fora technology’s minimum and maximum train length (for those that can be entrained). This criterion relates to the goal of mobility by identifying whethe projected number of transit riders in the corridor can be accommodated by a given technology.
Cruise speeds: The technology category should have technologies that are ) for
•
capable of maintaining cruise speeds of at least 43 to 62 mph (70 to 100 kpheffective line haul operations within the 23-mile (37-kilometer) corridor. This criterion also relates to the goal of mobility in terms of eliminating technologiesthat cannot maintain speeds high enough to improve mobility within the corridor.
Station/stop spacing: Since the corridor includes several different activity centers, the technology category should be appropriate for transit services with both long station/stop spacing (1 mile (1.6 kilometers) or more in outlying areas) and relatively short station/stop spacing (0.25 to 0.5 mile (0.4 to 0.8 kilometer) iurban core areas). In addition, the technology category should be able to servedestinations through the length of the corridor. This criterion relates to both thegoals of mobility and smart growth/economic development in terms of the level oaccessibility the technology can provide for a given area and its activity centers,
n
f
Page 3-12 Final Alternatives Screening Memo Honolulu High-Capacity Transit Corridor Project

as well as how effectively the technology can support connections between existing and likely origin and destination pairs with appropriate station spaci
Activity center access
ng.
• : The technology category should be able to access the key activity centers in the Corridor. This criterion relates to the goals of mobility and smart growth and economic development. If the technology is capable of linking existing activity nodes, then accessibility is improved and economic development is enhanced if it connects activity areas that were previously difficult to access. Additionally, if the technology can connect planned activity nodes, it supports smart growth by supporting the accepted area plans.
hrough this analysis, the following four technologies were screened out: personal rapid
le
the
he retained technologies were then screened against more detailed criteria, similar in st
d for
d
maturity
Ttransit (PRT), emerging technologies, commuter rail and waterborne ferry service. PRT had limited technical maturity and low cruise speeds. Emerging technologies were lacking technical maturity since none has proven to be stable enough to create reliabcost or implementation schedule estimates. Commuter rail would not meet the requiredstation spacing within this corridor, particularly within the urban core. And finally, water ferry service would not meet the line capacity requirement or, because of its confinement to waterways, the ability to service many of the key activity centers incorridor. Therefore, none of these technologies will be retained for further considerationfrom this point forward. Tnature to the initial criteria, to compare potential performance of the technologies againthe goals of the project. The transit technologies under consideration were grouped based on the four types of transit service the technology typically serves and screeneperformance within each group. Since it is undetermined whether the alternative will be fully exclusive right-of-way or a mixed traffic operation, this screening identified potential line-haul technology for both mixed traffic and exclusive right-of-way anpotential feeder service for the line haul portion of the alternative. Evaluation criteriawere as follows:
• Technical : The technologies to be selected for combining with specific
cation
•
alignments must minimize risk from technical, schedule and cost perspectives. Technical maturity is measured in terms of operating service years, number of operating applications, and reliability of operating systems. This criterion supports the goals of cost-effectiveness and feasibility by providing an indiof the cost certainty and schedule risk.
Line capacity: Selected technologies must have the capacity to accommodate the
nd
accommodated by a given technology.
travel demand for the planning horizon of year 2030. At this stage of the project adetailed travel-demand estimate has not been produced; however, from earlier work in the corridor it is assumed that a minimum threshold of between 3,000 a5,000 pphpd will have to be accommodated by the technology. Capacity will be measured for a technology’s minimum and maximum train length (for those that can be entrained). This criterion relates to the goal of mobility by identifying whether the projected number of transit riders in the corridor can be
Final Alternatives Screening Memo Page 3-13 Honolulu High-Capacity Transit Corridor Project

Performance: Because of the distances between various activity centers being connected by the project, technologies
• should achieve relatively fast travel times.
• M
Higher operating speeds will result in faster travel times which, in turn, will promote system use. This criterion relates to the goal of improved mobility.
aneuverability: Technologies must be able to physically operate within the corridor. Maneuverability relates to the right-of-way requirements for a technology given its performance capabilities and constraints with regard to thgeometry of proposed alignments. This is measured in terms of a technology’achievable minimum curve radius for the horizontal alignment and by the maximum grade for the vertical alignment. This criterion was derived from the goal of feasibility. In order for the technology to be feasible, it must be able to maneuver through the corridor within the natural and man-made constraints and work within the potential alignment elevations so it will not limit the alignment options.
Costs/Affordability
e s
• – The selected technologies should be cost-effective given the type of service (mixed traffic versus exclusive ROW) they provide. Costs are
•
considered in terms of general annualized capital costs, O&M costs, cost variability (technologies’ ability to be at-grade as well as elevated) and the cost of extension (supplier competition for system extensions). This criterion provides an indication of the technologies’ ability to be both cost-effective and financially feasible.
Environmental – The resulting exhaust and noise emissions generated by the technology should be acceptable within the corridor. This criterion measures the
•
technologies’ ability to have minimum community or environmental impact.
Safety – Technologies must meet local and national life/safety requirements. The transit operations should be inherently safe or the design of the system can
•
accommodate safety concerns in a cost-effective manner. This is measured in terms of right-of-way exclusivity. This criterion relates to the technologies’ ability to have minimum community or environmental impact.
Supplier Competition – A sufficient number of suppliers of the technology neto be available to foster price competition on the project to obta
ed in a cost-effective
•
system. This criterion provides one indication of the potential cost-effectiveness of a technology.
Implementation Time – This criterion considers the relative time for planning, design, permitting/funding and construction of the system. This criterion relates
•
to the accomplishment of the goal of being feasible in terms of political and public acceptance of the implementation time.
Accessibility – Selected technologies must comply with the Americans with Disabilities Act requirements. Vehicle boarding ease is another measure within
t this criterion and considers whether “level-boarding” occurs with a given technology. This criterion relates to how well a technology will allow the projecto achieve the goal of equity by allowing equal access to the technology for disabled users.
Page 3-14 Final Alternatives Screening Memo Honolulu High-Capacity Transit Corridor Project

The res
ults of this screening analysis are described below.1
Conventional Bus (40 and 60 foot) – This technology primarily provides the Mixed t can also provide exclusive
oot buses versus 60-foot buses Traffic and Limited Mixed Traffic types of transit service. Iight-of-way type of transit service. The advantage of 40-fr
can be determined when detailed travel demand numbers are available. Advantages – This technology has absolute advantages in technical maturity, maneuverability, costs (at-grade), supplier competition and implementation time. The echnology scored highly for Mixed Traffic and Limited Mixed Traffic tt ypes of service.
Disadvantages – This technology scores somewhat lower than most other technologies line capacity and performance. The technology scores “Moderate” for both exclusive ight-of-way types of transit service. For accessibility, in terms of ease of boarding, it
in
rscores “Moderate” due to lack of level boarding. It scores “Poor” in terms of safety, primarily because of the potential for increased conflicts with other vehicles in mixed flow operations. Recommendation – The conventional bus is a possible technology for alternatives withsignificant portions of mixed traffic operations, although higher travel demand volumedetermined later
s
in the study) would favor the articulated bus over the standard bus for
(line-haul service. The standard bus is recommended for consideration in terms of providing feeder service to a line-haul alignment. Both can also be considered for analysis for line-haul alternatives in exclusive right-of-way operations though articulatedbuses can accommodate higher demands.
Guided Bus – This technology primarily provides Limited Mixed Traffic and Medium-Speed exclusive right-of-way types of transit service. It can also provide Mixed Traffic nd High-Speed exclusive right-of-way service. The guidance is assumed at bus stops a
and would allow level boarding. Advantages – This technology has an advantage in maneuverability and scores well in line capacity for both exclusive right-of-way types of transit service. Disadvantages – This technology has disadvantages compared to other bus technologiesin technical maturity and supplier competition.
Recommendation – A guided bus is a possible technology for the exclusive right-of-way operations. It scored poorly for mixed traffic operations in general and is therefore not recommended for feeder service or line-haul service in mixed traffic operations. 1 A more thorough discussion of transit technologies and their use is provided in another study document titled Final Technology Options Evaluation Memo, prepared by Lea+Elliott and Parsons Brinckerhoff, February 2006.
Final Alternatives Screening Memo Page 3-15 Honolulu High-Capacity Transit Corridor Project
Streetcar Tram – This technology primarily provides the Mixed Traffic and Limited Mixed Traffic types of transit service. It can also provide exclusive right-of-way type otransit service, though this is not typical.
f
Advantages – This technology has advantages in maneuverability, costs (at-grade onlyenvironmental, supplier competition and accessibility.
),
isadvantagesD – This technology scored moderately in technical maturity and line
is to transition from mixed affic to exclusive right-of-way along an alignment, there are technical issues (power
the
capacity in relation to other technologies. It also only scored moderately in terms of performance in mixed traffic services. If the technologytrcollection, visual impact) that will be challenging. The technology scores poorly inthree types of service it was screened within. Recommendation – Streetcar Tram is not recommended because it scores lower than other LRT technologies in both mixed traffic and exclusive right-of-way operations. Thtechnology can maneuver well in mixed traffic applications, but th
e e study corridor may
ave only limited sections of mixed traffic operations.
h
Light Rail Vehicle – This technology primarily provides the Mixed Traffic and Limited Mixed Traffic types of transit service. It can also provide exclusive right-of-way type oftransit service.
Advantages – This technology had advantages in maneuverability, costs (at-grade only), environmental, supplier competition and accessibility. The technology scored highly overall for moderate and high speed operations in both mixed traffic and exclusive right-
f-way. o Disadvantages – This technology scored only moderately in performance in mixed trafservices. If the technology is to transition from mixed traffic to exclusive right-of-way along an
fic
alignment, there are technical issues (power collection, visual impact) that will e challenging. b
Recommendation – Light Rail is a strongly recommended technology for alternatives with limited portions of mixed traffic and predominately exclusive right-of-way, althoughthe transition betw
een the two types of service will pose technical challenges (power
ollection and visual impact). This technology is also recommended for analysis for calternatives with exclusive right-of-way. Diesel Multiple Unit (DMU) – This technology provides the Limited Mixed Traffic types of transit service. It can also provide exclusive right-of-way type of transit servthough this is not its typical application.
ice,
Advantages
– This technology has absolute, but not relative, advantages in safety and accessibility.
Page 3-16 Final Alternatives Screening Memo Honolulu High-Capacity Transit Corridor Project

Disadvantages – This technology scores only moderately in technical maturity, supplier competition and environmental compared to other technologies considered here. Recommendation – In comparison to other technologies in the LRT category, DMU scores poorly in the three types of service it was screened within and is not recommended
r inclusion in the alternatives analysis. fo Personal Rapid Transit (PRT) – This technology would provide the Medium-Speed,
clusive right-of-way type of transit service. ex Advantages – PRT has the potential to score well in terms of maneuverability, cost/affordability, and accessibility. Disadvantages – PRT scores poorly in terms of technical maturity, line capacity, and supplier competition for line-haul or feeder service. Recommendation – PRT’s lack of technical maturity and line capacity are viewflaws, especially given the implemen
ed as fatal tation schedule of this project. The technology is
ot recommended for inclusion in the alternatives analysis.
n
People Mover – This technology only provides Medium and High-Speed, exclusive right-of-way type of transit service.
Advantages – This technology has advantages in technical maturity, line capacity, maneuverability, environmental, safety and accessibility. The technology scores highly for both medium and high-speed exclusive right-of-way types of transit service. Disadvantages – This technology scores only low/moderate in cost. Although it scores
trinsically low in terms of implementation time for exclusive right-of-way technology inapplications, it scores higher than other technologies in this category. A slight disadvantage is found in performance as the technology’s top speed is below that of the higher capacity rail technologies. Recommendation – Automated People Mover is a strong technology for alternatives witonly exclusive right-of-way and should be included in the alternatives analysis. This technology is also a strong technology for feeder service serving high demand amay not be served by the line-haul alignment (e.g., Waikīkī, Airport).
h
reas that
onorail – Medium and LargeM – This technology only provides Medium and High-
Speed, exclusive right-of-way type of transit service. The advantage of Medium versus Large Monorail can be determined when detailed demand numbers are available. Advantages – This technology has advantages in technical maturity, line capacity (large monorail only), environmental, safety and accessibility. The technology scores
Final Alternatives Screening Memo Page 3-17 Honolulu High-Capacity Transit Corridor Project

moderately for both medium and high-speed exclusive right-of-way types of transit service. Disadvantages – This technology scores poorly in cost. Although it scores intrinsically
in terms
mpared to the higher capacity rail technologies. The larger curve radius quirements of Large Monorails would impact potential alignment geometry and this
low in terms of implementation time for exclusive right-of-way technology applications, it scores higher than other technologies in this category. It scores low/moderate of supplier competition. Monorails have a slight disadvantage in performance (top speed) coremust be considered during the detailed alternative analysis, Recommendation – Both Medium and Large Monorail score “good” for line-haul alternatives with exclusive ROW and are recommended for inclusion in the alternatianalysis, although they were not among the highest scoring. Medium Monorail is apotential candidate for feeder service (i.e., Waikīkī, Airport).
ves lso a
AGLEVM – This technology only provides Medium and High-Speed, exclusive ROW
type of transit service. Advantages – The MAGLEV technology has advantages in line capacity, environmental, safety and accessibility. Disadvantages – This technology scores “poor” in cost and supplier competition. Because this technology requires a lengthy implementation process, it scored a lower
plementation time compared to other exclusive ROW technology applications. It
ecommendation
imscores “moderate” in terms of technical maturity and maneuverability. R – MAGLEV scores in the low end of the “good” range within both
g of ves
edium Rapid Rail Vehicle
Moderate- and High-Speed exclusive ROW service types. It was the lowest scorinthe fixed guideway technologies but is still recommended for inclusion in the alternatianalysis. It is not recommended for feeder service. M – This technology only provides Medium and High-Speed,
d exclusive right-of-way type of transit service. This technology can be either automateor manually driven. The findings presented below assume a non-automated system. Findings for automated medium rapid transit are similar to that of People Mover but with slightly better performance (top speed). Advantages – This technology has advantages in technical maturity, line capacity, performance, environmental, safety, supplier competition and accessibility. The technology scores highly for both Medium and High-Speed exclusive right-of-way typof transit service.
es
isadvantagesD – This technology scores moderately in cost. It also scores low, though ht-of-better than other rail technologies, in terms of implementation time for exclusive rig
way technology applications.
Page 3-18 Final Alternatives Screening Memo Honolulu High-Capacity Transit Corridor Project

Recommendation – Medium Rapid Transit is a strong technology for alternatives with nly exclusive right-of-way and should be included in the alternatives analysis. o
Large Rapid Rail Vehicle – This technology only provides Medium and High-Speed, exclusive right-of-way type of transit service. This technology can be either automated
r manually driven. The findings presented below assume a non-automated system. o Advantages – This technology has advantages in technical maturity, line capacity,
erformance, environmental, safety, supplier competition and accessibility. The f
isadvantages
ptechnology scores high for both Medium and High-Speed exclusive right-of-way types otransit service. D – This technology scores only moderately in cost. It also scores low,
nsit,
ecommendation
though relatively well, in terms of implementation time for exclusive right-of-way technology applications. It is slightly less maneuverable than Medium Rapid Trawhich could limit its effectiveness in the Downtown Honolulu area. R – Large Rapid Transit is a strong technology for alternatives with only
exclusive right-of-way and should be included in the alternatives analysis.
Commuter Rail – This technology primarily provides the High-Speed, exclusive rightof-way type of transit service.
-
Advantages – Commuter Rail has the potential to score well in terms of technical maturity and line capacity. Disadvantages – This technology scores poorly in terms of maneuverability, cost/affordability (no existing freight tracks to use) and accessibility. Recommendation – Commuter Rail’s lack of maneuverability makes it inappropriaserving the Downtown porti
te in on of the corridor. The lack of existing freight tracks take
way from the technology’s inherent cost/affordability advantage. a Emerging Rail Concepts – This group of technologies would primarily provide the
edium-Speed, exclusive right-of-way type of transit service. M Advantages – Advantages potentially include maneuverability, cost/affordability, and accessibility. Disadvantages – This group of technologies scores poorly in terms of technical maturline capacity and supplier competition.
ity,
Recommendation – The lack of technical maturity for Emerging Rail Concepts is viewas a fatal flaw
ed given the implementation schedule for this project. This group of
chnologies is not recommended for inclusion in the alternatives analysis. te
Final Alternatives Screening Memo Page 3-19 Honolulu High-Capacity Transit Corridor Project

Technologies Screening Results Summary
sidered eds,
ation/stop spacing, and activity center access. As a result of the initial screening, the liminated from further consideration: ologies, commuter rail, and waterborne ferry
n to
As a stand-alone technology, however, it rates somewhat lower in comparison to other technologies in terms of satisfying Goals 1, 2 or 3. The
ot
, for
s of buses
m and
d-flow to other
LRT technologies for both mixed traffic and exclusive ROW operations.
ple
The project team has the option to suggest a single technology for an alternative, multiple
Using the conceptual-level screening criteria described in Chapter 2, a technology was eliminated if it failed to satisfy one or more of the screening criteria. Factors conin the initial screening included technical maturity, line capacity, cruise spestfollowing four technology categories were epersonal rapid transit (PRT), emerging technservice. The results of the second level technology screening are summarized in Table 3-2 at the end of this section.
It is assumed that conventional bus will be included in the No Build and TSM alternatives and will be incorporated into each build alternative in a modified fashioserve as a component of the background bus system that will feed and complement each rapid transit build technology. Conventional bus would also be the technology used in the Managed Lane Alternative.
lower rating in terms of Goal 1, Improve Corridor Mobility, is because it does nprovide the same level of high-capacity transit service that other technologies can and, when operating in mixed traffic, it cannot provide predictable, reliable travel times. However, it can provide higher capacity, speed and reliability when operating in exclusive rights-of-way. Similarly, for Goal 2, Encourage Patterns of Smart Growth and Economic Development, typical bus stops and transit centers are unlikely to generate significant development opportunities in comparison to other technologies. FinallyGoal 3, Find Cost-Effective Solutions, conventional buses, based on their smaller carrying capacity, do not provide the high-capacity operating efficiency as other typevehicles. Additionally, construction of exclusive ROW facilities and stations for are typically more expensive than other fixed guideway facilities because of the additional size (primarily width) required to accommodate conventional buses.
Of the different rail technologies examined, it is recommended that the streetcar traDMU be dropped from further consideration. The tram should be dropped because it does not satisfy Goal 1 (Improve Corridor Mobility); it does not provide high-capacity type service; and it does not provide reliable travel times when operating in mixetraffic. The DMU should be dropped because it scores lower overall in relation
Based on this analysis, it is recommended that conventional bus, guided bus, LRT, peomover, monorail, MAGLEV and rapid transit technologies be retained for further study as potential line haul technologies operating in an exclusive right-of-way. Table 3-2 (at the end of this section) summarizes the results of the technology screening.
technologies for an alternative, or a “composite” range of technologies that score high within the type of service that is applicable for a given alternative.
Page 3-20 Final Alternatives Screening Memo Honolulu High-Capacity Transit Corridor Project

Depending on the project delivery (procurement) strategy that is chosen, it may be possible to let the marketplace decide the most appropriate technology through a “performance” rather than a “detailed design” specification process. This turnkey
t in lower capital
procurement process has been used for some urban transit systems, such as those in Miami, Jacksonville, Detroit, San Juan, and a number of lines in New Jersey that wouldallow for greater competition among technology suppliers and resulcosts.
Final Alternatives Screening Memo Page 3-21 Honolulu High-Capacity Transit Corridor Project

Table 3-2: Summary of Technology Screening
Technology Advantages Disadvantages Recommendation
Line Haul Feeder
Mixed Excl. ROW
Conventional Bus - Singe Unit (40’)
- Good maneuverability - Low cost for at-grade - Good technical maturity - Short implement time
- Low line capacity in mixed traffic - Low performance in mixed traffic - Low safety in mixed traffic - Moderate environment
R R R
Conventional Bus - Articulated (60’)
- Good maneuverability - Low cost for at-grade - Good technical maturity - Short implement time
- Low performance in mixed traffic - Low safety in mixed traffic - Moderate environment
R R R
Guided Bus - Good maneuverability - Supplier competition - Poor technical maturity D D R
Streetcar Tram - Good environmental - Low cost for at-grade
- Supplier competition - Poor performance - Low line capacity
R D D
Light Rail Vehicle - Good performance - Low cost for at-grade - Supplier competition - Can operate all types of transit service
- Moderate line capacity in mixed traffic - Poor Safety - Maneuverability
D R R
Diesel Multiple Unit - Accessibility - Moderate maturity - Poor performance - Maneuverability - Moderate environment
D D D
People Mover - Accessibility - High line capacity - Good safety & maturity
- High cost - Lower top speed - Maneuverability
R D R
Monorail - Medium and Large
- Good safety & access - High line capacity
- High cost – low supply - Poor maneuverability R D R
MAGLEV - High line capacity - Good environmental - Good safety
- High cost - Supplier competition - Poor technical maturity
D D R
Rapid Transit - Medium and Large
- Good technical maturity - High passenger capacity - Good environmental - Good performance - Good safety and access
- Moderately high cost - Moderate maneuverability D D R
Legend: R = Retain for Alternatives Analysis
D = Drop
Page 3-22 Final Alternatives Screening Memo Honolulu High-Capacity Transit Corridor Project

Chapter 4 Fixed Guideway Alternative Alignment Analysis
To facilitate the assessment of alignment options for the fixed guideway alternative, the 23-mile long corridor was divided into eight geographic sections (see Figure 4-1: Corridor Map With 8 Sections ). The sections, identified from the Wai‘anae to Koko Head direction, were defined based on logical termini and the existence of existing transportation facilities, travel origins/ destinations, and neighborhood boundaries. The evaluation of alignment options and the results of this analysis will provide the basis for identifying corridor-length alignment alternatives for detailed study.
The alignments were evaluated against a set of criteria derived from the stated project goals and objectives. The screening differentiated the characteristics of the alignments within each section. The aim of the comparison was to distinguish between alignments within a particular section, not against particular benchmarks. Since each section has unique characteristics, the alignments were comparatively evaluated, not intrinsically evaluated (i.e. similar alignment characteristics may warrant different ratings in different sections). In two sections, fatal flaws were identified on alignments. The existence of one fatal flaw eliminated that alignment from further analysis. These are noted in the summary tables.
The screening criteria are consistent with the goals and objectives of the project and are a precursor to the much more detailed project justification criteria that FTA uses in their New Starts evaluation process. Each alignment was evaluated using these criteria and was assigned a comparative rating of high, medium or low. Five specific criteria are defined below:
• Mobility – the more transit riders that are served by the alignment, the higher the rating. Distance from major activity centers, service to known low-income, transit-dependent communities, and projected 2030 population and employment densities within ¼-mile of the alignment were considered. While this criterion reflects the goal of mobility, it also included considerations for the goal of equity by considering the service to known low-income, transit-dependent communities.
• Smart Growth and Economic Development – the orientation of the alignment serving developing areas or areas of existing high density would indicate a greater ability to promote transit oriented development as well as general economic development and merits a higher rating. This criterion is based on the goal of smart growth and economic development.
• Constructability and Cost – the easier to construct and the lower the anticipated cost, the higher the rating. Shorter alignments, alignments with more available space, and alignments that have at-grade options would cost less and have higher ratings. This criterion speaks to the goals of cost effectiveness and feasibility. Because the goal of cost effectiveness is heavily dependent on ridership forecasts, it was difficult to measure at this point in the screening process. Therefore, this
Final Alternatives Screening Memo Page 4-1 Honolulu High-Capacity Transit Corridor Project

Page 4-2 Final Alternatives Screening Memo Honolulu High-Capacity Transit Corridor Project
criterion considered mostly cost with the idea that lower costs would lead to higher cost effectiveness. This criterion addresses the goal of feasibility mainly from the engineering and potential political feasibility aspects. Because these are all fixed guideway alignments, the financial feasibility was considered generally similar for all fixed guideway alignments and was not a major distinguishing element of the screening.
• Community and Environmental Quality – the lower the negative impacts the higher the rating. For example, alignments through a residential community, alignments that reduce highway capacity by taking lanes, and/or alignments with high construction impacts on traffic have low ratings. This criterion is related to the goal of community and environmental quality.
• Planning Consistency – the more consistent the alignment is with current adopted plans the higher the rating. Current plans include the ‘Ewa Development Plan, the Central O‘ahu Sustainable Communities Plan, the Primary Urban Center Development Plan, the Kalaeloa Master Plan, and the Kapolei Area Long Range Master Plan. This criterion is derived from the goal of being consistent with adopted community plans and mirrors the analysis factors included in the goal definition.
The projected population and employment estimates within ¼-mile of each alignment (shown in Appendix A) were determined by analyzing data from OMPO’s 2030 travel demand forecasting model. Population and employment estimates are stored by the model by “transportation analysis zones,” or TAZs. The population and employment estimates within ¼-mile of each alignment were calculated by applying a ratio of the TAZ area within a ¼-mile to the total population and employment contained within the total TAZ. This calculation method is judged to be adequate for the Level 1 analysis, although the projections may not be accurate if the population and employment within a TAZ are not evenly distributed.
Alignment Descriptions and Analysis Analysis of each section is supplemented by a map of all the alignments evaluated within each section, a performance chart comparing alignments against each other within each section, and a table of population and employment data. The alignment maps are labeled as Figure 4-2–Figure 4-9 according to the section number and can be found within the discussion of each alignment. The alignment comparison charts are labeled Table 4-1 - 4-8 according to the section number and are grouped together at the end of the alignment analysis section of this report. The detailed population and employment data tables for each section are found in Appendix A.
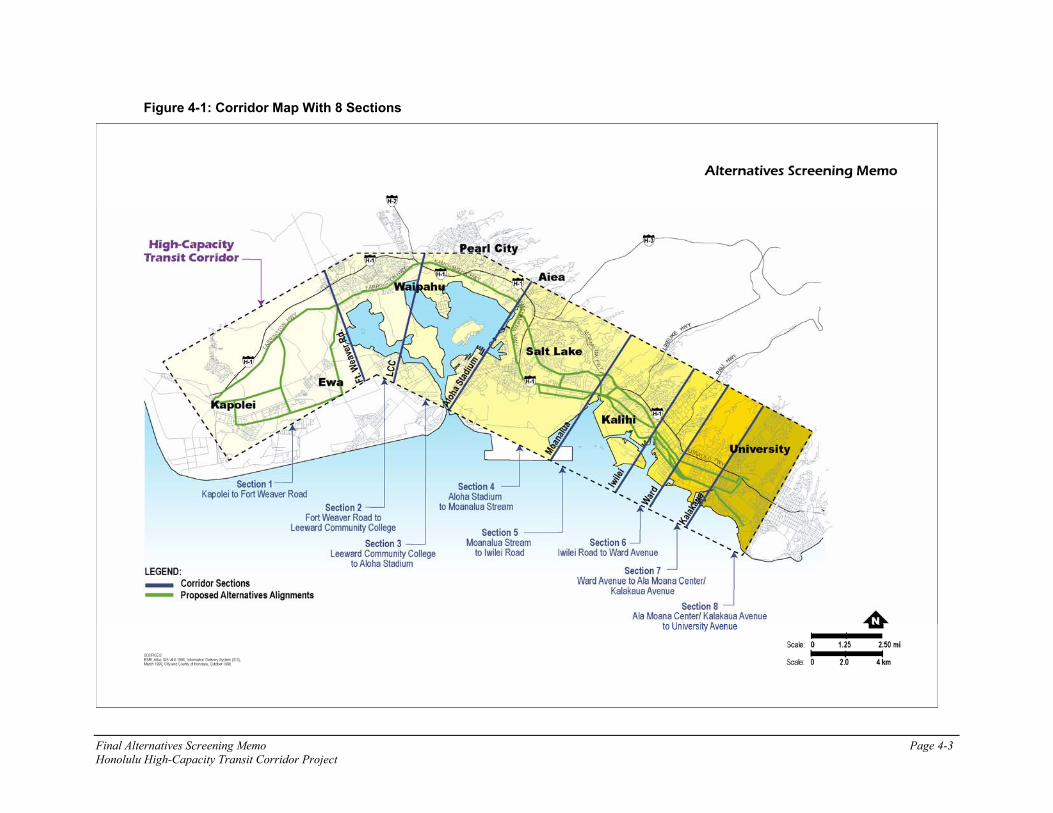
Screening Memo Page 4-3
Figure 4-1: Corridor Map With 8 Sections
Final AlternativesHonolulu High-Capacity Transit Corridor Project

Section 1: Kapolei to Fort Weaver Road Description: The greatest opportunities for transit oriented development in the corridor exist in Section 1. Much of the area is currently undeveloped and the ‘Ewa Development Plan supports growth to become a Secondary Urban Center for O‘ahu. Within this section, seven different alignment options were considered, all of which could include use of transit vehicles operating at-grade or on elevated structure. Beginning at the proposed Kapolei Transit Center on the Wai‘anae side of Kalaeloa Boulevard, these alignments include the following:
1.1 Kapolei Parkway to Wākea Street to the H-1 Freeway (at-grade or elevated),
1.2 Kapolei Parkway to Kamokila Boulevard to Farrington Highway (partially at-grade or elevated),
1.3 Kapolei Parkway to Fort Barrette Road to Farrington Highway (partially at-grade or elevated),
1.4 Kapolei Parkway to North-South Road to Farrington Highway (at-grade or elevated),
1.5 Kapolei Parkway to Wākea Street extension to the O‘ahu Rail & Land (OR&L) railroad right-of-way, or use of Renton Road to Fort Weaver Road (at-grade),
1.6 Kapolei Parkway to Wākea Street extension to Saratoga Avenue to extensions of Saratoga Avenue and North-South Road (at-grade or elevated), and
1.7 Kapolei Parkway to Wākea Street extension to Saratoga Avenue to extension of Saratoga Avenue to Geiger Road to Fort Weaver Road (at-grade or elevated).
See Figure 4-2 for a map with the alignments.
Analysis: The Wākea Street to H-1 Freeway alignment provides an opportunity to construct an at-grade guideway in the median of the H-1 Freeway. In the median, there are no conflicts with access ramps leading to or from the freeway. However, this alignment conflicts with construction of HOV lanes in the median, as proposed in the 2030 Regional Transportation Plan. This alignment is located away from central activity areas, provides a poor connection between existing and future employment and residential centers, and has little opportunity for transit oriented development. Along any of the H-1 Freeway alignments, access to the guideway by pedestrians, bicyclists, and vehicles would generally be limited to cross street locations. In this, and most of the sections, there are no frontage roads or public access adjacent to the H-1 freeway.
Alternatively, Kamokila Boulevard to Farrington Highway is more centrally located, travels through a more densely developed area, and is along a direct route heading to
Page 4-4 Final Alternatives Screening Memo Honolulu High-Capacity Transit Corridor Project

Final Alternatives Screening Memo Page 4-5Honolulu High-Capacity Transit Corridor Project
Waipahu. This alignment travels by Kapolei Hale government center, Kapolei Shopping Center, Kapolei Medical Park, and Kapolei Regional Park. Construction of the segment on the Wai‘anae side of Kapolei Golf Course Road would have fairly significant short-term and long-term impacts, compared to other alignments that do not have existing roadway infrastructure and landscaping. The area Koko Head of Kapolei Golf Course Road is undeveloped and provides opportunity for transit oriented development and at-grade construction. At-grade construction generally requires little or no major structures and thereby is significantly less expensive than construction of an elevated guideway.
The Kapolei Parkway to Fort Barrette Road alignment would promote growth in the makai portions of the City of Kapolei and has high projections for population and employment densities. This alignment would not service the existing commercial developments in Kapolei, as compared to the Kamokila Boulevard to Farrington Highway alignment.
The Kapolei Parkway to North-South Road alignment is the transit corridor identified in the City’s adopted ‘Ewa Development Plan. This alignment provides the opportunity to serve major activity centers in the future since this area is planned to be a high-density residential and commercial zone in the ‘Ewa Development Plan. Additionally, parts of this road are currently planned but not constructed, which provides a better opportunity to integrate High-Capacity transit right-of-way into the construction. Currently, the Department of Hawaiian Home Lands is creating plans to build town centers in the vicinity of North-South Road intersections with Farrington Highway and Kapolei Parkway. This alignment would also serve the proposed UH West O‘ahu campus very well.
Further makai, is the OR&L / Renton Road alignment. The OR&L right-of-way is a designated National Historic Place and the right-of-way is directly adjacent to high voltage overhead electric lines, gas pipelines and a major drainage gully. These may need to be relocated or otherwise disturbed, which increases the potential cost. The projected population and employment densities along this alignment are low, as compared to any of the alignments in Section 1 above. Although this alignment has many draw backs, it is on a route that would service the ‘Ewa communities.
The Kalaeloa development plans indicate that Saratoga Avenue is planned to be extended to connect Kalaeloa Road and North-South Road and is intended to be the main access road for Kalaeloa future development. The Saratoga Avenue to Geiger Road alignment would service the ‘Ewa communities; however, as with the OR&L alignment it has low projected population and employment densities.
The Draft Kalaeloa Master Plan includes a transit loop on Saratoga Avenue and an opportunity to establish a transit system corporation or maintenance yard in close proximity to Kalaeloa Harbor. The Saratoga Avenue to North-South Road alignment has high transit oriented development opportunities and would serve the UH West O‘ahu campus very well.

Screening Memo Page 4-6
Figure 4-2 : Section 1 Map With All Alignments
Final AlternativesHonolulu High-Capacity Transit Corridor Project

Final Alternatives Screening Memo Page 4-7Honolulu High-Capacity Transit Corridor Project
See Figure 4-3 for a map with the alignments.
Section 2: Fort Weaver Road to Leeward Community College Description: Waipahu, which has a very high transit-dependent population, lies within this section. Part of the towns of ‘Ewa and ‘Ewa Beach are also included in this section. Currently, residents of ‘Ewa and ‘Ewa Beach experience significant delays throughout much of the day commuting along Fort Weaver Road, which is the only access road for ‘Ewa and ‘Ewa Beach. Four alignment options were considered through this section, some of which could include use of transit vehicles operating at-grade or on elevated structure. Beginning at Fort Weaver Road, these alignments include the following:
2.4 Use of OR&L Right-of-Way (at-grade).
2.3 Fort Weaver Road to Farrington Highway (partially at-grade or elevated), and
2.2 Farrington Highway (elevated),
2.1 H-1 Freeway to Kamehameha Highway (at-grade or elevated),
• Wākea Street extension to Saratoga Avenue to extension of Geiger Road to Fort Weaver Road (at-grade or elevated).
• Wākea Street extension to Saratoga Avenue to North-South Road to Farrington Highway (at-grade or elevated), and
• Kapolei Parkway to North-South Road to Farrington Highway (at-grade or elevated),
• Kamokila Boulevard to Farrington Highway (partially at-grade or elevated),
Recommendation: The Kamokila Boulevard to Farrington Highway route has the potential to serve a large portion of downtown Kapolei, is the shortest, fastest, and least expensive alignment through the section, and should be considered for detailed analysis. Since the Kapolei Parkway to North-South Road option is included in the ‘Ewa Development Plan, it offers opportunities for the transit system to be fully integrated, and it will serve a high density mixed use (business and residential) area, it is prudent to include this alignment. An alignment that services the ‘Ewa communities should be considered, thereby additional study should be conducted on the Saratoga Avenue to Geiger Road to Fort Weaver Road. Due to its potential for transit oriented development and integration with ongoing future development planning, it is also recommended that the Saratoga Avenue to North-South Road alignment be carried forward. Therefore, as shown in Table 4-1, four alignment options in this segment shall be carried forward:
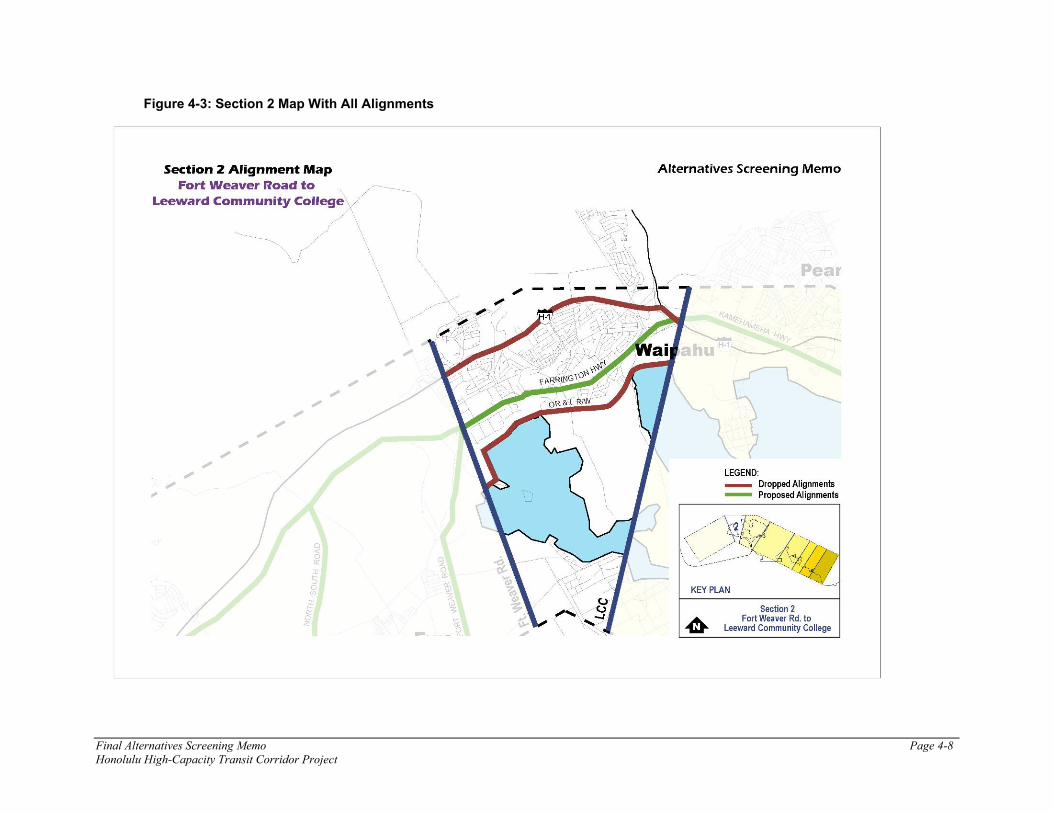
Screening Memo Page 4-8
Figure 4-3: Section 2 Map With All Alignments
Final AlternativesHonolulu High-Capacity Transit Corridor Project

Analysis: The H-1 to Kamehameha Highway alignment option has similar characteristics as described in Section 1, except that less space is available for an at-grade guideway in the median closer to Waiawa Interchange. More specifically, the H-1 Freeway a.m. peak period “zipper lane,” which is a contra flow lane separated from outbound traffic by moveable concrete barriers, takes up median space beginning in the vicinity of Managers Drive. This alignment would serve the Waikele Shopping Center, but does not directly serve or link any of the other major activity nodes along the corridor. Due to its freeway orientation, the option also does not readily serve local transit routes.
Alternatively, the Farrington Highway alignment has the highest projected population and employment densities in this Section and does serve a number of existing transit origins/destinations (e.g., much of central Waipahu including St. Francis Medical Center, several public schools, Waipahu Cultural Park, much of the commercial development along Farrington Highway, and ultimately Leeward Community College). The transit corridor identified in the City’s Central O‘ahu Sustainable Development Plan follows this alignment.
The Fort Weaver Road to Farrington Highway alignment services the ‘Ewa communities and has the potential to be constructed at-grade in the median of Fort Weaver Road. This alignment follows an existing heavily used transit route that currently operates express routes during peak periods with 10 minute headways. Non-express transit routes operate along Fort Weaver Road with 30 minute headways during peak periods. On the negative side, this alignment is the longest and thereby slowest and most expensive alignment through the section.
Although the OR&L alignment could accommodate at-grade construction and be comparatively inexpensive, it follows a curvilinear alignment along the coastline that would reduce travel speeds. This alignment also does not provide access to major activity centers or residences and thus would generate low levels of transit ridership.
See Table 4-2 for a summary of the analysis.
Recommendation: Due to their central location and high transit ridership potential, two alignments will be carried forward:
• Farrington Highway (elevated), and
• Fort Weaver Road to Farrington Highway ((partially at-grade or elevated).
Both options provide for easy connection to the earlier segment ‘Ewa and provide the flexibility of operating future High-Capacity transit service either at-grade or on elevated structure.
Final Alternatives Screening Memo Page 4-9 Honolulu High-Capacity Transit Corridor Project

Section 3: Leeward Community College to Aloha Stadium Description: Pearl City and ‘Aiea lie within this section. Four alignment options were considered, again some of which could include use of transit vehicles operating at-grade or on elevated structure. Beginning at Leeward Community College, these alignments include the following:
3.1 H-1 Freeway (elevated),
3.2 Moanalua Road (elevated),
3.3 Kamehameha Highway (elevated), and
3.4 OR&L Right-of-Way (at-grade).
See Figure 4-4 for a map with the alignments.
Analysis: There is currently little opportunity for constructing the guideway within the H-1 Freeway right-of-way in Section 3. The median is very narrow and the sides of the freeway are proposed to be widened as part of the 2030 Regional Transportation Plan. Because of the limited space, construction within the H-1 right-of-way would be expensive, take a long time, and result in severe traffic impacts. As with Section 2, the H-1 Freeway alignment option does not directly serve or link any major activity nodes along the corridor. The projected population density along the alignment is fairly dense, but the employment density is the lowest of all the alignments in this section.
Due to the frequency and tight radii of curves along its alignment, Moanalua Road presents difficult engineering and environmental challenges that make it a less desirable option. Also right-of-way is limited along this alignment, which means construction would be more costly, take a long time and result in significant traffic impacts. On the positive side, the alignment does pass mauka of Pearlridge shopping center, past several schools, has high projected population and employment densities, and is a well served transit route.
The Kamehameha Highway alignment was the route selected in the Locally Preferred Alternative in 1992. The alignment contains a fairly wide median where an elevated guideway can be constructed without removing any travel lanes. This alignment would be the least disruptive to traffic operations and have the fewest impacts to residents and businesses located along the alignment compared to the other alignments in this Section. Additionally, the major activity centers (Pearl City Shopping Center, Waimalu Shopping Center, Pearlridge Shopping Center, and various community businesses) along Kamehameha Highway are likely to generate high transit ridership. This notion is supported by the existing transit system which operates 5 through routes with peak headways of 7, 10, 20 and 30 minutes along this section of Kamehameha Highway. This alignment has the second highest projected density of employment in this Section.
Page 4-10 Final Alternatives Screening Memo Honolulu High-Capacity Transit Corridor Project

Final Alternatives Screening Memo Page 4-11 Honolulu High-Capacity Transit Corridor Project
The OR&L alignment in Section 3 is similar in characteristics to the alignment in Section 2. Although relatively inexpensive, at-grade construction is possible, the alignment follows the curvilinear coastline which would reduce travel speeds. And, there is a section of the alignment that would run through Neal Blaisdell Park. Additionally, it does not provide convenient access to major activity centers or residences.
See Table 4-3 for a summary of the analysis.
Recommendation: Only one alignment option in this segment was deemed technically feasible:
• Kamehameha Highway (elevated).
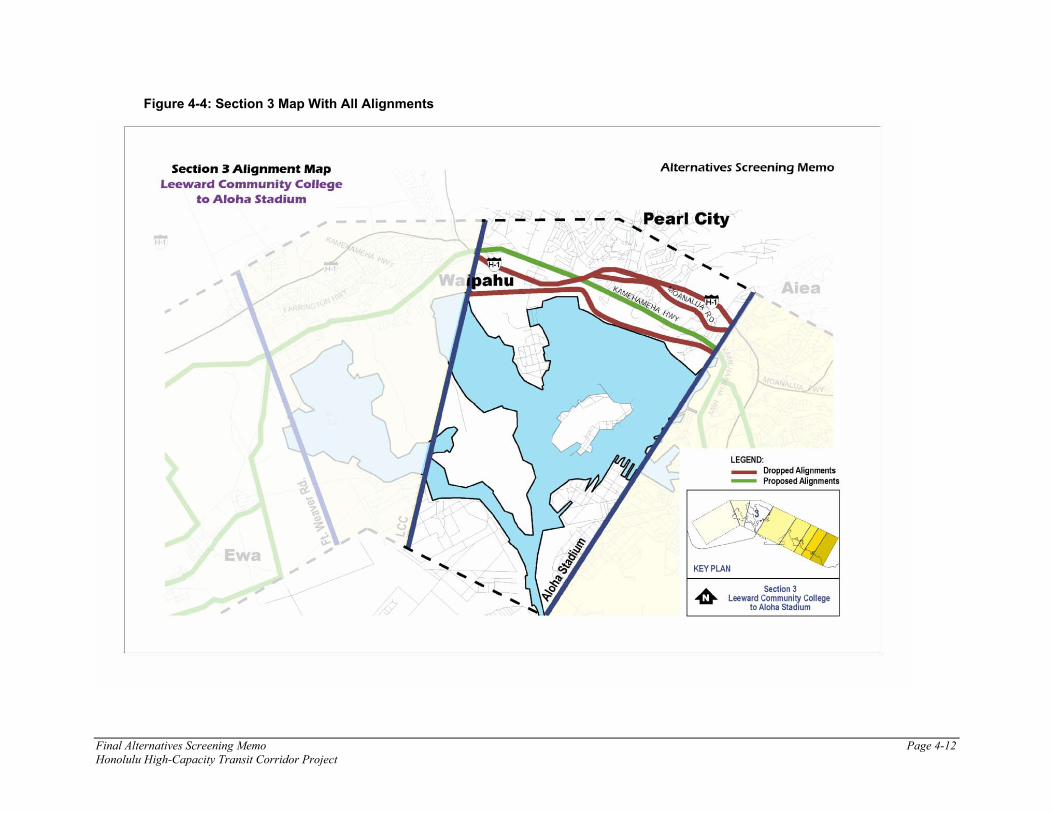
Screening Memo Page 4-12
Figure 4-4: Section 3 Map With All Alignments
Final AlternativesHonolulu High-Capacity Transit Corridor Project

Section 4: Aloha Stadium to Ke‘ehi Interchange Description: Aloha Stadium, the Arizona Memorial Visitor Center, Pearl Harbor Naval Shipyard, Honolulu International Airport, Foster Village, Āliamanu, Salt Lake, and Moanalua are some of the activity centers in this Section. Given the development density, large number of ‘Ewa/Koko Head oriented streets, and a desire to provide airport access, there were 11 alignment options identified in this corridor section. Awith the earlier sections, some of the alignments could incluuse of transit vehicles operating at-grade or on elevated structure. Beginning at Aloha Stadium, these alignments include the following:
s de
4.1 Moanalua Freeway (at-grade or elevated),
4.2 Salt Lake Boulevard (at-grade or elevated),
4.3 H-1 Freeway to Kamehameha Highway (at-grade or elevated),
4.4 H-1 Freeway to Kamehameha Highway, with an alignment closer to the Airport using Aolele Street (elevated),
4.5 Kamehameha Highway to Nimitz Highway in median area (at-grade),
4.6 Kamehameha Highway on makai side of the Airport Viaduct (elevated),
4.7 Kamehameha Highway to mauka side of the Airport Viaduct, then Mauka on Camp Catlin Road, Pūkōloa Street, to Moanalua Freeway (elevated),
4.8 Kamehameha Highway to mauka side of the Airport Viaduct, then Peltier, Moanalua School, Pūkōloa Street, to Moanalua Freeway (elevated),
4.9 Kamehameha Highway to mauka side of the Airport Viaduct, then Ahua Street to Moanalua Freeway (elevated),
4.10 Kamehameha Highway to mauka side of the Airport Viaduct to Ke‘ehi Interchange (elevated), and
4.11 Kamehameha Highway to makai side of the Airport Viaduct with an alignment closer to the airport using Aolele Street (elevated).
See Figure 4-5 for a map with the alignments.
Analysis: The Moanalua Freeway offers a direct route to downtown Honolulu and contains ample space for construction of an elevated guideway. However, it misses most of the activity centers within this section, such as the Arizona Memorial Visitor Center, Pearl Harbor Shipyard, and the Honolulu International Airport. It has the lowest projected employment density within the Section.
Final Alternatives Screening Memo Page 4-13 Honolulu High-Capacity Transit Corridor Project

Page 4-14 Final Alternatives Screening Memo Honolulu High-Capacity Transit Corridor Project
Salt Lake Boulevard travels along the highest density residential area within the Section and is a direct route to downtown. However, Salt Lake Boulevard does not offer as many opportunities for serving employment centers. Except for a short segment between Maluna Street and Salt Lake Shopping Center, there is limited space for construction of an elevated guideway within the Salt Lake Boulevard right-of-way. The Maluna Street to Salt Lake Shopping Center segment is planned for widening as part of the 2030 Regional Transportation Plan.
Although there is space along the H-1 Freeway right-of-way for construction of an elevated guideway between the Hālawa and Pearl Harbor Interchanges, there is little space available in the vicinity of the airport viaduct. If an elevated guideway is constructed on the mauka side of the Airport Viaduct, it is likely to require property acquisition/ exchange from the military and/or private property owners. Except for the airport, this alignment does not serve economic or residential centers as well as a makai alignment along the viaduct.
The 1992 LPA route followed Kamehameha Highway past the Arizona Memorial Visitor Center and along the makai side of the Airport Viaduct. An alignment that brings an elevated guideway further makai to connect to the Interisland and International terminals was also considered and is included in this study.
In general, the Kamehameha alignments serve multiple employment centers (e.g., Pearl Harbor, the Honolulu International Airport, and industrial manufacturing areas) and have good engineering feasibility. There are not a significant number of residential areas through this section, however the high density of employment and business in this section are likely to sustain high ridership of a High-Capacity transit system.
In order to serve both the airport and nearby economic centers and the high density residential area in Salt Lake, several alignment options were analyzed. These included connectors using Camp Catlin Road, Peltier Avenue, or Ahua Street. Of these alignments, the one that turns mauka on Camp Catlin Road to connect with Salt Lake Boulevard is the most direct and offers the fewest engineering obstacles of the potential Salt Lake connectors.
An at-grade alignment in the median of Nimitz Highway under the Airport Viaduct is also being considered. This option would be considerably less expensive than any of the other alignments in this section. However, the at-grade street crossings it would need to make will reduce travel speeds and create additional traffic impacts.
A summary of the analysis can be found in Table 4-4.

Figure 4-5: Section 4 Map With All Alignments
Final Alternatives Screening Memo Page 4-15 Honolulu High-Capacity Transit Corridor Project

Recommendation: Based on an analysis of the alignment options, some portions of the alignments provide better transit service potential, stronger engineering feasibility, or would require lower construction cost (based on right-of-way taking and elevation description). Kamehameha Highway offers the best entry option into this section; therefore all of the alignments that are recommended begin on this highway. As a result of mixing and matching, four alignment options were derived and are described below.
The Kamehameha Highway to Salt Lake Boulevard to Pūkōloa Street alignment will serve the high density residential areas along Salt Lake Boulevard and is a shorter route through this section than following the Airport Viaduct or Nimitz Highway.
The Kamehameha Highway to Camp Catlin Road to Salt Lake Boulevard to Pūkōloa Street to Moanalua Freeway alignment serve both the airport and economic centers near the Airport Viaduct and will serve the residential population on Salt Lake Boulevard. This alignment presents more engineering challenges because of the number of turns and the turns could decrease the overall travel speed of the transit system through this section, however the flexible service that this alignment provides makes it feasible for detailed analysis.
The Kamehameha Highway to the mauka side of the Airport Viaduct or at-grade along Nimitz Highway option is more direct than the option that serves both the airport and Salt Lake Boulevard and serves the continuum of employment and business centers along Nimitz Highway and near the Airport, which are likely ridership generators. The at-grade option for this alignment could reduce costs compared to an elevated structure, especially given the large right-of-way existing along Nimitz Highway. Both of these elements of potential ridership and potential cost effectiveness make this alignment feasible for detailed analysis.
The Kamehameha Highway to makai side of the Airport Viaduct with an option closer to the airport alignment must be elevated because of the existing airport access roads from H-1 Freeway and Nimitz Highway. Even though this alignment does not support an at-grade option, it offers unique access for the airport and could facilitate direct interface with an airport people mover in the future. It also serves a high density industrial center along Aolele Street and has high potential for ridership given the density of employment.
The following four alignments are recommended to be carried forward:
• Kamehameha Highway to Salt Lake Boulevard to Pūkōloa Street (elevated),
• Kamehameha Highway along the Airport Viaduct to transition mauka along Camp Catlin Road to Salt Lake Boulevard to Pūkōloa Street and on to Moanalua Freeway (elevated),
• Kamehameha Highway to the mauka side of the Airport Viaduct or at-grade along Nimitz Highway (elevated or at-grade), and
Page 4-16 Final Alternatives Screening Memo Honolulu High-Capacity Transit Corridor Project

• Kamehameha Highway to makai side of the Airport Viaduct with an option to serve the airport along Aolele Street (elevated).
Section 5: Ke‘ehi Interchange / Moanalua Stream to Iwilei Description: Kalihi, in Section 5, has a very high transit-dependent population. Within this section, five alignment options were considered, all of which assume use of High-Capacity transit vehicles that would operate on elevated structure. Beginning at the crossing of Moanalua Stream, these alignments include the following:
5.1 School Street (elevated),
5.2 H-1 Freeway to Vineyard Boulevard (elevated),
5.3 North King Street (elevated),
5.4 Dillingham Boulevard (elevated), and
5.5 Nimitz Highway (elevated).
See Figure 4-6 for a map with the alignments.
Analysis: The School Street alignment would service the transit dependent Kalihi residents on the mauka side of the H-1 Freeway. Portions of this alignment would severely impact residential communities and is longer, and thereby more expensive and slower than the North King Street alignment.
The projected population and employment densities along the H-1 Freeway to Vineyard Boulevard alignment are high. However, little space within the H-1 Freeway right-of-way is available to construct an elevated guideway. As with other H-1 Freeway segments, access to economic or residential centers along this alignment is not very good, construction would be expensive, and the construction impacts on traffic would be severe.
Alternatively, the North King Street and Dillingham Boulevard alignment options are significantly stronger transit corridors. For example, along North King Street the alignment would pass Kalihi Center several school campuses including Honolulu Community College, several large transit-dependant housing units, and high density residential and commercial developments. King Street within this section is also being considered for revitalization with the King Street Heritage Corridor. This revitalization offers opportunities for transit oriented development and integration of transit access points.
Similarly, Dillingham Boulevard was selected in the Kalihi/ Pālama Action Plan as the citizens’ choice as a transit corridor. It is a highly developed arterial and would provide access to residential areas, local shopping, and Honolulu Community College. Also, the
Final Alternatives Screening Memo Page 4-17 Honolulu High-Capacity Transit Corridor Project

Page 4-18 Final Alternatives Screening Memo Honolulu High-Capacity Transit Corridor Project
• Nimitz Highway (elevated for Managed Lane Alternative only).
• Dillingham Boulevard (elevated), and
• North King Street (elevated),
area near Honolulu Community College is planned for development of a network of businesses and enterprises that will directly support student life and could offer opportunities for transit oriented development. The 1992 LPA alignment followed Dillingham Boulevard.
The Nimitz Highway alignment would provide employee access to many of the industrial facilities located makai of the roadway. But, much of this highway along this section is long standing industrial development and does not offer as much opportunity for new development as North King Street or Dillingham Boulevard. The projected population and employment densities along the Nimitz Highway alignment were the lowest of all the alignments in this Section. The 2030 Regional Transportation plan includes an elevated HOV facility that is planned to be constructed in the median of Nimitz Highway. Although there would be little remaining space for a fixed-guideway facility, this alignment, including the HOV facility could be incorporated as part of a Managed Lane Alternative.
Recommendation: It is recommended that King Street and Dillingham Boulevard alignments are carried forward. Both of these arterials have plans in progress for redevelopment or revitalization, which could be coupled with transit plans along these alignments. Therefore, North King Street and Dillingham Boulevard are the primary alignments through this section. Nimitz Highway, as part of the Managed Lanes Alternative, will also be carried forward.
These are the three alignments recommended for this section as summarized in Table 4-5:

reening Memo Page 4-19
Figure 4-6: Section 5 Map With All Alignments
Final Alternatives ScHonolulu High-Capacity Transit Corridor Project

Section 6: Iwilei to Ward Avenue Description: This Section contains portions of many sensitive areas including the Special Design Districts of Chinatown District, Hawai‘i Capital District, and the Thomas Square/Academy of Arts District, and the Community Development District of Kaka‘ako, which contains many opportunities for transit oriented development. This section also contains, by far, the highest projected densities for population and eas compared to all of the Sections. Within this section, 1alignment options were considered. Portions of thesealignments would operate at-grade, on elevated structure,or in tunnel. Beginning at the Iwilei, these alignments include the following:
mployment 5
6.1 H-1 Freeway (elevated),
6.2 Vineyard Boulevard to Pali Highway to Beretania Street (elevated),
6.3 Beretania Street to Fort Street mauka to Vineyard Boulevard to Lusitania Street to Kīna‘u Street to Ward Avenue (elevated),
6.4 Beretania Street to Fort Street mauka to Vineyard Boulevard to Lusitania Street to Alapa‘i Street to South King Street to Ward Avenue (elevated),
6.5 Beretania Street to Fort Street mauka to Vineyard Boulevard to Lusitania Street to Alapa‘i Street to Cooke Street to Kawaiaha‘o Street to Ward Avenue (elevated),
6.6 Beretania Street to Ward Avenue (elevated),
6.7 South King Street to Ward Avenue (elevated),
6.8 South King Street to Kapi‘olani Boulevard to Ward Avenue (elevated or partially in tunnel),
6.9 Tunnel from Ka‘aahi Street under Hotel Street to Waimanu Street (tunnel),
6.10 Tunnel from Ka‘aahi Street under King Street to Waimanu Street (tunnel),
6.11 At-grade from Ka‘aahi Street to Iwilei Road., North King Street, Hotel Street, to tunnel before Richards Street to Kawaiaha‘o Street to elevated structure on Koko Head side of Cooke Street to Ward Avenue (partially at-grade, in tunnel and elevated),
6.12 Nimitz Highway to Queen Street to South Street to South King Street (elevated),
6.13 Nimitz Highway to Queen Street (elevated),
Page 4-20 Final Alternatives Screening Memo Honolulu High-Capacity Transit Corridor Project

Final Alternatives Screening Memo Page 4-21Honolulu High-Capacity Transit Corridor Project
See Figure 4-7 for a map with the alignments.
Analysis: Given their location, the mauka alignments along H-1 Freeway and Vineyard Boulevard do not provide the potential for significant transit ridership when compared to other alignment options. The projected population density along the H-1 Freeway alignment was the lowest of all the alignments in this Section and had a low projected employment density as well. As with other H-1 Freeway alignments, access is limited and construction impacts on traffic would be severe.
The Beretania Street routes could serve key activity centers, but if at-grade or elevated the disruption to historic, culturally significant buildings (e.g., Saint Andrews Cathedral and Washington Place) and government facilities (e.g., the State Capitol) make this route undesirable. Various alignments were investigated to avoid impacting these facilities, such as heading mauka on Fort Street to Vineyard Boulevard. As previously stated, however, the projected population and employment densities along Vineyard Boulevard is low as compared to alignments more makai.
Tunneling beneath Beretania is an alternative that would allow travel access through the densely developed downtown and would potentially be less disruptive to historic areas.
A tunnel under Hotel Street, beginning in Iwilei and ending in Kaka‘ako, was the alignment selected for the 1992 LPA. The roadway right-of-way along Hotel Street is very narrow and posed engineering challenges. After additional engineering studies were completed, this alignment was deleted. This alignment alternative is still considered a very expensive alternative.
An at-grade alternative on Hotel Street is currently being investigated. Although slower than an elevated or underground guideway, reasonable travel speeds can be provided by implementing transit signal priority. The alignment would descend into a tunnel to avoid the sensitive historic and government structures in the Capitol District and climb up to an elevated structure on Kawaiaha‘o Street on the Koko Head side of South Street. The length of the tunnel on this alignment is about half the length of the tunnel investigated in 1992. The projected population and employment densities along this route are the highest of all the alignments in this Section.
The King Street at-grade and elevated alignments also pass sensitive historic, cultural and government buildings such as ‘Iolani Palace, King Kamehameha Statue, Honolulu Hale, and Kawaiaha‘o Church and should be avoided if other alternatives exist. A tunnel under King Street was also investigated in 1992 after the Hotel Street tunnel was deleted from the LPA.
6.15 Tunnel from Kaahi Street under ‘A‘ala Park, under Beretania Street to beyond Punchbowl Street, then climb to an elevated structure and cross over Alapa‘i Street turning makai to continue onto South King Street (tunnel and elevated).
6.14 Nimitz Highway to Halekauwila Street to Ward Avenue (elevated), and

Final Alternatives Screening Memo Honolulu High-Capacity Transit Corridor Project
Figure 4-7: Section 6 Map With All Alignments
Page 4-22

The Nimitz Highway to Halekauwila Street alignment was the alignment included in the 1992 LPA after the Hotel Street tunnel was deleted. It provides a direct route to Kaka‘ako and the Ala Moana Shopping Center areas and would well serve the Aloha Tower Market Place. However, this elevated alignment would have severe visual impacts for Aloha Tower and should be avoided if there are other viable alternatives.
The alignment from Nimitz Highway to Queen Street is similar to the alignment on Halekauwila Street, but would avoid most of the visual impact to Aloha Tower. However, a disadvantage is that using Queen Street would require taking one of the four travel lanes for the transit guideway. On Halekauwila Street, there are only two travel lanes and the guideway would eliminate parking spaces.
A Queen Street to South Street alignment was also investigated to connect a route from Nimitz Highway to South King Street. However, this alignment would require a number of horizontal curves that would decrease the average travel speed through this section.
A summary of the analysis can be found in Table 4-6.
Recommendation: Given the physical constraints of building an at-grade, aerial and sub-grade alignment through downtown, four alignment options are recommended. Three of these include tunnel portions, while the fourth would be elevated. To maintain connectivity with the Section 5 alignment options, two of the alignments would connect with King Street and two would connect with Dillingham Boulevard. The four alignments are described below.
• Elevated on North King Street and then descending to grade onto Hotel Street past Alakea Street where the alignment would then tunnel under the government center and resurface at Waimanu Street (elevated, at-grade, and tunnel).
This takes advantage of the existing transit-only right-of-way along Hotel Street and avoids visual and environmental disruption through the historic district.
• North King Street on elevated structure past Liliha Street onto private property makai of North King Street. From this location, the alignment would connect to Nimitz Highway and then follow Queen Street where it would continue through the corridor segment (elevated).
• Elevated on Dillingham Boulevard, turning makai on Ka‘aahi Street, and then tunneling beneath ‘A‘ala Park toward North Beretania Street. The tunnel would surface on the mauka side of the City’s underground parking structure. The alignment then becomes elevated to South King Street and continues along South King (elevated and tunnel).
• Elevated on Dillingham Boulevard then at-grade along Ka‘aahi Street, to Iwilei Road, to Hotel Street on which it would continue at-grade to Alakea Street. From Alakea Street, the alignment then tunnels beneath the historic area and government center
Final Alternatives Screening Memo Page 4-23 Honolulu High-Capacity Transit Corridor Project
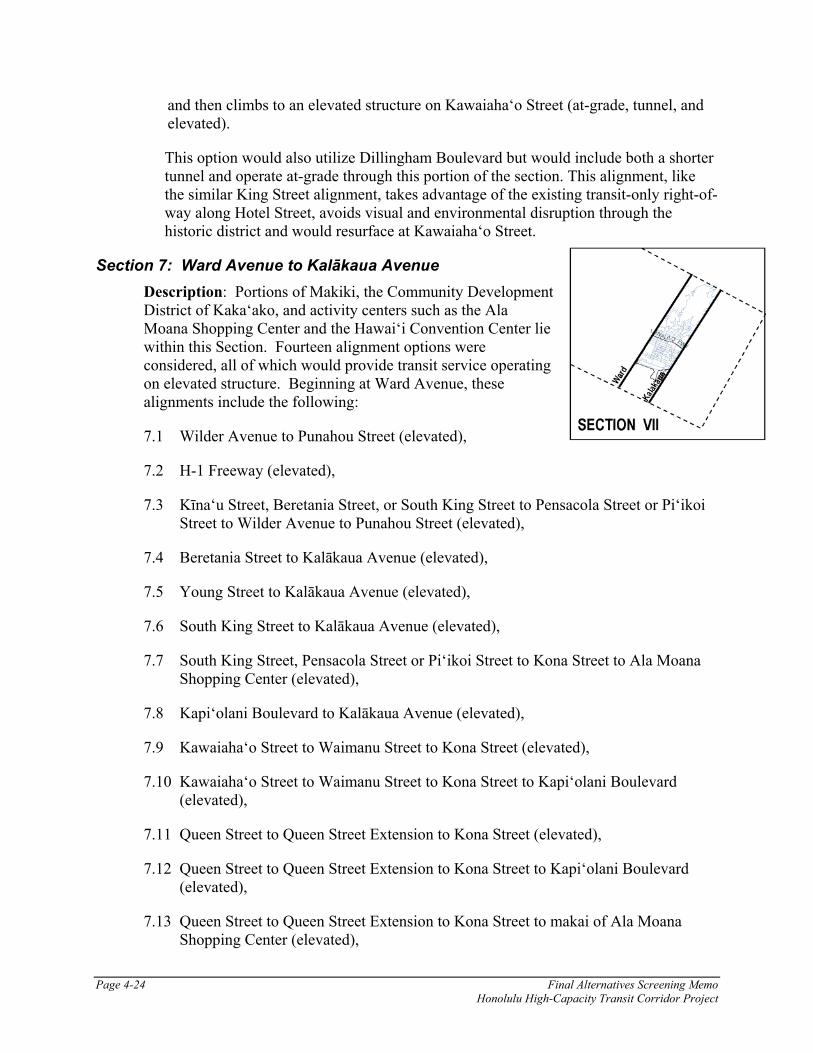
and then climbs to an elevated structure on Kawaiaha‘o Street (at-grade, tunnel, and elevated).
This option would also utilize Dillingham Boulevard but would include both a shorter tunnel and operate at-grade through this portion of the section. This alignment, like the similar King Street alignment, takes advantage of the existing transit-only right-of- way along Hotel Street, avoids visual and environmental disruption through the historic district and would resurface at Kawaiaha‘o Street.
Section 7: Ward Avenue to Kalākaua Avenue Description: Portions of Makiki, the Community Development District of Kaka‘ako, and activity centers such as the Ala Moana Shopping Center and the Hawai‘i Convention Center lie within this Section. Fourteen alignment options were considered, all of which would provide transit service operating on elevated structure. Beginning at Ward Avenue, these alignments include the following:
7.1 Wilder Avenue to Punahou Street (elevated),
7.2 H-1 Freeway (elevated),
7.3 Kīna‘u Street, Beretania Street, or South King Street to Pensacola Street or Pi‘ikoi Street to Wilder Avenue to Punahou Street (elevated),
7.4 Beretania Street to Kalākaua Avenue (elevated),
7.5 Young Street to Kalākaua Avenue (elevated),
7.6 South King Street to Kalākaua Avenue (elevated),
7.7 South King Street, Pensacola Street or Pi‘ikoi Street to Kona Street to Ala Moana Shopping Center (elevated),
7.8 Kapi‘olani Boulevard to Kalākaua Avenue (elevated),
7.9 Kawaiaha‘o Street to Waimanu Street to Kona Street (elevated),
7.10 Kawaiaha‘o Street to Waimanu Street to Kona Street to Kapi‘olani Boulevard (elevated),
7.11 Queen Street to Queen Street Extension to Kona Street (elevated),
7.12 Queen Street to Queen Street Extension to Kona Street to Kapi‘olani Boulevard (elevated),
7.13 Queen Street to Queen Street Extension to Kona Street to makai of Ala Moana Shopping Center (elevated),
Page 4-24 Final Alternatives Screening Memo Honolulu High-Capacity Transit Corridor Project

Final Alternatives Screening Memo Page 4-25Honolulu High-Capacity Transit Corridor Project
See Figure 4-8 for a map with the alignments.
Analysis: Although there is a very high density of high-rise buildings on the mauka side of the H-1 Freeway, the projected population density along the Wilder Avenue alignment is lower than those projected along the alignments makai of the freeway. The Wilder Avenue alignments would also severely impact residential community settings and result in the loss of travel lanes. The opportunities for transit oriented development are better on the makai side of the freeway as well.
The H-1 Freeway alignment has almost no right-of-way available for construction of an elevated guideway in this Section. And, as in other Sections, access to the guideway would be poor and construction impacts on traffic would be severe.
The Kīna‘u Street, Beretania Street, Young Street, and King Street alignments have similar, very high projected population and employment densities and are along direct routes to the University of Hawai‘i at Mānoa. Of these alignments, the King Street alignment has the largest right-of-way and thereby has the fewest engineering construction constraints and negative environmental impacts. This alignment runs adjacent to Straub Clinic & Hospital, Kaiser Permanente, Blaisdell Center, and McKinley High School. Construction of an elevated guideway would require the removal of a peak period curbside lane and some of its parking spaces.
The South King Street alignment with connection to Ala Moana Center by way of Pensacola or Pi‘ikoi Streets would require too many turns and would not be an efficient transit route as compared to other alignments that pass through Kaka‘ako.
Kapi‘olani Boulevard is a direct route to many of the major activity centers; however there is no median through most of this section. Morning and afternoon peak period contraflow lane operations also exist on Kapi‘olani Boulevard. To maintain these operations, the guideway may require the construction of columns on both sides of the street with cross beams spanning the roadway. This would have severe visual impact and should be avoided if other alternatives exist. Use of Kona Street offers an alternative to Kapi‘olani Boulevard, serves the same activity centers, and would have fewer visual impacts.
The alignments along Waimanu Street, Kawaiaha‘o Street, and Queen Street have similar characteristics. They travel through Kaka‘ako along streets planned for reconstruction and have very high potential for transit oriented development. These alignments would also serve many of the major activity centers in this section including Ward Warehouse, Ward Centre, Ala Moana Center, and the Hawai‘i Convention Center.
7.14 Halekauwila Street to Ward Avenue to Waimanu Street to Kona Street (elevated), and

Final Alternatives Screening Memo Honolulu High-Capacity Transit Corridor Project
Figure 4-8: Section 7 Map With All Alignments
Page 4-26

The 1992 LPA alignment in this Section started from Halekauwila Street (which ends at Ward Avenue), headed mauka on Ward Avenue, and turned onto Waimanu Street. The Waimalu Street, Kawaiaha‘o Street, and Queen Street alignment options do not have as many sharp turns and would therefore have faster travel speeds.
A summary of the analysis can be found in Table 4-7.
Recommendation: In order to maintain connectivity with the recommended alignments in Section 6 the entry points into this Section were clear: South King Street, Waimanu Street, Kawaiaha‘o Street, and Queen Street. From these entry points and the analysis above, four alignments were selected for further study.
• South King Street (elevated). This alignment takes advantage of the directness and high level of service potential of that route,
• Waimanu Street, connect to Kona Street and continue through the Ala Moana Shopping Center to Kapi‘olani Boulevard in the vicinity of Atkinson Drive (elevated),
• Kawaiaha‘o Street to Kona Street to Kapi‘olani Boulevard (elevated), and
• Queen Street to Kona Street to Kapi‘olani Boulevard (elevated).
The last three alignments will require responding to the inherent design and engineering challenges associated with using Kona Street, however this avoids the visual and traffic impacts associated with an alignment along Kapi‘olani Boulevard.
Section 8: Kalākaua Avenue to UH, Mānoa Description: Portions of Waikīkī, McCully, Mo‘ili‘ili, and Mānoa lie in this Section. Within this section, 13 alignment options were considered, all of which would provide transit service operating on elevated structure. Beginning at Kalākaua Avenue, these alignments include the following:
8.1 Wilder Avenue to Dole Street (elevated),
8.2 Beretania Street to University Avenue (elevated),
8.3 Young Street to Isenberg Street to South King Street to University Avenue (elevated),
8.4 South King Street to University Avenue (elevated),
8.5 Kapi‘olani Boulevard to University Avenue to UH quarry (elevated),
8.6 Kapi‘olani Boulevard to University Avenue to UH quarry with branch to Waikīkī via Kalākaua Avenue and Kūhiō Avenue (elevated),
Final Alternatives Screening Memo Page 4-27 Honolulu High-Capacity Transit Corridor Project

Page 4-28 Final Alternatives Screening Memo Honolulu High-Capacity Transit Corridor Project
See Figure 4-9 for a map with the alignments.
Analysis: The Wilder Avenue, Beretania Street, Young Street, and King Street alignments are along a direct route between Downtown and the University of Hawai‘i and have similar characteristics as they do in Section 7. They are located too far mauka to serve the major activity centers and would not provide any opportunity to serve Waikīkī, which is the largest activity center in Section 8. The King Street to University alignment has the highest projected population and employment densities of all the alignments in this section.
Kapi‘olani Boulevard connects directly to alignments that well serve the major activity centers in Section 7. It has a median along most of the section, where guideway columns can be placed without affecting travel lanes. It also serves ‘Iolani School and the nearby area that contains a high density of high-rise buildings. There were several alternative alignments investigated that stem from Kona Street or Kapi‘olani Boulevard to the University of Hawai‘i at Mānoa. Two headed mauka to King Street on Sheridan Street and Kāheka Street, prior to Atkinson Drive thereby avoiding visual impacts to the Hawai‘i Convention Center. However, these alignments do not provide an opportunity to serve Waikīkī and require two 90 degree turns that require property acquisition and result in slow travel speeds.
Another alignment on the makai side of the Ala Moana Center along Ala Moana Boulevard also avoided visual impacts to the Hawai‘i Convention Center. This alignment served Waikīkī but was very circuitous. This alignment would have severe visual impacts along Ala Moana Boulevard, the primary route to Waikīkī, along Niu Street and across the Ala Wai Canal.
8.13 Makai Side of Ala Moana Shopping Center to Ala Moana Boulevard to Niu Street to Ala Wai Canal to University Avenue (elevated).
8.12 Kona Street to Kāheka Street to South King Street to University Avenue (elevated), and
8.11 Kona Street to Sheridan Street to South King Street to University Avenue (elevated),
8.10 Kapi‘olani Boulevard to Isenberg Street to King Street to Kai‘ali‘u Street to UH quarry (elevated),
8.9 Kapi‘olani Boulevard to Kalākaua Avenue to Kūhiō Avenue to Kālaimoku Street to University Avenue with branch along Kūhiō Avenue (elevated),
8.8 Kapi‘olani Boulevard to Kalākaua Avenue to Ala Wai Boulevard to University Avenue with branch along Ala Wai Boulevard (elevated),
8.7 Kapi‘olani Boulevard to University Avenue to UH quarry with branch to Waikīkī via Kalākaua Avenue and Ala Wai Boulevard (elevated),

Screening Memo Page 4-29
Figure 4-9: Section 8 Map With All Alignments
Final AlternativesHonolulu High-Capacity Transit Corridor Project
Page 4-30 Final Alternatives Screening Memo Honolulu High-Capacity Transit Corridor Project
• Branch connection to Waikīkī via Kalākaua Avenue to Kūhiō Avenue (elevated).
• Kapi‘olani Boulevard to University Avenue into the UH at Mānoa (elevated),
• South King Street, turn makai along Kaialau Street into UH at Mānoa (elevated),
An alignment extending mauka from Kapi‘olani Boulevard along Isenberg Street was also investigated. Isenberg Street travels through a residential community setting, however, and should be avoided if other alternatives are available.
Serving the community of Waikīkī is an important consideration in this section. Several general concepts were identified to do this, each with some benefits and some drawbacks. In general, there is a large, high density residential population living near Ala Wai Boulevard that could benefit from access to the transit alignment. However, the aesthetic impact of an aerial structure along Ala Wai Boulevard and the Ala Wai Canal would be severe. Likewise, a crossing over the Ala Wai Canal (as included in two proposed alignments) should be avoided if other alternatives are feasible to minimize the visual impact of crossing the canal. A branch alignment alternative along Kalākaua to Kūhiō Avenue, then traveling down Kūhiō Avenue was identified. This alignment serves the central areas of Waikīkī without disrupting the pedestrian flow and shopping areas along Kalākaua Avenue past the Kūhiō Avenue intersection.
A summary of the analysis can be found in Table 4-8.
Recommendation: To maintain continuity with Segment 7, it is recommended that two alignments and one branch line option be further studied.
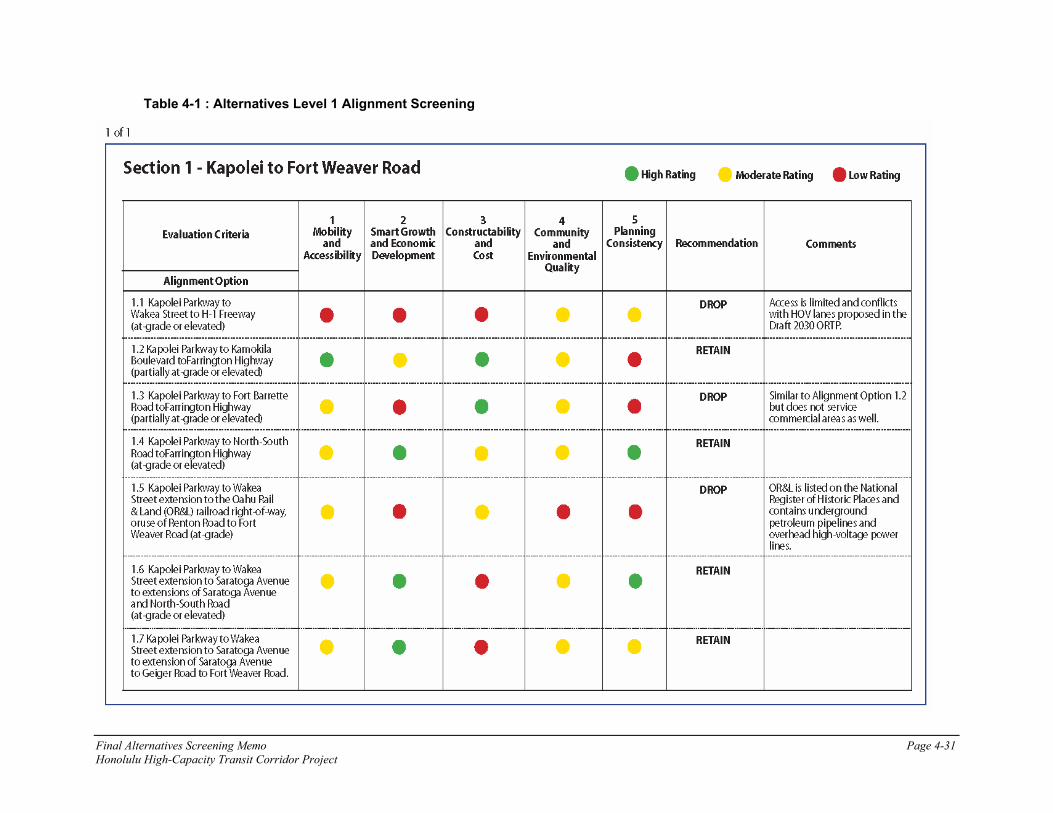
Table 4-1 : Alternatives Level 1 Alignment Screening
Final Alternatives Screening Memo Page 4-31 Honolulu High-Capacity Transit Corridor Project

Table 4-2: Alternatives Level 1 Alignment Screening
Page 4-32 Final Alternatives Screening Memo Honolulu High-Capacity Transit Corridor Project

Table 4-3: Alternatives Level 1 Alignment Screening
Final Alternatives Screening Memo Page 4-33 Honolulu High-Capacity Transit Corridor Project
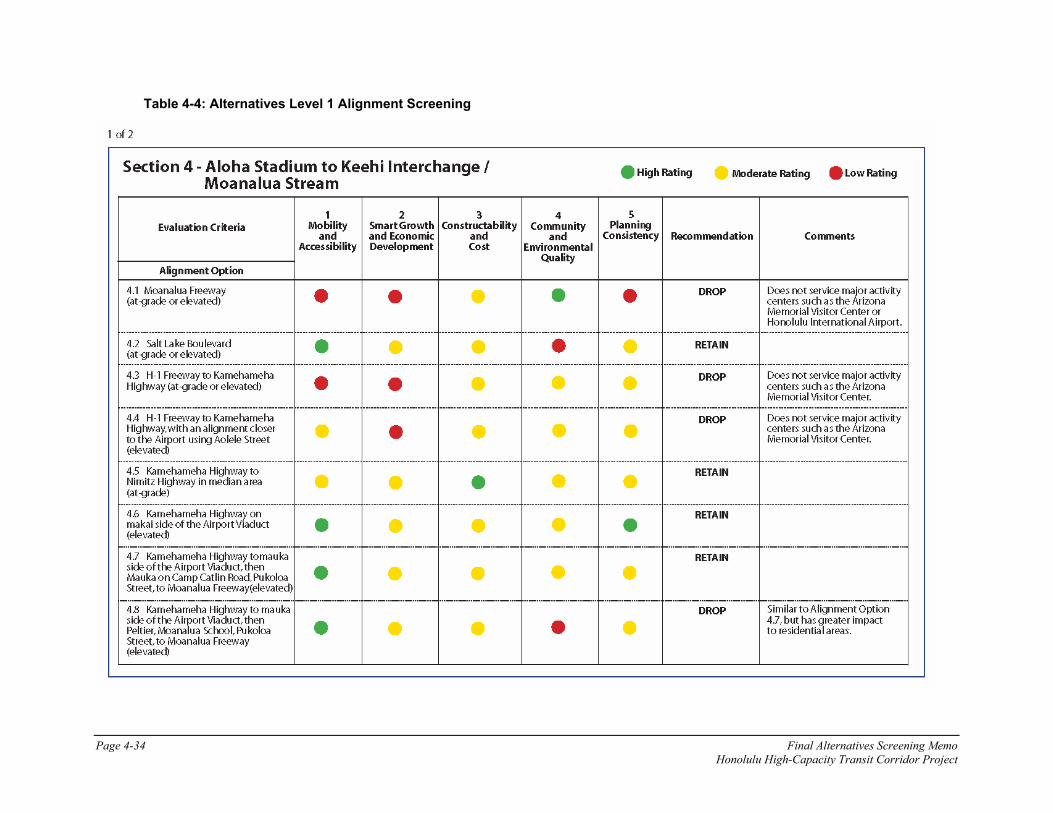
Table 4-4: Alternatives Level 1 Alignment Screening
Page 4-34 Final Alternatives Screening Memo Honolulu High-Capacity Transit Corridor Project

Final Alternatives Screening Memo Page 4-35 Honolulu High-Capacity Transit Corridor Project

Table 4-5: Alternatives Level 1 Alignment Screening
Page 4-36 Final Alternatives Screening Memo Honolulu High-Capacity Transit Corridor Project

Table 4-6: Alternatives Level 1 Alignment Screening
1 of 2
Final Alternatives Screening Memo Page 4-37 Honolulu High-Capacity Transit Corridor Project

2 of 2
Page 4-38 Final Alternatives Screening Memo Honolulu High-Capacity Transit Corridor Project

Table 4-7: Alternatives Level 1 Alignment Screening
Final Alternatives Screening Memo Page 4-39 Honolulu High-Capacity Transit Corridor Project

2 of 2
Page 4-40 Final Alternatives Screening Memo Honolulu High-Capacity Transit Corridor Project

Table 4-8: Alternatives Level 1 Alignment Screening
Final Alternatives Screening Memo Page 4-41 Honolulu High-Capacity Transit Corridor Project

Final Alternatives Screening Memo Honolulu High-Capacity Transit Corridor Project
Page 4-42
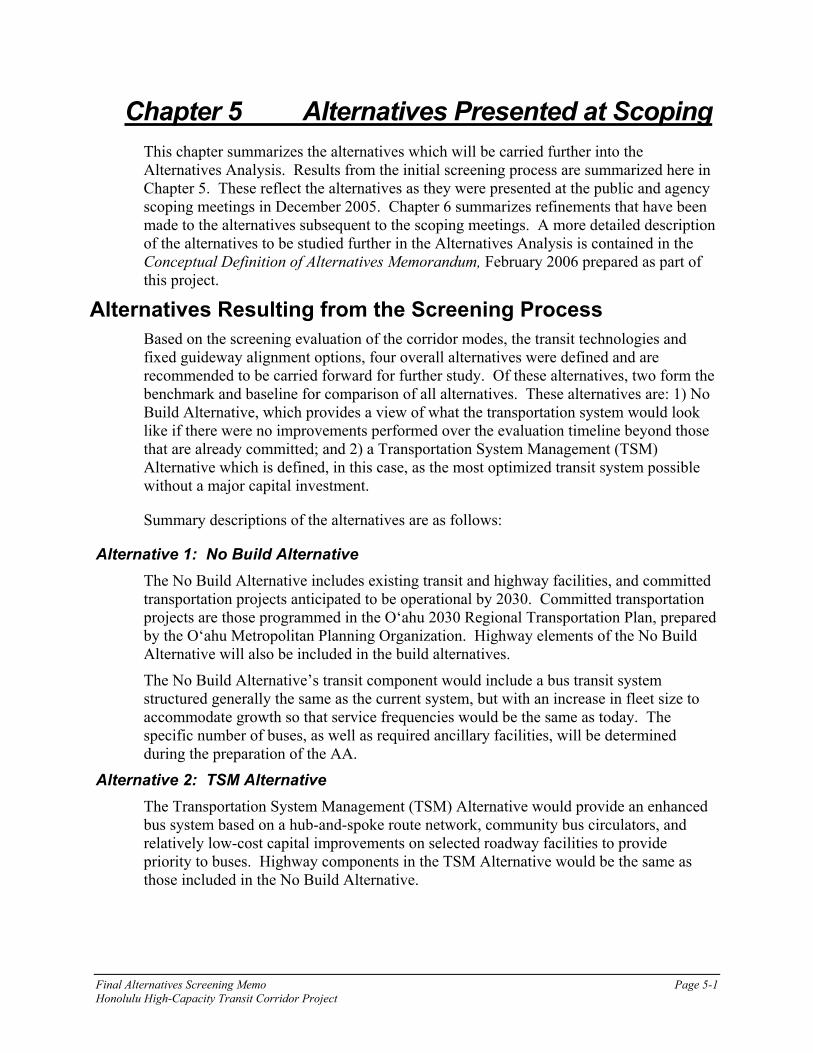
Chapter 5 Alternatives Presented at Scoping This chapter summarizes the alternatives which will be carried further into the Alternatives Analysis. Results from the initial screening process are summarized here in Chapter 5. These reflect the alternatives as they were presented at the public and agency scoping meetings in December 2005. Chapter 6 summarizes refinements that have been made to the alternatives subsequent to the scoping meetings. A more detailed description of the alternatives to be studied further in the Alternatives Analysis is contained in the Conceptual Definition of Alternatives Memorandum, February 2006 prepared as part of this project.
Alternatives Resulting from the Screening Process Based on the screening evaluation of the corridor modes, the transit technologies and fixed guideway alignment options, four overall alternatives were defined and are recommended to be carried forward for further study. Of these alternatives, two form the benchmark and baseline for comparison of all alternatives. These alternatives are: 1) No Build Alternative, which provides a view of what the transportation system would look like if there were no improvements performed over the evaluation timeline beyond those that are already committed; and 2) a Transportation System Management (TSM) Alternative which is defined, in this case, as the most optimized transit system possible without a major capital investment.
Summary descriptions of the alternatives are as follows:
Alternative 1: No Build Alternative The No Build Alternative includes existing transit and highway facilities, and committed transportation projects anticipated to be operational by 2030. Committed transportation projects are those programmed in the O‘ahu 2030 Regional Transportation Plan, prepared by the O‘ahu Metropolitan Planning Organization. Highway elements of the No Build Alternative will also be included in the build alternatives.
The No Build Alternative’s transit component would include a bus transit system structured generally the same as the current system, but with an increase in fleet size to accommodate growth so that service frequencies would be the same as today. The specific number of buses, as well as required ancillary facilities, will be determined during the preparation of the AA.
Alternative 2: TSM Alternative The Transportation System Management (TSM) Alternative would provide an enhanced bus system based on a hub-and-spoke route network, community bus circulators, and relatively low-cost capital improvements on selected roadway facilities to provide priority to buses. Highway components in the TSM Alternative would be the same as those included in the No Build Alternative.
Final Alternatives Screening Memo Page 5-1 Honolulu High-Capacity Transit Corridor Project

Page 5-2 Final Alternatives Screening Memo Honolulu High-Capacity Transit Corridor Project
Alternative 3: Managed Lanes Alternative The Managed Lanes Alternative would include construction of a two-lane grade-separated facility between Waiawa Interchange and Iwilei for use by buses, para-transit vehicles and vanpool vehicles (see Figure 5-1). The lanes would be managed to maintain free-flow speeds for buses, while simultaneously allowing High-Occupancy Vehicles (HOVs) and variable pricing for toll-paying single-occupant vehicles. Intermediate bus access points would be provided in the vicinity of Aloha Stadium and Middle Street. Bus operations utilizing the managed lanes would be restructured to use the Managed Lane and enhanced to provide additional service between Kapolei and other points ‘Ewa of Downtown, through to the University of Hawai‘i at Mānoa.
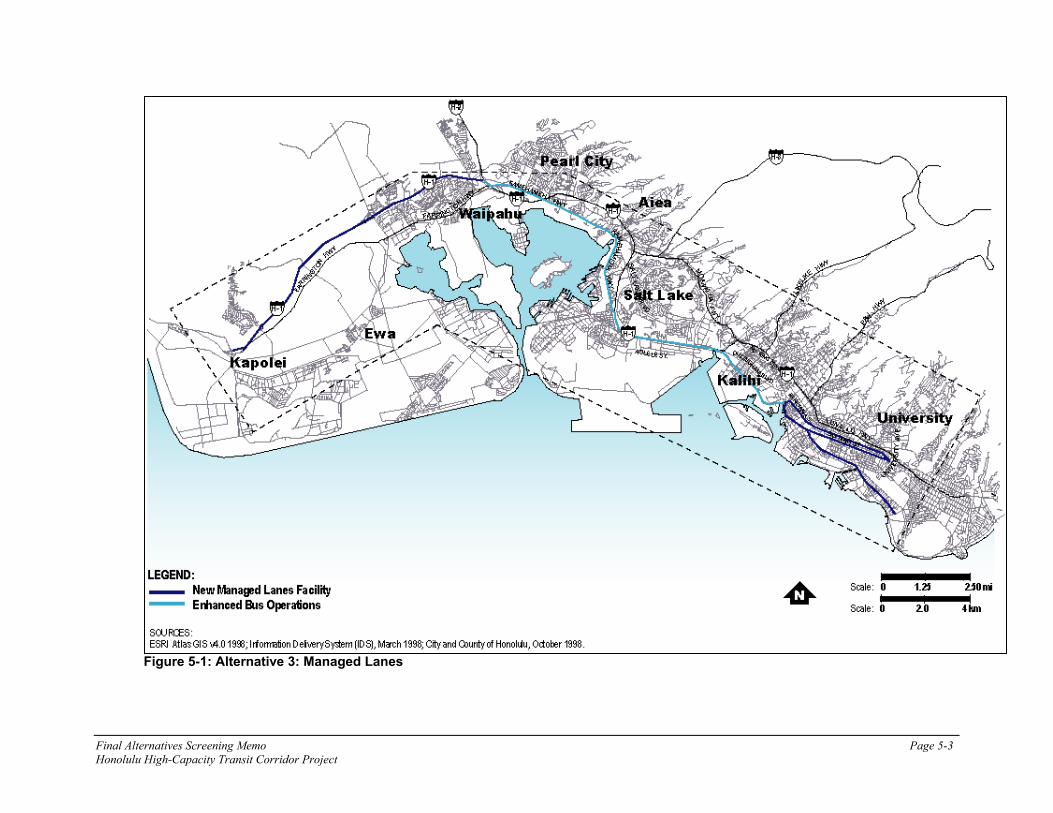
Final Alternatives Screening Memo Page 5-3 Honolulu High-Capacity Transit Corridor Project
Figure 5-1: Alternative 3: Managed Lanes
Page 5-4 Final Alternatives Screening Memo Honolulu High-Capacity Transit Corridor Project
Alternative 4: Fixed-Guideway Alternative Overview
The Fixed-Guideway Alternative would include the construction and operation of a fixed-guideway transit system, in exclusive or semi-exclusive right-of-way, between Kapolei and the University of Hawai‘i at Mānoa. The system could use any fixed-guideway transit technology meeting performance requirements and could either be automated or employ drivers. Bus system changes would be integrated with the project. Station and supporting facility locations will be determined during further alternative development. Supporting facilities would include a vehicle maintenance facility and park-and-ride lots. The alternative would be within existing streets or highway rights-of-way where possible but would require the acquisition of additional property in various locations. This alternative would not preclude future extensions of the system within the corridor, or to Central O‘ahu or East Honolulu.
Technologies Considered
A broad range of technologies were considered for application to this alternative, including conventional bus, guided bus, light rail transit, personal rapid transit, automated people mover, monorail, magnetic levitation (MAGLEV), commuter rail, and emerging technologies that are still in the development stage. Through a screening process, several were selected and will be considered as possible options for use as the fixed-guideway technology. Technologies that were not carried forward from the screening process include personal rapid transit, commuter rail, and the emerging technologies.
Alignment alternatives to be considered include, but are not limited to:
Alternative 4a: Fixed-Guideway Alternative, Kapolei Parkway/Kamokila Boulevard/Salt Lake Boulevard/King Street/Hotel Street/Alakea Street/Kapi‘olani Boulevard/ UH-Mānoa Lower Campus Alignment
The Fixed-Guideway Alternative, Kapolei Parkway/Kamokila Boulevard/Salt Lake Boulevard/King Street/Hotel Street/Alakea Street/Kapi‘olani Boulevard/ UH-Mānoa Lower Campus Alignment would include the construction and operation of a fixed-guideway transit system between Kapolei and the University of Hawai‘i at Mānoa (see Figure 5-2). The system could use any fixed-guideway transit technology meeting performance requirements, and could either be automated or employ drivers. Station and supporting facility locations will be determined during further alternative development. Supporting facilities will include a vehicle maintenance facility and park-and-ride lots. The alignment would be within existing rights-of-way where possible, but would require the acquisition of additional property in various locations. This alternative would not preclude future extension of the system to Central O‘ahu, Waikīkī, or East Honolulu.

Final Alternatives Screening Memo Page 5-5
Figure 5-2: Alternative 4a: Fixed Guideway Alternative, Kapolei Parkway/Kamokila Boulevard/Salt Lake Boulevard/King Street/Hotel Street/Alakea Street/Kapi'olani Boulevard/UH-Mānoa Lower Campus Alignment
Honolulu High-Capacity Transit Corridor Project

Page 5-6 Final Alternatives Screening Memo Honolulu High-Capacity Transit Corridor Project
This alternative would begin at a transit terminal facility on the Wai‘anae (west) side of Kalaeloa Boulevard in Kapolei. It would follow Kapolei Parkway, turn onto Kamokila Boulevard, and continue along Farrington Highway. Koko Head of Kapolei Golf Course Road the guideway could be located either at-grade with limited grade crossings or on elevated structure. Past Fort Weaver Road, the guideway would be elevated and follow Farrington Highway to Kamehameha Highway. In the vicinity of Aloha Stadium, the alignment would turn to follow Salt Lake Boulevard onto Pūkōloa Street, then continue elevated over the Moanalua Stream and follow North King Street to Iwilei.
After crossing Iwilei Road, the line would descend to grade, and follow Hotel Street. The line would operate as a streetcar on Hotel Street with transit signal priority to minimize delays between River Street and Alakea Street. At Alakea Street, the line would begin to descend into a tunnel with a portal at Richards Street. The line would continue in a tunnel under the government campus past Alapa‘i Street, and follow Kapi‘olani Boulevard to Cooke Street. The line would turn makai and begin to climb to an elevated structure following Waimanu Street.
Past Kamake‘e Street the line would turn mauka and follow Kona Street to past the Ala Moana Shopping Center. It would turn mauka just before Atkinson Drive and follow Kapi‘olani Boulevard to University Avenue. The line would then turn mauka and follow University Avenue past the H-1 Freeway and end at a proposed terminal facility in the Quarry at the University of Hawai‘i.
Alternative 4b: Fixed-Guideway Alternative, Kapolei Parkway/North-South Road/Camp Catlin Road/North King Street/Queen Street/ Kapi‘olani Boulevard/UH-Mānoa Lower Campus Alignment
Like Alternative 4a, the Fixed-Guideway Alternative, Kapolei Parkway/North-South Road/Camp Catlin Road/North King Street/Queen Street/ Kapi‘olani Boulevard/UH-Mānoa Lower Campus Alignment would include the construction and operation of a fixed-guideway transit system, with the same termini locations at Kapolei and the University of Hawai‘i at Mānoa (see Figure 5-3). The system could use the same range of technologies discussed for Alternative 4a. Station and supporting facility requirements and options would be the same as Alternative 4a. The alignment would be within existing rights-of-way where possible, but would require the acquisition of additional property in various locations. As with Alternative 4a, this alternative would not preclude future extensions of the system to Central O‘ahu, Waikīkī, or East Honolulu.
This alternative would begin at the transit terminal facility in Kapolei and follow Kapolei Parkway to North-South Road, turn mauka to Farrington Highway and continue along Farrington Highway as shown on the Public Facilities Map of the ‘Ewa Development Plan. Koko Head of Kalaeloa Boulevard, the guideway could be located either at-grade with limited grade crossings or on elevated structure. Past Fort Weaver Road, the guideway would be elevated and follow Farrington Highway to Kamehameha Highway.

Final Alternatives Screening Memo Page 5-7 Honolulu High-Capacity Transit Corridor Project
Figure 5-3: Alternative 4b: Fixed Guideway Alternative, Kapolei Parkway/North-South Road/Camp Catlin Road/King Street/Queen Street/Kapi‘olani Boulevard/UH-Mānoa Lower Campus Alignment

Page 5-8 Final Alternatives Screening Memo Honolulu High-Capacity Transit Corridor Project
In the vicinity of the Airport Viaduct, the alignment would follow the mauka side of H-1 Freeway to Camp Catlin Road, then turn mauka and continue elevated to Salt Lake Boulevard and turn Koko Head, continue elevated over Pūkōloa Street, past the Moanalua Stream and follow North King Street. Between Liliha Street and Iwilei Road, the line would turn makai over property to be acquired or over Nu‘uanu Stream, then follow Nimitz Highway Koko Head to Queen Street and follow Queen Street past Kamake‘e Avenue and follow the new Queen Street Extension alignment.
Property on the mauka side of Waimanu Street would be acquired to allow the alignment to cross over to Kona Street. As in Alternative 4a, the line would run above Kona Street through the Ala Moana Shopping Center and turn mauka to follow Kapi‘olani Boulevard to University Avenue, where it would again turn mauka to follow University Avenue over H-1 Freeway to the University of Hawai‘i at Mānoa.
Design Options
• In the vicinity of Moanalua Stream, the guideway could cross over to Dillingham Boulevard, and continue Koko Head, and would then connect to Nimitz Highway by following Sumner or Kūwili Streets.
• As an option, a branch line could extend from a transfer point at Ala Moana Center or the Hawai‘i Convention Center into Waikīkī following Kalākaua Avenue to Kūhiō Avenue, then extending along Kūhiō Avenue to the vicinity of Kapahulu Avenue.
Alternative 4c: Fixed-Guideway Alternative, Kapolei Parkway/Ft. Weaver Road/Farrington Highway/ Kamehameha Highway/ Dillingham Boulevard/Ka‘aahi Street/Beretania Street/ King Street/Kai‘ali‘u Street/UH-Mānoa Lower Campus Alignment
Like Alternatives 4a and 4b, the Fixed-Guideway Alternative, Kapolei Parkway/Ft. Weaver Road/Farrington Highway/ Kamehameha Highway/ Dillingham Boulevard/Ka‘aahi Street/Beretania Street/ King Street/Kai‘ali‘u Street/UH-Mānoa Lower Campus Alignment would include the construction and operation of a fixed-guideway transit system, with the same termini locations at Kapolei and the University of Hawai‘i at Mānoa (see Figure 5-4). The system could use the same range of technologies discussed for Alternatives 4a and 4b. Station and supporting facility requirements and options would be the same as Alternatives 4a and 4b. The alignment would be within existing rights-of-way where possible, but would require the acquisition of additional property in various locations. As with Alternatives 4a and 4b, this alternative would not preclude future extensions of the system to Central O‘ahu, Waikīkī, or East Honolulu.
This alternative would begin at the transit terminal facility in Kapolei and follow Kapolei Parkway to Wākea Street then turn makai to Saratoga Road. The line would continue on a future extension of Saratoga Road and Geiger Road to Fort Weaver Road. Continuing on Fort Weaver Road, the alignment would turn Koko Head onto Farrington Highway and follow Farrington Highway on elevated structure to Kamehameha Highway. At the
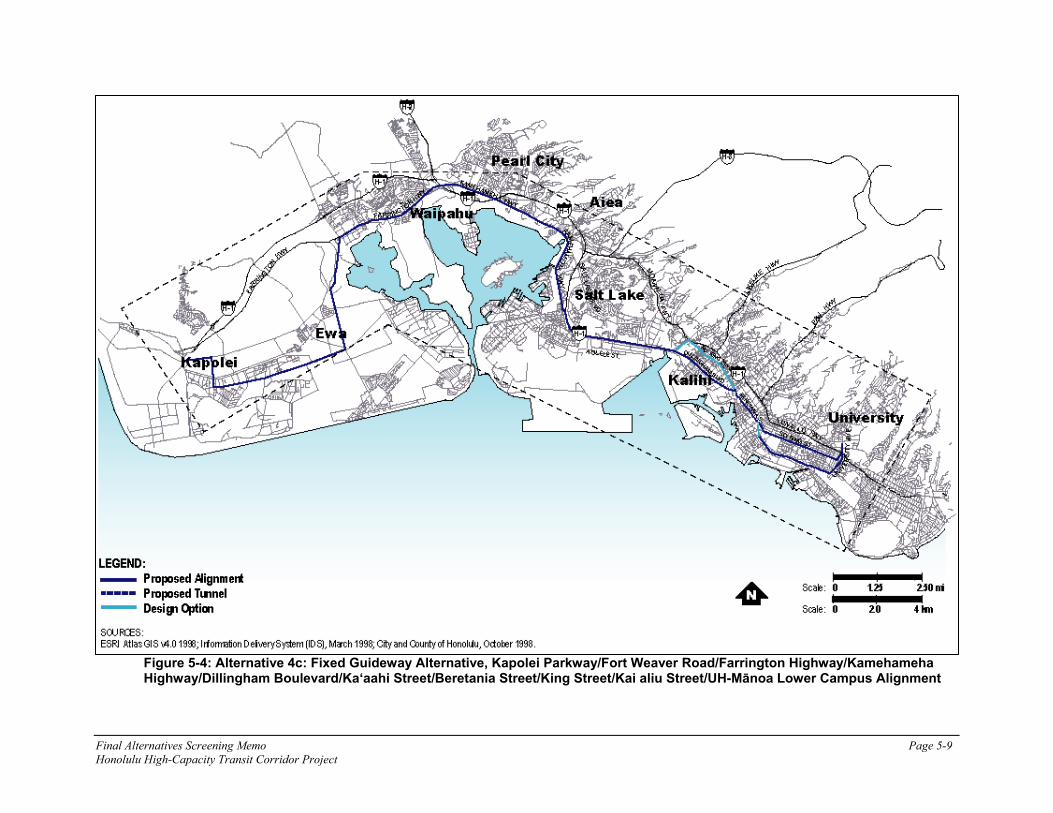
Final Alternatives Screening Memo Page 5-9
Figure 5-4: Alternative 4c: Fixed Guideway Alternative, Kapolei Parkway/Fort Weaver Road/Farrington Highway/Kamehameha Highway/Dillingham Boulevard/Ka‘aahi Street/Beretania Street/King Street/Kai aliu Street/UH-Mānoa Lower Campus Alignment
Honolulu High-Capacity Transit Corridor Project
Page 5-10 Final Alternatives Screening Memo Honolulu High-Capacity Transit Corridor Project
Pearl Harbor Interchange the line could continue either at-grade in the median of the Nimitz Highway under the viaduct, or continue elevated along the mauka side of H-1 Freeway to Dillingham Boulevard then follow Dillingham Boulevard Koko Head to Ka‘aahi Street.
The line would descend to a tunnel portal in the vicinity of Ka‘aahi Street. The line would continue in a tunnel under ‘A‘ala Park, continue under Nu‘uanu Stream and follow Beretania Street to beyond Punchbowl Street, then climb to an elevated structure and cross over Alapa‘i Street turning makai to continue onto South King Street. The line would run above South King Street to Kai‘ali‘u Street, where it would turn mauka to cross over University Avenue and the H-1 Freeway to the University of Hawai‘i at Mānoa.
Design Options
• In the vicinity of Middle Street, the guideway could cross over to North King Street, and follow North King Street Koko Head, then descend to a tunnel portal in property to be acquired in the vicinity of Liliha Street.
• Another alignment option could serve Ala Moana Center by continuing underground to follow Kapi‘olani Boulevard to Dreier Street as described for Alternative 4a, or to follow Kawaiaha‘o Street as described for Alternative 4d. The guideway would transition to an elevated structure as described for those two alternatives.
Alternative 4d: Fixed-Guideway Alternative, Kapolei Parkway/North-South Road/Farrington Highway/ Kamehameha Highway/ Airport/Dillingham/Hotel Street/ Kapi‘olani Boulevard/UH-Mānoa Lower Campus with Waikīkī Spur Alignment
Like Alternatives 4a, 4b, and 4c the Fixed-Guideway Alternative, Kapolei Parkway/ North-South Road/Farrington Highway/ Kamehameha Highway/ Airport/Dillingham/ Hotel Street/ Kapi‘olani Boulevard/UH-Mānoa Lower Campus with Waikīkī Spur Alignment would include the construction and operation of a fixed-guideway transit system, with the same termini locations at Kapolei and the University of Hawai‘i at Mānoa (see Figure 5-5). The system could use the same range of technologies discussed for Alternatives 4a, 4b, and 4c. Station and supporting facility requirements and options would be the same as Alternatives 4a, 4b, and 4c. The alignment would be within existing rights-of-way where possible, but would require the acquisition of additional property in various locations. As with Alternative 4a, 4b, and 4c, this alternative would not preclude future extensions of the system to Central O‘ahu or East Honolulu.
This alternative would begin at the transit terminal facility in Kapolei and follow Kapolei Parkway to Wākea Street then turn makai to a future alignment of Wākea Road to Saratoga Road. The line would continue on future extensions of Saratoga Road and North-South Road and follow North-South Road to Farrington Highway. ‘Ewa of Fort Weaver Road, the guideway could be located either at-grade with limited grade crossings

Final Alternatives Screening Memo Page 5-11
Figure 5-5: Alternative 4d: Fixed Guideway Alternative, Kapolei Parkway/North-South Road/Farrington Highway/Kamehameha Highway/Airport/Dillingham Boulevard/Hotel Street/Kapi‘olani Boulevard/UH-Mānoa Lower Campus with Waikīkī Branch Alignment
Honolulu High-Capacity Transit Corridor Project

or on elevated structure. Koko Head of Fort Weaver Road, the guideway would be on a elevated structure and follow Farrington Highway to Kamehameha Highway.
The alignment would be elevated along the makai side of the H-1 freeway to Dillingham Boulevard. On elevated structure, the line would follow Dillingham Boulevard Koko Head to Ka‘aahi Street. In the vicinity of Ka‘aahi Street, the line would descend to grade, and cross North King onto Hotel Street. The line would operate as a streetcar with transit signal priority on Hotel Street to minimize delays between River Street and Alakea Street. As in Alternative 4a, the line would begin to descend into a tunnel with a portal at Richards Street. The line would continue in a tunnel under the government campus to past Honolulu Hale and turn makai under South King Street and follow Kawaiaha‘o Street, where it would begin to climb to an elevated structure past South Street. It would continue on Kawaiaha‘o Street almost to Kamake‘e Street, where property on each side of Kamake‘e Street would be acquired to allow the alignment to cross over to Kona Street. As in Alternative 4a, the line would run above Kona Street through the Ala Moana Shopping Center and turn mauka to follow Kapi‘olani Boulevard to University Avenue, where it would again turn mauka to follow University Avenue over H-1 Freeway to the University of Hawai‘i at Mānoa.
A branch line would extend from a transfer point at Ala Moana Shopping Center or the Hawai‘i Convention center into Waikīkī following Kalākaua Avenue to Kūhiō Avenue, then extending along Kūhiō Avenue to the vicinity of Kapahulu Avenue.
Design Option
• In the vicinity of Honolulu International Airport, the alignment could turn makai onto Aolele Street towards the airport and then follow Aolele Street to reconnect to Nimitz Highway near Ke‘ehi Interchange.
Page 5-12 Final Alternatives Screening Memo Honolulu High-Capacity Transit Corridor Project

Chapter 6 Post Scoping Alternative Refinement Subsequent to the public and agency scoping meetings several refinements were made to the Alternatives. Most of these related to the alignment options for the Fixed Guideway Alternative, but one was related to the Managed Lane Alternative.
Changes to the Managed Lane Alternative Based on scoping comments, a second operational option was included under the Managed Lane Alternative. The initial option proposed a two-lane grade-separated facility between Waiawa Interchange and Iwilei which would operate as one lane in each direction at all times of the day. The second option proposes similar infrastructure, but it would operate as a reversible facility with two lanes traveling Koko Head during the morning peak period, and then reversing to travel ‘Ewa in the PM peak period. Both operational options would include restructured and enhanced bus operations by utilizing the managed lanes to provide additional service between Kapolei and other points ‘Ewa of Downtown, and both would be managed to maintain free-flow speeds for buses. Provided enough capacity exists, High-Occupancy Vehicles (HOVs) and toll-paying single-occupant vehicles would also be allowed to use the facility under either scenario; however, it is possible that under the initial option (one lane in each direction), there would not be enough excess capacity to allow toll-paying single occupant vehicles and still maintain reasonable speeds. Intermediate access points would be provided in the vicinity of Aloha Stadium and the Ke‘ehi Interchange.
Refinements to Fixed Guideway Alternative Alignments Public comments received through the official scoping process were evaluated by the Project Team and caused some alignments to be re-evaluated. There were five alignments that were affected by re-evaluation of the screening. The first re-evaluation stemmed directly from a scoping meeting comment. A public commenter recommended considering an alignment along Ala Moana Boulevard makai of Ala Moana Center. The second and third changes were based on further engineering evaluation of the alignments. The Nimitz Highway at-grade option through Section 4 proved to have a fatal flaw due to engineering constraints as well as impacts associated with interacting with at-grade vehicular traffic. In light of engineering constraints identified along the Queen Street alignment in Section 6, the Halekauwila Street elevated alignment that passes the Aloha Tower was reconsidered and reinstated as a potential alignment option in order to provide an alternative elevated option through downtown. The fourth change was an adjustment to an alignment to allow Fort Weaver Road to be considered as an alignment option itself. The fifth and final scoping comment was from the Department of the Navy regarding Camp Catlin Road. Camp Catlin Road hosts Navy housing and the Navy expressed a strong preference that the Camp Catlin Road alignment option be excluded. The evaluation of the additional alignments was completed following the same process by which all other alignments were screened.
One non-alignment related comment received at scoping was a recommendation to change the way the alignments were presented to allow for a mix-and-match solution to
Final Alternatives Screening Memo Page 6-1 Honolulu High-Capacity Transit Corridor Project

determining the fixed guideway alignments. Consequently, subsequent analysis and presentations to the public displayed all section alignment options. Below is a summary of the analysis and the post scoping alignment changes:
Ala Moana Boulevard An alignment was recommended to follow the length of Ala Moana Boulevard makai of Ala Moana Center. This alignment would begin in Section 6 on Nimitz Highway and follow Ala Moana Boulevard. In Section 7, this alignment would follow Ala Moana Boulevard makai of Ala Moana Center and either continue on Ala Moana Boulevard into Waikīkī or turn mauka on Atkinson Drive to Kapi‘olani Boulevard. In keeping with the analysis process used throughout the screening, the alignment was evaluated on how well it met the criteria within each section. The population and employment data are included in Appendix A within the appropriate sections.
Ala Moana Boulevard – Section 6
This alignment would be beneficial for the redevelopment and growth efforts in Kaka‘ako, however there are more serious negative impacts that outweigh the positive growth. The guideway would require the construction of a raised median, widening of the roadway, and acquisition of private properties to avoid shortening of left-turn bays along this major arterial. Negative visual impacts would occur, particularly in the waterfront area near the new cruise ship terminal. The population and employment data in this section illustrate that there is less ridership potential than along the other alignments and the general orientation is too far makai to serve many of the most dense residential and employment centers in this section. Overall, the negative impacts on this major arterial, which serves as a primary connection between Waikīkī and downtown Honolulu, outweigh the positive effects of this alignment.
Ala Moana Boulevard – Section 7
This alignment along Ala Moana Boulevard would serve the Ala Moana Center, but the makai orientation limits the accessibility of the alignment. The more dense activity centers are on the mauka side of this alignment. The makai side would only serve Ala Moana Beach Park and Kewalo Basin, which are not high density areas. The alignments that follow Kona Street serve Ala Moana Center equally well as this alignment, but they offer more accessibility to the system for other employment and population centers in addition to Ala Moana Center. The elevation of the guideway along this alignment would have a serious negative visual impact to Kewalo Basin and Ala Moana Beach Park areas. There would be available space for the construction of the guideway along the divided road in this section, however the comparatively poor service to areas around Ala Moana Center, the additional length of the alignment and negative visual impacts diminish the attractiveness of this alignment.
Based on this assessment, the Ala Moana alignment through Sections 6 and 7 are not recommended for further consideration.
Page 6-2 Final Alternatives Screening Memo Honolulu High-Capacity Transit Corridor Project
Section 4: Nimitz Highway (at-grade) A fatal flaw was identified along the Nimitz Highway at-grade alignment under the airport viaduct through Section 4 as more detailed engineering analysis was completed. The existing and planned highway segments along Nimitz Highway create major engineering challenges to the construction and connectivity of a fixed-guideway system at-grade. The biggest challenge is providing a connection to cross out from the median under the viaduct on the Koko Head side near the Ke‘ehi interchange. Additionally, an at-grade alignment would require that the guideway interact with at-grade traffic. There are nine intersections along this alignment that the fixed guideway system would have to pass through. Depending on the level of signal priority provided, passing through these intersections will either impact the speed of the transit vehicles, or severely impact roadway cross traffic and turning traffic. As a result of the engineering limitations and serious traffic impacts, the Nimitz Highway at-grade alignment option was dropped from further consideration.
Section 6: Nimitz Highway to Halekauwila Street (elevated) Further analysis of all alignments and feedback from the scoping meeting identified engineering and access constraints along the Queen Street alignment in Section 6. The elevated alignment would have to pass very near high-rise buildings in some locations. Locating stations within the physical constraints of this alignment is a particular challenge. Because of some uncertainty associated with the Queen Street alignment, the Section 6 analysis was re-evaluated to identify other potential elevated options. The Nimitz Highway to Halekauwila Street alignment received high evaluations for four of the five defined criteria. Although the alignment has negative community and environmental impacts due to the visual impact of an elevated alignment to Aloha Tower, this alignment received the best overall evaluation of all alignments within this section. The negative visual impact remains an issue, however, based on the otherwise positive evaluation and its ability to provide similar service to the Queen Street alignment, the Halekauwila Street alignment will be retained for further detailed analysis. The Queen Street alignment will not be dropped, but requires further detailed analysis to identify the extent of the identified constraints.
Fort Weaver Road Alignment A request was made at a public meeting that Fort Weaver Road be considered as an alignment option in Section 1. A portion of Fort Weaver Road was considered initially as part of an alignment from Kapolei Parkway to Wākea Street extension to Saratoga Road to Geiger Road and mauka on Fort Weaver to Farrington Highway. However, this request was for an alignment along the full length of Fort Weaver Road from the intersection of Farrington Highway ending at Pāpipi Road. Therefore, a complete analysis was conducted to compare this alignment with others in the same section. The population and employment data was included in the Appendix A, Table 1.
This alignment rated moderately in mobility and accessibility because the population and employment densities ranked fourth of eight alignment options in this section. This alignment is not included as a transit route on any adopted plans and the construction impacts on existing traffic along Fort Weaver Road would be a major detriment to the
Final Alternatives Screening Memo Page 6-3 Honolulu High-Capacity Transit Corridor Project

already congested arterial. Therefore, it rated low in the criteria of encouraging smart growth and economic development, minimizing community impacts and planning consistency. Additionally, this alignment and the terminus at Pāpipi Road do not facilitate access to Kapolei. This alignment rates well for constructability and cost because it is shorter than other alignment alternatives and therefore would require a lower capital investment.
Overall, this alignment does not score well enough to be carried forward into the detailed alternatives analysis; however it will be retained as a potential future spur.
Camp Catlin Road Camp Catlin Road crosses through an area of Navy housing and potential use of this property for this project has started a dialogue. The alignment is in conflict with the Navy’s housing redevelopment plans for this particular area. Currently, it is unknown if or when a final decision on this issue will be made, however as long as other viable alternatives exist, this will not be considered as a viable alignment option.
King Street Tunnel After initial cost estimates were derived for the Beretania Street tunnel, it was clear that the cost for a tunnel was not as high as initially expected. Since the costs were not as excessive as thought, a King Street Tunnel option was reconsidered. King Street provides good access to the heart of the Central Business District, direct service to the government center, and is a direct route depending on connections into other sections. As such, this option was added to the potential alignments.
The King Street Tunnel alignment considered would connect from North King Street in Kalihi, would descend to a tunnel on the ‘Ewa side of Ka’aahi Street and would follow under Iwilei Road in a relatively straight line until it could follow South King Street uin the vicinity of Nuuanu Stream. The alignment would continue underground following South King Street, shift to follow Kapiolani Boulevard to Dreier Street. The guideway would turn makai and transition to an elevated structure on private property on Waimanu Street between Dreier Street and Kamani Street. Following Waimanu Street past Kamakee Street, the guideway would turn mauka and follow Kona Street and continue to the UH at Manoa as with the Hotel Street/Kawaiahao Street alignment.
Selected Fixed Guideway Alignments and Presentation of Alignment Options by Section Based on the analysis provided above and the recommendation to present alignment options by sections, Table 6-1 summarizes the alignment selected for further study. Of additional note is the decrease in the number of sections from eight to five. The connections between some sections were driven by previous sections, therefore those areas were combined to create a more manageable range of alignments. Specifically, Sections 2 and 3 both had only Kamehameha Highway as an option, so they were combined into one section. Sections 6, 7, and 8 were combined into one section because of the limited combination options between alignments within the sections.
Page 6-4 Final Alternatives Screening Memo Honolulu High-Capacity Transit Corridor Project

The Fixed Guideway Alternative alignments were developed by creating logical connections between sections to develop a short list of alternatives. Ultimately, the exact connectivity between sections will be determined through the selection of a Locally Preferred Alternative. This alternative may incorporate pieces of the alternatives as defined above.
Table 6-1: Fixed Guideway Alternative Sections and Alignments After Scoping
Section Alignments Being Considered Kamokila Boulevard/Farrington Highway I. Kapolei to Fort Weaver
Road Kapolei Parkway/North-South Road Saratoga Avenue/North-South Road Geiger Road/Fort Weaver Road
II. Fort Weaver Road to Aloha Stadium
Farrington Highway/Kamehameha Highway
Salt Lake Boulevard III. Aloha Stadium to Middle Street Mauka of the Airport Viaduct Makai of the Airport Viaduct
Aolele Street
IV. Middle Street to Iwilei North King Street Dillingham Boulevard
V. Iwilei to UH Mānoa Beretania Street/South King Street
Hotel Street/Kawaiaha‘o Street/Kapi‘olani Boulevard
King Street/Waimanu Street/Kapi‘olani Boulevard
Nimitz Highway/Queen Street/Kapi‘olani Boulevard
Nimitz Highway/Halekauwila Street/Kapi‘olani Boulevard
Waikīkī Branch
Final Alternatives Screening Memo Page 6-5 Honolulu High-Capacity Transit Corridor Project


Final Alternatives Screening Memo Honolulu High-Capacity Transit Corridor Project


References Chiddix and Simpson, 2004. Next Stop Honolulu: Story of the O‘ahu Railway & Land Company. Jim Chiddix and MacKinnon Simpson. Sugar Cane Press, Honolulu.
DBEDT, 2003. The Economic Contribution of Waikīkī. Department of Business, Economic Development and Tourism.
DPP, 1999 (revised 2000). Ewa Sustainable Communities Plan. City and County of Honolulu Department of Planning and Permitting
DPP, 1999. East Honolulu Sustainable Communities Plan. City and County of Honolulu Department of Planning and Permitting
DPP, 1999. Koolau loa Sustainable Communities Plan. City and County of Honolulu Department of Planning and Permitting
DPP, 2000. Koolaupoko Sustainable Communities Plan. City and County of Honolulu Department of Planning and Permitting
DPP, 2000. North Shore Sustainable Communities Plan. City and County of Honolulu Department of Planning and Permitting
DPP, 2000. Waianae Sustainable Communities Plan. City and County of Honolulu Department of Planning and Permitting
DPP, 2002. Central Oahu Sustainable Communities Plan. City and County of Honolulu Department of Planning and Permitting.
DPP, 2004. Primary Urban Center Sustainable Communities Plan. City and County of Honolulu Department of Planning and Permitting.
DTS, 1992. Final Environmental Impact Statement Honolulu Rapid Transit Program. City and County of Honolulu Department of Transportation Services and U.S. DOT Federal Transit Administration.
DTS, 1998. O‘ahu Trans 2K Island Wide Mobility Concept Study. City and County of Honolulu Department of Transportation Services.
DTS, 1999. Primary Corridor Transportation Project Transit Alternatives Analysis. City and County of Honolulu Department of Transportation Services.
DTS, 2002. Primary Corridor Transportation Project Transit Final Environmental Impact Statement. City and County of Honolulu Department of Transportation Services.
DTS, 2006a. Honolulu High-Capacity Transit Corridor Project Alternatives Analysis Definition of Alternatives Report. City and County of Honolulu Department of Transportation Services.
Final Alternatives Screening Memo Page R-1 Honolulu High-Capacity Transit Corridor Project
DTS, 2006b. Honolulu High-Capacity Transit Corridor Project Screening Report. City and County of Honolulu Department of Transportation Services.
DTS, 2006c. Honolulu High-Capacity Transit Corridor Project Scoping Report.
DTS, 2006d. Honolulu High-Capacity Transit Corridor Project Final Technology Options Evaluation Memo.
HDOT, 2003, Bike Plan Hawai‘i. Hawai‘i Department of Transportation.
OMPO, 1984. HALI 2000 Study Alternatives Analysis Final Report. O‘ahu Metropolitan Planning Organization.
OMPO, 1995. O‘ahu Regional Transportation Plan. O‘ahu Metropolitan Planning Organization.
OMPO, 2001. Transportation for O‘ahu Plan TOP 2025. O‘ahu Metropolitan Planning Organization.
OMPO, 2006. 2030 O‘ahu Regional Transportation Plan. O‘ahu Metropolitan Planning Organization.
OTPP, 1967. O‘ahu Transportation Study Summary Report. O‘ahu Transportation Planning Program.
UH, 2005. Common Data Set 2004-2005 University of Hawai‘i at Mānoa. University of Hawai‘i Institutional Research Office.
UH, 2002. Trends in the College Experiences of Undergraduates at the University of Hawai‘i at Mānoa from 1990 to 2002. University of Hawai‘i Office of the Vice President for Student Affairs.
Page R-2 Final Alternatives Screening Memo Honolulu High-Capacity Transit Corridor Project
Final Alternatives Screening Memo Page A-1 Honolulu High-Capacity Transit Corridor Project
APPENDIX A Corridor Population and Employment Statistics

Honolulu High-Capacity Transit Alternatives Alignment Population and Employment Data by Corridor Section
Section 1: Kapolei to Fort Weaver Road
Population w/in ¼-mile
Employment w/in ¼-mile
Length of Alignment
Population per mile
Jobs per mile
Alignment Option 2000 2030 2030 (miles) 2030 2030 1.1 Kapolei Parkway to Wākea Street to H-1 Freeway (at-grade or elevated) 1,290 15,478 7,360 4.9 3,168 1,506
1.2 Kapolei Parkway to Kamokila Boulevard to Farrington Highway (partially at-grade or elevated) 2,992 23,950 9,412 4.9 4,898 1,925
1.3 Kapolei Parkway to Fort Barrette Road to Farrington Highway (partially at-grade or elevated) 4,043 30,638 8,995 5.6 5,494 1,613
1.4 Kapolei Parkway to North-South Road to Farrington Highway (at-grade or elevated) 2,057 27,399 3,420 6.1 4,484 560
1.5 Kapolei Parkway to Wākea Street extension to the O‘ahu Rail & Land (OR&L) railroad right-of-way, or use of Renton Road to Fort Weaver Road (at-grade)
11,726 19,555 5,396 6.0 3,250 897
1.6 Kapolei Parkway to Wākea Street extension to Saratoga Avenue to extensions of Saratoga Avenue and North-South Road (at-grade or elevated)
14,140 18,792 4,551 6.9 2,727 660
1.7 Kapolei Parkway to Wākea Street extension to Saratoga Avenue to extension of Saratoga Avenue to Geiger Road to Fort Weaver Road.
8,099 23,096 3,985 6.4 3,587 619
Post Scoping: ‘Ewa Extension: Fort Weaver Road between Pāpipi Drive and Farrington Highway 13,514 17,009 4,672 4.4 3,866 1,061
Page A- 2 Final Alternatives Screening Memo Honolulu High-Capacity Transit Corridor Project
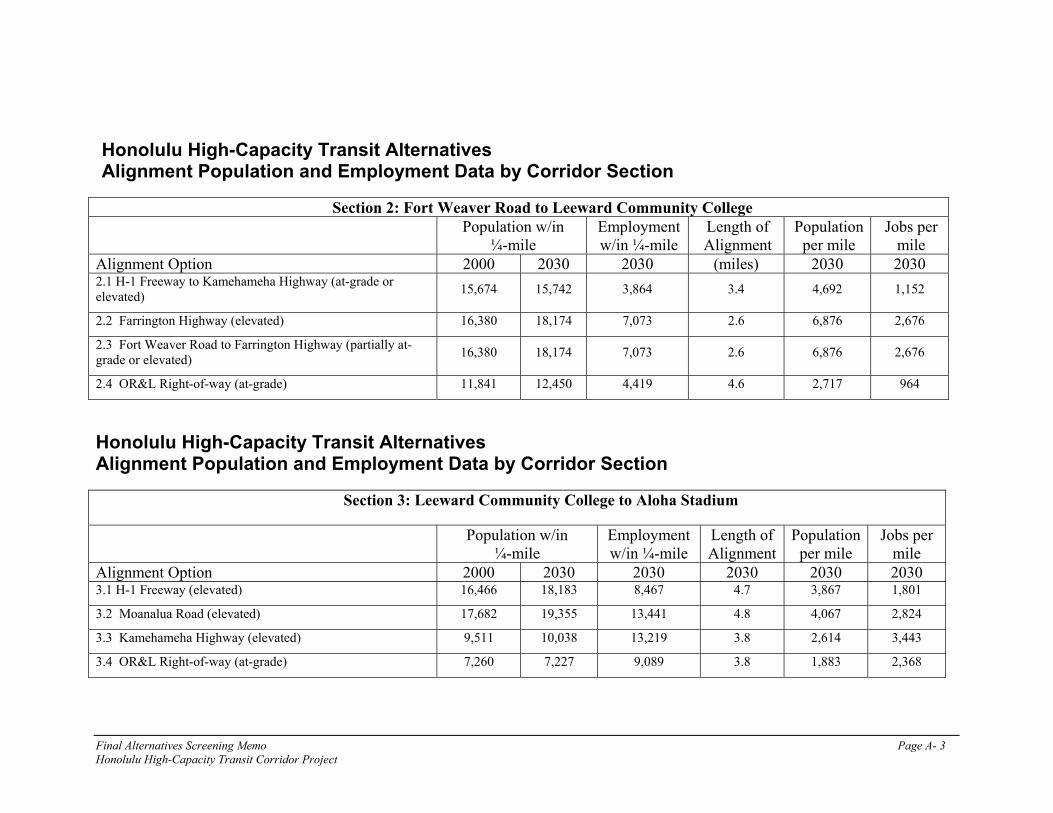
Honolulu High-Capacity Transit Alternatives Alignment Population and Employment Data by Corridor Section
Section 2: Fort Weaver Road to Leeward Community College Population w/in
¼-mile Employment w/in ¼-mile
Length of Alignment
Population per mile
Jobs per mile
Alignment Option 2000 2030 2030 (miles) 2030 2030 2.1 H-1 Freeway to Kamehameha Highway (at-grade or elevated) 15,674 15,742 3,864 3.4 4,692 1,152
2.2 Farrington Highway (elevated) 16,380 18,174 7,073 2.6 6,876 2,676
2.3 Fort Weaver Road to Farrington Highway (partially at-grade or elevated) 16,380 18,174 7,073 2.6 6,876 2,676
2.4 OR&L Right-of-way (at-grade) 11,841 12,450 4,419 4.6 2,717 964
Honolulu High-Capacity Transit Alternatives Alignment Population and Employment Data by Corridor Section
Section 3: Leeward Community College to Aloha Stadium
Population w/in ¼-mile
Employment w/in ¼-mile
Length of Alignment
Population per mile
Jobs per mile
Alignment Option 2000 2030 2030 2030 2030 2030 3.1 H-1 Freeway (elevated) 16,466 18,183 8,467 4.7 3,867 1,801
3.2 Moanalua Road (elevated) 17,682 19,355 13,441 4.8 4,067 2,824
3.3 Kamehameha Highway (elevated) 9,511 10,038 13,219 3.8 2,614 3,443
3.4 OR&L Right-of-way (at-grade) 7,260 7,227 9,089 3.8 1,883 2,368
Final Alternatives Screening Memo Page A- 3 Honolulu High-Capacity Transit Corridor Project
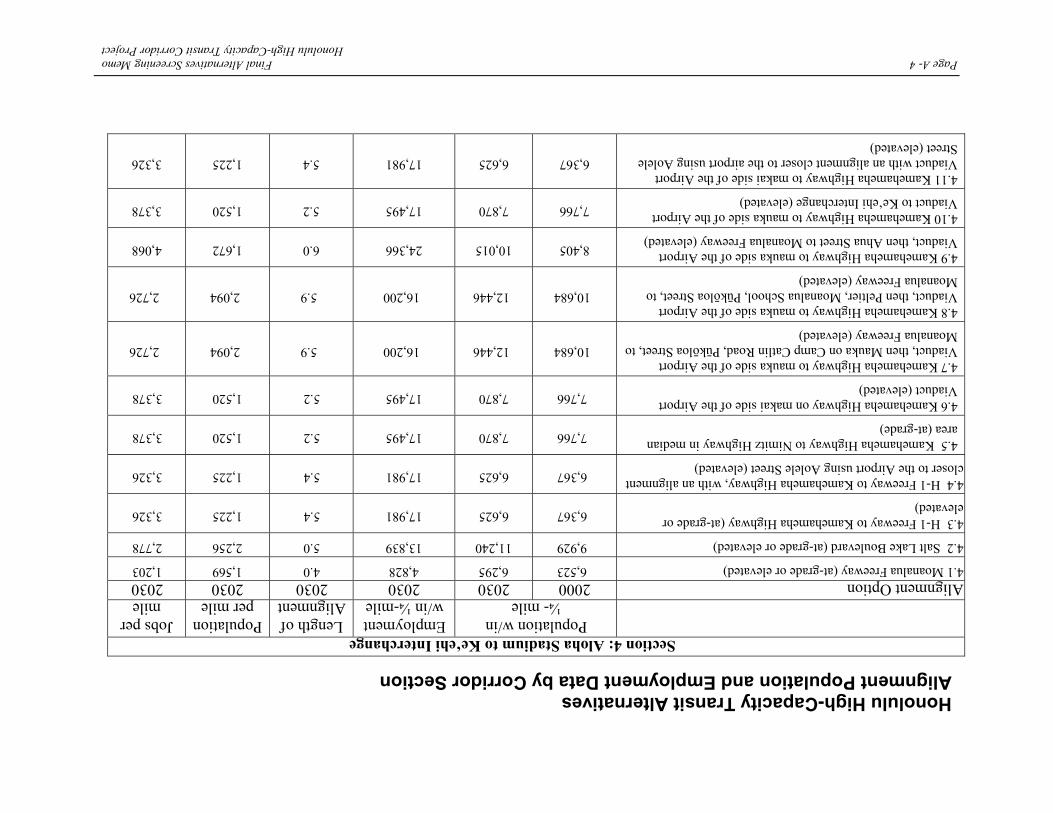
Honolulu High-Capacity Transit Alternatives Alignment Population and Employment Data by Corridor Section
Section 4: Aloha Stadium to Ke‘ehi Interchange Population w/in
¼- mile Employment w/in ¼-mile
Length of Alignment
Population per mile
Jobs per mile
Alignment Option 2000 2030 2030 2030 2030 2030 4.1 Moanalua Freeway (at-grade or elevated) 6,523 6,295 4,828 4.0 1,569 1,203
4.2 Salt Lake Boulevard (at-grade or elevated) 9,929 11,240 13,839 5.0 2,256 2,778
4.3 H-1 Freeway to Kamehameha Highway (at-grade or elevated) 6,367 6,625 17,981 5.4 1,225 3,326
4.4 H-1 Freeway to Kamehameha Highway, with an alignment closer to the Airport using Aolele Street (elevated) 6,367 6,625 17,981 5.4 1,225 3,326
4.5 Kamehameha Highway to Nimitz Highway in median area (at-grade) 7,766 7,870 17,495 5.2 1,520 3,378
4.6 Kamehameha Highway on makai side of the Airport Viaduct (elevated) 7,766 7,870 17,495 5.2 1,520 3,378
4.7 Kamehameha Highway to mauka side of the Airport Viaduct, then Mauka on Camp Catlin Road, Pūkōloa Street, to Moanalua Freeway (elevated)
10,684 12,446 16,200 5.9 2,094 2,726
4.8 Kamehameha Highway to mauka side of the Airport Viaduct, then Peltier, Moanalua School, Pūkōloa Street, to Moanalua Freeway (elevated)
10,684 12,446 16,200 5.9 2,094 2,726
4.9 Kamehameha Highway to mauka side of the Airport Viaduct, then Ahua Street to Moanalua Freeway (elevated) 8,405 10,015 24,366 6.0 1,672 4,068
4.10 Kamehameha Highway to mauka side of the Airport Viaduct to Ke‘ehi Interchange (elevated) 7,766 7,870 17,495 5.2 1,520 3,378
4.11 Kamehameha Highway to makai side of the Airport Viaduct with an alignment closer to the airport using Aolele Street (elevated)
6,367 6,625 17,981 5.4 1,225 3,326
Page A- 4 Final Alternatives Screening Memo Honolulu High-Capacity Transit Corridor Project

Honolulu High-Capacity Transit Alternatives Alignment Population and Employment Data by Corridor Section
Section 5: Ke‘ehi Interchange / Moanalua Stream to Iwilei
Population w/in ¼- mile
Employment w/in ¼-mile
Length of Alignment
Population per mile
Jobs per mile
Alignment Option 2000 2030 2030 2030 2030 2030
5.1 School Street 32,004 32,421 29,314 2.7 12,124 10,962
5.2 H-1 Freeway to Vineyard Boulevard 29,758 30,556 17,624 2.2 13,900 8,017
5.3 North King Street 20,736 22,157 5,426 2.2 10,157 2,487
5.4 Dillingham Boulevard 14,001 14,652 3,171 2.4 6,144 1,330
5.5 Nimitz Highway 10,429 13,059 2,649 2.5 5,216 1,058
Final Alternatives Screening Memo Page A- 5 Honolulu High-Capacity Transit Corridor Project

Honolulu High-Capacity Transit Alternatives Alignment Population and Employment Data by Corridor Section
Section 6: Iwilei to Ward Avenue Population w/in
¼- mile Employment w/in ¼-mile
Length of Alignment
Population per mile
Jobs per mile
Alignment Option 2000 2030 2030 2030 2030 2030 6.1 H-1 Freeway (elevated) 24,275 26,729 6,750 1.1 24,535 6,196 6.2 Vineyard Boulevard to Pali Highway to Beretania Street 49,384 54,572 15,880 1.3 41,406 12,049 6.3 Beretania Street to Fort Street mauka to Vineyard Boulevard to Lusitania Street to Kīna‘u Street to Ward Avenue 53,762 59,681 17,606 1.5 39,737 11,723
6.4 Beretania Street to Fort Street mauka to Vineyard Boulevard to Lusitania Street to Alapa‘i Street to South King Street to Ward Avenue (elevated)
53,762 59,681 17,606 1.5 39,737 11,723
6.5 Beretania Street to Fort Street mauka to Vineyard Boulevard to Lusitania Street to Alapa‘i Street to Cooke Street to Kawaiaha‘o Street to Ward Avenue (elevated)
53,762 59,681 17,606 1.5 39,737 11,723
6.6 Beretania Street to Ward Avenue (elevated) 50,543 55,000 15,874 1.1 48,823 14,091 6.7 South King Street to Ward Avenue (elevated) 62,386 68,947 17,725 1.3 52,951 13,613 6.8 South King Street to Kapi‘olani Boulevard to Ward Avenue (elevated or partially in tunnel) 62,386 68,947 17,725 1.3 52,951 13,613
6.9 Tunnel from Ka‘aahi Street under Hotel Street to Waimanu Street (tunnel) 57,986 63,810 18,031 1.3 48,821 13,796
6.10 Tunnel from Ka‘aahi Street under King Street to Waimanu Street (tunnel) 57,986 63,810 18,031 1.3 48,821 13,796
6.11 At-grade from Ka‘aahi Street to Iwilei Road., North King Street, Hotel Street, to tunnel before Richards Street to Kawaiaha‘o Street to elevated structure Koko Head of Cooke Street to Ward Avenue (at-grade, tunnel and elevated)
62,386 68,947 17,725 1.3 52,951 13,613
6.12 Nimitz Highway to Queen Street to South Street to South King Street (elevated) 62,386 68,947 17,725 1.3 52,951 13,613
6.13 Nimitz Highway to Queen Street (elevated) 59,176 65,531 16,010 1.4 48,392 11,822 6.14 Nimitz Highway to Halekauwila Street to Ward (elevated) 59,176 65,531 16,010 1.4 47,535 11,613 6.15 Tunnel from Kaahi Street under ‘A‘ala Park, under Beretania Street to beyond Punchbowl Street, elevated structure over Alapa‘i Street makai to continue onto South King Street
53,762 59,681 17,606 1.5 39,737 11,723
Post Scoping: Nimitz Highway to Ala Moana Boulevard (elev) 52,731 58,031 13,023 1.6 36,269 8,139
Page A- 6 Final Alternatives Screening Memo Honolulu High-Capacity Transit Corridor Project

Honolulu High-Capacity Transit Alternatives Alignment Population and Employment Data by Corridor Section
Section 7: Ward Avenue to Kalākaua Avenue
Population w/in ¼- mile
Employment w/in ¼-mile
Length of Alignment
Population per mile
Jobs per mile
Alignment Option 2000 2030 2030 2030 2030 2030 7.1 Wilder Avenue to Punahou Street 1,937 4,917 16,685 1.1 4,435 15,049
7.2 H-1 Freeway 1,484 4,067 17,148 1.0 4,008 16,898
7.3 Kīna‘u Street, Beretania Street, or South King Street to Pensacola Street or Pi‘ikoi Street to Wilder Avenue to Punahou Street
1,937 4,917 16,685 1.1 4,435 15,049
7.4 Beretania Street to Kalākaua Avenue 2,778 5,907 19,694 0.9 6,773 22,581
7.5 Young Street to Kalākaua Avenue 2,778 5,907 19,694 0.9 6,236 20,789
7.6 South King Street to Kalākaua Avenue 2,778 5,907 19,694 0.9 6,444 21,485
7.7 South King Street, Pensacola Street or Pi‘ikoi Street to Kona Street to Ala Moana Shopping Center 2,778 5,907 19,694 0.9 6,444 21,485
7.8 Kapi‘olani Boulevard to Kalākaua Avenue 2,778 5,907 19,694 0.9 6,444 21,485
7.9 Kawaiaha‘o Street to Waimanu Street to Kona Street 2,847 4,152 28,984 1.3 3,120 21,778
7.10 Kawaiaha‘o Street to Waimanu Street to Kona Street to Kapi‘olani Boulevard 2,847 4,152 28,984 1.3 3,120 21,778
7.11 Queen Street to Queen Street Extension to Kona Street 2,847 4,152 28,984 1.3 3,120 21,778
7.12 Queen Street to Queen Street Extension to Kona Street to Kapi‘olani Boulevard 2,847 4,152 28,984 1.3 3,120 21,778
7.13 Queen Street to Queen Street Extension to Kona Street to makai of Ala Moana Shopping Center 2,847 4,152 28,984 1.3 3,120 21,778
7.14 Halekauwila Street to Ward Avenue to Waimanu Street to Kona Street 2,847 4,152 28,984 1.3 3,120 21,778
Post Scoping: Ala Moana Boulevard connecting to Atkinson or continuing on Ala Moana to Waikīkī 1,865 3,928 15,123 1.5 2,619 10,082
Final Alternatives Screening Memo Page A- 7 Honolulu High-Capacity Transit Corridor Project
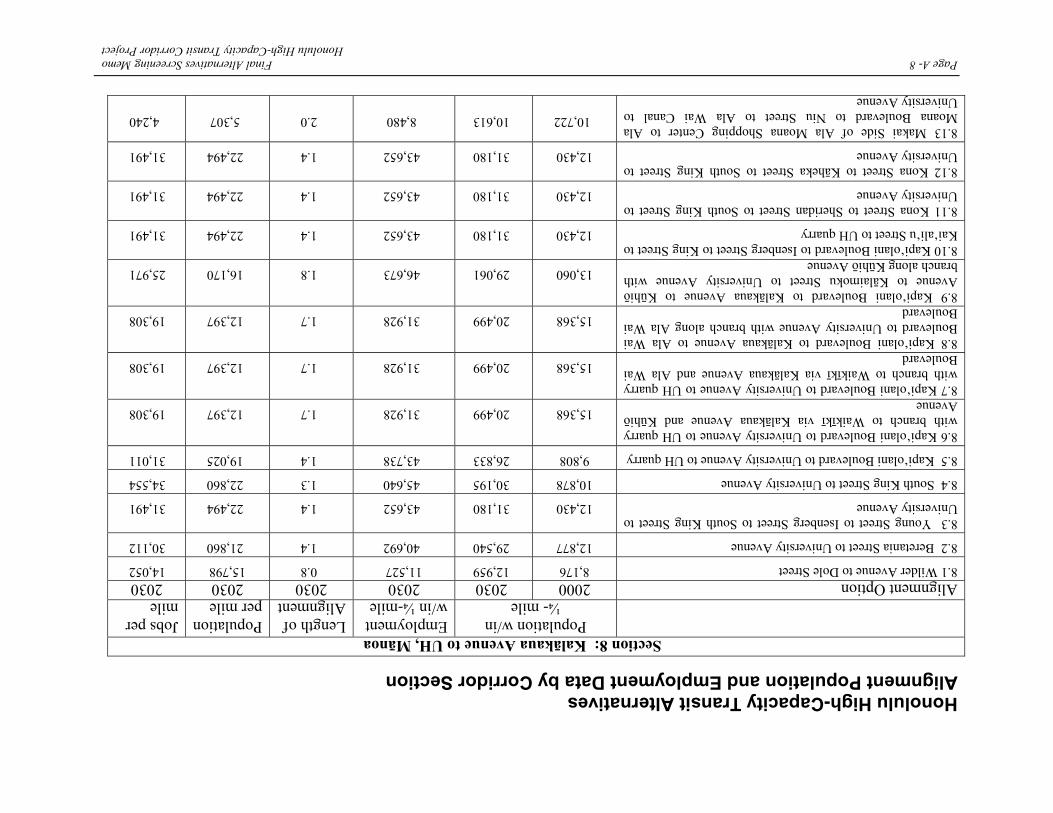
Page A- 8 Final Alternatives Screening Memo Honolulu High-Capacity Transit Corridor Project
Honolulu High-Capacity Transit Alternatives Alignment Population and Employment Data by Corridor Section
Section 8: Kalākaua Avenue to UH, Mānoa Population w/in
¼- mile Employment w/in ¼-mile
Length of Alignment
Population per mile
Jobs per mile
Alignment Option 2000 2030 2030 2030 2030 2030 8.1 Wilder Avenue to Dole Street 8,176 12,959 11,527 0.8 15,798 14,052
8.2 Beretania Street to University Avenue 12,877 29,540 40,692 1.4 21,860 30,112
8.3 Young Street to Isenberg Street to South King Street to University Avenue 12,430 31,180 43,652 1.4 22,494 31,491
8.4 South King Street to University Avenue 10,878 30,195 45,640 1.3 22,860 34,554
8.5 Kapi‘olani Boulevard to University Avenue to UH quarry 9,808 26,833 43,738 1.4 19,025 31,011
8.6 Kapi‘olani Boulevard to University Avenue to UH quarry with branch to Waikīkī via Kalākaua Avenue and Kūhiō Avenue 15,368 20,499 31,928 1.7 12,397 19,308
8.7 Kapi‘olani Boulevard to University Avenue to UH quarry with branch to Waikīkī via Kalākaua Avenue and Ala Wai Boulevard 15,368 20,499 31,928 1.7 12,397 19,308
8.8 Kapi‘olani Boulevard to Kalākaua Avenue to Ala Wai Boulevard to University Avenue with branch along Ala Wai Boulevard 15,368 20,499 31,928 1.7 12,397 19,308
8.9 Kapi‘olani Boulevard to Kalākaua Avenue to Kūhiō Avenue to Kālaimoku Street to University Avenue with branch along Kūhiō Avenue 13,060 29,061 46,673 1.8 16,170 25,971
8.10 Kapi‘olani Boulevard to Isenberg Street to King Street to Kai‘ali‘u Street to UH quarry 12,430 31,180 43,652 1.4 22,494 31,491
8.11 Kona Street to Sheridan Street to South King Street to University Avenue 12,430 31,180 43,652 1.4 22,494 31,491
8.12 Kona Street to Kāheka Street to South King Street to University Avenue 12,430 31,180 43,652 1.4 22,494 31,491
8.13 Makai Side of Ala Moana Shopping Center to Ala Moana Boulevard to Niu Street to Ala Wai Canal to University Avenue
10,722 10,613 8,480 2.0 5,307 4,240

Final Alternatives Screening Memo Page B- 1 Honolulu High-Capacity Transit Corridor Project
Appendix B Concept Screening by Criteria

Table B-1: Improve Mobility Improve corridor Mobility
Measures of Effectiveness No BuildValueAbsolute Change
Percent ChangeValue
Absolute Change
Percent ChangeValue
Absolute Change
Percent ChangeValue
Absolute Change
Percent Change
Travel Time (avg min during AM peak)Islandwide to Downtown29.127.7-1.5-5.0%25.3-3.9-13.2%24.0-5.1-17.5%23.5-5.6-19.2%Islandwide to Kapolei26.326.2-0.2-0.6%26.50.10.5%26.2-0.1-0.5%26.1-0.2-0.8%
Vehicle Hours of Delay (daily)102,00091,000-11,000-10.8%83,000-19,000-18.6%77,000-25,000-24.5%69,000-33,000-32.4%
Change from No BuildChange from No BuildChange from No BuildChange from No BuildAlternative 1: TSMAlternative 2: Managed LaneAlternative 3: Pearl Harbor TunnelAlternative 4: Fixed Guideway
Table B-2: Provide faster, more reliable public transit
Provide faster, more reliable public transit
Measures of Effectiveness No BuildValueAbsolute Change
Percent ChangeValue
Absolute Change
Percent ChangeValue
Absolute Change
Percent ChangeValue
Absolute Change
Percent Change
Mode Split (daily resident person trips)Auto83.8%83.3%-0.5%-0.6%84.5%0.7%0.8%83.9%0.1%0.1%81.5%-2.3%-2.7%Transit5.9%6.4%0.5%8.5%5.9%0.0%0.0%5.9%0.0%0.0%8.4%2.5%42.4%Bike & Walk10.3%10.3%0.0%0.0%9.6%-0.7%-6.8%10.1%-0.2%-1.9%10.1%-0.2%-1.9%
Transit Ridership (daily)253,000270,00017,0006.7%253,00000.0%254,0001,0000.4%348,00095,00037.5%Home-Work Average Vehicle Occupancy (AVO)1.161.160.000.0%1.160.000.0%1.160.000.0%1.15-0.01-0.9%Home-Work Average Vehicle Ridership (AVR)1.381.400.021.4%1.380.000.0%1.380.000.0%1.620.2417.4%Vehicle Miles Traveled (VMT) (daily)15,134,00015,008,000-126,000-0.8%15,180,00046,0000.3%15,032,000-102,000-0.7%13,961,000-1,173,000-7.8%Vehicle Hours Traveled (VHT) (daily)427,000413,000-14,000-3.3%408,000-19,000-4.4%399,000-28,000-6.6%375,000-52,000-12.2%Average Travel Time (minutes per vehicle trip)12.412.1-0.3-2.5%10.3-2.2-17.6%9.5-2.9-23.5%11.3-1.2-9.3%
Change from No BuildChange from No BuildChange from No BuildChange from No BuildAlternative 1: TSMAlternative 2: Managed LaneAlternative 3: Pearl Harbor TunnelAlternative 4: Fixed Guideway
Table B-3: Provide an alternative to private automobile
Provide an alternative to private auto
yesyesnoyes
Primary User vehiclesBusBus and HOVPrivate AutoMass Transit technology
Transit Priority
Alternative 1: TSMAlternative 2: Managed LaneAlternative 3: Pearl Harbor Alternative 4: Fixed Guideway
Page B- 2 Final Alternatives Screening Memo Honolulu High-Capacity Transit Corridor Project
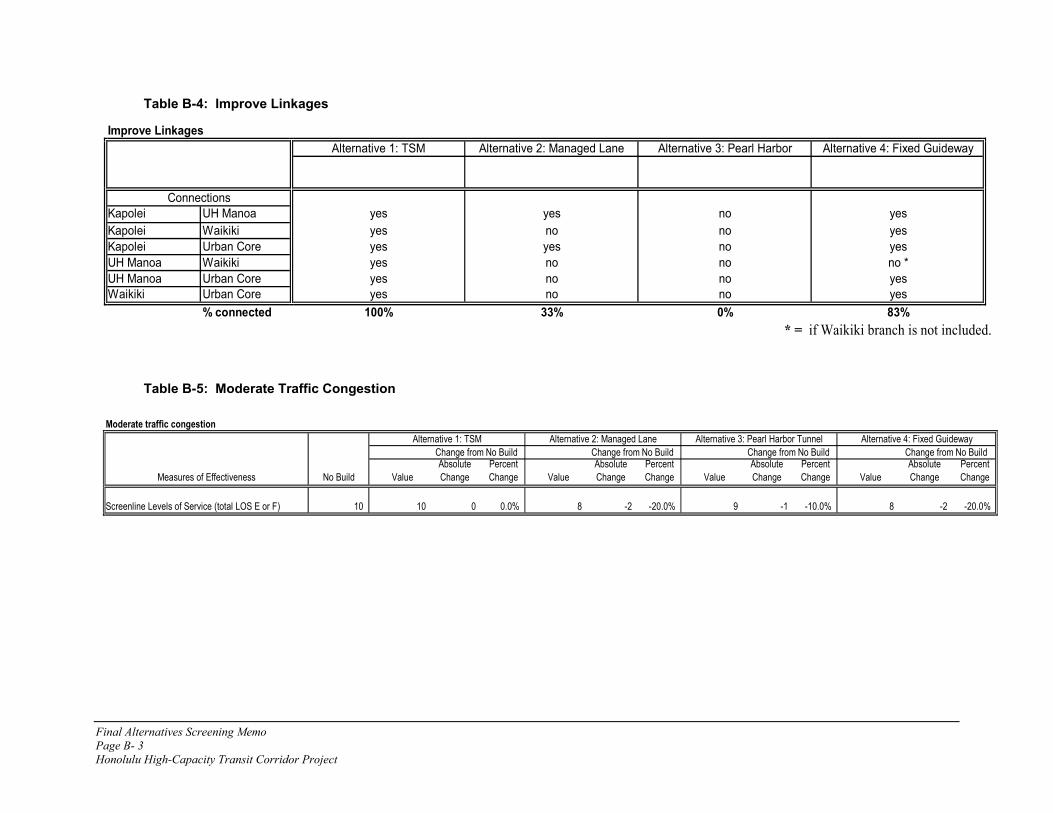
Table B-4: Improve Linkages Improve Linkages
Kapolei UH Manoa yes yes no yesKapolei Waikiki yes no no yesKapolei Urban Core yes yes no yesUH Manoa Waikiki yes no no no *UH Manoa Urban Core yes no no yesWaikiki Urban Core yes no no yes
% connected 100% 33% 0% 83%* = if Waikiki branch is not included.
Connections
Alternative 1: TSM Alternative 3: Pearl Harbor Alternative 4: Fixed GuidewayAlternative 2: Managed Lane
Table B-5: Moderate Traffic Congestion
Moderate traffic congestion
Measures of Effectiveness No Build ValueAbsolute Change
Percent Change Value
Absolute Change
Percent Change Value
Absolute Change
Percent Change Value
Absolute Change
Percent Change
Screenline Levels of Service (total LOS E or F) 10 10 0 0.0% 8 -2 -20.0% 9 -1 -10.0% 8 -2 -20.0%
Change from No Build Change from No Build Change from No Build Change from No BuildAlternative 1: TSM Alternative 2: Managed Lane Alternative 3: Pearl Harbor Tunnel Alternative 4: Fixed Guideway
Final Alternatives Screening Memo Page B- 3 Honolulu High-Capacity Transit Corridor Project
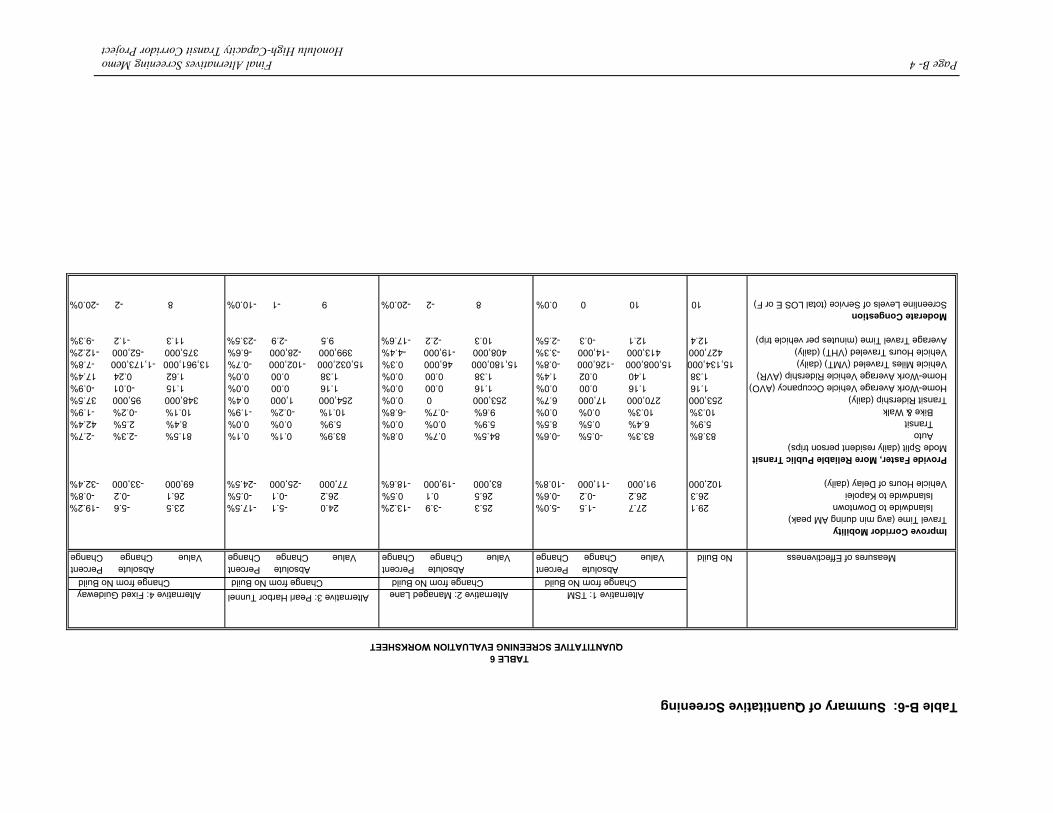
Page B- 4 Final Alternatives Screening Memo Honolulu High-Capacity Transit Corridor Project
Table B-6: Summary of Quantitative Screening
TABLE 6
QUANTITATIVE SCREENING EVALUATION WORKSHEET
Measures of Effectiveness No BuildValueAbsolute Change
Percent ChangeValue
Absolute Change
Percent ChangeValue
Absolute Change
Percent ChangeValue
Absolute Change
PercenChange
Improve Corridor Mobility Travel Time (avg min during AM peak)
Islandwide to Downtown29.127.7-1.5-5.0%25.3-3.9-13.2%24.0-5.1-17.5%23.5-5.6-19.2%Islandwide to Kapolei26.326.2-0.2-0.6%26.50.10.5%26.2-0.1-0.5%26.1-0.2-
Vehicle Hours of Delay (daily) 102,00091,000-11,000-10.8%83,000-19,000-18.6%77,000-25,000-24.5%69,000-33,000-32.4%
Provide Faster, More Reliable Public Transit Mode Split (daily resident person trips)
t
0.8%
Auto83.8%83.3%-0.5%-0.6%84.5%0.7%0.8%83.9%0.1%0.1%81.5%-2.3%-Transit5.9%6.4%0.5%8.5%5.9%0.0%0.0%5.9%0.0%0.0%8.4%2.5%42.4%Bike & Wal
2.7%
k10.3%10.3%0.0%0.0%9.6%-0.7%-6.8%10.1%-0.2%-1.9%10.1%-0.2%-Transit Ridership (daily) 253,000270,00017,0006.7%253,00000.0%254,0001,0000.4%348,00095,00037.5%Home-Work Average Vehicle Occupancy (AVO) 1.161.160.000.0%1.160.000.0%1.160.000.0%1.15-0.01-Home-Work Average Vehicle Ridership (AVR)1.381.400.021.4%1.380.000.0%1.380.000.0%1.620.2417.4%Vehicle Miles Traveled (VMT) (daily) 15,134,00015,008,000-126,000-0.8%15,180,00046,0000.3%15,032,000-102,000-0.7%13,961,000-1,173,000-7.8%Vehicle Hours Traveled (VHT) (daily) 427,000413,000-14,000-3.3%408,000-19,000-4.4%399,000-28,000-6.6%375,000-52,000-12.2%
1.9%
0.9%
Average Travel Time (minutes per vehicle trip)12.412.1-0.3-2.5%10.3-2.2-17.6%9.5-2.9-23.5%11.3-1.2-
Moderate Congestion Screenline Levels of Service (total LOS E or F) 101000.0%8-2 -20.0%9-1-10.0%8-2-20.0%
9.3%
Alternative 4: Fixed Guideway Alternative 1: TSMAlternative 2: Managed LaneAlternative 3: Pearl Harbor TunnelChange from No BuildChange from No BuildChange from No BuildChange from No Build

Appendix C Concept Screening Model Results Summarized By Concept
Final Alternatives Screening Memo Page C- 1 Honolulu High-Capacity Transit Corridor Project

Concept 1: TSM Screening Results
• The transit mode share is projected to increase to 6.4% under the TSM alternative (0.5% more than the No Build condition), with automobile decreasing and walk trips remaining constant.
Table 13 and Figures 8 and 9 describe the mode share for the TSM alternative. The transit mode share increases by 0.5% while the automobile mode share decreases by 0.5% in comparison to the No Build. The percentage of people walking and using bikes remains constant. The transit ridership for this alternative is projected at 270,000, an absolute increase of 17,000 riders or nearly 7% more than the No Build condition.
• The TSM alternative is forecast to have improvements in service effectiveness with reductions in VMT, VHT, and average travel time per vehicle trip from projected year 2030 No Build conditions.
The TSM alternative shows a reduction in VMT over the No Build on all facility types (freeways, expressways, arterials and collectors). Table 14 and Figure 10 show the extent of the reduction which amounts to a 1% (approximately 126,000 miles) decrease over all facilities.
Vehicle Hours Traveled data is presented in Table 15 and Figure 11. An overall reduction in VHT is projected when comparing the TSM alternative to the No Build, which amounts to a decrease of about 14,000 hours (3%) in total across all facilities. The largest individual decrease is 5% (8,000 hours), which is projected to occur on the freeway facilities.
The average travel time per vehicle trip is also projected to decrease for the TSM alternative in comparison to the No Build. The reduction in travel time is approximately 0.3 minutes.
• AVR is projected to increase from 1.38 to 1.40, indicating more use of transit.
Average Vehicle Occupancy is not projected to change under the TSM alternative; it remains constant with the No Build analysis at 1.16. There is a slight increase in AVR for this alternative, rising from 1.38 in the No Build to 1.40. This increase indicates a higher level of transit ridership.
• The screenline levels of service are projected to remain consistent. There are 10 locations that are projected to operate at LOS E of F in either the AM or PM peak hours. This represents no reduction from the 10 locations projected to operate at LOS E or F in the No Build condition.
The screenlines results are presented in Tables 16 and 17 and focus on corridor locations.
• The TSM alternative is projected to result in improved travel times and vehicle hours of delay relative to the 2030 No Build condition.
Page C- 2 Final Alternatives Screening Memo Honolulu High-Capacity Transit Corridor Project

The average travel times to downtown Honolulu and Kapolei are also projected to decrease from the No Build concept. Figures 13 to 15 show the travel times and the time savings over the No Build to destinations in downtown Honolulu and Kapolei. In addition, there is expected to be a decrease in delay of approximately 37,000 hours (41%) over the No Build. Table 18 and Figure 16 detail these results.
Final Alternatives Screening Memo Page C- 3 Honolulu High-Capacity Transit Corridor Project
Concept 2: Managed Lane Screening Results • The transit mode share under the Managed Lane alternative is projected to
hold constant with the No Build concept at 5.9%, with the automobile mode share increasing to 84.5% and the bike & walk mode share decreasing to 9.6%.
Table 19 and Figures 17 and 18 describe the mode share for the Managed Lane alternative. The transit mode share is unchanged from the No Build condition while the automobile mode share increases by 0.7% in comparison to the No Build. The percentage of people walking and using bikes decreases by 0.7%. The transit ridership projection for the Managed Lane alternative is 253,000, which represents no increase from the No Build condition.
• The Managed Lane alternative is forecast to have improvements in service effectiveness with reductions in VHT and average travel time per vehicle trip from projected year 2030 No Build conditions.
The Managed Lane alternative shows an increase in VMT over the No Build on all facility types (freeways, expressways, arterials and collectors). Table 20 and Figure 19 show the extent of this increase, which amounts to a less than 1% (approximately 46,000 miles) increase over all facilities.
Vehicle Hours Traveled data is presented in Table 21 and Figure 20. An overall reduction in VHT is projected when comparing the Managed Lane alternative to the No Build, which amounts to a decrease of about 19,000 hours (4%) in total across all facilities. The largest individual decrease is projected at 10% (16,000 hours) on the freeway facilities.
The average travel time per vehicle trip is also projected to decrease for the Managed Lane alternative in comparison to the No Build. The reduction in travel time is approximately 2.2 minutes.
• AVR is not projected to change from 1.38 in the No Build conditions.
Average Vehicle Occupancy is not projected to change under the Managed Lane alternative; it remains constant with the No Build analysis at 1.16. AVR also remains constant for this alternative, at 1.38.
• The screenline levels of service are projected to improve. There are 8 locations that are projected to operate at LOS E of F in either the AM or PM peak hours. This represents a reduction from the 10 locations projected to operate at LOS E or F in the No Build condition.
The screenlines results are presented in Tables 28 and 29 and focus on corridor locations.
Page C- 4 Final Alternatives Screening Memo Honolulu High-Capacity Transit Corridor Project

• The Managed Lane alternative is projected to result in improved travel times to downtown Honolulu and vehicle hours of delay relative to the 2030 No Build condition.
The average travel time to downtown Honolulu is projected to decrease from the No Build scenario. Figures 21 to 24 show the travel times and the time savings over the No Build to destinations in downtown Honolulu. The average travel time to Kapolei increases slightly compared to the No Build. In addition there is expected to be a decrease in delay of approximately 8,000 hours (9%) over the No Build. Table 24 and Figure 25 detail these results.
Final Alternatives Screening Memo Page C- 5 Honolulu High-Capacity Transit Corridor Project

Concept 3: Pearl Harbor Tunnel Screening Results • The transit mode share under the Pearl Harbor Tunnel alternative is projected
to hold constant with the No Build scenario at 5.9%, with the automobile mode share increasing to 83.9% and the bike & walk mode share decreasing to 10.1%.
Table 25 and Figures 26 and 27 describe the mode share for the Pearl Harbor Tunnel alternative. The transit mode share is unchanged from the No Build condition while the automobile mode share increases by 0.1% in comparison to the No Build. The percentage of people walking and using bikes decreases by 0.2%. The transit ridership projection for the Pearl Harbor Tunnel alternative is 254,000, which is an increase of 1,000 or 0.4% over the No Build condition.
• The Pearl Harbor Tunnel alternative is forecast to have improvements in service effectiveness with reductions in VHT, VMT, and average travel time per vehicle trip from projected year 2030 No Build conditions.
The Pearl Harbor Tunnel alternative shows a decrease in VMT from the No Build on all facility types (freeways, expressways, arterials and collectors). Table 26 and Figure 28 show the extent of this increase, which amounts to a less than 1% (approximately 102,000 miles) increase over all facilities.
Vehicle Hours Traveled data is presented in Table 27 and Figure 29. An overall reduction in VHT is projected when comparing the Pearl Harbor Tunnel alternative to the No Build, which amounts to a decrease of about 28,000 hours (7%) in total across all facilities. The largest individual decrease is 12% (20,000 hours), which occurs on the freeway facilities.
The average travel time per vehicle trip is also projected to decrease for the Pearl Harbor Tunnel alternative in comparison to the No Build. The reduction in travel time is approximately 2.9 minutes.
• AVR is not projected to change from 1.38 in the No Build conditions.
Average Vehicle Occupancy is not projected to change under the Pearl Harbor Tunnel alternative; it remains constant with the No Build analysis at 1.16. AVR also remains constant for this alternative, at 1.38.
• The screenline levels of service are projected to improve. There are 9 locations that are projected to operate at LOS E of F in either the AM or PM peak hours. This represents a reduction from the 10 locations projected to operate at LOS E or F in the No Build condition.
The screenlines results are presented in Tables 28 and 29 and focus on corridor locations.
Page C- 6 Final Alternatives Screening Memo Honolulu High-Capacity Transit Corridor Project

• The Managed Lane alternative is projected to result in improved travel times to downtown Honolulu and Kapolei and reduced vehicle hours of delay relative to the 2030 No Build condition.
The average travel times to downtown Honolulu and Kapolei are projected to decrease from the No Build scenario. Figures 30 to 33 show the travel times and the time savings over the No Build to destinations in downtown Honolulu. In addition there is expected to be a decrease in delay of approximately 14,000 hours (15%) over the No Build. Table 30 and Figure 34 detail these results.
Final Alternatives Screening Memo Page C- 7 Honolulu High-Capacity Transit Corridor Project
Concept 4: Fixed Guideway Screening Results • The transit mode share is projected to increase to 8.4% under the Fixed
Guideway alternative (2.5% more than the No Build condition), with automobile and walk trips decreasing.
Table 31 and Figures 35 and 36 describe the projected mode share for the Fixed Guideway alternative. The transit mode share increases by 2.5% while the automobile mode share decreases by 2.3% in comparison to the No Build. The percentage of people walking and using bikes decreases slightly, by 0.2%. The transit ridership projection for this alternative is 348,000; this represents an absolute increase of 95,000 riders or a 37.5% increase over the No Build condition.
• The Fixed Guideway alternative is forecast to have substantial improvements in service effectiveness with reductions in VMT, VHT, and average travel time per vehicle trip from projected year 2030 No Build conditions.
The Fixed Guideway alternative shows a large reduction in VMT over the No Build on freeways, expressways and arterials. Table 32 and Figure 37 show the extent of the reduction, which amounts to an 8% (about 1,173,000 miles) decrease over all facilities.
Vehicle Hours Traveled data is presented in Table 33 and Figure 38. An overall reduction in VHT is projected when comparing the TSM alternative to the No Build, which amounts to a decrease of about 52,000 hours (12%) in total across all facilities. The largest individual decrease is 27,000 hours (representing a 16% change), which occurs on the freeway facilities.
The average travel time per vehicle trip is also projected to decrease for the TSM alternative in comparison to the No Build. The projected reduction in travel time is approximately 1.2 minutes.
• AVR is projected to increase from 1.38 to 1.62 indicating a significantly higher use of transit. While AVO decreases from 1.16 to 1.15 compared to the No Build condition.
Average Vehicle Occupancy is projected to decrease slightly under the Fixed Guideway alternative. There is a large increase in AVR for this alternative, rising from 1.38 in the No Build to 1.62 (a change of 0.24). This increase indicates a much higher level of transit ridership.
• The screenline levels of service are projected to improve with the Fixed Guideway Alternative. There are eight locations that are projected to operate at LOS E of F in either the AM or PM peak hours. This represents a reduction from the ten locations projected to operate at LOS E or F in the No Build condition.
Page C- 8 Final Alternatives Screening Memo Honolulu High-Capacity Transit Corridor Project

The screenline results are presented in Tables 34 and 35 and focus on corridor locations.
• The Fixed Guideway alternative is projected to result in improved travel times and vehicle hours of delay relative to the 2030 No Build condition.
The average travel times to downtown Honolulu and Kapolei are also projected to decrease from the No Build concept. Figures 39 to 42 show the travel times and the time savings over the No Build to destinations in Kapolei and downtown Honolulu. In addition there is expected to be a decrease in delay of approximately 22,000 hours (24%) over the No Build. Table 36 and Figure 43 detail these results.
Final Alternatives Screening Memo Page C- 9 Honolulu High-Capacity Transit Corridor Project


![[PPT]ALOHA FROM HAWAIIekladata.com/T87xXLe0Y72JoKgvTgg575PI2tM/Hawaiil.pps · Web view* HONOLULU - HARBOUR HONOLULU - AIRPORT HONOLULU IOLANI PALACE - HONOLULU ROYAL GUARD KAMEHAMEHA](https://img.pdfslide.us/doc/110x75/5af655b67f8b9a5b1e8effcd/pptaloha-from-view-honolulu-harbour-honolulu-airport-honolulu-iolani-palace.jpg)