Embed Size (px)
Citation preview
Alternatives for Going Public: Evidence from Reverse Takeovers, Self-Underwritten IPOs, and Traditional IPOs∗
This draft: September 25, 2004 Very Preliminary Comments Welcome Kimberly C. Gleason Florida Atlantic University [email protected] Ravi Jain Temple University [email protected] Leonard Rosenthal Bentley College [email protected]
∗ The authors would like to thank the Securities and Exchange Commission’s Division of Corporate Finance (Small Business Policy), Tim Halter of Halter Financial Group, Paul Enright of JOMY Safety Products, Joe Prang of Mentor Capital., Bob Rader of Capital West Securities, the Pink Sheets™ LLC, and Stacy Swanstrum of the National Association of Securities Dealers for their valuable information, experiences, and insights.
Alternatives for Going Public: Evidence from Reverse Takeovers, Self-Underwritten IPOs, and Traditional IPOs
ABSTRACT
We examine the characteristics of firms using reverse takeovers and self-underwritten IPOs as an alternative to the traditional underwritten IPO. We find that at the time they go public, firms that use alternative mechanisms tend to be less profitable than contemporaneously issued IPO firms of comparable size in the same 3 digit SIC code, but they do not exhibit significantly lower balance sheet liquidity or significantly higher distress. However, by two years post going public, they have significantly increased debt and experience declines in profitability and balance sheet liquidity. Furthermore, we find that RT and SU firms are characterized by lower levels of trading liquidity and significantly higher volatility, as measured by the standard deviation of returns. While the combined sample of RT and SU firms have comparable institutional ownership post going public to their control IPO firms, RT firms are characterized by statistically lower institutional ownership than their matches, and while IPO firms experience significant increases in institutional support, those using RTs and SUs experience declines. We also find evidence that firms utilizing alternative going public mechanisms outperform their matched traditional IPO counterparts over longer horizons as indicated by mean and median tests of Sharpe ratios; however, the results for buy and hold returns are mixed.
1
Alternatives for Going Public: Evidence from Reverse Takeovers, Self-Underwritten IPOs, and Traditional IPOs
1. Introduction.
Hundreds of scholarly papers and practitioner articles have examined the issues
surrounding initial public offerings (IPOs), the performance of IPOs, and the governance of IPO
firms. Academic research has uncovered that underwriter reputation matters, that firms leave
money on the table, that IPO firms exhibit poor performance in the longer term, and that
conflicts of interest between investment banking, sell side, and underwriting functions
contributed to the crash of the technology stocks in early 2000. A casual perusal of the academic
literature would lead the reader to believe that an underwritten IPO is the only mechanism
available for going public.
The recent Google IPO, which utilized a Dutch Auction initial public offering, renewed
interest in alternative going-public mechanisms, and has led many in the industry to question
whether the traditional underwritten IPO is the only game in town. Because of the size and
established reputation of Google, its relatively novel variation on the traditional IPO has
generated a great deal of publicity. However, it is common knowledge in the small cap equity
sector that Google is not alone in utilizing a nontraditional approach to going public. What has
been less investigated in the academic literature are alternatives to the traditional IPO process
used by many public firms. Contrary to popular belief, it is not necessary to hire an investment
bank and have the issue underwritten in order to become publicly traded. Firms can, and do,
acquire a public firm in order to go public through a technique known as a “reverse takeover”, or
manage the underwriting of their own IPOs, called a “self-underwritten IPO”.
2

In this paper, we examine the characteristics of firms that use reverse takeovers and self-
underwritten IPOs, and the performance implications of alternative going public strategies
relative to a control sample of traditional underwritten IPOs.
2. Going Public
2.1. Traditional Underwritten IPOs
A great deal is known about the traditional underwritten IPO from both a practitioner and
academic perspective (see, e.g., the comprehensive Ritter and Welch, 2002 review paper).
Generally speaking, the process takes between six months and a year and a half, from the time
that the firm obtains an underwriter(s) and appropriate legal counsel, submits the registration
statement with the SEC (S-1), receives feedback from the SEC following a typical 30 day
review, files amendments to its S-1, carries on with the roadshow, prepares a “litigation proof”
prospectus, and files the prospectus and documents with the SEC and the exchange where the
shares will be listed. Firms choose an investment bank, arguably the one with the best reputation
that they can afford (or which is willing)1, to handle the pricing and marketing of the issue, in the
hopes that they will obtain the best possible price for their shares, get research coverage with a
favorable rating2, observe a consistent increase in trading volume and liquidity, and perform well
post-IPO. The process is time-consuming, sensitive to changes in industry and market-wide
conditions, and financially costly. If market conditions are not appropriate, the IPO may be
postponed or withdrawn. Prior to July 2003, a quiet period of 25 days was required before an 1 Firms doing an IPO should choose bankers who can match the kinds of investors the firm wants to place its shares with rather than just going with a marquis banker. In some cases, choosing a strong regional banker as a lead or co-lead may result in a more successful IPO, whereas using a marquis banker may result in less experienced bankers taking the firm public. 2 Under the Global Brokerage Settlement reached in April 2003, it is now illegal for investment banks to promise research coverage as a quid pro quo for getting the deal. However, some people believe that this practice is now continuing with a wink and a nod (see “Wall Street On the Run: Stock Analysts Are Facing a Far Graver Threat Than New York Attorney General,” Fortune, June 14, 2004).
3
analyst working for an investment bank that managed or co-managed the IPO could issue a
report on the company. The quiet period was extended to 40 days for leads and co-leads and a
25 day quiet period was established for other bankers involved in the deal (see SEC Release No.
34-48252; File No. SR-NASD-2002-154; SR-NYSE-2002-49, July 29, 2003).
The process has been extensively criticized for potential conflicts of interest with
underwriters, allocation of shares to “cronies” of the underwriter, and for the extent to which
money is left on the table. The media frenzy surrounding the recent Google IPO indicated that
many market participants are frustrated with the traditional IPO, but the Google experience also
indicates that the market may not view even minor deviations from tradition favorably.
2.2. Reverse Takeovers
The best known American reverse takeover (RT) was conducted by the now-infamous
corporate offender Bernie Ebbers, who, along with three other investors, formed Long Distance
Discount Service (LDDS) in September of 1983. In May of 1989, LDDS was acquired by
Addvantage Companies (NASDAQ: ADCO) through a reverse takeover to become listed on the
NASDAQ, and, after a protracted acquisition binge, Bernie Ebbers renamed the firm Worldcom.
While not the image that M&A advisors specializing in reverse takeovers like to put forth, like
SUs, many reverse takeovers have a reputation for low quality, or as being “crash and burn”
stocks3. Others, such as Hayes Microcomputer Products, which did an RT in 1997 with
3 Among the 10 largest RT firms in our sample, Struthers Industries Inc. (now Global Marines, Ltd.) personifies the stereotypical RT firm. Even though its stock is virtually worthless, its investor relations website expresses hope: “The shareholders of Struthers, Inc. have suffered mightily over the past few years, both financially and emotionally, yet somehow still clinging to the dream that there were fortunes to be made; while helplessly watching the share price sink to $.0001 and the company itself nearly destroyed. On October 28, 2003 all of that changed...when we decided to take charge of the situation and control our own destiny.” http://www.struthers-inc.com/index.html
4
NASDAQ-listed Access Beyond to go public, were fallen angels that once led their respective
industries; in the late 1970s, Hayes introduced the first PC modem4.
A reverse takeover is a technique that allows a privately held company to obtain a listing
on a public exchange without doing an IPO. The private firm (called the target) is acquired by a
publicly traded firm, referred to as the vehicle, or the “acquirer”, or the shell5. Following the
acquisition, the management of the privately held firm replaces the management of the vehicle,
and the surviving entity is the newly public, previously private “target”. While the target is now
public, it does not raise new equity capital through the transaction, unlike a firm doing an IPO,
whether self-underwritten or not. The motive is only to go public, and to obtain the benefits of
being public.
Thus, the reverse takeover process is a corporate combination (i.e., an acquisition) rather
than an IPO. The private firm management seeks an appropriate public vehicle, arranges for the
public vehicle to make a bid where payment is in stock or cash and stock, completes the
transaction, and files the appropriate forms for a corporate combination with the SEC, as in any
other acquisition. The process typically takes anywhere from a month to six months. The short
completion time relative to the traditional IPO is often mentioned as a motive for using the
reverse takeover. For instance, the Global Sources Investor Relations website provides
information on the reasons for the RT: “In March 2000, Global Sources exchanged 100 percent
of its shares for a 95 percent stake in Fairchild (Bermuda) Ltd. Through this deal, Global Sources
sought a public listing in order to provide an additional source of funds to expand its Internet 4 At the time, the deal was shopped around as though management was doing a favor for the investing public rather than providing a last chance for Hayes following its Chapter 11 reorganization. As stated by Jim Jones, Hayes’ CFO, "This will be a tremendous opportunity for people who have wanted to invest in Hayes" (Atlanta Journal/Constitution, 1997/Troubled Company Reporter http://bankrupt.com/TCR_Public/971229.MBX). Despite the optimism, Hayes Corp. filed Chapter 11 slightly over a year after going public, in large part because of a toxic private placement of preferred stock in a PIPE issue. 5 The term “shell” typically refers to a publicly traded firm that has ceased operations, but that has been “cleaned” of any potential legal liabilities.
5
business. If Global Sources had proceeded with the traditional Initial Public Offering, it would
have taken 2-3 years longer to go public. The reverse merger was the quickest and simplest way
for a public listing.” Managers of reverse takeover firms also have the advantage of knowing
exactly what the valuation will be prior to the going-public transaction.
Many boutique “shell brokers”, who are generally small investment advisors, can be
found that arrange reverse takeovers. They argue that the merits of RTs are that they allow the
firm attempting to go public to avoid the costs of having an investment bank underwrite the
issue, and that firms that use RTs to go public avoid depending on the vagaries of market
sentiment. Evidence also suggests that perhaps the RT process involves less SEC scrutiny than
the IPO process, (and hence, allows less reputable firms to go public). While firms who do RTs
are required to provide financial statements within two weeks of the transaction, they often
simply file an “inability to file” form instead, citing the difficulties of obtaining a comprehensive
set of financial statements so soon after the merger. Indeed, in April of 2004, the SEC voted to
increase supervision and regulation of reverse takeovers, and of requiring private firms using
RTs to go public to provide more extensive financial information than had been required
previously. In doing so, the SEC cited schemes involving insider sales to unsuspecting outside
shareholders (Burns, 2004).
Following reverse takeovers, the managers of the newly public firms often take steps to
“morph” into new corporate entities through repeated acquisitions, product line modifications,
and name changes. For example, one of the firms in our sample, Strategic Solutions, was the
intermediary product in a chain of RTs. The firm began as Trans Am Capital Corp, a small
financial services firms, which morphed into Pacific Animated Imaging Corp, which changed its
name to Strategic Solutions Inc. SSI merged with US Technologies. Strategic Solutions later
6
changed its name to US Technologies, and later to Digital Chainsaw. Digital Chainsaw merged
with both E2Enet and YAZAM and later changed its name back to US Technologies; thus, over
the course of a decade, the firm went from document processing to e-business. Another reverse
takeover combined a mushroom spawn farm (Urbani Truffels) with a satellite components
manufacturer (Sattel Global Networks) to form an exotic foods holding company (Urbani
Holdings).
Unlike an IPO, firms that use reverse takeovers are, in some ways, able to evade the
disclosure requirements and uncertainty of completion inherent in the IPO process. Furthermore,
very little information must be provided about the private firm prior to the acquisition; it is up to
the public vehicle shareholders to decide if they will vote for the combination. Ritter (1987) ties
stock price volatility post-going public to uncertainty about the market value of the firm prior to
going public. Thus, there should be greater uncertainty, and post going public volatility, of
reverse takeover firms than IPOs, whose prospectuses and registration statements require them to
provide comprehensive information.
Only one academic study examines reverse takeovers. In an exploratory study, Gleason et
al (2004) examine a sample of 121 reverse takeovers listed on the New York Stock Exchange
and NASDAQ-AMEX. They find that reverse takeover firms are small, unprofitable, and likely
to fail within 2 years of going public, though announcement returns to the acquirer vehicle firm
are significantly positive. However, they do not examine first day or long run returns from the
perspective of the shareholder of the private firm that uses the reverse takeover to go public, nor
do they compare the performance or characteristics of reverse takeover firms to IPO firms. In a
loosely related study, Brown et. al. (2004) finds that “rollup” IPOs (where several firms in an
7
industry combine into a single entity and go public) underperform as well, and attribute poor
performance to agency problems.
2.3. Self-Underwritten IPOs
Self-underwritten IPOs (SUs) are initial public offerings (typically best-efforts, though a
handful are all-or-none offerings) where the firm doing the issue underwrites its own shares.
While typically associated with Small Corporate Offering Registration (SCOR) offerings, which
are limited to under $1 million, or with unregistered Rule 504 offerings, self-underwritten IPOs
are registered equity securities that are not limited to qualified institutional buyers for purchase.
Like traditional IPO firms, SU companies can list on the Pink Sheets ™, the OTCBB, the
NASDAQ-AMEX, or the NYSE6. Though most end up on the Pink Sheets™ or the OTCBB,
several have successfully listed their stock on the NASDAQ. Some start off trading on the less
liquid platforms, with the hopes of moving up to the NASDAQ. Like self-underwritten IPOs,
some seasoned offerings, known as “Direct Public Offerings” are also not underwritten by an
investment bank, but unlike the firms in the sample, the DPO issuers are not listed on any
exchange; management of the firm markets the newly issued stock directly to private investors,
typically with the intention of later listing the stock if the equity investment pays off7.
In a true self-underwritten issue, firms do not have an investment bank manage the new
issue; the firm’s management acts as broker-dealer for the IPO itself, and often holds roadshows
6 At one point in the “internet revolution”, it was thought that improvements in information technology might lead to changes in the entire securities issuance process that would improve efficiency and accessibility to a broader base of investors. To that end, web-based, nontraditional lead-manager systems were developed by W.R. Hambrecht and E*Offering (which later became Wit). However, few IPOs were ever brought forward through these mechanisms, with the best-known offering being Peet’s Coffee and Tea (Lewis, 2001). 7 One such firm is JOMY, a Colorado safety equipment firm that raised $1 million through a direct public offering in 2003, which was widely followed by the local Boulder business press. The issue, which offered 27% of the company for outside ownership, was marketed by the CEO to the local community and was oversubscribed at $1 per share.
8
on the company’s premises8. Managers determine the value of the company within limits, and
potential investors decide if the price is acceptable. The tradeoffs involved are clear; the firm
does not get the benefit of underwriter marketing to institutional investors, aftermarket
stabilization, or certification, as described by Gompers and Lerner (1999), but the firm avoids
many of the costs and the uncertainty inherent in obtaining a firm commitment from an
investment bank as in a traditional underwritten issue9.
The opportunity costs of having management market the issue rather than an investment
bank are nontrivial. A tremendous amount of managerial resources must be dedicated to
obtaining retail buyer interest (though management may be able to obtain a higher valuation than
what would be possible with an issue aggressively marketed to more sophisticated institutional
investors). As described by Lipman (2001), some SU firms are able to interest local and regional
broker-dealers in providing IPO marketing services to assist managers, but investment banks
typically do not provide marketing services unless they handle the entire underwriting process.
8 The executives of the firm must meet certain qualifications in order to act as broker-dealer (though many appear to obtain exemptions), as described in Corporate RoadShow Dot Com’s 424A: “Mr. Ferraro, the CEO, will be the person responsible for the sales of securities on behalf of CRS and that he will rely on the safe harbor from broker dealer registration set out in Rule 3a4-1 under the Securities Exchange Act of 1934. Mr. Ferraro meets each of the qualifications set forth in such rule as follows: (i) he is not subject to any statutory disqualification; (ii) he is not compensated in connection with his participation by the payment of commissions or other remuneration based either directly or indirectly on transactions in securities; (iii) he is not at the time of his participation an associated person of a broker or dealer; and (iv) he will restrict his participation with respect to such sales to the following activities: (A) preparing any written communication or delivering such communication through the mails or other means that does not involve oral solicitation by the associated person of a potential purchaser; provided, however, that the content of such communication is approved by a partner, officer or director of the issuer; (B) responding to inquiries of a potential purchaser in a communication initiated by the potential purchaser; provided, however, that the content of such responses are limited to information contained in a registration statement filed under the Securities Act of 1933 or other offering document; or (C) Performing ministerial and clerical work involved in effecting any transaction.” 9 Firms going public through SUs still pay underwriting and registration fees, they simply do not pay them to an investment bank (and often who exactly such fees are paid to is not addressed in the prospectus). For example, SmartMetric Inc. issued its prospectus on 9/8/2004, and its SB-2 indicates that its fees associated with issuance and distribution of the new securities amounted to $147,927.43, including legal and accounting costs, printing and engraving, blue sky qualification fees, and transfer agent fees. It also reports underwriting costs ranging between $222,957 and $747,957. Many SU firms report having no underwriting expenses whatsoever.
9
SUs are not uncommon in practitioner circles, but have not been addressed in the
academic literature, with one exception: Muscarella and Vetsuypens (1989), examine a small
subsample of self-underwritten IPOs with a sample ending in the 1980s, where a “self-
underwritten” deal is defined as one where firms go public with or without the support of
investment banks in valuing and marketing the issues, but which have no underwriter.
Muscarella and Vetsuypens (1989) examine only investment bank IPOs; they find that self-
underwritten investment bank IPOs significantly underperform a control sample of investment
bank IPOs underwritten by an outside group. While not a study of self-underwritten IPOs per se,
Chen and Lin (1996) find similar results, using a sample of investment companies whose
underwriters own at least 3% of the firm’s stock at the time of the IPO. These results suggest the
outside certification involved in the IPO process is important.
Despite lacking investment bank/underwriter certification, self-underwritten IPOs are still
required to file all necessary documentation that any ordinary IPO would, including a prospectus.
Like ordinary IPOs, they are subject to listing and disclosure requirements, lockup period
constraints on insider sales, and corporate governance requirements of their respective
exchanges. However, as noted in the “Risk Factors” section of the Friday Night Entertainment
Corporation 2004 Prospectus, asymmetric information is likely to be higher for SUs than IPOs:
“…This offering is being self-underwritten by our officers and directors, and potential investors
should give careful consideration to all aspects of this offering before any investment is made. In
the absence of an underwriter, no due diligence examination has been performed in conjunction
with this offering such as would have been performed in an underwritten offering.”
In the popular press, SUs are considered speculative. For example, a Wall Street Journal
article notes that SUs “stand a good chance of never seeing the light of day” (Hennessey,
10

2004)10. They are generally viewed as firms that would not be able to get an investment bank to
underwrite the issue (though anecdotal evidence from the 1990’s IPO market suggests that by
and large, firms that wanted to go public were able to find underwriters). Indeed, many firms
who file prospectuses cannot realistically expect to ever meet the listing and disclosure
requirements of even the Bulletin Board, and their prospectuses list risk factors such as
management’s and accountant’s doubts about the firms’ prospects as a going concern, the fact
that the CEO may have to resign pending the outcome of an SEC investigation for securities
fraud11, the problem of the firm having no employees, doubts that a product will ever result from
R&D, no operating history, and the fact that the executive responsible for sales has no industry
experience whatsoever12.
The lack of a minimum number of shares that must be sold in SU offerings, as opposed to
the traditional IPO, makes them risky for investors as well. Managers who potentially have
conflicts of interest in marketing the shares can simply offer the shares, take the funds, and
obtain personal rents by claiming that sufficient funds were not raised to operationalize the
10 SUs often appear in the popular press as the butt of jokes as “do-it-yourself” IPOs done by bogus companies. See, e.g., the satire website http://www.anvari.org/fortune/Humorix_Stories/1745.html. 11 As stated in Human Biosystem’s 6/25/2003 prospectus: “Primarily as a result of these recurring losses, our independent certified public accountants modified their report on our December 31, 2002 financial statements to include an uncertainty paragraph wherein they expressed substantial doubt about our ability to continue as a going concern.” The next risk factor described in the prospectus involves securities fraud charges against the CEO: “On August 7, 2002, the United States Attorney for the Eastern District of New York and the Securities and Exchange Commission announced that they were bringing securities fraud charges against Harry Masuda, our Chief Executive Officer, for allegedly paying an unregistered broker an undisclosed commission in a 1999 and 2000 private placement. The allegations generally charge Mr. Masuda with the failure to adequately disclose to investors in this private placement a commission agreement with Larry Bryant, an unlicensed broker-dealer. Remedies sought in these proceedings include criminal penalties and a bar from service as an officer or director of a publicly-traded company … there can be no assurance that Mr. Masuda will be able to continue to serve as our Chief Executive Officer in the event that the Securities and Exchange Commission receives the remedies that it seeks.” 12 As stated in Coffee Pacifica’s August 8, 2003 424b2, “Our ability to implement the marketing and sales strategy is partially dependent on our employee, Brooks Farrell's, ability to increase awareness and recognition of Papua New Guinea grown green bean coffee in United States. Brooks Farrell lacks coffee industry experience and may have difficulty selling the Papua New Guinea grown green bean coffee.” Similar concerns are expressed in Grafix2Go’s 6/25/2003 prospectus: “We will rely heavily on Brandon Stillman and Jared Stillman to develop our business. While Jared and Brandon have some limited experience in computer programming and graphics, they have virtually no business and sales experience. This lack of experience further increases the risk that they will be unable to successfully develop our business.”
11
business plan outlined in the prospectus. As indicated in Coffee Pacifica’s August 8, 2003
424b2, “There is no minimum number of shares that must be sold in this offering, even if we
raise a nominal amount of money. Any money we receive will be immediately available for use
by us. We may not raise enough money to implement our business plan. No money will be
refunded to investors under any circumstances. As a result, investors may lose their entire
investment.”
At one time, during the IPO wave of the 1990s, self-underwritten IPOs were considered
the wave of the future. Interest reached a peak in 1999, when the relatively well-known firm
LinuxOne planned to do a self-underwritten IPO onto the NASDAQ, but ended up hiring an
investment bank, Capital West Securities, to underwrite the issue13.
In a sense, SUs provide a natural laboratory for investigating whether underwriters make
a difference. We examine whether SUs are, in fact, different in terms of operating characteristics
from firms whose IPOs are underwritten. We anticipate finding that self-underwritten IPOs face
higher volatility and lower performance outcomes than underwritten IPOs.
3. Post-IPO Performance
A great deal of evidence exists demonstrating that firms underperform following an IPO,
using a variety of measurement techniques (see, e.g., Ritter, 1991; Loughran and Ritter, 1995;
Gompers and Lerner, 2003; Levis, 1993; Lee, Taylor, and Walter, 1999; Keloharju, 1993). Ritter
(1991) finds that IPO firms significantly underperform non-IPO firms post IPO, and studies of
13 Both the decision to do the self-underwritten IPO and the decision to employ Capital West Securities baffled the investment community. Red Hat, a firm in the same industry, had hired prestigious Goldman Sachs to underwrite its IPO, indicating that LinuxOne could have hired a higher profile investment bank with more experience than Capital West, which had only underwritten 10 previous IPOs.
12

internet IPOs (see, e.g., Ljungqvist and Wilhelm, 2003) provide an even more blistering critique
of long horizon performance in the late 1990s.
However, whether poor post-IPO performance is merely an artifact of the broader issue
of low returns to small, low book to market firms, the use of buy and hold rather than calendar
time returns, or a function of the particular returns generating process used in the analysis, is a
matter of ongoing empirical debate (see, e.g., Brav and Gompers, 1997; Brav, Gzecy, and
Gompers, 2000). Furthermore, Purnanandam and Swaminathan (2004) argue that the evidence
from analysis of multiples indicates that high offer price-to-value IPOs experience greater price
declines than peers; the market seems to get carried away with overly optimistic growth
forecasts, and engages in systematic misvaluation.
If IPO firms do underperform post-IPO, then sentiment and market timing models stand
ready to explain the performance (see, e.g., Ritter, 1991; Loughran and Ritter, 2000; Hirshleifer,
2001; Baker and Wurgler, 2000; Ljungqvist, Nanda, and Singh, 2002; and Loughran, Ritter, and
Rydqvist, 1994). Carter et. al. (1998) indicates that underwriter reputation is a significant
determinant of long run performance post IPO. Furthermore, investors time their purchases to
coincide with periods of optimism, which bids up the price of the newly public firms, but which
results in sell-offs when the street becomes disenfranchised. Ben Dor (2004) argues that
institutional investor involvement in new IPOs is a leading indicator of market enfranchisement,
and, having better information than uninformed individual investors, institutions should
anticipate investor sentiment and capitalize on it. Consistent with this hypothesis, he shows that
higher institutional investor ownership shortly after the IPO is associated with higher subsequent
returns.
13
If traditional underwritten IPOs underperform, despite efforts by underwriters to properly
price and market the security issue (for which they are usually paid, approximately, 7% of the
proceeds), then what might one expect from the performance of firms using alternative
techniques to go public? At first glance, it might appear that it would be more difficult for
reverse takeover and self-underwritten IPOs to obtain institutional support or analyst coverage,
given that there is no underwriter to promote the issue. It may be the case that such firms are
poor performers who could not get an investment bank to risk reputational capital by
underwriting their offerings. Anecdotally, it appears to be the case that the scrutiny of the IPO
process is more extensive than for corporate combinations. If so, one would expect the popular
conception of reverse takeovers to be true, that they may turn out to be shareholder rip-offs. Self-
underwritten IPOs may save the 7% required for underwriting, but they also would be expected
to suffer from the consequences of not having the marketing backup provided by the underwriter,
and from the overextension of managerial resources involved in marketing the stock to retail
buyers. Both self-underwritten IPOs and RTs face the disadvantage of not obtaining the publicity
and visibility inherent in underwritten IPOs. RTs also differ from SUs and traditional IPOs in
that if the shares are determined to be marginable, shares of RTs can be shorted without lockup
period constraints, whereas the shares of SUs and traditional underwritten IPOs cannot be.
We first attempt to examine whether firms that use nontraditional going public
mechanisms differ from those that choose the traditional underwritten IPO. We then examine the
first day returns, long-term performance, volatility, and liquidity of firms that use nontraditional
approaches following their going public transactions to see whether they over or underperform
traditional IPOs. We document the ability of RTs and SUs to obtain institutional investor
14
support after they go public. Finally, we examine the factors that affect 12 month control-
adjusted buy and hold returns for firms using RTs or SUs to go public.
4. Data
Our data collection efforts were extremely intensive because it involved obtaining a
sample of transactions that are not widely or accurately covered by traditional data vendors. We
obtained our initial sample of reverse takeovers from Securities Data Corporation’s (SDC)
International Mergers and Acquisition files. However, in the process of examining the proxy
statements of firms reported to be reverse takeover firms, we found that SDC often incorrectly
categorizes rollups and other forms of industry consolidation as RTs, and improperly categorizes
many ordinary IPOs as RTs. Hence, we engaged in an extensive search for other firms that had
gone public using reverse takeovers. Our final sample includes 127 confirmed reverse takeovers
to go public and which were initially listed on the New York, American, or NASDAQ stock
exchanges between 1986 and 2002. All transactions were confirmed through Lexis Nexis
searches as well as the financial statements of the public and private firms involved in the deals.
Self-underwritten IPOs were even more difficult to track down and verify. Unlike
traditional underwritten IPOs, Securities Data Corporation does not cover SUs. Hence, we
utilized word searches in Edgar Online and online news searches to identify self-underwritten
IPOs involving public offerings registered with the SEC, which were listed on the New York,
American, or NASDAQ stock exchanges. The exchange listing screen removed firms that did
Direct Public Offers over the internet (such as Spring Street Brewing Company), Rule 506
offerings only available to qualified institutional buyers, and Regulation A and Public Rule
504/SCOR offerings resulting in a bulletin board listing for which no Compustat data was
15

available14. While these issues are not covered by traditional data sources, such as SDC, the SEC
and Edgar’s IPO Express track them. After obtaining the initial sample, we verified that the IPOs
were self-underwritten from their registration statements and from personal contact with the
SEC. Our final sample consists of 53 self-underwritten IPOs, which traded on the NASDAQ-
AMEX or NYSE between 1991 and 2003; however, we have CRSP data for only 22 firms.
Finally, we obtained our control sample of traditional underwritten IPOs from Securities
Data Corporation’s Global New Issues. We obtained all original IPOs in the 12-month period
prior to the reverse takeover or self underwriting, and selected the closest match on industry and
assets.
Our sample period covers 1986 to 2003. Sample breakdown by year and industry is
shown in Table 1.
[Table 1 About Here]
We obtained stock price, returns, and volume data from CRSP and accounting data from
Standard and Poor’s Compustat Research Insights. We obtained institutional ownership data for
all firms from CDA/Spectrum. Finally, we obtained characteristics on the transactions from the
proxy statements for the reverse takeovers, the registration statements for the self-underwritten
IPOs, and SDC Global New Issues database for the underwritten IPO control sample.
5. Methodology
We examine the characteristics of firms selecting into either an RT or SU (=1), or a
traditional underwritten IPO (=0) using a logit regression analysis:
14 Given the size of the issues, it is possible that some of the sample SUs would have preferred to use the Regulation A offering, except that development stage firms with no business plans are prohibited under Reg A, as are felons, under the Rule 262 “bad boy” provision.
16
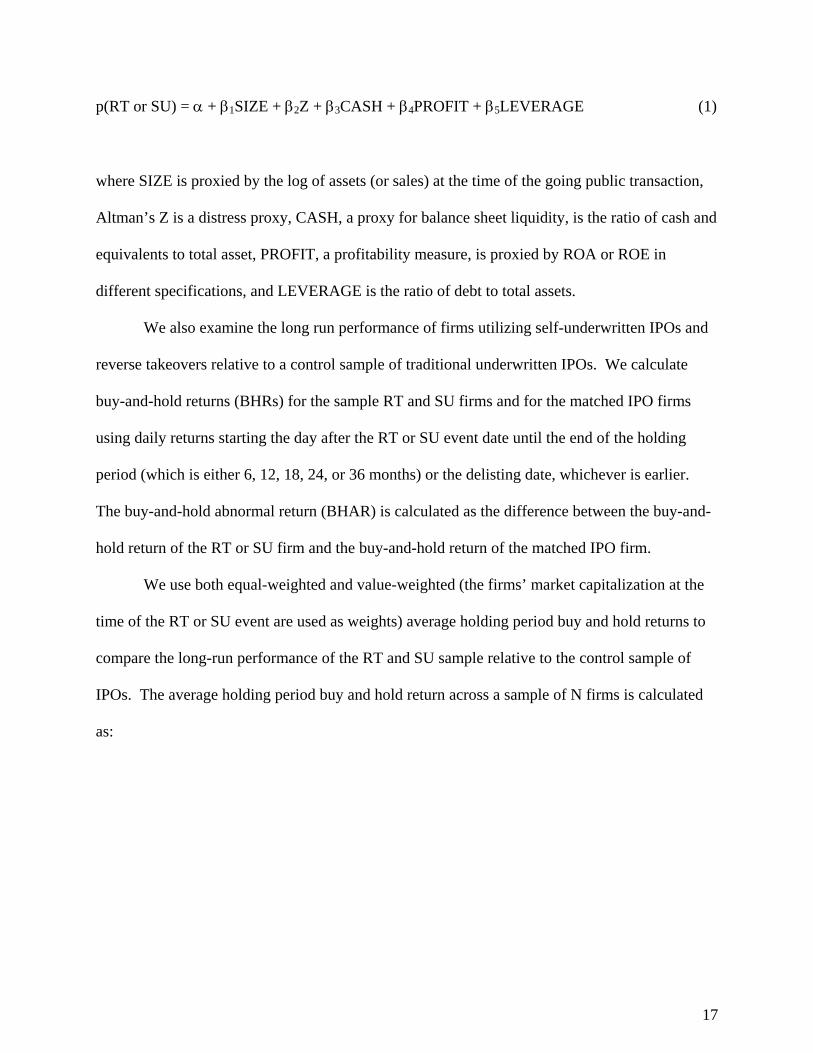
p(RT or SU) = α + β1SIZE + β2Z + β3CASH + β4PROFIT + β5LEVERAGE (1)
where SIZE is proxied by the log of assets (or sales) at the time of the going public transaction,
Altman’s Z is a distress proxy, CASH, a proxy for balance sheet liquidity, is the ratio of cash and
equivalents to total asset, PROFIT, a profitability measure, is proxied by ROA or ROE in
different specifications, and LEVERAGE is the ratio of debt to total assets.
We also examine the long run performance of firms utilizing self-underwritten IPOs and
reverse takeovers relative to a control sample of traditional underwritten IPOs. We calculate
buy-and-hold returns (BHRs) for the sample RT and SU firms and for the matched IPO firms
using daily returns starting the day after the RT or SU event date until the end of the holding
period (which is either 6, 12, 18, 24, or 36 months) or the delisting date, whichever is earlier.
The buy-and-hold abnormal return (BHAR) is calculated as the difference between the buy-and-
hold return of the RT or SU firm and the buy-and-hold return of the matched IPO firm.
We use both equal-weighted and value-weighted (the firms’ market capitalization at the
time of the RT or SU event are used as weights) average holding period buy and hold returns to
compare the long-run performance of the RT and SU sample relative to the control sample of
IPOs. The average holding period buy and hold return across a sample of N firms is calculated
as:
17
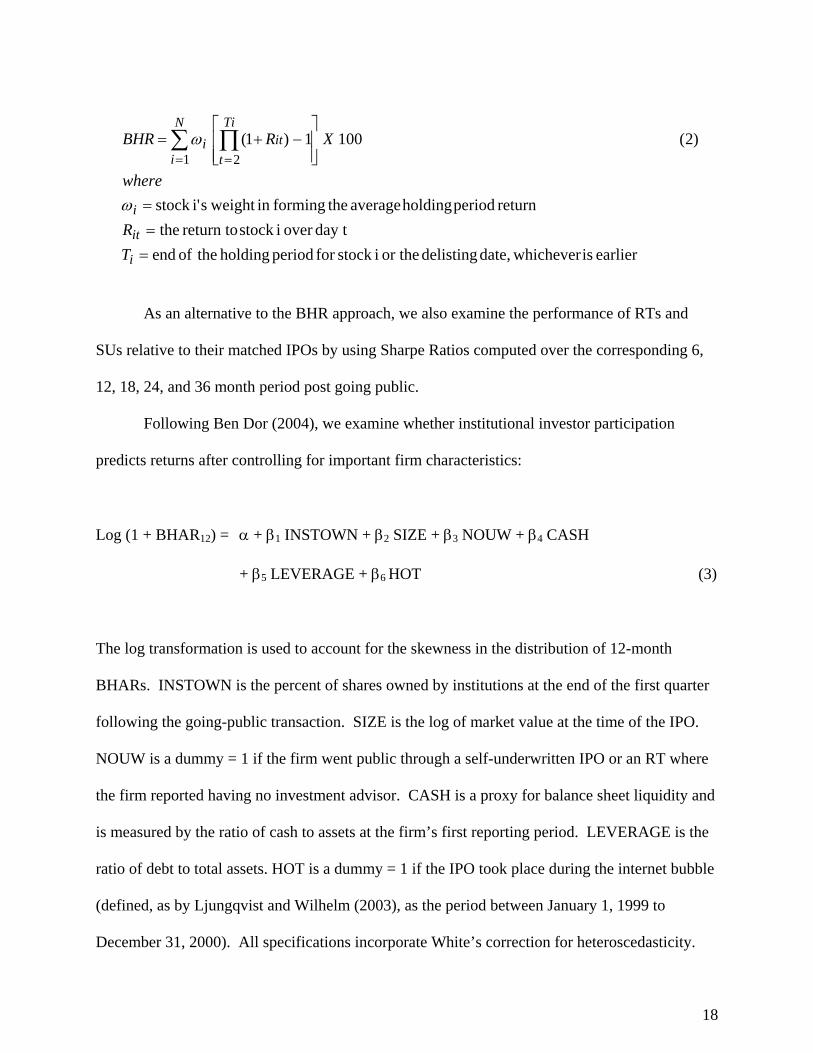
earlier is whicheverdate, delisting or the istock for period holding theof endday tover istock return to the
return periodholding average theformingin weight si'stock
)2(1001)1(21
===
⎥⎥⎦
⎤
⎢⎢⎣
⎡−+= ∏∑
==
i
it
i
Ti
tit
N
ii
TR
where
XRBHR
ω
ω
As an alternative to the BHR approach, we also examine the performance of RTs and
SUs relative to their matched IPOs by using Sharpe Ratios computed over the corresponding 6,
12, 18, 24, and 36 month period post going public.
Following Ben Dor (2004), we examine whether institutional investor participation
predicts returns after controlling for important firm characteristics:
Log (1 + BHAR12) = α + β1 INSTOWN + β2 SIZE + β3 NOUW + β4 CASH
+ β5 LEVERAGE + β6 HOT (3)
The log transformation is used to account for the skewness in the distribution of 12-month
BHARs. INSTOWN is the percent of shares owned by institutions at the end of the first quarter
following the going-public transaction. SIZE is the log of market value at the time of the IPO.
NOUW is a dummy = 1 if the firm went public through a self-underwritten IPO or an RT where
the firm reported having no investment advisor. CASH is a proxy for balance sheet liquidity and
is measured by the ratio of cash to assets at the firm’s first reporting period. LEVERAGE is the
ratio of debt to total assets. HOT is a dummy = 1 if the IPO took place during the internet bubble
(defined, as by Ljungqvist and Wilhelm (2003), as the period between January 1, 1999 to
December 31, 2000). All specifications incorporate White’s correction for heteroscedasticity.
18
6. Results
6.1. Do Firms Using Alternatives to IPOs Differ from IPOs?
6.1.1. Univariate Statistics
We first examine whether the characteristics of RT, SU, and matched IPO firms differ
significantly the year prior to the IPO. The results of univariate tests are shown in Table 2.
[Table 2 About Here]
Panel A provides mean and median values for the operating characteristics of RT, SU,
and IPO firms, for the year prior to going public15, and for the year of the going private
transaction. Anecdotal evidence suggests that firms that use alternatives to the traditional
underwritten IPO do so because they are so small, or that their operating characteristics are so
poor that either the firm cannot afford to have an investment bank underwrite the issue, or the
firm cannot find an investment bank to underwrite the issue at all. Table 2, which presents tests
of differences in means and medians, indicates that operationally, firms using RTs or SUs to go
public do not differ significantly from their IPO matches the year prior to going private16. All
three sets of firms are small, with mean (median) assets of $359.39 ($15.97) million for RTs and
SUs, and $282.77 ($22.33) million for IPOs. IPOs were size matched to RTs and SUs for the
year prior to the transaction, so it is not surprising that the mean size is not significantly
different.
Similarly, RT and SU firms do not, by and large, appear to differ from matched IPO
firms in terms of profitability, as measured by ROA and ROE, in the year prior to going public.
15 For RT firms, the year prior data is provided for the private firm that goes public via a reverse takeover. 16 Nonparametric Kolmogorov-Smirnov tests indicate that assets, ROA, ROE, Cash to Assets, Debt to Assets, and Altman’s Z are not normally distributed. Hence, we provide nonparametric as well as parametric tests throughout the paper. In most cases, the results of the nonparametric tests support the results of the parametric tests.
19
Mean figures illustrate that all three groups are unprofitable from an accounting perspective, as
indicated by negative ROA and ROE. Statistically, only RTs appear to be significantly less
profitable in terms of mean and median ROE than their control IPOs. Significant differences
appear in the year of the going private transaction, however, and firms using RTs and SUs
exhibit significantly lower profitability ratios in the years they go public.
Table 2 also provides proxies for leverage (debt/total assets), liquidity (cash and
equivalents/total assets), and distress (Altman’s Z). While RTs and SUs have cash and
equivalents comparable to their IPO matches in the year prior to going public, they exhibit
significantly lower balance sheet liquidity in the year that they go public. Furthermore, RT and
SU firms have higher leverage and are significantly more distressed (as indicated by lower
Altman’s Zs) than control IPOs the year they go public.
Table 2, Panel B provides information on market value and relative valuation in the year
of the going public transaction. We find that at the time they go public, RT and SU firms have
significantly lower market capitalization than control firms. However, their price to book and
price to sales multiples are comparable to control IPOs.
6.1.2. Logit Analysis
We next examine differences in characteristics of firms using SUs and RTs in a
multivariate framework. Table 3 provides the results of logit regressions, where the dependent
variable = 1 if the firm utilized an SU or RT to go public. We examine whether firms using
alternatives to IPOs differed from IPOs in terms of leverage, balance sheet liquidity, profitability,
and size (log of assets or sales).
[Table 3 About Here]
20
Table 3 confirms the results shown in Table 2 in a multivariate framework. Firms that use
RTs or SUs rather than IPOs tend to be smaller (as indicated by the significance of the negative
coefficient of the log of assets or sales). They also tend to exhibit higher distress, as proxied by
Altman’s Z; firms with higher Zs experience lower levels of distress, and the negative coefficient
of Altman’s Z indicates that firms with lower levels of distress are less likely to do RTs or SUs
than IPOs. The negative coefficient on the profitability measures, ROA and ROE, indicate that
more profitable firms are more likely to use IPOs than alternative measures. Finally, RTs and
SUs are associated with significantly higher levels of debt.
6.2. Do Firms Using Alternatives to Traditional IPOs Underperform Traditional IPOs?
6.2.1. First Trading Day Returns
In order to get an idea of investor sentiment and underpricing, we examine first trading
day returns. First trading day returns for RT firms are the change in the price from the close the
day prior to the first trading day of the newly public reverse takeover firm; for SUs and IPOs, the
first trading day return is measured as the change in the price at the close of the first day of
trading from the offer price. Table 4 provides first day trading returns for sample and control
firms.
[Table 4 About Here]
The mean (median) first trading day return for the combined RT and SU sample is
10.532% (2.340%), and for the RT sample is 7.882% (2.120%). By contrast, the matched
underwritten IPO firms corresponding to these two samples have a mean (median) first trading
day return of 23.415% (9.235%) and 23.054% (9.151%), respectively. The test statistics indicate
21
that the first trading day returns for both the combined RT and SU sample and for the RT only
sample are significantly lower than for their matched underwritten IPO counterparts.
It appears that market sentiment favored the underwritten IPO sample, or alternatively,
that the underwritten IPO sample experienced greater underpricing. Also, on average, SU firms
realize higher first trading day returns than RT firms as can be inferred from the larger first
trading day return for the combined RT and SU sample relative to the RT only sample. Two
factors may account for the difference in first trading returns for RTs and SUs. First, the RT is
an anticipated event. Part of the first day return may be captured in the return to the public
vehicle firm when the announcement of the merger is made to the public. Gleason et. al. (2004)
find that the (-1,0) mean (median) announcement returns to the shareholders of the public vehicle
are 15.60% (13.02%). Hence, the cash flow implications may have been partly impounded into
the price before the merger was actually completed and the private firm began trading.
Secondly, from the investor’s perspective, there is more certainty involved with the reverse
takeover than with the IPO. The value of the acquisition is known in advance in the case of the
RT, whereas for the IPO firms, the offer price is not known until the day of trading.
6.2.2. Market Performance
Table 5 provides buy and hold returns and Sharpe ratios for sample and control firms for
the 6, 12, 18, 24, and 36 month periods following their going private transactions.
[Table 5 About Here]
In general, the results in panel A suggest that long-run equal-weighted and value-
weighted average BHRs for the sample RT and SU firms are similar to the corresponding
average BHRs for matched IPO firms. We also compare median BHRs of the two samples
22
because the distribution of BHRs for both the RT and SU firms and the matched IPOs is
characterized by skewness (other studies, such as Purnandam and Swaminathan, 2004, have also
documented that long-run IPO returns are not normally distributed).
In contrast to the results above, a comparison of the Sharpe ratios of the sample firms
with the matched firms indicates that the stocks of RTs and SUs exhibit better performance, on
average, than their IPO counterparts (see panel B) over the 6, 12, 18, 24, and 36 months
following their going-public transactions.
6.2.3. Accounting Performance
To provide a broader illustration of post going public performance, Table 6 presents
changes in balance sheet profitability, liquidity, leverage, and distress variables, as well as price
to book and price to sales ratios, for the first and second full reporting years as public companies.
The table also tests if the change in the value of these variables for RT and SU firms is
significantly different from the change in the value of these variables for the matched IPO firms.
[Table 6 About Here]
The results in table 6 indicate that the profitability (ROA and ROE) of RT and SU firms
decline following the going public transaction but the decline is not statistically significant.
However, when compared with their IPO counterparts, RT and SU firms show a significantly
larger decline in ROA over the second year after they go public, and in ROE over the first year
after they go public.
Table 6 also indicates that balance sheet liquidity, proxied by cash/assets, declines
significantly for RT and SU firms over the two years after they go public. Furthermore, the
decline in the cash to assets ratio for RT and SU firms is significantly greater than that for their
23
matched IPO controls. The leverage increases significantly for sample firms over the first and
second full trading years. However, sample firms did not experience a greater increase in
leverage than control firms did. The results for Altman’s Z are mixed; while sample firms
experience a significantly larger decline in distress (increase in Z) over the first year than control
firms, distress appears to increase significantly (decline in Z) for the combined RT and SU
sample over the second year.
Finally, Table 6, Panel B provides evidence suggesting that market value multiples (price
to book and price to sales) decline during the first and second reporting years as a public
company for sample firms, though the decline is not greater than that experienced by control IPO
firms. Both the combined RT and SU sample and the RT sample exhibit an insignificant decline
in price to book. Price to sales, however, declines significantly for the combined RT and SU
sample and the RT firms alone.
Taken together, the results in Table 6 indicate that RT and SU firms experience a decline
in liquidity and an increase in leverage after they go public but these changes are not
significantly different from the corresponding changes shown by control underwritten IPO firms.
6.2.4. Volatility and Trading Liquidity
We investigate volatility and trading liquidity of sample and control firms following the
inception of trading. The popular perception of RTs and SUs is that they are less liquid, more
volatile, and generally riskier than IPOs. Also, RT and SU firms do not benefit from the
stabilization efforts of an IPO underwriter. Table 7 provides data on volatility, as measured by
the standard deviation of returns, over the 6, 12, 18, 24, and 36 months following the going-
public transaction.
24
[Table 7 About Here]
Table 7, Panel A shows that the stocks of RT and SU firms are significantly more volatile
than the stocks of matched IPO firms over each time interval. Similar results are obtained if the
comparison is done for the sample of RT firms only and their matched IPO firms (see Panel B).
Table 8 provides the results of an analysis of liquidity of RT and SU firms over the first,
second, and third year following their going-public transactions.
[Table 8 About Here]
Panel A documents that the RT and SU firms are less liquid than their IPO counterparts
in each of the three years following the RT or SU event date. Similar results are obtained when
the comparison is done for the sample of RT firms only and their IPO counterparts (see Panel B).
These results are consistent with those in Eckbo and Norli (2001), which finds that IPOs are
more liquid than size-matched seasoned firms. We measure liquidity by turnover, which is
volume divided by number of shares outstanding. Liquidity is measured beginning from the
second month after the event date (i.e. date of reverse takeover or self-underwritten offering),
and is measured as daily averages for each of the first three years. In each year, an RT and SU
firm is included in the sample if it and its matched IPO (in the case of Panels A and B) have a
minimum of 200 observations for which daily turnover can be calculated.
Unlike SUs and IPOs, RTs involve a previously existing and trading public firm. So in
Panel C we examine if the liquidity of the public firm is affected by the reverse takeover. We
find that there is no statistically significant change in the liquidity of the public firm because of
the reverse takeover, as the liquidity of the pre-existing public firm in the year prior to the
reverse takeover is not statistically different from the liquidity in the year after the reverse
takeover. This result suggests that while the shareholders of the private firm experience a
25
significant improvement in their liquidity position as a result of going public, the shareholders of
the former vehicle firm who remain as shareholders of the newly public firm do not.
6.2.5. Ability to Attract Institutional Ownership
In Table 9, we compare the institutional ownership of the combined RT and SU sample
and the RT only sample with the institutional ownership of the matched IPO sample during the
quarter of the event (i.e. reverse takeover or self-underwritten offering) and the following quarter
(see Panel A). We also do this comparison for the period corresponding to the matched firm’s
IPO (see Panel B). Finally, we examine if there is a change in the institutional ownership for
sample and control firms in the quarter after they go public.
[Table 9 About Here]
To illustrate the contents of Table 9, we provide the following example. Hayes Corp went
public through an RT on 7/30/1997. Its control firm, Ciena Corp, did an IPO on 2/7/1997. Table
9 column A1, shows the percent institutional ownership for RT firms at the end of the quarter in
which they went public (i.e., for Hayes, the quarter including 7/30/1997) and the quarter after.
Column A3 provides the same information for the combined RT and SU sample. Column A2
(A4) shows the institutional ownership of the matched IPO firm at the time the RT (RTSU) firm
went public (i.e., institutional ownership is reported for Ciena for the quarter including
7/30/1997, which is the quarter that the sample firm Hayes went public, and the quarter after).
Columns A5 and A6 provide t-statistics and Wilcoxon Z statistics for difference in mean and
medians between the RT sample and control IPO firms and between the full RTSU sample and
matched control firms, respectively.
26
The information for the RT sample and the combined RTSU sample remains the same in
Panel B. What differs in Panel B is the time measurement for control sample comparison
purposes. Column B2 (B4) provides the percent institutional ownership for the IPO control firms
for the RT (RTSU) sample for the quarter during which the control firm went public and the
quarter after (i.e., Ciena’s institutional ownership the quarter of 2/7/1997, when Ciena went
public, and the quarter after). In using both time measurements, we take into account market
conditions that might affect institutional ownership decisions as well as the decisions of
institutions to hold stock involving the “trading age” of the firm, or the time since the firm went
public.
Table 9 shows that at the end of the first reporting quarter, RTs and the combined RT and
SU sample exhibit significantly lower levels of institutional ownership relative to the control IPO
sample (a mean of 11.162% for RTs and 11.811% for the combined RT and SU sample, vs.
23.803% for matched IPO firms in the same period, and 17.832% for IPO firms in the period
when the IPO firm went public. Similarly, in the quarter following the going public transaction,
institutional ownership is significantly lower for RT firms and for RT and SU firms than for the
matched sample IPOs.
The last row in Table 9 indicates that while institutional ownership for the RT sample and
the combined RT and SU sample declined significantly between the quarter they went public and
the following quarter, institutional ownership rose significantly for control IPO firms.
Taken together, these results suggest that the IPO process provides benefits to IPO firms
in terms of obtaining institutional support for their clients. While clients pay for these services,
they appear more difficult to achieve without the help of all that is involved in the IPO process,
from the roadshow to aftermarket stabilization. The marketing function performed by the lead
27
manager appears to be more effective than that of the merger advisor in the case of the RT or the
management of the company in the case of the SU in attracting institutional support.
6.3. Post Going-Public Return Predictability
We next examine the factors that influence the long horizon performance of firms using
RTs and SUs to go public. Table 10 provides the results of regressions for three model
specifications where the dependent variable is 12 month buy and hold abnormal returns
(BHARs) of RT and SU firms.
[Table 10 About Here]
All three model specifications indicate that institutional ownership at the end of the first
quarter is a significant determinant of superior post going-public performance. This supports the
notion that institutional owners mitigate agency conflicts and provide monitoring for newly
public firms. The market capitalization of the RT or SU firms is negatively related to 12-month
BHARs but its coefficient is significant (at the 10% level) in only one specification. The
negative and significant coefficient on the HOT dummy variable in Model 3 indicates that firms
that engage in RTs or SUs during hot IPO markets (defined as per Ljungqvist and Wilhelm
(2004) and Loughran and Ritter (2004) as the period corresponding to the “internet bubble” in
1999 and 2000) perform poorly, consistent with other IPO studies.17 However, the negative
coefficient on the HOT dummy variable is insignificant in Model 2. Models 1 and 2 indicate that
higher leverage (proxied by the ratio of debt to total assets) is detrimental to long term
performance of RT and SU firms, while Model 3 indicates that higher balance sheet liquidity –
proxied by cash and equivalents to total assets – is positively and significantly related to
17 Ofek and Richardson (2003) use the 1998 – 2000 time period to represent the “internet bubble”. Our results are robust to this definition of hot market as well.
28

performance. The significance of both leverage and liquidity indicate that firms need to take
actions to reduce leverage and manage cash flow from the time they go public, and this would be
particularly true for firms in industries with high “burn rates” or for firms that would find
accessing the capital markets through a secondary offering prohibitively costly.
We also investigate whether having outside valuation assistance facilitates better post-
valuation performance. We include NOUW, a dummy variable, which is equal to 1 if the firm is
either an SU (with no underwriter) or an RT with no investment advisor18. Having no investment
advisor or underwriter (i.e., truly a “do it yourself” deal) is significantly and negatively related to
12 month performance in all three model specifications. This is consistent with comments made
by Capital West Securities banker Bob Rader, in explaining why self-managed going public
transactions often fail: “As a manager, you need to dedicate your time to running the firm, rather
than going out and trying to find people interested in your stock.”19 While not necessarily a
strong indicator of the role performed by the underwriter in a traditional IPO, this result is
consistent with the conjecture that managerial resources can become overextended if the firm
does not seek outside assistance with the going public transaction, and with the idea that an
outside financial valuation group provides certification of value.
7. Conclusions
In this paper, we examine the characteristics of firms using reverse takeovers and self-
underwritten IPOs as an alternative to the traditional underwritten IPO. We find that firms that
use alternative mechanisms tend to be less profitable than IPO firms of comparable size in the
same 3 digit SIC code. At the time that they go public, they do not exhibit significantly lower
18 Some reverse takeover firms report hiring a financial advisor to assist with the deal. However, about a third report “no investment advisor” in their pre-merger financial statements. 19 Personal interview with Bob Rader of Capital West Securities, 7/30/2004.
29
balance sheet liquidity or significantly higher distress. However, by two years post going public,
they have significantly higher debt and experience declines in profitability and balance sheet
liquidity.
We also examine post going public liquidity, volatility, institutional ownership, and post
IPO performance. We find that RT and SU firms are characterized by lower levels of liquidity
and significantly higher volatility, as measured by the standard deviation of returns. While the
combined sample of RT and SU firms have comparable institutional ownership post going public
to their control IPO firms, RT firms are characterized by statistically lower institutional
ownership than their matches, and while IPO firms experience significant increases in
institutional support, those using RTs and SUs experience declines. We also find evidence that
firms utilizing alternative going public mechanisms outperform their matched traditional IPO
counterparts over longer horizons as indicated by mean and median tests of Sharpe ratios;
however, the returns for buy and hold returns are mixed.
Our results have important implications for managers – namely, that the traditional
underwritten IPO is not the only game in town, and that firms can avoid the costs of the
traditional IPO without experiencing substantially lower performance by some measures.
However, investors should consider that firms using RTs and SUs experience lower institutional
ownership participation, lower liquidity, and higher volatility. Finally, having no investment
advisor at all when arranging a going public transaction appears to be negatively correlated with
long run performance.
30
References Baker, M. and J. Wurgler, 2000, The equity share in new issues and aggregate stock returns, The Journal of Finance 55, 2219-2257. Ben Dor, A., 2004, Sentiment, Long Run Performance, and the Cross Section of Institutional Ownership in IPOs, unpublished working paper, Northwestern University. Brav, A., C. Geczy, and P. A. Gompers, 2000, Is The Abnormal Return Following Equity Issuances Anomalous? Journal of Financial Economics, 56, 209-250. Brav, A. and P. A. Gompers, 1997, Myth or reality? The long-run underperformance of initial public offerings: Evidence from venture and nonventure capital-backed companies, Journal of Finance 52, 1791-1821. Brown, K., A. Dittmar, and H. Servaes, 2004, “Roll-ups: Performance and Incentives for Industry Consolidating IPOs,” Review of Financial Studies, forthcoming. Burns, J., April 14, 2004, SEC May Impose Stricter Rules on Behavior of Shell Companies, Dow Jones Newswires. Carter, R. B. and Dark, F. H., 1993, Underwriter reputation and initial public offerings: The detrimental effects of flippers, Financial Review, 28, 2, 279-301. Carter, R. B., F. H. Dark and A. K. Singh, 1998, Underwriter reputation, initial returns, and the long-run performance of IPO stocks, Journal of Finance 53, 285-311. Chen, C. and Lin, T. H., 1996, The information content of self-underwritten IPOs.” In Empirical Issues in Raising Equity Capital. Edited by Mario Levis. Elsevier Science B.V. Amsterdam, the Netherlands. Chen, Hsuan-Chi and Ritter, Jay R. (2000). “The Seven Percent Solution.” The Journal of Finance, 55, 1105-1131. Eckbo, Espen, and Orvind Norli, 2001, Leverage, liquidity, and long-run IPO returns, unpublished Dartmouth University working paper. Gleason, K., L. Rosenthal, and R. Wiggins, 2004, Reverse takeovers: Backing into being public, Journal of Corporate Finance, forthcoming. Gompers, P., and J. Lerner, 1999, Conflict of Interest and Reputation in the Issuance of Public Securities: Evidence from Venture Capital, Journal of Law and Economics, 42, 53-80
Gompers, P., and J. Lerner, 2003, The really long-term performance of initial public offerings: The pre-Nasdaq evidence, Journal of Finance, 58, 1355-1392.
31
Hennessey, R., 2004, Mum is the Word on Where IPOs Will Call Home, Wall Street Journal, June 7, 2004, page c4. Hirshleifer, D., 2001, Investor Psychology and Asset Pricing, Journal of Finance, 56, 1533-1598. Keloharju, M., 1993, The winner's curse, legal liability, and the long-run price performance of initial public offerings in Finland, Journal of Financial Economics 34, 251-277 Lee, P. J., S. L. Taylor and T. S. Walter, 1999, IPO underpricing explanations: Implications from investor application and allocation schedules, Journal of Financial and Quantitative Analysis 34, 425-444. Levis, M., 1993, The Long-Run Performance of Initial Public Offerings: The UK Experience 1980-1988, Financial Management, 22, 28-41. Lewis, M., 2001, Online IPO Revolution Postponed, Forbes.com, http://www.forbes.com/2001/03/14/0314banks.html. Lipman, F., 2001, The Complete Going Public Handbook. Prima Publishing, Roseville, CA. Ljungqvist, A., V. Nanda, and R. Singh, 2002, Hot markets, investor sentiment, and IPO pricing, unpublished NYU working paper. Ljungqvist, A. and Wilhelm, W.J., 2003, IPO pricing in the dot-com bubble, Journal of Finance, 58, 723-752. Loughran, T. and J. R. Ritter, 1995, The new issues puzzle, Journal of Finance 50, 23-51. Loughran, T., and J. R. Ritter, 2000, Uniformly least powerful tests of market efficiency, Journal of Financial Economics, 55, 361-389. Loughran, T., and J. R. Ritter, 2004, Why Has IPO Underpricing Increased Over Time? Financial Management, 33, 5-37. Loughran, T., J.R. Ritter and K. Rydqvist, 1994, Initial public offerings: International insights, Pacific-Basin Finance Journal 2, 165-199. Muscarella, C. J. and Vetsuypens, M. R., 1989, A simple test of Baron's model of IPO underpricing. Journal of Financial Economics, 24, 125-136. Ofek, E., and M. Richardson, 2003, DotCom Mania: The rise and fall of internet stock prices, Journal of Finance, 58, 1113-1138. Purnanandam, A. K., and B. Swaminathan, 2004, Are IPOs underpriced? Review of Financial Studies, forthcoming.
32

Ritter, J. R., 1987, The Costs of Going Public, Journal of Financial Economics, 19, 269-281.
Ritter, J. R., 1991, The long run performance of initial public offerings, Journal of Finance, 46, 3-27. Ritter, J. R., and I. Welch, 2002, A review of IPO activity, pricing, and allocations, Journal of Finance, 57, 1795-1828.
33
Table 1. Sample Descriptive Characteristics This table shows the sample breakdown by transaction (reverse takeover, self-underwritten IPO, and traditional IPO), by year (Panel A), and by SIC code (Panel B). Panel A. Sample by year
Year Number RT Only
Percent Number SU Only
Percent Number RT and SU Percent
1984 0 0 1 1.89 1 0.56 1986 0 0 2 3.77 2 1.11 1987 1 0.79 1 1.89 2 1.11 1989 2 1.57 0 0 2 1.11 1990 4 3.15 0 0 4 2.22 1991 3 2.36 5 9.43 8 4.44 1992 6 4.72 2 3.77 8 4.44 1993 13 10.24 1 1.89 14 7.78 1994 8 6.30 2 3.77 10 5.56 1995 8 6.30 0 0 8 4.44 1996 14 11.02 3 5.66 17 9.44 1997 14 11.02 3 5.66 17 9.44 1998 13 10.24 2 3.77 15 8.33 1999 21 16.54 9 16.98 30 16.67 2000 11 8.66 12 22.64 23 12.78 2001 8 6.30 4 7.55 12 6.67 2002 1 0.79 3 5.66 4 2.22 2003 0 0 3 5.66 3 1.67 Total 127 100 53 100 180 100
Panel B. Sample by SIC code RT SU RT and SU SIC Frequency Percent Frequency Percent Frequency Percent
1000-1999 15 11.81 4 7.55 19 10.562000-2999 14 11.02 9 16.98 23 12.783000-3999 19 14.96 6 11.32 25 13.894000-4999 6 4.72 3 5.66 9 5.005000-5999 15 11.81 6 11.32 21 11.676000-6999 19 14.96 12 22.64 31 17.227000-7999 26 20.47 8 15.09 34 18.898000-8999 11 8.66 4 7.55 15 8.339000-9999 2 1.57 1 1.89 3 1.67
Total 127 100 53 100 180 100
34
Table 2. Firm Characteristics Prior to Going Public *, **, *** represent significance at the 10%, 5%, and 1%, respectively. Panel A. Mean (median) descriptive statistics, year prior to going public (T-1) and year of going public transaction (T). Year Prior to Going Public (T-1) | Year of Going Public (T) RT&SU RT Only
Mean (Median)
Mean (Median)
IPO Mean (Median)
RT&SU vs. IPO T-statistic Wilcoxon Z
RT vs. IPO T-statistic Wilcoxon Z
RT&SU Mean (Median)
RT Only Mean (Median)
IPO Mean (Median)
RT&SU vs. IPO T-statistic (Wilcoxon Z)
RT vs. IPO T-statistic Wilcoxon Z
Assets 359.39 376.98 (15.97) (16.29)
283.77 (22.33)
0.321 (-0.371)
0.302 (-1.042)
516.08 (17.72)
652.37 (24.69)
393.64 (71.07)
0.413 (-2.983)***
0.457 (-2.998)***
ROA -22.833 -21.181 (-8.773) (-10.53)
-24.306 (0.314)
-0.669 (-1.016)
-0.568 (-1.078)
-32.186 (-4.271)
-26.863 (-3.845)
-8.569 (1.863)
-4.168*** (-4.189)***
-3.148*** (-3.528)***
ROE -13.489 -13.553 (-1.033) (-2.77)
16.633 (19.081)
-2.795** (-2.765)***
-3.757*** (-3.558)***
-9.961 (-1.244)
-14.062 (-2.35)
-8.891 (4.055)
-0.205 (-0.453)
-0.849 (-1.096)
Cash/Total Assets
20.803 (8.825)
22.961 (10.300)
24.884 (12.100)
-0.317 (-0.027)
-0.899 (-1.087)
22.109 (10.090)
22.899 (11.304)
14.903 (4.799)
-4.537*** (-3.904)***
-2.65*** (-2.429)**
Z 2.493 3.920 (1.920) (2.380)
0.268 (2.013)
1.143 (-0.894)
1.143 (1.509)
1.100 (2.118)
2.110 (2.268)
10.249 (5.991)
-4.855*** (-5.029)***
-4.855*** (-4.453)***
Debt/Total Assets
24.255 (17.638)
20.854 (13.801)
30.795 (20.348)
-1.274 (-1.240)
-1.822* (-1.830)*
27.026 (19.744)
24.829 (17.381)
14.903 (4.779)
3.775*** (3.351)***
2.757*** (2.465)**
Panel B. Mean (median) valuation, year of going public transaction (time T) RT&SU RT Only
Mean (Median)
Mean (Median)
IPO Mean (Median)
RT&SU vs. IPO T-statistic Wilcoxon Z
RT vs. IPO T-statistic Wilcoxon Z
Market Capitalization 75.955 (19.573)
58.671 (16.530)
487.303 (110.86)
-1.815* (-7.320)***
-1.878* (-7.677)***
Price/Book
5.796 (1.960)
7.585 (2.282)
5.235 (2.997)
0.333 (-1.990)**
0.902 (-1.289)
Price/Sales
9.566 (0.227)
7.143 (0.205)
6.128 (0.248)
0.984 (-1.217)
0.922 (-1.076)
Table 3. Logit Regressions. Dependent variable is RT or SU = 1, IPO = 0; models show factors affecting the probability of firm using an alternative to an IPO (such as an RT or SU) versus an IPO. SIZE is proxied by the log of assets (or sales) at the time of the going public transaction, Altman’s Z (Z) is a distress proxy, CASH, a proxy for balance sheet liquidity, is the ratio of cash and equivalents to total asset, PROFIT, a profitability measure, is proxied by ROA or ROE in different specifications, and LEVERAGE is the ratio of debt to total assets. All variables are as of the year of the going-public transaction. Wald statistics are shown below parameter estimates. *, **, *** represent significance at the 10%, 5%, and 1%, respectively. 1 2 3 4 Constant 2.588
(26.623)*** 2.741 (26.980)***
2.385 (18.835)***
1.795 (15.510)***
Log assets -0.512 (22.709)***
-0.462 (27.728)***
Log sales -0.512 (23.542)***
-0.436 (15.705)***
Z -0.071 (8.142)***
-0.069 (6.356)**
-0.063 (5.846)**
CASH -1.816 (9.202)***
-3.352 (18.561)***
-3.505 (20.072)***
-2.098 (15.226)***
Return on Assets -0.009 (1.778)*
Return on Equity -0.001 (0.002)
0.001 (0.107)
-0.001 (0.208)
LEVERAGE
0.017 (6.42)**
Likelihood Ratio 80.72*** 79.130*** 83.491*** 68.807*** Wald Chi-square 41.92*** 42.470*** 41.990*** 45.744*** N 253 253 253 255 Table 4. First Trading Day Returns Mean (median) first trading day returns (in %) for all RT and SU firms and matched IPO firms, and for RTs only and matched IPO firms. First trading day returns for RT firms are the change in the price from the close the day prior to the first trading day of the newly public reverse takeover firm; for SUs and IPOs, the first trading day return is measured as the change in the price at the close of the first day of trading from the offer price.
N Mean returns
(median)
Matched IPO mean returns
(median) t-test for difference
(Wilcoxon Z) All RTs and SUs 138
10.532 (2.340)
23.415 (9.235)
-2.66*** (-3.54)***
RTs only 116 7.882
(2.120) 23.054 (9.151)
-2.77*** (-3.51)***
36
Table 5. Post-Going Public Performance Panel A. Buy and Hold Returns Mean and median equal-weighted and value-weighted 6, 12, 18, 24, and 36-month buy and hold returns for all RT and SU firms and matched IPOs (a), and for RTs only and matched IPOs (b). The market capitalization of a firm on the RT or SU date is used as a weight to calculate the value-weighted results. *, **, *** represent significance at the 10%, 5%, and 1%, respectively. a. All RT and SU firms
Period Equal-weighted Mean (Median) BHRs Value-weighted Mean (Median) BHRs
(in months) N RT&SU Matched
IPO t-test for diff. (Wilcoxon Z) RT&SU
Matched IPO
t-test for diff. (Wilcoxon Z)
6 141 17.3480
(-9.0909) -3.4021
(-13.9344) 2.0582** (1.7401)*
-0.1540 (-0.0132)
0.0532 (-0.0088)
-1.4342 (-0.9004)
12 119 4.5481
(-14.6718) -7.2865
(-23.9667) 1.0847
(0.9069) -0.3215
(-0.0242) 0.1894
(-0.0187) -1.5682
(-0.7823)
18 108 -0.5163
(-30.5095) -4.6172
(-23.2375) 0.3010
(0.6590) -0.4130
(-0.0467) 0.7149
(-0.0168) -1.3461
(-1.1709)
24 100 4.3538
(-40.9827) -0.7334
(-24.4302) 0.3320
(-0.6945) -0.5363
(-0.0594) 0.8599
(-0.0127) -1.4039
(-2.3002)**
36 90 41.6333
(-18.3068) 26.5372
(-22.7232) 0.5610
(0.4909) -0.2612
(-0.0169) 1.8833
(-0.0081) -1.1002
(-1.2212) b. RT firms only
Period Equal-weighted Mean (Median) BHRs Value-weighted Mean (Median) BHRs
(in months) N RT Matched
IPO t-test for diff. (Wilcoxon Z) RT
Matched IPO
t-test for diff. (Wilcoxon Z)
6 119 22.8059
(-6.0000) -0.1797
(-12.4445) 1.9730*
(1.6600)* -0.0868
(-0.0058) 0.0999
(-0.0102) -1.4210
(-0.2493)
12 98 7.2222
(-13.7876) -4.8527
(-23.1855) 0.9575
(0.7388) -0.2344
(-0.0172) 0.3045
(-0.0239) -1.2873
(-0.0549)
18 90 3.5220
(-30.5095) -1.5509
(-18.3071) 0.3221
(0.5452) -0.1046
(-0.0483) 1.0346
(-0.0224) -1.0155
(-0.4567)
24 85 11.1719
(-37.5000) 3.9292
(-21.7391) 0.4127
(-0.5061) -0.2852
(-0.0461) 1.2223
(-0.0149) -1.1451
(-1.3912)
36 76 46.0909
(-18.3068) 37.6156
(-16.0405) 0.2741
(0.1217) 0.0233
(-0.0196) 2.5979
(-0.0094) -0.9764
(-1.0096)
37
Panel B. Sharpe Ratios
Mean (Median) Sharpe Ratios for 6, 12, 18, 24, and 36-month periods for all RT and SU firms and matched IPOs (a), and RTs only and matched IPOs (b). a. All RT and SU firms
Period Mean (Median) Sharpe Ratios
(in months) N RT&SU (median)
Matched IPO (median)
t-test for diff (Wilcoxon Z)
6 141 0.0200
(0.0177) -0.0187
(-0.0062) 1.98**
(3.23)***
12 119 0.0159
(0.0184) 0.0009
(0.0007) 2.05**
(2.31)**
18 108 0.0177
(0.0172) 0.0088
(0.0065) 1.56
(1.83)*
24 100 0.0162
(0.0182) 0.0122
(0.0093) 0.79
(1.06)
36 90 0.0247
(0.0248) 0.0169
(0.0195) 1.68*
(2.21)** b. RT firms only
Period Mean (Median) Sharpe Ratios
(in months) N RT
(median) Matched IPO
(median) t-test for diff. (Wilcoxon Z)
6 119 0.0264
(0.0267) -0.0193
(-0.0062) 2.01**
(3.47)***
12 98 0.0188
(0.0203) 0.0024
(-0.0011) 2.06**
(2.23)**
18 90 0.0210
(0.0205) 0.0099
(0.0065) 1.81*
(2.10)**
24 85 0.0190
(0.0195) 0.0142
(0.0103) 0.89
(1.15)
36 76 0.0263
(0.0267) 0.0190
(0.0204) 1.42
(1.80)*
38

Table 6. Balance Sheet Performance and Valuation Ratios Post Going-Public (years 1 and 2) ROA, ROE, Cash/Assets, and Debt/Assets are reported in %. *, **, *** represent significance at the 10%, 5%, and 1%, respectively. RT and
SU Mean (Median)
Difference from prior year = 0 T (Z)
Tests for diff. in change for RT and SU vs. change for IPO T (Z)
RT Only Mean (Median)
Difference from prior year = 0 T (Z)
Tests for diff. in change for RT and SU vs. change for IPO T (Z)
ROA, 1 -4.761 (-0.091)
-0.742 (-0.376)
-0.782 (-1.639)
-1.982 (-0.293)
-0.835 (-0.586)
-0.603 (-0.742)
ROA, 2 -3.366 (0.055)
-0.715 (-0.725)
-3.204*** (-2.769)***
-4.163 (0.085)
0.303 (-0.150)
-3.296*** (-2.891)***
ROE, 1 -3.845 (-0.005)
-0.791 (-0.804)
0.812 (1.783)*
-7.797 (-0.933)
-1.533 (-1.391)
0.340 (0.701)
ROE, 2 -1.790 (-0.684)
-1.004 (-0.954)
0.762 (1.639)
-7.981 (-1.273)
-0.594 (-0.753)
0.478 (1.471)
Cash/Assets, 1 -6.440 (-2.123)
-3.060*** (-3.437)***
0.682 (0.770)
-6.767 (-0.205)
-3.089*** (-3.301)***
0.608 (1.040)
Cash/Assets, 2 -4.662 (2.020)
-2.033** (-2.563)***
2.801*** (2.725)***
-3.972 (-1.347)
-1.609 (-2.128)**
2.600** (2.706)***
Debt/Assets, 1 4.176 (0.764)
2.021** (2.298)**
-0.276 (-0.322)
5.705 (1.569)
2.417** (2.581)**
0.286 (0.633)
Debt/Assets, 2 7.568 (2.256)
2.708*** (2.874)***
-0.157 (-0.040)
7.801 (2.370)
2.689*** (2.740)***
-0.204 (-0.208)
Altman’s Z, 1 3.018 (-0.395)
1.143 (-0.935)
3.001*** (2.685)***
-0.247 (-0.369)
0.210 (-0.794)
3.172*** (2.688)***
Altman’s Z, 2 -1.502 (-0.431)
-0.586 (-1.673)*
2.607** (3.749)***
1.995 (-0.710)
0.737 (-0.660)
2.695** (4.802)***
Price/Book, 1 -3.804 (-0.162)
-1.064 (-1.233)
-0.914 (-0.217)
-5.229 (-0.255)
-1.368 (-1.376)
-0.980 (-1.205)
Price/Book, 2 -3.567 (-0.153)
-1.158 (-0.487)
1.279 (-0.814)
-4.592 (-0.193)
-1.115 (-0.736)
1.228 (-0.650)
Price/ Sales, 1 -0.743 (-0.090)
-2.395** (-5.946)***
0.411 (0.381)
-0.401 (-0.750)
-1.378 (-4.780)***
-0.709 (-0.117)
Price/Sales, 2 -0.689 (-0.079)
-0.902 (-5.096)***
-0.606 (-0.515)
0.0465 (-0.747)
0.062 (-4.516)***
-1.408 (-0.274)
39
Table 7. Volatility Post Going-Public *, **, *** represent significance at the 10%, 5%, and 1%, respectively.
Mean (median) standard deviation of returns for 6, 12, 18, 24, and 36-month periods for all the RT and SU firms and matched IPOs (Panel A), and for RTs only and matched IPOs (Panel B) Panel A. All RT and SU firms
Period Mean (Median) Volatility
(in months) N RT&SU (median)
Matched IPO (median)
t-test for diff (Wilcoxon Z)
6 141 0.0723
(0.0605) 0.0486
(0.0436) 5.658***
(5.244)***
12 119 0.0663
(0.0595) 0.0514
(0.0486) 4.048***
(3.626)***
18 108 0.0667
(0.0574) 0.0533
(0.0474) 3.196*** (2.520)**
24 100 0.0685
(0.0602) 0.0530
(0.0486) 3.542***
(2.952)***
36 90 0.0645
(0.0566) 0.0532
(0.0478) 2.418** (1.867)*
Panel B. RT firms only
Period Mean (Median) Volatility
(in months) N RT
(median) Matched IPO
(median) t-test for diff. (Wilcoxon Z)
6 119 0.07668 (0.0645)
0.0476 (0.0429)
6.360*** (5.993)***
12 98 0.0699
(0.0659) 0.0507
(0.0472) 4.779***
(4.208)***
18 91 0.0700
(0.0593) 0.05311 (0.0472)
3.619*** (2.895)***
24 84 0.0708
(0.0610) 0.0527
(0.0484) 3.718***
(3.086)***
36 76 0.0670
(0.0568) 0.0531
(0.0478) 2.699**
(-2.164)**
40
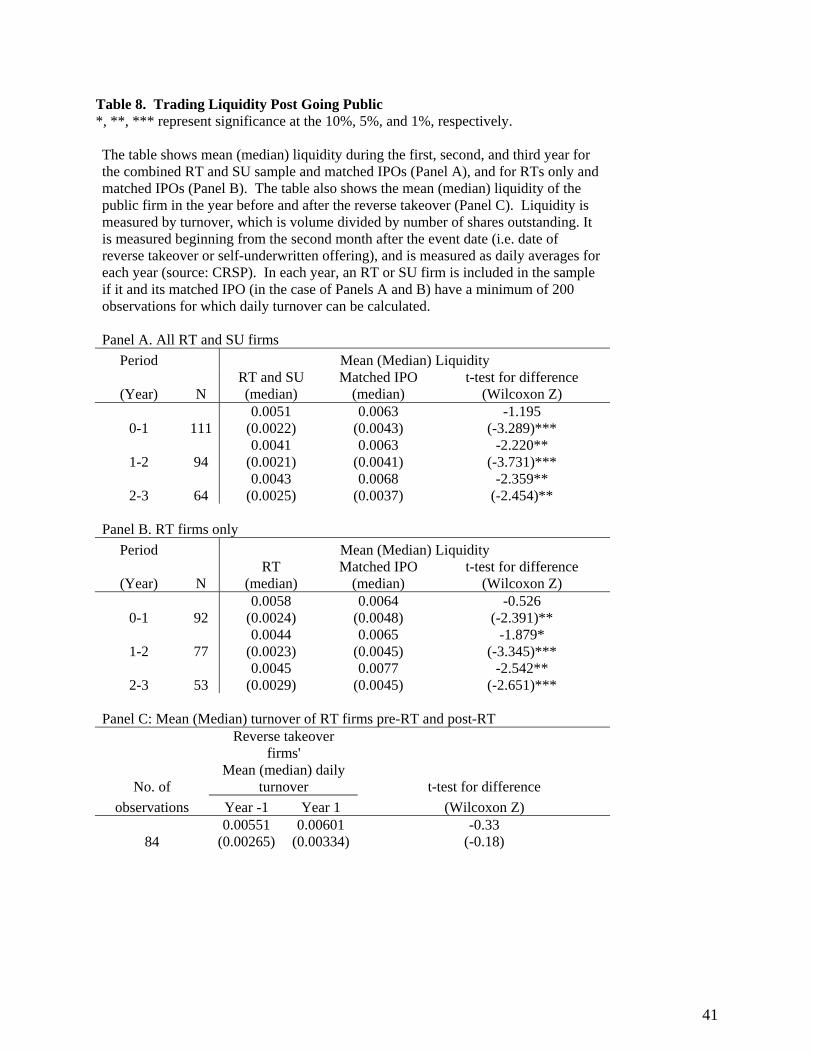
Table 8. Trading Liquidity Post Going Public *, **, *** represent significance at the 10%, 5%, and 1%, respectively. The table shows mean (median) liquidity during the first, second, and third year for the combined RT and SU sample and matched IPOs (Panel A), and for RTs only and matched IPOs (Panel B). The table also shows the mean (median) liquidity of the public firm in the year before and after the reverse takeover (Panel C). Liquidity is measured by turnover, which is volume divided by number of shares outstanding. It is measured beginning from the second month after the event date (i.e. date of reverse takeover or self-underwritten offering), and is measured as daily averages for each year (source: CRSP). In each year, an RT or SU firm is included in the sample if it and its matched IPO (in the case of Panels A and B) have a minimum of 200 observations for which daily turnover can be calculated. Panel A. All RT and SU firms
Period Mean (Median) Liquidity
(Year) N RT and SU (median)
Matched IPO (median)
t-test for difference (Wilcoxon Z)
0-1 111 0.0051
(0.0022) 0.0063
(0.0043) -1.195
(-3.289)***
1-2 94 0.0041
(0.0021) 0.0063
(0.0041) -2.220**
(-3.731)***
2-3 64 0.0043
(0.0025) 0.0068
(0.0037) -2.359**
(-2.454)** Panel B. RT firms only
Period Mean (Median) Liquidity
(Year) N RT
(median) Matched IPO
(median) t-test for difference
(Wilcoxon Z)
0-1 92 0.0058
(0.0024) 0.0064
(0.0048) -0.526
(-2.391)**
1-2 77 0.0044
(0.0023) 0.0065
(0.0045) -1.879*
(-3.345)***
2-3 53 0.0045
(0.0029) 0.0077
(0.0045) -2.542**
(-2.651)*** Panel C: Mean (Median) turnover of RT firms pre-RT and post-RT
Reverse takeover
firms'
No. of Mean (median) daily
turnover t-test for difference observations Year -1 Year 1 (Wilcoxon Z)
84 0.00551
(0.00265) 0.00601
(0.00334) -0.33
(-0.18)
41
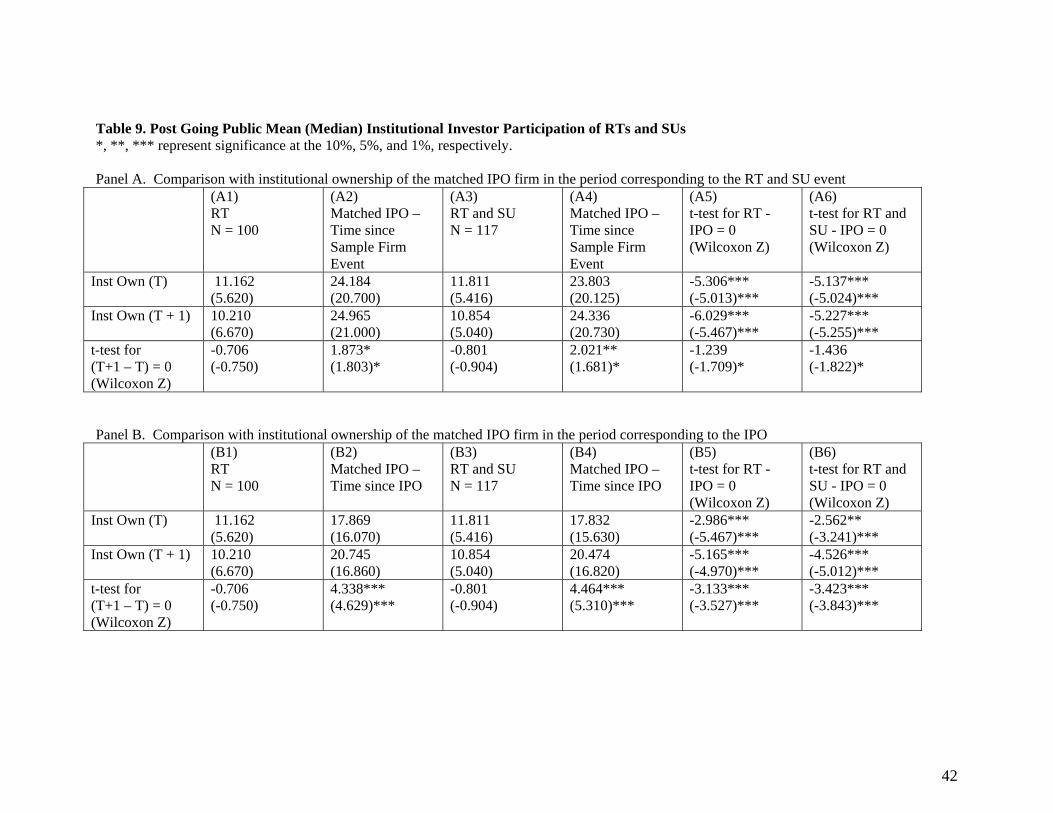
Table 9. Post Going Public Mean (Median) Institutional Investor Participation of RTs and SUs *, **, *** represent significance at the 10%, 5%, and 1%, respectively. Panel A. Comparison with institutional ownership of the matched IPO firm in the period corresponding to the RT and SU event
(A1)RT N = 100
(A2) Matched IPO – Time since Sample Firm Event
(A3) RT and SU N = 117
(A4) Matched IPO – Time since Sample Firm Event
(A5) t-test for RT - IPO = 0 (Wilcoxon Z)
(A6) t-test for RT and SU - IPO = 0 (Wilcoxon Z)
Inst Own (T) 11.162 (5.620)
24.184 (20.700)
11.811 (5.416)
23.803 (20.125)
-5.306*** (-5.013)***
-5.137*** (-5.024)***
Inst Own (T + 1) 10.210 (6.670)
24.965 (21.000)
10.854 (5.040)
24.336 (20.730)
-6.029*** (-5.467)***
-5.227*** (-5.255)***
t-test for (T+1 – T) = 0 (Wilcoxon Z)
-0.706 (-0.750)
1.873* (1.803)*
-0.801 (-0.904)
2.021** (1.681)*
-1.239 (-1.709)*
-1.436 (-1.822)*
Panel B. Comparison with institutional ownership of the matched IPO firm in the period corresponding to the IPO
(B1)RT N = 100
(B2) Matched IPO – Time since IPO
(B3) RT and SU N = 117
(B4) Matched IPO – Time since IPO
(B5) t-test for RT - IPO = 0 (Wilcoxon Z)
(B6) t-test for RT and SU - IPO = 0 (Wilcoxon Z)
Inst Own (T) 11.162 (5.620)
17.869 (16.070)
11.811 (5.416)
17.832 (15.630)
-2.986*** (-5.467)***
-2.562** (-3.241)***
Inst Own (T + 1) 10.210 (6.670)
20.745 (16.860)
10.854 (5.040)
20.474 (16.820)
-5.165*** (-4.970)***
-4.526*** (-5.012)***
t-test for (T+1 – T) = 0 (Wilcoxon Z)
-0.706 (-0.750)
4.338*** (4.629)***
-0.801 (-0.904)
4.464*** (5.310)***
-3.133*** (-3.527)***
-3.423*** (-3.843)***
42
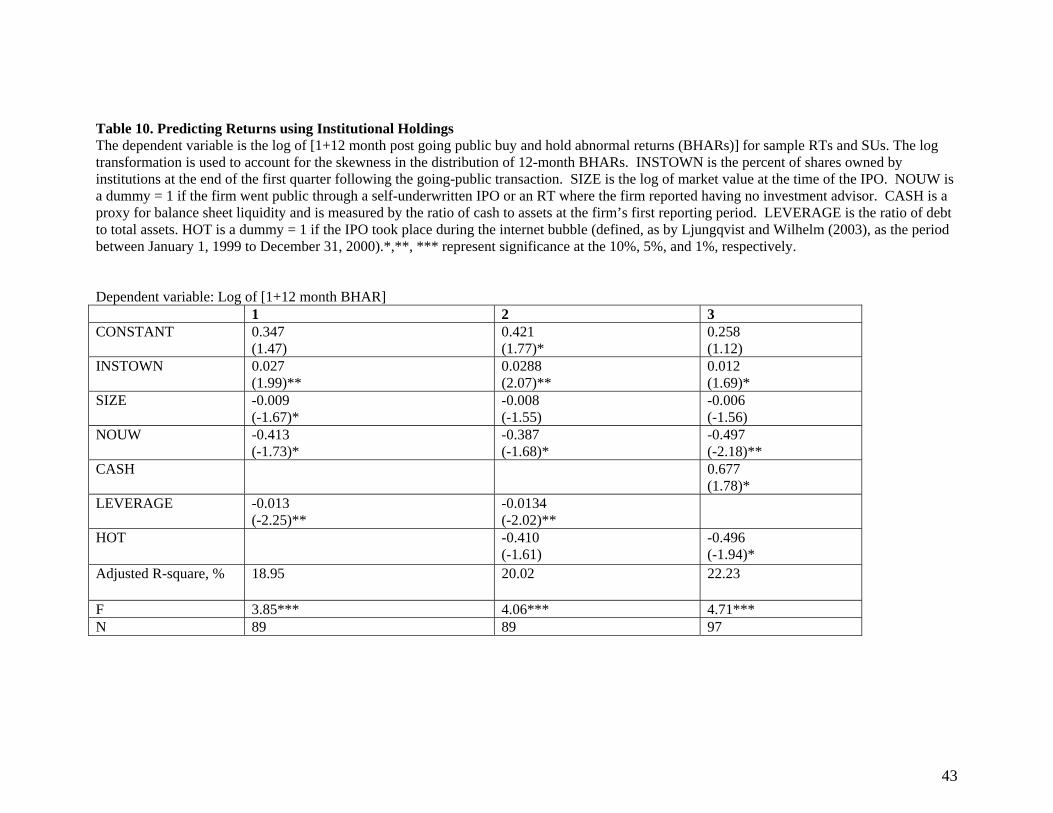
Table 10. Predicting Returns using Institutional Holdings The dependent variable is the log of [1+12 month post going public buy and hold abnormal returns (BHARs)] for sample RTs and SUs. The log transformation is used to account for the skewness in the distribution of 12-month BHARs. INSTOWN is the percent of shares owned by institutions at the end of the first quarter following the going-public transaction. SIZE is the log of market value at the time of the IPO. NOUW is a dummy = 1 if the firm went public through a self-underwritten IPO or an RT where the firm reported having no investment advisor. CASH is a proxy for balance sheet liquidity and is measured by the ratio of cash to assets at the firm’s first reporting period. LEVERAGE is the ratio of debt to total assets. HOT is a dummy = 1 if the IPO took place during the internet bubble (defined, as by Ljungqvist and Wilhelm (2003), as the period between January 1, 1999 to December 31, 2000).*,**, *** represent significance at the 10%, 5%, and 1%, respectively. Dependent variable: Log of [1+12 month BHAR] 1 2 3CONSTANT 0.347
(1.47) 0.421 (1.77)*
0.258 (1.12)
INSTOWN 0.027(1.99)**
0.0288 (2.07)**
0.012 (1.69)*
SIZE -0.009(-1.67)*
-0.008 (-1.55)
-0.006 (-1.56)
NOUW -0.413(-1.73)*
-0.387 (-1.68)*
-0.497 (-2.18)**
CASH 0.677(1.78)*
LEVERAGE -0.013(-2.25)**
-0.0134 (-2.02)**
HOT -0.410(-1.61)
-0.496 (-1.94)*
Adjusted R-square, % 18.95 20.02 22.23
F 3.85*** 4.06*** 4.71***N 89 89 97
43