Embed Size (px)
Citation preview

Alternative Report and Recommendations
in the Governor’s 2012 Commission
on Public Safety
Submitted by Clackamas County District Attorney John S. Foote,
Commission Member
December 2012
2 | P a g e
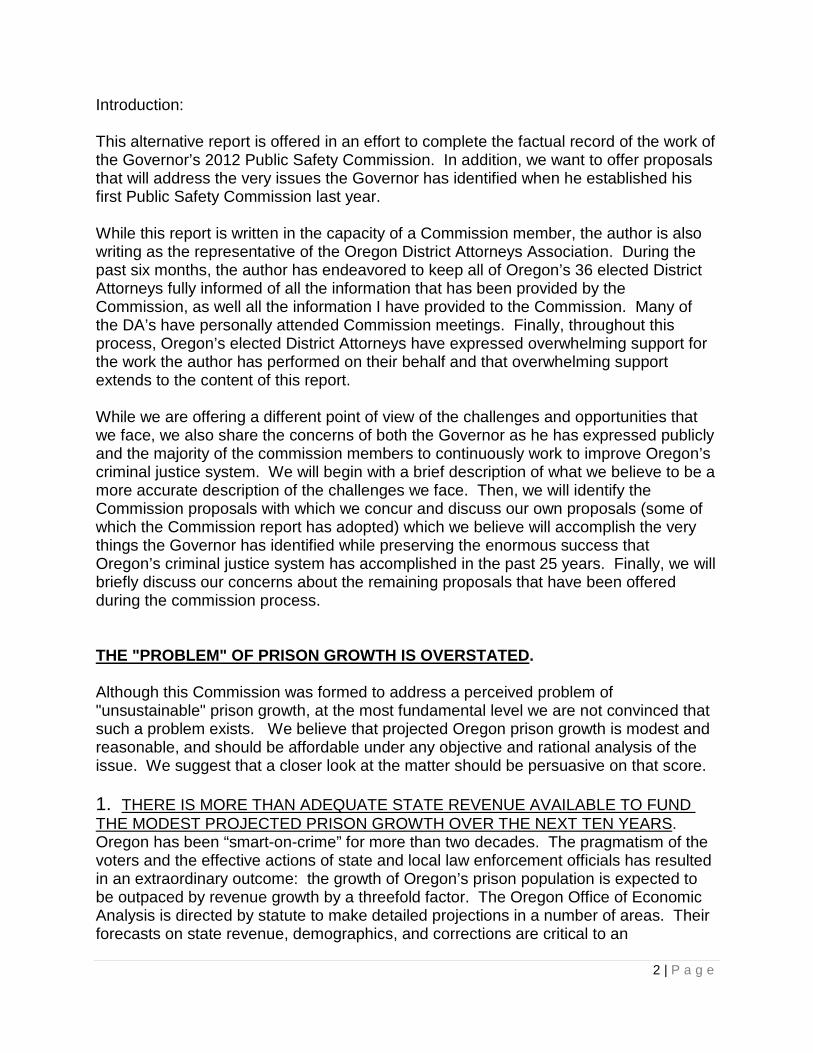
Introduction: This alternative report is offered in an effort to complete the factual record of the work of the Governor’s 2012 Public Safety Commission. In addition, we want to offer proposals that will address the very issues the Governor has identified when he established his first Public Safety Commission last year. While this report is written in the capacity of a Commission member, the author is also writing as the representative of the Oregon District Attorneys Association. During the past six months, the author has endeavored to keep all of Oregon’s 36 elected District Attorneys fully informed of all the information that has been provided by the Commission, as well all the information I have provided to the Commission. Many of the DA’s have personally attended Commission meetings. Finally, throughout this process, Oregon’s elected District Attorneys have expressed overwhelming support for the work the author has performed on their behalf and that overwhelming support extends to the content of this report. While we are offering a different point of view of the challenges and opportunities that we face, we also share the concerns of both the Governor as he has expressed publicly and the majority of the commission members to continuously work to improve Oregon’s criminal justice system. We will begin with a brief description of what we believe to be a more accurate description of the challenges we face. Then, we will identify the Commission proposals with which we concur and discuss our own proposals (some of which the Commission report has adopted) which we believe will accomplish the very things the Governor has identified while preserving the enormous success that Oregon’s criminal justice system has accomplished in the past 25 years. Finally, we will briefly discuss our concerns about the remaining proposals that have been offered during the commission process. THE "PROBLEM" OF PRISON GROWTH IS OVERSTATED
.
Although this Commission was formed to address a perceived problem of "unsustainable" prison growth, at the most fundamental level we are not convinced that such a problem exists. We believe that projected Oregon prison growth is modest and reasonable, and should be affordable under any objective and rational analysis of the issue. We suggest that a closer look at the matter should be persuasive on that score. 1. THERE IS MORE THAN ADEQUATE STATE REVENUE AVAILABLE TO FUND THE MODEST PROJECTED PRISON GROWTH OVER THE NEXT TEN YEARS. Oregon has been “smart-on-crime” for more than two decades. The pragmatism of the voters and the effective actions of state and local law enforcement officials has resulted in an extraordinary outcome: the growth of Oregon’s prison population is expected to be outpaced by revenue growth by a threefold factor. The Oregon Office of Economic Analysis is directed by statute to make detailed projections in a number of areas. Their forecasts on state revenue, demographics, and corrections are critical to an
3 | P a g e
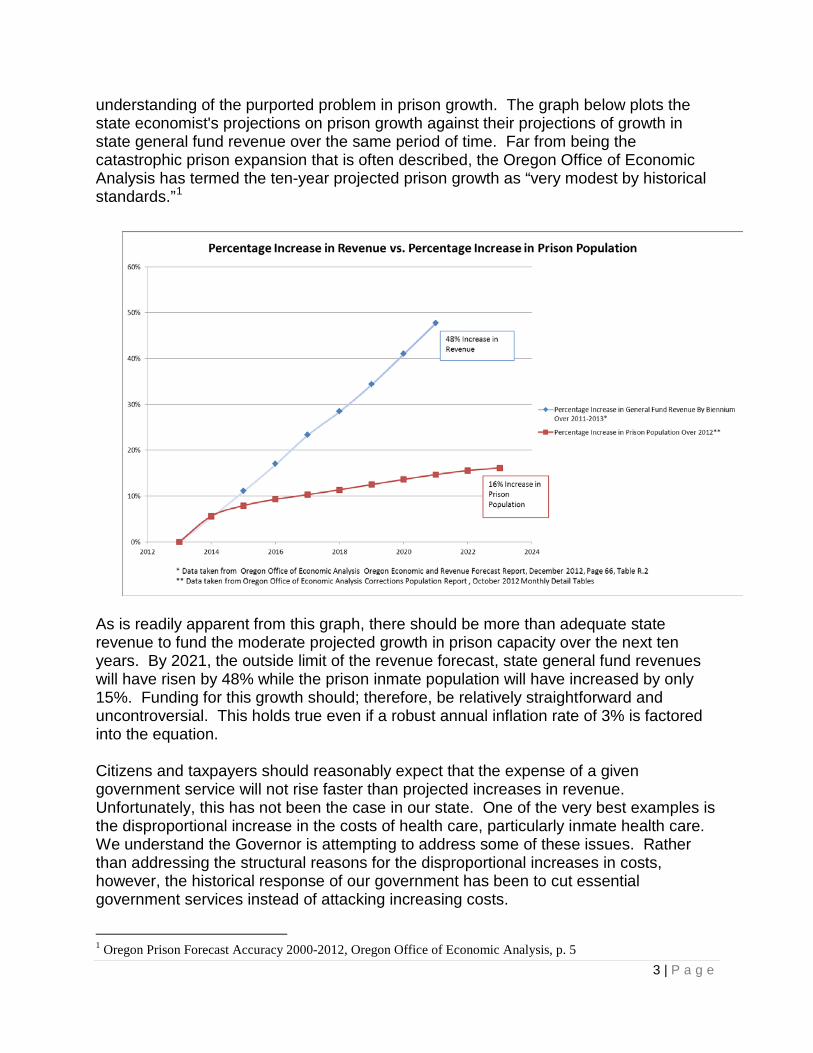
understanding of the purported problem in prison growth. The graph below plots the state economist's projections on prison growth against their projections of growth in state general fund revenue over the same period of time. Far from being the catastrophic prison expansion that is often described, the Oregon Office of Economic Analysis has termed the ten-year projected prison growth as “very modest by historical standards.”1
As is readily apparent from this graph, there should be more than adequate state revenue to fund the moderate projected growth in prison capacity over the next ten years. By 2021, the outside limit of the revenue forecast, state general fund revenues will have risen by 48% while the prison inmate population will have increased by only 15%. Funding for this growth should; therefore, be relatively straightforward and uncontroversial. This holds true even if a robust annual inflation rate of 3% is factored into the equation. Citizens and taxpayers should reasonably expect that the expense of a given government service will not rise faster than projected increases in revenue. Unfortunately, this has not been the case in our state. One of the very best examples is the disproportional increase in the costs of health care, particularly inmate health care. We understand the Governor is attempting to address some of these issues. Rather than addressing the structural reasons for the disproportional increases in costs, however, the historical response of our government has been to cut essential government services instead of attacking increasing costs.
1 Oregon Prison Forecast Accuracy 2000-2012, Oregon Office of Economic Analysis, p. 5
4 | P a g e
Oregon has low incarceration rate2
, but a high cost per day/per inmate. Yet, the Commission seems intent upon reducing Oregon’s modest incarceration rate as its first priority. Respectfully, we cannot agree. This is why our primary proposal, in this Commission and before the previous Commission on Public Safety, has been to attack the expanding daily costs of incarcerating inmates rather than simply by releasing those inmates into the community.
Adjusting sentencing policies downward to compensate for ballooning government spending by cutting prison beds will be a process that will be revisited each biennium unless an equilibrium is achieved that prevents our government spending from growing faster than revenue. 2. PROJECTED PRISON GROWTH IN OREGON IS LARGELY THE RESULT OF PROJECTED POPULATION GROWTH. The state Office of Economic Analysis produces a corrections population forecast twice each year. The latest forecast from October has made a point of breaking down the projected growth into components. While the office predicts a need for an additional 2300 prison beds in ten years it has determined that 62% of that growth will simply be the result of "baseline" growth, the increase in state population during that period.3
This finding is important, but we believe has been largely ignored. Repeated presentations to this Commission and to the first Commission have asserted that the primary "driver" of prison growth is sentencing policy, and specifically mandatory sentencing policy. That assertion is false. The primary "driver" of prison growth is the fact that our state's population will be larger in ten years than it is today, which will require more government services, including prison capacity. Only 38% of projected prison growth, or about 800 beds, is attributable to sentencing policies. Ballot Measure 11 mandatory sentences account for absolutely none of the growth, since the Measure 11 inmate populations have been stable for some time. It is important to distinguish the need for additional services due to population growth from the need for more services due to policy decisions because growth in services due to population growth is self-funding. A growing population will produce a growing tax base to support government services. (62% of projected prison growth will be funded by a revenue structure that has expanded with the population.)
2 Oregon has the 33d highest incarceration rate in the nation; as of 2010, Oregon ranked just 33rd among states in incarceration rate. Source: Bureau of Justice Statistics "Prisoners in 2010". See http://www.bjs.gov/content/pub/pdf/p10.pdf, Table 9, page 22. 3 See baseline tables attached to October 2012 Corrections Population Forecast, Oregon Office of Economic Analysis.
5 | P a g e
As a consequence, the effective (that is, truly unfunded beyond tax produced by population growth) growth in prison population over the next ten years will be only about 800 beds, or 5% of inmate population, over the next ten years.4
. It is this predicted growth of 800 beds that should legitimately be the subject of this policy debate. Although it seems apparent from the figures cited above that there should be adequate funding to address this small growth in inmate population, we understand the reason to prevent that increase, if it can be done safely. We support that effort and have presented to the Commission what we believe are cogent and well-thought-out proposals that would effectively halt most prison growth (and certainly will halt prison growth in excess of that which is produced by population growth).
Finally, presentations made to the Commission attempt to demonstrate that Oregon’s incarceration rate has increased faster than the national average in the past 12 years. Texas is often used as an example of a state which has reduced its incarceration rate in a manner that Oregon would do well to emulate. The first Commission on Public Safety even called experts from that state to testify about their progress. We believe this paints an irrationally distorted picture of the Oregon corrections and justice systems. A broader view allows some perspective. Between 2008 and today Texas reduced its incarceration sufficiently only to change its ranking from the highest incarceration rate in the nation to the fourth highest incarceration rate in the nation. During the same period, Oregon dropped from the 30th highest incarceration rate to the 33rd highest. The incarceration rate in Texas today remains almost twice as high as ours. In short, Oregon started with an extremely low incarceration rate and remains that way. It is deceptive to suggest that because other states started out with outrageously high incarceration rates and reduced those rates slightly, Oregon should follow suit. Actually we believe it should be the other way around. Other states should follow our lead and reduce their incarceration rates to the rates we have always had.
COMMISSION PROPOSALS
Of the 18 Commission proposals, there are 11 with which we concur, and of those 11, there are 6 that were actually suggested by Oregon’s District Attorneys. Below is a list of the commission proposals with which we concur, as well as a discussion of some of our own proposals.
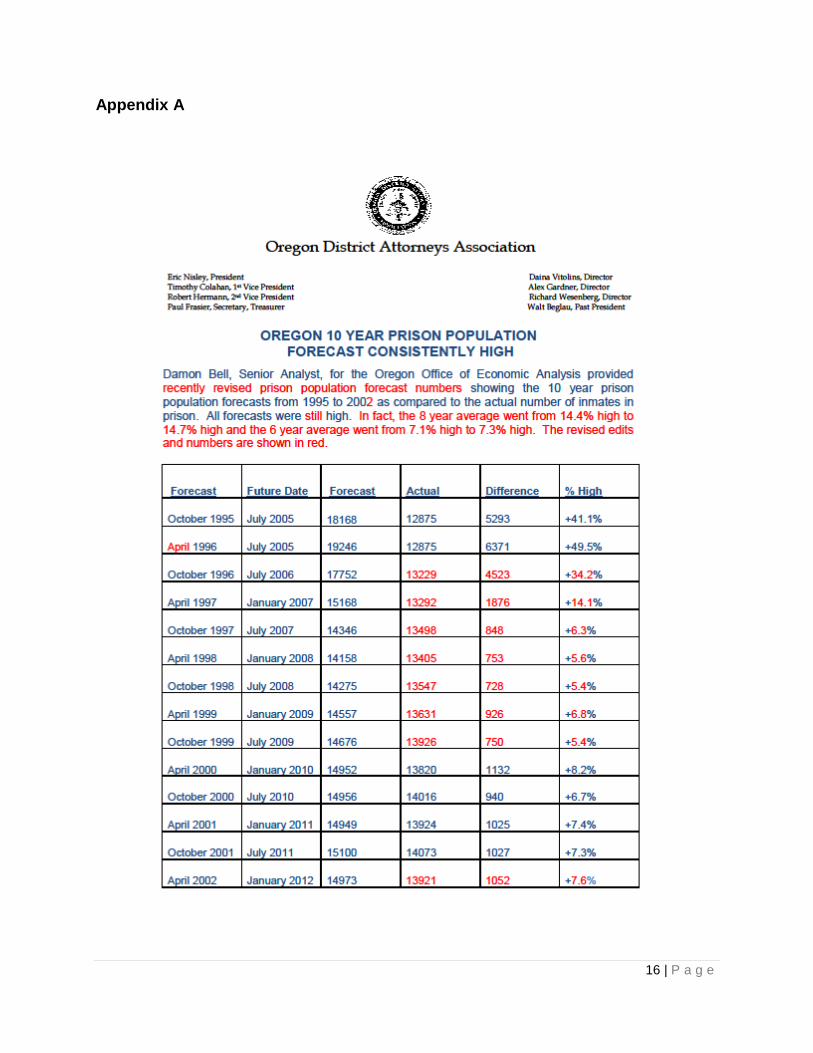
4 We have noted that corrections forecasting in Oregon has been extremely unreliable in only one direction. All 10-year forecasts since 1995 have proven to be high, some by as much as 47%. Therefore, based upon the history of 10 year forecasts, it appears highly likely that future 10 year forecasts will continue to be high. (Please see attached chart showing the record of all prior 10 year prison forecasts in Appendix A.) Nonetheless, we believe that the current staff of the Oregon Office of Economic Analysis has done an admirable job in addressing the policy purposes of the forecast and, while we believe that the current forecast may over-predict prison growth somewhat, it serves as a sound document for this policy discussion.
6 | P a g e
Proposals with which we concur:
1. Increasing threshold amounts of marijuana for presumptive prison sentences to federal court levels. It has been estimated this will save as many as 120 prison beds in the 10 year forecast.*
2. Eliminating presumptive prison sentences for felony driving while suspended. This has been estimated to save as many as 60 beds in the 10 year forecast.*
3. Community Corrections Earned Discharge. 4. Supervision Conditions 5. Definition of Recidivism.* 6. Specialty Court Standards. 7. Correctional Forecasts.* 8. Program Evaluations.* 9. Fiscal Impact Notes. 10. DOC Costs per day.* 11. Oversight Entity.
District Attorney Proposals*
DISTRICT ATTORNEY PROPOSALS EXPLAINED
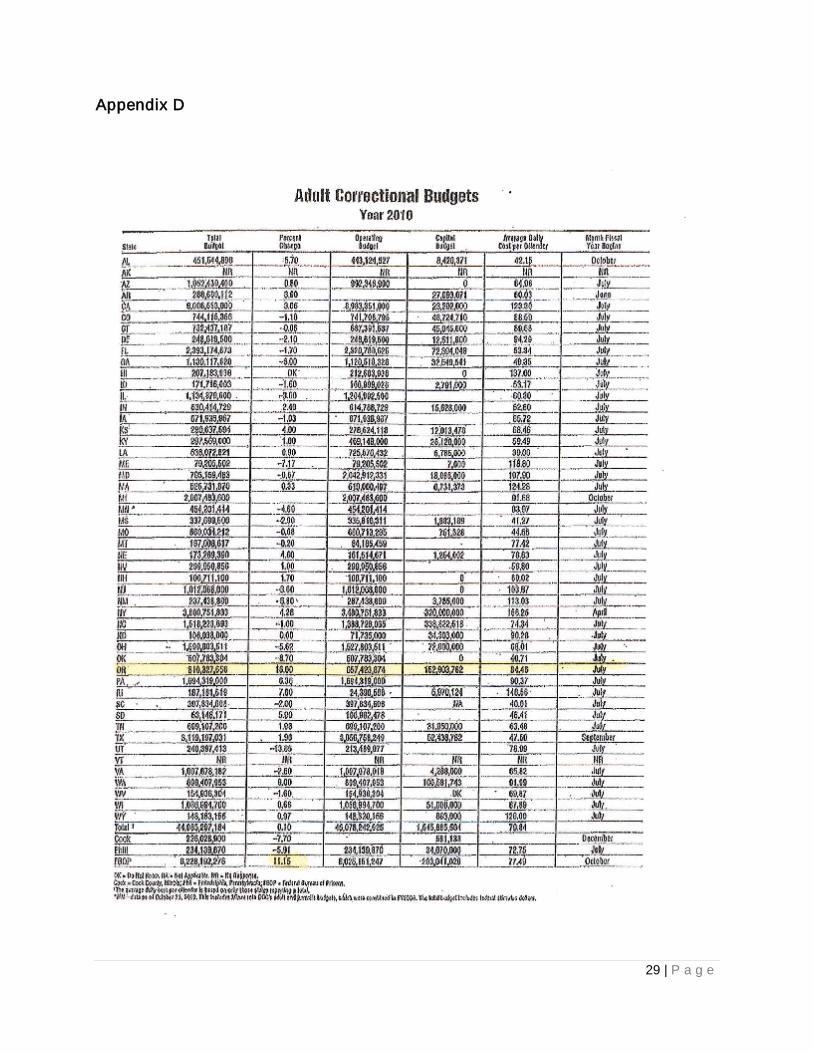
The following is a further explanation of some of the the proposals that we have advanced on this Commission. The utility of these proposals is that they will effectively freeze the cost of our prison system without changing sentencing policy, much of which has been enacted by the people themselves. 1. CONTROLLING PRISON COSTS PER DAY/PER INMATE. As discussed previously, if the goal of this Commission is to flatten the expense curve of our prison system, that goal can be reached in a number of ways without changing sentencing policy. The fundamental budget problem we face in this state today is unrelated to the growth of public services like prisons. The real culprit, as noted earlier, is poorly controlled state spending policies. These policies have allowed the cost of government services, such as the incarceration of criminal offenders, to expand much faster than the economy expands. Oregon daily inmate costs are well above the national average, despite the fact that the per capita GDP in this state is below the national average according to the American Corrections Association (ACA). Our state led the nation in increased daily inmate costs in the last biennium, at a time when many other states were actually reducing their costs (Appendix D). I have repeatedly made the point that the only decisive manner to address long-term prison spending is to control daily prison bed costs. On November 21 of last year I appeared at the first Commission on Public Safety meeting to make this point, and on
7 | P a g e
December 31, 2011, I co-authored a letter with Multnomah County District Attorney Mike Schrunk and Washington County District Attorney Bob Hermann to the Commission re-emphasizing that point. I have repeatedly made it a key recommendation to this Commission. Reducing the daily costs of incarcerating inmates just slightly, to something closer to national averages, will solve the funding of prison growth over the next ten years, and it will do so without releasing dangerous inmates into our communities. A direction by the legislature to the Department of Corrections to reduce inmate costs, accompanied by a disciplined budget, would accomplish this purpose. We recommend that the Oregon Department of Corrections be directed during the next biennium to reduce its costs per day/per inmate as currently measured by at least 5% and again in the following biennium by another 5%. We believe this could easily be the only recommendation of the Commission, and it would effectively accomplish our goals. 2. ESTABLISH AN EFFECTIVE RE-ENTRY PROGRAM FOR INMATES RELEASED
FROM PRISON AND HOPE PROBATION FOR DEFENDANTS ON SUPERVISION IN THE COMMUNITY
.
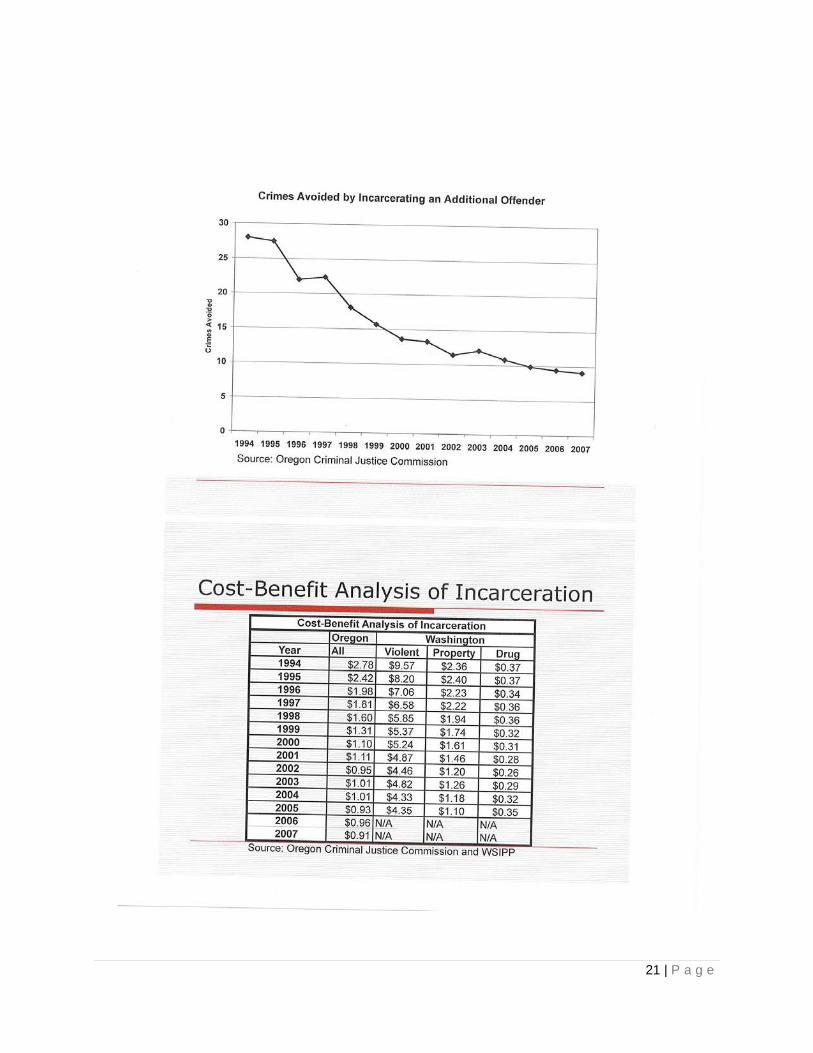
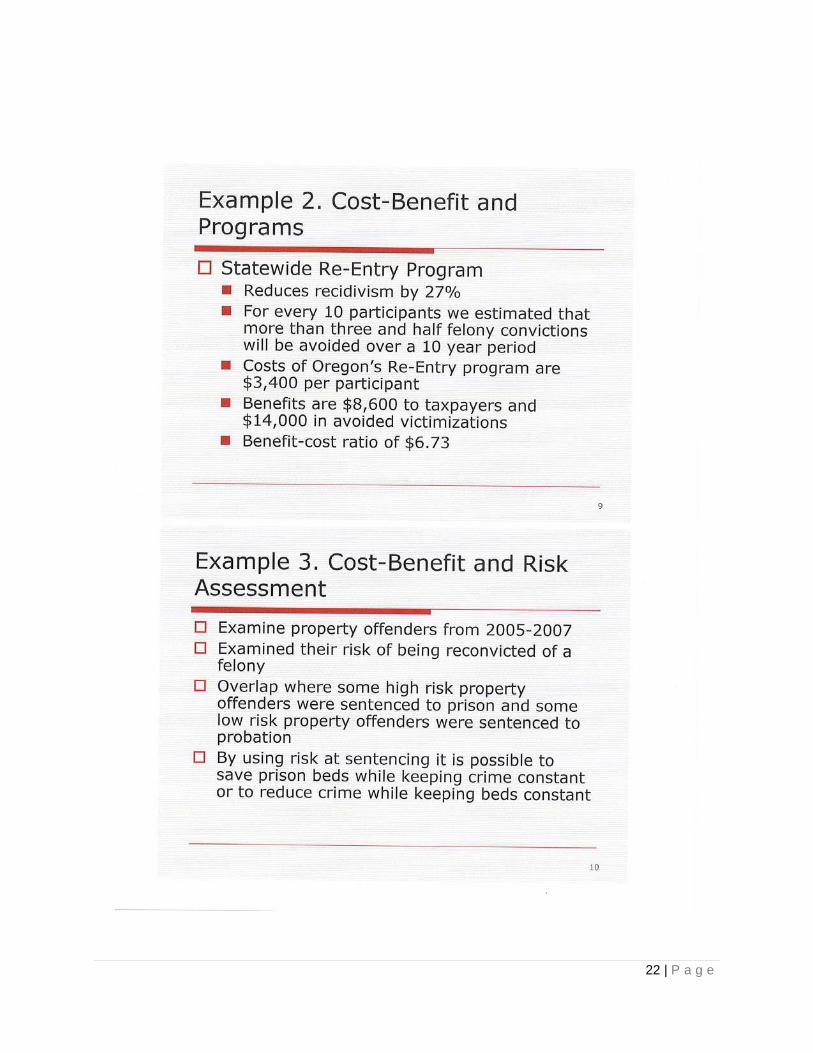
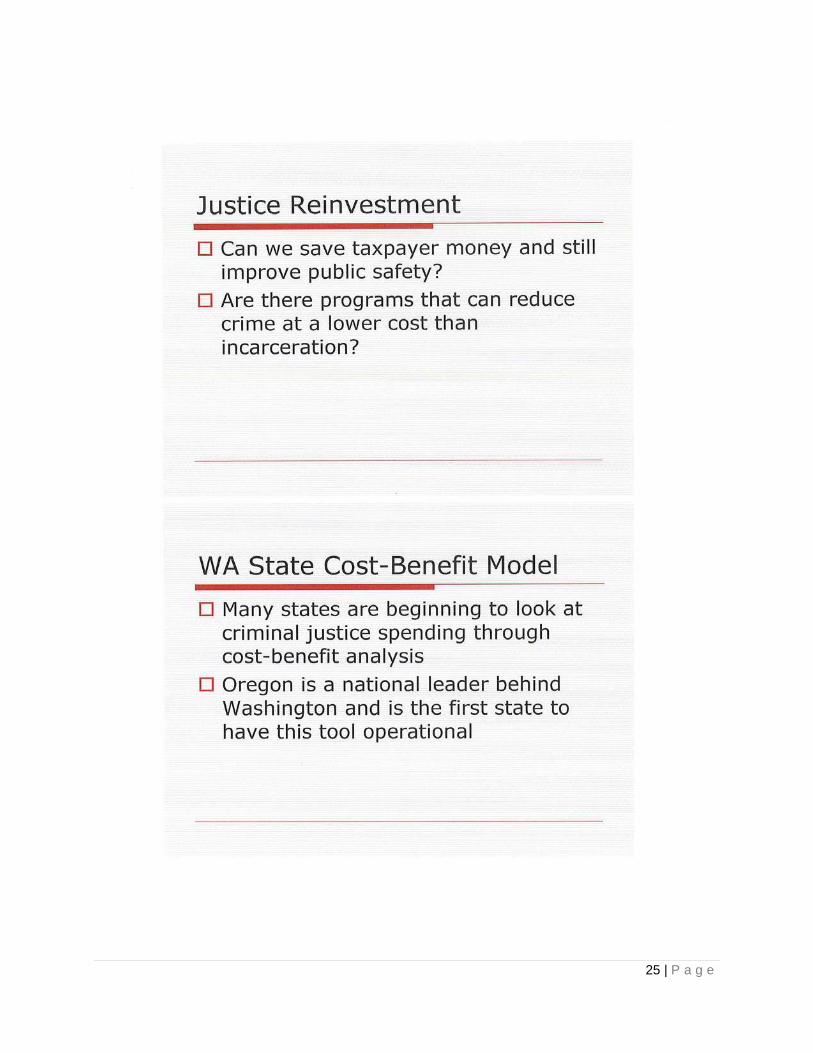
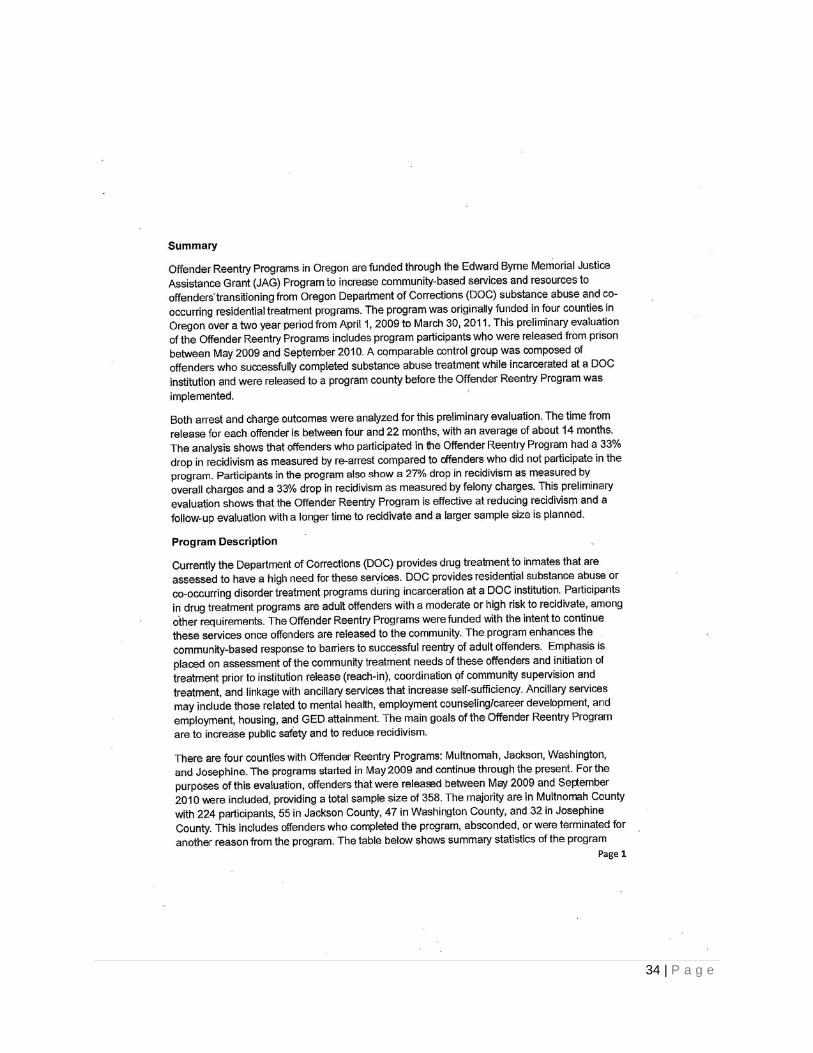
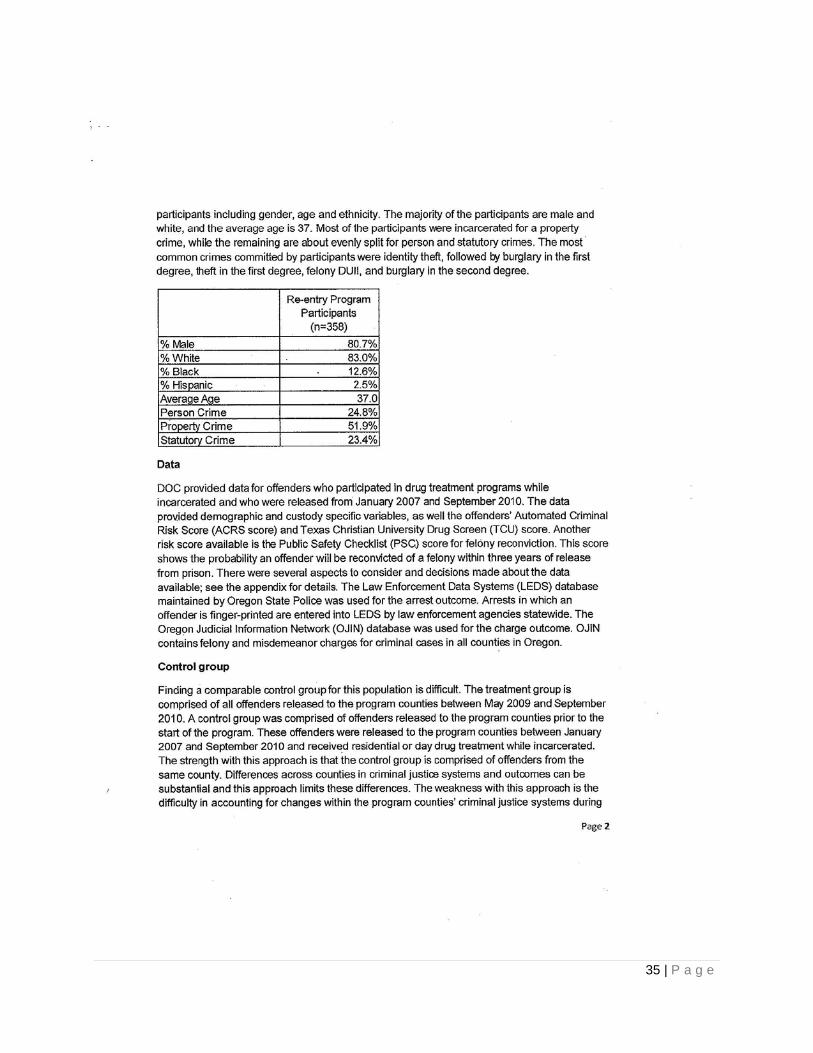
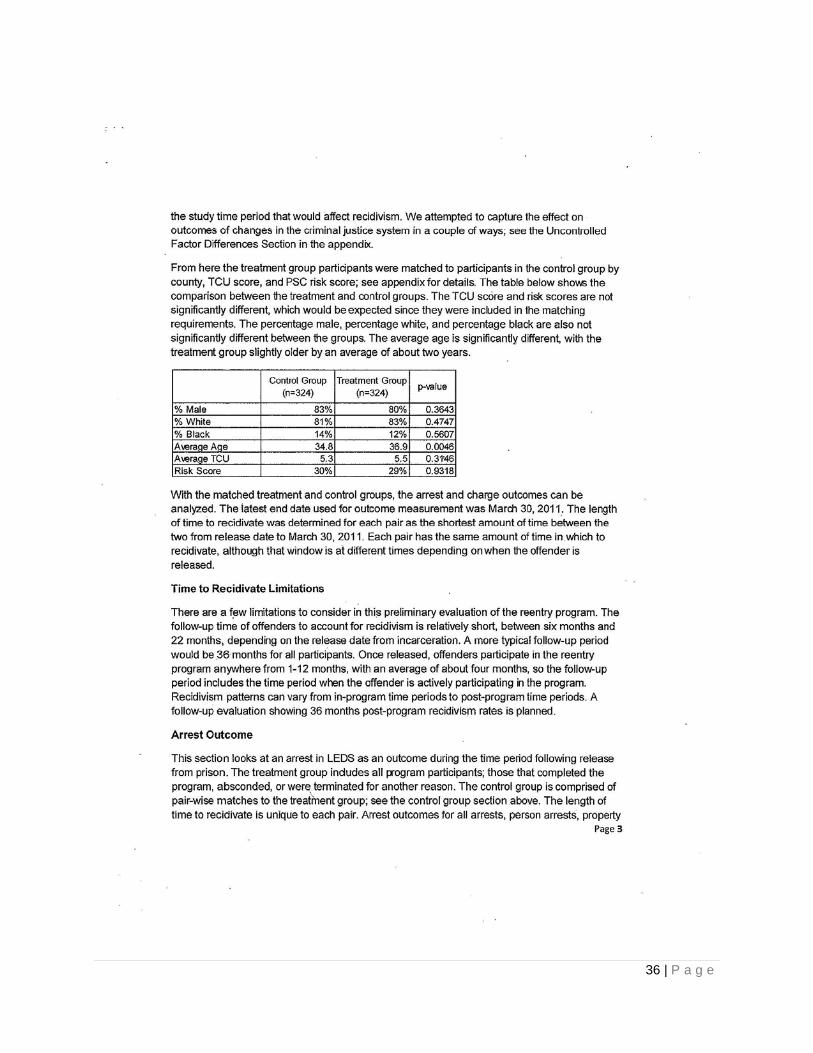
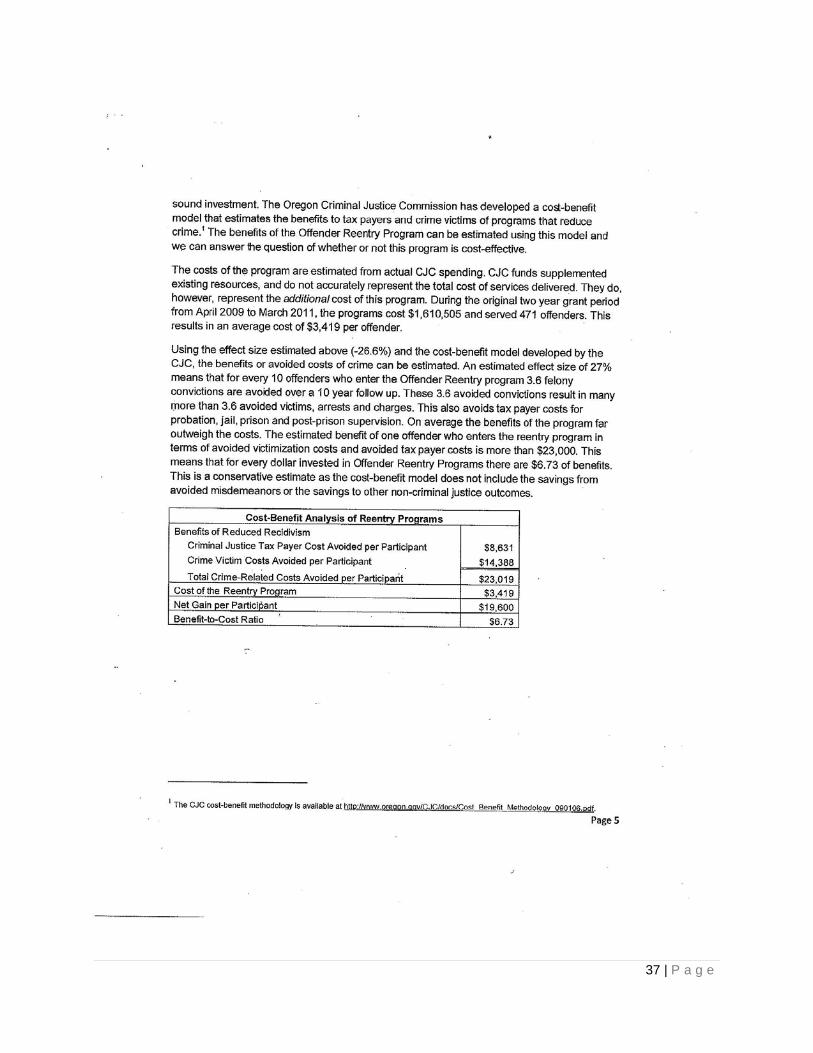
Over 4500 inmates are released from our prison system each year. 26% of those inmates will be convicted of a new felony within three years of their release from prison. The figure is even higher for those who are released from state local control sentences in county jails. Many, if not most, of those convictions will result in a return to prison, either immediately or upon a revocation of supervision. The arithmetic of this situation makes it clear that the growth in Oregon's prison inmate population can be halted by targeting the recidivism rate of just these 4500 inmates. Each month, the Department of Corrections releases approximately 380 inmates. According to the current prison forecast during the next three years if the number of defendants sent to prison is reduced by only 31 per month statewide the prison population will remain stable. And over the next 10 years the target for prison admissions drops to only 18 per month statewide. Effective inmate re-entry programs exist to achieve this goal. One of these programs was piloted in four Oregon counties in 2009 under grants from the Criminal Justice Commission. At a cost of only $3400 per inmate, felony recidivism was reduced by 33%. The calculated savings in tax dollars and victim costs was determined to be seven dollars saved for each dollar invested. Mike Wilson of the Criminal Justice Commission, in fact, testified about the effectiveness of this program before the first Commission on Public Safety5
. It is unfortunate that this program did not receive as much attention in the second Commission as it did in the first.
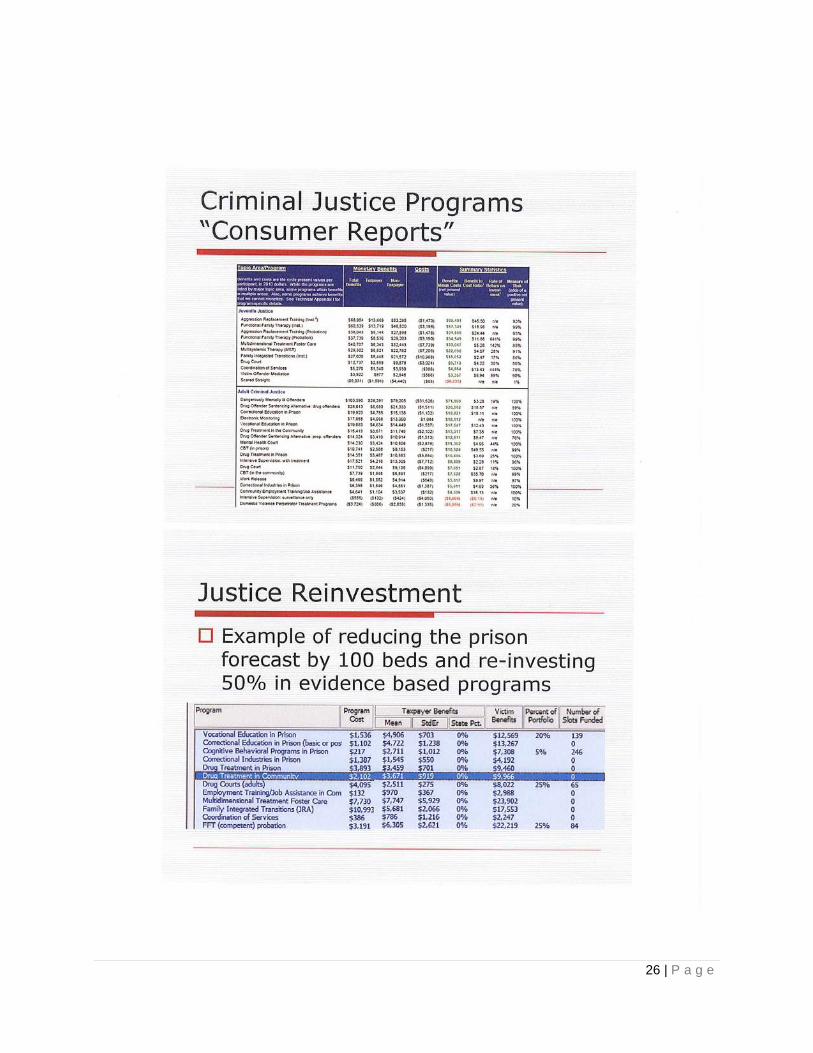
Applied to all 4500 inmates released from Oregon prisons each year, the same re-entry program would cost $15.3 million annually, but would save $60 million in prison expenses each year by halting prison growth, and possibly even reducing prison 5 See testimony of Michael Wilson before the Commission on Public Safety , October 21, 2011in Appendix B.
8 | P a g e
population. This would again be another policy that would achieve the purpose of this Commission without altering sentencing policy. In addition, HOPE probation has been rigorously evaluated in Hawaii using randomized controlled trials over a 2-year period. It has proven to be extremely effective in pushing criminals on supervision away from substance abuse. Their success rate is truly remarkable.6
Furthermore, HOPE program in Hawaii was created with virtually no additional funding and can be operated very cost effectively, particularly when compared to the general cost of probation and local control which HOPE probation replaces.
Finally, according to PEW, each year more than 2200 offenders are revoked off of supervision and sent to prison. This should be our target population for both of these kinds of programs. If these programs can produce the kinds of results that the “evidence” suggests, we should be immediately successful in dramatically reducing the number of revocations to prison each year, thereby relieving pressure on prison growth for the foreseeable future. This is a much better approach because it protects the public with existing voter approved sentencing. 3. ALTER PRISON ELIGIBILITY FOR TWO OFFENSES
.
Upon viewing the list of "low-risk" inmates it appeared that, while virtually all of those on the list merited prison sentences, there were two categories of offenders, many of whom we believe could be better managed outside of prisons--those convicted of marijuana delivery offenses and those convicted of felony driving while suspended. Changing the sentencing guideline grid-block on felony driving while suspended and aligning marijuana delivery amounts to conform with federal amounts would save a number of prison beds, initially estimated at approximately 180 by PEW, although we believe that the number might be somewhat larger. 4. ALTER THE DEFINITION OF RECIDIVISM
.
Oregon currently has one of the weakest definitions of recidivism in the nation. We suggest this be changed so we can more readily compare our performance to that in other states. I believe there is a consensus among the Commission on this point, so I will refrain from elaborating further. 5. RAISE THE STANDARD BY WHICH WE EVALUATE PROGRAMS
.
Oregon has led the country in our efforts to enact “evidence based” programs. That is good public policy and has helped Oregon lower its recidivism rate. However, too many of Oregon’s programs for offenders are inadequately evaluated. Oregon must raise the bar when it comes to the “evidence” that shows a program works. In these tight economic times, we should only fund programs that have been rigorously and 6 See, Evaluation of the Hawaii Opportunity Probation with Enforcement (HOPE) Community Supervision Strategy, 2007-2009 (ICPSR 27921)
9 | P a g e
independently tested. We should insist upon more use of “randomly controlled trials” as the gold standard for evaluations. These will result in fewer kinds of programs, but the programs that we do fund will gain the confidence and trust of the entire public safety community. And we will continue to build on Oregon’s more recent success in reducing recidivism and victimization. In addition, this effort should include a complete and ongoing inventory of every program in the state by type, number and location and be accompanied by the “evidence” that supports each program’s effectiveness. And the standard for whether or not a program is effective should be, “does it change behavior that would not change otherwise.” Just because graduates of a program are successful in and of itself does not prove the program is the cause of the success. It might be that the program is filled with participants who would succeed without the program. Only independent and highly rigorous testing will provide the “evidence” that the program is changing criminal behavior that would not change otherwise. Fundamental disagreement with the some proposals advanced by this Commission
.
Having presented our proposals, in many instances in agreement with the proposals of the remainder of the Commission, we additionally feel it is incumbent upon us to explain why we oppose certain of the major changes sought by the majority of this Commission. This is not to say we oppose the entire package. We feel the need to clarify our position on these matters.
BALLOT MEASURE 11
We oppose changes in Ballot Measure 11, and particularly any changes that are designed simply to save money. As a ballot initiative, Measure 11 constitutes as close a representation of the will and intent of the people as can be achieved in a democracy. It should be trifled with only upon a clear showing that it constitutes errant policy, and never for the sake of finances. Easily over 95% of our state's laws were never specifically approved by voters, and if changes to laws are necessary to readjust finances it should be from among those laws that these changes come. Failing to do so constitutes a fundamental lack of respect for the clearly expressed will of the people, as expressed on the rare occasions they find it necessary to do so directly. Additionally, and just as importantly, Measure 11 has proven to be one of the most successful policy initiatives in the recent history of our state. Violent crime was literally cut in half in this state after this measure was passed, the second largest reduction in violent crime in the nation. Oregon now has one of the lowest violent crime rates in the nation. The national violent crime rate is 56% greater than Oregon's, and only three states with major metropolitan areas, Wisconsin, Minnesota, and Kentucky, have lower violent crime rates. It turns out in fact that the people can on occasion make better decisions than the experts. Nor does Measure 11 reflect draconian sentencing policy, as some contend; its sentences remain well below average for sentences for the same crimes across the
10 | P a g e
nation. Even the same experts who were once in opposition to such laws now grudgingly accept the uncontroverted evidence that sentencing policies such as Measure 11 have been a key ingredient in the dramatic decline in crime in this nation. Ballot Measure 11 has in fact been the lead player in a progressive Oregon justice system that is second to none in this country. In this state we have the lowest percentage of non-violent prison inmates in the nation. Prison is reserved only for violent felons and serious repeat offenders. The rest are given multiple opportunities to reform. Oregon was the first state to demand by law the use of evidence-based supervision practices. Only a quarter of convicted felons in this state are sentenced to prison, as opposed to a national average of 40%. And we have achieved our dramatic improvement in violent crime with a very low incarceration rate, the 33rd highest incarceration rate in the nation. Throughout the country our criminal justice system is presented as a model for others, and Measure 11 has been the key reason for our success. We believe that Ballot Measure 11, along with other voter-approved justice policies like truth in sentencing statutes and victims’ rights measures, have restored accountability for offenders and integrity to a justice system that was, charitably, dysfunctional in the 1980s. These measures were overwhelmingly supported by the electorate, and in the case of Ballot Measure 11, twice. We cannot believe the public feels differently now. BALLOT MEASURE 57
.
For the same reasons as those expressed above for Ballot Measure 11, we also oppose changes to Ballot Measure 57, an initiative that was passed by 61% of voters in 2008. There seems to be a common misperception that Measure 57 contains mandatory prison sentences. In fact, Measure 57 was proposed and supported by Oregon’s District Attorneys as an alternative to Measure 61 because 61 had mandatory prison sentences and 57 does not. Oregon’s District Attorneys designed most of Measure 57, in collaboration with the legislature and governor, without mandatory minimum sentences and as an extension of the existing Repeat Property Offender statutes the legislature passed in 1995. It was written with the specific intent of preserving judicial discretion as contained in sentencing guidelines and the RPO statutes Measure 57 represents a thoughtful and targeted approach to career property criminals who do so much damage in Oregon’s communities. In stark contrast to our violent crime rate, Oregon's property crime rate is higher than the national average, and the public certainly has noticed. Even more troubling is the fact that, led by Oregon metropolitan areas, Oregon's property crime rate is actually increasing at a time when national rates are declining. Between 2010 and 2012 FBI statistics show that national property crime rates dropped 1.3% while Oregon's rate increased 2.5%. And unfortunately these FBI crime statistics do not record the type of property crime that is most prevalent today, cyber crime and credit card fraud, which
11 | P a g e
has increased dramatically over the last decade. The real increase in property crime, therefore, is significantly understated by that 2.5% figure.7
Oregon imprisons the lowest percentage of non-violent offenders in the nation, and it is reasonable to believe that this is a key reason we have had far less success in controlling property crime in this state than we have had in controlling violent crime. The public was well warranted in approving a measure that has moderately increased penalties for repeat offenders. We see no policy reasons to change Ballot Measure 57, and as in the case of Ballot Measure 11, do not believe that tampering with a voter initiative is appropriate for financial reasons. EXTENSIONS OF EARNED TIME, WORK TIME, AND TRANSITIONAL LEAVE
.
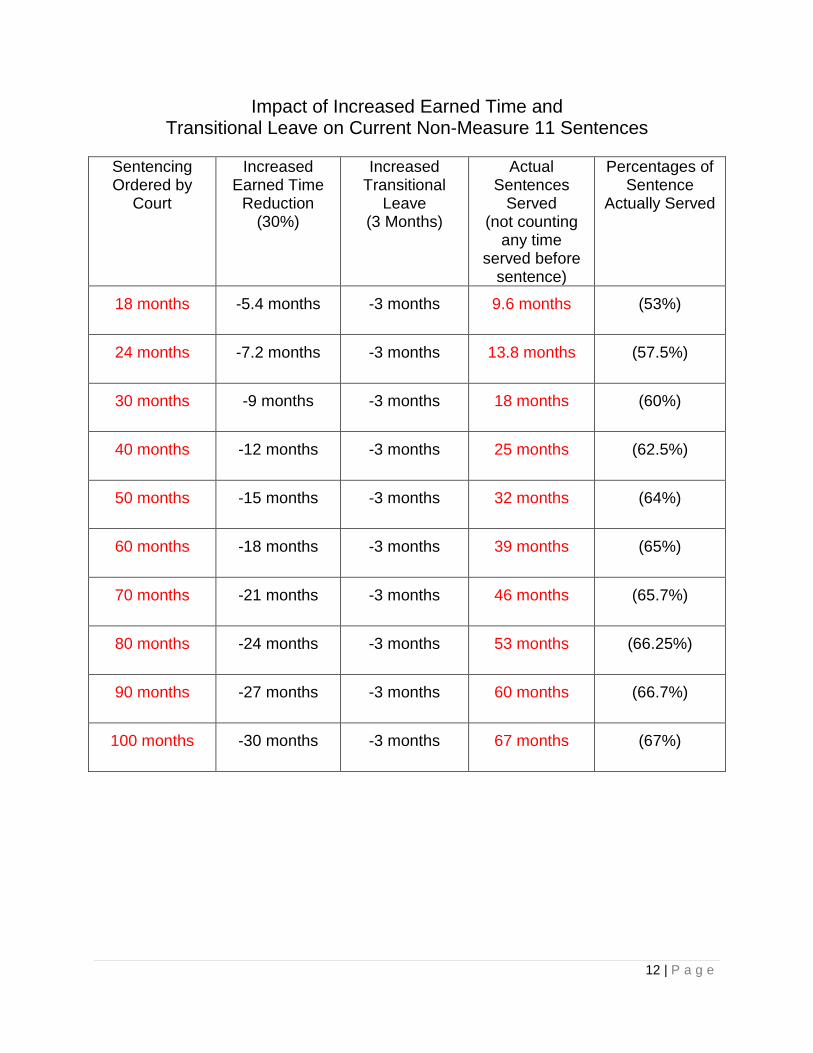
One of the principal accomplishments of sentencing policy over the last 25 years has been the movement to establish truth in sentencing. Prior to the advent of sentencing guidelines there was little correlation in our state practice between sentences pronounced in court by judges and the time actually served by inmates. Parole and terminal leave became simply an inmate population control device, and inmates who had been sentenced to twenty years or more were often released by parole boards in two or three years, many to return to the community to commit significant crimes upon their early release. Victims were seldom notified. Corrections officials and parole boards, far removed from the original sentencing decision in the courtroom with all parties present and distant from the devastating impacts that crime has on victims and the community, became the real judges of criminal conduct and punishment. Their decisions were motivated by the necessity to manage the inmate population of a chronically underfunded prison system. This practice was one of the major factors that led to the alarming erosion of public trust in our justice system. Voter initiatives are the inevitable result of such policies. The recommendations by this Commission, we believe, signal a return to that prior state of affairs. The chart below demonstrates the result of these proposed policies, placing sentence reductions of up to 50% in the hands of corrections officials. By law and regulation, these decisions on earned time, work time, and transitional leave are sheltered from input from the state or victims. In short, in many cases, the key arbiter of prison sentences will become the Department of Corrections which is properly and almost exclusively focused on offenders and is not in the best position to determine a just and proportional sentence in each case. As in the 1980’s the key consideration once again will be controlling the number of prison beds and will once again result in the erosion of public trust and confidence in our entire system.
7 The FBI index crime statistics include only burglary, larceny, and auto theft in their statistical analyses. Excluded from the FBI definitions of property crime are credit card fraud, cyber crime, and fraud in general, all of which are increasing dramatically according to BJS studies. Ironically, for instance, possibly the largest property crime in history, the $50 billion Ponzi scheme fraud of Bernard Madoff, does not appear as a crime in FBI index crime statistics.
12 | P a g e
Impact of Increased Earned Time and Transitional Leave on Current Non-Measure 11 Sentences
Sentencing Ordered by
Court
Increased Earned Time
Reduction (30%)
Increased Transitional
Leave (3 Months)
Actual Sentences
Served (not counting
any time served before
sentence)
Percentages of Sentence
Actually Served
18 months -5.4 months -3 months 9.6 months (53%)
24 months -7.2 months -3 months 13.8 months (57.5%)
30 months -9 months -3 months 18 months (60%)
40 months -12 months -3 months 25 months (62.5%)
50 months -15 months -3 months 32 months (64%)
60 months -18 months -3 months 39 months (65%)
70 months -21 months -3 months 46 months (65.7%)
80 months -24 months -3 months 53 months (66.25%)
90 months -27 months -3 months 60 months (66.7%)
100 months -30 months -3 months 67 months (67%)
13 | P a g e
PERFORMANCE ENHANCED FUNDING
.
We are compelled to oppose the Commission proposal for Performance Incentive Funding (founded on incentives to not send serious criminals to prison when they would otherwise be subject to prison sentences under sentencing guidelines). When sentences are determined in open court, the primary focus is proportionality and justice for victims, defendants and the community. Although Oregon only incarcerates a small percentage of convicted criminals, there are times when a defendant’s criminal conviction and criminal history require a prison sentence in order to achieve justice. This must remain the primary focus at every criminal sentence. It would be truly paradoxical for the state to enact, as it has done, a system of sentencing guidelines designed to promote uniformity in sentencing across the state, and then offer financial incentives for various counties to ignore that system. Furthermore, our entire criminal justice system and particularly every local courthouse and local public safety office must be fiscally responsible with resources. While individual cases are focused on justice, the backdrop for these cases is what results are affordable within the system. The sentencing guidelines were established in 1989 to require uniformity and to ensure affordability by establishing sentences that matched the available prison and supervision resources. To achieve this, there is constant communication between all local public safety and criminal justice partners to balance what we want to accomplish with the resources that are available. There is no need to provide some outside incentive to make fiscal responsibility a priority at the local level. It will only drive a wedge between the pursuit of justice and outside incentives to achieve state funding.
FINAL OBSERVATIONS OF PEW’S SELECTIVE USE OF DATA
When PEW claims that Oregon's prison incarceration rate "hovers below the national average" they fail to add that the national average, at 497 per 100,000 population, is actually "hovering" 37% higher than Oregon's, at 361 per 100,000. When PEW asserts that "admissions have grown to include increasing percentages of non-violent offenders," they make a subtle, and deceptive distinction. It may be true that the number of admissions for non-violent offenders, including short terms for supervision revocations, have increased, but the actual percentage of inmates taking up a bed in Oregon prisons today for non-violent offenses has actually decreased in the last seven years, from 31.6% of total inmate population to 30.9%, according to Department of Corrections statistics. The truth is that Oregon is actually imprisoning a lesser percentage of non-violent offenders than seven years ago. So when the PEW group chose to highlight the admissions, and ignored DOC inmate profile statistics that were more relevant, skepticism is warranted. Additionally, while it was emphasized that property offenders are serving longer sentences than a decade ago, the average increase in these prison sentences is only
14 | P a g e
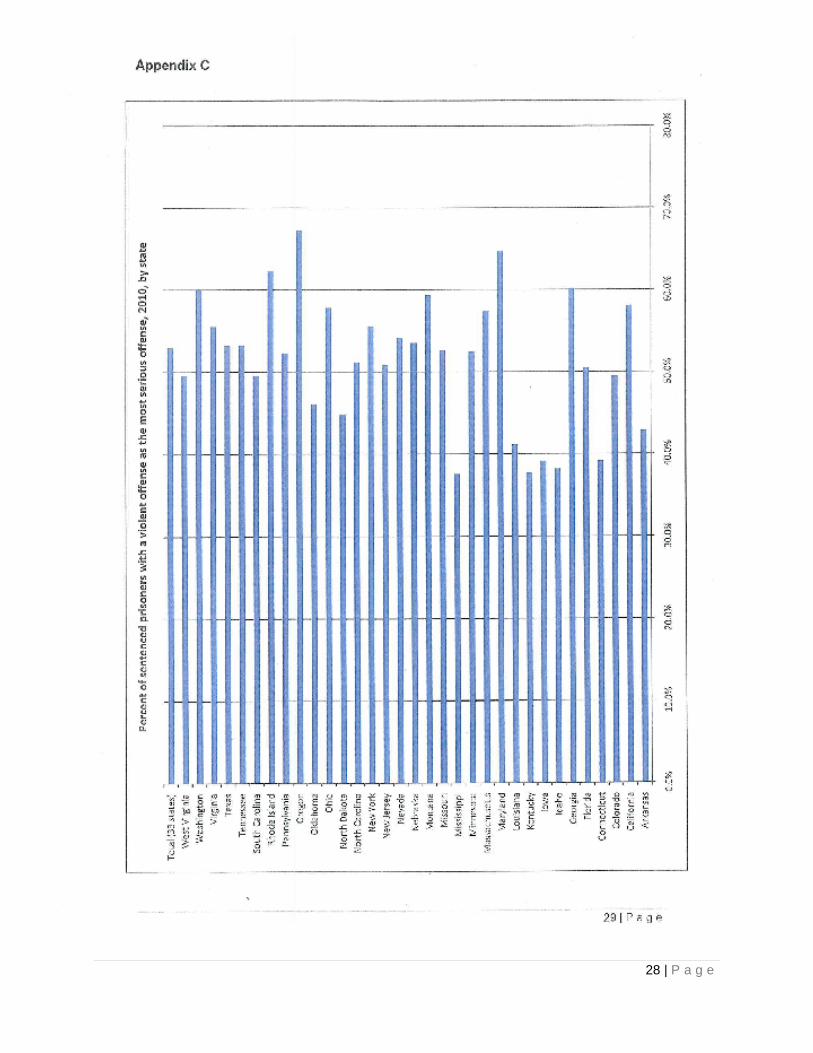
one month, which was not emphasized. And never mentioned was the fact that these types of moderate increases in sentences were actually recommended by our legislature and approved by the voters in 2008 in a legislative referendum. When Pew claims that "nearly half of the projected prison growth in the next decade will be a result of M57," the actual figure is 35% (824 beds out of 2300), according to the latest prison forecast. The continued assertion that sentencing policy is the main driver of prison growth is wrong; it is simply state population growth that will "drive" the majority of our state's moderate prison growth. When it was asserted that 26% of Oregon prison admissions were "low-risk" offenders, no attempt was made to clarify who those supposed "low-risk" offenders were, and that their status as low risk offenders was determined by a software tool that failed to include out-of-state and juvenile convictions, and which included many convicted murderers on the list. CONCLUSION: Oregon’s criminal justice system has been enormously successful over the past 25 years. Crime is at 40 year lows. We have prioritized our prisons for violent criminals.8
As a consequence, violent crime in Oregon has dropped more than 50% in the 17 years since Measure 11 was passed by the voters. We have used less expensive community resources to deal with most property and drug offenders. In fact, we are a “low incarceration” state, ranking in the bottom third of the 50 states. Only 25% of convicted felons in Oregon actually go to prison. And we have led the nation in the use of “evidence based” programs to change criminal behavior.
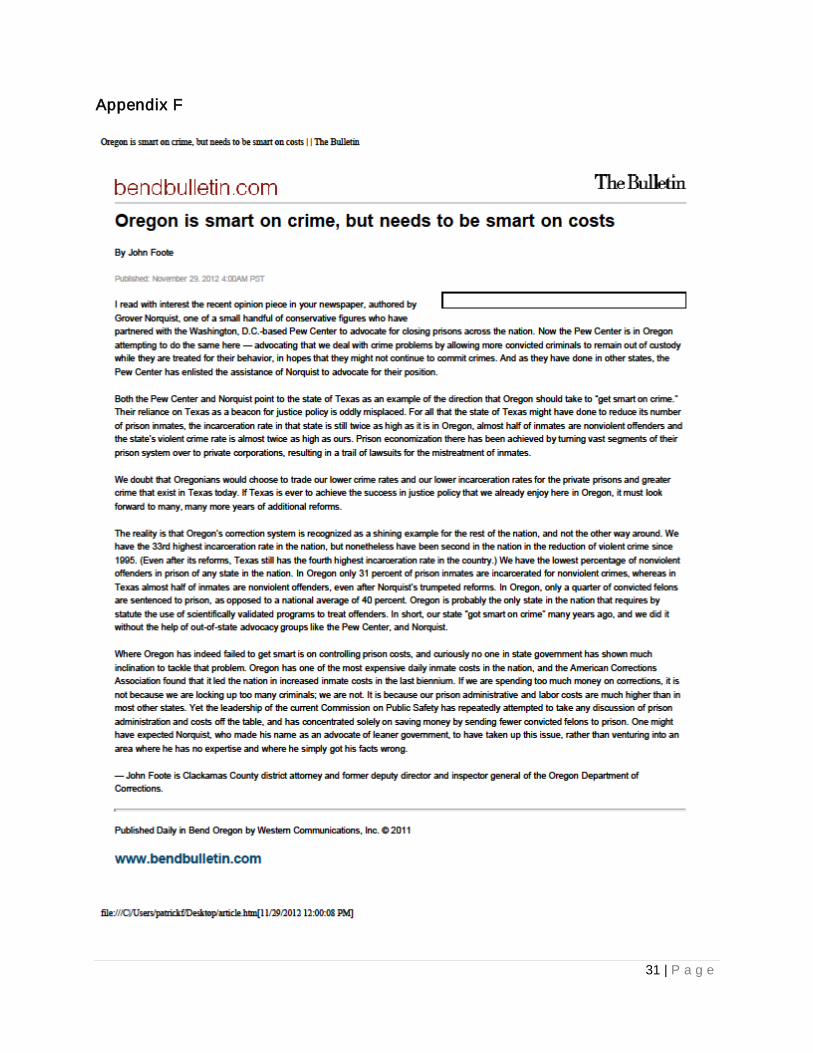
It is worth noting that the report, perhaps at the behest of PEW which has operated in many of these states, seems to try and make the argument that other states have done things Oregon has not. The argument seems to be that we can learn from these other states like, perhaps, Texas. However, what PEW fails to mention is that each of those states has taken a different path than Oregon which has been a leader in progressive sentencing policy. For instance, New York previously provided for draconian sentencing laws for possession and distribution of controlled substances, something Oregon abandoned decades ago. Texas seems also to be a state that PEW likes to use as a comparison. Again, they fail to put Texas’ performance in perspective. Recently the noted conservative Grover Norquist sent an editorial to the Bend Bulletin newspaper in which he made many of these same arguments. He used Texas as a great example of what Oregon should be doing. In response, this author also provided an editorial in response. Please see attached Appendix F which is a copy of that editorial. We believe it fairly puts the performance of Texas in recent years in perspective. Simply put, Texas has a lot to learn from Oregon, not the other way around. 8 See Appendix C.
15 | P a g e
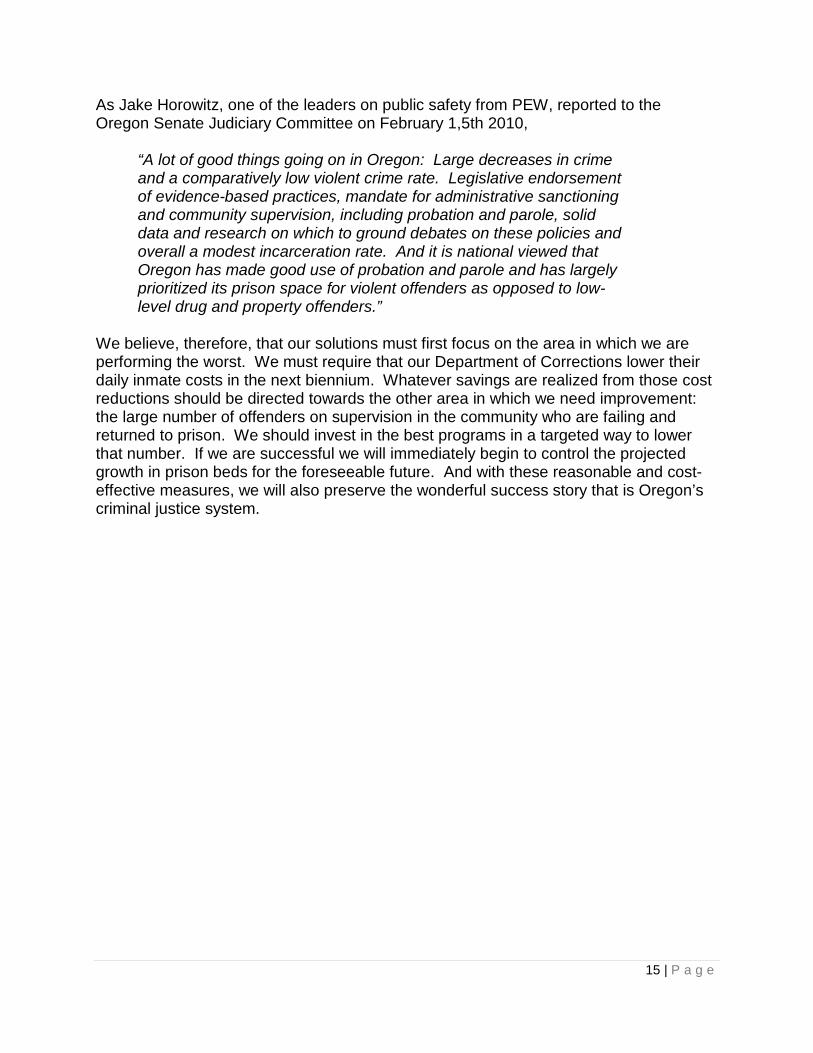
As Jake Horowitz, one of the leaders on public safety from PEW, reported to the Oregon Senate Judiciary Committee on February 1,5th 2010,
“A lot of good things going on in Oregon: Large decreases in crime and a comparatively low violent crime rate. Legislative endorsement of evidence-based practices, mandate for administrative sanctioning and community supervision, including probation and parole, solid data and research on which to ground debates on these policies and overall a modest incarceration rate. And it is national viewed that Oregon has made good use of probation and parole and has largely prioritized its prison space for violent offenders as opposed to low-level drug and property offenders.”
We believe, therefore, that our solutions must first focus on the area in which we are performing the worst. We must require that our Department of Corrections lower their daily inmate costs in the next biennium. Whatever savings are realized from those cost reductions should be directed towards the other area in which we need improvement: the large number of offenders on supervision in the community who are failing and returned to prison. We should invest in the best programs in a targeted way to lower that number. If we are successful we will immediately begin to control the projected growth in prison beds for the foreseeable future. And with these reasonable and cost-effective measures, we will also preserve the wonderful success story that is Oregon’s criminal justice system.
16 | P a g e
Appendix A
17 | P a g e
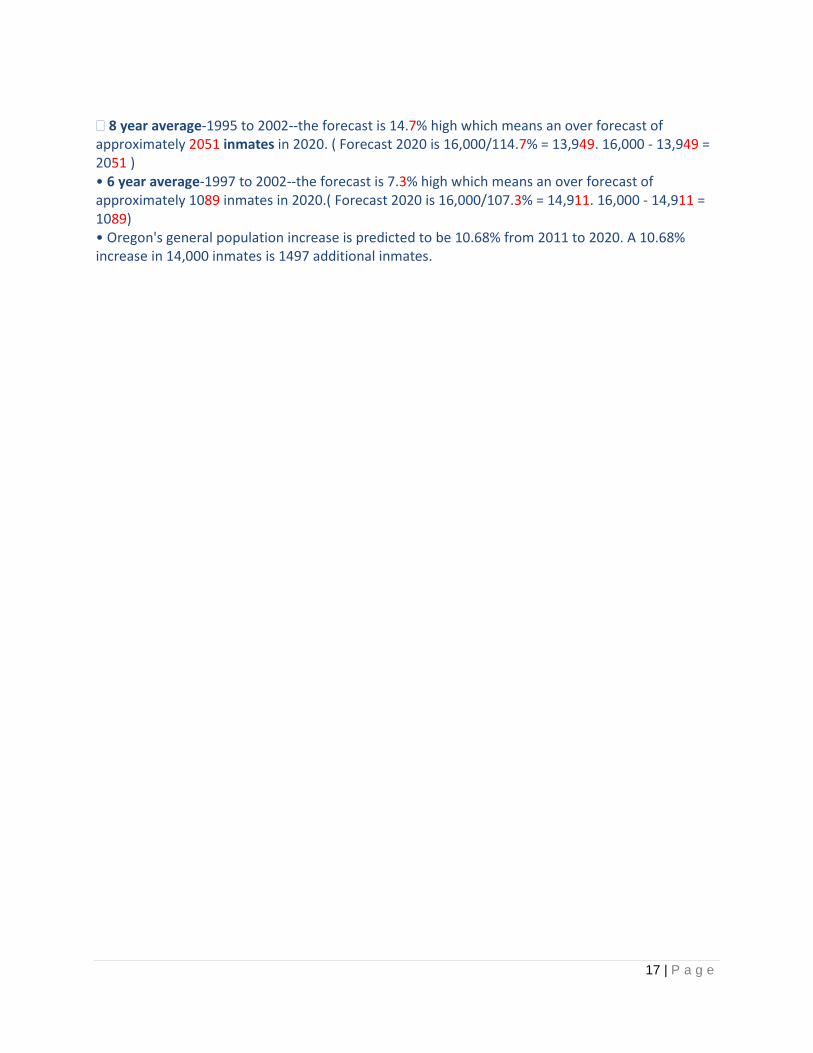
� 8 year average-1995 to 2002--the forecast is 14.7% high which means an over forecast of approximately 2051 inmates in 2020. ( Forecast 2020 is 16,000/114.7% = 13,949. 16,000 - 13,949 = 2051 ) • 6 year average-1997 to 2002--the forecast is 7.3% high which means an over forecast of approximately 1089 inmates in 2020.( Forecast 2020 is 16,000/107.3% = 14,911. 16,000 - 14,911 = 1089) • Oregon's general population increase is predicted to be 10.68% from 2011 to 2020. A 10.68% increase in 14,000 inmates is 1497 additional inmates.
18 | P a g e
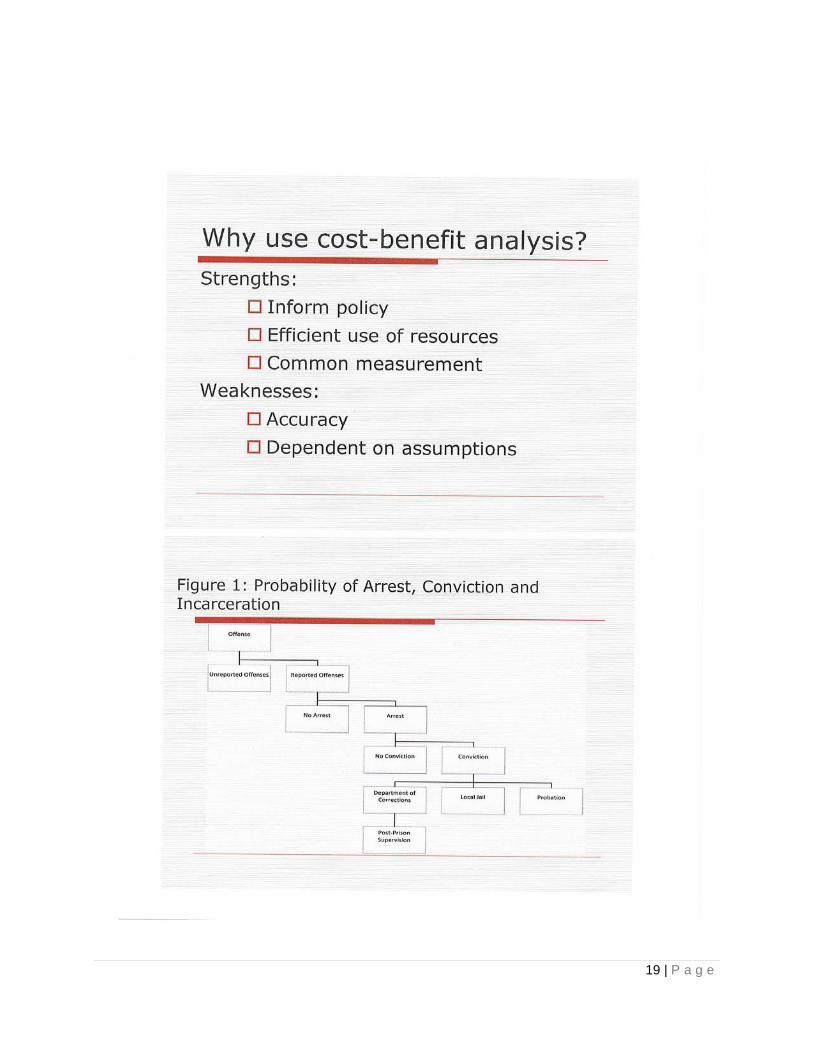
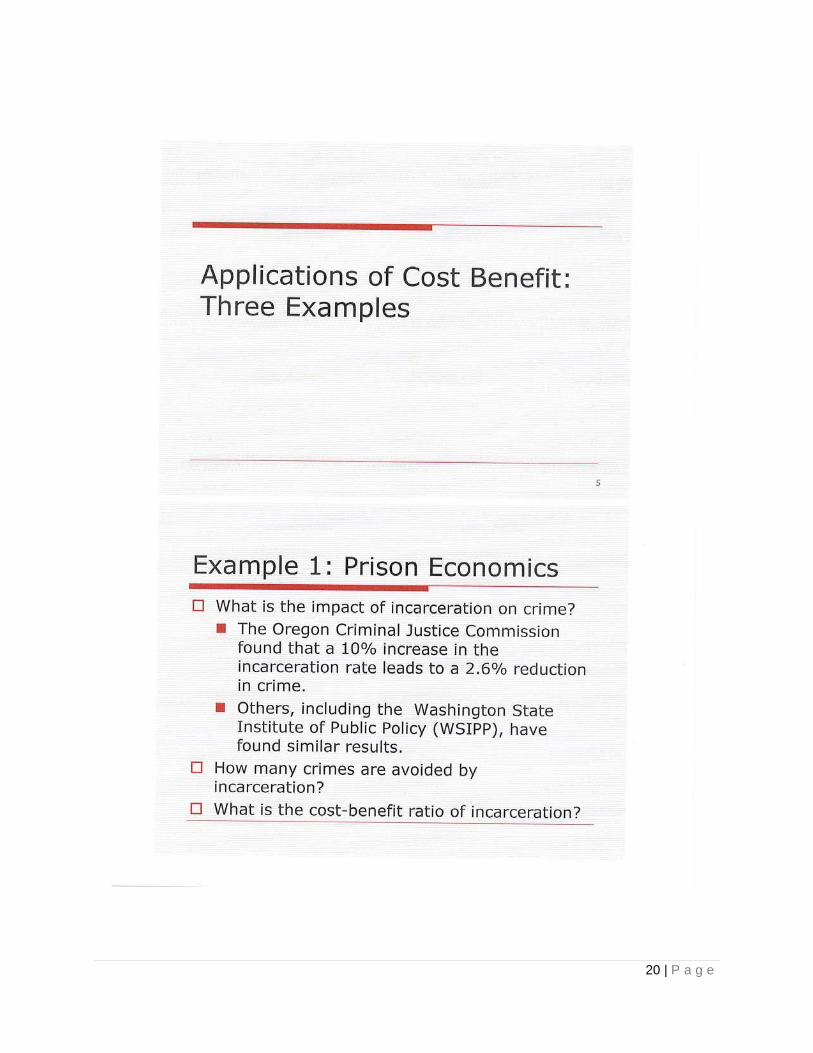
Appendix B
19 | P a g e
20 | P a g e
21 | P a g e
22 | P a g e
23 | P a g e
24 | P a g e
25 | P a g e
26 | P a g e
27 | P a g e
28 | P a g e
29 | P a g e
Appendix D
30 | P a g e
Appendix E
31 | P a g e
Appendix F
32 | P a g e
Appendix G
33 | P a g e
Appendix H
34 | P a g e
35 | P a g e
36 | P a g e
37 | P a g e
38 | P a g e
39 | P a g e
40 | P a g e
41 | P a g e