Embed Size (px)
Citation preview

US NAVY REPORT ALTERNATIVE PROPULSION METHODS FOR
SURFACE COMBATANTS AND
AMPHIBIOUS WARFARE SHIPS
Prepared by:
Naval Sea Systems Command 1333 Isaac Hull Avenue SE
Washington Navy Yard, DC 20376
March 2007 Distribution Statement A: Approved for public release; distribution is unlimited.

ii
EXECUTIVE SUMMARY In response to Section 130 of the Fiscal Year 2006 National Defense Authorization Act, the Navy evaluated alternative propulsion methods for Small and Medium Surface Combatants and Amphibious Warfare Ships. Twenty three ship concepts were developed and analyzed in terms of acquisition cost, life-cycle cost (LCC), and operational effectiveness. The different concepts varied power and propulsion technologies including nuclear power, gas turbines, diesel engines, mechanical power transmission systems, hybrid power transmission systems, integrated power transmission systems, combined power plants, and various propulsor systems. The major conclusions of the report are:
• Mission and operating requirements drive the need for particular power and propulsion system architectures, not ship displacement. For instance, it was found that ships with constant, high demands for energy may benefit from nuclear power, whereas ships with constant low demands for energy may be more suitable with combined diesel and gas turbine plants with hybrid power transmission systems (such as a single shaft with a secondary propulsion unit).
• Based on the mission requirements assumed in this study, the LCC premiums for nuclear
propulsion compared to fossil fuel propulsion, expressed in terms of percentage, for the various ship concepts are:
o Small Surface Combatants: 17% to 37% o Medium Surface Combatants: 0% to 10% o Amphibious Warfare Ships: 7% to 8%
• Acquisition cost premiums for nuclear propulsion compared to fossil fuel propelled ships for the various ship concepts are:
o Small Surface Combatants: ~ 80% (~$600M) o Medium Surface Combatants ~ 22% ($600-$700M) o Amphibious Warfare Ships ~ 46% (~$800M)
The nuclear propulsion ship acquisition costs include the cost of the nuclear fuel, which lasts for the entire service life of the ship. Acquisition cost comparisons are for the 5th ship constructed of each type.
• Based on the fuel usage projections for the ships in this study, the break even costs per
barrel of fossil fuel for the various options are: o Small Surface Combatants: $210/BBL to $670/BBL o Medium Surface Combatants: $70/BBL to $225/BBL o Amphibious Warfare Ships: $210/BBL to $290/BBL
These breakeven costs are driven by both OPTEMPO and propulsion plant efficiencies. The higher OPTEMPO is a likely stressing scenario outside of historical precedent. Therefore, the lower breakeven costs (e.g., $70/BBL for the medium surface combatant) are less likely to be realized if historic trends continue. The more likely range of breakeven costs based on historical precedent are bounded by a lower OPTEMPO. For example, while the medium surface combatant breakeven range is $70/BBL- $225/BBL, the more likely range is $115/BBL - $225/BBL based on historical precedent.
iii
• Ship vulnerability1 can be reduced by the employment of redundancy, zonal distribution,
longitudinal separation of prime movers2 and propulsors (e.g., auxiliary propulsor units) and use of flexible energy conversion (e.g., integrated propulsion systems) of power and propulsion systems.
• The number of refuelings (independent of other stores replenishments) and the amount of
fuel required by ships surging to theater is reduced by efficient energy conversion systems and high energy densities. The most effective means to achieve this operational effectiveness advantage are:
o Nuclear energy. o Propulsor systems that maximize propulsor efficiency and reduce drag by
minimizing the number of shafts/propulsors, or in the future, incorporating podded propulsors and/or low drag hull forms.
o Plant architectures matched to operational requirements. o Large fuel tankage capacities.
• Sustainability, measured by time on station and low speed operations, is enhanced by energy efficient plant architectures. The most effective architectures include:
o Nuclear energy. o Diesel engines and generators alone or in combined power plants with boost gas
turbine prime movers if high speed is also a requirement. (Fuel cells could provide similar benefits if the technology matures.)
o Integrated power and propulsion systems.
• Nuclear propulsion systems are technically feasible for small and medium combatants and for amphibious ships using existing reactor designs. The scope of this study did not include costs or time required to modify the nuclear surface ship construction capability. Likewise, this study did not include beneficial impacts to the nuclear industrial base from increased surface ship workload.
• Nuclear propulsion options provide operational advantages in surge to theater and time
on station for all variants studied. These operational advantages are even more pronounced for scenarios of high energy demand over long durations in tactical situations (e.g., high-power radars, high speeds, and electric weapons and sensors). Trends in ship weapons and sensors toward significantly higher power and energy demands will further highlight these advantages.
• Significant growth in electrical power loads to support future sensors and weapons will
be required to address projected threats and will have major impacts on ship power and
1 Vulnerability is the probability of losing mission capability resulting from the damage effects of threat weapons. Vulnerability constitutes one of a ship’s three survivability characteristics; the other two are susceptibility (qualities of a ship affecting a threat weapons targeting and tracking) and recoverability (ability to restore ship functionality following a damage event). 2 Prime movers are devices that convert fuel into a useful form of energy. For instance, on current surface combatants they would be gas turbines.

iv
propulsion architectures and fuel requirements. This will require a more detailed understanding of future operational requirements to better inform the selection of power and propulsion architectures and components. As energy requirements for these loads increase, the value of efficient next generation systems increases.
The major technical recommendations of the report are as follows:
• The Navy should continue to use the methods and processes developed for this study in analysis for future ships to evaluate the operational effectiveness of propulsion and power systems. Future studies should include quantifiable analyses of ship vulnerability, sustainability, and timeliness that can be evaluated against acquisition and LCC. This is especially critical where emerging commercial energy and propulsion technologies are being considered for warship applications.
• The Navy should consider ship options with nuclear power and combined plant
architectures (e.g., diesels combined with gas turbine boost) in studies for future surface combatants and amphibious warfare ships.
• The Navy should continue to invest in RDT&E efforts to improve affordability, power
density and efficiencies of technologies for Naval ship power generation (e.g., fuel cells), power distribution, propulsion transmissions, and technologies to reduce hull drag.
• The Navy should invest in RDT&E for propulsors that provide improved efficiency and
increased longitudinal segregation.
v
TABLE OF CONTENTS Executive Summary ........................................................................................................................ ii Table of Contents............................................................................................................................ v Introduction..................................................................................................................................... 1 1 Key Assumptions .................................................................................................................... 3 2 Study Methodology and Techniques ...................................................................................... 5 3 Current and Future Technologies............................................................................................ 8
3.1 Power System Architectures ........................................................................................... 8 3.2 Current Propulsion Technology...................................................................................... 9
3.2.1 Current Power System Architectures...................................................................... 9 3.2.2 Current Power Generation ...................................................................................... 9 3.2.3 Current Energy Storage......................................................................................... 10 3.2.4 Current Propulsion Motors and Drives ................................................................. 10 3.2.5 Current Power Distribution and Power Conversion ............................................. 10 3.2.6 Current Propulsors ................................................................................................ 10
3.3 Future Propulsion Technology...................................................................................... 11 3.3.1 Future Power Generation ...................................................................................... 12 3.3.2 Future Energy Storage .......................................................................................... 12 3.3.3 Future Propulsion Motors and Drives................................................................... 13 3.3.4 Future Power Distribution and Power Conversion ............................................... 13 3.3.5 Future Propulsors .................................................................................................. 13
4 Propulsion Alternatives for Surface Combatant and Amphibious Ships.............................. 14 4.1 Power and Energy Requirements.................................................................................. 14 4.2 Ship Concepts ............................................................................................................... 22
4.2.1 Small Surface Combatant ..................................................................................... 23 4.2.2 Medium Surface Combatant ................................................................................. 24 4.2.3 Amphibious Warfare Ship .................................................................................... 25 4.2.4 Manpower Analysis .............................................................................................. 26
5 Cost and Operational Effectiveness of Alternatives ............................................................. 27 5.1 Cost Analyses................................................................................................................ 27
5.1.1 Assumptions/Methodology................................................................................... 27 5.1.2 Procurement Cost.................................................................................................. 29 5.1.3 Life-cycle Cost Results and Analysis ................................................................... 32 5.1.4 The Cost of Speed................................................................................................. 36 5.1.5 Cost Analysis Insights........................................................................................... 36
5.2 Operational Effectiveness Analysis Results ................................................................. 37 5.2.1 Warfare Area Mission Effectiveness .................................................................... 37 5.2.2 Surge to Theater.................................................................................................... 38 5.2.3 Operational Presence ............................................................................................ 39 5.2.4 Vulnerability ......................................................................................................... 39
5.3 Insights on Cost and Effectiveness Analyses................................................................ 40 6 Break Even Analysis for Nuclear Propulsion Alternatives................................................... 42 Conclusions and Recommendations ............................................................................................. 46 References and Abbreviations ...................................................................................................... 49

vi
List of Tables Table 1: Current Ship Propulsion Technology .............................................................................. 9 Table 2: Power System Architecture Considerations for the Next Navy and Navy after Next... 12 Table 3: Electric Load Summary (unmargined) ...........................Error! Bookmark not defined. Table 4: Ship Design Exploration Matrix.................................................................................... 23 Table 5: Baseline Fossil Fueled Ship’s Company Manpower Requirements.............................. 26 Table 6: Baseline Nuclear Ship’s Company Manpower Requirements....................................... 26 Table 7: Acquisition Cost Premium for Nuclear vs. Fossil Fuel ................................................. 31 Table 8: Acquisition Cost Premium for IPS vs Mechanical / Hybrid Drive ............................... 31 Table 9: Acquisition Cost Premium for Gas Turbine vs Diesel Cruise Engine........................... 32 Table 10: Acquisition Cost Premium for two propulsion shafts vs one shaft ............................. 32 Table 11: Life-cycle Cost Premium for Nuclear vs Fossil Fuel ................................................... 34 Table 12: Life-cycle Cost premium for IPS vs. Mechanical / Hybrid Drive................................ 35 Table 13: Life-cycle Cost Premium for Gas Turbine vs Diesel Cruise Engine............................ 35 Table 14: Life-cycle Cost Premium for two propulsion shafts vs one shaft................................. 36 Table 15: The Cost of Speed......................................................................................................... 36 List of Figures Figure 1: Study Process Flow Description..................................................................................... 5 Figure 2: Growth in Ship Service Loads...................................................................................... 15 Figure 3: Energy Requirements Study Process............................................................................. 16 Figure 4: Destroyer and Frigate Average Historical Operational Tempo (2000-2006)............... 18 Figure 5: Cruiser Average Historical Operational Tempo (2000-2006)..................................... 18 Figure 6: Amphibious Ships Average Historical Operational Tempo (2000-2006).................... 19 Figure 7: Comparison of DD/DDG/FFG Historic ....................................................................... 20 Figure 8: Comparison of CG-47 Historic and Modeled Steaming Hours Underway.................. 21 Figure 9: Comparison of Amphibious Warfare Ship Historic and Modeled Steaming Hours
Underway.............................................................................................................................. 21 Figure 10: Genealogy of the Small Surface Combatant ............................................................... 24 Figure 11: Genealogy of the Medium Surface Combatant ........................................................... 25 Figure 12: Genealogy of the Amphibious Warfare Ship .............................................................. 25 Figure 13: Fuel Burdening ............................................................................................................ 28 Figure 14: Small Surface Combatant Acquisition Cost – 5th Ship ............................................. 29 Figure 15: Medium Surface Combatant Acquisition Cost – 5th Ship .......................................... 30 Figure 16: Amphibious Warfare Ship Acquisition Cost – 5th Ship ............................................ 30 Figure 17: Small Surface Combatant Life-cycle Cost – 5th Ship................................................. 33 Figure 18: Medium Surface Combatants Life-cycle Cost – 5th Ship........................................... 33 Figure 19: Amphibious Warfare Ship Life-cycle Cost – 5th Ship................................................ 34 Figure 20: Life-cycle Cost vs. Crude Oil Price for the Small Combatants (5th Ship) ................. 43 Figure 21: Life-cycle Cost vs. Crude Oil Price for the Medium Combatants (5th Ship) ............. 44 Figure 22: Life-cycle Cost vs. Crude Oil Price for the Amphibious Ships (5th Ship) ................. 45

1
INTRODUCTION This report is written in response to Section 130 of the Fiscal Year 2006 National
Defense Authorization Act that directs the Navy to evaluate alternative propulsion methods for surface combatants and amphibious warfare ships.
SEC. 130. REPORT ON ALTERNATIVE PROPULSION METHODS FOR SURFACE COMBATANTS AND AMPHIBIOUS WARFARE SHIPS. (a) Analysis of Alternatives. --The Secretary of the Navy shall conduct an analysis of alternative propulsion methods for surface combatant vessels and amphibious warfare ships of the Navy. (b) Report. --The Secretary shall submit to the congressional defense committees a report on the analysis of alternative propulsion systems carried out under subsection (a). The report shall be submitted not later than November 1, 2006. (c) Matters To Be Included. --The report under subsection (b) shall include the following:
(1) The key assumptions used in carrying out the analysis under subsection (a). (2) The methodology and techniques used in conducting the analysis. (3) A description of current and future technology relating to propulsion that has been incorporated in recently-designed surface combatant vessels and amphibious warfare ships or that is expected to be available for those types of vessels within the next 10-to-20 years. (4) A description of each propulsion alternative for surface combatant vessels and amphibious warfare ships that was considered under the study and an analysis and evaluation of each such alternative from an operational and cost-effectiveness standpoint. (5) A comparison of the life-cycle costs of each propulsion alternative. (6) For each nuclear propulsion alternative, an analysis of when that nuclear propulsion alternative becomes cost effective as the price of a barrel of crude oil increases for each type of surface combatant vessel and each type of Amphibious Warfare Ship. (7) The conclusions and recommendations of the study, including those conclusions and recommendations that could impact the design of future ships or lead to modifications of existing ships. (8) The Secretary's intended actions, if any, for implementation of the conclusions and recommendations of the study. (d) Life-Cycle Costs. --For purposes of this section, the term ``life-cycle costs'' includes those elements of cost that would be considered for a life-cycle cost analysis for a major defense acquisition program.
This report addresses technologies such as nuclear power, gas turbines, diesel engines, mechanical power transmission systems, hybrid power transmission systems, integrated power transmission systems, combined power plants (e.g., diesel and gas turbine), and various propulsor systems. It identifies aspects of these technologies that are anticipated to mature for transition to ship acquisition programs within the next ten to twenty years. The report compares the performance of alternate power and propulsion systems and associated architectures in non-program-of-record small (~7,500 to ~12,000 metric ton) and medium (~21,000 to ~26,000-

2
metric ton) surface combatants and in amphibious warfare (~34,000 to ~38,000-metric tons) ship concept designs3. The report evaluates the cost and operational effectiveness of these designs with alternative propulsion systems. The breakeven costs of nuclear propulsion options are also compared with fossil-fueled ships. The report is organized into sections that track with the specific matters requested in the public law:
1) Key assumptions 2) Study methodology and techniques 3) Current and future propulsion technologies 4) Propulsion alternatives for surface combatant and amphibious ships 5) Cost and operational effectiveness of alternatives 6) Break even analysis for nuclear propulsion alternatives 7) Conclusions and recommendations.
The Secretary of the Navy’s recommendations and intended actions are addressed in the cover letter of this report.
3 Using the NAVSEA 05D Ship Studies Extent of Effort Scale (reference (c)), this study is a level 4, with level 10 being the highest. A level 4 study is an extended rough order of magnitude effort. It is generally used to compare cost and performance trade-offs across multiple sets of ship requirements to gain more detailed insights for requirements definition. It can also be used to determine impact of different technologies to meet the same set of requirements.

3
1 KEY ASSUMPTIONS • Two energy sources are considered: diesel fuel marine4 and nuclear. 5 • Section 3 of this report addresses a wide range of technologies at varying levels of
maturity; however the remaining sections only consider technologies that are available for integration into ships that would join the fleet in the 2017 to 2027 timeframe.
• Ships evaluated in this study are non-program-of-record ship concept designs6, with capabilities bounded by the Navy's 2006 30-Year Shipbuilding Plan (reference (d)).
• The baseline7 ships in this study are surrogates for the ships in the 30-Year Shipbuilding Plan. Warfare mission capabilities, and therefore power loads, are kept constant across all platforms in each class and are reflective of the warfare capabilities of the ships envisioned in the 30-Year Shipbuilding Plan. Thus, the ships of this study are considered ‘energy management system surrogates’ of the ships in the 30-Year Shipbuilding Plan.
• Official Defense Planning Scenarios (DPS) that were used to define the quantities and capabilities of the 313 ship future fleet were also used to develop the warfare and mobility system energy requirements and operating tempos for the ships modeled.
• LCC are expressed in FY2007 dollars. • Cost estimates assume that ships would be built at shipyards that normally produce non-
nuclear warships, except that the single subdivision enclosing the nuclear primary plant would be built at a shipyard already licensed and qualified to build nuclear ships. The details of how and where to best integrate the nuclear propulsion package into the rest of the ship’s construction plan would require further analysis. Any cost inefficiencies incurred by building portions of the ship at two sites was not included. Likewise, the beneficial cost impacts to the nuclear industrial base due to increased workload were not included.
• Nuclear ship acquisition prices reflect life of ship reactor cores. Conventionally powered ship life-cycle operations and support costs reflect the price of Diesel Fuel Marine (DFM)/F76 as delivered to ships at sea.
• Manpower estimates are derived from the Manpower Analysis and Prediction System (MAPS) adjusted to reflect propulsion plant discrimination of billet numbers. Costs are estimated per billet for officers and enlisted using the Conceptual Operations Manpower Estimating Tool (COMET).
• Visibility and Management of Operating and Support Costs (VAMOSC) data was used in determining maintenance and inactivation costs. Nuclear variants reflect defueling and
4 This study did not address the topic of synthetic fuels. However, the results of this study are valid for any liquid hydrocarbon (natural or synthetic) which provides equivalent performance to diesel fuel marine. 5 Other sources (coal, wind, wave, and solar energy) were reviewed and eliminated after determining they would conflict with primary ship missions. For example, wind energy would consume excessive shipboard space and directly impact the ability of the ship to maneuver freely. Fuel cells were evaluated as a promising technology from an energy conversion standpoint, but do not yet provide the power conversion vs. weight and volume density to be included in Next Navy ships. For a more detailed discussion of these sources, and an extensive reference list, please consult reference (a), NAVSEA’s FY2005 response to reference (b). 6 Designs for program-of-record ships could not be modified to accommodate vastly different propulsion and power systems without introducing biases into the cost and effectiveness analysis. 7 A “baseline” ship was developed for each class of ships to reflect the current architecture of ships in the fleet today. All other ships developed for each class used these as points of departure.

4
disposal costs based on actual data consistent with the single plant arrangement used in this study.
• Non-recurring costs are not specified as they are dependent on capability growth (both military and industrial) and acquisition strategies which are outside the scope of this study. Non-recurring costs are not expected to be a major LCC cost discriminator among propulsion options.
• The breakeven analysis of the study was performed in constant FY 2007 dollars. • A breakeven analysis amortizes nonrecurring costs over a given quantity. Since the scope
of the study did not assess quantity, the development cost of non-propulsion technologies, the beneficial impacts to the nuclear industrial base, nor the costs and time required to re-establish a nuclear surface ship construction capability, the results presented herein are meant to merely indicate conditions where nuclear propulsion could be considered a viable alternative in future analyses. More detailed review would be required for specific tradeoffs.
• This study assumes a one-to-one relationship between nuclear and fossil fuel ships to sustain a notional force structure.
• The study also does not make any assumptions regarding the affordability of alternative propulsion ships as it relates to either a notional $13.4B (FY05) shipbuilding plan, or total costs to achieve the Navy’s 313 ship fleet.

5
2 STUDY METHODOLOGY AND TECHNIQUES The Commander of the Naval Sea Systems Command (NAVSEA) directed this study with oversight from the Deputy Assistant Secretary of the Navy for Research and Development, Deputy Assistant Secretary of the Navy for Ships, and the Chief of Naval Operations’ Capability Analysis and Assessment Division (OPNAV N81). Study team members included representatives from NAVSEA 017 (Cost Engineering), NAVSEA 05 (Ship Design, Integration and Engineering), NAVSEA 08 (Naval Reactors), NAVSEA 03 (Human Systems Integration), the Naval Surface Warfare Center (Carderock and Dahlgren Divisions), Office of Naval Intelligence, Naval Operational Logistics and Support Center, and the Program Executive Office Integrated Warfare Systems. The study process consists of project elements executed in sequence to provide a response to public law directed products:
• Cost versus operational effectiveness • Break even costs of nuclear and fossil fuel plants • Survey of current and future technology
Figure 1, below, illustrates the relationship between the various project elements and the overall process flow. The process requires iteration of the ship and energy plant designs until performance requirements are met and mission effectiveness is sufficient. Physical and cost descriptions of mature technologies are included in technology models exercised in block 6, “Propulsion Plant Architecting and Systems Engineering.”
Figure 1: Study Process Flow Description

6
The overall study process consisted of the following pieces: 1. Initial Capabilities: Identify ship types to be studied and baseline their warfare system
performance requirements. Characterize baseline ships as well as variants of those ships with alternative propulsion systems. This is discussed as part of Section 4.2 of this report.
2. Technology Survey (Current): Survey industry and consult with the Office of Naval
Research (ONR) to identify and describe current technologies relating to propulsion and power systems and architectures.
3. Technology Survey (Future): Survey industry and consult with ONR to identify and
describe future technologies relating to propulsion and power systems and architectures. 4. Technology Findings: The findings of the current and future system technology surveys
are summarized in Section 3 of this report. 5. Energy Requirements: Determine life-cycle energy requirements for each ship (energy
demand signal) to perform missions within the context of the DoD DPS. Develop the energy demand signal from the speed range in given warfare system energy usage states for each ship over its expected lifetime. Exercise each variant in energy usage states to determine propulsion and electrical power demands. Develop an analytical model to determine lifetime energy demand based on the energy requirements and expected plant line-ups. This is discussed in Section 4.1 of this report.
6. Propulsion Plant Architecting and Systems Engineering: Develop the basic architecture
for each variant. Architectures will include traditional mechanical, and electric propulsion architectures as well as “hybrid” architectures that blend integrated propulsion (electric and steam) with mechanical and electric transmissions to satisfy mobility, vulnerability and warfare system service demands. Characterize nuclear and fossil fuel power plants that meet peak, endurance, and, in the case of nuclear powered ships, the lifetime energy needs. Select the type, number, and general location of prime movers and propulsion equipment in the ship. Determine the sizes, weights, and costs associated with various propulsion plant options appropriately scaled for the surface combatants and amphibious warfare ships under study. This is discussed in Section 4.2 of this report.
7. Ship Synthesis Model: Develop a total ship concept for each variant that incorporates the
alternate propulsion plants and defined mission systems that is suitable for cost estimating and operational effectiveness analysis. The ship synthesis model used for this effort is the Advanced Surface Ship Evaluation Tool (ASSET) V5.3. It is a design tool which balances area, volume, weight, and basic performance characteristics of a notional ship based on parametric analysis. The result of this effort is not a full-up ship design; rather it is an engineering estimation indicative of the potentially feasible design solutions. This is discussed in Section 4.2 of this report.
8. Ship Performance Assessment: Evaluate the performance of each ship baseline/variant in
all energy management system areas: energy storage, energy conversion, energy distribution, energy transmission, and thrust generation. Relate the energy management

7
system and architecture to ship speed, range, and service to warfare mission system performance areas. This is discussed in Section 5.2 of this report.
9. Cost Models: Estimate fifth ship8 (using two shipyards) acquisition cost and LCC for
each ship baseline and associated variants. Due to the maturity of power and propulsion system equipment, when possible, acquisition costs include actual cost return data or vendor quotes for power and propulsion system material. The LCC estimates incorporate the following costs: inactivation, defueling (nuclear variants only), disposal, burdened fuel costs, manpower costs, and maintenance. Non-recurring costs are not specified as they are dependent on capability growth (both military and industrial) which is outside the scope of this study. This is discussed in Section 5.1 of this report.
10. Breakeven Cost Model: Perform breakeven cost analyses to compare the nuclear and
fossil-fueled ship concepts. Perform a correlation analysis between the breakeven cost of oil with operational tempo, operational profile, and service life. This is discussed in Section 6 of this report.
11. Effectiveness Models: Develop analytical models to evaluate the vulnerability,
operational, and mobility effectiveness of the ship variants in mission scenarios. This is discussed in Section 5.2 of this report.
12. Operational Effectiveness Analysis: Evaluate each ship concept in terms of mobility,
survivability, and warfare effectiveness in the context of operational scenarios and include attributes such as timeliness, percent mission complete, and sustainability. This is discussed in Section 5.2 of this report.
13. Cost and Operational Effectiveness Analysis: Quantify the relationships between mission
effectiveness and cost using a design of experiments (DOE) approach. Develop a DOE for performance versus cost and for performance versus operational effectiveness for each ship type. This is discussed in Section 5 of this report.
8 This assumption also includes two shipyards, therefore the price reflects only third ship on the learning curve.
8
3 CURRENT AND FUTURE TECHNOLOGIES 3.1 Power System Architectures Surface ship designs today usually chose one of four basic power system architectures:
• Conventional Mechanical Drive • Integrated Power System • Nuclear Steam with Mechanical or Integrated Power Systems • Hybrid
All currently in-service surface combatants and many amphibious warfare ships use conventional mechanical drive where prime movers such as gas turbines or diesels drive propellers through reduction gears. Electrical loads are provided power with a segregated electrical distribution system. In the past, nuclear powered surface ships used nuclear steam with mechanical power systems. The Navy’s newest destroyer design class, the DDG-1000,uses an Integrated Power System (IPS) where all prime movers produce electrical power that is shared between propulsion and ship service loads. Discriminating attributes of integrated power systems are flexibility of arrangements, mechanical decoupling between prime movers and propulsors, and an increased level of energy conversion and transmission redundancy. These attributes permit the lower IPS propulsion transmission efficiency to be offset by improvements in the fuel efficiency of the prime movers, improvements in the efficiency of the propulsor, and reductions in hull drag. Mechanically decoupling prime movers from propulsors enables segregation and separation of ship propulsor components. Nuclear steam is also an integrated system where propulsion power and electrical generators are driven by steam turbines with steam produced from the energy in a nuclear reactor. Finally, hybrid systems combine the attributes of the other three ship types. For example, the hybrid mechanical drive / IPS propulsion system for LHD 8 combines a gas turbine mechanical drive system with IPS diesel generator powered auxiliary propulsion motors to gain fuel efficiencies at low speeds without sacrificing transmission efficiencies at high speeds.

9
3.2 Current Propulsion Technology Table 1, summarizes current power and propulsion architectures and technologies that have been incorporated in recently designed surface combatants and amphibious warfare ships. Table 1: Current Ship Propulsion Technology
Storage Conversion Distribution Transmission Thrust Generation
DDG-51 Gas Turbine Mechanical COGAG
LHD-8 / LHA-6
Diesel Cruise / Gas Turbine Boost CODLAG
LPD-17 Diesel Mechanical CODAD Controllable Pitch Propeller
LCS (LM)
LCS (GD)
DDG-1000 Gas Turbine Integrated Electric Electric Motor Fixed Pitch Propeller
COGAG: Combined Gas Turbine and Gas Turbine Power PlantCODAG: Combined Diesel and Gas Turbine Power PlantCOLAG: Combined Diesel Electric and Gas Turbine Power Plant
Energy Management Systems
Diesel Cruise / Gas Turbine Boost
Fossil Fuel (DFM/F76)
Segregated Electric
Mechanical CODAG Waterjet
Ship
Controllable Pitch Propeller
The following technology discussions are limited to only those technologies that are mature for immediate transition to naval warships. This section is only intended to serve as a high level survey of current technology, and as such does not necessarily cover all existing technologies. Due to the limited scope of this study, only a subset of these technologies could be evaluated. 3.2.1 Current Power System Architectures The basic power system architectures described in section 3.1 are not anticipated to change in the next 20 years. Advances in technologies of components, as well as changes in the ship power and energy requirements are anticipated to shift the architectures selected for many warships from conventional mechanical drive to other architecture choices. Employing these architectures to their fullest potential will require investment in new design tools, design processes, and education of the design workforce in addition to investments in the basic technologies supporting the architectures. 3.2.2 Current Power Generation Power generation options currently available to ship designers include gas turbines, diesel engines, and nuclear steam. Gas turbines and diesel engines are fueled with Diesel Fuel Marine (DFM) and can be either mechanically coupled to propulsors through reduction gears, or used to produce electrical power using generators. Nuclear power plants currently produce steam to drive steam turbines that either propel the ship or produce electricity with generators. Electrical generators are typically three phase 60 Hz synchronous machines using copper wires for both the stator and rotor.

10
3.2.3 Current Energy Storage Lead Acid batteries remain the most mature means for providing bulk electrical energy storage on ships. Many ship designs use compressed air in cylinders or hydraulic accumulators for storing energy for specific applications such as generator starting. The Navy’s next generation aircraft carrier design, CVN-78, incorporates rotating electromechanical storage for pulse applications. 3.2.4 Current Propulsion Motors and Drives Mature propulsion motor technologies include advanced induction motors, conventionally wound synchronous motors, and brushed direct current ( DC) motors. Most motor drives include a simple controlled rectifier to create a DC link that is then converted to variable frequency multi-phase power as required by the particular propulsion motor. Inverter technologies include load commutated inverters and pulse-width modulated inverters. Another type of converter, the cycloconverter, also has application for motors requiring low frequencies. The available silicon switching devices currently limit affordable drives to voltage ranges between 4.16 and 7.2 kV. Higher generation voltages generally require the use of heavy transformers to match up with the capabilities of the drives. 3.2.5 Current Power Distribution and Power Conversion High power is currently distributed with traditional 60 Hz three phase power at a voltage chosen to limit currents to values that can be interrupted using available air or vacuum circuit breakers. Conversion to other voltages is typically done with traditional transformers. Conversion to other frequencies (such as 400 Hz) is typically accomplished with solid state frequency changers. Another option is the use of a motor generator set. With the Integrated Fight-Through Power (IFTP) system, the Navy has recently matured DC power distribution and advanced fault isolation techniques. IFTP will be integrated into DDG-1000. 3.2.6 Current Propulsors For ship applications with maximum speeds below about 35 knots, either fixed pitch or controllable reversible pitch propellers are typically used. In mechanical drive applications, a fixed pitch propeller requires a reversing gear, or a prime mover that can reverse. Consequently, many mechanical drive applications use controllable reversible pitch propellers to enable shaft rotation in a single direction for both ahead and astern propulsion. Since electric motors can easily change directions, electric propulsion typically uses fixed pitch propellers. For ship applications with maximum speeds above about 35 knots, mechanically driven waterjets are often used. The single screw propulsor is made possible by an integrated propulsion system architecture that provides propulsor redundancy by longitudinally separating the primary propulsor from a secondary propulsion unit. Primary propulsor types mature enough to transition to future ships include waterjet and podded propulsion. Secondary propulsor types that are transitionable to future ships include retractable podded propulsors. Combined internal shaft driven fixed pitch propulsors with podded propulsors located immediately aft have demonstrated higher efficiency. Although not captured in this analysis, the pod-hybrid contrarotating propulsion architecture is
11
an integrated propulsion variation that could be supported by both nuclear and fossil energy storage and conversion schemes. Secondary propulsion units in the 3-5MW power range are available for naval applications. However, although a number of commercial ships currently use podded propulsors with ratings above the 5MW level to improve fuel efficiency, technology at these power levels is not currently mature for naval warships. 3.3 Future Propulsion Technology The Navy and industry are investing in propulsion technologies that offer the potential to improve future naval ship designs. In the ship design process, a component or subsystem technology should be mature enough at the ship’s Preliminary Design Review (PDR) such that interfaces and component performance are not likely to change. A ship’s PDR is typically several years prior to the lead ship detail design and construction award and five to ten years before lead ship delivery. The goals of the current and planned technology development efforts are to improve affordability, power density, efficiency, and satisfy the energy demands of future mission systems. Table 2 lists power and propulsion plant architectures that should or are being considered for ships in design or construction (Next Navy) and for future ships (Navy after Next). 9
9 Current Navy refers to in service ships and systems and the timeframe is current operations. The Next Navy refers to ships and systems that are under acquisition in an appropriated program, the timeframe is the future year defense program (FYDP). The Navy After Next refers to concepts for ships and systems, the timeframe is prior to the initial acquisition milestone decision.

12
Table 2: Power System Architecture Considerations for the Next Navy and Navy after Next10
Next Navy Navy after Next(Ships in Design and Construction) (Future Ship Designs)
Combined Gas Turbine and Diesel PlantsSingle shaft with longitudinally separated secondary propulsion unit.IPS for ships with high mission system electrical loads.Fuel CellsNuclear PowerIPS for ships with high mission system electrical loads and ships requiring high levels of survivability.Longitudinally separated Secondary Propulsion Unit.Fuel CellsCombined Diesel and Gas Turbine plants.Nuclear PowerIPS or Hybrid PlantsLongitudinally separated Secondary Propulsion Unit.
Fuel CellsNuclear Power
Amphibious Warfare
LHD-8, LHA-6 – Hybrid Gas Turbine Mechanical and Diesel Electric
Small Surface Combatant
LCS – Combined Gas Turbine and Diesel Mechanical Propulsion with Diesel Generator Sets
Medium Surface Combatant
DDG-1000 – Gas Turbine-Electric Integrated Power System
The following sections describe ongoing technology development efforts that promise to improve affordability, power density, efficiency and/or satisfy the energy demands of future mission systems. 3.3.1 Future Power Generation Emerging power generation technologies that are anticipated to mature within the next ten years include high speed – high frequency electrical generators. Maturation of technologies to meet marine and naval requirements, such as superconducting generators and small fuel cells is expected in the next ten to twenty years. Promising technologies that will likely mature more than twenty years from now include nuclear direct thermal to electricity conversion and propulsion sized fuel cells. 3.3.2 Future Energy Storage Emerging energy storage technologies that will likely mature during the next ten years include rotating electromechanical storage for pulse applications and large battery based power supplies for providing ride-through capability during power interruptions. Technologies such as advanced batteries and capacitors, advanced rotating electromechanical storage, and superconducting magnetic energy storage may mature ten to twenty years from now.
10 The term “hybrid” in reference to a propulsion plant refers to the combination of a direct drive transmission system with an electric drive transmission system. LHD-8 is an example of this because it an architecture where gas turbines or an electric motor can drive the same shaft.

13
3.3.3 Future Propulsion Motors and Drives Near term surface combatant electric propulsion motor applications include both primary propulsion twin and single shaft applications and secondary propulsion units. Section 5.2.4 , the operational effectiveness vulnerability section of this report, identifies segregated propulsion with longitudinal separation as the key discriminator in reducing ship vulnerability to loss of ship mobility. In addition to supporting the main propulsion power requirements needed to meet full mission capabilities, electric propulsion can provide segregated and separated propulsion capability. Lower power levels needed to support full mission capability other than surge to theater and sprint speeds set a power limits similar to the LHD 8, partial (hybrid) electric drive system. Permanent magnet motors and high temperature superconducting motor technology are likely to mature sufficiently during the next ten years to enable their integration into ship designs. Due to the need for full scale demonstration and motor drive development, superconducting homopolar motors will take somewhat longer to mature. Technologies promising for propulsion motor drives include multi-level converters and resonant converters. Once high voltage silicon carbide power devices become reliable and affordable, the opportunity will exist to develop high voltage power converters for shipboard applications. 3.3.4 Future Power Distribution and Power Conversion High voltage DC distribution fault protection and isolation techniques could be matured within the next ten years. Hybrid solid state- mechanical breakers may, within the next ten years, enable higher currents for a given power distribution voltage. Standards, equipment, and techniques for power distribution frequencies above 60 Hz may mature within ten to twenty years, which would enable the reduction in size of generators and transformers. Promising technologies for power conversion include multi-level converters, resonant converters, and high frequency inverter fed power transformers. 3.3.5 Future Propulsors Within the next ten years, maturation of secondary propulsion units beyond the 5MW range is achievable. The significant challenge will be shock qualifying low power density units. Adapting commercial podded propulsion technology to naval auxiliaries is also achievable in the next ten years. Maturing pod technology for naval combatant applications will likely take ten to twenty years.

14
4 PROPULSION ALTERNATIVES FOR SURFACE COMBATANT AND AMPHIBIOUS SHIPS The study evaluated 23 different ship concepts with varying propulsion and power systems. These concepts are variants of the three ship baselines: small combatant, medium combatant, and Amphibious Warfare Ship. Mission systems for the ship concepts are similar to current or projected systems. 4.1 Power and Energy Requirements Developing ship power and propulsion requirements entails a detailed understanding of the power and energy requirements for each ship concept driven by ship mission and capability requirements. Like the engine rating for an automobile, ship design power requirements are driven by limiting mission needs. For example, for each ship concept, a determination is made of the maximum power requirements to simultaneously support propulsion and ship service electrical loads with design/construction and service life margins. Simply adding maximum propulsion speed and ship service electrical load design capacity would be one method of determining power plant design rating. However, since not all electrical loads resident on the ship are needed while simultaneously operating at maximum speed, such an approach would grossly overestimate the design power needs of the ship concept and drive up costs. Instead, a more detailed and iterative approach is taken to determine likely ship speed requirements matched with likely ship electrical load needs for various conditions. The more limiting of these realistic conditions modified for design/construction and service life margins are used to size the power plant. Similarly, the energy needs of the ship can be thought of as sizing the “gas tank.” In this case, mission needs (both propulsion speed/range and electrical energy usage) for sustained periods without refueling drive energy requirements for the fossil fuel variants. For nuclear propulsion options, mission needs are determined for the ship’s service life to size the energy rating of the nuclear reactor. The study recognizes substantive historic and predicted growth in electrical power requirements. Figure 2, below, illustrates the growth in maximum margined electric loads of recent ships.

15
Figure 2: Growth in Ship Service Loads
The ~31 MW maximum margined load shown above in Figure 2 was used in this study’s Medium Surface Combatant. This significant increase in ship service loads is attributable to Theater Ballistic Missile Defense (TBMD) radar system requirements.11 Electric load growth similar to that of the DDG-51 to DDG-1000 was reflected for the Small Surface Combatant and Amphibious Warfare Ships due to the lower radar system capability requirements. Energy requirements12 were developed for each ship type based on Design Reference Missions (DRMs). The DRMs are comprised of Tactical and Operational Situations that suggest an employment of energy management systems in ship energy states, thus driving mobility, survivability, and mission system energy demands. Figure 3, below, depicts the process used to determine the energy and power requirements for the various ship concepts and therefore the “engine” and “gas tank” capacities needed.
11 A “powered-down” mode is assumed for these radar systems. Future radar system development will need to incorporate such a mode to be consistent with the lifetime fuel usage assumptions in the study. 12 Life cycle energy requirement is the amount of energy required for each ship to perform missions as defined within the context of the DoD Defense Planning Scenarios. This includes propulsion and ship service loads over the life of the ship.
0
5
10
15
20
25
30
35
DD-963 DDG-51 FltIIA
DDG-1000 AP StudyMedium
Combatant
Elec
tric
Loa
d, M
W
Alternate Propulsion Study
Medium Combatant
~37 MW
~16 MW
Potential Future Radar Loads
0
5
10
15
20
25
30
35
DD-963 DDG-51 FltIIA
DDG-1000 AP StudyMedium
Combatant
Elec
tric
Loa
d, M
W
Alternate Propulsion Study
Medium Combatant
0
5
10
15
20
25
30
35
DD-963 DDG-51 FltIIA
DDG-1000 AP StudyMedium
Combatant
Elec
tric
Loa
d, M
W
Alternate Propulsion Study
Medium Combatant
~37 MW
~16 MW
Potential Future Radar Loads
16
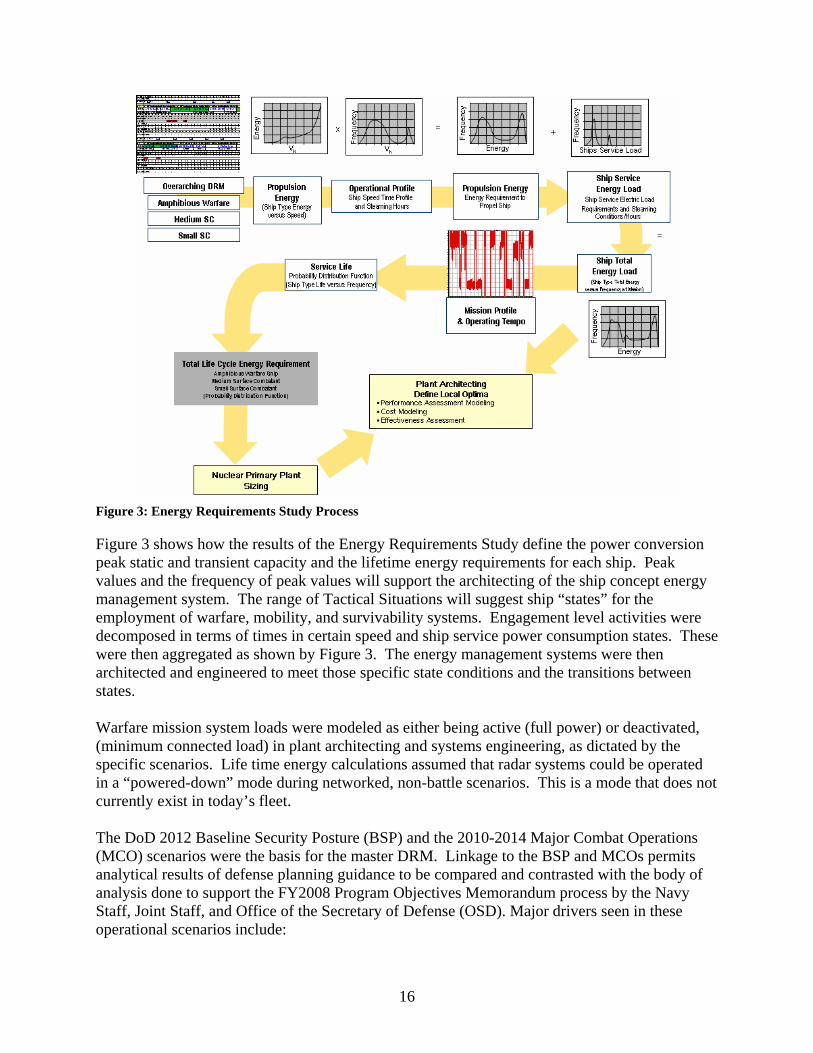
Figure 3: Energy Requirements Study Process
Figure 3 shows how the results of the Energy Requirements Study define the power conversion peak static and transient capacity and the lifetime energy requirements for each ship. Peak values and the frequency of peak values will support the architecting of the ship concept energy management system. The range of Tactical Situations will suggest ship “states” for the employment of warfare, mobility, and survivability systems. Engagement level activities were decomposed in terms of times in certain speed and ship service power consumption states. These were then aggregated as shown by Figure 3. The energy management systems were then architected and engineered to meet those specific state conditions and the transitions between states. Warfare mission system loads were modeled as either being active (full power) or deactivated, (minimum connected load) in plant architecting and systems engineering, as dictated by the specific scenarios. Life time energy calculations assumed that radar systems could be operated in a “powered-down” mode during networked, non-battle scenarios. This is a mode that does not currently exist in today’s fleet. The DoD 2012 Baseline Security Posture (BSP) and the 2010-2014 Major Combat Operations (MCO) scenarios were the basis for the master DRM. Linkage to the BSP and MCOs permits analytical results of defense planning guidance to be compared and contrasted with the body of analysis done to support the FY2008 Program Objectives Memorandum process by the Navy Staff, Joint Staff, and Office of the Secretary of Defense (OSD). Major drivers seen in these operational scenarios include:

17
1. Stressing Operational and Tactical Situations from MCO’s dictate the energy intensive future combat systems and the capability for high speed transits in future fleet operations.
2. The BSP and the MCO scenarios were used to model future fleet deployment and employment profiles for:
a. Presence at Home b. Presence Overseas c. Lesser Contingencies d. Major Combat Operations
These features together with overhaul and maintenance define the “Demand Signal” for the fleet and constitute the basis for the “Ship Lifetime Power Estimate.”
3. The Navy's 30-Year Shipbuilding Plan is informed by analysis performed by the Navy Staff using the DoD Analytic Agenda in coordination with the Joint and OSD Staff. This plan represents the Future Naval Force of the 313 ship Navy. The Alternate Propulsion Study fleet represents a different fleet architecture with different characteristics but roughly equivalent capability of the Navy’s 30-Year Shipbuilding Plan. Each ship is an energy demand surrogate for ships of similar type within the 313 ship Navy.
The results of the energy requirements study provided speed-time, steaming hour profiles, and ship service electrical demand signals for the three baseline ships. This information is required to set high level propulsion plant functional requirements, determine operations and support costs, as well as to determine the needed sustainment levels for fossil fuel ships and reactor lifetimes of nuclear plants. As a result of this analysis, it was determined that the reactor plants used in this study (existing non-developmental submarine and aircraft carrier designs) do provide life of ship cores; therefore, no reactor plant refuelings would be necessary. Three operating profiles were developed from DPS for the three ship types of the study. The low operating profile is the baseline scenario that models peacetime operations that are dominated by ordinary presence, training exercises and lesser contingency operations. The medium speed-time profile considers the addition of a single Major Combat Operation in a seven-year period to the baseline low operating profile. The high profile adds two Major Combatant Operations in a seven-year period to the baseline low operating profile. Historic operational demand signals for destroyers, cruisers and amphibious warfare ships over the seven-year period FY2000 through FY2006 were analyzed. Steaming hours underway reflect peacetime operation from FY2000 through FY2001, the FY2002 lesser contingency, and a peak in FY2003 reflecting a Major Combat Operation-like deployment. FY2004 through FY2006 reflects redistributed fleet ordinary presence in support of protracted MCO activity. Figure 4, Figure 5, and Figure 6 present the average ship steaming hours underway by year along with the number of ships operating each year. Noteworthy is a continued increase in steaming hours underway for ships after the recovery from the MCO-like event in FY2003. Both destroyers and cruisers have a steady decrease in steaming hours not underway over the period from FY2000 to FY2006 suggesting an increased operating tempo for Small and Medium Surface Combatant mission sets over time.

18
91 89 92 8981 79 79
0
500
1,000
1,500
2,000
2,500
3,000
3,500
2000 2001 2002 2003 2004 2005 2006Fiscal Year
Stea
ming
Hou
rs / Y
ear
0
20
40
60
80
100
120
140
Shi
ps /
Yea
r
Steaming Hours Underway Steaming Hours Not Underway Number of Ships
Figure 4: Destroyer and Frigate Average Historical Operational Tempo (2000-2006)
27 26 27 27 2724 23
0
400
800
1,200
1,600
2,000
2,400
2,800
3,200
3,600
2000 2001 2002 2003 2004 2005 2006Fiscal Year
Aver
age
Stea
min
g H
ours
/Y
ear
0
4
8
12
16
20
24
28
32
36
Shi
ps /
Yea
r
Steaming Hours Underway Steaming Hours Not Underway Number of Ships
Figure 5: Cruiser Average Historical Operational Tempo (2000-2006)

19
2223 23 23 23 23
22
0
500
1,000
1,500
2,000
2,500
3,000
3,500
4,000
4,500
2000 2001 2002 2003 2004 2005 2006Fiscal Year
Aver
age
Stea
min
g H
ours
/Y
ear
0
3
6
9
12
15
18
21
24
Shi
ps /
Yea
r
Steaming Hours Underway Steaming Hours Not Underway Number of Ships
Figure 6: Amphibious Ships Average Historical Operational Tempo (2000-2006)
Approximately 8% to 12% of surface combatant and amphibious warfare ships’ annual fuel consumption is historically consumed during the 20% to 30% of the steaming hours per year that a ship is not underway. Figure 7, Figure 8, and Figure 9, below, compare the low, medium and high operating profile steaming hours underway developed by the Energy Requirements Study with historic data. They provide a basis of comparison between the DPS derived and historic operating tempos in which 70% and 80% of the annual steaming hours in which a ship is underway and consuming 80% to 90% of its lifetime energy.

20
1,500
2,000
2,500
3,000
3,500
4,000
4,500
2000 2001 2002 2003 2004 2005 2006
Fiscal Year
Ste
amin
g H
ours
/ Ye
ar
Steaming Hours Underway Baseline Op-Tempo + 2 MCOsBaseline Op-Tempo + 1 MCO Baseline Op-Tempo + No MCOs
High Operating Tempo Profile
Medium Operating Tempo Profile
Low Operating Tempo Profile
Figure 7: Comparison of DD/DDG/FFG Historic and Modeled Steaming Hours Underway
Figure 7 compares the three DPS based operating tempos of the Small Surface Combatant with historic data for the FFG-7, DD-963, and DDG-51 Classes. The Small Surface Combatant steaming hours underway in peacetime conditions (low operating profile) are higher than those of the peer ships operating from FY2000 to FY 2002. Likewise the steaming hours underway for the single MCO operating profile (medium) are greater than peer ships historic performance in FY2003. This reflects the lower capability of the Small Surface Combatant’s light-destroyer mission suite (e.g., fewer Vertical Launch System cells, less capable radar suite) relative to the peer ships requiring greater numbers and steaming hours to conduct similar missions.

21
2,000
2,500
3,000
3,500
4,000
2000 2001 2002 2003 2004 2005 2006Fiscal Year
Ave
rage
Ste
amin
g H
ours
/ Y
ear
Steaming Hours Underway Baseline Op-Tempo + 2 MCOsBaseline Op-Tempo + 1 MCO Baseline Op-Tempo + No MCOs
High Operating Tempo Profile
Medium Operating Tempo Profile
Low Operating Tempo Profile
Figure 8: Comparison of CG-47 Historic and Modeled Steaming Hours Underway
Figure 8 compares the three DPS based operating tempos of the Medium Surface Combatant with historic data for the CG-47 Class. The historic CG 47 data validates the range selected for the Medium Surface Combatant.
1,500
2,000
2,500
3,000
3,500
4,000
4,500
2000 2001 2002 2003 2004 2005 2006Fiscal Year
Ave
rage
Ste
amin
g H
ours
/Y
ear
Steaming Hours Underway Baseline Op-Tempo + 2 MCOsBaseline Op-Tempo + 1 MCO Baseline Op-Tempo + No MCOs
Medium Operating Tempo Profile
High Operating Tempo Profile
Low Operating Tempo Profile
Figure 9: Comparison of Amphibious Warfare Ship Historic and Modeled Steaming Hours Underway

22
Figure 9 compares the three DPS based operating tempos of the Amphibious Warfare Ship with historic data for the peer amphibious warfare ships of the current fleet. Again, historic ship data validates the range selected for the amphibious warfare ships. The DPS derived operational tempos profiles provide a valid model for plant architecting, lifetime energy estimation, and determination of LCC based on the strong correlation with historic return data from surface combatant and amphibious warfare ships of the current fleet. Finally, electric loads for IPS and mechanical transmission variants of surface combatants and amphibious warfare ships were modeled in this study for mission specific load conditions. The electric loads for the Small Surface Combatant and Amphibious Warfare Ship are marginally higher than the electric loads of current navy similar ship types. In contrast, the Medium Surface Combatant’s 7 to 27 MW ship service loads associated with Summer Cruise and Battle conditions, respectively, represents a significant increase relative to current navy electric loads. The higher loads are reflective of next navy warfare mission system energy demands Plant architectures were developed using the electric loads with a 20% margin with a 20% design margin and a 20% service life allowance combined with mission consistent ship propulsion loads. 4.2 Ship Concepts Each concept has a designator with three letters plus one number, such as SFM-1. The first letter represents the type of ship (S=Small, M=Medium, A=Amphibious). The second letter represents the type of fuel (F=Fossil, N=Nuclear). The third letter represents the type of energy transmission system (M=Mechanical, I=Integrated Power System, H= Hybrid Mechanical Electric Transmission System). The number provides discrimination for other changes. The three baseline ships along with twenty variants with alternative propulsion systems are as shown in the Table 3 below. The shaded cells indicate a change from the baseline configurations:

23
Table 3: Ship Design Exploration Matrix
Small CombatantsSustained Transmission Primary Propulsion Secondary Propulsion Separate Ship Service Main Secondary
Speed (kts) Type Power Source Power Source Power Source Propulsor PropulsorSFM-1(Baseline) Diesel Engine Diesel GeneratorSFM-2 Gas Turbine Gas Turbine Gen.SFH-3 Diesel Engine 1 Shafted Prop APUSFM-5 Gas TurbineSFM-6 25 Diesel EngineSFM-7 35 Gas TurbineSNH-1 30SNH-2 25SFI-1 Diesel GeneratorSFI-2 Gas Turbine Gen.SFI-3 Diesel GeneratorSNI-1 Nuc Steam Turb Gen. NoneMedium CombatantsMFM-1(Baseline) Diesel Engine Diesel GeneratorMFM-2 Gas Turbine Gas Turbine Gen.MNM-1 Nuc Steam Turb None Nuc Steam Turb Gen. APUMFI-2 Diesel GeneratorMFI-3 Gas Turbine Gen.MFI-4 Diesel GeneratorMNI-1 Nuc Steam Turb Gen. None APUAmphibious ShipsAFM-1(Baseline) 25 Gas Turbine Diesel Engine Diesel Generator NoneANH-1 25 Nuc Steam Turb None Nuc Steam Turb Gen. APUAFI-1 25 Gas Turbine Gen. Diesel Generator N/A NoneANI-1 25 Nuc Steam Turb Gen. None Nuc Steam Turb Gen. APU
= Changed from the Baseline Design
= Baseline Design
Electric2 Shafted Props
Mechanical
Mechanical
Electric
30
None
None2 Shafted Props
N/AGas Turbine Gen.
Gas Turbine
Nuc Steam Turb Gen.
30
Diesel Generator
Nuc Steam Turb Gen.
Gas Turbine
MechanicalDiesel Engine
Nuclear Steam Turbine
Nuc Steam Turb Gen. APU
N/A
None
Electric Gas Turbine Gen.
1 Shafted Prop APU
2 Shafted Props None
1 Shafted Prop
Ship Designator
2 Shafted Props None
2 Shafted Props None
30
A basic description of the three baseline designs follows. 4.2.1 Small Surface Combatant The Small Surface Combatant (SSC) is designed around general frigate and destroyer mission capabilities. This conceptual class of warships is designed to be the workhorse of the future US Navy. Its primary role is to conduct protection of shipping missions such as convoy escort, maritime interdiction, and antisubmarine warfare. In addition, they have the capacity to perform littoral Antisubmarine Warfare (ASW) and Mine Warfare Ships (MIW) missions currently envisioned for the LCS. The SSCs are multi-mission ships with capability across all warfare areas; they are intended to be built in large numbers. The ship’s total installed power is approximately 60-80 Megawatts (MW) including propulsion and ship service power (variation due to differences in possible power system configurations). The SSC is designed with a sustained maximum speed of 30 knots and an endurance range of 5,000 nautical miles at 20 knots (placing it between the ranges of the FFG-7 and DD-963 Class ranges).13 The 24-hour electrical power load for SSC is approximately 2.5 MW with a maximum design load of approximately 5.7 MW.
13 Two of the Small Surface Combatants were designed to have sustained maximum speeds of 25 and 35 knots. This was done as a sensitivity analysis excursion which will be discussed in the “Cost of Speed” section of the report.
24
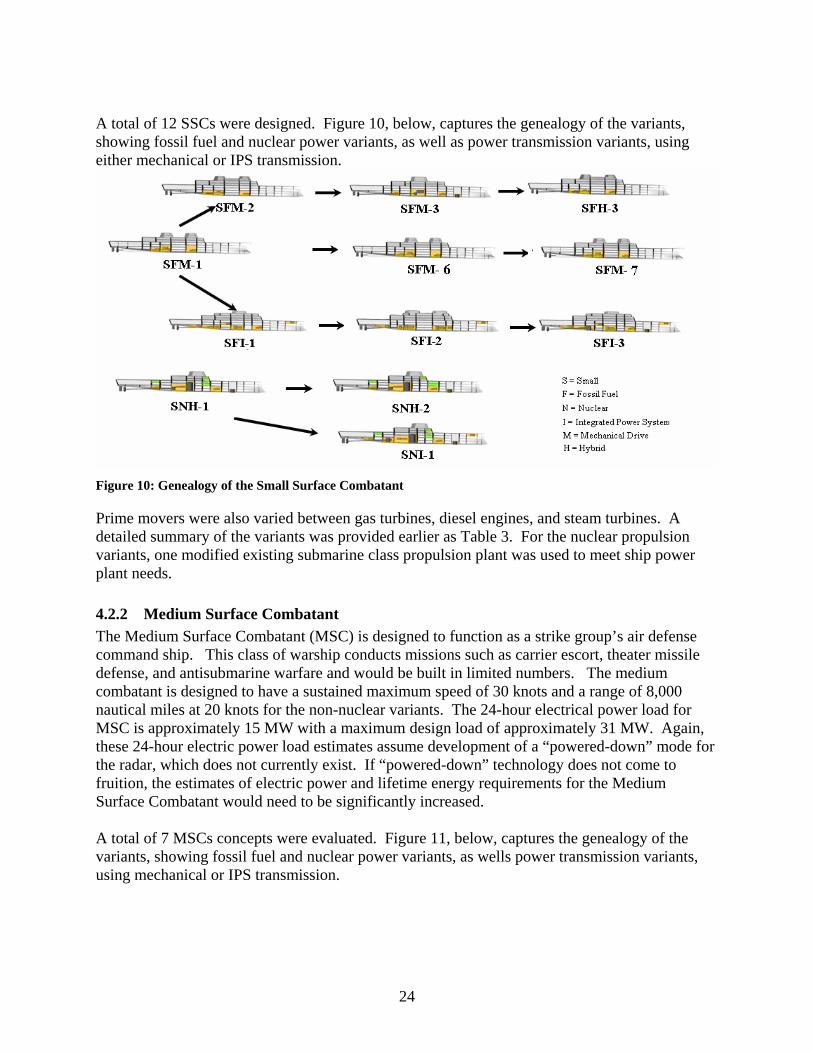
A total of 12 SSCs were designed. Figure 10, below, captures the genealogy of the variants, showing fossil fuel and nuclear power variants, as well as power transmission variants, using either mechanical or IPS transmission.
Figure 10: Genealogy of the Small Surface Combatant
Prime movers were also varied between gas turbines, diesel engines, and steam turbines. A detailed summary of the variants was provided earlier as Table 3. For the nuclear propulsion variants, one modified existing submarine class propulsion plant was used to meet ship power plant needs. 4.2.2 Medium Surface Combatant The Medium Surface Combatant (MSC) is designed to function as a strike group’s air defense command ship. This class of warship conducts missions such as carrier escort, theater missile defense, and antisubmarine warfare and would be built in limited numbers. The medium combatant is designed to have a sustained maximum speed of 30 knots and a range of 8,000 nautical miles at 20 knots for the non-nuclear variants. The 24-hour electrical power load for MSC is approximately 15 MW with a maximum design load of approximately 31 MW. Again, these 24-hour electric power load estimates assume development of a “powered-down” mode for the radar, which does not currently exist. If “powered-down” technology does not come to fruition, the estimates of electric power and lifetime energy requirements for the Medium Surface Combatant would need to be significantly increased. A total of 7 MSCs concepts were evaluated. Figure 11, below, captures the genealogy of the variants, showing fossil fuel and nuclear power variants, as wells power transmission variants, using mechanical or IPS transmission.

25
Figure 11: Genealogy of the Medium Surface Combatant
Prime movers were also varied between gas turbines, diesel engines, and steam turbines. A detailed summary of the variants was provided earlier as Table 3. For the nuclear propulsion variants, one modified next generation aircraft carrier propulsion plant was used to meet ship power plant needs. 4.2.3 Amphibious Warfare Ship The Amphibious Warfare Ship (AWS) is designed to carry one-third of a Marine Expeditionary Unit (MEU); therefore, three AWSs would form an Expeditionary Strike Group. The AWS is a surrogate for existing amphibious assault ships. The flight deck and hangar accommodate 17 CH-46 equivalent aircraft. The ship has the capability of operating CH-46, CH-53, V-22, and Short Takeoff and Vertical Landing Joint Strike Fighter aircraft. The AFM-1 is designed to have a sustained speed of 25 knots and a range of 10,000 nautical miles at 20 knots. The 24-hour electrical power load for AWS is approximately 7.6 MW with a maximum design load of approximately 16 MW. A total of 4 AWSs were designed. Figure 12, below, captures the genealogy of the variants, showing fossil fuel and nuclear power variants, as well as power transmission variants, using either mechanical or IPS transmission.
Figure 12: Genealogy of the Amphibious Warfare Ship

26
Prime movers were also varied between gas turbines and steam turbines. A detailed summary of the variants was provided earlier as Table 3. For the nuclear propulsion variants, one next generation aircraft carrier propulsion plant was used to meet ship power plant needs. 4.2.4 Manpower Analysis Rough order of magnitude manpower estimates for three baseline mechanical drive ships: the Small Surface Combatant, Medium Surface Combatant, and Amphibious Warfare Ship were developed using the Manpower Analysis and Prediction System (MAPS). MAPS is a total ship manpower assessment tool which analyzes total ship manpower requirements by mission, function, and functional workload for a ship configuration. Lastly, it applies functional workload to manpower determination rules and policy changes to arrive at a manpower estimate. Manpower estimates for engineering plant manpower requirements for nuclear fueled ships are based on single plant adaptations of current and recently designed propulsion plant manning models. IPS variants conservatively use the mechanical drive manpower estimates. The resulting estimates are shown in Table 4 and Table 5. The ship’s company is composed of those personnel aboard the ship dedicated to the operation of the ship. These numbers do not include detachments, embarked staff, or the like, which are not counted in the LCC estimate but would be the same across propulsion variants. Due to continuing decreases in nuclear powered submarine force levels as well as a fifty percent reduction in nuclear trained manning requirements for the CVN-78 class, the nuclear propulsion training pipeline would be more than capable of supporting increased manning needs in both the near term and longer. The training projection for a single ship class of those evaluated in this study would represent a less than 10% impact to the nuclear training pipeline, even without the benefits of reduced manpower needs in the current fleet. A long term evaluation of the nuclear training pipeline would be required should the Navy decide to wholesale changeover to nuclear power for the entire surface ship fleet. Table 4: Baseline Fossil Fueled Ship’s Company Manpower Requirements
SSC MSC AWSOfficers 20 20 64CPOs 8 19 82Enlisted 107 244 895Ship's Company 135 283 1041
Table 5: Baseline Nuclear Ship’s Company Manpower Requirements
SSC MSC AWSOfficers 25 25 69CPOs 13 22 83Enlisted 138 277 921Ship's Company 176 324 1073

27
5 COST AND OPERATIONAL EFFECTIVENESS OF ALTERNATIVES
5.1 Cost Analyses The cost analyses quantify the acquisition and LCC of each variant to support calculating the breakeven point of nuclear versus fossil fuel propulsion, as well as the cost deltas between various power and propulsion system architectures (e.g., diesels versus gas turbines, IPS versus mechanical transmission). The sections below detail the Assumptions and Methodology, the Procurement Cost, Fuel Burdening Method and Manpower Estimation, LCC Results and Analysis, Cost of Speed Analysis and Cost Analysis Insights. The breakeven analysis is provided in Section 6. 5.1.1 Assumptions/Methodology
Technical and Cost Estimating Relationships (CERs), assumptions and methods are as follows:
• Construction CERs for non-propulsion portions of each ship are common across platforms.
• Material costs for fossil fuel propulsion machinery are based on vendor quotes, return costs, or engineering analogy. Labor man-hours are based on DDG-51 Flight IIA, LHD-6 and LPD-17 Class Ships as appropriate.
• Material cost for nuclear equipment for both reactor and steam plant are based on vendor quotes, return costs, or engineering analogy. Propulsion plant labor hours are based on current and recently designed propulsion plants. Government-furnished warfare systems, electronics equipment, and ordnance were priced using engineering analogy with current ships that are similar and vendor quotes.
Economic and programmatic assumptions are:
• All estimates are rough order of magnitude and do not include the impacts of possible infrastructure requirements to include changes in the mix of nuclear and non-nuclear ships.
• No specific schedule for design and construction is assumed. Historic surface ship design and construction spans are assumed.
• All costs are in present value FY2007 dollars. • Labor rates are current forward pricing rates for the respective yards. • An assumption for shipbuilder profit is included. • Ship acquisition and LCC are based on 5th ship estimates (with two building shipyards for
surface combatants). Fuel burdening assumptions are:
• The baseline market price of fuel used in this analysis is $74.15 per BBL of crude oil, and its burdening buildup is shown below in Figure 13.

28
Figure 13: Fuel Burdening
• As the price of Crude Oil increases or decreases, the other elements of the burdened rate are assumed to remain constant with the exception of Oiler O&S / Charter costs. Fuel makes up 20% of the Oiler O&S / Charter costs; therefore, 20% is varied based on Crude Oil cost.
The following are LCC assumptions and methodology used in this report.
• The ranges of operating tempos are derived from the DoD DPS described in detail in Section 4.1.
• Manpower estimates are derived from the Manpower Analysis and Prediction System adjusted to reflect propulsion plant discrimination of billet numbers. Costs were estimated per billet for officers and enlisted using the Conceptual Operations Manpower Estimating Tool (COMET).
• Visibility and Management of Operating and Support Costs (VAMOSC) data was used in determining maintenance inactivation cost for non-nuclear variants. Nuclear variants reflect defueling and disposal costs based on actual data consistent with the single plant arrangement used in this study.
• The Nonrecurring Design and Engineering (NRE) effort was evaluated using a parametric approach to cost modeling. This approach considered the ship size, weight, outfitting density, degree of reuse design, and method of design. NRE was not applied in the breakeven analysis since ship quantity scenarios and a number of discriminating factors such as non-propulsion technologies, future military and industrial capabilities, specific phasing in of the new classes of ships, industrial scenario impacts, etc. were not determined within the scope of the study. These factors would have impact on the NRE estimates. That said, if NRE were applied, its inclusion would tend to have minimal impact on the overall breakeven analysis because of the relatively small marginal difference between the Nuclear and non-nuclear variant NRE estimates.
• The breakeven analysis of the study was performed in present FY 2007 dollars. If cost were first calculated in Then Year dollars, then further adjustments in the calculations would be required to convert to Net Present Value (NPV) terms. However, to calculate in Then Year dollars, one would have to determine the phasing of costs and apply assumed inflation rates with much uncertainty and speculation. This is particularly true

29
for future fossil fuel prices and items that are affected by fossil fuel prices. Thus the study approach opted for current prices that are considered present value.
• A breakeven analysis amortizes nonrecurring costs over a given quantity. Since the scope of the study did not assess quantity, the development cost of non-propulsion technologies, the beneficial impacts to the nuclear industrial base, nor the costs and time required to re-establish a nuclear surface ship construction capability, the results presented herein are meant to merely indicate conditions where nuclear propulsion can compete in future analyses. More detailed review would be required for specific tradeoffs.
5.1.2 Procurement Cost Figure 14, Figure 15, and Figure 16 show the acquisition cost estimates for the 5th ship of the class for each of the ship types.
$0.00
$0.25
$0.50
$0.75
$1.00
$1.25
$1.50
$1.75
SFM-1 SFI-1 SFM-2/5 SFI-2 SFM-3 SFI-3 SNM-1/2 SNI-1
Acq
uisi
tion
Cos
t (FY
07$B
)
Propulsion
Material & Labor
Ordnance & Electronics
Combined Diesels & Gas Turbine Powered
Single Shaft Ships with SPU
Gas Turbine Powered(SFM-5 Diesel Ship Service)
Nuclear Powered
Mechanical IPS Hybrid IPS Mechanical IPS Hybrid __ IPS
Figure 14: Small Surface Combatant Acquisition Cost – 5th Ship

30
$0.0
$0.5
$1.0
$1.5
$2.0
$2.5
$3.0
$3.5
$4.0
MFM-1 MFI-2/4 MFM-2 MFI-3 MNM-1 MNI-1
Acq
uisi
tion
Cos
t (FY
07$B
)
Propulsion
Material & Labor
Ordnance & Electronics
Combined Diesels & Gas Turbine Powered
Gas Turbine Powered Nuclear Powered
MechanicalMechanicalMechanical IPS IPSIPS
Figure 15: Medium Surface Combatant Acquisition Cost – 5th Ship
$0.0
$0.5
$1.0
$1.5
$2.0
$2.5
$3.0
AFM-1 AFI-1 ANM-1 ANI-1
Acq
uisi
tion
Cos
t (FY
07$B
)
Propulsion
Material & Labor
Ordnance & Electronics
Fossil Fuel Nuclear Powered
Mechanical IPS Hybrid ___ IPS
Figure 16: Amphibious Warfare Ship Acquisition Cost – 5th Ship

31
Table 6 shows that the nuclear acquisition cost premium for the three ship types is roughly $600M to $800M. The acquisition cost premium of the nuclear propulsion plant options include the cost of the reactor cores that power the ship throughout its service life. This is a very important distinction when addressing LCC. The naval nuclear propulsion program is actively working to reduce the cost of propulsion plant Government Furnished Equipment (GFE) for VIRGINIA Class submarines. If successful this would provide acquisition cost savings that would be realized in surface ship nuclear propulsion plant GFE. Should these efforts realize the expected 10% reduction in up front cost savings, $32M savings for SSN21 Class plant and $53M savings for a CVN-78 Class plant would reduce the nuclear acquisition cost premium by 2 to 4% for the nuclear powered ships in this study. Table 6: Acquisition Cost Premium for Nuclear vs. Fossil Fuel
Small Surface Combatant
Medium Surface
Combatant
Amphibious Warfare Ship
Nuclear Acquisition
Cost Premium (FY07)
$604M
$656
$809
Nuclear Acquisition
Premium (% of Ave
Fossil Fuel Ship Cost)
80%
22%
46%
Table 7 shows that the acquisition cost premium for IPS is roughly $30M for Small Surface Combatants and Amphibious Warfare Ships, and roughly $110M for the Medium Surface Combatant ship. On a percentage basis, IPS is estimated to add about 4% to the cost of a combatant and about 1% to the cost of the Amphibious Warfare ships. IPS vs. Mechanical / Hybrid Drive is thus not a significant discriminator for the acquisition costs of the ships studied. Table 7: Acquisition Cost Premium for IPS vs Mechanical / Hybrid Drive
Small Surface Combatant
Medium Surface
Combatant
Amphibious Warfare Ship
IPS vs. Mechanical / Hybrid Drive Cost Premium
(FY07)
$32M
$113
$28
IPS Acquisition Premium
(% of Mechanical / Hybrid Drive
Ave Cost)
4%
4%
1%

32
Table 8 shows that for fossil fueled ships, the acquisition cost difference between diesel and gas turbine cruise plants is very small. Table 8: Acquisition Cost Premium for Gas Turbine vs Diesel Cruise Engine
Small Surface Combatant
Medium Surface
Combatant
Amphibious Warfare Ship
Gas Turbine vs Diesel Cruise Engine Cost
Premium (FY07)
$4M
$10
N/A
Gas Turbine Cruise
Acquisition Premium
(% of Diesel Ave Cost)
< 1%
< 1%
N/A
Table 9 shows that for the Small Surface Combatant, the acquisition cost premium of two propulsion shafts is roughly 3%. The number of shafts is thus not a significant discriminator for acquisition cost. Table 9: Acquisition Cost Premium for 2 propulsion shafts vs 1 shaft
Small Surface Combatant
Medium Surface
Combatant
Amphibious Warfare Ship
2 Shaft vs. 1 Shaft Cost Premium (FY07)
$21M
N/A
N/A
2 Shaft Acquisition
Premium (% of 1 Shaft
Ave Cost)
3%
N/A
N/A
5.1.3 Life-cycle Cost Results and Analysis The LCC at an assumed fuel price of $74.15/BBL for the small, medium and amphibious variants are summarized in Figure 17, Figure 18, and Figure 19. Figure 17 includes only the 30 knot Small Surface Combatant variants; this allows accurate comparisons of equal capability.

33
Figure 17: Small Surface Combatant Life-cycle Cost – 5th Ship
Figure 18: Medium Surface Combatants Life-cycle Cost – 5th Ship
$1.7

34
Figure 19: Amphibious Warfare Ship Life-cycle Cost – 5th Ship
Table 10 shows the LCC Premium for nuclear propulsion compared to fossil fuel propulsion, expressed in terms of percentage. Table 10: Life-cycle Cost Premium for Nuclear vs Fossil Fuel
$74.15/BBL Crude High to Low OPTEMO
Small Surface Combatant
Medium Surface
Combatant
Amphibious Warfare Ship
Nuclear LCC Premium
(% of Ave Fossil Fuel Ship LCC)
17%
to 37%
0% to
10%
7% to
8%
This can be read off of Figure 20, Figure 21, and Figure 22 at a crude oil cost of $74.15/BBL.

35
Table 11 shows that for the Medium Surface Combatant and the Amphibious Warfare Ship, the Life-cycle Cost premium associated with IPS is less than 2% and is thus not a significant discriminator. For the Small Surface Combatant, the 5-6% IPS LCC premium must be considered against operational benefits. Table 11: Life-cycle Cost premium for IPS vs. Mechanical / Hybrid Drive
74.15/BBL Crude High to Low OPTEMO
Small Surface Combatant
Medium Surface
Combatant
Amphibious Warfare Ship
IPS vs. Mechanical / Hybrid Drive LCC Premium
(FY07)
$117M
to $108M
$72M
to $109M
$50M
to $9M
IPS LCC Premium
(% of Mechanical / Hybrid Drive
Ave LCC)
6% to
5%
1% to
2%
< 1%
Table 12 shows the benefit of diesel cruise engines. For the Small Surface Combatant, a diesel cruise engine plant is essentially acquisition cost neutral with respect to a gas turbine cruise engine plant, but will save roughly 8 to 10% in life-cycle cost. To a lesser extent, the same situation holds with the Medium Surface Combatant with LCC savings from 5 to 6%. Therefore, from a LCC standpoint, diesel cruise engines should be considered in the design of future fossil fueled shipboard propulsion plants. Table 12: Life-cycle Cost Premium for Gas Turbine vs Diesel Cruise Engine
$74.15/BBL Crude High to Low OPTEMO
Small Surface Combatant
Medium Surface
Combatant
Amphibious Warfare Ship
Gas Turbine vs Diesel Cruise Engine LCC
Premium (FY07)
$213M
to $179M
$369M
to $247M
N/A
Gas Turbine Cruise LCC
Premium (% of Diesel Ave LCC)
10%
to 8%
6% to
5%
N/A

36
Table 13 shows that for the Small Surface Combatant, the LCC premium of two propulsion shafts is roughly 3%. Thus, while the number of shafts is not a significant discriminator for either acquisition or LCC of the small combatant studied, the potential for cost reductions suggests that single shaft options should be included in future machinery plant trade-offs, especially if podded auxiliary propulsors can be incorporated. Table 13: Life-cycle Cost Premium for two propulsion shafts vs one shaft
$74.15/BBL Crude High to Low OPTEMO
Small Surface Combatant
Medium Surface
Combatant
Amphibious Warfare Ship
two Shaft vs. one Shaft LCC
Premium (FY07)
$58M
to $54M
N/A
N/A
two Shaft LCC Premium
(% of 1 Shaft Ave LCC)
3%
N/A
N/A
5.1.4 The Cost of Speed A sensitivity analysis was performed to examine the cost of speed. The baseline Small Surface Combatant was designed with a sustained speed of 30 knots, similar to surface combatants in the fleet today. Accordingly, an excursion is included in which two of the Small Surface Combatants were designed to have sustained speeds of 25 and 35 knots. The results of this analysis are shown in Table 14. These costs represent deltas from the costs for the baseline Small Surface Combatant. LCC savings of less than 3% are realized by lowering the sustained speed to 25 knots. Increasing the sustained speed to 35 knots results in a LCC cost premium of between 7 and 9%. Table 14: The Cost of Speed
$74.15/BBL Crude High to Low OPTEMO
Acquisition Cost Delta from
Baseline 30 knots
LCC Delta from Baseline 30 knots
Speed reduced to 25 knots
-$59M (-8%)
-$30M (-2%) To
-$60M (-3%)
Speed incresased to 35 knots
+$79M (+10%)
+$180M (9%) To
+$140M (7%)
5.1.5 Cost Analysis Insights Acquisition cost premiums for nuclear propulsion compared to fossil fuel propelled ships for the various ship concepts are:
o Small Surface Combatants ~ 80% (~$600M) o Medium Surface Combatants ~ 22% ($600-$700M) o Amphibious Warfare Ships ~ 46% (~$800M)

37
The nuclear propulsion ship acquisition costs include the cost of the nuclear fuel for the entire service life of the ship. The LCC premium of nuclear power for the Medium Surface Combatant and Amphibious Warfare Ships is projected to be less than ten percent. During the CVN(X) Analysis of Alternatives (AoA), the Navy was willing to pay an additional ten percent premium for nuclear power because of the added operational effectiveness of nuclear power for the aircraft carrier missions. While the operational value of nuclear power depends on the specific mission requirements of each ship type, this analysis suggests that nuclear power should be considered and evaluated in future ship designs similar to the Medium Surface Combatant and Amphibious Warfare Ships. For the Small Surface Combatant, and to a lesser extent the Medium Surface Combatant, diesel cruise engines have a LCC advantage over gas turbine cruise engines in the fossil fuel alternatives. Unless gas turbine cruise engines provide significant operational advantage, diesel cruise engine options should be considered for future shipboard propulsion plant designs. Neither the Integrated Power System (IPS) versus mechanical / hybrid power transmission architectures nor the single versus twin propulsion shaft trade-offs showed significant acquisition or LCC differences. Because the single vs. twin propulsion shaft trade-off was only studied for the small combatant, these results should not be generalized for all ship designs. Future propulsion plant trade-offs should consider single shaft options. The inclusion of IPS should also be evaluated based on operational effectiveness. 5.2 Operational Effectiveness Analysis Results
The Operational Effectiveness analyses quantify the impact of alternate propulsion and power architectures on the operational effectiveness of the three ship types studied. Elements of Operational Effectiveness that were modeled were Warfare Area Mission Effectiveness, Surge to Theater, Operational Presence, and Vulnerability. Operational context is provided from a subset of the DoD DPS used to determine the lifetime energy demand signals for the three ship types. Reference (e) provides quantifiable comparisons of mobility effectiveness for the peer ship types with alternative propulsion plants in operational scenarios. Reference (f) (SECRET) provides the results of vulnerability analyses. Reference (g) provides the analysis of Warfighting operational effectiveness analyses.
5.2.1 Warfare Area Mission Effectiveness Warfare Area Mission Effectiveness is evaluated as the percentage of missions completed by a variant in three tactical scenarios. The ship performance parameters and capabilities modeled in this analysis were: radar cross section, ship speed, ship acceleration, and ship turning. The warfare scenarios were small boat interdiction/denial of access and missile defense. The tactical situation engagements were short duration events. The variation in electrical and propulsion plant architectures did not significantly change the outcome of the engagements at the gross level of evaluation.

38
The warfare systems energy demands for next navy ships that were modeled were not stressors to ship propulsion and power system components14. Warfare mission systems being considered for the navy after next are expected to place higher transient load demands on the ship’s power system. Once the powering characteristics of these future warfare mission systems are known, the Navy anticipates that this method of analysis will help determine the impact of power system transients on Warfare Area Mission Effectiveness. This method will also enable the evaluation of non-concurrent mission capability. Current plant power sizing criteria requires that the power generating plant be sized to meet the sustained maximum speed requirement (i.e. propulsion load) plus the maximum connected load (mission plus ship service loads) with design/construction and service life margins. Depending on the ship’s mission, these two conditions may not occur concurrently within the operational context of the design. In that case, the power generating plant can be sized to meet the worst case propulsion load and margined mission loads that occur simultaneously15. In the case of high-energy radars, allowing for non-concurrency could mean that one less prime mover is needed for a ship design compared with that required by current criteria. The capabilities modeled however, did not create significant discrimination in Warfare Mission Area Effectiveness. 5.2.2 Surge to Theater For the purposes of this study, Surge to Theater was evaluated in two ways: 1) in terms of the number of refuelings and the amount of fuel required to reach a theater of operations from a homeport at maximum surge speeds of 30 knots for Small and Medium Surface Combatants and 25 knots for Amphibious Warfare Ships, and 2) the best speed attainable for those ships without refueling. Both metrics are very significant to naval operations and force structure as they drive the required number of fleet oilers, the ships which must be staged to provide underway replenishment of fuel. Systems that provide high-energy storage capacity and density, high energy conversion (i.e. engine) efficiencies and high thrust generation (i.e. propulsor) efficiencies improve these metrics. Of great significance are the numbers of propulsion architectures that provide more operational flexibility than the pure gas turbine architecture of SFM-2, which is the architecture in the fleet today. It should also be noted that this analysis assumed that ships refueled when they had burned 50% of the fuel in their tanks. The fleet is more conservative than this, which would only drive up the number of underway replenishments, and hence increase the demands on oiler infrastructure. Nuclear powered ships are superior to all fossil fuel variants in the transit scenarios modeled as non-nuclear surface combatants required between 2-3 refuelings to support a surge from CONUS to the Mediterranean Sea. Other technologies providing high levels of performance relative to the mission timeliness metric are diesel prime movers and single screw propulsors. 14 Pulsed electromechanical weapons such as the rail gun and some potential theater ballistic missile defense radar alternatives with higher energy demands were not considered in this analysis. 15 See discussion in Section 4.1.

39
With the current and expected increase in energy-intensive ship service electrical loads (high energy radar systems, ship self defense systems, etc.) a much more detailed analysis of a ship’s energy demands is required. A methodology to do this was applied in this study as was discussed in Section 4.1. Historically, fossil fueled ship’s fuel tanks were sized based on the ship’s range requirements since electrical loads were relatively small. However, this is no longer the case. Proper sizing of ship’s fuel tanks requires analysis of real-time electrical loads combined with propulsion loads in an operational context. Increased fuel tankage could be pursued to improve endurance of the fossil fuel variants; however, this will result in higher acquisition and LCC than those of the ships analyzed in this study. In this version of the surge analysis, the 50% fuel burn restriction is lifted and the ships are evaluated over an approximately 4,200 nautical mile transit. Again, the nuclear variants exhibited the best operational performance with most efficient fossil fuel surface combatant maximum transit speeds ranging from 70 to 90% of the nuclear variants. None of the variants that used only gas turbines as their principal means of producing mobility power were able to make the transit. Combined diesel and gas turbine plants in either pure or hybrid IPS architectures exhibited the best performance of the fossil fueled ships. This analysis does not consider the need for other underway replenishments for non-fuel stores (e.g., food, other consumables) which could be either connected (traditional) or vertical (via aircraft). 5.2.3 Operational Presence Operational Presence is evaluated as the time a ship variant can remain on station while conducting missions in theater. As discussed earlier, DoD DPS provided the basis for the speed time profile and ship service electric loads modeled in the Operational Presence analysis. Battle loads (Condition 1) were modeled in-theater and summer cruising loads with radars on (Condition 3) were modeled in transit to and from the Sea Base refueling point. The nuclear powered variants are superior to fossil fuel powered variants in providing operational presence on station limited only by ship stores capacity. Fossil fuel plant variants provide between 89% and 95% of the nuclear powered plant operational presence for small surface combatants and between 87% and 90% of the medium nuclear powered surface combatant. Fossil fuel plant variants with diesel prime movers have a significant advantage over gas turbine variants. The best performing fossil fuel variant is SFH-3, the fossil fuel mechanical-electric drive single shaft hybrid variant. This variant best captures the system efficiencies and flexibility provided by an IPS system. Similar improvements in operational presence can be expected by employing hybrid IPS architectures. The hybrid architecture was not modeled in the other fossil fuel baselines (MFM-1 and AFM-1). Again, increased fuel tankage could be pursued to improve fossil fuel variants operational presence at increased acquisition and LCC. 5.2.4 Vulnerability Vulnerability is evaluated as the probability of losing mission capability following damage from threat weapons. This analysis purposely looked at the ability of the various options to sustain
40
hits. Ship susceptibility (i.e., ability of ship to avoid being hit) was not modeled in this study. Therefore, any benefits of propulsion plant concepts that decrease ship susceptibility (high sustained speed, fewer refueling, and signature impacts) were not evaluated. The primary focus of this analysis was the Small Surface Combatant, because the smaller size of the platform is likely to exacerbate those stressors that drive vulnerability successes or failures. In all, 12 variants were evaluated for the Small Surface Combatant. The Medium Surface Combatant was assessed using analysis by analogy. The vulnerability assessment results of the Small Surface Combatant are analogous because the extent of damage resulting from the threat weapons associated with DoD DPS do not discriminate between the relatively small differences in ship subdivision sizes or in the high-level compartment de-activation logic for both ships. Results of ship vulnerability assessment studies suggest that power and propulsion systems and architectures reduce ship vulnerability through:
• Redundancy • Zonal (vertical and longitudinal alignment between energy sources and loads) distribution systems • Separated distribution of propulsion systems (Auxiliary or Secondary propulsors located at the forward end of the ship) • Flexible energy conversion systems (electric or steam integrated power systems) providing for distributed conversion architectures.
5.3 Insights on Cost and Effectiveness Analyses For the Small Surface Combatant, the diesel cruise engine variants were superior to the gas turbine variants in the Surge to Theater and the Operational Presence Analysis. This result, coupled with the LCC advantage of the diesel cruise engine variant suggests that ships similar to Small Surface Combatants should seriously consider diesel cruise engines. For the small fossil fuel surface combatants, the reduced fuel usage, the reduced number of required refuelings, and the best unrefueled transit speed (for fossil fuel alternatives) in the Surge to Theater analysis, coupled with the high percent time on station in the operational presence analysis, and slightly lower LCC of the single shaft variant suggests that future Small Surface Combatants consider a single shaft propulsion plant with a longitudinally separated secondary propulsion unit. For the fossil fueled Medium Surface Combatant, the LCC savings of the diesel cruise engines coupled with the superiority of this configuration in the Surge to Theater and Time on Station analysis suggest that future ship concepts similar to Medium Surface Combatants consider diesel cruise engines. This represents the possibility of LCC savings in the range of 44% for the single shaft and 30% for the twin shafted small combatant, as well as 31-33% for the medium combatant. Longitudinally separated propulsors as enabled by IPS and hybrid propulsion plants were the single largest discriminator among Small Surface Combatant peers in the vulnerability analysis. Since the LCC analysis did not significantly discriminate between IPS and mechanical drive

41
plants, small and medium (by analogy) surface combatant designs should consider IPS and hybrid propulsion plants. The vulnerability reduction (and other benefits) due to IPS comes at a LCC premium of less than 6% for the Small Surface Combatants, 2% for the Medium Surface Combatant, and less than 1% for the Amphibious Warfare Ship. For the Medium Surface Combatant and the Amphibious Warfare Ship, the superiority of the nuclear variants in the Surge to Theater analysis and Operational Presence analysis comes at a LCC premium of less than 10%, but an acquisition cost premium of 22% and 46%, respectively.

42
6 BREAK EVEN ANALYSIS FOR NUCLEAR PROPULSION ALTERNATIVES
Based on the fuel usage projections inherent in this study, the break even costs per barrel of fossil fuel at which nuclear propulsion becomes economical for the various options are:
o Small Surface Combatants: $210/BBL to $670/BBL o Medium Surface Combatants: $70/BBL to $225/BBL o Amphibious Warfare Ships: $210/BBL to $290/BBL
Break even regions are defined for the high (baseline plus two MCOs) and medium (baseline plus one MCO) operational tempos. Analysis provided in Section 4.1 correlates historic and DPS derived steaming hours underway over the period from FY2000 through FY2006. The ship type demands during this period strongly correlate with the medium operational tempo (baseline plus one MCO) excepting the addition of the FY2002 lesser contingency. The range of breakeven costs for each ship concept are driven by both OpTempo and propulsion plant efficiencies. The higher OpTempo includes two MCOs in a seven-year period, a likely stressing scenario outside of historical precedent. Therefore, the lower breakeven costs are less likely to be realized if historic trends continue. The more likely range of breakeven costs based on historical precedent are bounded by the one MCO, medium OpTempo. For example, while the medium surface combatant breakeven range is $70/BBL - $225BBL, the more likely range is $115/BBL - $225BBL based on historical precedent. Figure 20, Figure 21, and Figure 22 show the breakeven analysis comparing the LCC of a nuclear variant to fossil fuel variants for increasing crude oil costs. The breakeven point, where the costs for the nuclear and fossil fuel variants are the same, depends on the ship’s power requirements, operational tempo, ship mission, ship design characteristics, and service life. In this analysis, the variation in break even points is dominated by operating tempo and by the machinery configuration of the propulsion and electrical plant. In the three following graphs, the upper and lower red fossil fuel lines bound the fossil fuel power and propulsion architecture trade space. Some architectures lie firmly in the middle of this trade space, while others may be quite close to the upper or lower bounds. These charts should not be taken as absolutes, but rather as relative indicators of the feasible trade space. The lower line on these three graphs is generally indicative of the most efficient power and propulsion architecture operating at the lower operating tempo; similarly the higher number represents the least efficient architecture and higher operating tempo. Changes in assumptions/projections of fuel usage for the various ship concepts will significantly impact these break even costs.
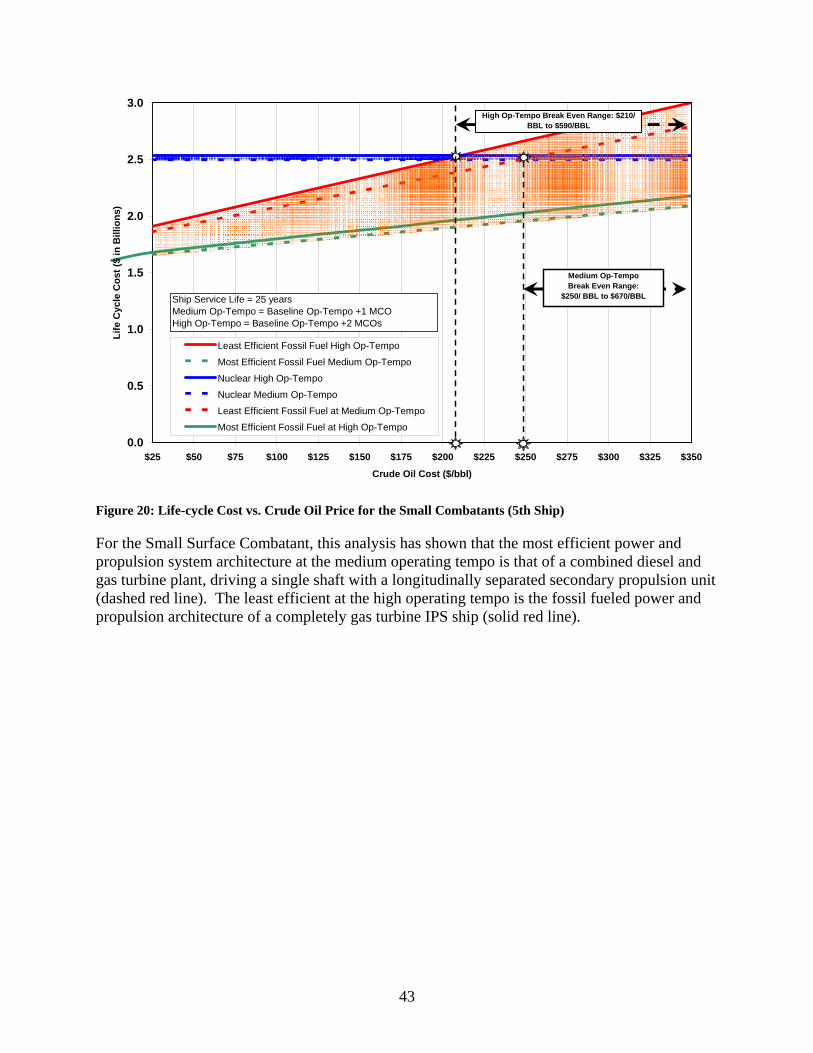
43
Figure 20: Life-cycle Cost vs. Crude Oil Price for the Small Combatants (5th Ship)
For the Small Surface Combatant, this analysis has shown that the most efficient power and propulsion system architecture at the medium operating tempo is that of a combined diesel and gas turbine plant, driving a single shaft with a longitudinally separated secondary propulsion unit (dashed red line). The least efficient at the high operating tempo is the fossil fueled power and propulsion architecture of a completely gas turbine IPS ship (solid red line).
0.0
0.5
1.0
1.5
2.0
2.5
3.0
$25 $50 $75 $100 $125 $150 $175 $200 $225 $250 $275 $300 $325 $350
Crude Oil Cost ($/bbl)
Life
Cyc
le C
ost (
$ in
Bill
ions
)
Least Efficient Fossil Fuel High Op-Tempo
Most Efficient Fossil Fuel Medium Op-Tempo
Nuclear High Op-Tempo
Nuclear Medium Op-Tempo
Least Efficient Fossil Fuel at Medium Op-Tempo
Most Efficient Fossil Fuel at High Op-Tempo
Ship Service Life = 25 yearsMedium Op-Tempo = Baseline Op-Tempo +1 MCOHigh Op-Tempo = Baseline Op-Tempo +2 MCOs
High Op-Tempo Break Even Range: $210/ BBL to $590/BBL
Medium Op-Tempo Break Even Range:
$250/ BBL to $670/BBL

44
Figure 21: Life-cycle Cost vs. Crude Oil Price for the Medium Combatants (5th Ship)
For the Medium Surface Combatant, this analysis has shown that the most efficient power and propulsion system architecture at the medium operating tempo is an architecture that uses diesel engines at cruise speeds (dashed red line). The least efficient fossil fueled power and propulsion architecture at the high operating tempo uses gas turbines at cruise speeds (solid red line)
0.0
0.5
1.0
1.5
2.0
2.5
3.0
3.5
4.0
4.5
5.0
5.5
6.0
6.5
7.0
7.5
8.0
$25 $50 $75 $100 $125 $150 $175 $200 $225 $250 $275 $300 $325 $350
Crude Oil Cost ($/bbl)
Life
Cyc
le C
ost (
$ in
Bill
ions
)
Least Efficient Fossil Fuel High Op-TempoMost Efficient Fossil Fuel MediumOp-TempoNuclear High Op-Tempo
Nuclear Medium Op-Tempo
Least Efficient Fossil Fuel at MediumOp-TempoMost Efficient Fossil Fuel at High Op-Tempo
High Op-Tempo Break Even Range:
$70/ BBL to $155/BBL
Ship Service Life = 35 yearsMedium Op-Tempo = Baseline Op-Tempo +1 MCOHigh Op-Tempo = Baseline Op-Tempo +2 MCOs
Medium Op-Tempo Break Even Range:
$115/ BBL to $225/BBL

45
Figure 22: Life-cycle Cost vs. Crude Oil Price for the Amphibious Ships (5th Ship)
For the conventional Amphibious Warfare Ship, which has a combined gas turbine and diesel powered IPS and mechanical architectures, the range in breakeven prices is relatively tight for these ship versus other fossil fueled ship classes studied. This is due to the smaller set of designs studied and relatively small difference in propulsion transmission efficiencies at this scale. The primary driver seen here is operational tempo profile.
0.00.51.01.52.02.53.03.54.04.55.05.56.06.57.07.58.08.59.09.5
10.0
$25 $50 $75 $100 $125 $150 $175 $200 $225 $250 $275 $300 $325 $350
Crude Oil Cost ($/bbl)
Life
Cyc
le C
ost (
$ in
Bill
ions
)
Fossil Fuel High Op-Tempo
Fossil Fuel Medium Op-Tempot
Nuclear High Op-Tempo
Nuclear Medium Op-Tempo
Ship Service Life = 40 yearsMedium Op-Tempo = Baseline Op-Tempo +1 MCOHi h O T B li O T 2 MCO
Break Even Range: $210/BBL to $290/BBL

46
CONCLUSIONS AND RECOMMENDATIONS In response to Section 130 of the Fiscal Year 2006 National Defense Authorization Act, the Navy evaluated alternative propulsion methods for Small and Medium Surface Combatants and Amphibious Warfare Ships. Twenty three ship concepts were developed and analyzed in terms of acquisition cost, LCC, and operational effectiveness. The different concepts varied power and propulsion technologies including nuclear power, gas turbines, diesel engines, mechanical power transmission systems, hybrid power transmission systems, integrated power transmission systems, combined power plants, and various propulsor systems. The major conclusions of the report are:
• Mission and operating requirements drive the need for particular power and propulsion system architectures, not ship displacement. For instance, it was found that ships with constant, high demands for energy may benefit from nuclear power, whereas ships with constant low demands for energy may be more suitable with combined diesel and gas turbine plants with hybrid power transmission systems (such as a single shaft with a secondary propulsion unit).
• Based on the mission requirements assumed in this study, the LCC premiums for nuclear
propulsion compared to fossil fuel propulsion, expressed in terms of percentage, for the various ship concepts are:
o Small Surface Combatants: 17% to 37% o Medium Surface Combatants: 0% to 10% o Amphibious Warfare Ships: 7% to 8%
• Acquisition cost premiums for nuclear propulsion compared to fossil fuel propelled ships for the various ship concepts are:
o Small Surface Combatants: ~ 80% (~$600M) o Medium Surface Combatants ~ 22% ($600-$700M) o Amphibious Warfare Ships ~ 46% (~$800M)
The nuclear propulsion ship acquisition costs include the cost of the nuclear fuel, which last for the entire service life of the ship.
• Based on the fuel usage projections for the ships in this study, the break even costs per
barrel of fossil fuel for the various options are: o Small Surface Combatants: $210/BBL to $670/BBL o Medium Surface Combatants: $70/BBL to $225/BBL o Amphibious Warfare Ships: $210/BBL to $290/BBL
The range of breakeven costs for each ship concept are driven by both OPTEMPO and propulsion plant efficiencies. The higher OPTEMPO includes two MCOs in a seven year period, a likely stressing scenario outside of historical precedent. Therefore, the lower breakeven costs are less likely to be realized if historical trends continue. The more likely range of breakeven costs based on historical precedent are bounded by the one MCO, lower OPTEMPO. For example, while the medium surface combatant breakeven range is $70/BBL - $225/BBL, the more likely range is $115/BBL - $225/BBL based on historical precedent.

47
• Ship vulnerability can be reduced by the employment of redundancy, zonal distribution,
longitudinal separation of prime movers and propulsors (e.g., auxiliary propulsor units) and use of flexible energy conversion (e.g., integrated propulsion systems) of power and propulsion systems.
• The number of refuelings (independent of other stores replenishments) and the amount of
fuel required by ships surging to theater is reduced by efficient energy conversion systems and high energy densities. The most effective means to achieve this operational effectiveness advantage are:
o Nuclear energy. o Propulsor systems that maximize propulsor efficiency and reduce drag by
minimizing the number of shafts/screws, or in the future, incorporating podded propulsors and/or low drag hull forms.
o Plant architectures matched to operational requirements. o Large fuel tankage capacities.
• Sustainability, measured by time on station and low speed operations, is enhanced by energy efficient plant architectures. The most effective architectures include:
o Nuclear energy. o Diesel engines and generators alone or in combined power plants with boost gas
turbine prime movers if high speed is also a requirement. (Fuel cells could provide similar benefits if the technology matures.)
o Integrated power and propulsion systems.
• Nuclear propulsion systems are technically feasible for small and medium combatants and for amphibious ships using existing reactor designs. The scope of this study did not include costs or time required to re-establish a nuclear surface ship construction capability. Likewise, this study did not include beneficial impacts to the nuclear industrial base from increased surface ship workload.
• Nuclear propulsion options provide operational advantages in surge to theater and time
on station for all variants studied. These operational advantages are even more pronounced for scenarios of high energy demand over long durations in tactical situations (e.g., high-power radars, high speeds, and electric weapons and sensors). Trends in ship weapons and sensors toward significantly higher power and energy demands will further highlight these advantages.
• Significant growth in electrical power loads to support future sensors and weapons will
be required to address projected threats and will have major impacts on ship power and propulsion architectures and fuel requirements. This will require a more detailed understanding of future operational requirements to better inform the selection of power and propulsion architectures and components. As energy requirements for these loads increase, the value of efficient next generation systems increases.

48
The major technical recommendations of the report are as follows: • The Navy should continue to use the methods and processes developed for this study in
future ship analysis for future ships to evaluate the operational effectiveness of propulsion and power systems. Future studies will consider including quantifiable analyses of ship vulnerability, sustainability, and timeliness that can be evaluated against acquisition and LCC. This is especially critical where emerging commercial energy and propulsion technologies are being considered for warship applications.
• The Navy should consider ship options with nuclear power and combined plant
architectures (e.g., diesels combined with gas turbine boost) in studies for future ships performing missions assigned to surface combatants and amphibious warfare ships.
• The Navy should continue to invest in RDT&E efforts to improve affordability, power
density and efficiencies of technologies for Naval ship power generation (e.g., fuel cells), power distribution, propulsion transmissions, and technologies to reduce hull drag.
• The Navy should invest in RDT&E for propulsors providing improved efficiency and
increased longitudinal segregation.

49
REFERENCES AND ABBREVIATIONS
(a) NAVSEA Concept Study Report, CNOG 2005-068 Sea Basing: Alternate Propulsion for Submarines and Surface Combatants, Webster, James S., Ser 05D/Ser062, dated March, 2006 (NOFORN).
(b) Sea Power 21 Chief of Naval Operations Guidance, 2005, Winning the Fight and Bridging to the Future, Item 068.
(c) NAVSEA 05D Ship Studies Extent of Effort Scale, Ser05D/023, 31 January 2005. (d) Annual Long Range Plan for Construction of Naval Vessels for FY2007 (30-Year
Shipbuilding Plan). (e) Report To Congress On Alternative Propulsion Methods for Surface Combatants and
Amphibious Warfare Ships, Prepared by: Naval Sea Systems, January 2006 (FOUO/NOFORN).
(f) NAVSEA Concept Study Report, Vulnerability Analysis (Alternative Propulsion Methods for Surface Combatants and Amphibious Warfare Ships), NAVSEA, Ser 05D/060, dated January, 2007 (SECRET).
(g) NAVSEA Concept Study Report, Operational Effectiveness Analysis Report (Alternate Propulsion For Surface Combatants and Amphibious Warfare Ships), Koleser, Jeffrey Allen, Ser 05D/Ser006, dated January, 2007 (FOUO/NOFORN).
AoA - Analysis of Alternatives ASSET - Advanced Surface Ship Evaluation Tool ASW - Antisubmarine Warfare AWS - Amphibious Warfare Ship $B - Dollars in Billions BBL - Barrel of Oil (42 United States gallons) BSP - Baseline Security Posture CG-47 - Ticonderoga Class Guided Missile Cruisers CER - Cost Estimating Relationship CH-46 - Sea Knight Helicopter CH-53 - Sea Stallion Helicopter CNO - Chief of Naval Operations CODAG - Combined Diesel and Gas Turbine CODLAG - Combined Diesel Electric and Gas Turbine CODOG - Combined Diesel or Gas Turbine COGAG - Combined Gas Turbine and Gas Turbine COMET - Conceptual Operations Manpower Estimating Tool CVN-21 - 21st Century Aircraft Carrier, now designated CVN-78, formerly CVN(X) DC - Direct Current DD-963 - Spruance Class Destroyers DDG-51 - Arleigh Burke Class Guided Missile Destroyers DDG -1000 - Zumwalt Class Guided Missile Destroyers (Formerly called DD-21 and DD(X)) DESC - Defense Energy Support Center DFM - Diesel Fuel Marine

50
DG - Diesel Generator DRM - Design Reference Mission DSL - Diesel DoD - Department of Defense DOE - Design of Experiments DPS - Defense Planning Scenarios F76 - Diesel Fuel Marine FFG - Oliver Hazard Perry Class Guided Missile Frigates Fp - Full Power FY - Fiscal Year GFE - Government Furnished Equipment GT - Gas Turbine GTG - Gas Turbine Generator HR - House Resolution Hz - Hertz IFTP - Integrated Fight Through Power IPS - Integrated Power System AWS - Amphibious Warfare Ship Kts - Knots, nautical miles per hour kV - kilo-Volts LCC - Life-cycle costs LCS - Littoral Combat Ship LHA-1 - Tarawa Class Amphibious Assault Ships LHA-6 - LHA(R) Lead Ship LHA-7 - Formerly LHA(R) Flight 1 LHD-1 - Wasp Class Amphibious Assault Ships LHD-8 - USS Makin Island $M - Dollars in Millions MAPS - Manpower Analysis and Prediction Systems MCO - Major Combat Operation MIW - Mine Warfare Ships MOE - Measure of Performance MOP - Measure of Effectiveness MSC - Medium Surface Combatant MT - Metric Ton MW - Mega Watts NA - Not Applicable NAVSEA - Naval Sea Systems Command NOLSC - Naval Operational Logistics Support Center NPV - Net Present Value NRE - Nonrecurring Design and Engineering NSWCCD - Naval Surface Warfare Center Carderock Division NSWCDD - Naval Surface Warfare Center Dahlgren Division O&S - Operating and Support ONI - Office of Naval Intelligence ONR - Office of Naval Research

51
OPNAV N81 - Office of the CNO, Capability Analysis and Assessment Division OPSITS - Operational Situations OPTEMPO - Operating Tempo OSD - Office of the Secretary of Defense PDR - Preliminary Design Review POM-08 - FY 08 Program Objectives Memorandum POW - Projected Operational Environment RDT&E - Research Development, Test, and Engineering ROC - Required Operational Capability SC - Surface Combatant SSC - Small Surface Combatant SSN-21 - Seawolf Class Attack Submarines TACSITs - Tactical Situations TBMD - Theater Ballistic Missile Defense V-22 - Osprey Tilt-rotor Aircraft VAMOSC - Visibility and Management of Operating and Support Costs


![An Introduction To Marine Steam Propulsion Plant [Source: US Navy]](https://img.pdfslide.us/doc/110x75/5515527755034685568b5594/an-introduction-to-marine-steam-propulsion-plant-source-us-navy.jpg)