Embed Size (px)
Citation preview


Alternative Fuel Truck Evaluation Project
by
Kevin Chandler, Battelle
Paul Norton, National Renewable Energy Laboratory
Nigel Clark, West Virginia University
January 2001
The authors wish to acknowledge the help and cooperation of the staff
at the host site, Waste Management, Inc., in Washington, Pennsylvania.
The authors also acknowledge the editorial contributions of Vincent
Brown at Battelle and Stefanie Woodward at NREL.
World Wide Web: http://www.ott.doe.gov/heavy_vehicle
National Alternative Fuels Hotline: 1-800-423-1DOE
W ASTE MANAGEMENT’S LNG TRUCK FLEET:FINAL RESULTS

ii
Notice
This report was prepared as an account of work sponsored by an agency of
the United States government. Neither the United States government nor any
agency thereof, nor any of their employees, makes any warranty, express or
implied, or assumes any legal liability or responsibility for the accuracy, com-
pleteness, or usefulness of any information, apparatus, product, or process
disclosed, or represents that its use would not infringe privately owned
rights. Reference herein to any specific commercial product, process, or ser-
vice by trade name, trademark, manufacturer, or otherwise does not neces-
sarily constitute or imply its endorsement, recommendation, or favoring by
the United States government or any agency thereof. The views and opinions
of authors expressed herein do not necessarily state or reflect those of the
United States government or any agency thereof.
Available electronically at http://www.doe.gov/bridge
Available for a processing fee to U.S. Department of Energy
and its contractors, in paper, from:
U.S. Department of EnergyOffice of Scientific and Technical Information
P.O. Box 62
Oak Ridge, TN 37831-0062
phone: 865.576.8401
fax: 865.576.5728
email: [email protected]
Available for sale to the public, in paper, from:
U.S. Department of CommerceNational Technical Information Service
5285 Port Royal Road
Springfield, VA 22161
phone: 800.553.6847
fax: 703.605.6900
email: [email protected]
online ordering: http://www.ntis.gov/ordering.ht

Alternative FuelTrucks
Final Results
Executive Summary
OverviewAlternative Fuel Projects at DOE and NRELThe Alternative Fuel Truck Evaluation ProjectHost Site Profile: Waste Management, Inc., in Washington, Pennsylvania
Waste Managment’s LNG TrucksWaste Managment’s Involvement in Air Quality Improvement
Project Design and Data Collection
Waste Management’s Facilities and Bulk Fuel Storage
Project Start-Up at Waste Management
Evaluation ResultsActual Truck Use in Refuse Hauling ServiceFuel Economy and Maintenance Costs
Fuel EconomyFuel Cost per GallonFuel Cost per MileEngine Oil Consumption and CostFactors Affecting Maintenance CostsMaintenance Costs by Vehicle SystemWarranty CostsOverall Maintenance Costs
Overall Operating CostsEmissions Testing Results
Turbocharger Effects on NOx EmissionsCBD Duty Cycle ResultsWaste Management Duty Cycle ResultsU.S. EPA Emissions Certification
Summary and ConclusionsFuture LNG Operations at Waste ManagementContactsReferences and Related ReportsAppendix A. Fleet Summary StatisticsAppendix B. Emissions Test Results
............................................................................................v
.............................................................................................................1................................................2...............................................2
....2.............................................................2
...............4...............................................................5
.....................................7
............................................................9
............................................................................................11.................................................11
.......................................................12........................................................................................12
.............................................................................14.................................................................................15
.......................................................15.....................................................16...................................................16
......................................................................................18....................................................................18
..............................................................................19.............................................................................20
...............................................20.......................................................................22
.................................................22.........................................................22
.............................................................................24.............................................26
...........................................................................................................27....................................................................28
.........................................................A-1.............................................................B-1
iii
Table of Contents

iv

v
Waste Management, Inc., a private com-
pany based in Houston, Texas, began
operating a fleet of heavy-duty refuse
trucks powered by liquefied natural gas
(LNG) at its Washington, Pennsylvania,
facility in 1997. Waste Management
currently operates seven LNG refuse
trucks at that site.
The U.S. Department of Energy (DOE)
Office of Heavy Vehicle Technologies
sponsored a research project to collect
and analyze data on the performance
and operation costs of five of Waste
Management’s LNG trucks in commercial
service, for comparison with data on the
performance of three diesel trucks oper-
ating on similar routes.
This report presents an evaluation of five
of the first seven LNG trucks produced
by Mack. Mack partnered with Waste
Management in Washington, Pennsylvania,
to field test its natural gas engine design
and gain experience.
Objective
The objective of the DOE research project,
managed by the National Renewable
Energy Laboratory, was to provide trans-
portation professionals with quantitative,
unbiased information on the cost, main-
tenance, operational, and emissions
characteristics of LNG as one alternative
to conventional diesel fuel for heavy-duty
trucking applications.
This information should benefit decision
makers by providing a real-world account
of the obstacles overcome and the
lessons learned in adapting alternative
fuel trucks to a hauling site previously
geared toward diesel trucks.
Methods
Data were gathered daily from fuel and
maintenance tracking systems for more
than one year. The data parameters
included
• Fuel consumption
• Mileage and dispatching records
• Engine oil additions and oil/filter
changes
• Preventive maintenance action records
• Records of unscheduled maintenance
(such as roadcalls) and warranty repairs
In general, these data were already
collected as part of normal business
operations at the Waste Management site
in Washington, Pennsylvania.
Results
The results shown in this report are
based on an evaluation of the first Mack
LNG trucks placed in service by Mack
and Waste Management in Washington,
Pennsylvania. Start-up problems were
encountered that have been resolved.
Although this implementation was
considered successful by both Mack and
Waste Management, sites using new Mack
LNG refuse trucks (as of model year
2000) should expect significantly lower
operating costs than experienced in
Washington, Pennsylvania.
• Throughout the evaluation period,
both the LNG and the diesel fleets did
the work Waste Management expected.
The major difference in operations was
that the monthly average mileage
(miles driven) per truck was 26% lower
for the LNG trucks.
Executive Summary

Alternative FuelTrucks
Final Results
vi
• Drivers and refuse workers have
reported that there is no difference in
power between the LNG and diesel
trucks. The refuse workers prefer the
LNG trucks because of their lack of
diesel odor and quieter operation.
• Diesel equivalent fuel economy was
27% lower for the LNG trucks for in-
use operation during the evaluation.
(“Diesel equivalent” or “energy equi-
valent” comparisons allow fuels with
different energy content, such as
diesel fuel and LNG, to be evaluated
on the same terms. See box on
page 15 for more information.) Diesel
equivalent fuel consumption per engine
hour was only 4% higher for the LNG
trucks. However, these values must be
interpreted in light of the fact that the
LNG trucks were used 26% fewer miles
and 3% fewer engine hours. The LNG
trucks also were used to haul 34% more
refuse by weight.
The more representative fuel economy
results came from the emissions testing
and the controlled fuel economy test
with the same load on the vehicles and
essentially the same route and average
speed. Fuel economy measured during
the emissions testing showed that the
LNG trucks had a 9% to 12% lower fuel
economy. This fuel economy result
shows considerable improvement
compared to other heavy-duty natural
gas engine products.
• The per-engine-hour fuel cost per mile
from the evaluation was double for the
LNG trucks and 54% higher for the
LNG trucks. These high costs were
caused by the high price paid in
Washington, Pennsylvania, for LNG—
$0.88 per LNG gallon or $1.77 per
diesel equivalent gallon with taxes.
Diesel fuel price used for the evalua-
tion was $1.20 per gallon.
In some other parts of the country,
LNG costs about $0.50 per LNG gallon,
($1.13 per diesel equivalent gallon with
taxes). Based on the evaluation results
from Washington, Pennsylvania, if LNG
were $1.13 per diesel equivalent gal-
lon and diesel were $1.50 per gallon,
the LNG per-mile truck fuel costs
would be 3% higher; engine-hour
costs would be 21% lower.
• The LNG trucks had per-mile mainte-
nance costs that were 63% higher and
per-engine-hour costs 23% higher. The
maintenance costs for the LNG trucks
reflect extra effort by the Waste
Management staff to understand and
troubleshoot the LNG trucks. This
extra effort also includes labor to
support Mack in its troubleshooting
effort and refinements for the final
Mack natural gas refuse truck product.
Also, these costs were higher because
Mack required preventive maintenance
twice as often for the LNG trucks.
Beginning with the 2000 model year,
the preventive maintenance cycle is
the same as for diesel: 600 engine
hours. Mack is considering increasing
the maintenance interval for the LNG
trucks by 50% to 900 engine hours.
This increase is expected to signifi-
cantly reduce maintenance costs for
the LNG trucks.
• Overall, the LNG trucks cost 80% more
to operate per mile and 37% more per
engine hour, excluding driver labor.
Operating costs were affected by dif-
ferences in miles traveled between the
fleets, the high cost of the LNG fuel,
and by differences in the weight of
refuse carried per fleet, all of which
favored the diesel trucks.
• Emissions results from testing on a
portable chassis dynamometer using
two duty cycles showed much lower
particulate matter emissions for the
LNG trucks. The non-methane hydro-
carbon emissions for the LNG trucks
were much lower than the total hydro-
carbon emissions for the diesel trucks.
Three of the LNG trucks had a problem
with the turbocharger. For new model
year 2000 LNG trucks, Mack uses a

Alternative FuelTrucks
Final Results
vii
different turbocharger manufacturer.
The three LNG trucks affected by
a turbocharger problem are not
included in the nitrogen oxide (NOx)
emissions comparison. The LNG
trucks had 16% lower NOx than the
diesel trucks on the Central Business
District cycle and 32% lower NOxthan the diesel trucks on the Waste
Management cycle.
The engines used during the evaluation
were not emissions certified, but the
engine calibration was the same used
for emissions certification. Improve-
ments in control and operation of the
natural gas engine were implemented
in production engines sold by Mack
during model year 2000.
• The LNG fuel station was installed
with the storage tank underground.
It is reported to operate well. Minor
problems have been reported with
the fuel nozzle.
Lessons Learned
This LNG truck project provided Waste
Management, DOE, and other partici-
pants the opportunity to learn many
lessons about implementing alternative
fuels, including
• Communication, commitment, and
training are essential.
• The project must have a committed
champion or nucleus of support to
succeed.
• Drivers need a contact person who can
handle questions or problems. Drivers
may sense that something is wrong
with the vehicles; but because the
technology is new, they may not know
whether the problems are real.
• Creative troubleshooting is essential.
Obstacles Overcome
Waste Management reported several
in-service failures and changes to the
trucks during the process of converting
the LNG trucks from operating proto-
types into nearly full production vehicles.
The components changed or repaired
on the LNG vehicles include electric
module, contaminated fuel line, blocked
exhaust back pressure line, leaking fuel
nipple at fuel tank, fuel level sensors,
and accelerator pedal.
Since August 1998, a few more problems,
such as fuel tank gauges, fuel valve
adjustments, fuel regulators, spark plugs,
and ignition coils, occurred with the LNG
fleet. All were resolved.
Future LNG Operations at Waste Management
Waste Management remains committed to
natural gas as a heavy-duty trucking fuel.
Waste Management, in concert with
alternative fuel project partners, is devel-
oping an on-site small-scale liquefaction
capability. This will use natural gas from
the Columbia Gas pipeline. Landfill gas
may also be used as the feedstock for
the LNG in the future. This should make
the fuel cost much more reasonable and
allow the LNG fleet to expand.
Based on the positive experience in
Washington, Pennsylvania, Waste
Management is currently implementing
alternative fuels at several other operat-
ing sites. During the next two years,
Waste Management plans to deploy
approximately 200 LNG refuse collection
trucks in locations throughout California.
Natural Gas Trucks from Mack
This LNG refuse truck demonstration
at Waste Management in Washington,
Pennsylvania, has successfully brought
the Mack LNG refuse truck from proto-
type to production for model year 2000.
Mack accomplished several goals during
this project:
• During the demonstration, Mack certi-
fied the E7G Eco-Tech engine below

Alternative FuelTrucks
Final Results
viii
2.5 g/bhp-hr NOx for 325-hp
and 350-hp settings for the
U.S. Environmental Protection
Agency and California Air
Resources Board.
• Mack demonstrated a signifi-
cant improvement in fuel econ-
omy for heavy-duty natural gas
engines. The fuel economy test-
ing as part of the emissions
testing showed that the natural
gas trucks had an energy equiv-
alent fuel economy 9% to 12%
lower than the comparable
diesel trucks on a slow average
speed cycle (10 to 12 mph).
Previous experience for heavy-
duty natural gas engines
showed an energy equivalent
fuel economy of 25% to 35%
below diesel.
• Mack worked out the logistics of
assembling the LNG trucks on
the same production line as the
diesel trucks at the Macungie
plant. An LNG truck is a stan-
dard product for the two refuse
truck models (MR and LE).
• Mack has started to respond
to significant interest in
purchasing natural gas
refuse trucks.
• Mack is engineering the CH
tractor to use LNG and operate
on the 350-hp E7G Eco-Tech
engine based on the experience
from the refuse trucks. Mack
plans to release the CH model
using the natural gas E7G engine
uprated to higher than 400 hp
and available in July 2001.

Alternative FuelTrucks
Final Results
1
Waste Management, Inc., based
in Houston, Texas, is the largest
waste management service
company in North America. It
employs approximately 60,000
persons and has more than 1,400
refuse collection facilities.
At its 143-truck facility in
Washington, Pennsylvania
(south of Pittsburgh), Waste Man-
agement has operated heavy-duty
refuse trucks fueled by liquefied
natural gas (LNG) since August
1997. The company’s fleet now
includes seven LNG Mack trucks
with E7G engines.
Between November 1998 and
May 2000, data on selected LNG
and diesel trucks from Waste
Management were collected for
evaluation as part of the U.S.
Department of Energy (DOE)/
National Renewable Energy
Laboratory (NREL) Alternative
Fuel Truck Evaluation Project.
The purpose of this report is
to provide transportation profes-
sionals with summary informa-
tion on the cost, maintenance,
operational, and emissions
characteristics of LNG as one
alternative to conventional diesel
fuel for heavy-duty trucking
applications.
In addition, the report should
benefit decision makers by
providing a real-world account
of the obstacles overcome and
the lessons learned in adapting
alternative fuel trucks to a
site previously geared toward
diesel trucks.
Overview
This report summarizes the
results of the LNG study at Waste
Management. Further technical
background, research methods,
extensive original data, and
detailed discussions are pre-
sented in a companion document
(Waste Management Final DataReport, NREL, August 2000).
What Is LNG Fuel and How Is It Processed?
Liquefied natural gas is a naturally occurring mixture of hydrocarbons(mainly methane, or CH4), that has been purified and condensed toliquid form by cooling cryogenically to -260° F (-162° C). At atmos-pheric pressure, it occupies only 1/600 the volume of natural gas invapor form.
Methane is the simplest molecule of the fossil fuels and can beburned very cleanly. It has an octane rating of 130 and excellentproperties for spark-ignited internal combustion engines.
Because it must be kept at such cold temperatures, LNG is stored in double-wall, vacuum-insulated pressure vessels. Compared to thefuel tanks required for using compressed natural gas (CNG) in vehiclesoperating over similar ranges, LNG fuel tanks are smaller and lighter.However, they are larger, heavier, and more expensive than dieselfuel tanks.
Compared to conventional fuels, LNG’s flammability is limited. It isnontoxic, odorless, noncorrosive, and noncarcinogenic. It presents no threat to soil, surface water, or groundwater.
LNG is used primarily for international trade in natural gas and formeeting seasonal demands for natural gas. It is produced mainly atLNG storage locations operated by natural gas suppliers, and at cryo-genic extraction plants in gas-producing states. Only a handful oflarge-scale liquefaction facilities in the United States provide LNG fuel for transportation.
This information was adapted from the following Web sites. Eachoffers further information about LNG:
– Natural Gas Vehicle Coalition: http://www.ngvc.org/qa.html
– Alternative Fuels Data Center: http://www.afdc.doe.gov
– Zeus Development Corp./LNG Express:http://www.lngexpress.com/welcome.htm
– CH-IV Cryogenics: http://www.ch-iv.com/lng/lngfact.htm

Alternative FuelTrucks
Final Results
2
Alternative Fuel Projects atDOE and NREL
NREL, a DOE national laboratory,
managed the data collection,
analysis, and reporting activities
for the Waste Management LNG
truck evaluation on behalf of DOE.
One of NREL’s missions is to assess
the performance and economics of
alternative fuel vehicles (AFVs)
objectively so that
• Fleet managers can make
informed decisions when
purchasing AFVs.
• AFVs can be used more widely
and successfully in the future to
reduce U.S. consumption of
imported petroleum and to ben-
efit users and the environment.
Alternative fuels evaluated by
NREL and participating companies
across the United States include
LNG, CNG, biodiesel, ethanol,
methanol, and propane (liquefied
petroleum gas).
The Alternative Fuel TruckEvaluation Project
The overall objective of the ongoing
DOE/NREL Alternative Fuel Truck
Evaluation Project is to compare
heavy-duty trucks using an alterna-
tive fuel with those using conven-
tional diesel fuel. Specifically, the
program seeks to provide compre-
hensive, unbiased evaluations of the
newest generation of alternative fuel
engine and vehicle technologies.
Heavy-duty alternative fuel trucks
have been evaluated across the
United States through data collec-
tion and analysis since 1996. The
truck program includes five dem-
onstration sites and continues to
add new sites. Other evaluation
sites include
• Raley’s (Sacramento, California)
• Orange County Sanitation District (Fountain Valley, California)
• United Parcel Service (Hartford,Connecticut)
• Ralphs Grocery (Riverside, California)
Sites have been selected accord-
ing to the kinds of alternative fuel
technology in use, the types of
trucks and engines, the availability
of diesel comparison (“control”)
vehicles, and the host sites’
interest in using alternative fuels.
The data collection and evaluation
efforts are subject to peer review
and DOE approval. The results of
the evaluation at each site are
being published separately.
Host Site Profile: Waste Management, Inc., in Washington, Pennsylvania
The participating host site for
this study was the Washington,
Pennsylvania, facility of Waste
Management, Inc., a private refuse
hauling and waste management
services company based in
Houston, Texas. Waste Management
operates LNG and diesel trucks
in refuse collection across a five-
county operating area in and
around Washington.
Waste Management’s LNG Trucks
The first of the seven LNG trucks
ordered from Mack Trucks, Inc.,
was delivered to Washington,
Pennsylvania, in the spring of
1997, and started operation the
following August. Six more LNG
trucks were introduced into the
fleet over the next two years.

Alternative FuelTrucks
Final Results
Waste Management’s LNG trucks
operate on the same duty cycle as
the rest of the fleet, which is daily
city and suburban refuse pickup
service. The fleet services 900 to
1,000 houses per day.
Six of the LNG trucks are MR
model trucks, and data from five
are included in the analysis. One
LNG truck is an LE model and is
not included because the truck
systems are different from those
of the MRs. The other LNG truck
not included is the newest MR
model truck, which started opera-
tion at the end of July 1999. The
data collected for this vehicle
were insufficient for analysis.
Operating information from these
two LNG trucks is presented
separately in the appendixes of
the Final Data Report.
Mack partnered with Waste
Management to field test Mack’s
natural gas engine design and
gain experience. The engines used
were not emissions certified; how-
ever, the engine calibration on the
test vehicles was the same used
for emissions certification.
Some improvements in control
and operation of the natural gas
engine were implemented in
production engines sold by Mack
during model year 2000.
Another aspect of Waste
Management’s partnership with
Mack relates to warranty costs.
Maintenance costs for the LNG
trucks included mechanic labor
for troubleshooting engine and
fuel system problems that nor-
mally would have been covered
under warranty, at no expense
to the fleet operator. Waste
Management and Mack agreed to
this arrangement to move the
LNG trucks from development to
production more quickly.
3
The arrangement was very
successful in keeping the trucks
on the road and achieving
improved performance. However,
it also drove the maintenance
costs for the LNG trucks higher.
For this reason, maintenance
costs for production LNG vehi-
cles being sold by Mack outside
the scope of this evaluation
should be significantly lower
than those for these first trucks
at Waste Management.
As shown in Table 1, the five LNG
trucks evaluated were model
years 1997 through 1999 Mack
MR trucks equipped with Mack
E7G engines. The three diesel
trucks used for comparison were
all model year 1997 Mack MR
trucks equipped with Mack
E7 engines.
PittsburghWashington, PA

Table 1. Vehicle System Descriptions
Description Diesel Control LNG
Chassis Manufacturer/Model Mack MR Refuse Mack MR Refuse
Chassis Model Year 1997 1997, 1998, 1999
Engine Manufacturer/Model Mack E7 - 300 Mack E7G - 325
Engine Ratings Max. Horsepower 300 hp @ 1950 rpm 325 hp @ 1950 rpmMax.Torque 1080 lb-ft @ 1200 rpm 1180 lb-ft @ 1250 rpm
Fuel System Storage Capacity 72 gallons 150 LNG gallons usable (90 diesel equivalent gallons)— 2 LNG tanks from MVE, Inc.
Transmission Manufacturer/Model Allison HT740RS, Allison HT740RS,4-speed automatic 4-speed automatic
Catalytic Converter Used (Y/N) No No
Packer Body Manufacturer Leach EZ Pack, Leach
Vehicle Cost in Comparison to Diesel Baseline +$40,000
Figure 1. LNG truck at Waste Management, Washington, Pennsylvania
Alternative FuelTrucks
Final Results
4
The LNG trucks have a slightly
higher peak torque and peak
horsepower rating than the diesel
trucks. All the LNG trucks had
the same engine calibration,
which was updated during
July 1998.
The different years of manufac-
ture and different dates for start
of operation were addressed by
collecting all back maintenance
data for the older diesel trucks.
As discussed later, this allows
similar vehicle lifetimes for the
study fleets to be compared.
Each LNG truck cost about
$40,000 more than an
equivalent diesel refuse truck.
Waste Management installed the
packer body and a tag axle on
the first four LNG trucks after
delivery from Mack. For the
last three LNG trucks, Mack
installed the tag axle and Waste
Management installed only the
packer body. Figure 1 shows
an LNG refuse truck at Waste
Management.
Waste Management’s drivers, who
received specialized training in
fueling and safety for the new
technology, came to prefer the
LNG trucks, because they have
no diesel smoke or smell, are
quieter, and have more power
than the diesel trucks (325 hp
versus 300 hp for the comparable
diesel trucks).
Waste Management’s Involvementin Air Quality Improvement
In 1991, Chambers Development
Company (later William H. Martin,
Inc., and now Waste Management,
Inc.) began exploring the possi-
bility of using the site’s landfill as
an energy source to fuel its refuse
trucks. Landfill gas (LFG) could
be converted to usable natural
Cou
rtes
y of
Kev
in C
hand
ler/
PIX
095
67

Alternative FuelTrucks
Final Results
5
gas fuel, but the technology at that
time did not produce acceptable
quality fuel. Further analysis of
the fuel processing and engine
requirements showed that LFG
conversion did not suit the site at
that time.
A strong commitment to finding
an alternative to diesel fuel for
environmental and economic
reasons led Waste Management
to explore on-site natural gas
fueling, with the hope of expand-
ing to LFG conversion in the
future. A working group of
government funding sources
and industry participants was
formed to develop a natural
gas-fueled refuse truck and to
provide on-site LNG fueling at
the Washington, Pennsylvania,
site. Partners included
• Waste Management, Inc.
• Mack Trucks, Inc.
• Gas Technology Institute (GTI,
formerly Gas Research Institute)
• DOE/NREL
• Pennsylvania Department of
Environmental Protection
• Southwest Research Institute
(SwRI)
• Columbia Gas of Pennsylvania
• Chart Industries (formerly
CVI, Inc.)
• American Trucking Associations/
Trucking Research Institute
Mack, supported by SwRI, built a
production natural gas truck in
1995. The first LNG truck for
Waste Management went into ser-
vice in August 1997. To support
the LNG truck development, GTI
and CVI, Inc., led the effort to
develop and install an on-site LNG
fueling station at Washington,
Pennsylvania. This was the first
underground LNG fueling station
in the United States. It was ready
for operation in mid-1997.
Project Design and Data Collection
Data were gathered from Waste
Management’s fuel and mainte-
nance tracking systems daily. The
data parameters included
• Diesel fuel consumption by
vehicle and fill
• LNG fuel consumption by
vehicle and fill
• Mileage and engine hour data
from every vehicle
• Dispatching logs
• Engine oil additions and oil/
filter changes
• Preventive maintenance action
(PMA) work orders, parts lists,
labor records, and related
documents
• Records of unscheduled main-
tenance (e.g., roadcalls)
• Records of repairs covered by
manufacturer warranty
The data collection was designed
to cause as little disruption for
Waste Management as possible.
Data were sent from the site to an
NREL contractor for analysis. In
general, staff at Waste Management
sent copies (electronic and/or
paper) of data that had already
been collected as part of normal
business operations.
Waste Management staff had
access to all data being collected
from its site and other data avail-
able from the project. Summaries,
evaluations, and analyses of the

Alternative FuelTrucks
Final Results
6
data were distributed to desig-
nated staff at Waste Management
for review and input.
The study design included the
tracking of safety incidents
affecting the vehicles or occurring
at the fueling station or in the
maintenance facilities. No report-
able safety incidents occurred
during the data collection period.

Alternative FuelTrucks
Final Results
7
Waste Management operates
143 refuse hauling trucks over a
five-county service area in the
Washington, Pennsylvania, area.
The truck operations facility
covers 10 acres and employs a
staff of more than 250.
Fuel for the LNG trucks is provided
by a permanent station equipped
with an underground 13,000-
gallon storage tank (manufactured
and installed by Chart Cryogenic
Components Division, see
Figure 2). The fueling station
includes a pump that can fill a
warm vehicle tank without vent-
ing. The dispenser can provide
as much as 30 gallons of LNG
per minute.
The station uses on-the-fly condi-
tioning that allows the station
storage tank to operate at lower
pressure. The vacuum-insulated
dispensing hose is counterbal-
anced so the nozzle stays off the
ground when not in use.
The cost to construct and install
the LNG fueling station was about
$500,000. The capability to pro-
vide compressed natural gas
(CNG) at 3,600 psi was added to
the LNG fueling station at the end
of 1999. The facility converts LNG
to compressed natural gas (LCNG).
The added components were a
larger heat exchanger and an addi-
tional cryogenic pump along with
changes to the computer control
software. Chart Industries report-
ed that this fuel station would cost
$700,000 to $750,000 today in its
current configuration.
The LNG fueling station had
problems with the dispensing
nozzle, including fuel leakage
during filling, which causes ice
buildup on the nozzle and on the
seal. This can make connecting
and disconnecting the nozzle at
the truck fuel tank difficult and
damages the seal on the nozzle. A
modified design JC Carter nozzle
is now being used and seems to
control leaks better.
The only other problem reported
was damage to the dispenser read-
out caused by a lightning strike
toward the end of summer 1999.
Fuel for the diesel trucks is
provided by an aboveground
10,000-gallon diesel storage
tank (see Figure 3).
The maintenance facility (Figure 4)
was built at about the same time
the LNG program started (early
1997). It has two bays equipped
with methane gas and heat detec-
tors as well as audible and visual
alarm systems (manufactured by
Waste Management’s Facilities and Bulk Fuel Storage
Figure 2. LNG fueling station with added LCNG components
PIX
095
70/K
evin
Cha
ndle
r

Alternative FuelTrucks
Final Results
8
Honeywell) in case of a natural
gas fuel leak. The cost for this
system was not separated from
the cost of constructing the new
maintenance facility. The trucks
are parked outside when not
being driven or serviced.
Figure 4. Maintenance facility
Figure 3. Diesel fueling station with maintenance facility in background
PIX
082
65/K
evin
Cha
ndle
rPI
X 0
9560
/Kev
in C
hand
ler

Alternative FuelTrucks
Final Results
9
As noted earlier, the first LNG
trucks from Mack began operation
in Washington, Pennsylvania, in
August 1997. Waste Management
agreed to do most of the warranty
work without reimbursement
from Mack. The mechanics have
learned to troubleshoot and ser-
vice the trucks with much less
involvement from the manufac-
turer compared to other alterna-
tive fuel operations or other new
technology development projects.
Nevertheless, Waste Management
personnel have benefited from
the support of Mack’s technical
know-how in ensuring the success
of the LNG project. Mack has been
extremely responsive to Waste
Management’s needs to make
changes to the LNG trucks and
provides parts on short notice.
There were several in-service
failures and changes to the trucks
during the process of converting
the LNG trucks from operating
prototypes into nearly full pro-
duction vehicles. The following
components were changed or
repaired on the LNG vehicles
through July 1998:
• Electric module
• Contaminated fuel line
• Blocked exhaust back pressure line
• Leaking fuel nipple at fuel tank
• Fuel level sensors
• Accelerator pedal
• Methane detector
• Wastegate actuator
• Engine control unit chip calibration
• Turbocharger
Since the “clean point” for the
data collection and evaluation
(August 1, 1998), a few more
problems have occurred with
the LNG fleet, all of which were
resolved:
• All LNG trucks
- Repaired the fuel tank
gauges
- Added humidity sensors
for the engines
- Replaced the accelerator
pedals with a new design
• Isolated failures
- Adjusted fuel valves on five
LNG trucks
- Replaced two fuel regulators
- Replaced spark plugs on
five LNG trucks
- Replaced eight ignition coils
- Repaired a broken wire in
a harness
Project Start-Up at Waste Management

Alternative FuelTrucks
Final Results
10
Lessons Learned at Start-Up
• Communication, commitment, and training are essential.
• The project must have a committed champion or a nucleus of
support to succeed. This will ensure that the project, whether
large or small, will receive enough attention to start-up issues
such as fueling infrastructure and training.
• Recognize that the LNG trucks will not mix immediately with the
diesel fleet. There can be differences between the systems, but a
troubleshooter who knows the engines can resolve many problems.
• Drivers need to have a contact who can handle questions or
problems. Sometimes drivers sense that something is wrong but
do not fully understand the new technology. They spend more
time with the trucks than anyone else, and their input is valuable.
• Creative troubleshooting is essential. For example, LNG is not
odorized, so Mack used a portable methane detector to help
identify leaks.
• Starting with a few trucks is the best way to introduce
new technology into a fleet operation. This gives time
for learning about the new technology and for learning
how to integrate the trucks into normal operations and
training. However, to capture economies of scale, more
trucks can equate to more savings in operating costs.
• Carefully plan the timing of delivery of the
fuel infrastructure and the delivery of the trucks.
The installation of the fuel infrastructure may
have delays; plan some time into the schedule
for these potential delays.
A report about Waste Management’s start-up experience is
available on-line at www.ott.doe.gov/heavy_vehicle or from
the National Alternative Fuels Hotline at 800/423-1DOE.

Alternative FuelTrucks
Final Results
During the evaluation, Waste
Management staff were concerned
that the LNG trucks might not
have the range of the diesel
trucks. However, the difference
in range of the LNG and diesel
trucks based on the fuel economy
testing on a simulated Waste
Management cycle (during emis-
sions testing) showed that the
range was 10% higher for the
LNG trucks when operated in the
same service (245 miles for LNG
versus 222 miles for diesel).
Waste Management staff also
wanted the LNG trucks closer to
the maintenance facility in case
of operating problems.
The diesel trucks generally trav-
eled farther from their base of
operations. Consequently, the
diesel trucks had higher mileage
per month and a higher average
speed than the LNG trucks.
Figure 5 shows the monthly aver-
age miles traveled and engine
hours of operation for the diesel
and LNG fleets. The LNG trucks
averaged 1,688 miles per month;
the diesel trucks averaged
2,295 miles per month. Figure 6
shows the average monthly miles
driven per truck.
Refuse industry fleet operators
generally base most of their fleet
statistics on engine hours rather
than on miles driven. Because
refuse trucks tend to have a very
low average speed, fuel comsump-
tion and preventive maintenance
schedules are usually based on
engine hours of operation.
The analyses in this report cover
five LNG trucks and three diesel
trucks operating during the
12-month focus periods (see
Table 2). These periods were
chosen to analyze each vehicle
over a similar range of accumulat-
ed mileage.
Actual Truck Use in RefuseHauling Service
The LNG and diesel fleets were
used for residential refuse pickup
5 to 6 days per week, on one route
per day. Each truck collected
refuse and returned to the landfill
for unloading. Unloading was
required more than once per day
during peak times of the year.
Throughout the evaluation
period, both the LNG and the
diesel fleets did the work Waste
Management expected. The major
difference in operations was that
the monthly average mileage
(miles driven) per truck was 26%
lower for the LNG trucks.
Evaluation Results
Table 2. Evaluation Vehicles and Data Evaluation Periods
Start Maintenance Fuel Data Maintenance Truck Date Start Mileage Period Data
300242 2/17/97 12403 11/98 – 10/99 8/97 – 7/98
300237 7/9/97 16186 11/98 – 10/99 1/98 – 12/98
300239 8/25/97 10709 11/98 – 10/99 2/98 – 1/99
300243 8/19/97 24409 11/98 – 10/99 11/98 – 10/99
300241 4/16/98 11853 11/98 – 10/99 11/98 – 10/99
300240 6/3/98 8554 11/98 – 10/99 11/98 – 10/99
303352 4/28/99 2365 5/99 – 10/99 6/99 – 5/00
303351 5/18/99 812 5/99 – 10/99 6/99 – 5/00
Die
sel
LNG
11

Alternative FuelTrucks
Final Results
12
Figure 5. Monthly average mileage and engine hours
Waste Management’s LNG trucks
averaged 8.7 mph throughout the
evaluation period; its diesel
trucks averaged 11.5 mph.
On a given day of operation, the
trucks’ engines run the entire
time the driver is working (7 to
12 hours per day). For this report,
all vehicle usage, fuel economy
and costs, and maintenance costs
are analyzed separately based on
mileage and then based on engine
hours. The monthly average miles
driven per truck were 26% lower
for the LNG trucks, but the
monthly average engine hours
per truck were only 3% lower for
the LNG trucks (see Figure 5).
One other difference was that
the LNG trucks were used to
haul 34% more refuse by weight
each day. This had a significant
effect on fuel consumption.
Fuel Economy and Maintenance Costs
Diesel equivalent fuel economy
per mile driven was 27% lower
for the LNG trucks for in-use
operation. Fuel consumption cal-
culated per engine hour was 4%
higher for the LNG trucks. The
LNG trucks had significantly
higher maintenance costs: 63%
higher per mile and 23% higher
per engine hour. Details of these
and other costs follow.
Fuel Economy
Each LNG truck used an average
of 74 gallons of LNG per day of
operation (45 gallons diesel equiv-
alent). Each diesel control truck
used an average of 35 gallons of
diesel fuel per day of operation.
Figure 7 shows the fleet averages
by month in miles per diesel
equivalent gallon and in diesel

Alternative FuelTrucks
Final Results
13
Figure 7. Fuel economy (mpg) and fuel consumption per engine hour
equivalent gallons per hour.
Figure 8 compares per-truck
and overall fleet fuel economy
based on mileage; Figure 9
shows the comparison based on
engine hours.
Diesel equivalent gallons are
calculated based on a standard
LNG gallon divided by 1.67 (the
conversion factor for pure
methane; LNG at this site is
essentially methane, based on
discussions with the fuel supplier,
ALT-USA). The fuel consumption
expressed in energy equivalent
gallons per hour is 4% higher for
the LNG trucks compared to the
diesel trucks.
The average speeds (see Table 3)
put the miles per diesel equiva-
lent gallon numbers for LNG and
diesel trucks into perspective.
The average speeds for the LNG
and diesel trucks are low (8.7 to
11.5 mph), but the LNG trucks’
average speed was 24% lower
than that of the diesel trucks.
This difference has a significant
impact on the efficiency of the
spark-ignited LNG engines. Also,
the heavier load contributed to
the lower fuel economy for the
LNG trucks.
In general, historical experience
has shown that the diesel equiva-
lent fuel economy is usually 15%
to 30% lower for the LNG trucks.
In-use data at Waste Management
appear to be consistent with
previous experience, showing a
miles-per-gallon/equivalent-gallon
fuel economy 27% lower for the
LNG trucks than for the diesel
trucks. However, this comparison
involved significant duty cycle
differences between the diesel
and LNG trucks. The controlled
fuel economy testing from the
emissions testing is a much
better comparison to consider.

Alternative FuelTrucks
Final Results
14
As detailed later, the fuel econ-
omy was also calculated during
the course of emissions testing by
West Virginia University (WVU)
on controlled duty cycles. Results
showed that for the Central Busi-
ness District (CBD) cycle, the
LNG trucks had a fuel economy
(miles per gallon/equivalent gal-
lon) that was 9% lower than that
of the diesel trucks.
Fuel economy results from the
emissions testing were also
measured using a duty cycle
designed to match the way
Waste Management uses its refuse
trucks. The diesel equivalent
fuel economy results for the
Waste Management cycle were
12% lower.
Fuel Cost per Gallon
The diesel fuel costs were $1.10
to $1.30 per gallon, including
federal and state taxes. An aver-
age of $1.20 per gallon for diesel
fuel was used for the evaluation.
LNG fuel cost used for the
evaluation was $1.059 per LNG
gallon or $1.77 per diesel equiv-
alent gallon. Waste Management
pays a very high price for LNG
in Washington, Pennsylvania,
because no transportation-grade
LNG is available nearby. The
cost to Waste Management
(before taxes) is $0.35 per LNG
gallon for the fuel plus $0.53
per LNG gallon for transporta-
tion costs, totaling $0.88 per
LNG gallon. Other LNG sites in
the United States have reported
costs of $0.45 to $0.50 per
LNG gallon.
Small-scale liquefaction, which is
being developed at the operations
site in Washington, Pennsylvania,
should significantly reduce the
price paid for LNG.
Truck mpg/mpeg Avg Speed mph
300242 3.09 11.8
300237 3.00 11.4
300239 2.75 11.2
Diesel Avg 2.93 11.5
300243 2.06 8.2
300241 2.07 8.2
300240 2.23 8.8
303352 2.26 10.3
303351 2.11 8.6
LNG Avg 2.14 8.7
Die
sel
LNG
Table 3. Average Fuel Economy and Average Speed

Alternative FuelTrucks
Final Results
15
The LNG trucks consumed
2.01 quarts of oil per 1,000 miles;
the diesel trucks consumed 91%
less—1.05 quarts per 1,000 miles.
Based on engine hours, the die-
sel trucks consumed 0.83 quarts
per 100 engine hours and the
LNG trucks consumed 1.75 quarts
per 100 engine hours, which rep-
resents 2.1 times higher engine
oil consumption for LNG.
The higher engine oil consumption
by the LNG trucks is expected,
because the LNG engine’s spark-
ignition cycle allows a lower pres-
sure inside the cylinder (than in a
diesel engine). This causes a small
amount of the oil to be drawn
into the cylinder and burned.
The cost of engine oil for the LNG
trucks was $1.35 per quart; the
diesel engine oil was $0.65 per
quart. The significant difference was
due to the low ash requirement
and low-volume purchase for the
engine oil used in the LNG trucks.
Fuel Cost per Mile
The average fuel costs ($1.77 per
diesel equivalent gallon for LNG
trucks; $1.20 per gallon for
diesel trucks), coupled with the
difference in energy equivalent
fuel economies, were used to
determine fuel cost per mile for
this evaluation.
For the evaluation period, the
cost per mile for fuel was $0.410
for diesel and $0.826 for LNG, or
101% higher for LNG. Diesel
operation costs were $4.699 per
engine hour and LNG operations
were $7.233 per engine hour, or
54% higher for LNG.
The LNG fuel cost at Washington,
Pennsylvania, was high in com-
parison to other parts of the
country with closer access to
LNG. With small-scale liquefac-
tion at Washington, Pennsylvania,
the LNG fuel cost could be $0.50
per LNG gallon or lower. Diesel
fuel costs may climb higher than
recent experience to $1.50 per
gallon or higher.
LNG fuel costs at $0.50 per LNG
gallon would equate to $0.679
per gallon with taxes or $1.13
per diesel equivalent gallon.
Using $1.13 per diesel equivalent
gallon for LNG and diesel fuel
cost of $1.50 per gallon, the
in-service experience at Waste
Management on a per-mile fuel
cost basis for LNG would be 3%
higher than diesel and 21% lower
than diesel per engine hour.
Engine Oil Consumption and Cost
Engine oil consumption is mea-
sured by recording the volume of
engine oil added between oil
changes. For most heavy-duty
engines, a certain level of engine
oil consumption is expected.
What Is a Diesel Equivalent Gallon?
Because LNG contains less energy per gallon than diesel fuel, compar-ing simple miles per gallons of LNG and diesel trucks would not accu-rately compare their true fuel efficiencies. Diesel equivalent gallonsare commonly used to solve this problem. A diesel equivalent gallonis the quantity of LNG (or any other fuel) that contains the sameenergy as a gallon of diesel fuel. Because 1.67 gallons of LNG containthe same energy as 1 gallon of diesel fuel, 1.67 gallons of LNG are 1 diesel equivalent gallon.

Alternative FuelTrucks
Final Results
16
The cost per mile was $0.001
for diesel and $0.003 for LNG.
Cost per engine hour was $0.008
for diesel and $0.024 for LNG.
Engine oil consumption costs
were very small compared to the
per-mile and per-hour fuel and
maintenance costs.
Factors Affecting Maintenance Costs
The maintenance costs for the
LNG fleet were significantly high-
er than expected because Waste
Management agreed to provide
the resources for its mechanics
to troubleshoot and service the
LNG trucks with minimal support
from Mack.
This has been extremely successful
in keeping the trucks on the road.
However, Waste Management has
expended significant resources
keeping the LNG trucks running.
In other circumstances, such
labor costs would have been
covered under warranty. At
other locations, in-house fleet
mechanics may do the work,
but the manufacturer reimburses
the fleet.
In general, Waste Management has
performed all maintenance on the
LNG trucks for troubleshooting
and service. Mack provided an
experienced technician when the
problems were difficult to diagnose
or when significant work needed
to be done. Mack also provided
many LNG parts at no charge.
Another factor affecting mainte-
nance costs was the difference in
preventive maintenance interval
between the fleets (300 engine
hours for the LNG trucks and
600 engine hours for the diesel
trucks). The LNG trucks had
scheduled maintenance parts
(fuel filters, engine oil, and spark
plugs) that were more expensive
and changed more often than the
diesel trucks.
Mack increased the oil change
interval for the LNG trucks to
600 engine hours after the data
collection period. Mack is consid-
ering increasing the oil change
interval for the LNG trucks to
900 engine hours.
Maintenance Costs byVehicle System
In the comparison between LNG
and diesel trucks, maintenance
cost differences should be
expected only in the engine- and
fuel-related systems and the
inspection costs. All maintenance
costs by vehicle system are pro-
vided in this analysis to put the
engine- and fuel-related mainte-
nance costs into perspective of
the total maintenance cost and
the maintenance cost for other
vehicle systems. The maintenance
costs for the vehicle systems
other than the engine- and fuel-
related systems and inspections
may be significantly higher or
lower for the LNG trucks but are
not considered to be caused by
the natural gas fuel or related
vehicle systems.
Figure 10 shows the relative
share of the six major truck
systems contributing to each
fleet’s per-mile maintenance
costs. Costs calculated per mile
did not vary greatly from the
costs per engine operating hour
by percentage.
Five of the top six systems
contributing to maintenance
costs are common for diesel
and LNG trucks:
1. Tires.

Alternative FuelTrucks
Final Results
17
Figure 10. Share of maintenancecosts across major systems
2. Frame, steering, and suspen-
sion, including bumper repairs,
steering repairs, and suspension
repairs such as shock absorbers.
This category also includes
preventive maintenance for
lubricating the suspension and
steering systems. The trucks at
Waste Management have this
action performed once a week
while the trucks are in service.
3. PTO and hydraulics, including
the power take-off, hydraulic
system, and garbage packer body.
4. Brakes.
5. Engine and fuel-related sys-
tems, including exhaust, fuel,
engine, non-lighting electrical,
air intake, and cooling repairs.
The other major contributor to
maintenance costs for the diesel
fleet was lighting. For the LNG
trucks, the other major category
was cab, body, and accessories
(body repairs, repairs following
accidents, glass, and painting;
cab and sheet metal repairs,
including seats and doors; and
accessories such as radios).
Tires were the highest mainte-
nance cost element for both
fleets (27% for LNG and 32% for
diesel). Engine- and fuel-related
systems repairs were the second-
highest element (16%) for the
LNG trucks but sixth (5%) for the
diesel trucks.
Brief summaries of the differences
between the diesel and LNG
fleets, and some of their causes,
are presented here. All results
relating to maintenance by vehicle
system focus on the similar vehicle
lifetimes (12 months).
More detailed maintenance cost
results are presented in Appendix
A and in the Final Data Report.
• Engine- and fuel-related systems
– The LNG trucks had much
higher costs for these systems
(5 times higher based on
mileage, nearly 4 times higher
based on engine hours). This
was caused by more frequent
preventive maintenance and
higher costs for troubleshoot-
ing engine and fuel system
issues.
- Exhaust system – Costs were
low for both fleets.
- Fuel system – The per-mile
LNG truck maintenance
costs were 6.2 times higher
than the diesel trucks; the
per-engine hour costs were
4.7 times higher. This was
caused by significantly
higher labor costs to trou-
bleshoot and repair small
LNG leaks and problems
with the LNG tanks. Also,
the LNG fuel filters cost
nearly 10 times more than
the diesel fuel filters. The
diesel and LNG trucks had
some maintenance work for
accelerator pedal problems.
- Engine system – The LNG
truck maintenance costs
were 6 times higher per mile
than the diesel trucks and
4.5 times higher per engine
hour. The parts costs for
both groups were almost
entirely engine oil and filters
changed as part of preven-
tive maintenance.
- Non-lighting electrical sys-
tems – The maintenance
costs were low for the diesel
trucks, only 3 labor hours.
The LNG maintenance costs
consisted of charging and
cranking system problems
with one voltmeter and one
alternater being replaced.

Alternative FuelTrucks
Final Results
18
- Air intake system – Costs
were low for both fleets.
- Cooling system – Costs were
low for both fleets.
• PMA inspections (labor hours
only) – The LNG trucks had
70% higher costs for inspections
based on mileage and 30% more
based on engine hours. The
diesel trucks had preventive
maintenance every 600 engine
hours (3 to 4 times per year), and
the LNG trucks had preventive
maintenance every 300 engine
hours (7 to 8 times per year).
• Cab, body, and accessories sys-
tems – The LNG trucks had
nearly double the costs for
these systems (2.1 times based
on mileage and 1.6 times based
on engine hours). Maintenance
costs for both sets of trucks
were for doors, windshields
and windows, horns, mirrors,
wipers, and mud flaps. There
were only a few hours for each
truck group to repair minor
accident damage.
• Frame, steering, and suspen-
sion system – Costs were
nearly the same for both fleets.
• PTO and hydraulic systems –
The LNG trucks had costs 2.3
times higher based on mileage
and 1.7 times higher based on
engine hours.
• Axles, wheels, and drive shaft
systems – Costs were low for
both fleets.
• Tire systems – Costs were nearly
the same: the diesel trucks
had 38% higher costs based
on mileage and only 4% higher
based on engine hours.
• Lighting system – Costs were
nearly the same. The LNG trucks
had 13% higher costs based on
mileage and 15% lower costs
based on engine hours.
Warranty Costs
Warranty information collected
for this project included only
work on the engine and fuel
systems for the LNG trucks. No
warranty information was col-
lected for the diesel trucks, so
no warranty cost comparison
between the fleets is possible.
As discussed earlier, Waste
Management included in its
maintenance cost totals a
substantial amount of labor
cost that normally would have
been borne by the truck
manufacturer.
Further details on warranty
repairs, modifications, and start-
up activities were presented in
Waste Management’s LNG TruckFleet: Start-Up Experience.
Overall Maintenance Costs
Figures 11 and 12 show the total
maintenance costs by fleet based
on mileage and engine hours,
respectively. The figures also
show miles or hours per truck,
and breakouts for the separate
parts and labor elements of the
total maintenance costs.
For this analysis, labor costs
were held constant at $50 per
hour. The focus of the analysis
was on similar vehicle lifetimes
(12 months).
Overall, the maintenance costs
per mile (Figure 11) were 63%
higher for the LNG trucks. The
average vehicle mileage was 31%
lower, the parts costs were nearly
the same (1% lower), and the
labor hours were 20% higher for
the LNG trucks.

Alternative FuelTrucks
Final Results
19
Figure 12 shows that the mainte-
nance costs per engine hour
were 23% higher for the LNG
trucks. The LNG and diesel
vehicles had comparable usage
as measured by engine hours,
9% lower for the LNG trucks.
A similar usage basis for the
maintenance costs shows a more
accurate comparison of costs.
The higher labor hours were
caused by a higher rate of repairs
for the hydraulic system/packer
body and troubleshooting labor
for the engine and fuel systems
for the LNG trucks. These costs
should decrease over time with
more mechanic experience.
Overall Operating Costs
Figure 13 provides a summary of
operating costs (without driver
labor) based on vehicle mileage.
Figure 14 provides a similar
summary based on vehicle engine
hours of operation. These results
are for similar vehicle lifetime
data periods.
Overall, the LNG trucks had
significantly higher costs than the
diesel trucks, 80% higher based
on mileage and 37% higher based
on engine hours. As mentioned
earlier, Waste Management’s LNG
was very expensive at $0.88 per
LNG gallon (before taxes), and
Waste Management incurred
substantial unreimbursed
expenses for maintenance on the
trucks under warranty, unlike
prevailing industry practice for
new vehicles.
Future operating costs should
decrease with the addition of
small-scale liquefaction at the
Washington, Pennsylvania, site.
With more experience with the
LNG trucks, troubleshooting
labor costs should also decline.

Alternative FuelTrucks
Final Results
20
Similar preventive maintenance
periods will also show a signifi-
cant reduction in maintenance
costs for the LNG trucks.
Emissions Testing Results
Emissions tests on the diesel
trucks and six LNG trucks were
conducted by the WVU Depart-
ment of Mechanical and Aero-
space Engineering using one of
its transportable heavy-duty
chassis dynamometer emissions
laboratories (developed under
DOE sponsorship).
WVU used the standard CBD
speed-versus-time cycle to
evaluate each truck. WVU also
measured the operation of trucks
in service, then developed a
customized test cycle that repre-
sents the operation of the trucks
more closely than the CBD cycle.
The average speed for the CBD
cycle is 12.7 mph, for the Waste
Management cycle, 10.6 mph.
WVU evaluated emissions from
Waste Management’s trucks in
January and February 2000.
Detailed emissions testing results
are presented in Appendix B and
in the Final Data Report.
Figure 15 shows the emissions
testing results for the CBD duty
cycle, and Figure 16 shows the
emissions testing results for the
Waste Management duty cycle.
Turbocharger Effects on NOx Emissions
The emissions testing revealed
that three LNG trucks were emit-
ting high nitrogen oxide (NOx)
levels compared to the diesel and
the other LNG trucks. The prob-
lem was traced to faulty turbo-
chargers, which Mack has since
resolved by changing suppliers.

Alternative FuelTrucks
Final Results
21

Alternative FuelTrucks
Final Results
22
Because this problem appears to
be a specific equipment problem
related only to NOx emissions,
the NOx results are shown for all
LNG trucks and then without the
high NOx LNG trucks. Unless
otherwise noted, references to
LNG trucks include all the LNG
trucks tested by WVU.
CBD Duty Cycle Results
On the CBD cycle (Figure 15),
the LNG trucks had 40% higher
carbon monoxide (CO) and 94%
lower particulate matter (PM).
The LNG trucks, on average, had
22% higher NOx with the high
emitters included. Excluding the
three high NOx emitters from the
comparison, the LNG trucks had
a result 16% lower.
When comparing non-methane
hydrocarbons (NMHC) for the
LNG trucks and hydrocarbons
(HC) for the diesel control trucks
(all HC emissions for the diesel
trucks are assumed to be non-
methane), the results showed
that the LNG trucks had signifi-
cantly lower emissions.
The LNG trucks also had 21%
lower levels of carbon dioxide
(CO2). The average miles per
diesel equivalent gallon (mpeg)
for the LNG trucks obtained dur-
ing emissions testing was much
higher than the result obtained
from in-use fuel economy data,
as discussed earlier. The LNG
truck mpeg was only 9% lower
than the mpg measured for diesel
trucks on the CBD cycle.
Waste Management Duty Cycle Results
On the Waste Management cycle
(Figure 16), the LNG trucks had
80% higher CO and 86% lower
PM. The LNG trucks, on average,
had 4% lower NOx with the high
emitters included. Excluding the
high NOx emitters from the
comparison, the LNG trucks
had a result 32% lower.
When comparing NMHC for
the LNG trucks and HC for the
diesel control trucks, the results
showed that the LNG trucks had
significantly lower emissions.
The LNG trucks also had 18%
lower levels of CO2. The LNG
truck mpeg was only 12% lower
than the mpg measured for the
diesel trucks on the Waste
Management cycle.
U.S. EPA Emissions Certification
The U.S. Environmental Protec-
tion Agency (EPA) certification
standard for engines from model
years 1998 through 2001, along
with the emissions certification
testing data from Mack diesel and
natural gas engines for model
year 2000. The Mack engines
meet the standards for all emis-
sion species. (See Table 4.)
The certification test is performed
on an engine in a laboratory. The
results are expressed in grams
per brake-horsepower hour, and
thus differ from the values shown
in Figures 15 and 16 from the
WVU emissions testing. Because
the EPA certification tests are
engine based rather than vehicle
based and use a different testing
cycle, there is no direct compari-
son between the EPA values and
the chassis dynamometer emis-
sions testing results from WVU.

Alternative FuelTrucks
Final Results
23
* Mack waived the CO measurement based on diesel engines historically having low CO emissions.
** The results for NOx include a deterioration factor developed for each engine family.
Standard/ Non-Methane (Total) Carbon Oxides of ParticulateCertification Hydrocarbons Monoxide Nitrogen Matter
NMHC (HC) CO NOx PM
1998+ Truck 1.2 (1.3) 15.5 4.0 0.10
Mack EM7-300 Diesel 0.11 Waiver* 3.669** 0.081
Mack E7G-350 NG 0.276 1.32 2.323** 0.026
Table 4. Engine Certification Level and Data (grams per brake-horsepower hour)

Alternative FuelTrucks
Final Results
24
Summary and Conclusions
Based on the evaluation of the
Waste Management LNG trucks
used in Washington, Pennsylvania,
we can conclude several major
points:
• In general, the LNG trucks
were used in a similar manner
as the diesel trucks, and the
LNG trucks met all require-
ments for operation. The
monthly average mileage (miles
driven) per truck was 26%
lower for the LNG trucks, but
the monthly average engine
hours per truck were only
3% lower for the LNG trucks.
• The LNG trucks were used to
haul 34% more refuse by
weight each day. Another differ-
ence in operation was a lower
average speed (8.7 mph for
LNG and 11.5 mph for diesel).
• Drivers and refuse workers
report no difference in power
between the LNG and diesel
trucks. The refuse workers
prefer the LNG trucks because
of the lack of diesel exhaust
smell, which is important to
them because they have to walk
behind the trucks. Also, they
prefer the quieter operation of
the LNG trucks.
• Emissions testing results from
testing on a portable chassis
dynamometer using two duty
cycles showed much lower PM
emissions for the LNG trucks.
The NMHC emissions for the
LNG trucks were much lower
than the HC emissions for the
diesel trucks. CO2 emissions
were 18% to 21% lower for the
LNG trucks, and CO emissions
were 40% to 80% higher for the
LNG trucks.
• Results for NOx emissions are
more difficult to interpret.
Three of the LNG trucks tested
had higher than expected NOx
emissions, traced by Mack to a
malfunctioning turbocharger
(Mack has changed suppliers
for new engines). When those
trucks are not included in the
analysis, the LNG trucks had
16% lower NOx than the diesel
trucks on the CBD cycle and
32% lower NOx than the
diesel trucks on the Waste
Management cycle.
• Diesel equivalent per-mile fuel
economy was 27% lower for
the LNG trucks for in-use
operation. Diesel equivalent
fuel consumption per engine
hour was only 4% higher for
the LNG trucks.
The in-service fuel economy
was affected by the lower aver-
age operating speed of the LNG
trucks compared to the diesel
trucks and the LNG trucks
being used to haul more refuse
(by weight) than the diesel
trucks each day.
• Per-mile fuel economy mea-
sured during the emissions
testing showed that the LNG
trucks had diesel equivalent
gallon fuel economy 9% lower
for the CBD cycle and
12% lower for the Waste

Alternative FuelTrucks
Final Results
25
Management cycle. Because the
trucks were operated with the
same packer load and over the
same driving cycle during the
emissions tests, the comparison
more clearly indicates the effect
of the fuel on fuel economy
than the in-use comparison.
• Per-mile maintenance costs for
the LNG trucks were 63% higher
and engine-hour costs 23%
higher. For the engine- and
fuel-related systems (the engine,
fuel, air intake, cooling, and
non-lighting electrical systems),
the per-mile maintenance costs
were 5.1 times higher for the
LNG trucks and per-engine-
hour costs 3.8 times higher.
• Waste Management in
Washington, Pennsylvania, has
been dedicated to operating
the LNG trucks, and agreed to
do most of the warranty work
without reimbursement from
Mack. The mechanics have
learned to troubleshoot and
service the LNG trucks with
much less support from the
manufacturer compared to
other alternative fuel opera-
tions or other new technology
development projects.
This has caused the mainte-
nance costs to be significantly
higher than expected for the
LNG trucks, and these costs
are expected to decrease signif-
icantly with more experience
in operation. Mack has been
extremely responsive to Waste
Management’s needs to make
changes to the LNG trucks, and
provides parts on short notice.
Also, these high costs were
affected by the preventive
maintenance schedule being
twice as often for the LNG
trucks. Mack has since made
the preventive maintenance
cycle the same as for diesel (in
model year 2000), 600 engine
hours. Mack is considering
increasing the maintenance
interval for the LNG trucks by
50% to 900 engine hours.
• During the data collection and
evaluation, Waste Management
paid $0.88 per LNG gallon
(before taxes), an extremely
high price compared to other
alternative fuel sites. Other
LNG sites in the United States
have reported costs of $0.45 to
$0.50 per LNG gallon.
Transportation-grade LNG
has to be trucked in from the
western United States at a
significant cost. Options for
small-scale liquefaction are
being explored on-site using
natural gas from the Columbia
Gas pipeline. Landfill gas may
be used in the future.
• Overall, the LNG trucks cost
80% more to operate per mile
and 37% more per engine hour.
Total operating costs excluded
driver labor, but included fuel
and engine oil consumption
costs and maintenance costs.
• The LNG fuel station was
installed with the storage tank
underground. It is reportedly
operating well, although
problems were reported with
the fuel nozzle (leaking and
difficulty getting on and off the
truck fuel tank). There was a
problem with the dispenser
readout, but there have been
no major operations problems.

Final Results
26
Alternative FuelTrucks
Currently, Waste Management in
Washington, Pennsylvania, has
seven LNG trucks in service.
There are no plans to purchase
more LNG trucks. The main issue
is the cost of LNG fuel.
Alternative fuel project partners
affiliated with the site, led by
Chart Industries, Inc., and
Brookhaven National Laboratory,
are developing an on-site small-
scale liquefaction capability. It
will use natural gas from the
Columbia Gas pipeline. Landfill
gas may also be used in the
future as the feedstock. Having
on-site fuel production is ex-
pected to bring the fuel cost
down to the $0.50 per LNG
gallon range.
Waste Management is commited
to cleaner burning truck tech-
nologies. During the next two
years, Waste Management plans
to deploy approximately 200 LNG
refuse collection trucks in
locations throughout California.
Future LNG Operations at Waste Management

Alternative FuelTrucks
Final Results
27
Contacts
WASTE MANAGEMENT
Ben Woods, Jr.
District Manager
200 Rangos Lane
Washington, PA 15301
724/228-4200
WASTE MANAGEMENT
Jerry Simmons
Fleet Manager
200 Rangos Lane
Washington, PA 15301
724/228-4200
WASTE MANAGEMENT
Chuck Vleck
Fleet Director, Eastern Area
Westpointe Corporate Center,
Suite 200
Coropolis Heights Road
Moon Township, PA 15108
412/893-4900
MACK TRUCKS, INC.
Ken Murphy
Senior Staff Engineer
13302 Pennsylvania Avenue
Hagerstown, MD 21742
301/790-5594
MACK TRUCKS, INC.
Steve Ginter
Marketing Manager
2100 Mack Boulevard
Allentown, PA 18105
610/709-3259
PA DEPT. OF ENVIRONMENTALPROTECTION
Susan K. Summers
Bureau of Air Quality
Program Coordinator
P.O. Box 8468
Harrisburg, PA 17105-8468
717/783-9242
COLUMBIA GAS
Mack Godfrey
Engineering Consulting
650 Washington Road
Pittsburgh, PA 15228
412/572-7124
NATIONAL RENEWABLE ENERGY LABORATORY
Paul NortonSenior Project Engineer1617 Cole BoulevardGolden, CO 80401303/384-7545
BATTELLE
Kevin ChandlerProject Manager505 King AvenueColumbus, OH 43201614/424-5127
WEST VIRGINIA UNIVERSITY
Nigel ClarkDepartment of Mechanical &Aerospace Engineering
Morgantown, WV26506-6106304/293-3111 ext. 2311

Alternative FuelTrucks
Final Results
28
References and Related Reports
Battelle, 2000, Dallas Area Rapid Transit (DART) LNG Bus Site: FinalResults, National Renewable Energy Laboratory, Golden, CO.
Battelle, 2000, DART’s LNG Bus Fleet, Final Data Report, National
Renewable Energy Laboratory, Golden, CO.
Battelle, 2000, DART’s LNG Bus Fleet, Start-Up Experience, National
Renewable Energy Laboratory, Golden, CO, NREL/BR-540-28124.
Battelle, 2000, Waste Management’s LNG Truck Fleet, Final DataReport, National Renewable Energy Laboratory, Golden, CO.
Chandler, K., Norton, P., Clark, N., 2000, Raley’s LNG Truck Fleet, FinalResults, National Renewable Energy Laboratory, Golden, CO, NREL/BR-
540-27678.
Battelle, 1999, Raley’s LNG Truck Site, Final Data Report, Battelle,
Columbus, OH.
Battelle, 1999, Waste Management’s LNG Truck Fleet, Start-Up Experi-ence, National Renewable Energy Laboratory, Golden, CO, NREL/BR-
540-26617.
Chandler, K., Norton, P., Clark, N., 1999, Interim Results from Alterna-tive Fuel Truck Evaluation Project, SAE International, Warrendale, PA,
SAE Pub. #1999-01-1505.
Chandler, K., Norton, P., Clark, N., 1999, Update from the NREL Alter-native Fuel Transit Bus Evaluation Program, American Public Transit
Association, 1999 Bus Conference, Cleveland, OH.
Norton, P., Vertin, K., Bailey, B., Clark, N., Lyons, D., Goguen, S.,
Eberhardt, J., 1998, Emissions from Trucks Using Fischer-Tropsch DieselFuel, SAE International, Warrendale, PA, SAE Pub. #982426.
Chandler, K., Norton, P., Clark, N., 1998, Alternative Fuel Truck Evalua-tion Project – Design and Preliminary Results, SAE International, War-
rendale, PA, SAE Pub. #981392.
Battelle, 1998, Dual-Fuel Truck Fleet, Start-Up Experience, National
Renewable Energy Laboratory (NREL), Golden, CO, NREL/BR-540-25118.

Alternative FuelTrucks
Final Results
29
Battelle, 1998, Using CNG Trucks in National Parks, National Renew-
able Energy Laboratory (NREL), Golden, CO, NREL/BR-540-24744.
Clark, N., Lyons, D., Rapp, L., Gautam, M., Wang, W., Norton, P., White,
C., Chandler, K., 1998, Emissions from Trucks and Buses Powered byCummins L-10 Natural Gas Engines, SAE International, Warrendale, PA,
SAE Pub. #981393.
Clark, N., Gautam, M., Lyons, D., Bata, R., Wang, W., Norton, P., Chandler,
K., 1997, Natural Gas and Diesel Transit Bus Emissions: Review andRecent Data, SAE International, Warrendale, PA, SAE Pub. #973203.
Battelle, 1997, Raley’s LNG Truck Fleet, Start-Up Experience, National
Renewable Energy Laboratory (NREL), Golden, CO, NREL/BR-540-23402.
Battelle, 1996, Alternative Fuel Transit Buses, The Pierce Transit Suc-cess Story…, National Renewable Energy Laboratory, Golden, CO,
NREL/SP-425-21606.
Chandler, K., Malcosky, N., Motta, R., Norton, P., Kelly, K., Schumacher,
L., Lyons, D., 1996, Alternative Fuel Transit Bus Evaluation ProgramResults, SAE International, Warrendale, PA, SAE Pub. #961082.
Chandler, K., Malcosky, N., Motta, R., Kelly, K., Norton, P., Schumacher,
L., 1996, Final Alternative Fuel Transit Bus Evaluation Results,Battelle, Columbus, OH.
Motta, R., Norton, P., Kelly, K., Chandler, K., Schumacher, L., Clark, N.,
1996, Alternative Fuel Transit Buses, Final Results from the NationalRenewable Energy Laboratory (NREL) Vehicle Evaluation Program,NREL, Golden, CO, NREL/TP-425-20513.
Wang, W., Gautam, M., Sun, X., Bata, R., Clark, N., Palmer, G., Lyons, D.,
1993, Emissions Comparisons of Twenty-Six Heavy-Duty Vehicles Oper-ated on Conventional Alternative Fuels, SAE International, Warrendale,
PA, SAE Pub. #932952.
Bata, R., Clark, N., Gautam, M., Howell, A., Long, T., Loth, J., Lyons, D.,
Palmer, M., Rapp, B., Smith, J., Wang, W., 1991, The First TransportableHeavy Duty Vehicle Emissions Testing Laboratory, SAE International,
Warrendale, PA, SAE Pub. #912668.


Alternative FuelTrucks
Final Results
A-1
Appendix AFleet Summary
Statistics

Alternative FuelTrucks
Final Results
A-2
Table A-1. Waste Management of PA (Washington, PA) Fleet Summary Statistic (Based on Engine Hours and Mileage) Fleet Operations and Economics Similar Vehicle Lifetimes
DieselControl LNG
Number of Vehicles 3 5
Period Used for Fuel and Oil Op Analysis 11/98 - 10/99 11/98 - 10/99
Total Number of Months in Period 12 12
Fuel and Oil Analysis Base Engine Hours 6,678 7,895
Period Used for Maintenance Op Analysis 12 Month 12 Month
Total Number of Months in Period 12 12
Maintenance Analysis Base Engine Hours 7,230 10,979
Average Monthly Engine Hours per Vehicle 200 195
Average Speed 11.47 8.67
Fleet Fuel Usage in Diesel #2 Equiv. Gal. 26,149 32,291
LNG Gallons per Hour (GPH) 6.81
Representative Fleet GPH (energy equiv) 3.92 4.09
Ratio of GPH (AF/DC) 1.04
Average Fuel Cost as Reported (with tax) 1.20 1.06
per Gal D2 per Gal LNG
Average Fuel Cost per Energy Equivalent 1.20 1.77
Fuel Cost per Hour 4.699 7.233
Number of Make-Up Oil Quarts per Hour 0.012 0.017
Oil Cost per Quart 0.65 1.35
Oil Cost per Hour 0.008 0.024
Total Scheduled Repair Cost per Hour 1.394 1.673
Total Unscheduled Repair Cost per Hour 4.559 5.646
Total Maintenance Cost per Hour 5.954 7.319
Total Operating Cost per Hour 10.660 14.576
Appendix A Fleet Summary Statistics

Alternative FuelTrucks
Final Results
A-3
Fleet Operations and Economics Similar Vehicle LifetimesDiesel
Control LNGNumber of Vehicles 3 5
Period Used for Fuel and Oil Op Analysis 11/98 - 10/99 11/98 - 10/99
Total Number of Months in Period 12 12
Fuel and Oil Analysis Base Fleet Mileage 76,514 69,106
Period Used for Maintenance Op Analysis 12 Month 12 Month
Total Number of Months in Period 12 12
Maintenance Analysis Base Fleet Mileage 82,866 95,143
Average Monthly Mileage per Vehicle 2,295 1,688
Average Speed (mph) 11.47 8.67
Fleet Fuel Usage in Diesel #2 Equiv. Gal. 26,149 32,291
LNG MPG 1.28
Representative Fleet MPG (energy equiv) 2.93 2.14
Ratio of MPG (AF/DC) 0.73
Average Fuel Cost as Reported (with tax) 1.20 1.06
per Gal D2 per Gal LNG
Average Fuel Cost per Energy Equivalent 1.20 1.77
Fuel Cost per Mile 0.410 0.826
Number of Make-Up Oil Quarts per Mile 0.001 0.002
Oil Cost per Quart 0.65 1.35
Oil Cost per Mile 0.001 0.003
Total Scheduled Repair Cost per Mile 0.122 0.193
Total Unscheduled Repair Cost per Mile 0.398 0.651
Total Maintenance Cost per Mile 0.519 0.845
Total Operating Cost per Mile 0.930 1.674
DieselControl LNG
Fleet Engine Hours 7,230 10,979
Fleet Mileage 82,866 95,143
Total Parts Cost 15,544.01 25,536.04
Total Labor Hours 550.0 1096.3
Average Labor Cost 27,500.00 54,815.00
(@ $50.00 per hour)
Total Maintenance Cost 43,044.01 80,351.04
Monthly Maintenance Cost per Truck 1,195.67 1,691.60
Total Maintenance Cost per Hour 5.954 7.319Total Maintenance Cost per Mile 0.519 0.845
Maintenance Costs

Alternative FuelTrucks
Final Results
A-4
Breakdown of Maintenance Costs by Vehicle SystemDiesel
Control LNGFleet Engine Hours 7,230 10,979Fleet Mileage 82,866 95,143Total Engine/Fuel-Related Systems (ATA VMRS 30, 31, 32, 33, 41, 42, 43, 44, 45)Parts Cost 725.52 3,671.81Labor Hours 29.3 180.9Average Labor Cost 1,462.50 9,045.00Total Cost (for system) 2,188.02 12,716.81Monthly Cost (for system) per Truck 60.78 267.72Total Cost (for system) per Hour 0.3026 1.1583Total Cost (for system) per Mile 0.0264 0.1337Exhaust System Repairs (ATA VMRS 43)Parts Cost 97.61 21.91Labor Hours 1.8 7.6Average Labor Cost 87.50 380.00Total Cost (for system) 185.11 401.91Monthly Cost (for system) per Truck 5.14 8.46Total Cost (for system) per Hour 0.0256 0.0366Total Cost (for system) per Mile 0.0022 0.0042Fuel System Repairs (ATA VMRS 44)Parts Cost 52.08 1,040.76Labor Hours 11.0 65.7Average Labor Cost 550.00 3,285.00Total Cost (for system) 602.08 4,325.76Monthly Cost (for system) per Truck 16.72 91.07Total Cost (for system) per Hour 0.0833 0.3940Total Cost (for system) per Mile 0.0073 0.0455

DieselControl LNG
Air Intake System Repairs (ATA VMRS 41)Parts Cost 76.28 130.73Labor Hours 3.0 1.0Average Labor Cost 150.00 50.00Total Cost (for system) 226.28 180.73Monthly Cost (for system) per Truck 6.29 3.80Total Cost (for system) per Hour 0.0313 0.0165Total Cost (for system) per Mile 0.0027 0.0019Cooling System Repairs (ATA VMRS 42)Parts Cost 62.17 77.60Labor Hours 2.5 6.6Average Labor Cost 125.00 330.00Total Cost (for system) 187.17 407.60Monthly Cost (for system) per Truck 5.20 8.58Total Cost (for system) per Hour 0.0259 0.0371Total Cost (for system) per Mile 0.0023 0.0043Brake System Repairs (ATA VMRS 13)Parts Cost 1,986.00 2,205.84Labor Hours 94.0 123.9Average Labor Cost 4,700.00 6,192.50Total Cost (for system) 6,686.00 8,398.34Monthly Cost (for system) per Truck 185.72 176.81Total Cost (for system) per Hour 0.9248 0.7649Total Cost (for system) per Mile 0.0807 0.0883
Power Plant (Engine) Repairs (ATA VMRS 45)Parts Cost 437.38 1,744.74Labor Hours 8.0 80.3Average Labor Cost 400.00 4,012.50Total Cost (for system) 837.38 5,757.24Monthly Cost (for system) per Truck 23.26 121.21Total Cost (for system) per Hour 0.1158 0.5244Total Cost (for system) per Mile 0.0101 0.0605Electrical System Repairs (ATA VMRS 30-Electrical General,31-Charging, 32-Cranking, 33-Ignition)Parts Cost 0.00 656.07Labor Hours 3.0 19.8Average Labor Cost 150.00 987.50Total Cost (for system) 150.00 1,643.57Monthly Cost (for system) per Truck 4.17 34.60Total Cost (for system) per Hour 0.0207 0.1497Total Cost (for system) per Mile 0.0018 0.0173
Alternative FuelTrucks
Final Results
A-5
Breakdown of Maintenance Costs by Vehicle System (continued)

Cab, Body, and Accessories Systems Repairs(ATA VMRS 02-Cab and Sheet Metal, 50-Accessories, 71-Body)Parts Cost 484.59 929.17
Labor Hours 28.5 71.9
Average Labor Cost 1,425.00 3,592.50
Total Cost (for system) 1,909.59 4,521.67
Monthly Cost (for system) per Truck 53.04 95.19
Total Cost (for system) per Hour 0.2641 0.4118Total Cost (for system) per Mile 0.0230 0.0475Inspections Only - no parts replacements (101)Parts Cost 0.00 0.00
Labor Hours 42.3 83.0
Average Labor Cost 2,112.50 4,150.00
Total Cost (for system) 2,112.50 4,150.00
Monthly Cost (for system) per Truck 58.68 87.37
Total Cost (for system) per Hour 0.2922 0.3780Total Cost (for system)per Mile 0.0255 0.0436HVAC System Repairs (ATA VMRS 01)Parts Cost 0.00 18.87
Labor Hours 2.0 3.4
Average Labor Cost 100.00 170.00
Total Cost (for system) 100.00 188.87
Monthly Cost (for system) per Truck 2.78 3.98
Total Cost (for system) per Hour 0.0138 0.0172Total Cost (for system) per Mile 0.0012 0.0020
Breakdown of Maintenance Costs by Vehicle System (continued)Diesel
Control LNG
Alternative FuelTrucks
Final Results
A-6
Transmission Repairs (ATA VMRS 27)Parts Cost 275.28 547.54Labor Hours 4.5 11.6Average Labor Cost 225.00 580.00Total Cost (for system) 500.28 1,127.54Monthly Cost (for system) per Truck 13.90 23.74Total Cost (for system) per Hour 0.0692 0.1027Total Cost (for system) per Mile 0.0060 0.0119PTO and Hydraulic Repairs (ATA VMRS 56-PTO, 65-Hydraulic)Parts Cost 634.13 1,140.16Labor Hours 65.5 179.3Average Labor Cost 3,275.00 8,962.50Total Cost (for system) 3,909.13 10,102.66Monthly Cost (for system) per Truck 108.59 212.69Total Cost (for system) per Hour 0.5407 0.9202Total Cost (for system) per Mile 0.0472 0.1062
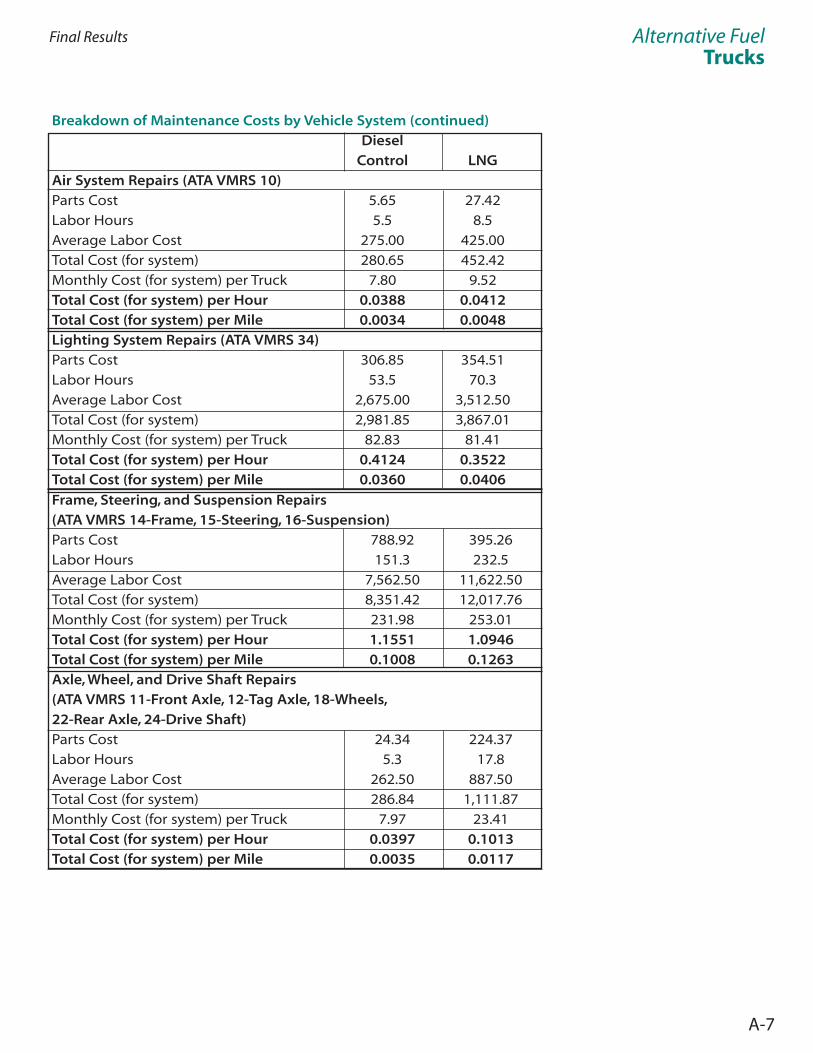
Alternative FuelTrucks
Final Results
A-7
Breakdown of Maintenance Costs by Vehicle System (continued)Diesel
Control LNGAir System Repairs (ATA VMRS 10)Parts Cost 5.65 27.42
Labor Hours 5.5 8.5
Average Labor Cost 275.00 425.00
Total Cost (for system) 280.65 452.42
Monthly Cost (for system) per Truck 7.80 9.52
Total Cost (for system) per Hour 0.0388 0.0412Total Cost (for system) per Mile 0.0034 0.0048Lighting System Repairs (ATA VMRS 34)Parts Cost 306.85 354.51
Labor Hours 53.5 70.3
Average Labor Cost 2,675.00 3,512.50
Total Cost (for system) 2,981.85 3,867.01
Monthly Cost (for system) per Truck 82.83 81.41
Total Cost (for system) per Hour 0.4124 0.3522Total Cost (for system) per Mile 0.0360 0.0406
Frame, Steering, and Suspension Repairs (ATA VMRS 14-Frame, 15-Steering, 16-Suspension)Parts Cost 788.92 395.26
Labor Hours 151.3 232.5
Average Labor Cost 7,562.50 11,622.50
Total Cost (for system) 8,351.42 12,017.76
Monthly Cost (for system) per Truck 231.98 253.01
Total Cost (for system) per Hour 1.1551 1.0946Total Cost (for system) per Mile 0.1008 0.1263Axle, Wheel, and Drive Shaft Repairs (ATA VMRS 11-Front Axle, 12-Tag Axle, 18-Wheels,22-Rear Axle, 24-Drive Shaft)Parts Cost 24.34 224.37
Labor Hours 5.3 17.8
Average Labor Cost 262.50 887.50
Total Cost (for system) 286.84 1,111.87
Monthly Cost (for system) per Truck 7.97 23.41
Total Cost (for system) per Hour 0.0397 0.1013Total Cost (for system) per Mile 0.0035 0.0117

Alternative FuelTrucks
Final Results
A-8
Breakdown of Maintenance Costs by Vehicle System (continued)Diesel
Control LNGTire Repairs (ATA VMRS 17)Parts Cost 10,312.73 16,021.09
Labor Hours 68.5 113.5
Average Labor Cost 3,425.00 5,675.00
Total Cost (for system) 13,737.73 21,696.09
Monthly Cost (for system) per Truck 381.60 456.76
Total Cost (for system) per Hour 1.9001 1.9761Total Cost (for system) per Mile 0.1658 0.2280

Alternative FuelTrucks
Final Results
B-1
Appendix BEmissions Test
Results

Alternative FuelTrucks
Final Results
B-2
Test
IDW
VU R
ef N
umFu
elM
odel
YrOd
omet
erCy
cle
CONO
xHC
PMCO
2M
PGBt
uCH
4NM
HC
3562
WHM
-300
237-
D2-3
CBD
D219
9771
600
3CBD
5.2
32.5
0.70
0.99
3400
2.98
4356
8
3598
WHM
-300
239-
D2-3
CBD
D219
9769
500
3CBD
4.6
32.6
0.62
0.88
3398
2.99
4352
9
Aver
age
4.9
32.6
0.66
0.93
3399
2.99
4354
8
3569
WHM
-300
240-
LNG-
3CBD
LNG
1998
3390
03C
BD6.
650
.618
.60.
0727
002.
7247
212
16.3
0.24
3572
WHM
-300
241-
LNG-
3CBD
LNG
1998
4100
03C
BD6.
754
.015
.90.
0727
202.
7147
426
15.4
0.19
3575
,357
7W
HM-3
0024
3-LN
G-3C
BDLN
G19
9745
400
3CBD
6.4
22.8
16.8
0.05
2554
2.88
4462
815
.00.
12
3580
WHM
-300
489-
LNG-
3CBD
LNG
1999
1280
03C
BD6.
628
.329
.40.
0227
492.
6548
563
26.7
0.22
3567
WHM
-303
351-
LNG-
3CBD
LNG
1999
1500
03C
BD7.
551
.616
.80.
0727
482.
6847
967
15.2
0.20
3583
WHM
-303
352-
LNG-
3CBD
LNG
1999
1710
03C
BD7.
331
.123
.70.
0727
062.
7047
569
21.4
0.28
Aver
age:
6.9
39.7
20.2
0.06
2696
2.72
4722
818
.30.
21
Perc
ent D
iffer
ence
:40
.422
.0-9
3.7
-20.
7-8
.88.
4-6
8.6
Aver
age,
High
NO x
Rem
oved
:27
.4
Perc
ent D
iffer
ence
:-1
5.9
Ap
pen
dix
B E
mis
sio
ns
Test
Res
ult
s Ta
ble
B-1
.Em
issi
on
s Te
stin
g a
t W
aste
Man
agem
ent
in W
ash
ing
ton
,Pen
nsy
lvan
iaR
esu
lts
fro
m C
BD
Cyc
le E
mis
sio
ns
Test
ing
(g/m
i)
Res
ult
s fr
om
Was
te M
anag
emen
t C
ycle
Em
issi
on
s Te
stin
g (g
/mi)
Test
IDW
VU R
ef N
umFu
elM
odel
YrOd
omet
erCy
cle
CONO
xHC
PMCO
2M
PGBt
uCH
4NM
HC
3563
WHM
-300
237-
D2-W
HMD2
1997
7160
0W
HM4.
232
.70.
660.
7732
303.
1441
377
3599
WHM
-300
239-
D2-W
HMD2
1997
6950
0W
HM3.
733
.20.
630.
7133
403.
0442
774
Aver
age:
3.9
33.0
0.64
0.74
3285
3.09
4207
5
3570
WHM
-300
240-
LNG-
WHM
LNG
1998
3390
0W
HM6.
738
.520
.20.
0627
182.
7047
604
18.3
0.27
3573
WHM
-300
241-
LNG-
WHM
LNG
1998
4100
0W
HM6.
946
.618
.80.
1027
022.
7247
271
16.9
0.25
3578
WHM
-300
243-
LNG-
WHM
LNG
1997
4540
0W
HM6.
819
.520
.50.
1126
582.
7646
582
18.5
0.27
3581
WHM
-300
489-
LNG-
WHM
LNG
1999
1280
0W
HM7.
023
.233
.20.
0525
872.
8045
977
30.1
0.21
3566
WHM
-303
351-
LNG-
WHM
LNG
1999
1500
0W
HM7.
438
.416
.20.
2327
512.
6847
998
14.6
0.24
3584
WHM
-303
352-
LNG-
WHM
LNG
1999
1710
0W
HM7.
324
.127
.20.
0827
072.
6947
751
24.6
0.31
Aver
age:
7.0
31.7
22.7
0.10
2687
2.72
4719
720
.50.
26
Perc
ent D
iffer
ence
:79
.5-3
.8-8
5.9
-18.
2-1
1.9
12.2
-59.
6
Aver
age,
High
NO x
Rem
oved
:22
.3
Perc
ent D
iffer
ence
:-3
2.4

Produced by the
Center for Transportation Technologies and Systems at the National
Renewable Energy Laboratory (NREL), a U.S. Department of Energy
national laboratory
NREL
1617 Cole Boulevard
Golden, Colorado 80401-3393
NREL/BR-540-29073
January 2001
Printed with a renewable-source ink on paper containing at least
50% wastepaper, including 20% postconsumer waste