Embed Size (px)
Citation preview

ANALYSIS OF SMALL-SCALE DAIRY FARMERS’ PERCEPTIONS OF
ALTERNATIVE FODDER GRASSES CONTINGENT ON NAPIER STUNT DISEASE
IN BUNGOMA DISTRICT, KENYA
RUTH CHEPCHIRCHIR TARUSS
A Thesis Submitted to the Graduate School in Fulfillment for the Requirements of the
Master of Science Degree in Agricultural and Applied Economics of Egerton University
EGERTON UNIVERSITY
OCTOBER, 2010
ii
DECLARATION AND RECOMMENDATION
DECLARATION
I hereby declare that this is my original work and has not been presented in this or any other
university for the award of a degree.
Ruth Chepchirchir Taruss
KM17/1865/07
Sign:
Date: 15th
October, 2010
RECOMMENDATION
This work has been submitted with our recommendation as supervisors.
Prof. Gideon A. Obare
Department of Agricultural Economics, Egerton University
Sign:
Date: 14th
October, 2010
Dr. David M. Amudavi
Department of Agricultural Education and Extension, Egerton University
Sign:
Date: 15th
October, 2010
Dr. Zeyaur R. Khan
International Centre of Insect Physiology and Ecology (ICIPE)
Sign:
Date: 15th
October, 2010
iii
COPYRIGHT
No part of this thesis may be reproduced, stored in a retrieval system, or transmitted in any form
or by any means; electronic, mechanical, photocopying, recording or otherwise, or translated in
any language, without the prior written permission of the author or Egerton University on that
behalf.
©2010 Ruth Chepchirchir Taruss
All rights reserved.

iv
ACKNOWLEDGEMENTS
This thesis, a result of two years of work as a Collaborative Master of Agricultural and Applied
Economics (CMAAE) student at the Department of Agricultural Economics and Business
Management of Egerton University in collaboration with the Department of Natural Resources
and Agricultural Extension of University of Pretoria (South Africa) and International Centre of
Insect Physiology and Ecology (ICIPE), would not have been complete without the help and
input from many individuals and institutions. My sincere gratitude and thanks go to all persons
involved at ICIPE, Egerton University, KARI-Kakamega, and Mabanga Agricultural Training
Centre of the Ministry of Agriculture in Bungoma.
To my supervisors, Prof. Gideon Obare, Dr. David Amudavi and Dr. Zeyaur Khan, I extend my
sincere gratitude for their guidance and assistance. Their constructive criticism, comments, ideas
and unlimited support are highly appreciated. My gratitude also goes to all the lecturers in the
Department of Agricultural Economics and Agribusiness Management for their support and
contribution that has made this study worthwhile. Their valuable recommendations and ideas
throughout the whole research work are highly appreciated.
Special thanks go to Dr. Ephraim Mukisira and Mrs. Mukisira, for their valuable ideas, advice,
and technical assistance towards the development and completion of this thesis. The enthusiastic
contribution, guidance, effort and encouragement from colleagues, Ms. Alice Murage and Ms.
Zipporah Maiyo, who not only spared their time to read and provide useful comments, but also
greatly assisted at the initial stages of methodological development of this work and analysis is
highly appreciated. I wish to thank all my colleagues for always being there with both material
and moral support.
Most importantly, I would like to thank the farmers I interacted with in Bungoma district and my
family for the various kinds of support they gave me during the study period. For health, strength
and the gift of life, I say thank you to God Almighty.

v
DEDICATION
To my family Kap Chepchoge, who taught me the intrinsic worth of learning!
vi
ABSTRACT
Smallholder dairy sector in Western Kenya plays an important role in the livelihoods of many
farm households by generating income and employment. Napier grass is the principal source of
livestock feed in the region; as well as being an integral grass in the push-pull technology (PPT).
Despite this fact, Napier stunt disease (NSD) has become a serious threat to the growth of Napier
grass and consequently to the livestock industry. This thesis focused on farmers‟ perceptions on
alternative fodder grasses to Napier grass and sought to provide a better understanding of the
alternative grasses available for adoption due to the threat to fodder availability by NSD. The
objective of this study was thus to determine the extent of Napier stunt disease infestation in
small-scale dairy farming and to find out alternative fodder grasses small scale dairy farmers
would prefer if Napier grass is affected by NSD. The study was conducted in Bungoma District
(now county), Western province, Kenya. Primary data were collected from 140 small-scale dairy
farmers. Descriptive statistics and multinomial logit model were employed to generate the results
using STATA and SPSS application software. Results revealed that, Napier grass is the main
source of fodder by the majority (98.6%) of the farmers and that the cultivation and expansion of
the fodder crop has been severely threatened by NSD. Most (97.9%) of the interviewed farmers
recognized and experienced the damage caused by this disease. At least a portion of each
respondent‟s land had been affected ranging from 0.01 acres to 2.0 acres. The reported effects of
NSD on dairy enterprise included: reduction in milk production, reduction of breeding stock and
increased costs of production. Results further confirmed that, a majority (68.6%) of the
respondents showed willingness to replace Napier grass with alternative fodder grasses. The
alternatives in order of priority included: Natural grass; signal grass; Giant seteria; Sudan grass;
and Molasses grass. Results obtained from multinomial logit model revealed that, some of the
farm and farmer characteristics, institutional characteristics, and grass attributes were important
determinants of farmers‟ perceptions on alternative grasses used in smallholder dairy farming.
Consequently, it is essential that when screening alternative fodder grasses, emphasis should be
placed on attributes that conform to farmers‟ preferences and that farmers should be involved in
evaluation of fodder grasses to find their suitability to the farmers‟ circumstances. It is also
recommended that on farm trials/ demonstrations to test grass attributes suggested as important
in decision making on preference of alternative grasses should be validated.

vii
TABLE OF CONTENTS
DECLARATION AND RECOMMENDATION ....................................................................... ii
COPYRIGHT ............................................................................................................................... iii
ACKNOWLEDGEMENTS ........................................................................................................ iv
DEDICATION............................................................................................................................... v
ABSTRACT .................................................................................................................................. vi
TABLE OF CONTENTS ........................................................................................................... vii
LIST OF TABLES ....................................................................................................................... ix
LIST OF ACRONYMS, SYMBOLS AND ABBREVIATIONS ............................................. xi
CHAPTER ONE: GENERAL INTRODUCTION .................................................................... 1
1.1 Background of the Study ...................................................................................................... 1 1.2 Statement of the Problem ...................................................................................................... 3
1.3 Objectives of the Study ......................................................................................................... 3 1.4 Research Questions ............................................................................................................... 3
1.5 Justification ........................................................................................................................... 4 1.6 Definition of Terms............................................................................................................... 4 1.7 Scope and Limitation ............................................................................................................ 5
1.8 Organization of the Study ..................................................................................................... 5
REFERENCES .............................................................................................................................. 6
CHAPTER TWO: LITERATURE REVIEW ............................................................................ 8
2.1 Introduction ........................................................................................................................... 8
2.2 Small Scale Dairy Farming ................................................................................................... 8
2.3 Napier Stunt Disease ............................................................................................................. 9 2.4 Push-pull Technology ......................................................................................................... 10 2.5 Role of Grasses in Pest Control .......................................................................................... 11
2.6 Role of Grasses in Weed Control ........................................................................................ 12 2.7 Past Rresearch on Forage Alternatives ............................................................................... 13
2.8 Farmers‟ Perceptions in Technology Uptake ...................................................................... 14 2.9 Theoretical and Conceptual Framework ............................................................................. 15
2.9.1 Theoretical Framework ................................................................................................ 15 2.9.2 Conceptual Framework ................................................................................................ 17
REFERENCES ............................................................................................................................ 20
CHAPTER THREE: METHODOLOGY ................................................................................ 23
3.1 Study Area .......................................................................................................................... 23 3.2 Sampling design and techniques ......................................................................................... 25
3.3 Data and Data Analysis ....................................................................................................... 25
REFERENCES ............................................................................................................................ 26
CHAPTER FOUR: EXTENT AND DAMAGE OF NAPIER STUNT DISEASE
INFESTATION IN SMALL-SCALE DAIRY FARMING IN BUNGOMA DISTRICT ..... 27
4.1. Introduction ........................................................................................................................ 27 4.2. Literature Review............................................................................................................... 28
viii
4.3. Statistical Analysis. ............................................................................................................ 30 4.3.1. Data Collection and Analysis...................................................................................... 30
4.4 Results and Discussion ....................................................................................................... 31
4.4.1 Gender and age of respondents .................................................................................... 31 4.4.3 Farming practices and kind of livestock system .......................................................... 32 4.4.4 Main source of fodder and use of Napier grass ........................................................... 33
4.4.5 The extent of Napier stunt disease infestation ............................................................. 34 4.5 Conclusion .......................................................................................................................... 38
REFERENCES ............................................................................................................................ 39
CHAPTER FIVE: FARMERS’ PERCEPTIONS AND PREFERENCES ON
SUITABILITY OF ALTERNATIVE FODDER GRASSES .................................................. 40
5.1. Introduction ........................................................................................................................ 40 5.2. Literature Review............................................................................................................... 41 5.3. Data and methods ............................................................................................................... 43
5.3.1: Multinomial Logit Model (MLM) .............................................................................. 43 5.4. Results and Discussion ...................................................................................................... 48
5.4.1. Descriptive Analysis on Grass Alternatives ............................................................... 48 5.5. Conclusion ......................................................................................................................... 56
REFERENCES ............................................................................................................................ 58
CHAPTER SIX: GENERAL DISCUSSION AND CONCLUSIONS .................................... 60
6.1 Aim of the study…………………………………………………………………………..60
6.2. Study methodology ............................................................................................................ 61
6.3. General Discussion of the Results ..................................................................................... 61 6.4. Conclusions and Recommendations .................................................................................. 63
REFERENCES ............................................................................................................................ 65
APPENDIX .................................................................................................................................. 67

ix
LIST OF TABLES
Table 1: Distribution of respondents across Divisions by gender and age (%) ............................ 31
Table 3: Farming practices ............................................................................................................ 33
Table 4: Distribution, main source of fodder and use of Napier grass ......................................... 34
Table 5: The extent of Napier stunt disease .................................................................................. 35
Table 6: Size of land in acres affected by NSD ............................................................................ 37
Table 7: Description of the Variables and Expected Signs .......................................................... 46
Table 8: Proportion of farmers who ranked alternative fodder grasses in order of their
preferences .................................................................................................................................... 48
Table 9: Multinomial Logit Model estimates for determinants of perceptions on alternative
fodder grasses................................................................................................................................ 51
Table 10: Marginal effects of determinants of farmers‟ perceptions on alternative fodder grasses
....................................................................................................................................................... 52

x
LIST OF FIGURES
Figure 1: Conceptual framework .................................................................................................. 19
Figure 2: Map of traditional Bungoma District ........................................................................... 24
Figure 3: Year when Napier stunt disease was first observed ...................................................... 36
Figure 4: Proportion of Napier grass affected by NSD (Percentage) ........................................... 37
xi
LIST OF ACRONYMS, SYMBOLS AND ABBREVIATIONS
ASARECA Association for Strengthening Agricultural Research in Eastern and Central Africa
CMAAE Collaborative Masters in Agricultural and Applied Economics
DDP District Development Plan
ICIPE International Centre of Insect physiology and Ecology
ILRI International Livestock Research Institute
IPM Integrated Pest Management
IID Independently and Identically Distributed
KARI Kenya Agricultural Research Institute
MLM Multinomial Logit Model
MOA Ministry of Agriculture
NSD Napier Stunt Disease
PPT Push-Pull Technology
SSA Sub-Saharan Africa
1
CHAPTER ONE
GENERAL INTRODUCTION
1.1 Background of the Study
The dairy sub-sector in Kenya as reported in a study by ILRI (2007) is dominated by smallholder
farmers, who are estimated to produce an astonishing 80% of all the milk marketed in the
country. The study indicated that the smallholders have farms keeping one to two milking
animals on a small piece (about 1 hectare) of land. Furthermore, the research reports that even
where annual income from crops and other enterprises is greater, farmers value the even
distribution of income offered by dairying, the capital asset represented by the animal and
manure. The study also concluded that the manure produced by the dairy sub-sector is of critical
importance in smallholder production of vegetables, maize and other crops.
According to Ouma et al., (2007), it is estimated that Kenya has up to 6.7 million dairy cattle and
about 1.8 million households who rely on dairying. Research done by ILRI (2007), shows that
the principal source of livestock feed on about half a million of Kenya‟s smallholder dairy farms
is Napier grass, commonly known as elephant grass. It further mentioned that: Napier grass is
highly nutritious; grows well even in poor soils; produces seven times more herbage biomass
than traditional grasses; it is generally higher yielding than other cut fodders; and is also easier to
propagate and manage. These among other factors make Napier grass a favorite of dairy farmers.
Western Kenya is one of the most densely populated areas of sub-Saharan Africa (SSA) with a
high level of hunger and extreme poverty levels ranging between 59% and 63%; which exceed
the country‟s national average of 46% (Mariara and Ngethe, 2004). However, the smallholder
dairy sector in Western Kenya plays an important role in the livelihoods of many farm
households by generating income and employment (Mudavadi et al., 2001).
According to Ouma et al., (2007), dairy farming in the mixed small-scale farming systems of
Western Kenya ranks second to maize and beans in contribution to household incomes and food
security. Further on their observation, Napier grass (Pennisetum purpureum) is an improved
fodder crop, which is especially important in cut-and-carry systems (zero grazing). The Napier

2
grass can produce large quantities of forage; it is a fast growing, deeply rooted, perennial grass
growing up to four metres tall that can spread by underground stems to form thick ground cover;
and though best suited to high rainfall areas, it is relatively drought-tolerant and can also grow
well in drier areas (Orodho, 2006). In Western Kenya, Napier grass takes up as much acreage as
that planted with maize, Kenya‟s staple food crop. In addition, it has been used by farmers in a
novel Push-Pull Technology (PPT), an Integrated Pest Management (IPM) system for cereal
stemborers control (Khan et al., 2001).
Although in the last decade cultivation of Napier grass has increased in Western Kenya as small-
scale dairying has shifted from extensive to zero grazing, the development of smallholder dairy
systems in the region has been marked by declining farm sizes, grazing fields and planted area
for fodder. On the other hand, the cultivation and expansion of the fodder crop is threatened by
Napier grass stunt disease (NSD). The disease causes economic losses in the smallholder dairy
industry, thus affecting the source of revenue of the rural poor (Khan et al., 2008). Napier stunt
disease, which is caused by phyto-plasma bacteria and transmitted by leaf hoppers, retards the
growth of the plant and curls the leaves progressively turning them yellow and drying them out
(Jones et al., 2004).
According to work by Khan et al., (2008), the NSD has a direct impact on the livestock/dairy
industry in Western Kenya. The same authors emphasized that NSD has spread quickly and now
covers several districts of Western Kenya causing serious economic losses in the smallholder
dairy industry. A study by Jones et al., (2004) showed that most of the Napier grass varieties
grown in the area are susceptible to the disease which usually becomes visible in re-growth after
cutting or grazing. The study established that affected shoots become pale yellow green in color
and seriously dwarfed leading up to 100 percent of their Napier crop. Consequently, farmers are
forced to de-stock or sell off their entire herd because of lack of feed especially of the high
Napier grass prices and also due to the prohibitive management costs to control the disease.
Khan et al., (2001) established that, the major cattle feeds in Western Kenya are natural grass
and planted fodder. They indicate that commonly, Napier grass, molasses grass (Melinus
minutiflora), Sudan grass (Sorghum /vulgare var. Sudanese) and signal grass (Bracharia
brizantha) are alternative grasses which have been recognized to be of economic importance to

3
farmers in Western Kenya. These are used as livestock fodder and some have shown great
potential in PPT, an integrated pest management (IPM) strategy that offers effective control of
cereal stemborers and Striga weed in maize-based cropping systems.
1.2 Statement of the Problem
In Western Kenya, unstable availability and seasonality of livestock feed have been major
constraints to small-scale dairy farming. Farmers have been using Napier grass as livestock feed
and as an integral grass in push-pull technology despite the presence of Napier stunt disease.
However, there are alternative fodder grasses that farmers can use to enhance dairy productivity
in the event of loss of Napier grass. The major cattle feeds that are used are natural grass and
planted fodder which include: Napier grass; Sudan grass; signal grass; and molasses grass which
are nutritious and highly valued fodder either for own use as livestock feed or for sale. Farmers‟
perceptions of and preferences on various grasses as alternative fodder given the status of Napier
stunt disease are unknown.
1.3 Objectives of the Study
The overall objective of this study was to assess small-scale dairy farmers‟ perceptions of
alternative fodder grasses contingent on Napier Stunt Disease in order to inform on the
appropriate fodder grass to be promoted among the farmers to improve small-scale dairy
industry. The specific objectives were:
1. To determine the extent of Napier stunt disease infestation in small-scale dairy farming.
2. To assess the damage caused by the NSD
3. To assess farmers‟ perceptions on suitability of alternative fodder grasses in order to
establish their preference for dairy grasses.
1.4 Research Questions
To achieve the above objectives, the following research questions guided the study:
1. What is the extent of Napier stunt disease infestation in small-scale dairy farming in
Bungoma District?
2. What damage does the NSD cause?

4
3. What are the farmers‟ perceptions on suitability of alternative fodder grasses used for
small-scale dairy farming in Bungoma District?
1.5 Justification
Napier stunt disease has seriously threatened the viability of the smallholder dairy industry in
Western Kenya. This implies that unless control measures are undertaken, NSD will continue to
undermine efforts to develop the smallholder dairy industry, putting rural households‟ economic
as well as food security at risk in the region (Jones et al., 2004). The study therefore targets
various stakeholders including small scale farmers, practitioners working with farmers, and
policy makers in providing information on appropriate grass (es) as alternative to Napier grass
due to the serious effects of Napier stunt disease in Western Kenya. Furthermore, the study
results facilitates in solving serious problems of food insecurity and nutritional related health
risks experienced in the country.
1.6 Definition of Terms
Perception: The process by which individuals interpret and organize sensation to produce a
meaningful experience of the alternative chosen (Adesina, 1995). This study considered this
definnition.
Napier stunt disease: A disease that is spread by phyto-plasma bacteria transmitted by leaf
hoppers which retards the growth of the plant and curls the leaves progressively turning them
yellow and drying them out (Jones et al., 2004).
Small-scale dairy farming: Economic activity which involves keeping dairy cows with a herd
of less than five milking cows on less than 1 ha of land (Henk et al., 2007). This study
considered all dairy cows irrespective of the breeds.
Push-Pull technology: Pest management technology developed for control of stemborers and
Striga weed in maize based farming systems where maize is intercropped with desmodium
forage legume as a repellent plant to deter the pest from the main crop (push) and Napier grass is
planted as a border crop to attract the repelled pest, thus the pull effect (Khan et al., 2001).

5
Fodder: Feedstuff that is used specifically to feed domesticated livestock and is mostly from
plants. It is especially coarsely chopped hay or straw (Henk et al., 2007).
Contingent: Dependent on or conditioned by something else.
1.7 Scope and Limitation
The study was restricted to small-holder dairy farmers practicing push-pull technology and also
those who were not practicing the technology but were facing the problem of Napier stunt
disease and would prefer other grasses to Napier grass in Bungoma district. The study area was
chosen because of the intensive nature of agriculture practised in the region - most farmers
practice zero grazing, grasses have economic impact; farmers are aware of indigenous and novel
uses of several grasses in the region, and that Napier stunt disease has become a serious threat to
the small-scale dairy industry.
1.8 Organization of the Study
Subsequent to chapter one that presents the general introduction, chapter two, presents literature
review on the various aspects related to this study. In this chapter, an assortment of selective
findings and ideas from different studies on small scale dairy farming, Napier stunt disease, the
role of grasses in pest and weed control in the novel push-pull strategy and farmers‟ perceptions
on forage alternatives is highlighted. Chapter two also provides theoretical and conceptual
frameworks whereas chapter three presents the methodologies used in answering research
questions of the study. Chapter four presents the first part of results covering the first two
objectives by detailing some of the factors that explains the extent of Napier stunt disease
infestation in small-scale dairy farming. The chapter mainly aims at estimating the damage of
Napier stunt disease. In chapter five multinomial logit results on farmers‟ perceptions on
suitability of alternative fodder grasses are presented and discussed. The main purpose of this
chapter is to establish farmers‟ preferences on alternative fodder grasses for their dairy farming.
Finally, chapter six incorporates all the previous results and other relevant information into
general considerations for alternative fodder grasses as fodder due to the effect of Napier grass
by Napier stunt disease.

6
REFERENCES
Adesina, A., and Baidu-Forson, J., (1995). Farmers‟ perception and adoption of new agricultural
technology: Evidence from analysis in Burkina Faso and Guinea, West Africa.
Agricultural Systems, 55 (3), 409-423.
International Livestock Research Institute-ILRI (2007). Markets that work: Making a living from
livestock. Annual report. Nairobi, Kenya: Author.
Jones, P., Devonshire, B. J., Holman, T. J., and Ajanga, S., (2004). New disease report: Napier
grass stunt, a new disease associated with a 16SrXI group phytoplasma in Kenya. Plant
Pathology, 53(4), 519.
Khan, Z.R., Amudavi, D.M., Midega, C.A.O., Nyang‟au, I.M., Pittchar, J., and Pickett, J.A.,
(2008). Farmers‟ knowledge and perceptions of Napier grass stunt disease in smallholder
farming systems in Western Kenya. Unpublished manuscript. ICIPE.
Khan Z.R., Pickett, J.A., Wadhams, L.J., and Muyekho, F., (2001). Habitat management
strategies for the control of cereal stem borers and Striga in maize in Kenya. Insect
Science and its Application, 21, 375-380.
Khan, Z. R., Amudavi, D. M., Midega, C. A.O., Wanyama, J. M., and Pickett, J. A., (2008).
Farmers‟ perceptions of a „Push-Pull‟ technology for control of cereal stemborers and
Striga weed in Western Kenya. Crop Protection, 27, 976–987.
Mariara, J. K., and Ngeng‟e, G. K., (2004). Measuring and monitoring poverty: The case of
Kenya. Paper presented at the Poverty Analysis and Data Initiative (PADI) Workshop on
measuring and monitoring poverty May 7–8, 2004 Mombasa, Kenya.
Mudavadi, P. O., Otieno, K., Wanambacha, J. W., Odenya, J. O., Odendo, M. and Njaro,
O.K., (2001). Smallholder dairy production and marketing in Western Kenya: A review
of literature. Smallholder Dairy (Research & Development) Project Research Report.
Orodho, A.B., (2006). The role and importance of Napier grass in the smallholder dairy industry
in Kenya. Kenya Agricultural Research Institute, Kitale Kenya Report.
7
Ouma, R., Njoroge, L., Romney, D., Ochungo, P., Staal, S., and Baltenweck I., (2007). Targeting
dairy interventions in Kenya: A guide for development planners, researchers and
Extension worker. SDP/KDDP, Nairobi, Kenya.
8
CHAPTER TWO
LITERATURE REVIEW
2.1 Introduction
Research done at ILRI (2007), confirms that farm animals are an ancient, vital and renewable
natural resource. The research further shows that throughout the developing world, livestock is a
means for hundreds of millions of people to escape absolute poverty. Furthermore, livestock in
developing countries contributes up to 80 percent of agricultural gross domestic product; nearly
one billion rural poor people rely on livestock for their livelihoods. Globally, livestock are
becoming agriculture‟s most economically important sub sector, with demand in developing
countries for animal foods projected to double over the next 20 years. Likewise the ongoing
„livestock revolution‟ offers many of the world‟s poor a pathway out of poverty. They also
emphasize that livestock not only provide poor people with food, income, traction and fertilizer
but also acts as catalysts that transform subsistence farming into income-generating enterprises,
allowing poor households to join the market economy.
Further, the ILRI impact assessment report indicated that by 2006, Kenya had 1.8 million
smallholder dairy farms, 39,650 milk hawkers and 6.7 million dairy cattle and the country was
producing four billion litres of milk each year. Nearly half the benefits went to producers, with
the remainder going to consumers ($8 million), small-scale milk vendors ($4.1 million) and ($5.1
million) input suppliers.
2.2 Small Scale Dairy Farming
According to Onsongo (2008), Kenya has a relatively well developed dairy industry that spans
over 90 years and has undergone various evolutionary stages. During its formative stages the
dairy sub-sector was dominated by large-scale farmers. However smallholder dairy farming has
increasingly dominated the sub-sector contributing over 80% of total milk production and
supporting over one million small-scale farmers in 2007. The dairy cattle industry accounts for
about 4 % of GDP, with an estimated cattle population of 3.5 million. The major milk producing
provinces are Rift valley, Central and Eastern provinces. Rift valley accounts for about 50% of
this production. Kenya Dairy Board estimates 2007 milk production at 3.74 billion litres a

9
minimal increase from 3.59 billion litres the previous year. The increase in production was
attributed to favorable weather and relatively stable prices.
Small-scale dairy producers are generally competitive and are likely to endure for some time,
particularly where the opportunity costs of family labour and wages remain low. The most
compelling evidence towards this is the continued dominance of smallholders in all the countries
studied, even where there is steady economic growth. Furthermore, dairy as an enterprise is an
option available to landless and socially marginalized groups (ILRI, 2007). According to Khan
and Pickett, (2004), smallholder farmers in SSA practice mixed farming, with livestock being an
important component. Mixed crop livestock systems predominate, and as human population
rises, land becomes an important constraint, necessitating further integration of the two
enterprises supported by the small holdings.
In line with the study done at ILRI (2007), the principal source of livestock feed on about half a
million of Kenya‟s smallholder dairy farms is Napier grass (Pennisetum purpureum), commonly
known as elephant grass. However the study reported that, Napier is highly nutritious, grows
well even in poor soils, and produces seven times more herbage biomass than traditional grasses.
This among other factors makes it a favorite of dairy farmers. Scientists from several institutions
have been working together to halt the spread of various diseases of elephant grass. They are
raising awareness of the diseases, providing information on how best to control them and
determining clones of Napier that are genetically resistant to the diseases. This research study
seeks to generate more information on how to stop the progress of the spread of Napier stunt
disease by assessing farmers‟ perceptions of alternative grasses to Napier grass.
2.3 Napier Stunt Disease
Elephant stunt, a new disease of Napier, has been confirmed in over 90% of Napier grass fields
in Kenya, most of whose zero-grazing dairy farmers rely on Napier grass for animal feed. It was
discovered that the disease is spread by phyto-plasma bacteria transmitted by leaf hoppers.
Furthermore, this disease retards the growth of the plant and curls the leaves, progressively
turning them yellow and drying them out. However, the disease cuts herbage biomass by more
than half, creating a feeding gap that is not only hurting dairy farmers but also compromising the
quality and quantity of milk and meat products. In addition, the first sighting of this infection

10
was in Uganda‟s Masaka District whereby, many fields since then have been wiped out. More so,
as most Ugandan dairy farmers have tiny plots of land on which they have room only to practice
„zero-grazing‟, in which they daily hand cut and carry feed to cows kept in stalls, the country‟s
smallholder dairying could decline drastically (Nielsen, et al., 2007; Tiley, 1969 in Orodho,
2006).
According to Ouma et al., (2007), farmers have been reduced to harvesting much larger portions
of their Napier fields to get enough grass daily to feed their milk cows. The quality of the
herbage is poor and where, as common, farmers fail to get supplementary feeds, milk yields have
been reduced by almost half. This feed shortage has led to the price of a bundle of Napier more
than doubling in districts badly affected by stunt. Unless controlled, both smut and stunt will
continue to undermine efforts to develop East Africa‟s smallholder dairy industry, putting
economic as well as food security at risk in the region.
In Kenya, the Napier stunt disease was first reported in Bungoma district in 1997. Since the year
2000, symptoms have been seen on Napier grass that include foliar yellowing, little leaves,
proliferation of tillers and shortening of internodes to the extent that clumps appear severely
stunted. Laboratory tests for viruses and root-infecting fungi that might cause these symptoms
have been all negative. However, Napier grass stunt is associated with a phyto-plasma belonging
to the 16SrXI (Candidatus Phytoplasma oryzae) group (Orodho, 2006).
The disease poses a threat to the push-pull multifunctional technology developed for the control
of stemborers and Striga weed, and soil fertility improvement. Push-pull technology utilizes a
strategy in which plant chemicals are deployed to push colonizing insects away from a target
crop and aggregate them on Napier grass used as a sacrificial or trap crop so that a selective
control agent can be used effectively and economically to reduce the pest population by
combining the effects of "push" and "pull" multiplicatively, and providing opportunities for
enhanced biological control in sites where the pest becomes concentrated (Khan et al., 2008).
2.4 Push-pull Technology
Push-pull strategy also referred to as a technology was developed by scientists at the
International Centre of Insect Physiology and Ecology (ICIPE) in Kenya and Rothamsted
Research in the United Kingdom, in collaboration with other research organizations in Eastern
11
Africa. The strategy combines the knowledge of chemical ecology and agro-biodiversity of the
stemborer with Striga management (Miller and Cowles, 1990; Khan et al., 2001; Cook et al.,
2007). Push-pull technology involves intercropping maize with forage legume and planting a
grass as a border crop (Cook et al., 2007; Hassanali et al., 2008). The cropping strategy uses a
combination of molasses grass or desmodium as common repellents to deter the pest from the
main crop „push‟ and Napier grass or Sudan grass as the common trap plants to attract („pull‟)
the repelled pest .
The desmodium plant produces volatiles which repel the moths while volatiles produced by the
Napier grass attract them (Chamberlain et al., 2006). The larvae from oviposition are trapped by
a sticky substance produced by the Napier grass which inhibits the larvae‟s full development to
adulthood (Khan and Pickett, 2004). In this technology, desmodium roots produce chemical
compounds, some of which initiate Striga germination and others inhibit lateral root growth,
thereby hindering its parasitic attachment to maize roots. The ensuing suicidal process
suppresses Striga emergence and effectively reduces the amount of seed bank in the soil (Van
den Berg et al., 2006).
2.5 Role of Grasses in Pest Control
Stemborers are the major insect pests of cereals in many areas of Eastern and Southern Africa.
They are regarded as major limiting factors of the production of maize, and sorghum (Soghrum
bicolor). At least four species infest maize in the East African region with yield losses reported
to vary from 20-40% depending on agro ecological conditions, crop cultivar, agronomic
practices and intensity of infestations (Pickett et al., 2001).The two main stemborer species
found in the Western part of Kenya are Busseola fusca Fuller (Lepidoptera, Noctuidae) and
Chilo partellus (swinhoe lepidoptera: Crambidae). Stemborer damage causes green yield losses
estimated at 10-80% of the potential grain output depending on the pest population, density, and
phonological stage of the crop at infestation (Kfir et al., 2002).
According to Khan and Pickett, (2004), effective control of stemborers is difficult, largely due to
the cryptic and nocturnal habits of the adult moths and protection provided by the host stem for
immature pest stages. Moreover the conventionally recommended chemical control strategies are
not practical and economical for smallholder farmers, while effectiveness of some of the cultural

12
control methods considered cheaper for resource constrained farmers has yet to be empirically
demonstrated (Van den Berg and Nur, 1998).
The push–pull technology described herein involves intercropping maize with a repellent plant
such as desmodium and planting an attractive trap plant such as Napier grass as a border crop
around their intercrop. On the other hand, during dusk Napier grass produces chemical
substances some of which are good attractants for stemborers to lay eggs. Fortunately, Napier
grass produces gummy substances which trap the resulting stemborer larvae and only few
survive to adulthood thus reducing their population. Whereby gravid stemborer females are
repelled from the main crop and are simultaneously attracted to trap crop (Khan et al., 2000,
2001; Cook et al., 2007). The technology so far, is effective and indeed the only push –pull
strategy in practice by farmers. It also enhances productivity of maize based farming systems
through suppression and elimination of Striga and also in providing quality fodder for livestock
thus increased milk production (Khan et al., 2000, 2001; Cook et al., 2007).
2.6 Role of Grasses in Weed Control
According to Vanlauwe et al., (2008), plants belonging to genus Striga comprise obligate root
parasites of cereal crops that inhibit normal host growth via three processes; competition for
nutrients, impairment of photosynthesis and a phytotoxic effect within days of attachment to its
hosts. In their research, it is estimated that 76% of land planted to maize and sorghum is infested
with Striga causing up to 100% yield losses, equivalent to annual losses estimated at $40.8
million in Western Kenya.
According to Khan et al., (2001), around the Lake Victoria basin, infestation by Striga causes
30- 100% loss in maize yield. The study associated Striga infestation with increased cropping
intensity and declining soil fertility. Furthermore, Striga infestation has resulted in the
abandoned net of much arable land by farmers in Africa, and the problem is more serious in
areas with low soil fertility and rainfall (ibid). Pickett et al., (2001), have demonstrated that
maize production in the region is also severely constrained by parasitic weeds in the genus Striga
in which Striga hermonthica is by far the most damaging. The study also reported that, Striga
roots attach to the maize roots from where they draw their moisture and nutrient requirements in

13
the process inhibiting growth of maize plant leading to a reduction in grain yields. In severe
cases, the Striga strangulation causes death of maize plant. Furthermore, maize yield losses of
30-50% have been reported under typical field infestations by Striga.
2.7 Past Research on Forage Alternatives
According to research done by Roothaert et al.,(2005), on lessons learnt from participatory
evaluation of improved forages with farmer groups in Uganda, one of their objective was to
evaluate alternative varieties which would provide high amounts of high quality feed for dairy
cows during the critical dry season. Several forage types were evaluated including grasses and
legumes and the parameters analyzed included: growth and vigor, germination, pest and disease
resistance, plant height, fodder biomass production, maturity, drought resistance, seed production
and palatability.
Roothaert et al.,(2005), also found that signal grass (Bracharia brizantha) has the potential to
continue growing during at least part of the dry season, and remains a high leaf: stem ratio unlike
Napier grass which normally stays green during the dry season, but stops growing and becomes
stemmy. Therefore, replacement of Napier by Bracharia was seen as a way of dealing with a
mycoplasma causing the „stunt‟ syndrome affecting Napier grass in East Africa.
In the same study it was revealed that adoption of forages in East Africa is highly correlated to
intensification process and market success of livestock enterprises. Besides, in the case of
smallholder dairy systems, many factors contribute to its market success such as adequate
artificial insemination (AI) service, veterinary service, input and output systems, and dairy
management expertise. The study concluded that when one factor breaks down, the whole
system breaks down. Therefore, when improved forages are introduced into a smallholder dairy
system, farmers‟ perceptions should be taken into consideration and more so, the whole dairy
innovation system should be analyzed.

14
2.8 Farmers’ Perceptions in Technology Uptake
According to Adesina and Zinnah (1993), farmers‟ perception of an agricultural technology is
important in influencing adoption decisions. In addition, Boahene et al., (1999), found out that
technology adoption which is a multidimensional process, is influenced by factors such as;
perceived profitability and costs of the technology, its compatibility with production systems,
and the clarity with which the new knowledge and information is communicated in a recipient
population. Besides the efficacy of a technology, the severity of the existing constraints also
conditions the decision to invest in new technologies (Mbaga-Semgalawe and Folmer, 2000;
Kalule et al., 2006).
As part of continued research on push-pull strategy done by Khan et al., (2008), farmers‟
perceptions of the attributes of the strategy and their influence on adoption of the technology
were evaluated and the specific factors that were assessed included the following: perceptions of
push-pull technology-practicing farmers on severity of Striga and stemborer constraints; primary
sources of information about push-pull technology and the reasons for its adoption among the
practicing farmers; perceptions of push-pull technology-practicing farmers on any benefits
realized from the technology and any labour changes experienced following its adoption on their
farms; and perceptions of non-participating farmers attending field days about the technology
attributes and motivational aspects for its adoption.
The results from the study showed that the majority of the push-pull technology - practicing
farmers rated the technology as significantly superior to the farmers‟ own practices on all
attributes, indicating that they perceived it as an effective technology for the control of
stemborers and Striga, improved soil fertility and increased maize production. In their study,
farmers cited both stemborers and Striga as severe maize production constraints in their districts.
It was concluded that, given such circumstances, availing an appropriate technology that is
affordable and fits well into farmers‟ farming system is likely to stimulate its uptake. Therefore,
farmers‟ perceptions on the severity of production constraints, such as Striga and stemborers,
and suitability and effectiveness of any management strategies are a key determining factor on
whether farmers adopt or do not adopt such technologies.

15
Economists investigating consumer demand have accumulated considerable evidence showing
that consumers generally have subjective preferences for characteristics of products attributes
(Engel and Blakwell, 1982; Steenkamp, 1989). However, when investigating adoption of new
agricultural technologies, economists have lagged behind in investigating how users‟ (the
consumer of agricultural technologies) subjective perceptions of technology characteristics affect
their adoption decisions. Focusing on the perceptions of farmers towards technologies may
provide answers to missing information since they deal with the technologies and they probably
perceive technologies differently from researchers and extension agents. Elbasha et al., (1999)
reviewed the literature and assembled a list of the factors, which have been cited as constraining
adoption of forage legumes in West Africa. These included: lack of fencing materials; shortage
of labour; inappropriate land tenure; land scarcity; livestock diseases; invasion of grasses and
weeds; and damage by fire. Whereas farmers can be reached with new technologies, researchers
and extension agents need to learn the farmers‟ preferences and constraints in order to address
effectively problems confronting them.
2.9 Theoretical and Conceptual Framework
2.9.1 Theoretical Framework
Farmers are assumed to make their decisions by choosing the alternative that maximizes their
perceived utility (Sadoulet et al., 1995). Observations of farmers‟ preference among different
interventions can reveal the farmers‟ utility ranking of the alternatives. However, in the case
where farmers are asked to state their perception for alternative interventions, there is no natural
ordering in the alternatives and it is not assumed that there is monotonic relationship between
one underlying latent variable and the observed outcomes in ordering the alternatives (Bekele,
2004). In such cases, a common alternative framework to put some structure on the different
probabilities is a random utility framework, in which the utility of each alternative is a linear
function of observed individual characteristics plus an additive error term (Verbeek, 2000). With
appropriate distributional assumptions on the error terms, this approach leads to manageable
expressions for probabilities implied by the model.
In this study we assumed that farmers, from experiences, know their major agricultural problems
and can state their preference among alternative grasses. Underlying this assumption is the fact

16
that the stated preference is based on farmers‟ implicit cost and benefit expectation from the
alternative intervention, given their resource endowment. They are expected to rationally reveal
their preference in line with the objective of improving their welfare. This preference can be
represented by a utility function and the decision problem can therefore, be modeled as a utility
maximization problem.
Suppose that the farmer derives utility from choosing a particular preferred grass, and from
his/her own perception. Let choice of a particular grass be represented by j, where j = 1 if the
farmer is willing to choose a particular grass as fodder due to the presence of NSD and j = 0
otherwise. The farmer‟s perception on alternative grass is represented by w, and the vector x
represents factors influencing choice of that grass which include: institutional characteristics,
farm and farmer characteristics, and attributes of the grass that gives the farmer confidence to
prefer that particular grass. If the farmer prefers a particular grass, his utility is given by U1 = U
(1, w, x) and, if he does not have preference for the grass U0 = U (0, w, x). As in standard
economic theory, farmers would try to choose particular grasses they like most, subject to their
attributes.
The basic framework for analysis is provided by the random utility model where consumers are
assumed to choose among a range of discrete number of alternatives to maximize their utility.
Random utility theory states that a consumer‟s utility can be decomposed into a systematic and
random component of utility (Hwan and Harrison 2004). That is, total utility is the sum of
observable and unobservable components,
Uij (choice j for individual i) = Vij + εij--------------------------------------------------------------------------------------------------- (1)
The utility level Uij, which is individual i‟s utility from choosing alternative j, is determined by
the systematic component of utility of Vij and random components εij, which is assumed to be
independently and identically distributed with type I extreme value (Gumbel) distribution
(Greene, 2003). The random component represents the unknown components the consumers‟
utility function. Consumer i chooses alternative j if:
Uij > Uik for all k ≠j ------------------------------------------------------------------------------------- (2)

17
The probability of individual i choosing alternative j is equal to the probability that the utility of
alternative j is greater than the utilities of all other alternatives in the choice set (Greene 2003).
Pij= Pr (Uij > Uik) for all k ≠j ---------------------------------------------------------------------------- (3)
Extending the argument to multiple choice alternatives, suppose there is a choice between M
different alternatives indexed by j = 0 … M, with the ordering being arbitrary. Assume that the
utility that individual i attaches to each alternative is given by Uij, j = 1, 2 … M. The farmer will
prefer alternative j if it can be expected to give him the highest utility (Hwan and Harrison 2004).
That is,
Uij = max {Ui0... UiM ----------------------------------------------------------------------------------------------------------------------------- (4)
The probability that farmer i prefers alternative grass j from among M alternatives is given by:
P(Ci j ) P Uij max {Ui0... UiM---------------------------------------------------------------- (5)
where Ci denotes the preference of individual i.
Assuming that the error terms in the utility function are independently and identically distributed
(IID) two widely used distributions are the normal and logistic that gives the probit and logit
model respectively (Haab and McConnell, 2002). In this study we assume that the error term is
logistically distributed and use the logit model. This model is more appropriate and makes it
possible to study the determination of the factors influencing farmers‟ perception when the
explanatory variables consist of individual specific characteristics and these characteristics are
the determinants of the choice.
2.9.2 Conceptual Framework
Farmers‟ perception about the performance of the technologies significantly affects both the
probability and the intensity of having the fodder on the farm. Therefore, it is important that for
any new technology to be introduced to the farmers, they should be involved in its evaluation to
find its suitability to the farmers‟ circumstances, especially screening fodder legume varieties to
be introduced to farmers. Furthermore, researchers should analyze those factors that farmers

18
themselves consider as important in their decision to adopt the technologies otherwise, when
they rely only on literature and extension staff, as has been the habit, researchers may end up
considering factors that are irrelevant to the farmers in a particular region (Sinja et al., 2004).
The conceptual framework in Figure 1 shows factors that influence farmers‟ decisions on which
alternative grass to choose due to the presence of Napier stunt disease that greatly affects Napier
grass in order to improve small-scale dairy industry. The study conceptualizes that, farmers form
perceptions favourable to preference of an alternative preferred grass in presence of Napier stunt
disease under the influence of several variables which are grouped into farm and farmer
characteristics, institutional characteristics and attributes of various grasses. Farm and farmer
characteristics include: Age, gender, education level, family size and farm size. Institutional
characteristics include: Participation in push-pull technology and access to extension services.
While grass attributes include: Cost of grass planting materials, growth rate, disease resistance,
dry season tolerance, economy on land, and grass biomass. The above group of variables can
influence farmers‟ perceptions leading to choice of a particular grass (es). On the other hand,
farm and farmer characteristics, institutional characteristics and attributes of various grasses can
directly influence choice of a particular grass (es). As a result of perceiving to choose a particular
preferred grass (es), a farmer can realize direct benefits which include: provision of sufficient
livestock fodder either for own use as livestock feed or for sale and increased milk yield thus
improving the small-scale dairy industry.

19
Figure 1: Conceptual framework
Source: Own conceptualization
20
REFERENCES
Adesina, A., and Zinnah, M., (1993). Technology characteristics, farmers‟ perception and
adoption decision: A Tobit model application in Sierra Leone. Agricultural Economics,
9(4), 297-311.
Bekele W., (2004). Analysis of farmers' preferences for development intervention programs: A
case study of subsistence farmers from Eastern Ethiopian highlands. Paper presented at
the African development and poverty reduction: The macro-micro linkage. 13-15th
October 2004, Somerset West, South Africa.
Cook, S.M., Khan, Z.R., and Pickett, J.A., (2007). The use of „Push-Pull‟ strategies in integrated
pest management. Annual Review of Entomology 52, 375-400.
Greene, W.H., (2003). Econometric analysis, 3rd
edition, New York: Macmillan Publishing
Company.
Hassanali, A., Herren, H., Khan, Z.R., Pickett J.A., and Woodcock C. M., (2008). Integrated pest
management: The push–pull approach for controlling insect pests and weeds of cereals,
and its potential for other agricultural systems including animal husbandry. Philosophical
Transactions of the Royal Society, 363, 611 – 621.
Haab, T., and McConnell, K., (2002). Valuing environmental and natural resources:
Econometrics of non-market valuation. Cheltenham, UK: Edward Elgar
Hwan, J.H., and Harrison, R.W., (2004). A multinomial logit model of consumer perceptions for
biotech food labeling. Department of Agricultural Economics and Agribusiness 101 Ag
Administration Building, Louisiana State University.
Jones, P., Devonshire, B. J., Holman, T. J., and Ajanga, S., (2004). New disease report: Napier
grass stunt, a new disease associated with a 16SrXI group phytoplasma in Kenya. Plant
Pathology, 53(4), 519.

21
Kfir, R., Overholt, W. A., Khan, Z. R., and Polaszek, A., (2002). Biology and management of
economically important lepidopteran cereal stemborers in Africa. Entomology, 47(5),
701–731.
Khan, Z.R., and Pickett, J. A., (2004). The „push–pull‟ strategy for stemborer management: A
case study in exploiting biodiversity and chemical ecology. Wallingford, UK: CAB
International.
Khan, Z. R., Hassanali, A., Pickett, J. A., Wadhams, L. J., and Woodcock, C. M., (2002).
Control of witchweed Striga. Wallingford, UK: CAB International.
Miller, J. R., and Cowles, R. S., (1990). Stimulo-deterrent diversion: A concept and its possible
application to onion maggot control. Journal of Chemical Ecology, 16, 3197-3212.
Onsongo M., (2008). Kenya Dairy Update Report, USDA Foreign Agricultural Service, Global
Agriculture Information Network.
Pickett, J.A., Khan, Z.R., Wadhams, L., and Muyekho, F., (2001). Habitat management
strategies for the control of cereal stemborers and Striga in maize in Kenya. Insect
Science and its Application, 21(4), 375–380.
Roothaert, R., Nalukwago, G., and Nyende, P., (2005). Lessons learned from participatory
evaluation of improved forages with farmer groups in Tororo Uganda. In tropical grasses
and legumes: Optimizing genetic diversity for multipurpose use. IP-5 project annual report,
2005. Cali, Columbia: Centro Internacional de Agricultura Tropical-CIAT.
Vanlauwe, B., Kanampiu, F., Odhiambo, G.D., De Groote, H., Wadhams, L.J., and Khan Z.R.,
(2008). Integrated management of Striga hermonthica, stemborers, and declining soil
fertility in Western Kenya. Field Crops Research, 107(5), 102 – 115.
Van den Berg, J., (2006). Oviposition preference and larval survival of Chilo partellus
(Lepidoptera Pyralidae) on Napier grass (Pennisetum purpureum) trap crops.
International Journal of Pest Management, 52(3), 39-44.

22
Van den Berg, J., De Bruyn, A.J.M., Van Hamburg, H., (2006). Oviposition preference and
survival of the maize stem borer, Busseola fusca (Lepidoptera: Noctuidae), on Napier
grasses, Pennisetum spp., and maize. African Entomology, 14(3), 211-218.
Verbeek, M., (2000). A guide to modern econometrics. New York – Weinheim –Brisban –
Toronto – Singapore: John Wiley & sons, Ltd.
23
CHAPTER THREE
METHODOLOGY
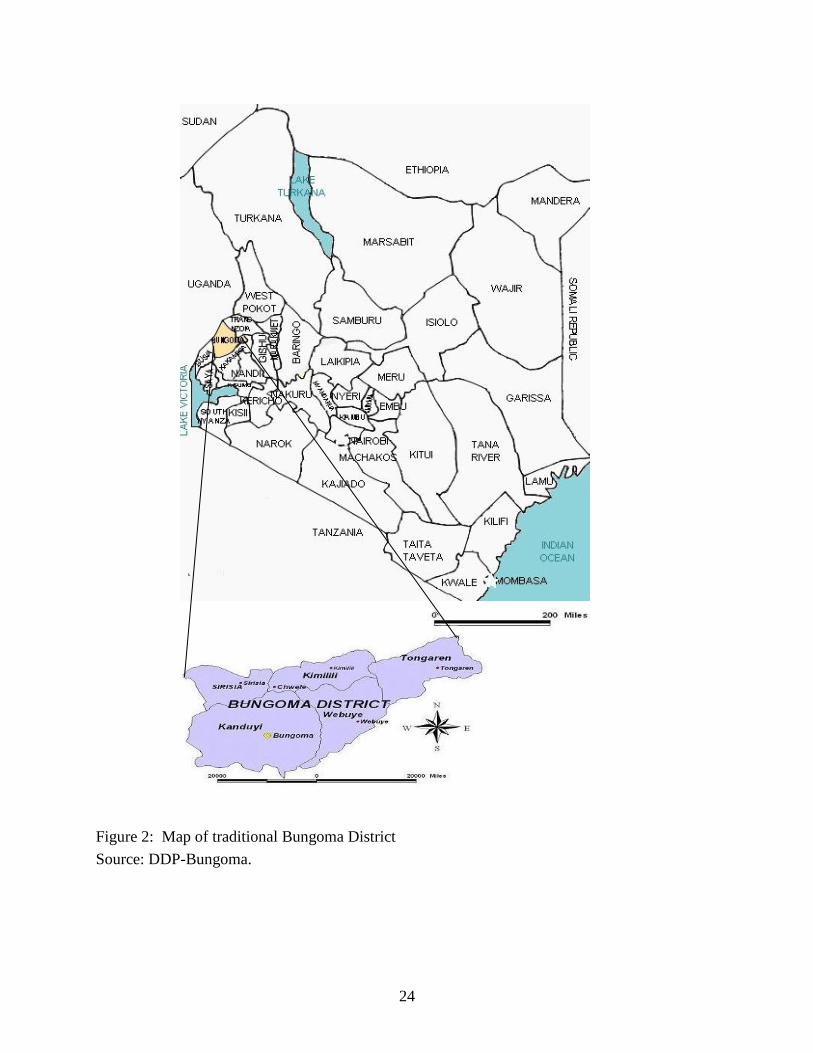
3.1 Study Area
The study was conducted in Bungoma district in Western province, Kenya (see Figure 2).
Bungoma (0025‟–0
053‟S, 34
012‟–35
004 E) receives an annual rainfall of 1000–1800mm and lies
on an altitude of about 1300–3500 metres above sea level. It lies at the northern tip of western
province of Kenya and borders Mt.Elgon district to the Northwest, Trans Nzoia district to the
North, Kakamega and Mumias District to the East, Busia District to the West and Teso District
to the South west. It covers an area of 2,068.5km2 (Bungoma District Strategic Plan 2005 –
2010). In this district, maize, cassava, beans, sorghum, and sweet potatoes are the major food
crops. In the livestock sector, cattle, sheep, goats and chicken are kept by most of households
(KNBS, 2008).
24
Figure 2: Map of traditional Bungoma District
Source: DDP-Bungoma.
25
3.2 Sampling design and techniques
Smallholder dairy farmers who were facing the problem of Napier stunt disease, practicing PPT
and those who were not practicing the technology and would prefer alternative grasses made the
target population of the study. Multistage sampling technique was used where five divisions with
high prevalence of the NSD were purposively identified from the district. These divisions
include; Bumula, Kibabii, Sangalo, Malakisi and Webuye. All sub-locations in the five divisions
were listed and two sub-locations were randomly selected from each division.
Two source lists, one from the push-pull coordinators and another from extension officers from
the Ministry of agriculture were used to get the sample of participants and non participants from
the sub-locations. Systematic random sampling was employed to obtain a sample of 70
respondents practicing the technology and another 70 respondents who did not practice PPT
from the ten sub-locations. This resulted to a sample of 140 respondents for the study.
The required sample size was determined by proportionate to size sampling methodology as per
formulation by Kothari, (2004) in the equation below:
2
2
E
pqZn
where;
n = Sample size
Z= confidence level (α=0.05)
p = proportion of the population containing the major interest q = 1-p, and E= allowable error.
Since the proportion of the population is not known, p= 0.5, q= 1-0.5=0.5 and E = 0.083. This
results to a sample of approximately 140 respondents.
3.3 Data and Data Analysis
The kind of data collected for the purpose of this study and the different types of analysis used to
answer the study‟s research questions are explained in the methodology subsections of the
subsequent chapters.
26
REFERENCES
Bungoma District Strategic plan (2005). Bungoma District Strategic plan (2005 – 2010) for
Implementation of the National Population Policy for Sustainable Development. National
Coordination Agency for Population and Development. Ministry of Planning and
National Development. Nairobi, Kenya.
Bungoma District Development Plan (1996). Bungoma District Development Plan. Ministry of
Planning Project Reports. Government of Kenya.
KNBS, (2008). Kenya National Bureau of Statistics, Revised edition. Nairobi: The Regal Press
Kenya Ltd.
Kothari, C.R., (2004). Research methodology; methods and techniques. New Delhi: New Age
International (P) Limited, Publishers.
.
.

27
CHAPTER FOUR
EXTENT AND DAMAGE OF NAPIER STUNT DISEASE INFESTATION IN SMALL-
SCALE DAIRY FARMING IN BUNGOMA DISTRICT
4.1. Introduction
The high potential agricultural areas of Kenya are very densely populated and holding sizes are
very small; free range grazing is no longer feasible and so livestock, especially cattle, have to be
fed on crop residues and cultivated fodder complimented with additional concentrates. Many
small-scale farmers practice intensive dairy farming where they do stall feeding and/or a
combination of stall feeding and grazing. This is because of their small land sizes of usually less
than five acres (Bebe et. al., 2002). Napier grass (Pennisetum purpureum) has become by far
more important than traditional grasses or other cut fodders due to its wide ecological range, high
yield potential and ease of propagation and management. This, among other factors, makes it a
favorite of dairy farmers. However, there are now serious problems of emerging diseases, both
fungal and mycoplasmal, which threaten Napier grass in Eastern Africa and unless resistant
cultivars and alternative fodders are found, the smallholder dairy industry will be threatened
(Orodho, 2006).
Severe diseases of Napier grass are affecting its continued use and represent a major threat to the
smallholder dairy sub-sector. Napier grass head smut; a fungal disease caused by Ustilago
kamerunensis, is a serious problem in central and eastern Kenya. This fungus has also been
reported in Tanzania, Uganda, Rwanda and Congo. The disease results in decreased biomass.
Biomass loss caused by smut ranged from 75-90% in Kiambu and 25-90% in Thika, with costs
of management and milk loss of 30-75% (Nyanyu 1998).
In Western Kenya and Uganda, the threat comes from Napier grass stunt disease, caused by a
phytoplasma which causes severe stunting and yield reduction. The disease is spreading rapidly
with high economic costs to farmers. Shortage of feed as a result of the disease has led to a
doubling of the price of a bundle of Napier grass in badly affected districts in Uganda.
Furthermore, farmers have to sell animals because they do not have enough feed and cannot
afford to buy at current prices. With fewer animals, the farmers have less milk so the nutrition of

28
children suffers. Similarly, without surplus milk to sell, income decreases and school fees and
other expenses cannot be met (Orodho, 2006).
Though scientists from several institutions have been working together to halt the spread of these
diseases. Farmers have shown efforts on how best to control them as some of the coping
strategies to stop the spread of the threatening Napier stunt disease. According to research done
by Khan et al., (2008), farmers gave the following suggestions; uprooting and burning the
diseased plants, stopping the application of fresh cow dung on planted Napier, planting diseases
resistant Napier grass, application of more fertilizers, and that scientists should carry out research
on this disease to determine Napier grass variety that is high yielding and is resistant to the NSD.
Other suggestions made included crop rotation, spraying with chemicals, leaving land fallow,
planting healthy Napier grass canes and fencing off grazing land.
As part of continued effort to address emerging problems of pests and diseases in the small-scale
dairy industry, this study was conducted to make a contribution to the understanding of farmers‟
perceptions of alternative grasses given the infestation by the Napier stunt disease, in order to
inform on the appropriate fodder grass to be promoted among the farmers to improve small-scale
dairy industry of which its specific aim in this chapter was to determine the extent of Napier
stunt disease infestation in small-scale dairy farming in order to estimate its damage.
4.2. Literature Review
Kenya's dairy industry is the most developed in East Africa. Like other agricultural subsectors,
the dairy industry is dominated by smallholder farmers, who account for over 75% of the
industry's total output. Additionally, it is one of the largest producers of dairy products in Africa,
with an estimated herd of 3.5 million improved dairy animals, 9 million zebus, 12 million goats,
and 900,000 camels. Cattle milk account for 88% of the milk produced whereas camels and
goats account for the rest, Ministry of Livestock and Fisheries Sessional paper (2006). Most of
the dairy farming is done on the Kenyan highland at >1000 m above sea level, due to its
favorable agro-ecological conditions for dairy farming (Staal, et al., 1997).
The New Agriculturist Report (2005) indicates that, cultivation of Napier or elephant grass has
been common in East Africa, as small-scale dairying has shifted from extensive to zero grazing.
However, the expansion of the fodder crop has been confronted with unique disease problems:

29
head smut to the east of the Rift Valley, and Napier grass stunt (NSD) to the west. In parts of
eastern Uganda and western Kenya, market prices for fodder grass have doubled in the last few
years as farmers have been forced to buy grass to compensate for declining production.
Napier stunt disease is caused by a phytoplasma (Wambua, 2007). It is a disease of economic
importance on Napier grass in Kenya. It has spread throughout western Kenya, causing
economic loss in the smallholder dairy industry. All Napier grass varieties are susceptible to the
disease which expresses itself after cutting or grazing. Infected shoots become pale yellowish-
green in colour and are dwarfed leading to subsequent death loss of up to 100% of their crop.
Orodho (2006) reported that many farmers having lost 100% of their Napier crop are being
forced to de-stock or sell-off their entire herd because of lack of feed.
The disease is spread in two ways: Over longer distances the primary means of spread is farmers
themselves. Napier is vegetatively propagated, so farmers can take either a slice of cane, or split
a clump, in order to plant on. If unaware of the dangers, they can inadvertently introduce a
diseased plant into their fields. Over shorter distances, such as between plants within a field, the
disease is primarily spread by plant hoppers, small insects in the same family as crickets, cicadas
and grasshoppers, which feed on the sugar-rich sap in Napier phloem and can, transfer the
phytoplasma in their saliva in the process. However, if that plant is cut down they will move to
another. Hence in fields where leaves are regularly harvested, as typically occurs with farmers
who use Napier for zero-grazing, the rate of insect movements, and therefore of disease spread,
is much higher, (New Agriculturist Report, 2005).
Napier stunt was first reported in Bungoma district in Western Kenya in 1997. It has spread
quickly and now covers several districts of Western Kenya causing serious economic loss in the
smallholder dairy industry including loss of up to 100% of Napier grass. Affected shoots become
pale yellow green in colour and seriously dwarfed. Often the whole stool is affected with
complete loss in yield and eventual death, Orodho, (2006). Furthermore, Mulaa et al., (2004)
established in their study that, the affected plants are small, yellow, may have many leaves but
they are very thin and the plant eventually dries and dies. As a coping strategy, the authors
recommended that farmers should plant grass from healthy fields, should check grass frequently
and uproot diseased plants, replant with healthy grass, burn the sick plants, or bury them deeply.

30
Scientists from several institutions have been working together to halt the spread of Napier stunt
disease. They have been raising awareness of the diseases, providing information on how best to
control them and determining clones of Napier that are genetically resistant to the diseases.
Amongst other research work done, KARI undertook research to identify Napier grass varieties
resistant to the disease, whereby two smut-resistant clones of Napier grass; Kakamega 1 and
Kakamega 2 from the in trust collection held by ILRI, were identified. However, these varieties
are less productive than the best local varieties and not satisfying the demands of local farmers,
(Farrel et al., 2002). Furthermore, KARI and the Global Plant Clinic reported on a short “Going
Public” campaign in western Kenya to raise awareness of the problem of Napier grass stunt
which requires follow up in the form of a sustained and long term program of extension and
research to combat this threat to dairy farmers in East Africa. Scientists at the International
Centre of Insect Physiology and Entomology (ICIPE) amongst other research work have also
made an effort of assessing farmers‟ perceptions of the NSD in order to investigate their
knowledge and experience of the disease and how they were controlling or managing the NSD.
Therefore there is still need to determine the extent of Napier stunt disease infestation in small-
scale dairy farming in order to estimate its damage which is addressed in this chapter.
4.3. Statistical Analysis.
To achieve the above objective, descriptive analysis was utilized. This entails statistical analysis
to determine the mean, percentages, frequencies and likert scale techniques in order to determine
the extent of Napier stunt disease in small-scale dairy farming.
4.3.1. Data Collection and Analysis
Prior to the sampling design and techniques discussed in Chapter three, a total of 140
smallholder dairy farmers from five divisions in the traditional Bungoma district; facing the
problem of Napier stunt disease, practicing PPT and those not practicing the technology were the
target population of the study. Farmers from each of the five divisions who had planted Napier
grass on their plots were randomly sampled and interviewed using structured questionnaires
developed to capture farmers‟ knowledge on factors that explain the extent of NSD infestation in
order to explain its damage.

31
The study focused on farmers‟ knowledge of the NSD and its effects to the dairy industry.
Important data collected included, the year the farmers first observed the disease, size of land
affected, measures taken to counter the effect of the disease, and whether other preferred grasses
in place of Napier grass have been adopted. The respondents were also asked to rate how the
NSD had affected their farming enterprise using the Likert type scale on a four point scale with
1= No effect, 2= little effect, 3= Moderate effect, and 4= High effect. Data generated was
analyzed using SPSS application software (Version 15.0). The frequencies, percentages, mean
and cross tabulations were generated during analysis.
4.4. Results and Discussion
4.4.1 Gender and age of respondents
A total of 140 farmers drawn from Bungoma district were interviewed and 72.9% were male (see
Table 1). The mean age of the participants was 49.7 with a range of between 28 and 83 years.
Most (46.4%) of the farmers in Malakisi, 42.9% in Webuye, 42.9% in Sangalo, 30% in Kibabii
and 42.3% in Bumula division were under the age category of 41-55 years old. The relationship
between gender of the interviewed respondents and the divisions was statistically significant
(p<0.05), whereas there was no significant difference in the age of respondents in the divisions
(p> 0.05). The results imply that, male respondents were more likely to be interviewed in the
divisions as compared to female respondents.
Table 1: Distribution of respondents across Divisions by gender and age (%)
Variable Malakisi Webuye Sangalo Kibabii Bumula Total Chi-square
value
Gender: Male 75 46.4 92.9 86.7 61.5 72.5 20.196***
Age: 25-40 17.9 28.6 14.3 46.7 23.1 26.1
41-55 46.4 42.9 42.9 30 42.3 40.9
56-70 28.6 25 39.3 20 26.9 28 11.401
71-85 7.1 3.6 3.6 3.3 7.7 5.1
Note: *** Statistically significant at 1%
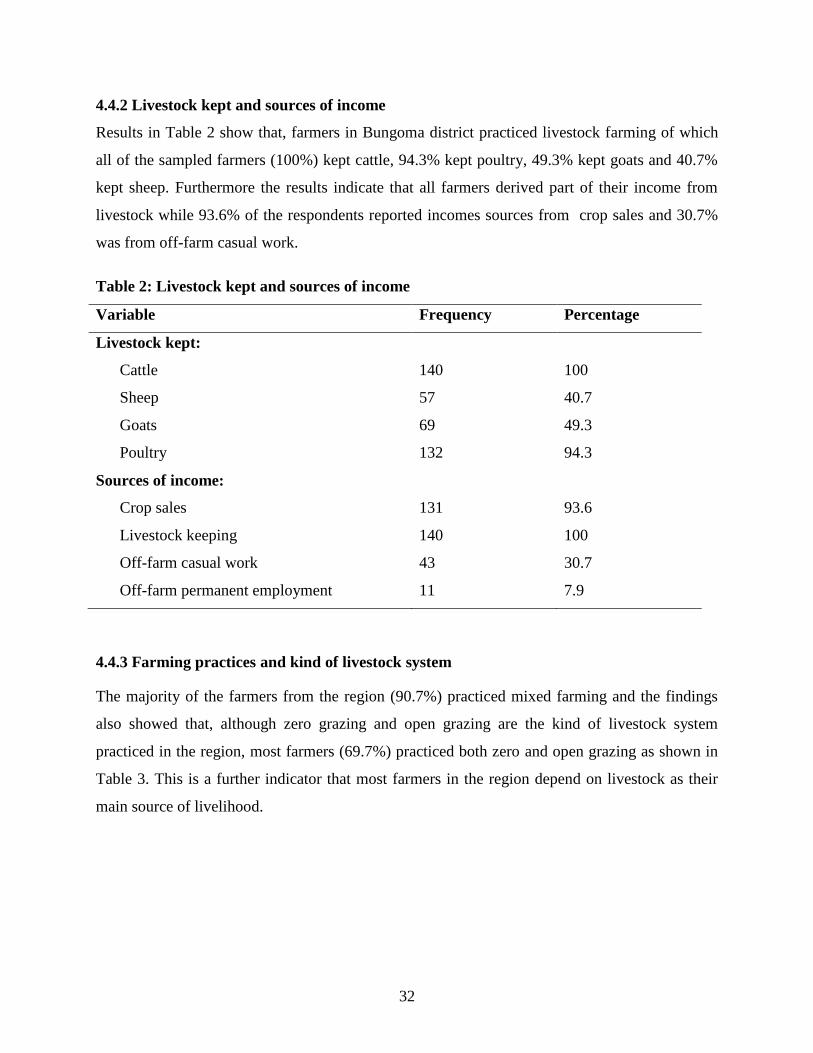
32
4.4.2 Livestock kept and sources of income
Results in Table 2 show that, farmers in Bungoma district practiced livestock farming of which
all of the sampled farmers (100%) kept cattle, 94.3% kept poultry, 49.3% kept goats and 40.7%
kept sheep. Furthermore the results indicate that all farmers derived part of their income from
livestock while 93.6% of the respondents reported incomes sources from crop sales and 30.7%
was from off-farm casual work.
Table 2: Livestock kept and sources of income
Variable Frequency Percentage
Livestock kept:
Cattle
140
100
Sheep 57 40.7
Goats 69 49.3
Poultry 132 94.3
Sources of income:
Crop sales
131
93.6
Livestock keeping 140 100
Off-farm casual work 43 30.7
Off-farm permanent employment 11 7.9
4.4.3 Farming practices and kind of livestock system
The majority of the farmers from the region (90.7%) practiced mixed farming and the findings
also showed that, although zero grazing and open grazing are the kind of livestock system
practiced in the region, most farmers (69.7%) practiced both zero and open grazing as shown in
Table 3. This is a further indicator that most farmers in the region depend on livestock as their
main source of livelihood.

33
Table 3: Farming practices
Variable Frequency Percentage
Type of farm practice:
Mixed farming
127
90.7
Livestock farming 13 9.3
Kind of livestock system:
Zero grazing
8
5.7
Open grazing 35 25
Both open and zero
grazing
97 69.3
4.4.4 Main source of fodder and use of Napier grass
Findings in Table 4 show that about 98.6% of the farmers grow Napier grass which is the most
suitable fodder for small-scale dairy farmers in the region. They further verify that the majority
of the farmers interviewed (88.6%), had their own fodder as the main source of feed for their
dairy enterprises, 24.3% bought fodder for their livestock and 37.1% obtained feed for their
livestock from free grazing fields. The results show the proportionate importance of Napier grass
either in feeding livestock for milk production which is represented by 96.4%, soil conservation
(72.9%), stemborer control through Push-pull technology (51.4%), or selling for money which
was represented by 27.9% of the interviewed farmers. These results suggest that, despite the
serious effect of NSD in the region, farmers still value Napier grass as a major source of feed for
their dairy enterprise.

34
Table 4: Distribution, main source of fodder and use of Napier grass
Variable Frequency Percentage
Whether farmers grow Napier
Grass: (Yes=1)
138
98.6
Main source of livestock feed:
Own farm fodder
124
88.6
Buy fodder 34 24.3
Free grazing fields 52 37.1
Main use of Napier grass:
Feeding livestock
135
96.4
Selling for money 39 27.9
Soil conservation 102 72.9
Stemborer control (PPT) 72 51.4
4.4.5 The extent of Napier stunt disease infestation
About 97.9% of the farmers interviewed were aware of the disease and had witnessed it in their
own farms. Moreover 78.3% of the farmers acknowledged that the affected grass becomes small
in size; their leaves turn yellow in colour and eventually dry off. On measures to be taken to
counter the effect of NSD, about 39.3% of them indicated the strategy of uprooting and burying
the affected plants, 24.3% recommended uprooting, burning, burying affected plants and
replacing with healthy grass, 20.7% advocated uprooting affected plants and 15.7% mentioned
that affected plants should be uprooted and animal manure should be applied on entire affected
portion of land. This is consistent with Mulaa et al., (2004) who reported that, Napier stunt is a
serious disease which if not controlled, farmers may lose over half of their yield of Napier grass.
How farmers came to know of the strategies of countering the NSD may be attributed to
extension services which is evident from the study results that 60% of the farmers received
extension services either on Napier stunt disease awareness or dairy farming practices among
others (Table 5).

35
Table 5: The extent of Napier stunt disease
Variable Frequency Percentage
Ever heard of NSD (Yes=1) 137 97.9
Knowledge on NSD:
Stunted growth (small in size)
4
2.9
Yellowing of leaves 5 3.6
Small, yellow and dries off 108 77.1
Small and yellow in colour 16 11.4
Small and dries off 5 3.6
Whether NSD has affected
Napier grass ( Yes=1)
137
97.9
How NSD can be controlled:
Uproot/bury affected plant
55
39.3
Uproot/burn/bury/replant 34 24.3
Uproot 29 20.7
Uproot/apply animal manure 22 15.7
Effect on dairy farming:
Reduction of milk production
123
87.9
Reduction of stock 11 7.9
Increased cost of production 6 4.3
Access of extension services
(Yes=1)
84 60
Adoption of Alternative fodder
grasses (Yes=1)
96
68.6
Although the results suggest that most farmers in Bungoma are experiencing negative effects of
the disease, none of the farmers had a total loss of Napier grass in their farms. Nevertheless, the
disease so far has a negative impact on dairy farming enterprise whereby 87.9% of the
respondents pointed out that they had experienced a reduction in milk production, 7.9% had
experienced reduction of stock and only 4.3% had experienced an increased cost of production.

36
Due to the impacts of NSD on Napier grass varieties, the respondents were asked if they had
adopted any other alternative grass as fodder in replacement of Napier grass. About 68.6% of the
respondents indicated adoption of other alternative grasses (Table 5). However, farmers‟
preferences on alternative grasses mentioned will be discussed in the next chapter.
Figure 3 presents a profile of the onset of the NSD over a period of years. From the figure it is
evident that the symptoms of the disease were first noticed as early as 1998 in Bungoma District
though it had not spread and felt much by most farmers in the region. As the effects of the
disease spread gradually, its awareness increased with the highest awareness being experienced
in 2006 (22.5%). The number of farmers noticing the symptoms of the disease has been growing
generally between 0.7-22.5 percent annually. The incidences of NSD declining after the year
2006 towards 2009 may be attributed to coping strategies highlighted by farmers on measures
taken to counter the threat of NSD.
Furthermore, on being interviewed on the size of land affected by NSD, farmer responses
indicated that at least a portion of their land had been affected with minimum size of land
Figure 3: Year when Napier stunt disease was first observed
2009 2008 2007 2006 2005 2004 2003 2002 2000 1999 1998
Percent
25
20
15
10
5
0

37
affected being 0.01 acres and the maximum being two acres (Table 6). There was no significant
difference in the land affected by NSD in the divisions (p>0.05).
Table 6: Size of land in acres affected by NSD (N=140)
Name of the division Minimum Maximum Mean of land
in acres
Malakisi 0.01 2.0 0.28
Webuye 0.25 0.50 0.36
Sangalo 0.13 0.33 0.25
Kibabii 0.01 1.0 0.20
Bumula 0.01 0.50 0.25
On how NSD had affected their farming enterprise, results in Figure 4 indicate that a majority
(65%) of the farmers in the study area indicated that they had experienced a loss of about 25% of
their Napier grass; 33% of the farmers pointed out that they had experienced a loss of about 50%
to 75% of their Napier grass and only 2% had not experienced any loss of their Napier at all
(Figure 4).
2%
65%
33%
No effect
Little effect (1/4 loss of Napier)
Moderate effect (1/2 to 3/4 loss of Napier)
High effect (3/4 loss of Napier)
Figure 4: Proportion of Napier grass affected by NSD (Percentage)
38
4.5 Conclusion
The majority of the small-scale dairy farmers‟ practice open and zero-grazing, their main source
of fodder being Napier grass which was found to be highly susceptible to the stunt disease. The
NSD causes small, yellowing of leaves and whole plant dries off. It has spread among small-
scale farmers‟ in the region since it was first noticed in 1998, thus causing economic loss in the
smallholder dairy industry and hence affecting the livelihoods of the rural poor. In this study
farmers acknowledged the fact that NSD had affected their Napier grass, for instance; in all the
five divisions of Malakisi, Webuye, Sangalo, Kibabii and Bumula, farmers mentioned the
proportion of the Napier which had the effect of NSD and the proportion loss of Napier grass
leading to a reduction in milk production, reduction of stock and an increased cost of production.
Moreover, as a NSD control mechanism, the findings obtained from this study show that farmers
recommended uprooting, burning, burying affected plants and replacing with healthy grass. They
also mentioned that animal manure should be applied on the farms. This suggests that knowledge
transfer to farmers about the disease and short-term coping strategies together with extension
services are also urgently needed to stem the imminent threat by the NSD to the livestock
industry whilst research on long term solutions is conducted.

39
REFERENCES
Bebe, B.O., H.M.J. Udob, G.J. Rowlands, and W. Thorpe (2003). Smallholder dairy systems in
the Kenya highlands: Cattle population dynamics under increasing intensification.
Livestock Production Science, 82 (6), 211–221.
Farrell, G., Simons, S.A., and Hillocks, R.J., (2002). Ustilago kamerunensis on Napier grass in
Kenya. International Journal of Pest Management, 48 (9), 25-28.
Khan, Z.R., Amudavi, D.M., Midega, C.A.O., Nyang‟au, I.M., Pittchar, J., and Pickett, J.A.,
(2008). Farmers‟ knowledge and perceptions of Napier grass stunt disease in smallholder
farming systems in Western Kenya. Unpublished Manuscript.
Ministry of Livestock and Fisheries Development (2006). Draft Sessional paper for dairy
industry development. Ministry of Livestock and Fisheries Project Reports; Government
of Kenya.
Mulaa M., Muyekho F., Nandasaba J., Nyakira B., and Kute C., (2004). Napier stunting disease.
Kenya Agricultural Research Institute (Kitale Centre) Annual Report.
New Agriculturist report for 21st Century, (2005). Grass stunt draws a crowd. Retrieved on June
5th
2009, from, www.new-ag.info/focuson.htm.
Nyanyu, G., (1998). Napier grass head smut in Kiambu and Thika districts. Proceedings of the
2nd
workshop on smut disease of Napier grass. October 1998.
Orodho, A.B., (2006). The role and importance of Napier grass in the smallholder dairy industry
in Kenya. http://www.fao.org/doc/newpub/napier_kenya.htm. 22nd
, August 2009.
Staal, S., Delgado, C., and Nicholson, C., (1997). Smallholder dairying under transactions costs
in East Africa. World Development, 25(5), 779 -794.
Wambua M., (2007). Plant protection: Napier grass turning yellow, KACE: Question Answer
Service for Agriculture. http://www.runetwork.de/html. 22nd
, August 2009.

40
CHAPTER FIVE
FARMERS’ PERCEPTIONS AND PREFERENCES ON SUITABILITY OF
ALTERNATIVE FODDER GRASSES
5.1. Introduction
According to Orodho, (2006), East Africa has many areas suited to dairying, especially in the
better-watered zones at medium and high altitudes which are well-adapted for forages, many of
which are of local origin. Furthermore, forage quality is looked at in terms of the nutritive value,
factors influencing quality and ways of improving it. Further Orodho reported that, smallholder
dairying has undergone intensification and changes in management whereby systems are moving
from grazing to stall feeding. As a response, smallholder dairy farmers have developed feed
management strategies to cope with these changes. Additionally, to enhance and facilitate this
transition in management, availability of seed of recommended forages is important as well as
the availability of access to adapted seed production technologies and production of seed of
recommended cultivars by the formal and informal seed sectors are also essential.
Although disease and parasite challenges can be strong where forages of economic importance
are increasingly attacked by diseases and pests, small-scale dairy farmers have over the years
depended on Napier grass because of its high herbage yield, ease of establishment and relatively
high quality for utilization Mulaa et al., (2004),. Nevertheless, in the recent times Napier grass
varieties recommended for on-farm production have increasingly been affected by stunting
disease.
As reported by Nandasaba et al., (2005) due to the threat of NSD, there was need to look for
alternative high yielding fodder grasses to Napier grass in order to keep and maintain dairy
production. Furthermore Nandasaba et al have highlighted that Giant panicum (Panicum
maximum), Giant seteria (Seteria splendida), Guatemala grass (Tripsacum laxum), Sudan grass
(Sorghum vulgare sudanense) among others were identified as fodder grasses that produce high
herbage dry matter yields with comparatively high nutritive qualities that could be used as
alternatives to Napier grass in stunting disease prone areas. What is not clear is whether the
farmers are willing and able to adopt them and under what circumstances.

41
5.2. Literature Review
Dairy farming is important in and around Kenya‟s major towns. Smallholder production is
constrained by inadequacy and seasonality of feed and its quality, and by low dry matter intake.
Stall feeding using crop residues, natural grass – mostly Kikuyu grass (Pennisetum
clandestinum), star grass (Cynodon spp.), Rhodes grass (Chloris gayana) and seteria (Setaria
sphacelata) - is common and increasing. The purchase of fodders such as Napier grass
(Pennisetum purpureum) or hay, some of which is from the roadside or from farmers who do not
have livestock, is common in intensive areas (Staal et al., 1998).
As reported by Orodho (1990), planted fodders on smallholder farms include sweet potato
(Ipomoea batatas) vines, various kinds of vetch (Vicia spp.) and desmodium (Desmodium
uncinatum, D.intortum) or fodder trees such as Calliandra (Calliandra calothyrsus) and leucaena
(Leucaena leucocephala). Farmers also buy grain, concentrates and agro-industrial by-products
such as bran, wheat pollard and dairy meal. Nevertheless, Napier grass is the major fodder used
by smallholders in Kenya.
According to Orodho‟s (2006) study, smallholder dairy farmers can increase production by
planting improved forage. Further this study reports that, planted fodders play a significant role
in smallholder dairy production: they are mostly identified with zero grazing and stall feeding in
smallholder dairying. Of all the planted fodders used by smallholders, Napier grass is the most
popular; it forms up to 40 percent of the dry matter in the diet of dairy cattle, the rest coming
from other cultivated grasses, fodders, crop by-products, crop residues and purchased
concentrates (Orodho, 2006). In contrast to the omnipresent Napier grass, other forages,
including fodder trees and shrubs and herbaceous legumes have not been widely adopted on most
smallholders‟ farms. A few smallholders plant Sesbania spp. or Calliandra spp., and herbaceous
legumes, such as Desmodium spp. This shows that there is always a trade-off, for instance;
introducing or cultivating these fodder grasses take up resources that would be used elsewhere.
Besides, uptake or adoption of such grasses may be constrained by the kind of objectives that the
farmers might wish to optimize.
According to Jones et al., (2004) Napier grass is also attacked by diseases and pests, causing
serious economic loss and concern to farmers. Some of the important diseases and pests are;

42
Snowmould fungal disease, Napier grass head smut and Napier grass stunting disease.
Snowmould fungal disease causes a white mould on the leaves and stems. This disease has also
been reported to attack Kikuyu grass and Nandi seteria (Van Wijk, 1974). Napier grass head
smut is another serious Napier grass disease caused by a fungus Ustilago kamerunensis, whereby
affected plants develop fungal symptoms that look like flower structures but open up releasing
black spores. The stems then become smaller and the total dry matter of the affected crop is
drastically reduced and after 2–3 cuttings the entire stool dries (Farrel, 1998). Napier grass
stunting disease is further a serious Napier grass disease which has spread in Western Kenya; it
was first reported in Bungoma district in 1997. A similar disease had been reported in Uganda
and its cause was suspected to be a virus, probably transmitted by insects (Tiley, 1969).
Research done by Muyekho et al., (2003) on development and transfer of forage production
technologies for smallholder dairying in Western Kenya, utilized a case study approach to
evaluate 12 forage species/varieties at two sites in the Trans Nzoia District. Grasses including
Rhodes grass (Chlorisgayana), Napier grass (Pennisetum purpureum), Bana Napier grass, Clone
13 Napier grass, French Cameroon Napier grass, Guatemala grass (Tripsacum laxum), Sudan
grass (Sorghum sudanense), and Nandi Setaria (Setaria sphacelata ), while forage legumes
including Lucerne (Medicago Sativa) dolichos (Lablab purpureus) Silverleaf desmodium, and
mucuna (Mucuna pururiens) were evaluated. In general, farmers considered factors that related
directly to the animal to be more important than factors related to agronomic characteristics of
the forage (tolerance to drought, high forage yield and tolerance to pests and diseases).
Furthermore, farmers‟ preferred Napier grass among the above mentioned forage species.
Sinja et al., (2004) did a research on farmers‟ perception of technology and its impact on
adoption using a case study of legume forages in central Kenya highlands. Four most important
fodder legume attributes to farmers in their adoption decision were identified as: dry season
tolerance; disease resistance; economy on land; and availability of planting materials which were
then used in conjoint analysis. An ordered probit model was estimated to assess relative
importance of each attribute to the farmer. A Tobit model was also estimated to show the effect
of farmers‟ perception of calliandra and desmodium on probability and intensity of adoption.
Results showed that dry season tolerance and economy on land are most important
43
characteristics of fodder legumes to the farmers. It was also found that Calliandra and
desmodium were more relevant to the farmers in the area than other fodders.
The objective of this chapter was to assess farmers‟ perceptions on suitability of alternative
fodder grasses in order to establish their preference for dairy grasses. This study contributes to
the understanding of farmers‟ perceptions of alternative grasses in small-scale dairy farming
given the infestation by the Napier stunt disease. Farmers were provided with a list of alternative
grasses which they were to rank in order of their preferences; the ranks were then subjected to
descriptive statistics to determine the order of preference. Multinomial logit analysis was
performed to determine the relationship between grass alternatives; molasses, Sudan, natural,
giant seteria and signal grass, and the independent variables including; farm and farmer
characteristics; land size, gender, age, years spend in schooling, institutional characteristics;
availability of extension services, adoption of push-pull technology, and grass attributes; cost of
grass planting materials, growth rate, dry season tolerance, grass biomass, economy on land and
disease resistance. For a better interpretation of the outcomes, marginal effects were computed
by differentiating the coefficients at their mean.
5.3. Data and methods
5.3.1: Multinomial Logit Model (MLM)
According to McFadden (1974), Multinomial logit models are used to model relationships
between a polytomous response variable and a set of regressor variables. Generalized logit and
conditional logit models are used to model consumer choices. The generalized logit model
consists of a combination of several binary logits estimated simultaneously. In studying
consumer behavior, an individual is presented with a set of alternatives and asked to choose the
most preferred alternative. Both the generalized logit and conditional logit models are used in the
analysis of discrete choice data. In a conditional logit model, a choice among alternatives is
treated as a function of the characteristics of the alternatives, whereas in a generalized logit
model, the choice is a function of the characteristics of the individual making the choice.
In many situations, a mixed model that includes both the characteristics of the alternatives and
the individual is needed for investigating farmers‟ choice. This study will utilize both generalized

44
and conditional logit models which focus on individual farmer as the unit of analysis and the
characteristics of the alternative grass attributes, institutional, farm and farmer characteristics as
explanatory variables.
The explanatory variables are constant over the alternatives in the choice set (Maddala, 1992).
Logistic regression analysis was used to reveal and quantify the relations between the farmer‟s
perception for a particular grass and some chosen explanatory variables. Grass attributes in the
study were captured by: cost of planting materials; growth rate; disease resistance; dry season
tolerance; economy on land; and biomass of the grass. Farm and farmer characteristics included:
Farm size; age; gender; education level and family size. Institutional characteristics included
Adoption of PPT and access to extension services.
A more general model may be obtained by combining generalized and conditional logit
formulations, so the underlying utilities Uij depend on characteristics of the individuals as well as
attributes of the choices, or even variables defined for combinations of individuals and choices
(such as an individual's perception of the value of a choice). The general model is usually written
as:
zbxu ijjiij -------------------------------------------------------------------------------------------------------------------------- (6)
where, xi represents characteristics of the individuals that are constant across choices, and zij
represents characteristics that vary across choices (whether they vary by individual or not)
Rodriguez, (2000).
Suppose Xi is a vector of explanatory variables, βj is the matrix of parameters to be estimated and
Y is the response variable which can be binary or multiple in nature such that Prob (Yi = j) is the
probability of individual farmer i choosing a particular grass j. A general formalization of the
MNL according to Schmidt and Strauss (1975) is: The probability that individual farmer i
chooses alternative j is;
jje
eJYP
ik
ij
x
x
r ,......2,1,1
---------------------------------------- (7)

45
The log likelihood function is expressed as:
,1
10
ik xre
yP
----------------------------------------------------------------------- (8)
The reduced linear form of the MNL model becomes:
k
k
k
k
j
j
jj
i
i
ii XXXY111
0 .......... ------------------------------------------------- (9)
where; Y is the log – odds ratio, β0 is the intercept term, βi, βj and βk are vectors of parameters to
be estimated (each of which is different, even though Xj is constant across alternatives), Xi, Xj and
Xk are vectors of grass attributes, farm and farmer characteristic variables and institutional
characteristics that influence farmers‟ perception leading to a choice of a particular grass and
is the error term which is assumed to be independently, normally distributed with zero mean and
constant variance.
The estimation model is specified as follows:
Yi = β0 + β1 (FAMSIZE) + β2 (AGE) + β3 (GENDER) + β4 (EDUC) + β5 (FAMLYSIZE) + β6
(PPT) + β7 (EXT) + β8 (COSTP) + β9 (GR) + β10 (DR) + β11 (DST) + β12 (ECN) + β13 (BM) + ε
where; Yi is the farmers‟ perception on choosing/ preferring a particular grass such that; Y = 0 if
the farmer does not perceive to choose a particular grass, Y = 1 if a farmer perceives to choose a
particular grass. β0 = constant term and ε = error term. Table 7 summarizes the hypothesized
relationships between Yi and Xk

46
Table 7: Description of the Variables and Expected Signs
Abbreviation Variable name Description Hypothesized
effect
FAMSIZE Farm size Acres +
AGE Age of the farmer Years +
GENDER If decision maker is male
/female(male=1,female=0)
Dummy + or-
EDUC Years of schooling Years in formal
education
+
FAMLYSIZE Family size Number of persons
+
PPT Adoption of PPT 1 if yes, 0 otherwise +
EXT Availability of extension
services
1 if yes, 0 otherwise +
COSTP Cost of grass planting
material
3=high 2=moderate
1=low
+ or -
GR Growth rate of the grass 3=high 2=moderate
1=low
+ or -
DR Disease resistance 3=high 2=moderate
1=low
+ or -
DST Dry season tolerance 3=high 2=moderate
1=low
+ or -
ECN Economy on land 3=high 2=moderate
1=low
+ or -
BM Biomass of the grass 3=high 2=moderate
1=low
+ or -
In light of what the other researchers have done the choice of important fodder attributes were
identified based on their studies. Adesina et al., (1993 and 1995) in their studies included
attributes whose perception by the farmer is thought by the researchers or extension agent to be
important in their decision to adopt the technology. Sinja et al., (2004), considered fodder
legume attributes suggested by the farmers‟ themselves through participatory techniques which
included; economy on land, dry season tolerance, cost of planting material and disease
resistance. In research done by Muyekho et al., (2003), criteria for suitable forage species were

47
set and farmers ranked the attributes based on their own local technical knowledge. Amongst the
agronomic characteristics, tolerance to drought, high forage yield and tolerance to pests and
diseases were considered to be more important than other factors.
In this study grass attributes, cost of grass planting materials, growth rate, disease resistance, dry
season tolerance, economy on land and grass biomass were set and each attribute had three
levels; high, moderate and low. Other explanatory variables included farmer, farm and
institutional factors hypothesized to influence perception whereas dependent variable was
alternative fodder grass to be used in the dairy industry due to the presence of NSD. Five
alternative fodder grasses were identified and included molasses, Sudan grass, Giant seteria,
signal grass and natural grass. Since rankings and ratings all yield bounded discrete indices, the
empirical utility function can be estimated via probit or logit (Mackenzie, 1993).
An appropriate framework for analyzing the effect of independent variables on choice, when
there are a finite number of choices greater than two, is multinomial logit estimation which has
been used widely by agricultural economists. Using multinomial logit, the probability of the ith
individual's choice of the jth
grass is assumed to follow a logistic distribution Maddala (1983).
Marginal probabilities of choice (that is, the marginal effects) can be calculated from the
multinomial logit results employing the following formulation (Greene, 2003):
mjm
i jpijp jxi
p j..,2,1,
1
------------------------------------------- (10)
The marginal effects are partial derivatives of probabilities with respect to the vector of
characteristics and are needed since parameter estimates do not allow for direct determination of
the marginal effects in multinomial logit models (Schupp, 1998).
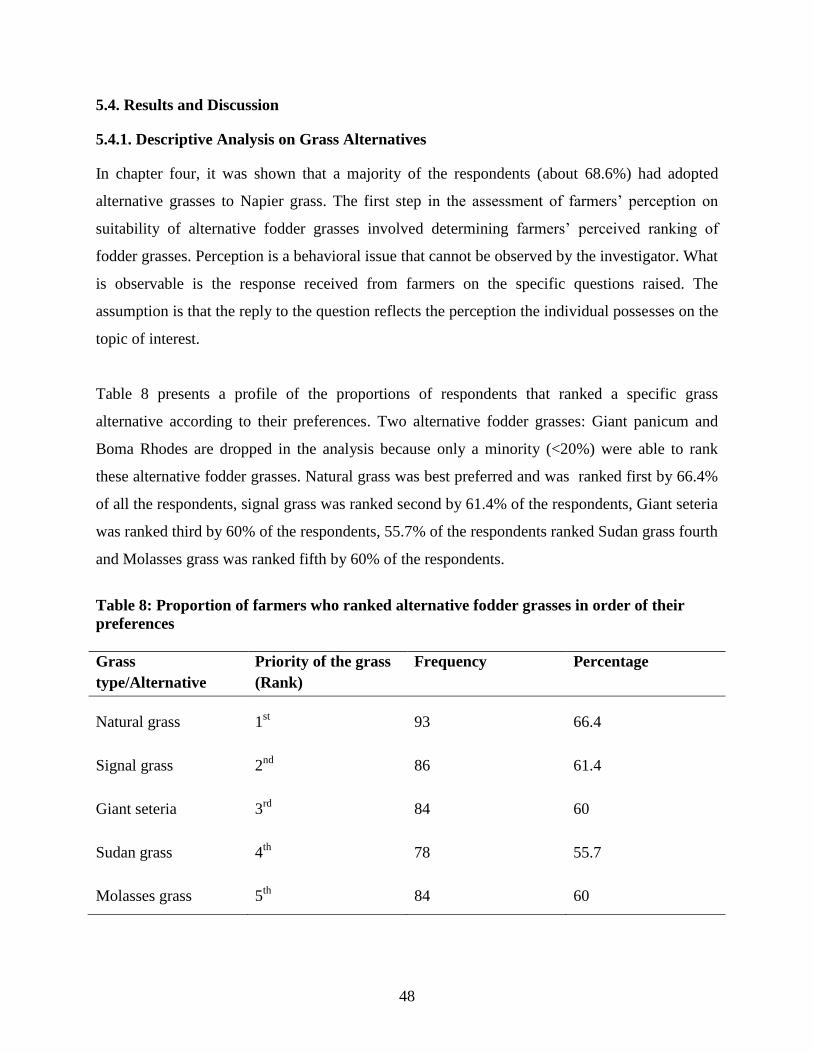
48
5.4. Results and Discussion
5.4.1. Descriptive Analysis on Grass Alternatives
In chapter four, it was shown that a majority of the respondents (about 68.6%) had adopted
alternative grasses to Napier grass. The first step in the assessment of farmers‟ perception on
suitability of alternative fodder grasses involved determining farmers‟ perceived ranking of
fodder grasses. Perception is a behavioral issue that cannot be observed by the investigator. What
is observable is the response received from farmers on the specific questions raised. The
assumption is that the reply to the question reflects the perception the individual possesses on the
topic of interest.
Table 8 presents a profile of the proportions of respondents that ranked a specific grass
alternative according to their preferences. Two alternative fodder grasses: Giant panicum and
Boma Rhodes are dropped in the analysis because only a minority (<20%) were able to rank
these alternative fodder grasses. Natural grass was best preferred and was ranked first by 66.4%
of all the respondents, signal grass was ranked second by 61.4% of the respondents, Giant seteria
was ranked third by 60% of the respondents, 55.7% of the respondents ranked Sudan grass fourth
and Molasses grass was ranked fifth by 60% of the respondents.
Table 8: Proportion of farmers who ranked alternative fodder grasses in order of their
preferences
Grass
type/Alternative
Priority of the grass
(Rank)
Frequency Percentage
Natural grass 1st 93 66.4
Signal grass 2nd
86 61.4
Giant seteria 3rd
84 60
Sudan grass 4th
78 55.7
Molasses grass 5th
84 60
49
The results suggest that farmers were able to rank natural grass as the most preferred grass. This
may be due to the fact that natural grass is readily available for grazing purposes and it is less
costly to access/get. It does not need establishment, does not warrant conservation; and it is good
in soil conservation.
Signal grass was ranked second after natural grass by majority of the farmers may be due to the
fact that it increases livestock productivity. According to Muyekho et al., (2004), signal grass is
well distributed in Western Kenya among other regions, and has good grazing value, and makes
good hay. The authors also established that it controls soil erosion due to its good ground cover;
commonly used for thatching, mulching, compost manure making and seed is commercially
available. Roothaert (2005) also found that, signal grass has the potential to continue growing
during at least part of the dry season and remains a high leaf: stem ratio unlike Napier grass
which normally stays green during the dry season, but stops growing and becomes stemmy
during the dry season.
Giant seteria was ranked third. This is probably due to the fact that it provides good forage for
livestock production when fed to the domestic animals. Muyekho et al., (2004) have shown that
giant seteria is common in damp places (this is characteristic of Western Kenya). It is leafy and
of good grazing value with potential to improve livestock health and increase productivity.
However, they also found that it is among the top 10 grasses that farmers in western Kenya
would like to conserve on their farms and it is observed to drain soil moisture rather quickly at
the onset of dry season.
Sudan grass and molasses grass were ranked fourth and fifth, respectively. This would be
explained by the fact that, farmers had the information of being used as integral grasses in the
novel push-pull technology which has been adopted by majority of the farmers in the region.
This is consistent with Khan et al., (2002) who established that plants that have been identified
as effective in push-pull technology include; Napier grass, Sudan grass, molasses grass, silver
leaf desmodium and Greenleaf desmodium. Furthermore, Napier grass and Sudan grass have
shown high potential for use as trap plants, whereas molasses grass and silver leaf desmodium
repel ovipositing stemborer moths. The study also noted that these plants are of economic
importance to farmers in Eastern Africa as it has improved fodder and milk productivity and

50
have shown great potential in stemborer and Striga management in farmer participatory on-farm
trials. For further assessment of farmers‟ perceptions on suitability of alternative fodder grasses,
survey data were subjected to multinomial logit. The results of this analysis are discussed next.
5.4.2 MNL Model Results: Determinants of Farmers’ Perceptions on Alternative grasses
Table 9 shows the multinomial logit results for the relationship between farmers‟ perceptions on
alternatives to Napier grass including: molasses; Sudan grass; Giant seteria; signal grass; and
natural grass and the explanatory factors including farmer and farm characteristics, institutional
characteristics and grass attributes. Most of the explanatory factors were significant at the 5%
and 10% levels. The likelihood ratio chi-square value was 166.99 with 48 degrees of freedom
and significant p value (p<0.05. This implies that the model as a whole was statistically
significant - at least one of the predictors' regression coefficients in the model is not equal to
zero. The pseudo R square was 0.557 (55.7%) and natural grass was dropped as the base
outcome for comparison purposes. Further discussions of the model results by means of marginal
effects follow.
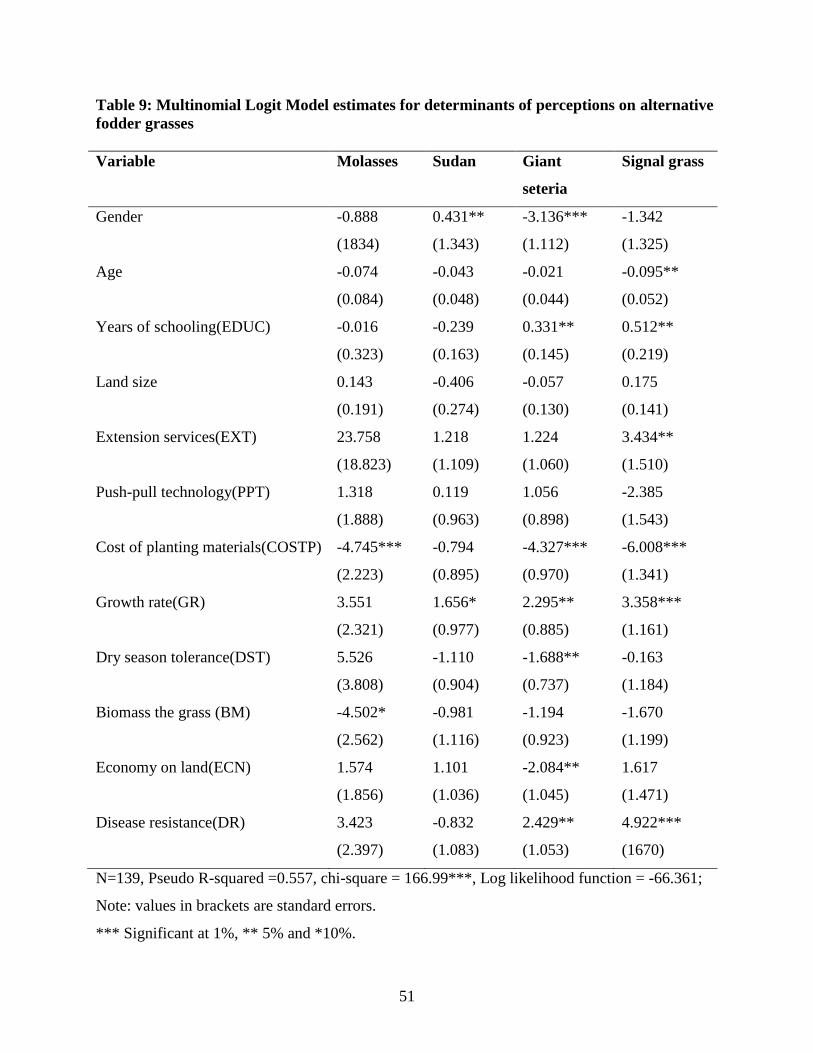
51
Table 9: Multinomial Logit Model estimates for determinants of perceptions on alternative
fodder grasses
Variable Molasses Sudan Giant
seteria
Signal grass
Gender -0.888
(1834)
0.431**
(1.343)
-3.136***
(1.112)
-1.342
(1.325)
Age -0.074
(0.084)
-0.043
(0.048)
-0.021
(0.044)
-0.095**
(0.052)
Years of schooling(EDUC) -0.016
(0.323)
-0.239
(0.163)
0.331**
(0.145)
0.512**
(0.219)
Land size 0.143
(0.191)
-0.406
(0.274)
-0.057
(0.130)
0.175
(0.141)
Extension services(EXT) 23.758
(18.823)
1.218
(1.109)
1.224
(1.060)
3.434**
(1.510)
Push-pull technology(PPT) 1.318
(1.888)
0.119
(0.963)
1.056
(0.898)
-2.385
(1.543)
Cost of planting materials(COSTP) -4.745***
(2.223)
-0.794
(0.895)
-4.327***
(0.970)
-6.008***
(1.341)
Growth rate(GR) 3.551
(2.321)
1.656*
(0.977)
2.295**
(0.885)
3.358***
(1.161)
Dry season tolerance(DST) 5.526
(3.808)
-1.110
(0.904)
-1.688**
(0.737)
-0.163
(1.184)
Biomass the grass (BM) -4.502*
(2.562)
-0.981
(1.116)
-1.194
(0.923)
-1.670
(1.199)
Economy on land(ECN) 1.574
(1.856)
1.101
(1.036)
-2.084**
(1.045)
1.617
(1.471)
Disease resistance(DR) 3.423
(2.397)
-0.832
(1.083)
2.429**
(1.053)
4.922***
(1670)
N=139, Pseudo R-squared =0.557, chi-square = 166.99***, Log likelihood function = -66.361;
Note: values in brackets are standard errors.
*** Significant at 1%, ** 5% and *10%.
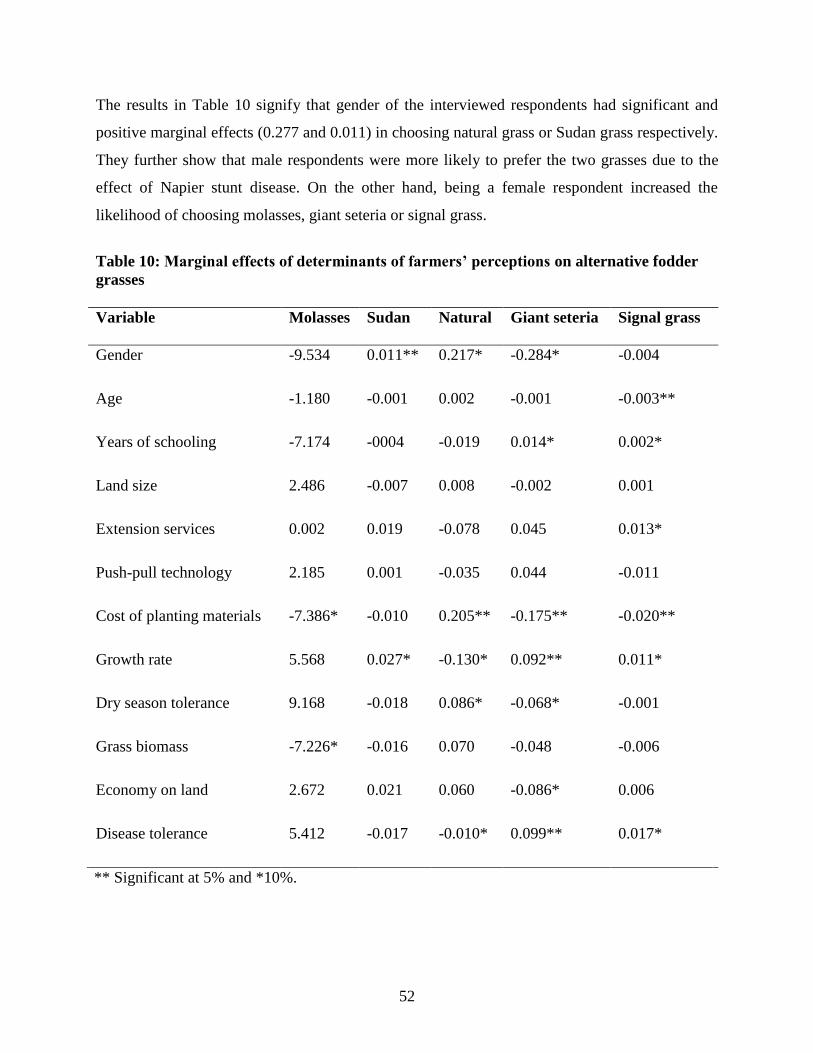
52
The results in Table 10 signify that gender of the interviewed respondents had significant and
positive marginal effects (0.277 and 0.011) in choosing natural grass or Sudan grass respectively.
They further show that male respondents were more likely to prefer the two grasses due to the
effect of Napier stunt disease. On the other hand, being a female respondent increased the
likelihood of choosing molasses, giant seteria or signal grass.
Table 10: Marginal effects of determinants of farmers’ perceptions on alternative fodder
grasses
Variable Molasses Sudan Natural Giant seteria Signal grass
Gender -9.534 0.011** 0.217* -0.284* -0.004
Age -1.180 -0.001 0.002 -0.001 -0.003**
Years of schooling -7.174 -0004 -0.019 0.014* 0.002*
Land size 2.486 -0.007 0.008 -0.002 0.001
Extension services 0.002 0.019 -0.078 0.045 0.013*
Push-pull technology 2.185 0.001 -0.035 0.044 -0.011
Cost of planting materials -7.386* -0.010 0.205** -0.175** -0.020**
Growth rate 5.568 0.027* -0.130* 0.092** 0.011*
Dry season tolerance 9.168 -0.018 0.086* -0.068* -0.001
Grass biomass -7.226* -0.016 0.070 -0.048 -0.006
Economy on land 2.672 0.021 0.060 -0.086* 0.006
Disease tolerance 5.412 -0.017 -0.010* 0.099** 0.017*
** Significant at 5% and *10%.

53
Results from this study show that age of respondents had an inverse relationship in choosing
molasses, Sudan, giant seteria or signal grass but positively influence the choice of natural grass
with a marginal effect of 0.002. This implies that despite the presence of Napier stunt disease in
the region, older farmers are less likely to prefer alternative grasses as younger farmers would
do. The observed inverse relationship between age and preference of alternative fodder grasses
maybe due to the fact that elderly farmers who have been using Napier grass are more risk averse
to adopt a technology that they are unfamiliar with and whose expected returns are not assured.
Years spent in schooling was negatively significant in influencing the probability of choosing
molasses, Sudan or natural grass and positively significant in choosing giant seteria or signal
grass. More years spent in schooling increased the probability of preferring giant seteria or signal
grass. The marginal effects of giant seteria and signal grass were 0.014 and 0.002 respectively.
The results imply that more educated farmers have access to information on alternative grasses
that can be used as fodder due to the threatening effects of Napier stunt disease in the dairy
industry. This is possible because farmers who are more educated attend and participate in
various agricultural based functions such as field days, farmer field schools and focus group
discussions among others.
Total land size owned by the farmers had an inverse relationship in choosing Sudan grass or
giant seteria and positively significant in choosing molasses, natural or signal grass. The positive
marginal effects for land size signify that those who have more land have an incentive and the
potential of planting other alternative fodder grass as a substitute to Napier grass due to the
effects of Napier stunt disease which has caused a great loss to the small-scale dairy industry.
This corroborates with Wanyoike (2004), who also found similar results that farm size had a
significant influence on adoption of Calliandra trees.
The results also show that extension services had a positive significant influence in choosing
molasses, Sudan, giant seteria or signal grass but had a negative relationship in choosing natural
grass. The positive marginal effects for the extension services signify that, availability of
extension services provided to the farmers enables them to get more information on alternative
fodder grass establishment and management particularly on how to plant, where to obtain seeds
and or planting materials. Therefore with the availability of knowledge or rather information on

54
alternative grasses, farmers are able to express their preference for alternative fodder grasses. On
the other hand, negative marginal effect may imply that interviewed farmers have access to
extension services but the information may be such that they should not prefer the grass (es) due
to associated costs of adopting a new system.
Push-pull technology had a positive relationship in choosing molasses, Sudan or giant seteria and
a negative relationship in choosing natural or signal grass. The results indicate that farmers who
adopt the push-pull technology are well endowed with information on various integral grasses
used in the novel push-pull technology thus are more likely to prefer molasses, Sudan or giant
seteria as alternatives to Napier grass. Farmers get involved with trained agricultural personnel
through farmer field days, seminars and frequent visits by extension officers therefore, can get
access to information on alternative grasses that can be used to substitute Napier grass due to the
presence of NSD.
Cost of grass planting materials influenced positively the choice of natural grass and had a
negative influence on choosing Molasses, Sudan, giant seteria or signal grass as alternative
fodder grasses due to the presence of NSD. This implies that grass alternatives which require
seeds as planting materials might be expensive to small-scale farmers who would prefer grasses
which are easy to establish through cuttings or root splits. As might be expected, farmers with no
off farm income placed greater importance on high cost of planting materials, which may be
because they cannot easily access ready cash. This is in accordance with Muyekho et al., (2003),
who recommended in their research that, small-scale dairy farmers require readily available
planting materials in forage establishment which are commercially available and economically
viable.
Results further signify that, growth rate had a positive significant influence in choosing
molasses, Sudan, giant seteria or signal grass and a negative influence in choosing natural grass
(marginal effect of -0.130). This implies that high growth rate during establishment is an
indicator for potential for dairy development, which will provide continual availability of pasture
to livestock. This corroborates with Wandera et al., (1997); Mason et al., (1999) who reported
that, in western Kenya major constraints to livestock farming systems are inadequate livestock
feeds.

55
Dry season tolerance had a positive influence in choosing either molasses, natural or signal grass
and a negative influence in choosing Sudan grass or giant seteria as alternative grasses to be used
in place of Napier grass. This implies that farmers‟ perception that fodder grasses have high dry
season tolerance significantly enhanced the probability and intensity of the farmer preferring the
fodder on the farm. However farmers would choose grasses which are dry season tolerant in that
they would have sufficient feeds for their livestock during dry season and even in presence of
drought. This is consistent with Roothaert et al. (2005) who established that; Napier is good
forage in many aspects, but it needs high soil fertility and continuous rainfall throughout the
year. Besides, this is an important attribute to small-scale dairy farmers who rely on mixed
farming as their main source of livelihood and require sufficient fodder throughout the year for
their dairy industry.
Furthermore, the results show that grass biomass had a negative influence in choosing molasses,
Sudan, giant seteria, or signal grass and a positive influence in choosing natural grass. This may
be due to the fact that, continued use of Napier grass which is the highest yielding grass in the
region despite the presence of NSD, makes the farmers not to prefer any other alternative grass
apart from the natural grass which is readily available. Moreover for small-scale dairy farming
improvement, farmers would prefer grasses that produce a lot of biomass because the more the
biomass produced, the more is available for livestock feeding thus increased milk production
with associated increased income.
Economy on land positively influenced the choice of molasses, Sudan, signal or natural grass and
negatively influenced the choice of giant seteria with a marginal effect of -0.086. As might be
expected, farmers with smaller farms placed more importance on high economy on land. This
implies that small-scale farmers would prefer grasses which economize on land which is meant
for both livestock production and food crop farming. Besides, Western Kenya is well known as a
predominantly high potential agricultural area with a high population density; moreover average
farm size has been steadily declining therefore alternative grasses with high economy on land
that can satisfy the demands for local farmers are preferred. This corroborates with research done
by Farrell (1998), who observed that identification of alternative resistant grasses and more
resistant clones of Napier is one of the approaches to address feed shortages. This approach is
56
economical and particularly suitable for Napier grass disease since the farmers threatened by
these diseases are resource poor and traditionally grow Napier grass with no or low inputs.
Disease resistance significantly increased the likelihood of choosing molasses, giant seteria or
signal grass with marginal effects of 5.412, 0.099 and 0.169 respectively and a negative
influence in choosing Sudan or natural grass with marginal effects of -0.017 and -0.099
respectively. This implies that regardless of the fact that Napier grass has been identified as the
most suitable fodder for intensive milk production on majority of smallholder farms in the
region, in the recent times Napier grass varieties recommended for on-farm production have
succumbed to stunting disease which seriously reduces grass yields. This is in accordance with
Muyekho et al., (2003), who reported that a number of Napier varieties favored by farmers,
especially Bana grass which is both high yielding and most preferred by farmers was found to be
susceptible to the disease.
The results also suggest that due to the presence of NSD which is affecting the continued use of
Napier grass consequently causing a major threat to the smallholder dairy sub-sector, farmers
would prefer other alternative grasses. This is a valid observation because adoption of other
alternative grasses preferred by farmers will also improve the feed base and related milk
production with associated increased income. This concurs with Muyekho et al., (2003) who
reported that amongst agronomic factors in addition to high yields, farmers greatly valued
tolerance to drought and resistance to local diseases/pests.
5.5. Conclusion
Since farmers‟ perception about the performance of alternative fodder grasses significantly
affects both the probability and the intensity to choose an alternative grass, it is essential that
researchers analyze those factors that farmers themselves suggest as important in their decision
to prefer and adopt fodder grass alternatives as was addressed by the multinomial logit analysis
method in this study.
Due to the effects of Napier stunt disease, recurrent scarcity of grazing materials especially
during the dry season and decreasing land size due to the high population pressure, small-scale
farmers in the study region value: low cost of grass planting materials; high growth rate; dry

57
season tolerance; high grass biomass; economy on land; and disease resistant fodder grass
attributes. Furthermore, attributable to different weights given to different fodder grasses by the
farmers, researchers can come up with specific fodders for each region.

58
REFERENCES
Jones, P., Devonshire, B. J., Holman, T. J., and Ajanga, S., (2004). New disease report: Napier
grass stunt, a new disease associated with a 16SrXI group phytoplasma in Kenya. Plant
Pathology, 53(4), 519.
Khan, Z. R., Amudavi, D. M., Midega, A.O., Wanyama, J.M., and Pickett, J.A., (2002). Use
“Push-Pull” Strategy and produce more maize by controlling stemborers and Striga weed.
Nairobi, Kenya: ICIPE Science Press.
Maddala G.S., (1992). Introduction to econometrics, second edition, New York: Macmillan
Publishing Company.
Maddala, G.S., (1983). Limited-dependent and qualitative variables in econometrics.
Cambridge: Cambridge University Press.
McFadden, D.L., (1984). Econometric analysis of qualitative response model. In Griliches Z. and
Intriligator M.D. (Eds.), Handbook of econometrics (vol. 2, pp.1395-1457).
B.V.Amsterdam: Elsevier Scientific Publishers.
Mulaa, M., Muyekho, F., Nandasaba, J., Nyakira, B., and Kute, C., (2004). Napier stunting
disease. Kenya Agricultural Research Institute (Kitale Centre) Annual Report.
Muyekho, F.N., Mose, L,. and Cheruiyot, D.T., (2003). Development and transfer of forage
production technologies for smallholder dairying: Case studies of participatory evaluation
of species and methods of establishment in western Kenya. National Agricultural Research
Centre (NARC) Kitale Annual report, Kenya.
Orodho, A.B., (1990). Dissemination of research technology on forages and agriculture by-
products in Kenya. In Utilization of research results on forage and agricultural by-product
materials as animal feed resources in Africa Proceedings of the First Joint Workshop of the
Pasture Network for Eastern and Southern Africa (PANESA) and the African Research
Network for Agriculture By-products (ARNAB). 5-9 December, 1988, Lilongwe, Malawi.

59
Orodho, A.B., (2006). Intensive forage production for smallholder dairying in East Africa;
Development opportunities perspectives by Reynolds & Frame Kitale, Kenya.
http://www.fao.org/ag/AGP/agpc/doc/Newpub/napier/eastafrica_orodho.htm.,22nd
, August
2009.
Rodriguez, (2000). Generalized linear models, Princeton University, US.
Roothaert, R., Nalukwago, G., and Nyende, P., (2005). Lessons learned from participatory
evaluation of improved forages with farmer groups in Tororo Uganda. In tropical grasses
and legumes: Optimizing genetic diversity for multipurpose use. IP-5 project annual report,
2005. Cali, Columbia: Centro Internacional de Agricultura Tropical-CIAT.
Schupp, A., Gillespie, J., and Reed, D., (1998). Consumer choice among alternative red meats.
Journal of Food Distribution Research, 29(3), 35-43.
Staal, S.J., Chege, L., Kinyanjui, M., Kimani, A., Lukuyu, B., Njubi, D., Owango, M., Tanner, J.,
Thorpe, W., and Wambugu, M., (1998). Characterization of dairy systems supplying the
Nairobi milk market: A pilot survey in Kiambu District for the identification of target
groups of producers. Smallholder Dairy (R&D) Project KARI, ILRI and Livestock
Production Department (Ministry of Agriculture).
Tiley, G.E.D., (1969). Elephant grass. Technical Communication Report, No. 23. Kawanda
Research Station, Kampala Uganda.
Van Wijk, A.J.P. (1974). Breeding of Napier grass. Maize and Pasture Annual Report, 1974.
Kenya Agricultural Research Station, Kitale.
Wandera, J.L. (1997). Forage research and production in western Kenya. Proceedings of a
workshop held at Kitale, Kenya, 26–28 September 1995. pp. 169–187. Nairobi, Kenya:
Kenya Agricultural Research Institute.
Wanyoike, F. G., (2004). Dissemination and adoption of improved fodder trees: The case of
Calliandra Calothyrsus in Embu district, Kenya. Msc. Thesis; University of Nairobi
Department of Agricultural Economics, Kenya.

60
CHAPTER SIX
GENERAL DISCUSSION AND CONCLUSIONS
6.1. Aim of the study
Livestock feed to support dairy sub-sector remains a challenge while low milk yields, high calf
mortality and long calving intervals experienced by many small-scale dairy enterprises are
predominantly due to insufficient good-quality feed (ASARECA, 2008). The recurrent scarcity
of grazing materials especially during the dry season and decreasing land size following high
population pressure has led to the recommendation of fodder grasses as the ideal forages for
Western Kenya. In addition, their high productivity and quality per unit area makes them
appropriate for small-scale farmers because they provide immediate feeding material for the
livestock especially in zero grazing systems. Surplus material can be conserved in form of hay or
silage for dry season feeding Muyekho et al., (2005). Most forage are multi-purpose plants.
Direct effects on crop production include weed suppression, pest and disease reduction (when
used in rotation), while indirect effects include their use as green manures, improved fallows,
cover crops and live barriers, (Delgado et al., 1999).
In Kenya, more than 0.3 million smallholder dairy producers (53%) rely on Napier grass as a
major source of feed. It has been observed that the demand for Napier grass is so high that
landless farmer‟s plant along the highway verges and free land to cut and sell to animal owners
(Nyanyu 1998). Despite being a very valuable and highly productive grass for livestock on
smallholder farms, Napier grass is also being promoted in the push-pull production system for
the control of maize stem borers. However, the cultivation and expansion of the fodder crop is
being threatened by various pests and diseases amongst them Napier grass stunt disease (NSD).
This disease represents a major menace to the smallholder sub-sector in the region. This study
was based on two specific objectives: (1) to determine the extent of Napier stunt disease
infestation in small-scale dairy farming in order to estimate its damage and (2) to assess farmers‟
perceptions on suitability of alternative fodder grasses in order to establish their preference for
dairy grasses.
61
6.2. Study methodology
One hundred and forty (140) respondents in the traditional Bungoma district were selected for
this study. Interest was restricted to small-holder dairy farmers practicing push-pull technology
and also those who were not practicing the technology but were facing the problem of Napier
stunt disease. In conjunction with descriptive statistics on several aspects of the extent of Napier
stunt disease in small-scale dairy farming, multinomial logit analysis were executed to assess
farmers‟ perceptions on the alternative grasses in order to establish their preference for dairy
farming. Frequencies, percentages, mean and cross tabulations were generated during analysis to
capture farmers‟ knowledge on factors that explain the extent of NSD infestation in order to
explain its damage. Descriptive statistics in form of frequencies and percentages were further
utilized to determine farmers‟ perceived ranking of fodder grasses in order of their preferences.
The relationship between farmers‟ perceptions on alternative fodder grasses and the explanatory
factors was done using MNL model whereby marginal effect estimates showed influence of a
group of variables on the choice of alternative grasses.
6.3. General Discussion of the Results
The study established the extent of Napier stunt disease infestation in small-scale dairy farming
by employing several aspects of analysis. From the results it was evident that livestock keeping
is a major source of livelihood in the region where majority of the farmers kept; cattle, sheep,
goats and poultry and their source of income is mainly from livestock keeping, crop sales, off-
farm casual work, and off-farm permanent employment among others. The results also showed
that, farmers in the region practiced mixed farming and both open and zero grazing are
predominant. This corroborates with Peeler and Omore, (1997) who noted that dairy farming
generates more regular household income and jobs than any other enterprise whereby resource
poor smallholder dairy farmers produce more than 80% of the marketed milk.
On the main source of fodder, results showed that majority of the farmers grew fodder grasses
which they used as the main source of feed for their dairy enterprises. Although some
acknowledged that they buy fodder for their livestock, greater part of the small-scale farmers
said that they obtained feed for their livestock from free grazing fields. The study also
established that, majority of the farmers (98.6%) used Napier grass as the main source of fodder
62
in addition to soil conservation, stem borer control through Push-pull technology, and incomes
from selling. This concurs with the research done by Staal et al., (1997), which indicated that
Napier and its hybrids is one of the major forages grown and adopted by small-scale farmers.
The NSD is a disease of economic importance on Napier grass in the region. Though most
farmers started noticing the emergence of the disease in the year 1998, it is thought that the
effects of the disease might have been felt before then. The NSD, causing short internodes, bushy
appearance, yellow to purple streaking and a low biomass Nielsen et al., (2007), has spread
among small-scale farmers in Kenya, causing economic loss in the smallholder dairy industry
and hence affecting the livelihoods of the rural poor. Most farmers recognized the NSD and
97.9% of the farmers interviewed had experienced the damage caused by this disease. For
example; they mentioned the effect on dairy enterprise as: reduction in milk production,
reduction of stock and increased cost of production.
As a NSD control mechanism, the findings obtained from the study suggest that farmers should
use clean plant materials by obtaining planting materials from a reputable source such as Kenya
Agricultural Research Institute (KARI), practice field sanitation by removing and burning the
affected plants as they are reservoirs of the phytoplasma, and put into practice field management.
They also need to use recommended cutting intervals and fertilize the plant well at planting and
manure during crop growth. This is consistent with Mulaa et al., (2004), who reported that as
recommendations for NSD, farmers should plant grass from healthy fields, check their grass
frequently and uproot diseased plants, replant with grass, and burn the sick plants or bury them
deeply. They also advised that farmers should plant grass at one meter by one meter for each
plant to have room to grow healthy, fertilize Napier grass with one 50 kilo bag of Triple Supper
Phosphates at planting and top-dress with 2 bags of Calcium Ammonia Nitrates per acre.
Given the vulnerability of the Napier grass to NSD, the respondents showed the willingness of
replacing Napier grass with other alternative fodder grasses. This is enough evidence that, there
is urgent need to look for alternative high yielding fodder grasses to Napier grass in order to keep
and maintain the dairy industry. Although Farrell (1998) reported that, two-smut resistant clones
of Napier grass; Kakamega 1 and Kakamega ΙΙ, have already been identified in Kenya by KARI,
and that French Cameroon was reported to be less severely affected than the more affected Bana.
63
Other fodder grass alternatives should be introduced to the farmers to enable them increase their
ability to manage risks associated with fluctuating feed supply and disease threat. This
corroborates with Jamnadass, (1999) who established that, a Napier grass cultivar resistant to one
disease may not necessarily be resistant to another disease even if it is of the same genus.
Since perception on alternative grasses clearly showed that farmers preferred; Natural grass,
signal grass, Giant seteria, Sudan grass and Molasses grass respectively in that order, it is also
important for the farmers to consider grass attributes which include cost of planting materials,
growth rate, dry season tolerance, grass biomass, economy on land, and disease resistance along
with farm, farmer and institutional characteristics that also significantly affect both the
probability and the intensity of having the fodder on the farm. The main prerequisite to obtain
efficient forages is however, to choose the appropriate species and cultivars, for which the
following basic aptitudes are requested: the adaptability to the local environmental conditions
mainly climate and soils; the capability to ensure high yields in palatable materials with
acceptable nutritive value; and the maximum efficiency in soil fertility improvement (Sebastien
et al., 2008).
6.4. Conclusions and Recommendations
This study has demonstrated that small-scale farmers have great experience and knowledge of
Napier stunt disease and alternative forage grasses that may meet their needs. From the findings
of farmers‟ perceptions, it is evident that, Napier stunt disease has lead to the reduction in milk
production, reduction of livestock, and an increased cost of production. Furthermore, some farm
and farmer characteristics, institutional characteristics, and grass attributes are important
determinants of farmers‟ perceptions on alternative grasses to Napier grass used in smallholder
dairy farming. It is therefore important that when screening alternative fodder grasses, emphasis
should be on focusing on farmers‟ desired fodder attributes. That is; farmers should be involved
in evaluation of fodder grasses to establish their suitability into farmers‟ farming systems.
Given that this study was based on assessing farmers‟ perceptions on alternative fodder grasses
to Napier grass this study recommends that alternative fodder grasses should be tested on farms
to assess their productivity in different agro-ecological zones and under farmer managed
regimes. They should also be assessed for their ability to resist or tolerate emerging diseases in

64
different agro-climatic conditions. Equally important, they should be assessed for their
integration with the novel push-pull technology given the technology‟s multiple functions
including provision of fodder. Such efforts will also call for further research to quantify the
effects of Napier stunt disease on milk production, livestock, and cost of production is
recommended.
A policy recommendation emanating from this study calls for relevant line ministries
(Agriculture and Livestock) to hasten research work on alternative fodder grasses to assess their
potential in enhancing smallholder dairy industry and mitigation of the serious threat by the NSD
to the sector. Also investments in farmer training and extension information should be promoted
by both the public and private sectors to enable farmers to access appropriate technologies and
management practices with potential to boost the smallholder industry.
65
REFERENCES
Association for Strengthening Agricultural Research in Eastern and Central Africa-ASARECA
(2008). Napier grass smut and stunt resistance, http://www.asareca.org. 11th
, October
2009.
Delgado C., Rosegrant M., Steinfeld H., Ehui S. and Courbois C. (1999). Livestock to 2020: The
next food revolution. Food, agriculture, and the environment. Discussion Paper 228.
IFPRI (International Food Policy Research Institute), FAO (Food and Agriculture
Organization of the United Nations), and ILRI (International Livestock Research
Institute). IFPRI (International Food Policy Research Institute), Washington, DC, USA.
72 pp.
Farrell, G., (1998). Resistance of Napier grass types to Ustilago kamerunensis. Proceedings of
the 2nd
workshop on smut disease of Napier grass, October 1998.
Jamnadass, R., (1999). PARD characterization of accession of Napier grass (Pennisetum
purpureum). A collaborative pilot research project ILRI/KARI/DFID. Nairobi, Kenya:
International Livestock Research Institute, Kenya.
Muyekho F.N., Lusweti F., Cheruiyot D.T., Kamau J.N., Gitahi F., Kungu J., and Kute C.,
(2005). Forage crops for western Kenya. Kenya Agricultural Research Institute (Kitale
Centre) Annual Report.
Mulaa M, Muyekho F, Nandasaba J, Nyakira B, and Kute C, (2004). Napier stunting disease.
Kenya Agricultural Research Institute (Kitale Centre) Annual Report.
Nielsen S.L., Ebong C., Kabirizi J., and Nicolaisen M., (2007). First report of a 16SrXI group
phytoplasma (Candidatus Phytoplasma Oryzae) associated with Napier grass stunt
disease in Uganda. http://www.bspp.org.uk/publications/new-disease-reports. 21st
August, 2009.
Nyanyu, G. (1998.) Results of PRAs on Napier grass head smut in Kiambu and Thika Districts.
Proceedings of the 2nd
workshop on smut disease of Napier grass, October 1998.
66
Peeler, E.J., and Omore, A.O., (1997). Manual of livestock production systems in Kenya. 2nd
Edition. Kenya Agricultural Research Institute, Nairobi.138pp.
Sebastien, A., Bindelle, J., Adandedjan, C., and Buldgen, A., (2008). Some suitable grasses and
legumes for ley pastures in Sudanian Africa: The case of the Borgou region in Benin.
Grass and Forage Science, 12(4), 405-419.
Staal S.J., Chege, L., Kinyanjui, M., Kimari, A., Lukuyu, B., Njumbi, D., et al. (1997).
Characterization of dairy systems supplying the Nairobi milk market. International
Livestock Research Institute, Nairobi.

67
APPENDIX 1: QUESTIONNAIRE
TITLE: ANALYSIS OF SMALL-SCALE DAIRY FARMERS’ PERCEPTIONS OF
ALTERNATIVE FODDER GRASSES CONTINGENT ON NAPIER STUNT DISEASE
IN BUNGOMA DISTRICT.
The purpose of this study is purely academic and above all, to contribute to the understanding of
farmers‟ perceptions of alternative fodder grasses in small-scale dairy farming given the
infestation by the Napier stunt disease. As a respondent you are kindly requested to participate in
answering this questionnaire and you are assured that any information shared will be strictly
confidential. The information generated will help small-scale farmers in deciding which grass
(es) among alternatives to plant given the threat by the Napier stunt disease and therefore make
economically viable decisions.
Section A: General Information
1. Date of interview _______________________________________________
2. Name of enumerator_____________________________________________
3. District _______________________________________________________
4. Division_______________________________________________________
5. Location_______________________________________________________
6. Sub location____________________________________________________
7. Village_______________________________________________________
Section B. Farmer Characteristics
1. Name of the farmer/household head: _______________________________
2. Gender of the farmer: 1. Male [ ] 2. Female [ ]
3. Age of the farmer: ___________ (please enter date of birth, if known): [19 _ _]
4. Marital status (please tick one)
1. Married [ ] 2. Single [ ] 3. Widowed [ ] 4. Divorced[ ]
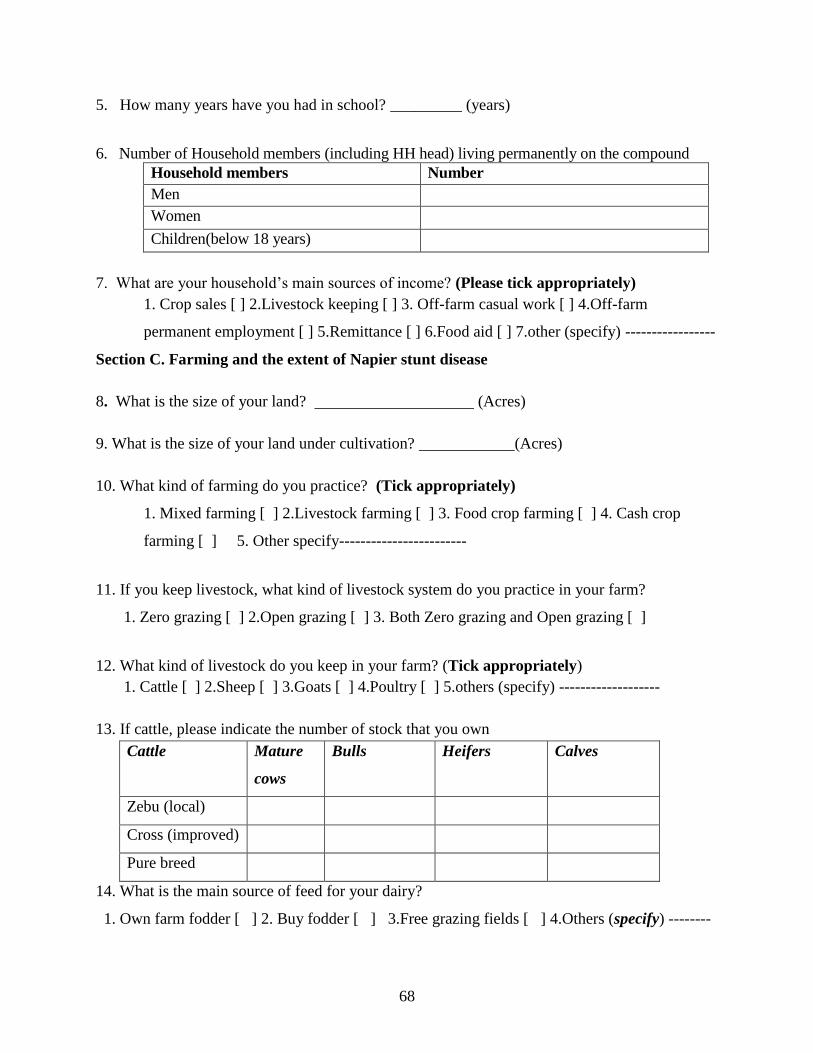
68
5. How many years have you had in school? _________ (years)
6. Number of Household members (including HH head) living permanently on the compound
Household members Number
Men
Women
Children(below 18 years)
7. What are your household‟s main sources of income? (Please tick appropriately)
1. Crop sales [ ] 2.Livestock keeping [ ] 3. Off-farm casual work [ ] 4.Off-farm
permanent employment [ ] 5.Remittance [ ] 6.Food aid [ ] 7.other (specify) -----------------
Section C. Farming and the extent of Napier stunt disease
8. What is the size of your land? (Acres)
9. What is the size of your land under cultivation? (Acres)
10. What kind of farming do you practice? (Tick appropriately)
1. Mixed farming [ ] 2.Livestock farming [ ] 3. Food crop farming [ ] 4. Cash crop
farming [ ] 5. Other specify------------------------
11. If you keep livestock, what kind of livestock system do you practice in your farm?
1. Zero grazing [ ] 2.Open grazing [ ] 3. Both Zero grazing and Open grazing [ ]
12. What kind of livestock do you keep in your farm? (Tick appropriately)
1. Cattle [ ] 2.Sheep [ ] 3.Goats [ ] 4.Poultry [ ] 5.others (specify) -------------------
13. If cattle, please indicate the number of stock that you own
Cattle Mature
cows
Bulls Heifers Calves
Zebu (local)
Cross (improved)
Pure breed
14. What is the main source of feed for your dairy?
1. Own farm fodder [ ] 2. Buy fodder [ ] 3.Free grazing fields [ ] 4.Others (specify) --------
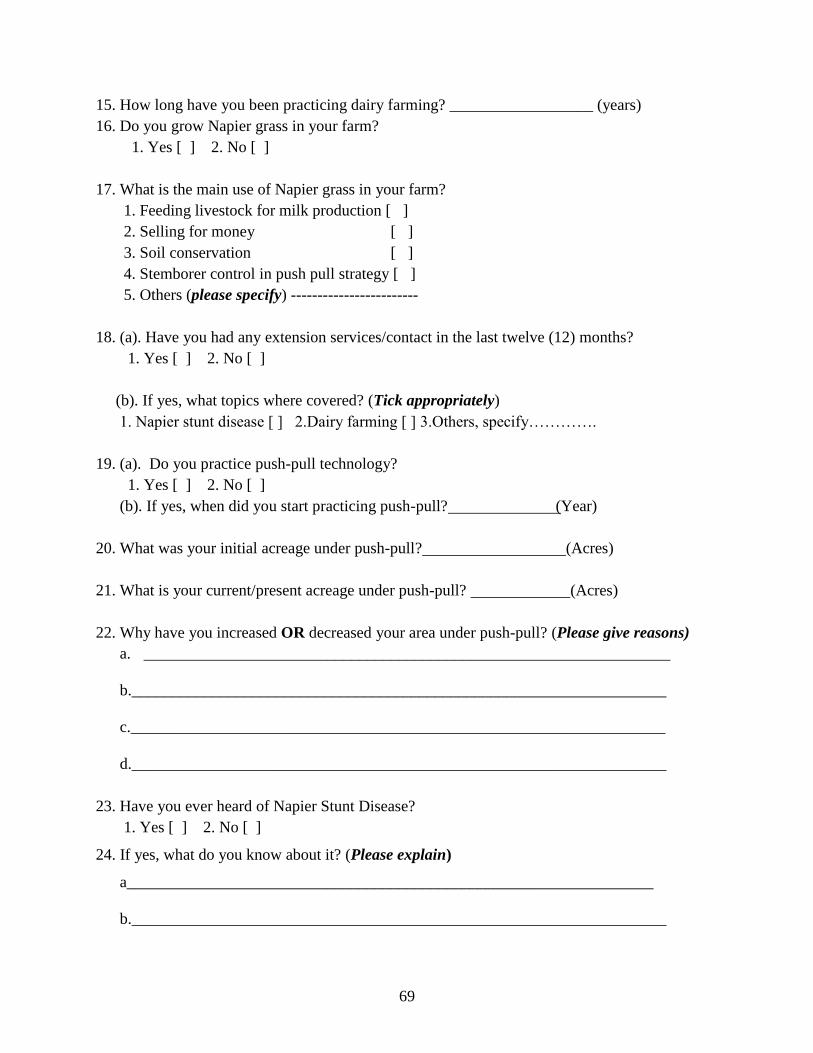
69
15. How long have you been practicing dairy farming? __________________ (years)
16. Do you grow Napier grass in your farm?
1. Yes [ ] 2. No [ ]
17. What is the main use of Napier grass in your farm?
1. Feeding livestock for milk production [ ]
2. Selling for money [ ]
3. Soil conservation [ ]
4. Stemborer control in push pull strategy [ ]
5. Others (please specify) ------------------------
18. (a). Have you had any extension services/contact in the last twelve (12) months?
1. Yes [ ] 2. No [ ]
(b). If yes, what topics where covered? (Tick appropriately)
1. Napier stunt disease [ ] 2.Dairy farming [ ] 3.Others, specify………….
19. (a). Do you practice push-pull technology?
1. Yes [ ] 2. No [ ]
(b). If yes, when did you start practicing push-pull? (Year)
20. What was your initial acreage under push-pull? (Acres)
21. What is your current/present acreage under push-pull? (Acres)
22. Why have you increased OR decreased your area under push-pull? (Please give reasons)
a. __________________________________________________________________
b.___________________________________________________________________
c.___________________________________________________________________
d.___________________________________________________________________
23. Have you ever heard of Napier Stunt Disease?
1. Yes [ ] 2. No [ ]
24. If yes, what do you know about it? (Please explain)
a__________________________________________________________________
b.___________________________________________________________________

70
c.___________________________________________________________________
d.___________________________________________________________________
e.___________________________________________________________________
25. Has Napier stunt disease affected your Napier grass plantation?
1. Yes [ ] 2. No [ ]
26. If yes, when did you first notice/observe the disease in your field? ___________ (years).
27. What size of land has been affected? (Acres)
28. What measures have you taken to counter the effect of the Napier stunt disease? (Please give
reasons) a.__________________________________________________________________
b.___________________________________________________________________
c.___________________________________________________________________
d.___________________________________________________________________
29. How has the Napier stunt disease affected your dairy farming enterprise? (Tick
appropriately)
1. Reduction in milk production [ ] 2. Reduced stock [ ] 3. Increased cost of production [ ]
4. Others (please specify) ----------------------
30. Using a four point likert scale of no effect (1), little effect (2), moderate effect (3), and high
effect (4), how has the Napier stunt disease affected your farming enterprise?
1. No effect meaning no loss of fodder [ ]
2. Little effect - meaning loss of about ¼ of the Napier [ ]
3. Moderate effect – meaning about ½ to ¾ of the Napier [ ]
4. High effect - meaning over ¾ of the Napier [ ]
31. With the onset of Napier stunt disease; have you ever considered adopting alternative grasses
as fodder?
1. Yes [ ] 2.No [ ].

71
32. In order of preference and ranking would you please provide a list of the alternative grasses?
Grass type/Alternative Rank
Molasses grass
Sudan grass
Signal grass (Bracharia)
Giant seteria
Giant panicum
Natural grass
Others (please specify) ________________
33. On a scale below, with 3=high, 2=moderate and 1=low, how would you rate the following
grass attributes on your farm?
Grass alternative ONE
High Moderate low
(a) Cost of planting material 3[ ] 2[ ] 1[ ]
(b) Growth rate 3[ ] 2[ ] 1[ ]
(c) Dry season resistance 3[ ] 2[ ] 1[ ]
(d) Grass biomass 3[ ] 2[ ] 1[ ]
(e) Economy on land 3[ ] 2[ ] 1[ ]
(f) Disease resistance 3[ ] 2[ ] 1[ ]
Grass alternative TWO
High Moderate low
(a) Cost of planting material 3[ ] 2[ ] 1[ ]
(b) Growth rate 3[ ] 2[ ] 1[ ]
(c) Dry season resistance 3[ ] 2[ ] 1[ ]
(d) Grass biomass 3[ ] 2[ ] 1[ ]
(e) Economy on land 3[ ] 2[ ] 1[ ]
(f) Disease resistance 3[ ] 2[ ] 1[ ]
Grass alternative THREE
High Moderate low
(a) Cost of planting material 3[ ] 2[ ] 1[ ]
(b) Growth rate 3[ ] 2[ ] 1[ ]
(c) Dry season resistance 3[ ] 2[ ] 1[ ]
(d) Grass biomass 3[ ] 2[ ] 1[ ]
(e) Economy on land 3[ ] 2[ ] 1[ ]

72
(f) Disease resistance 3[ ] 2[ ] 1[ ]
Grass alternative FOUR
High Moderate low
(a) Cost of planting material 3[ ] 2[ ] 1[ ]
(b) Growth rate 3[ ] 2[ ] 1[ ]
(c) Dry season resistance 3[ ] 2[ ] 1[ ]
(d) Grass biomass 3[ ] 2[ ] 1[ ]
(e) Economy on land 3[ ] 2[ ] 1[ ]
(f) Disease resistance 3[ ] 2[ ] 1[ ]
Grass alternative FIVE
High Moderate low
(a) Cost of planting material 3[ ] 2[ ] 1[ ]
(b) Growth rate 3[ ] 2[ ] 1[ ]
(c) Dry season resistance 3[ ] 2[ ] 1[ ]
(d) Grass biomass 3[ ] 2[ ] 1[ ]
(e) Economy on land 3[ ] 2[ ] 1[ ]
(f) Disease resistance 3[ ] 2[ ] 1[ ]
Grass alternative SIX
High Moderate low
(a) Cost of planting material 3[ ] 2[ ] 1[ ]
(b) Growth rate 3[ ] 2[ ] 1[ ]
(c) Dry season resistance 3[ ] 2[ ] 1[ ]
(d) Grass biomass 3[ ] 2[ ] 1[ ]
(e) Economy on land 3[ ] 2[ ] 1[ ]
34. When did you start planting the alternative grasses?
Grass Year first planted
Alternative ONE
Alternative TWO
Alternative THREE
Alternative FOUR
Alternative FIVE
Alternative SIX
Thank you for taking your time to provide answers to this questionnaire.