Embed Size (px)
Citation preview

J. Mater. Environ. Sci. 7 (7) (2016) 2453-2467 Chaubey et al.
ISSN : 2028-2508
CODEN: JMESC
2453
Alstonia Scholaris bark as an environmentally benign corrosion inhibitor for
Aluminium alloy in sodium hydroxide solution
Namrata Chaubey
1, Vinod Kumar Singh
1, M. A. Quraishi*
2
1Department of Chemistry, Udai Pratap Autonomous College, Varanasi-221002, India
2Department of Chemistry, Indian Institute of Technology (Banaras Hindu University), Varanasi-221005, India.
Received 02 Feb 2015, Revised 21 Aug 2015, Accepted 22 Aug 2015
*Corresponding author: E-mail: [email protected] ; [email protected]
Ph.no. +91-9307025126; Fax: +91- 542- 2368428
Abstract
Inhibition effect of aqueous extract of Alstonia Scholaris bark (ASB) on the corrosion of aluminium alloy (AA) in 1M
NaOH was carried out using gravimetric, electrochemical impedance spectroscopy (EIS), Potentiodynamic polarization
(PDP) and linear polarization resistance (LPR) techniques. ASB showed maximum inhibition efficiency (η %) of 92.6%
at 2.0 g/L. The adsorption of inhibitor molecules on AA surface obeyed the Langmuir’s adsorption isotherm. Tafel
Polarization study showed mixed mode of corrosion inhibition of inhibitor. The effective protection of AA in inhibited
system was investigated using scanning electron microscopy (SEM) and atomic force microscopy (AFM).
Keywords: Aluminium; AFM; EIS; Polarization; Alkaline corrosion
1. Introduction
Aluminium and its alloys are extremely diverse materials due to their unusual combinations of properties.
These materials find their way into broad applications in the various industries such as automotive, aerospace,
construction and electrical power generation. Aluminium, with high energy density (8.1 kWhkg-1
) and an
electrode potential of 2.35 V vs. standard hydrogen electrode (SHE) in alkaline medium, has emerged as one of
the most promising anode materials in Al-air cells [1]. These cells often utilize aluminium alkaline solution
systems in which inherent dissolution of metal occurs. The battery performance is determined by the
electrochemical and corrosion properties of aluminum anodes [2]. However, aluminium is highly resistant to
most acidic and neutral solutions due to the formation of a protective oxide film on its surface. In oxidizing
environments the formation of film is very rapid and attack on the metal is negligible [3] but this protective film
destroys, when it is exposed to alkaline conditions and corrosion of aluminium occurs, yielding AlO2-
(aluminate) ions in the alkaline medium. In efforts to mitigate aluminium corrosion, the main tactic is to
separate the metal from corrosive environments. This can be achieved using corrosion inhibitors.
In literature, a number of organic compounds have been used as effective inhibitors for various metals in
corrosive media [4-9] but most of them are synthetic chemicals, expensive and toxic to the environment. In view
of this, it is necessary to develop a very cheap and environmentally safe research to diminish self-corrosion rate
of aluminium in alkaline medium. In order to achieve the goal, extracts of various parts of plants (leaves, stems,
barks, fruits etc) have been used as corrosion inhibitors [10-12] because they are incredibly rich source of
naturally synthesized organic compounds that can be extracted using simpler techniques with low cost. In
addition, Plant extracts are environmentally acceptable, readily available and renewable source for a wide range
of needed inhibitors. We therefore aim to investigate the corrosion inhibition study of aqueous extract of bark of
Alstonia Scholaris tree on AA in alkaline media.
J. Mater. Environ. Sci. 7 (7) (2016) 2453-2467 Chaubey et al.
ISSN : 2028-2508
CODEN: JMESC
2454
Alstonia Scholaris tree belongs to the family Apocynaceae, grows throughout the India, in deciduous and
evergreen forests and also in plains [13]. In present study, we are focused on the corrosion inhibition
performance of aqueous extract of ASB on AA in 1 M NaOH solution. The inhibiting study was conducted by
weight loss measurement, potentiodynamic polarization, linear polarization resistance and electrochemical
impedance spectroscopy.
2. Experimental
2.1 . Specimen and test solution
Aluminium alloy coupons were purchased from the market and analyzed it in department of Metallurgical
Engineering, IIT (BHU). The analysis of result showed that AA specimen having the composition (wt %) Si = 0.77,
Fe=0.93, Cu=0.02, Mn=0.11, Mg=0.01, Zn=0.01, Cr=0.05, Ti=0.02, V=0.01, Ga=0.01, Al= balance, was used in this study.
Stock solution of 1 M NaOH was prepared by dissolving 40 g of solid NaOH in double distilled water.
2.2 . Preparation of inhibitor solution
Barks of Alstonia Scholaris tree were collected from the campus of Banaras Hindu University, India. Barks were
dried in a laboratory oven at 45◦ C, and ground to powdered form. 1 g of the powder was added to 500 ml of 1M NaOH
solution in a round bottom flask and refluxed for 1h. Thereafter, the mixture was cooled and filtered. The precipitate was
dried and weighed to confirm the amount of soluble materials present in the solvent. The extract was concentrated by
solvent evaporation and maintained up to concentration of 2000 mg/L and used as stock solution. Bark extract test solutions
were prepared at concentrations of 0.5, 1.0, 1.5 and 2.0 g/L.
2.3. Inhibitor constituents
ASB contains naturally occurring compounds such as alkaloids flavonoids, and terpenoids [14-16]. The constituent
alkaloids include alstonidine, alstonine, chlorogenic acid, chlorogenine, ditain, echitamine, and echitenin, while the
triterpenoids include lupeol linoleate and lupeol [17-19]. But two water soluble major constituents obtained from ASB are
echitamine and loganin are reported. Because of the presence of heteroatoms, functional group and π-electrons, corrosion
inhibition by aqueous ASB extracts can be regarded as synergistic process.
Table 1: Molecular structure of major constituents present in ASB extract
Inhibitor Major constituents’ Molecular structure Ref.
ASB Loganine
[48]
Echitamine
2.4. Gravimetric measurement
AA with the dimension of 2.5 × 2.0 × 0.046 cm was used in the weight loss experiment in 1M NaOH solution
without and with the addition of different concentrations of bark extract. The AA coupons were abraded with silicon
carbide papers with grade of 600, 800 and 1000, degreased with acetone and dried at room temperature. After weighing,
J. Mater. Environ. Sci. 7 (7) (2016) 2453-2467 Chaubey et al.
ISSN : 2028-2508
CODEN: JMESC
2455
every coupon was placed in the stock solution of 1 M NaOH for 3 hour at 303 K. After the time period, the sample was
taken out from the weight loss chamber, washed with distilled water and cleaned with acetone, dried and weighed. The
same process was repeated at the temperature range from 313- 333 K.
The corrosion rate of aluminium and inhibition efficiency (ƞ %) were calculated using the following relation [20] :
R
K WC
A T D
(1)
Where K is constant (87.6 × 10⁴), T is the exposure time in hours (h), A is the area of a coupon in cm
2, W is the weight
loss (mg) and D is the density of AA in g/cm3
% 100o i
o
w w
w
(2)
Where, w0 and wi are the weight loss value in the absence and presence of inhibitor, respectively.
2.5 . Electrochemical experiment
The electrochemical measurement was carried out by using three electrode cell assembly connected to the Gamry
Potentiostat /Galvanostat (Model 300) at room temperature. AA with 1 cm2 area was used as a working electrode. A
platinum foil and a saturated calomel electrode (SCE) i.e. (Cl-| (4M) Hg2Cl 2 (s)| Hg (l) | Pt) were used as counter and
reference electrodes respectively. Echem Analyst version 5.0 software packages were used for analyzing the
electrochemical data. All the tests were performed after 15 minute immersion of AA in the absence and presence of
optimum concentration of inhibitors in1M NaOH solution. Before starting impedance experiments, the electrode were
allowed to corrode freely and its open circuit potential (OCP) was recorded as a function of time for 200 s to obtain steady
state OCP which corresponds to corrosion potential. Impedance measurements were carried out in the frequency range 100
kHz -0.01 Hz using AC signals of amplitude 10 mV peak to peak at open circuit potential.
Linear polarization resistance (LPR) measurements were performed in a potential range - 0.02 V to + 0.02 V vs. with
respect to OCP at a scan rate of 0.125 mV/s. Finally, potentiodynamic polarization curves were obtained by shifting the
electrode potential automatically from -250 upto + 250 mVSCE vs. OCP at a scan rate of 1 mV/s. the anodic and cathodic
curves of the linear Tafel plots was extrapolated to obtain corrosion current densities (Icorr).
2.6. Surface analysis
AA coupons of size 2 × 2.5 × 0.046 cm were immersed in 1 M NaOH in absence and presence of ASB for 3 h at 303
K. Thereafter, the metal specimens were taken out, washed with distilled water, degreased with acetone, dried at ambient
temperature, and mechanically cut into 1 cm2 sizes for SEM and AFM investigations.
The SEM of the AA surface was performed at an accelerating voltage of 5000 V and 5KX magnification using FEI
Quanta 200F microscope. The AFM was performed using NT-MDT multimode, Russia, controlled by solver scanning
probe microscope controller. The inhibited system contains optimum concentration (2.0 g/L) of ASB extract.
3. Result and discussion
3.1 . Gravimetric test
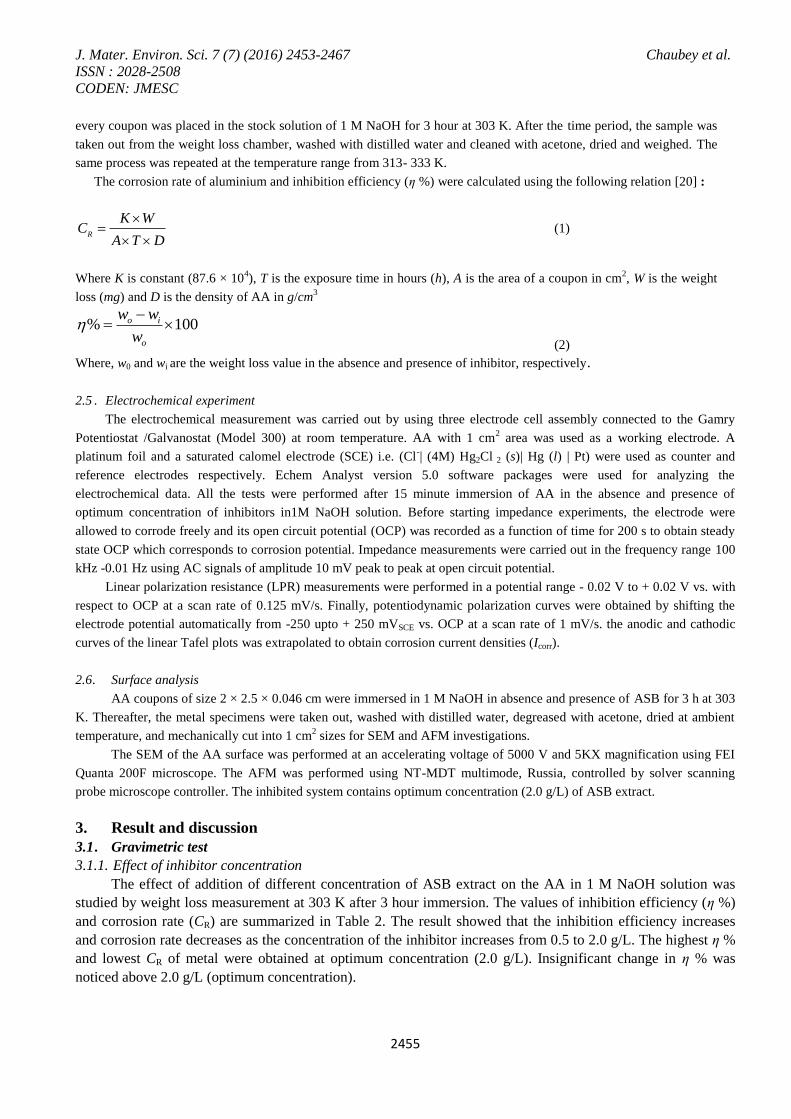
3.1.1. Effect of inhibitor concentration
The effect of addition of different concentration of ASB extract on the AA in 1 M NaOH solution was
studied by weight loss measurement at 303 K after 3 hour immersion. The values of inhibition efficiency (η %)
and corrosion rate (CR) are summarized in Table 2. The result showed that the inhibition efficiency increases
and corrosion rate decreases as the concentration of the inhibitor increases from 0.5 to 2.0 g/L. The highest η %
and lowest CR of metal were obtained at optimum concentration (2.0 g/L). Insignificant change in η % was
noticed above 2.0 g/L (optimum concentration).
J. Mater. Environ. Sci. 7 (7) (2016) 2453-2467 Chaubey et al.
ISSN : 2028-2508
CODEN: JMESC
2456
Table 2: Inhibition efficiency (η %) and corrosion rate (CR) values obtained from gravimetric
measurement for AA in 1M NaOH containing various concentrations of the inhibitor at 303K.
Inhibitors Cinh
(g/L)
CR
(mm/year) θ ƞ
(% )
Blank 0.0 351.0 - -
ASB 0.5 75.7 0.67 67.8
1.0 62.7 0.73 73.3
1.5 32.4 0.86 86.2
2.0 17.3 0.92 92.6
Figure 1: Effect of concentration on inhibition efficiency
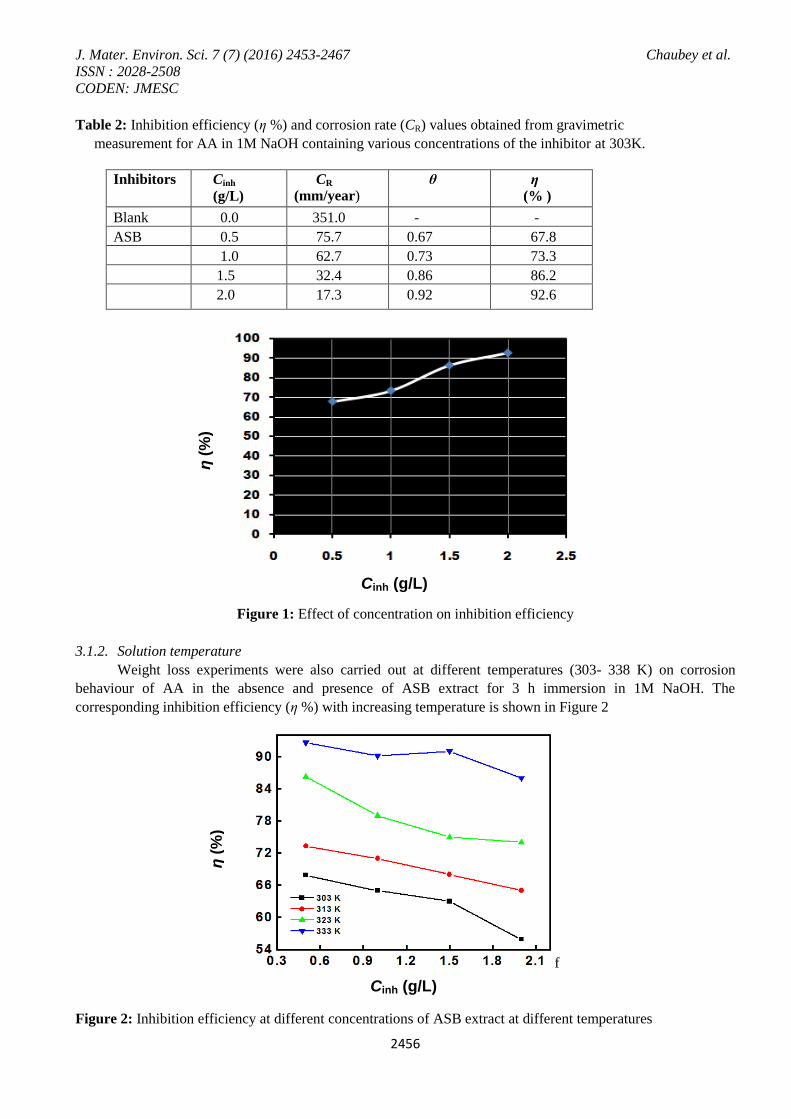
3.1.2. Solution temperature
Weight loss experiments were also carried out at different temperatures (303- 338 K) on corrosion
behaviour of AA in the absence and presence of ASB extract for 3 h immersion in 1M NaOH. The
corresponding inhibition efficiency (η %) with increasing temperature is shown in Figure 2
f
Figure 2: Inhibition efficiency at different concentrations of ASB extract at different temperatures
η (
%)
Cinh (g/L)
Cinh (g/L)
η (
%)

J. Mater. Environ. Sci. 7 (7) (2016) 2453-2467 Chaubey et al.
ISSN : 2028-2508
CODEN: JMESC
2457
As shown in Figure 2, corrosion rate (CR) increases and inhibition efficiency (ƞ %) decreases with rise in
temperature and this increase in corrosion rate may be due to an appreciable decrease in the adsorption of the
inhibitor molecules on the AA surface with increasing temperature.
With decrease in adsorption, more desorption of inhibitor molecules occur because these two opposite
processes are in equilibrium. Due to more desorption of inhibitor molecules at higher temperatures, the larger
surface area of AA are affected with alkali environment, resulting in increased corrosion rates and decreased η
% with increase in temperature. To calculate the apparent activation energy (Ea) for corrosion process Arrhenius
Eq. (3) was used:
log2.303
aR
EC
RT
(3)
where, Ea is the apparent activation energy of the corrosion process, R is the general gas constant, and A is the
Arrhenius pre-exponential factor.
Figure 3: Arrhenius plots for AA corrosion rates (CR) in 1M NaOH without and with optimum concentration of
ASB extract.
The Ea values were determined by linear regression between log CR and 1/T (Figure 3). The Ea value for
inhibited system is higher (55 kJmol-1
) than that of uninhibited system (33.6 kJmol-1
). The higher value of Ea
indicates that more energy barrier for the corrosion reaction in presence of the inhibitor is attained. Thus the
adsorbed inhibitor molecules prevent charge or mass transfer from the metal surface [21].
3.1.3. Adsorption isotherm
Basic information of the interaction of inhibitor molecules to the metal surface could be provided from
the adsorption isotherms. To determine the adsorption process, the surface coverage (θ) values corresponding to
various concentrations of inhibitors have been used to explain the correct isotherm [22].
The surface coverage values (θ) for different inhibitor concentration were tested by fitting to various
isotherms such as Freundlich, Temkin, Langmuir and Frumkin isotherms. Among these isotherms, Langmuir
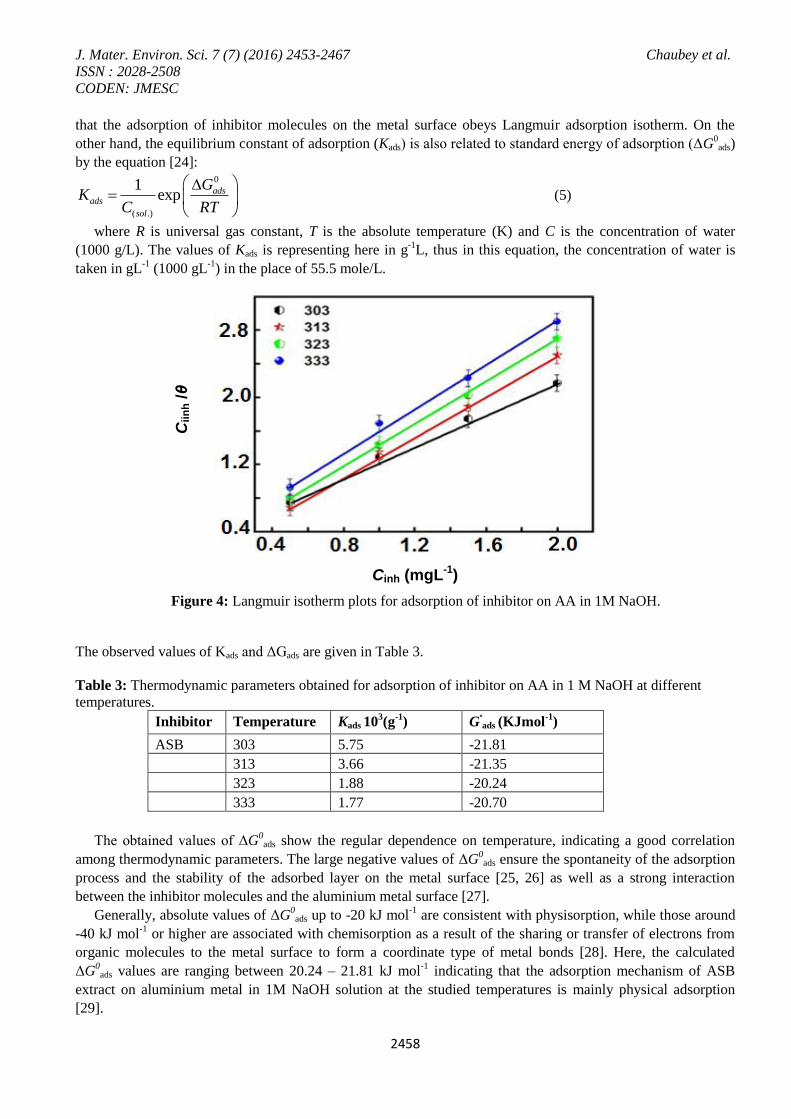
adsorption isotherm was best fitted (Figure 4) and can be given by following equation [23]:
inhinh
ads
1CC
K (4)
where Kads is the adsorption equilibrium constant, C denotes the concentration of the inhibitor and θ is
surface coverage value. The plot of log Cinh/θ vs. Cinh gave a straight line as shown in Figure 4, which indicates
log
CR
(m
my
-1)
1/T. 103 (K-1)
J. Mater. Environ. Sci. 7 (7) (2016) 2453-2467 Chaubey et al.
ISSN : 2028-2508
CODEN: JMESC
2458
that the adsorption of inhibitor molecules on the metal surface obeys Langmuir adsorption isotherm. On the
other hand, the equilibrium constant of adsorption (Kads) is also related to standard energy of adsorption (ΔG0ads)
by the equation [24]: 0
( .)
1exp ads
ads
sol
GK
C RT
(5)
where R is universal gas constant, T is the absolute temperature (K) and C is the concentration of water
(1000 g/L). The values of Kads is representing here in g-1
L, thus in this equation, the concentration of water is
taken in gL-1
(1000 gL-1
) in the place of 55.5 mole/L.
Figure 4: Langmuir isotherm plots for adsorption of inhibitor on AA in 1M NaOH.
The observed values of Kads and ΔGads are given in Table 3.
Table 3: Thermodynamic parameters obtained for adsorption of inhibitor on AA in 1 M NaOH at different
temperatures.
Inhibitor Temperature Kads 103(g
-1) G
ads (KJmol
-1)
ASB 303 5.75 -21.81
313 3.66 -21.35
323 1.88 -20.24
333 1.77 -20.70
The obtained values of ΔG0ads show the regular dependence on temperature, indicating a good correlation
among thermodynamic parameters. The large negative values of ΔG0
ads ensure the spontaneity of the adsorption
process and the stability of the adsorbed layer on the metal surface [25, 26] as well as a strong interaction
between the inhibitor molecules and the aluminium metal surface [27].
Generally, absolute values of ΔG0ads up to -20 kJ mol
-1 are consistent with physisorption, while those around
-40 kJ mol-1
or higher are associated with chemisorption as a result of the sharing or transfer of electrons from
organic molecules to the metal surface to form a coordinate type of metal bonds [28]. Here, the calculated
ΔG0ads values are ranging between 20.24 – 21.81 kJ mol
-1 indicating that the adsorption mechanism of ASB
extract on aluminium metal in 1M NaOH solution at the studied temperatures is mainly physical adsorption
[29].
Cinh (mgL-1)
Cii
nh /θ
J. Mater. Environ. Sci. 7 (7) (2016) 2453-2467 Chaubey et al.
ISSN : 2028-2508
CODEN: JMESC
2459
3.2 . Electrochemical measurement
3.2.1. Electrochemical impedance spectroscopy
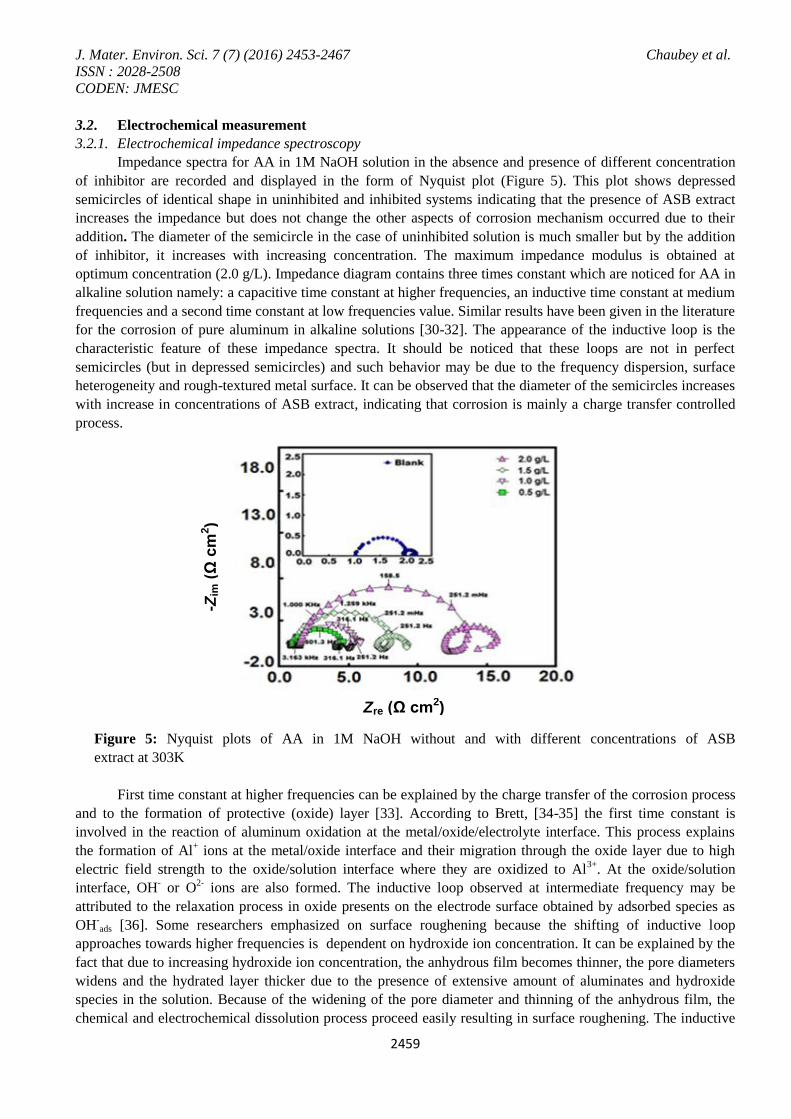
Impedance spectra for AA in 1M NaOH solution in the absence and presence of different concentration
of inhibitor are recorded and displayed in the form of Nyquist plot (Figure 5). This plot shows depressed
semicircles of identical shape in uninhibited and inhibited systems indicating that the presence of ASB extract
increases the impedance but does not change the other aspects of corrosion mechanism occurred due to their
addition. The diameter of the semicircle in the case of uninhibited solution is much smaller but by the addition
of inhibitor, it increases with increasing concentration. The maximum impedance modulus is obtained at
optimum concentration (2.0 g/L). Impedance diagram contains three times constant which are noticed for AA in
alkaline solution namely: a capacitive time constant at higher frequencies, an inductive time constant at medium
frequencies and a second time constant at low frequencies value. Similar results have been given in the literature
for the corrosion of pure aluminum in alkaline solutions [30-32]. The appearance of the inductive loop is the
characteristic feature of these impedance spectra. It should be noticed that these loops are not in perfect
semicircles (but in depressed semicircles) and such behavior may be due to the frequency dispersion, surface
heterogeneity and rough-textured metal surface. It can be observed that the diameter of the semicircles increases
with increase in concentrations of ASB extract, indicating that corrosion is mainly a charge transfer controlled
process.
Figure 5: Nyquist plots of AA in 1M NaOH without and with different concentrations of ASB
extract at 303K
First time constant at higher frequencies can be explained by the charge transfer of the corrosion process
and to the formation of protective (oxide) layer [33]. According to Brett, [34-35] the first time constant is
involved in the reaction of aluminum oxidation at the metal/oxide/electrolyte interface. This process explains
the formation of Al+ ions at the metal/oxide interface and their migration through the oxide layer due to high
electric field strength to the oxide/solution interface where they are oxidized to Al3+
. At the oxide/solution
interface, OH- or O
2- ions are also formed. The inductive loop observed at intermediate frequency may be
attributed to the relaxation process in oxide presents on the electrode surface obtained by adsorbed species as
OH-ads [36]. Some researchers emphasized on surface roughening because the shifting of inductive loop
approaches towards higher frequencies is dependent on hydroxide ion concentration. It can be explained by the
fact that due to increasing hydroxide ion concentration, the anhydrous film becomes thinner, the pore diameters
widens and the hydrated layer thicker due to the presence of extensive amount of aluminates and hydroxide
species in the solution. Because of the widening of the pore diameter and thinning of the anhydrous film, the
chemical and electrochemical dissolution process proceed easily resulting in surface roughening. The inductive
Zre (Ω cm2)
-Zim
(Ω
cm
2)

J. Mater. Environ. Sci. 7 (7) (2016) 2453-2467 Chaubey et al.
ISSN : 2028-2508
CODEN: JMESC
2460
loop shifts towards higher frequencies with increasing potential in the positive direction can be attributed to the
increasing movement rate of aluminum and hydroxide species and to the enlargement of pores resulting in
surface roughening [37]. Second capacitive loop at lower frequency values arise because of the metal
dissolution.
Figure 6: Simulated and experimentally generated EIS plots (a) Nyquist plot (b) Bode phase angle (c)
Electrical equivalent circuit used for the analysis of impedance spectra
(a)
(b)
(c)
f (Hz)
lo
g |
Z|
(Ωcm
2)
Zre (Ω cm2)
-Zim
(Ω
cm
2)

J. Mater. Environ. Sci. 7 (7) (2016) 2453-2467 Chaubey et al.
ISSN : 2028-2508
CODEN: JMESC
2461
Table 4: Electrochemical impedance parameters for AA in 1 M NaOH in the absence and presence of
different concentrations of inhibitor.
Inhibitor
(g/L)
Rs
(Ω)
Q1
(SΩ-1
cm2)
n1 (Rct)1
(Ωcm2)
L
(Hcm2)
RL
(Ωc2)
Q2
(SΩ-1
cm2)
n2 (Rct)2
(Ω cm2)
Cdl
(µF cm-2
)
η (%)
Blank 1.023 500×10-6
0.975 0.849 0.221 0.121 39.8×10⁻⁶
0.521 0.188 413.08 --
0.5 0.741 63.18×10⁻⁶
0.886 2.745 0.154 1.143 38.8×10⁻⁶
0.780 0.200 122.3 71.4
1.0 0.824 43.65×10⁻⁶
0.924 6.985 0.184 0.281 37.4×10⁻⁶
0.703 1.229 102.31 87.6
1.5 0.915 54.78×10⁻⁶
0.982 7.469 0.114 1.770 33.2×10⁻⁶
0.757 0.886 78.51 87.9
2.0 1.020 65.64×10⁻⁶
0.989 13.83 0.078 3.078 19.5e×10-6
0. 881 0.638 41.79 93.05
All the impedance parameters were calculated (Table. 4) by the use of the equivalent circuit model as shown in
Figure 6c. The circuit contains Rs (the resistance of solution between working electrode and counter electrode),
Cdl in parallel to the Rct, and Rct in series with the parallel inductive elements L and RL. In the Impedance spectra
the existence of L in the presence of ASB extract indicated that aluminium is still dissolved by the direct charge
transfer at the inhibitor adsorbed electrode surface [38].
The explanation for the presence of double layer capacitance is in parallel with the impedance is due to the
charge transfer reaction. The constant phase element (CPE) is introduced in the circuit rather than a pure double
layer capacitance to fit the semicircle more accurately. The impedance for CPE (ZCPE) is expressed as:
11
( )CPE nZ jQ
(6)
Where, Q the proportionality constant comparable to capacitance, j is the imaginary unit and ω is the angular
frequency (ω = 2πf, f is the frequency at maximum in Hz), n is the phase shift which related to degree of surface
non-homogeneity. Depending on n, CPE can represent resistance (Y0 = R, n = 0), capacitance (Y0 = C, n = 1),
inductance (Y0 = L, n =−1) or Warburg impedance (n = 0.5, Y0 =W). Analysis of Table. 4 reveals the Rct
values in the presence of inhibitor are more than in uninhibited system. The maximum Rct values are found in
optimum concentration (2.0 g/L) of ASB extract and the increase in values for inhibited system attributed to the
decrease in the active surface necessary for the corrosion reaction. The inhibition efficiency associated with
charge transfer resistance values is calculated by following equation: 1 1
( )
1
( )
% 100p inh p
p inh
R RIE
R
(7)
Where Rp-1
and Rp-1
(inh) are the polarization resistance values without and with inhibitor, respectively.
The value of double layer capacitance (Cdl) decreases with increasing inhibitor concentration. The double layer
between the electrolyte and charged metal surface is considered as an electrical capacitor. The adsorption of
ASB on aluminium surface decreases its electrical capacity because they displace water molecules and other
ions originally adsorbed on the surface. The decrease in capacitance of an inhibited system may be imputed to
the formation of a protective layer on the electrode surface [39]. The double layer capacitance (Cdl) values were
calculated using the following equation: 1
dl max( )nC Q (8)
where ωmax is the angular frequency at which imaginary element reaches a maximum. Moreover, Addition of
inhibitors increases the values of n that explains reduction of surface inhomogeneity due to the adsorption of
inhibitor molecules on the most active adsorption sites at the AA surface [40].

J. Mater. Environ. Sci. 7 (7) (2016) 2453-2467 Chaubey et al.
ISSN : 2028-2508
CODEN: JMESC
2462
Indeed, the lower n value for uninhibited solution (n = 0.975) describes an inhomogeneity in surface
occurring from surface metal roughening and/or surface of corrosion products. The values of n lies between
0.886 and 0.989 in the case of inhibited solutions.
Figure 7. Bode plots and phase angle plots of AA in 1M NaOH without and with different concentration of
inhibitor at 303 K
The Bode impedance modulus and phase angle plots recorded for AA electrode immersed in 1M NaOH in the
absence and presence of different concentrations of ASB at its OPC are given in Figure 7. The impedance plots
at higher frequency limit (100 kHz) correspond to the ohmic resistance of the films of corrosion product and the
solution between the working electrode and reference electrode.
At high frequency the values of log |Z| and phase angle falls to zero. This indicates the resistive behavior of
metal electrode which corresponds to solution resistance enclosed between the reference and working electrodes
[41]. In the intermediate frequency region, a linear relationship between log |Z| vs. log f with a slope near -1
and the phase angle approaching 800 has been observed. For an ideal capacitor, the value of S and α
should be -1
and -90 respectively. However, in this case, the maximum slope value reaches up to -0.81 and maximum phase
angle was 720. These deviations considered to be the deviation from the ideal capacitive behavior at
intermediate frequencies [42].
3.2.2. Potentiodynamic polarization study
The effect of ASB extract on the corrosion reactions was also determined by potentiodynamic
polarization techniques. After adding inhibitor, the changes observed in the polarization curves are usually used
as criteria to classify inhibitors as cathodic, anodic or mixed [43, 44]. Tafel polarization curves for aluminium
metal in 1 M NaOH at different concentrations of ASB are displayed in Figure 8. It can be observed from the
curves that the presence of inhibitor causes a prominent decrease in corrosion rate, i.e. shifts the anodic curves
to more positive potentials and cathodic curves to more negative potentials and to the lower values of corrosion
current densities. The linear section of cathodic and anodic Tafel plots is extrapolated to the corrosion potential
in order to get polarization parameters for corrosion of AA in 1M NaOH without and with additives. From the
figure, it is revealed that the addition of inhibitors shifts the cathodic and anodic branches toward lower
currents, probably as a consequence of the blocking effect of the adsorbed inhibitor molecules. The polarization
parameters such as corrosion potential (Ecorr), anodic and cathodic Tafel slopes (βa and βc), corrosion current
density (Icorr), polarization resistance (Rp) and inhibition efficiency (η %) values are shown in Table 5.
The η % using values of Icorr and Rp were calculated by following equation:
log f (Hz)
lo
g |
Z|
(Ωcm
2)
J. Mater. Environ. Sci. 7 (7) (2016) 2453-2467 Chaubey et al.
ISSN : 2028-2508
CODEN: JMESC
2463
0
0% 100corr corr
corr
I I
I
(9)
where I 0
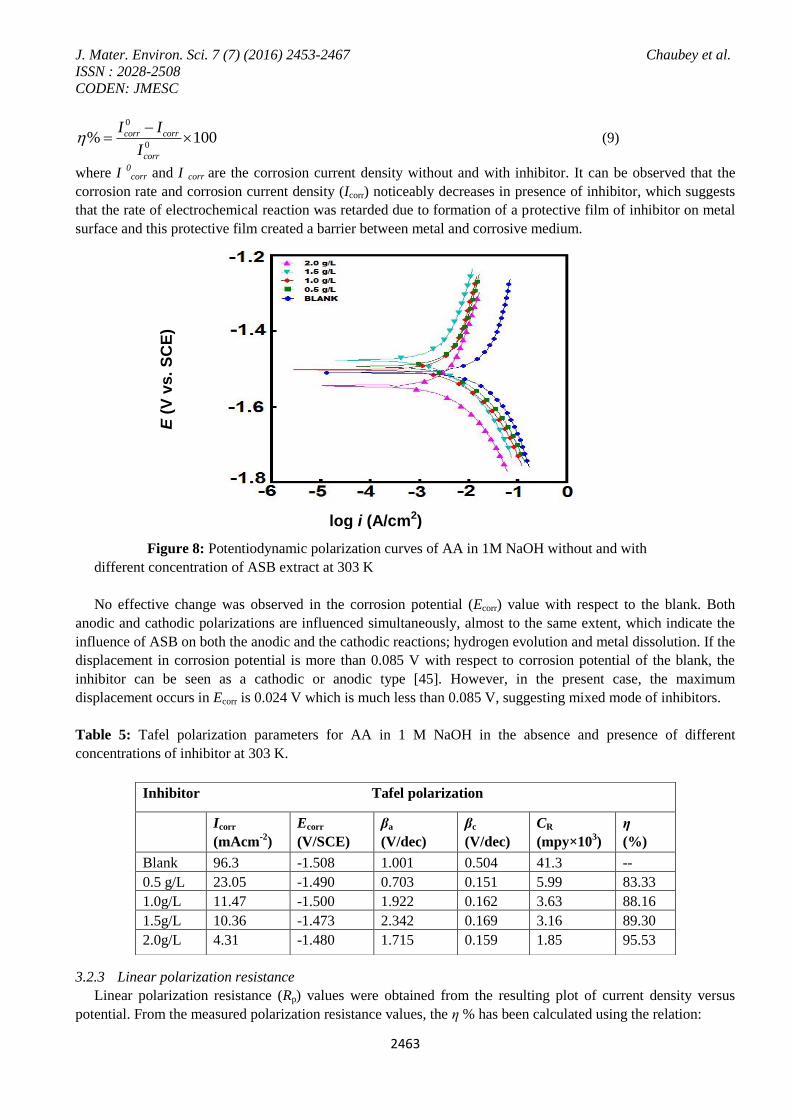
corr and I corr are the corrosion current density without and with inhibitor. It can be observed that the
corrosion rate and corrosion current density (Icorr) noticeably decreases in presence of inhibitor, which suggests
that the rate of electrochemical reaction was retarded due to formation of a protective film of inhibitor on metal
surface and this protective film created a barrier between metal and corrosive medium.
Figure 8: Potentiodynamic polarization curves of AA in 1M NaOH without and with
different concentration of ASB extract at 303 K
No effective change was observed in the corrosion potential (Ecorr) value with respect to the blank. Both
anodic and cathodic polarizations are influenced simultaneously, almost to the same extent, which indicate the
influence of ASB on both the anodic and the cathodic reactions; hydrogen evolution and metal dissolution. If the
displacement in corrosion potential is more than 0.085 V with respect to corrosion potential of the blank, the
inhibitor can be seen as a cathodic or anodic type [45]. However, in the present case, the maximum
displacement occurs in Ecorr is 0.024 V which is much less than 0.085 V, suggesting mixed mode of inhibitors.
Table 5: Tafel polarization parameters for AA in 1 M NaOH in the absence and presence of different
concentrations of inhibitor at 303 K.
3.2.3 Linear polarization resistance
Linear polarization resistance (Rp) values were obtained from the resulting plot of current density versus
potential. From the measured polarization resistance values, the η % has been calculated using the relation:
Inhibitor Tafel polarization
Icorr
(mAcm-2
)
Ecorr
(V/SCE)
βa
(V/dec)
βc
(V/dec)
CR
(mpy×103)
η
(%)
Blank 96.3 -1.508 1.001 0.504 41.3 --
0.5 g/L 23.05 -1.490 0.703 0.151 5.99 83.33
1.0g/L 11.47 -1.500 1.922 0.162 3.63 88.16
1.5g/L 10.36 -1.473 2.342 0.169 3.16 89.30
2.0g/L 4.31 -1.480 1.715 0.159 1.85 95.53
log i (A/cm2)
E (
V v
s.
SC
E)

J. Mater. Environ. Sci. 7 (7) (2016) 2453-2467 Chaubey et al.
ISSN : 2028-2508
CODEN: JMESC
2464
( )% 100
p inh p
p
R R
R
(10)
where Rp and Rp (inh) is polarization resistance in the absence and presence of inhibitors. The calculated values of
Rp in 1 M NaOH solution with the different concentration of extracts are shown in Table 6. The linear
polarization resistance value (RP) is higher in the inhibited system as compared to the blank that means lowering
of corrosion rate occur due to presence of ASB. The maximum value is observed at the optimum concentration
(2.0 g/L) of ASB, suggesting the formation of its adherent protective film on aluminium surface.
Table 6: Linear polarization parameters for AA in 1 M NaOH in the absence and presence of different
concentrations of inhibitor at 303 K.
Linear polarization
Rp
(Ωcm-2
)
η
(%)
1.279 --
4.50 76.04
8.68 86.04
9.34 87.04
13.57 92.30
3.3. Surface morphology study
3.3.1. Scanning Electron Microscope:
The SEM images of aluminium in the absence and presence of 2.0 g/L inhibitor in 1 M NaOH are
displayed in Figure 9 a-b.
Figure 9a shows the roughness of metal surface on which pits and scratches was observed due to strong
damaged by the attack of NaOH. After adding 2.0 g/L of ASB extracts, the smoothness of the aluminium
surface (Figure 9b) results. The close observation of this micrograph proved that there is less damage of AA
surface occurs, which is achieved due to adsorption of inhibitor molecules.
Figure 9: SEM micrographs of (a) uninhibited and (b) inhibited AA sample at 2.0 gL
-1 of ASB in 1M NaOH
3.3.2. Atomic force Microscope
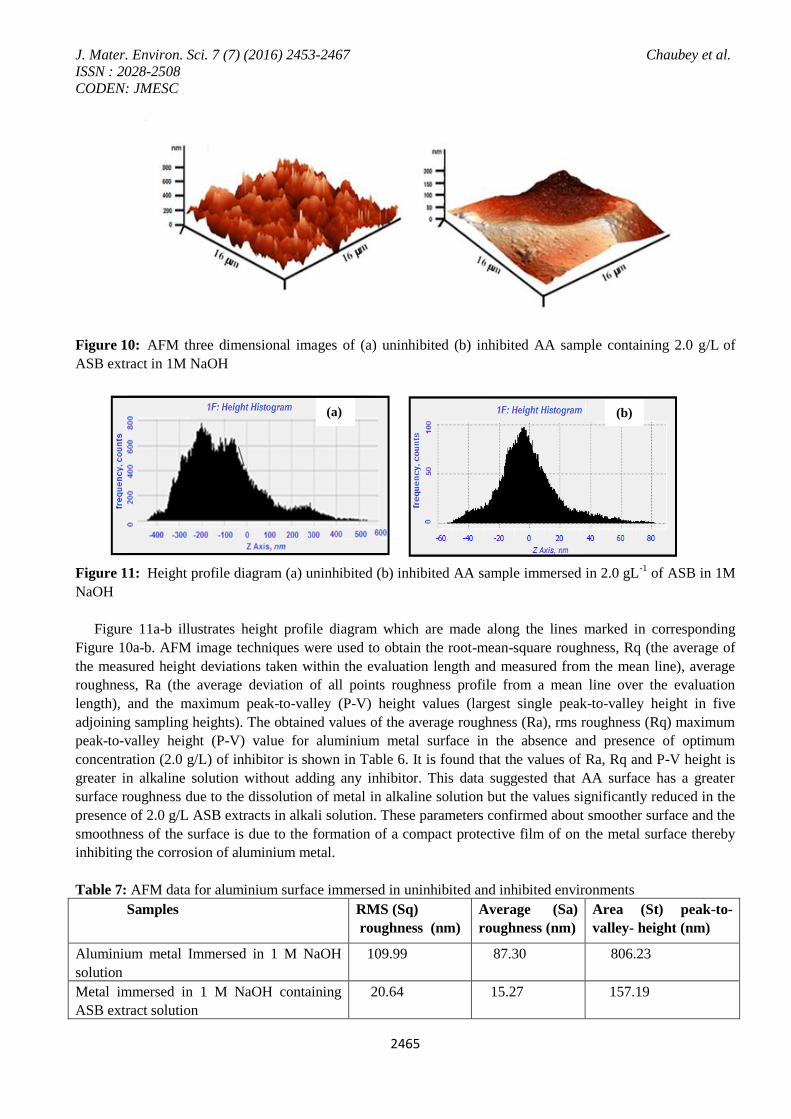
The three dimensional AFM images are displayed in Figure 10a-b. Figure 10a shows the image detected
in 1 M NaOH solution. As can be seen in figure, aluminium surface shows much more damages after exposing
it on 1M NaOH and the roughness of surface height is measured as 800 nm. Figure 10b displays the AFM image
of surface in inhibited system. The surface height is reduced from 800 nm to 200 nm after adding 2.0 g/L of
ASB extract indicated the formation of protective layer on it.
(a) (b)
J. Mater. Environ. Sci. 7 (7) (2016) 2453-2467 Chaubey et al.
ISSN : 2028-2508
CODEN: JMESC
2465
Figure 10: AFM three dimensional images of (a) uninhibited (b) inhibited AA sample containing 2.0 g/L
of
ASB extract in 1M NaOH
Figure 11: Height profile diagram (a) uninhibited (b) inhibited AA sample immersed in 2.0 gL
-1 of ASB in 1M
NaOH
Figure 11a-b illustrates height profile diagram which are made along the lines marked in corresponding
Figure 10a-b. AFM image techniques were used to obtain the root-mean-square roughness, Rq (the average of
the measured height deviations taken within the evaluation length and measured from the mean line), average
roughness, Ra (the average deviation of all points roughness profile from a mean line over the evaluation
length), and the maximum peak-to-valley (P-V) height values (largest single peak-to-valley height in five
adjoining sampling heights). The obtained values of the average roughness (Ra), rms roughness (Rq) maximum
peak-to-valley height (P-V) value for aluminium metal surface in the absence and presence of optimum
concentration (2.0 g/L) of inhibitor is shown in Table 6. It is found that the values of Ra, Rq and P-V height is
greater in alkaline solution without adding any inhibitor. This data suggested that AA surface has a greater
surface roughness due to the dissolution of metal in alkaline solution but the values significantly reduced in the
presence of 2.0 g/L ASB extracts in alkali solution. These parameters confirmed about smoother surface and the
smoothness of the surface is due to the formation of a compact protective film of on the metal surface thereby
inhibiting the corrosion of aluminium metal.
Table 7: AFM data for aluminium surface immersed in uninhibited and inhibited environments
Samples RMS (Sq)
roughness (nm)
Average (Sa)
roughness (nm)
Area (St) peak-to-
valley- height (nm)
Aluminium metal Immersed in 1 M NaOH
solution
109.99 87.30 806.23
Metal immersed in 1 M NaOH containing
ASB extract solution
20.64 15.27 157.19
(a) (b)
J. Mater. Environ. Sci. 7 (7) (2016) 2453-2467 Chaubey et al.
ISSN : 2028-2508
CODEN: JMESC
2466
3.4 Explanation for inhibition
The extract of ASB in this study contains various naturally occurring chemical compounds. The principal
chemical constituent of the aqueous extract of leaves are given in Table 1.
It is generally assumed that aluminium has great affinity for ambient oxygen for the formation of protective
oxide layer:
2Al (metal) + 3/2 O2 (gas) ↔ Al2O3 (solid)
The oxide film formed act as a static barrier that isolate the metal from the solution. However, alkaline
solutions may affect its properties. The dissolution of aluminium in alkaline solution is due to the following
reaction:
Al + 3H2O + OH‒ → 3/2 H2 + [Al (OH) 4]
‒
The soluble complex ion formed leads to the dissolution of the metal. The adsorption of inhibitor molecules
on metal surface is considered as a displacement reaction involving removal of H2O molecules from the metal
surface and adsorption of inhibitor molecules on metal surface [46] :
Inhibitor (sol) + nH2O (ads) ↔ Inhibitor (ads) + nH2O (sol)
The high inhibition efficiency shown by this extract is attributed to the presence of various organic
compounds containing heteroatoms, -OH groups and pi bonds in the ASB extract (Table 1). The inhibitors
adsorbed on the surface of aluminium and create a protective film on it. This restricts the diffusion of ions to or
from the metal surface and hence retards the overall corrosion process.
The interactions of the adsorbed inhibitor molecules with the metal surface may prevent the metal atoms
from participating in the anodic reaction of the corrosion. This simple blocking effect decreases the number of
metal atoms participating and hence decreases the corrosion rate. [47].
Conclusion
Based on the results of investigation, the following conclusions are drawn:
1. ASB is a good eco-friendly green inhibitor for the corrosion control of aluminium in 1 M NaOH solution.
2. Inhibition efficiency of ASB extract increases with increasing concentration and decreases with rise in
temperature.
4. The adsorption of inhibitor molecules on the surface of aluminium follows Langmuir adsorption isotherm.
5. Energy of activation value suggests that chemical present in ASB extract adsorbed chemically on the surface
of aluminium.
Acknowledgement-Authors are highly thankful to Prof. V. B. Singh, Head (Department of chemistry), B.H.U. for providing SEM
and AFM facilities for successful completion of my research work.
References
1. Wang L., Wan W., Yan G., Li D., Xua J., Wan H., Leun M. K. H., Li F., Int. J. Hydrogen Energy, 38 (2013)
14801.
2. Zhang J., Klasky M., Letellier B. C., J. Nucl. Mater. 384 (2009) 175.
3. Khaled K. F., Corros Sci. 52 (2010) 2905.
4. Quraishi M.A., Sardar R., Corrosion 58 (2002) 103.
5. Quraishi M.A., Sardar R., Corrosion 58 (2002) 748.
6. Eddib A., Hamdani M., Mor. J. Chem. 2 N°3 (2014) 165
7. Lebrini M., Lagrenee M., Vezin H., Gengembre L., Bentiss F., Corros. Sci. 47 (2005) 485.
8. Bentiss F., Bouanis M., Mernari B., Traisnel M., Vezin H., Lagrenee M., Appl. Surf. Sci. 253 (2007) 3696
9. Chikh Z. A., Chebabe D., Dharmraj A., Hajjaji N., Srhirri A., Montemor M.F., Ferreira M.G.S., Bastos A.
C., Corros. Sci. 47 (2005) 447.
10. El-Etre A. Y, Corros Sci. 40 (1998) 1845.
11. El-Etre A. Y, Corros Sci. 45 (2003) 2485.
12. El-Etre A. Y. Abdallah, M., El-Tantawy Z. E., Corros Sci. 47 (2005) 385.
13. Pratap B., Chakraborthy G.S., Mogha N., Int. J. Pharm. Tech. Research, 5 (2013) 17.
J. Mater. Environ. Sci. 7 (7) (2016) 2453-2467 Chaubey et al.
ISSN : 2028-2508
CODEN: JMESC
2467
14. Eddy N.O., Ebenso E.E., Afr. J. Pure Appl. Chem. 2 (2008) 46.
15. Salim A. A, Garson M. J., Craik D. J., J. Nat. Prod. 67 (2004) 1591.
16. Hui, T., Sun, Y., Zhu, L., Guo, W., Rao, G., Zhongguo Zhong Yao Za Zhi, 34 (2009) 1111.
17. Wang F., Ren F. C., Liu J. K., Phytochemistry, 70 (2009) 650.
18. Rastogi R. M., Mehrotra B. N., Central Drug Research Institute, Lucknow, India, 1990.
19. Rajic A., Kweifio-Okai G., Macrides T., Sandeman R. M., Chandler D. S., Polya, G. M., Planta Medica, 66
(2000) 206.
20. Chaubey N., Singh V. K., Savita Quraishi M. A., Ebenso E., E., Int. J. Electrochem. Sci., 10 (2015) 504.
21. Martinez S., Stern I., Appl. Surf. Sci. 199 (2002) 83.
22. Yadav, D. K., Quraishi, M. A., Ind. Eng. Chem. Res. 51 (2012) 8194.
23. Majidi L., Faska Z., Znini M., Kharchouf S., Bouyanzer A., Hammouti B., J. Mater. Environ. Sci. 1 (2010)
219.
24. Tourabi M., Nohair K., Nyassi A., Hammouti B., Chetouani A., Bentiss F., Mor. J. Chem. 1 (2013) 33.
25. Tang L., Li X., Li L., Mu G., Liu G., Mater. Chem. Phys, 97 (2006) 301.
26. Tebbji K., Faska, N., Tounsi, A., Ouddad, H., Benkaddour, M., Hammouti, B., Mater. Chem. Phys. 106
(2007) 260.
27. Mu G., Li X., Liu G., Corros Sci. 47 (2005) 1932.
28. Outirite M., Lagrenee M., Lebrini M., Traisnel M., Jama C., Vezin H., Bentiss F., Electrochim. Acta. 55
(2010) 1670.
29. Ansari K. R., Quraishi M. A., J. Ind. Eng.Chem. 20 (2014) 2819.
30. Shao H. B., Wang J. M., Zhang Z., Zhang J. Q., Cao C. N., Mater. Chem. Phys. 77 (2003) 305.
31. Abdel-Gaber A. M., Khamis E., Abo-ElDahab Sh., Adeel H., Mater. Chem. Phys. 109 (2008) 297.
32. Kumari P .D. R., Nayak J., Shetty A. N., Arab. J. Chem. (2012) http://dx.doi.org/10.1016/j.arabjc.2011.12.003.
33. Mansfeld F., Lin S., Kim S., Shih H., Corros. Sci. 27 (1987) 997.
34. Brett C. M. A., J. Appl. Electrochem., 20 (1990) 1000.
35. Brett C. M. A., Corros Sci. 33 (1992) 203.
36. Amin M. A., Abd EI-Rehim S. S., El-Sherbini E. E.F., Hazzazi O. A., Abbas M. N., Corros Sci.51 (2009)
658.
37. Emregu K. C., Aksut A. A., Corros Sci. 42 (2000) 2051.
38. Yadav D. K., Quraishi M. A., Ind. Eng. Chem. Res. 51 (2012)14966.
39. Khaled K. F., Amin M. A. Corros. Sci. 51 (2009) 1964.
40. Yadav D. K., Chauhan D. S., Ahamad I., Quraishi M. A., RSC Advances, 3 (2013) 632.
41. Ansari K. R., Quraishi M. A. Singh A., Corros Sci. 79 (2014) 5.
42. Ansari K. R., Sudheer, Singh A., Quraishi M. A., J. Dispersion Sci. Technol. DOI /10.1080/01932691.2014.938349.
43. Sangeetha M., Rajendran S., Sathiyabama J., Krishnaveni A., Shanthy P., Manimaran N., Shyamaladevi
B., Electrochim. Acta 29 (2011) 429.
44. Rosliza R., Senin H.B., Wan Nik W.B., Colloids Surf. 312 (2008) 185.
45. Ansari K. R., Yadav D. K., Ebenso E. E., Quraishi M.A., Int. J. Electrochem. Sci. 7 (2012) 4780.
46. Hamdi A., Taouti M. B., Benbertal D., J. Mater. Environ. Sci., (2015) 93.
47. Prabhu D., Rao P., J. Environ. Chem. Eng. 1 (2013) 676.
48. Lee S. J., Cho S. A., An S. S., Na Y. J., Park N. H., Kim H. S., Lee C. W., Kim H. K., Kim E. K., Jang Y.
P., Kim J. W., Evidence-Based Complementary and Alternative Medicine, 2012 (2012) 1.
(2016) ; http://www.jmaterenvironsci.com/