Embed Size (px)
Citation preview
21GEO-ECO-MARINA 13/2007 Coastal Zone Processes and Management. Environmental Legislation
IntroductIon
In modern times mankind influences all the natural sys-tems. Among these, very vulnerable systems such as del-tas were affected too. The present day Danube Delta status seems to be better than many other deltas state. However, the human activities have a negative influence for the Dan-ube Delta, especially in the last 100 years (dams built along the Danube River, jetties at Sulina mouth, dredging etc.) (Panin, 1996, 1999, 2001; Ungureanu et al., 2000; Stănică, 2003; Giosan et al., 1997).
To understand the circulation and quantify the volumes of sediments involved in the evolution of the coastal zone in front of the Danube Delta, it was first necessary to obtain a wave climate. The wave recordings on the Romanian littoral were made near Constanta and these are not very reliable for a variety of reasons. First, these were made by visual observa-tion. Second, the wave data are not recorded continuously (due to the insufficient visibility during the intervals with bad weather). Third, the measurements were made close to the shore where shoaling, refraction and diffraction influence the
Alongshore sediment trAnsport cApAcity computAtion on the coAstAl Zone of the
dAnube deltA using A simulAted wAve climAteSebaStian Dan(1,2), Marcel Stive(1) and andré van Der WeSthuySen(1)
(1)Delft University of Technology, Faculty of Civil Engineering and Geosciences, 2600 GA Delft, The Netherlands(2)National Institute of Marine Geology and Geoecology – GeoEcoMar, 23-25, Dimitrie Onciul St, RO-024053, sect. 2,
Bucharest, Romania; [email protected]
propagation onshore. Fourth, the observation point is locat-ed more than 100 km South of the area under study.
Taking into account these disadvantages, the decision to simulate a wave climate using the local wind data was made. Further, using the obtained wave climate, the alongshore sediment transport capacity was computed using two differ-ent sediment transport formulas.
GeoGraphIcal settInGs and present state of the studIed zoneThe Danube River is one of the main European water-
ways, flowing 2,857 km through the continent from Germany down to the Black Sea, having a catchment of 817,000 km2. Along the river and its tributaries many hydraulic works were built, which had an impact on the water and sediment dis-charge regime. The main works are the two dams called Iron Gates I and Iron Gates II. The average annual suspended sedi-ment discharge before the building of the Iron Gates dam was 67.5 millions t/year, out of which sandy alluvia accounted for nearly 10%. After 1970, following the building of the Iron Gates I dam (943 km upstream from the Black Sea) the sedi-
Abstract. The second largest river in Europe discharges into the Black Sea through the Danube Delta. This delta was, on average, accretive over the past 10,000 years; yet during the last century, its coastal zone has been subjected to intense erosion due to human interventions. The barrages regulating the discharges of the Danube River and the jetties at Sulina mouth have disrupted the natural discharge and coastal circulation of sediment. Since these interventions the deltaic coast has been wave-dominated so that the shoreline position is controlled by the Black Sea wave climate and the associated alongshore transport gradients. Based on regional wind data and a shallow water state-of-the-art wave model (SWAN) a representative wave climate along the depth contours of the Danube Delta coastal zone was determined. The wave climate served as prime input for the computation of the alongshore sediment transport capacity. Finally, the results were compared with previous works and direct observations.
Keywords: Danube Delta, wind analysis, wave climate, SWAN, longshore transport, CERC formula, Kamphuis formula
22 GEO-ECO-MARINA 13/2007 Coastal Zone Processes and Management. Environmental Legislation
S. Dan, M. Stive, A. van der Westhuysen – Alongshore Sediment Transport Capacity Computation on the Coastal Zone of the Danube Delta Using a Simulated Wave Climate
ment discharge decreased by approximately 10-20% (Panin, 1996). In 1983 Iron Gates II (864 km from the Black Sea) was built and this new intervention led to a significant decrease in the sediment discharge, 50 % less sediments than before the construction of the barrages. It is estimated that currently, the Danube total average sediment discharge does not ex-ceed 30-35 million t/yr, out of which 4-6 million t/yr consists of sandy material (Panin, 1996). As a result the beaches show strong erosion, up to 15-20 m/year in certain sections (Panin, 2001).
The Danube Delta is situated in the Northwestern part of the Black Sea, between 44°25’ and 45°30’ Northern latitude and between 28°45’ and 29°46’ Eastern longitude; it borders on the Bugeac Plateau in the North and on the Dobrogea Unit in the South.
The Danube River discharges into the Black Sea through three main arms (from North to South): Kilia, which transports approximately 51.6% of the water discharge; Sulina, the ma-jor waterway, provides 19.9% and Sfântu Gheorghe, 24.4%, the rest of the water being discharged through Razelm-Sinoe lagoon system (Bondar in Panin et al., 2001). The distribu-tion of the sediment discharge is slightly different: Kilia - ap-proximately 53.3%, Sulina – 15.8%, Sfântu Gheorghe – 21.9%, while the rest is being deposited in the Danube Delta (Bondar in Panin et al., 2001).
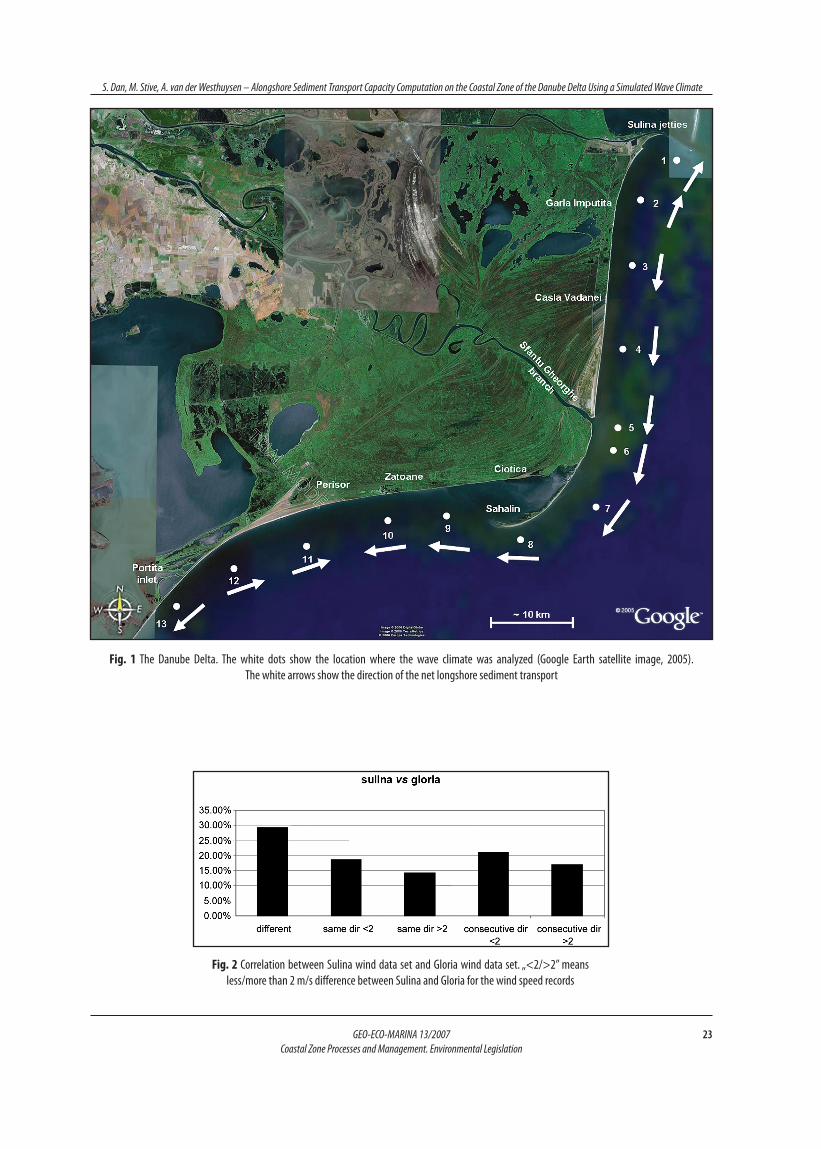
The Romanian deltaic coast extends from the border with Ukraine (North) to Cape Midia (South). The surface area covered by this study, part of the Danube Delta littoral zone, is confined by the Sulina jetties Northward and Portiţa inlet Southward ranging in depth from the shoreline up to 35 - 40 m (Fig. 1).
The Sulina - Sfântu Gheorghe section is characterized by a longshore current towards South and retreat of the shoreline. The coast close to Sulina (8 km long) is strongly influenced by the jetties. The jetties’ construction started in 1858 as part of a bigger project aiming to improve navigation on the Sulina branch. Today these extend 8 km into the sea (Panin, 1999; Stănică, 2003). These jetties are disrupting the Southward alongshore drift of sediments brought into the littoral zone by the Kilia distributary. The jetties are also responsible for a much more remote from the coastline discharge point of the sediment download of the Sulina distributary into the sea. Southward of the jetties a sheltered environment is formed (since the Northerly waves are predominant). Here, the present day status of the coastal zone is accretive.
Further, the longshore current is oriented towards South and the shoreline is strongly eroded with rates ranging from 5 to 20 m/yr. Only the Southern end of the section, situated in the vicinity of the Sfântu Gheorghe arm mouth is rela-tively stable (Panin, 1996, 1999, 2001; Ungureanu et al., 2000; Stănică, 2003).
Southward of the Sfântu Gheorghe mouth a spit island called Sahalin was formed. The island emerged in 1897, after
an exceptional flood and it has constantly stretched towards South-West to reach today over 17 km in length. Simultane-ously, processes like overwash lead to a migration towards land, sometimes with a rate of 70 m/year (Panin, 1996).
South-Westward from the Sahalin Island there is a sector about 20 km long where the coastline has been regressing, since 1950, more than 500 m. Further, towards South-West, the shoreline within the Perisor section is almost stable, with erosion/accretion of 5-10 m/year (Panin, 1996).
WInd data analysIsAvailable wind data were recorded from 1991 until 2000
in Sulina (Danube Delta) meteorological station; other avail-able records were made in 2002 over the same time span, both at Sulina and Gloria Oil Rig (offshore). Records were made four times per day: the speed (m/s) and the direction (nautical convention, 16 directions) of the wind. The values are recorded automatically and continuously. At Sulina the records are made at a height of 10 m above the mean sea level, while at Gloria Oil Rig they were made at a height of 36 m.
The Sulina meteorological station is situated at the shore-ward end of the Sulina jetties described above. Consequent-ly, the data measured there characterize a shoreline proxy. A first correction was needed for the Gloria data set in order to translate the speed of the wind to the standard elevation of 10 m above the mean sea level (U10 ≈ U36/1.2) (Shore Protec-tion Manual, 1984).
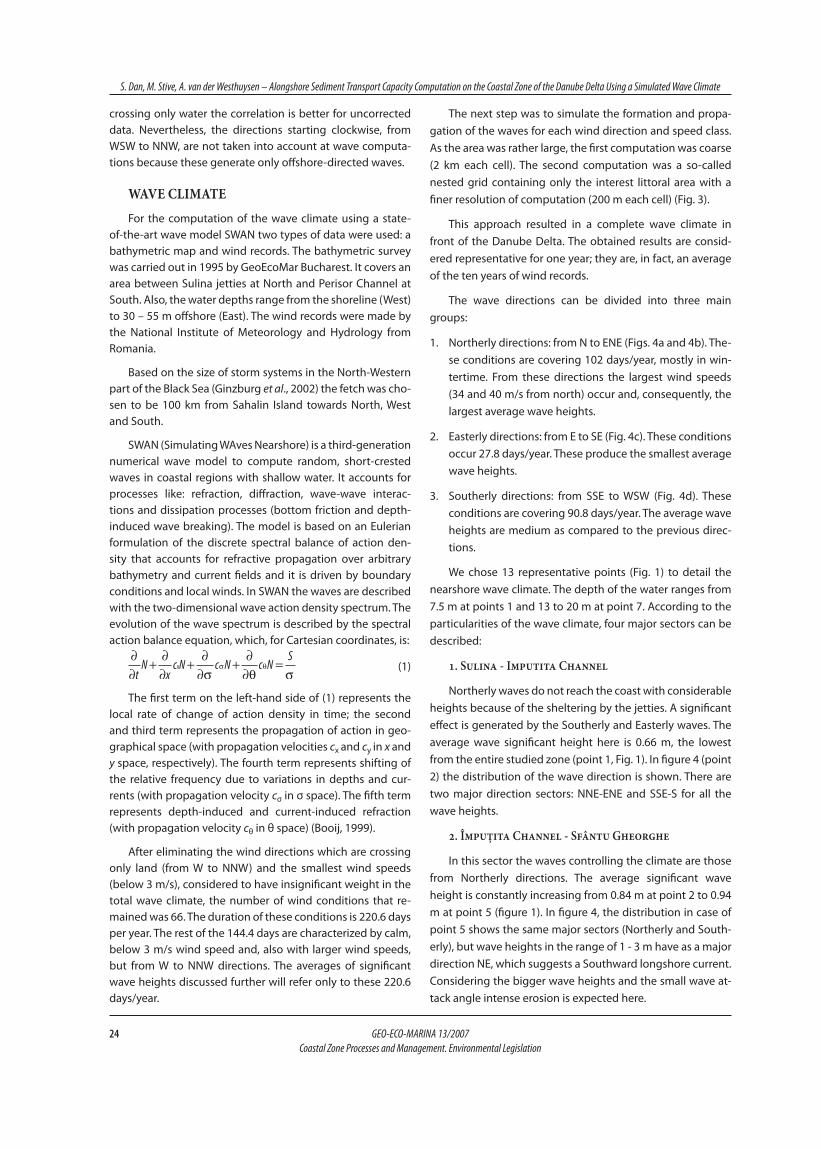
The question was whether the Sulina station could be considered representative for the offshore wind conditions. To answer this it was necessary to compare the Sulina 2002 data set with Gloria 2002 data set (situated offshore).
It turned out that almost 70% of the records were similar, which can be considered a good correlation (Fig. 2).
Categories from a total of 1454 pairs of data (Sulina - Gloria):same direction, less than 2 m/s difference: 18.50%;•same direction, more than 2 m/s difference: 14.24%;•consecutive directions, less than 2 m/s difference: •20.98%;consecutive directions, more than 2 m/s difference: •17.05%;different directions: 29.23%.•
The different directions were eliminated. With the re-mainder of the data the next step was to apply a land vicinity correction. An empirical method was used obtained from a study of winds in the Great Lakes area, USA, (Shore Protection Manual, 1984), resulting in a dimensionless coefficient of 1.2 to multiply the recorded wind speed.
Subsequently, the data were split into the 16 directions for each set. For the wind directions which are crossing land the corrected data (multiplied with dimensionless factor of 1.2) correlate better with those from Gloria. For the directions
23GEO-ECO-MARINA 13/2007 Coastal Zone Processes and Management. Environmental Legislation
S. Dan, M. Stive, A. van der Westhuysen – Alongshore Sediment Transport Capacity Computation on the Coastal Zone of the Danube Delta Using a Simulated Wave Climate
Fig. 1 The Danube Delta. The white dots show the location where the wave climate was analyzed (Google Earth satellite image, 2005). The white arrows show the direction of the net longshore sediment transport
Fig. 2 Correlation between Sulina wind data set and Gloria wind data set. „<2/>2” means less/more than 2 m/s difference between Sulina and Gloria for the wind speed records
24 GEO-ECO-MARINA 13/2007 Coastal Zone Processes and Management. Environmental Legislation
S. Dan, M. Stive, A. van der Westhuysen – Alongshore Sediment Transport Capacity Computation on the Coastal Zone of the Danube Delta Using a Simulated Wave Climate
crossing only water the correlation is better for uncorrected data. Nevertheless, the directions starting clockwise, from WSW to NNW, are not taken into account at wave computa-tions because these generate only offshore-directed waves.
Wave clImateFor the computation of the wave climate using a state-
of-the-art wave model SWAN two types of data were used: a bathymetric map and wind records. The bathymetric survey was carried out in 1995 by GeoEcoMar Bucharest. It covers an area between Sulina jetties at North and Perisor Channel at South. Also, the water depths range from the shoreline (West) to 30 – 55 m offshore (East). The wind records were made by the National Institute of Meteorology and Hydrology from Romania.
Based on the size of storm systems in the North-Western part of the Black Sea (Ginzburg et al., 2002) the fetch was cho-sen to be 100 km from Sahalin Island towards North, West and South.
SWAN (Simulating WAves Nearshore) is a third-generation numerical wave model to compute random, short-crested waves in coastal regions with shallow water. It accounts for processes like: refraction, diffraction, wave-wave interac-tions and dissipation processes (bottom friction and depth-induced wave breaking). The model is based on an Eulerian formulation of the discrete spectral balance of action den-sity that accounts for refractive propagation over arbitrary bathymetry and current fields and it is driven by boundary conditions and local winds. In SWAN the waves are described with the two-dimensional wave action density spectrum. The evolution of the wave spectrum is described by the spectral action balance equation, which, for Cartesian coordinates, is:
(1)
The first term on the left-hand side of (1) represents the local rate of change of action density in time; the second and third term represents the propagation of action in geo-graphical space (with propagation velocities cx and cy in x and y space, respectively). The fourth term represents shifting of the relative frequency due to variations in depths and cur-rents (with propagation velocity cσ in σ space). The fifth term represents depth-induced and current-induced refraction (with propagation velocity cθ in θ space) (Booij, 1999).
After eliminating the wind directions which are crossing only land (from W to NNW) and the smallest wind speeds (below 3 m/s), considered to have insignificant weight in the total wave climate, the number of wind conditions that re-mained was 66. The duration of these conditions is 220.6 days per year. The rest of the 144.4 days are characterized by calm, below 3 m/s wind speed and, also with larger wind speeds, but from W to NNW directions. The averages of significant wave heights discussed further will refer only to these 220.6 days/year.
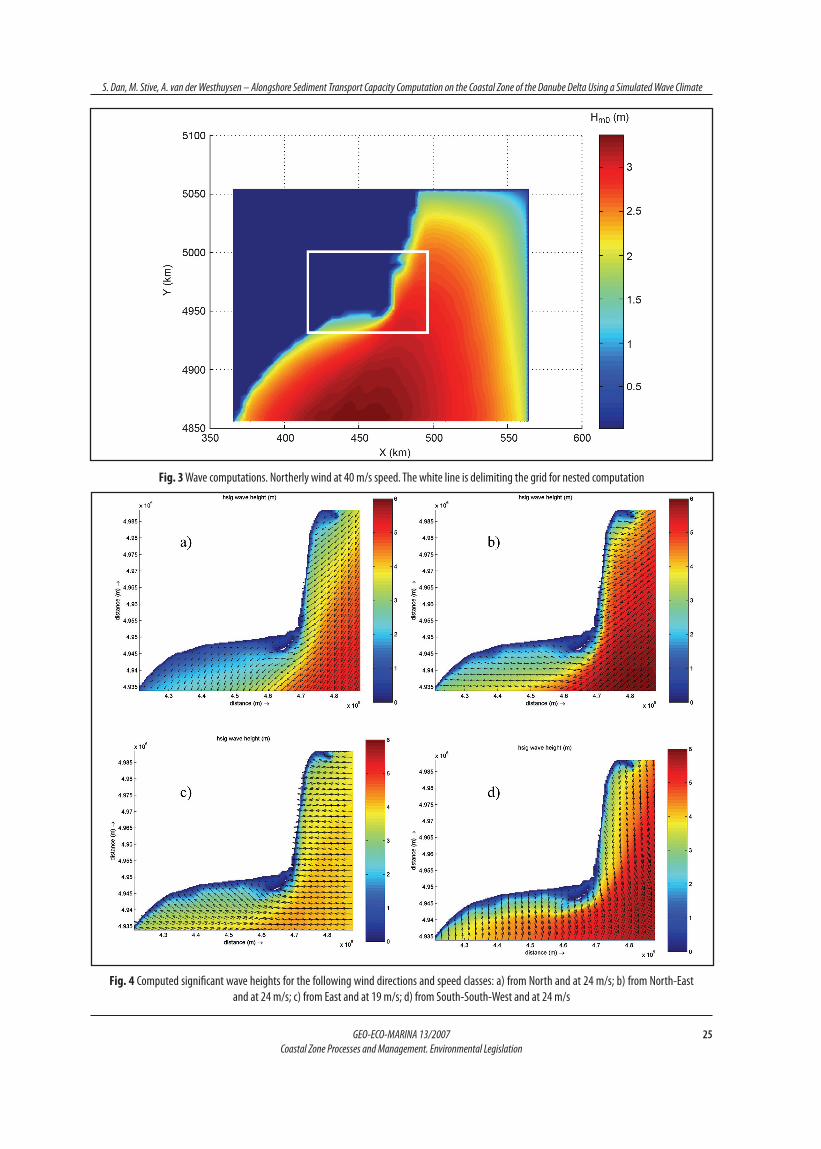
The next step was to simulate the formation and propa-gation of the waves for each wind direction and speed class. As the area was rather large, the first computation was coarse (2 km each cell). The second computation was a so-called nested grid containing only the interest littoral area with a finer resolution of computation (200 m each cell) (Fig. 3).
This approach resulted in a complete wave climate in front of the Danube Delta. The obtained results are consid-ered representative for one year; they are, in fact, an average of the ten years of wind records.
The wave directions can be divided into three main groups:
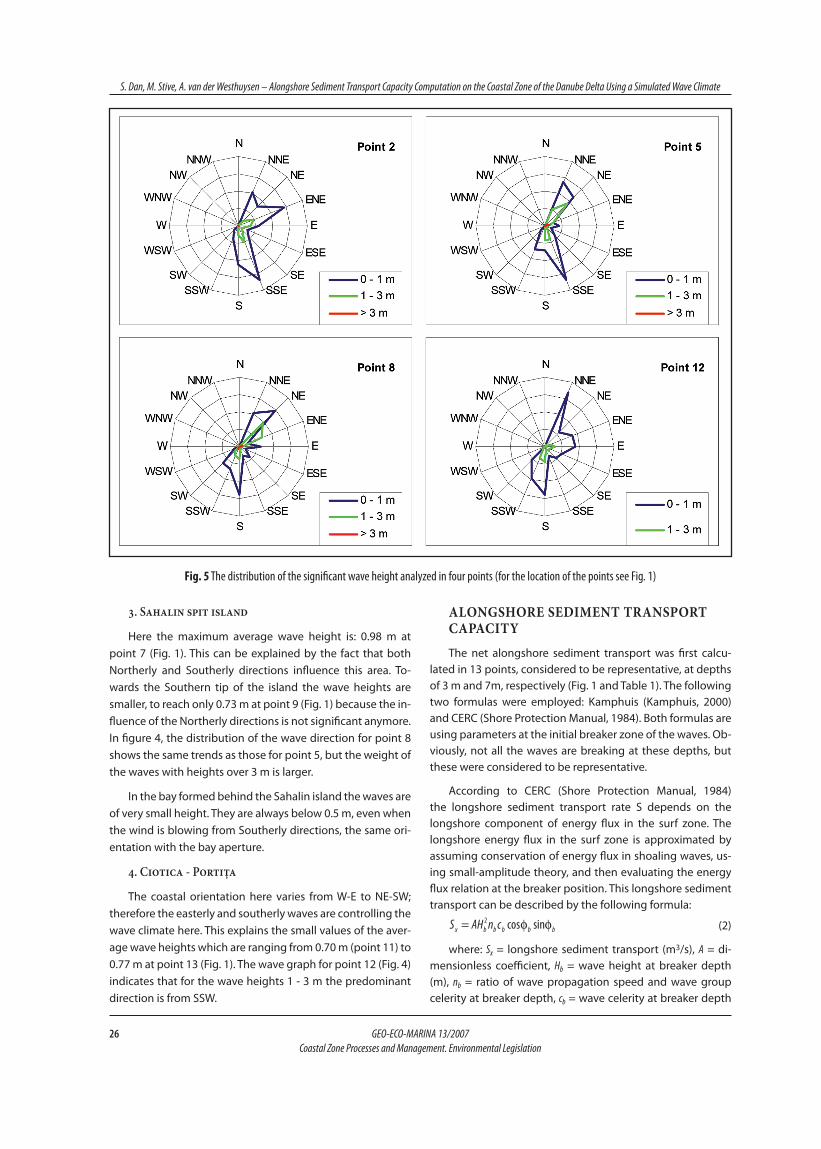
Northerly directions: from N to ENE (Figs. 4a and 4b). The-1. se conditions are covering 102 days/year, mostly in win-tertime. From these directions the largest wind speeds (34 and 40 m/s from north) occur and, consequently, the largest average wave heights.
Easterly directions: from E to SE (Fig. 4c). These conditions 2. occur 27.8 days/year. These produce the smallest average wave heights.
Southerly directions: from SSE to WSW (Fig. 4d). These 3. conditions are covering 90.8 days/year. The average wave heights are medium as compared to the previous direc-tions.
We chose 13 representative points (Fig. 1) to detail the nearshore wave climate. The depth of the water ranges from 7.5 m at points 1 and 13 to 20 m at point 7. According to the particularities of the wave climate, four major sectors can be described:
1. sulina - imputita channel
Northerly waves do not reach the coast with considerable heights because of the sheltering by the jetties. A significant effect is generated by the Southerly and Easterly waves. The average wave significant height here is 0.66 m, the lowest from the entire studied zone (point 1, Fig. 1). In figure 4 (point 2) the distribution of the wave direction is shown. There are two major direction sectors: NNE-ENE and SSE-S for all the wave heights.
2. Împuţita channel - sfântu gheorghe
In this sector the waves controlling the climate are those from Northerly directions. The average significant wave height is constantly increasing from 0.84 m at point 2 to 0.94 m at point 5 (figure 1). In figure 4, the distribution in case of point 5 shows the same major sectors (Northerly and South-erly), but wave heights in the range of 1 - 3 m have as a major direction NE, which suggests a Southward longshore current. Considering the bigger wave heights and the small wave at-tack angle intense erosion is expected here.
25GEO-ECO-MARINA 13/2007 Coastal Zone Processes and Management. Environmental Legislation
S. Dan, M. Stive, A. van der Westhuysen – Alongshore Sediment Transport Capacity Computation on the Coastal Zone of the Danube Delta Using a Simulated Wave Climate
Fig. 3 Wave computations. Northerly wind at 40 m/s speed. The white line is delimiting the grid for nested computation
Fig. 4 Computed significant wave heights for the following wind directions and speed classes: a) from North and at 24 m/s; b) from North-East and at 24 m/s; c) from East and at 19 m/s; d) from South-South-West and at 24 m/s
26 GEO-ECO-MARINA 13/2007 Coastal Zone Processes and Management. Environmental Legislation
S. Dan, M. Stive, A. van der Westhuysen – Alongshore Sediment Transport Capacity Computation on the Coastal Zone of the Danube Delta Using a Simulated Wave Climate
3. sahalin spit island
Here the maximum average wave height is: 0.98 m at point 7 (Fig. 1). This can be explained by the fact that both Northerly and Southerly directions influence this area. To-wards the Southern tip of the island the wave heights are smaller, to reach only 0.73 m at point 9 (Fig. 1) because the in-fluence of the Northerly directions is not significant anymore. In figure 4, the distribution of the wave direction for point 8 shows the same trends as those for point 5, but the weight of the waves with heights over 3 m is larger.
In the bay formed behind the Sahalin island the waves are of very small height. They are always below 0.5 m, even when the wind is blowing from Southerly directions, the same ori-entation with the bay aperture.
4. ciotica - portiţa
The coastal orientation here varies from W-E to NE-SW; therefore the easterly and southerly waves are controlling the wave climate here. This explains the small values of the aver-age wave heights which are ranging from 0.70 m (point 11) to 0.77 m at point 13 (Fig. 1). The wave graph for point 12 (Fig. 4) indicates that for the wave heights 1 - 3 m the predominant direction is from SSW.
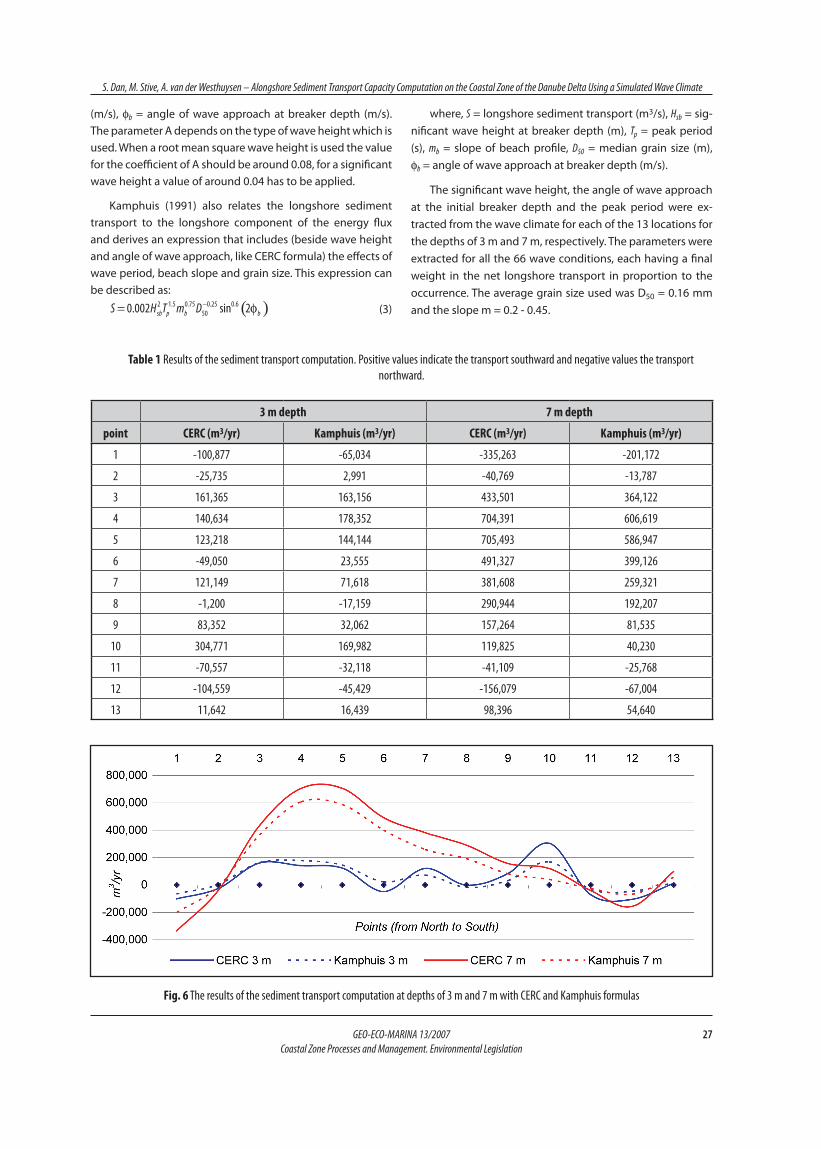
alonGshore sedIment transport capacIty
The net alongshore sediment transport was first calcu-lated in 13 points, considered to be representative, at depths of 3 m and 7m, respectively (Fig. 1 and Table 1). The following two formulas were employed: Kamphuis (Kamphuis, 2000) and CERC (Shore Protection Manual, 1984). Both formulas are using parameters at the initial breaker zone of the waves. Ob-viously, not all the waves are breaking at these depths, but these were considered to be representative.
According to CERC (Shore Protection Manual, 1984) the longshore sediment transport rate S depends on the longshore component of energy flux in the surf zone. The longshore energy flux in the surf zone is approximated by assuming conservation of energy flux in shoaling waves, us-ing small-amplitude theory, and then evaluating the energy flux relation at the breaker position. This longshore sediment transport can be described by the following formula:
(2)
where: Sx = longshore sediment transport (m3/s), A = di-mensionless coefficient, Hb = wave height at breaker depth (m), nb = ratio of wave propagation speed and wave group celerity at breaker depth, cb = wave celerity at breaker depth
Fig. 5 The distribution of the significant wave height analyzed in four points (for the location of the points see Fig. 1)
27GEO-ECO-MARINA 13/2007 Coastal Zone Processes and Management. Environmental Legislation
S. Dan, M. Stive, A. van der Westhuysen – Alongshore Sediment Transport Capacity Computation on the Coastal Zone of the Danube Delta Using a Simulated Wave Climate
(m/s), φb = angle of wave approach at breaker depth (m/s). The parameter A depends on the type of wave height which is used. When a root mean square wave height is used the value for the coefficient of A should be around 0.08, for a significant wave height a value of around 0.04 has to be applied.
Kamphuis (1991) also relates the longshore sediment transport to the longshore component of the energy flux and derives an expression that includes (beside wave height and angle of wave approach, like CERC formula) the effects of wave period, beach slope and grain size. This expression can be described as:
(3)
where, S = longshore sediment transport (m3/s), Hsb = sig-nificant wave height at breaker depth (m), Tp = peak period (s), mb = slope of beach profile, D50 = median grain size (m), φb = angle of wave approach at breaker depth (m/s).
The significant wave height, the angle of wave approach at the initial breaker depth and the peak period were ex-tracted from the wave climate for each of the 13 locations for the depths of 3 m and 7 m, respectively. The parameters were extracted for all the 66 wave conditions, each having a final weight in the net longshore transport in proportion to the occurrence. The average grain size used was D50 = 0.16 mm and the slope m = 0.2 - 0.45.
Fig. 6 The results of the sediment transport computation at depths of 3 m and 7 m with CERC and Kamphuis formulas
Table 1 Results of the sediment transport computation. Positive values indicate the transport southward and negative values the transport northward.
3 m depth 7 m depth
point CERC (m3/yr) Kamphuis (m3/yr) CERC (m3/yr) Kamphuis (m3/yr)
1 -100,877 -65,034 -335,263 -201,172
2 -25,735 2,991 -40,769 -13,787
3 161,365 163,156 433,501 364,122
4 140,634 178,352 704,391 606,619
5 123,218 144,144 705,493 586,947
6 -49,050 23,555 491,327 399,126
7 121,149 71,618 381,608 259,321
8 -1,200 -17,159 290,944 192,207
9 83,352 32,062 157,264 81,535
10 304,771 169,982 119,825 40,230
11 -70,557 -32,118 -41,109 -25,768
12 -104,559 -45,429 -156,079 -67,004
13 11,642 16,439 98,396 54,640
28 GEO-ECO-MARINA 13/2007 Coastal Zone Processes and Management. Environmental Legislation
S. Dan, M. Stive, A. van der Westhuysen – Alongshore Sediment Transport Capacity Computation on the Coastal Zone of the Danube Delta Using a Simulated Wave Climate
The general flow circulation in the Western part of the Black Sea is mainly counter clockwise and the alongshore current in front of the Danube Delta follows this direction: from North to South. This is due to the wind and wave regime because the predominant directions are from North to North-East. The computation of the alongshore sediment transport indicates that the local direction of the longshore transport in front of the Danube Delta is following the same trend. How-ever, there are some limited sections where the alongshore transport is towards North (points 1, 2, 11 and 12 in Fig. 1). In the case of point 1 the explanation is the presence of the long jetties. The direct observations (Panin, 1996; Stănică, 2003; Gi-osan et al., 1997) show that this sector, approximately 8 km long, is accreting.
The very small quantity of sediment transported at point 2 is interpreted to be very close to the so-called divergence point, the point where circulation of the sediments is divided into two branches: one to the South (the general circulation), the other to the North (the anticyclone circulation).
In the case of points 11 and 12 this can be explained by the position of the shoreline, which is sheltered by the Sfântu Gheorghe lobe against the Northerly waves. Therefore the waves from Southerly directions are those which control the shoreline evolution in this area. However, the quantities of sediments transported Westward from Sahalin Island are rather small as compared with those in the Sulina – Sf. Gheo-rghe sector.
It can be noticed that the quantity of the sediment trans-ported from the North towards the South between points 2 and 5 is continuously increasing. The result is erosion of the beach at a high rate. Our computation is confirmed by direct observation (Panin, 1996; Stănică, 2003; Giosan et al., 1997)
The decrease of the sediment transport between points 6 and 9 suggests an intense deposition Southward of Sfântu Gheorghe mouth, which can constitute, along with Sfântu Gheorghe branch, the source of sediments for formation and growing of the Sahalin spit island. At the points 9, 10 and 13 the direction of the transport is towards South-West, because only waves from Eastern directions attack the shore at high enough angles to produce a significant transport.
From figure 6 an important difference can be observed between the results of the computation of alongshore sedi-ment transport capacity for 3 m depth and 7 m depth. The explanation is given by the fact that both formulas used (Kamphuis and CERC) take into account the parameters of the waves (significant height, period and angle) at the initia-tion of breaking.
The small values of the sediment transport computed for the depth of 3 m show that this depth is too small for many wave conditions. Another argument to support this expla-nation is the spatial distribution of the longshore transport, which appears to be rather random and not showing consist-ent trends like in the case of 7 m depth computation. This is
due to the wave breaking, which occurs, in many cases, at depths larger than 3 m, so the wave angles with respect to the shoreline are already modified.
The maximum alongshore sediment transport is pro-duced when the waves attack the shore at an angle, relative to the shore normal, of 45° and the minimum transport is produced when the wave direction is parallel (90°) or perpen-dicular (0°) to the shore. In our case, at 3 m depth many waves already break, so the wave angle relative to the shore normal is closer to 0° than at the initiation of breaking, which leads, along with the smaller values of the significant wave heights and wave period, to small values of the alongshore sediment transport capacity.
The modification of the wave angles after the breaking in the case of 3 m depth computation is the main cause for the spatial distribution differences between the computation for 3 m and 7 m depths.
dIscussIons In the JICA/ECOH (2006) report data on the wave climate
near Constanta, Romania, situated approximately 150 km south from our study zone are presented. In this report wave data are collected from local visual observations (NIRMD) and waves obtained by computation using the ECMWF wind data. After analyzing and correlating this data, the average significant wave height resulted was 0.95 m, very similar with our computed values.
The wave climate all over the studied zone is controlled mainly by Northerly and Southerly directions. The trends in the state of the coastal zone suggested by the wave climate are confirmed by the direct observations. Most of the waves are below 1 m, but the category 1 - 3 m is significant. The cat-egory over 3 m is insignificant, especially close to the Sulina jetties and Sahalin - Portita area.
In the sector Sulina - Garla Imputita the wave heights are rather low, the largest wave heights being from Southerly and Easterly directions. This suggests an environment favour-able to sedimentation with a possible alongshore sediment transport towards North. According to Panin (1996), Stănică (2003), Giosan et al. (1997) this is one of the fewest advancing zones from the entire Danube Delta coastal zone.
The next sector Southward (Impuţita Channel - Sfântu Gheorghe) was described by Panin (1996), Stanica (2003) and Giosan et al. (1997) being the sector with the fastest retreat from the entire Romanian littoral. The computed wave cli-mate shows the same trend, supported by the fact that the predominant directions are Northerly, probably inducing an intense alongshore transport towards South.
Sahalin island was described (Panin, 1996; Giosan et al., 1997), as a very dynamic environment, controlled often by overwash processes with intense erosion in the Northern half, but also deposition at the southern end (advancing of the southern tip with an average of 100-300 m/year). The largest
29GEO-ECO-MARINA 13/2007 Coastal Zone Processes and Management. Environmental Legislation
S. Dan, M. Stive, A. van der Westhuysen – Alongshore Sediment Transport Capacity Computation on the Coastal Zone of the Danube Delta Using a Simulated Wave Climate
values for the average wave height are near to the North part of the island, decreasing towards South.
In the small bay behind the Sahalin spit island the com-puted wave heights are very small, suggesting a quiet envi-ronment. In fact, here a secondary delta of Sfântu Gheorghe branch is developing (Panin, 1996).
According to the computed wave climate the Sahalin - Portita sector is controlled mainly by the Easterly and South-erly directions with lower average waves heights. Direct ob-servations indicate here a low alongshore sediment transport and slight erosion.
Using the CERC formula result larger values than in the case of the Kamphuis formula.
There are two divergence zones, but the most important is the one between points 2 and 3 where the erosion is in-tense. This sector experienced the fastest shoreline retreat of the entire Romanian littoral zone. The other zone of diver-gence (between points 12 and 13) is less important from the point of view of the quantity of the sediment transport, but it confirms a retreat of the shoreline. Also, a convergence zone can be noticed (between points 10 and 11). In this case the measurements do not indicate accretion, but rather a stable shoreline.
conclusIons
Despite the lack of reliable wave data and precise infor-mation about the fetch for each wind direction the computed
wave climate can be considered realistic for the littoral zone of the Danube Delta.
The trends and the order of magnitude of the computed alongshore sediment transport matches well with the direct ob-servations, especially in the case of the 7 m depth computation.
In the case of the Sahalin spit island domain (points 6, 7 and 8 - Fig. 1) the decrease of the alongshore sediment transport suggests accretion which is not the case in reality. It seems that the Sahalin spit island domain is able to accom-modate large quantities of sediments, taking into account that, the contribution of the Sf. Gheorghe branch is added to the longshore transport (350 - 500,000 m3/yr, Panin, 1997), reaching a total of at least 1,000,000 m3/yr. To understand the circulation of the sediments and quantify the volumes in this area, further research is required.
acknoWledGementsThe authors would like to thank Nicolae Panin, Adrian
Stănică (National Institute of Marine Geology and Geoecol-ogy – GeoEcoMar, Romania), Alfred Vespremeanu-Stroe (Fac-ulty of Geography, University of Bucharest) and Viorel Gh. Ungureanu (Faculty of Geology and Geophysics, University of Bucharest) for supporting the study with valuable data and useful observation. The computation was made during a doc-toral fellowship in the frame of European Centre of Excellence for Environmental and Geo-ecological Studies on River – Delta – Sea Systems in Europe: case study River Danube, its Delta, Black Sea System”, Project number EVK3-2002-00503, European Commission - FP5.
references
Bondar C., Panin n., niCColini G., 2000. The Danube Delta Hydrologic Da-taBase and Modelling. In Final Report EC: Fluxes of greenhouse gases in the north-western region of the Black Sea coastal zone: Influence of the Danube River System, 35 p., Romania-Italy.
Booij n., ris r. C. and HoltHuijsen l. H., 1999. A third-generation wave model for coastal regions; 1. Model description and validation, Journal of Geophysical Research, Vol. 104, No. C4, p. 7649–7666.
GinsBurG, a. i., Kostianoy G. K., nezlin n. P., solovieev d. M., staniCHny s. v., 2002. Anticyclonic Eddies in Northwestern Black Sea, Journal of Marine Systems 32, p. 91 - 106.
Giosan l., BoKuniewiCz H., Panin n., PostolaCHe i., 1997. Longshore Sedi-ment Transport Pattern along Romanian Danube Delta Coast, GEo-ECo-MaRina, 2: 11-24, Bucharest.
jaPan international CooPeration aGenCy (jiCa) and Ministry of environMent and water ManaGeMent, roMania, 2006. The Study of Protection and Rehabilitation of the Southern Romanian Black Sea Shore in Ro-mania.
KaMPHuis j. w., 2000. Introduction to Coastal Engineering and Mana-
gement, advanced Series on ocean Engineering, Vol. 16.
Panin n., 1996. Impact of global changes on geo-environmental and
coastal zone state of the Black Sea, Geo-Eco-Marina, vol. 1, Bu-
charest.
Panin n., 1997. On the geomorphologic and the geologic evolution
of the River Danube – Black Sea interaction zone, GEo-ECo-Ma-
Rina, vol. 2, p. 31-40, Bucharest, Romania.
Panin n., 1999. Danube Delta: Geology, Sedimentology, Evolution, As-
sociation des Sedimentologistes Francais, Paris.
Panin n., 1999. Global changes, sea level rise and the Danube Delta:
risks and responses, GEo-ECo-MaRina, Vol. 4, Bucharest.
Panin n., 2001. Le delta et l’elevation du niveau de la mer: risques et
reponse. Actes Coll. d’Arles 12-13 OCT. 2000: Le changement cli-
matiques et les espaces cotiers – L’elevation du niveau de la mer:
risques et reponses, p. 66-71, France.
30 GEO-ECO-MARINA 13/2007 Coastal Zone Processes and Management. Environmental Legislation
S. Dan, M. Stive, A. van der Westhuysen – Alongshore Sediment Transport Capacity Computation on the Coastal Zone of the Danube Delta Using a Simulated Wave Climate
Panin n., stăniCă a., Bondar C., Brustur t., 2001. Integrated coastal zone management in relation coastal dynamics (in Romanian, unpu-blished report), GeoEcoMar, Bucharest.
u.s. arMy Coastal enGineerinG researCH Center, dePartMent of tHe arMy, CorPs of enGineers, 1984. „Shore Protection Manual» U.S. Govt. Printing Office, Washington, DC, USA, vols. 1 and 2.
stăniCă a., 2003. Evoluţia geodinamicã a litoralului românesc al Mãrii Negre din sectorul Sulina - Sfântu Gheorghe şi posibilitãţi de pre-dicţie, PhD thesis, University of Bucharest.
unGureanu GH., stãniCã a., Gaitã, C., danielesCu-CHirloMez, C., 1996.
“Shoreline and beach morphology seasonal variations in the
Sf. Gheorghe area (Danube Delta) - a pilot study”, anuarul insti-
tutului Geologic al României, Vol. 69, Suppl. 1, Bucuresti, p. 197
- 200.
unGureanu GH., stăniCă a., 2000. Impact of human activities on the
evolution of the Romanian Black Sea beaches, Lakes & Reservoirs:
Research and Management, vol. 5, p. 111-115.