Embed Size (px)
Citation preview

Allosteric hotspots in the main protease of SARS-CoV-2Léonie Strömich
Imperial College London https://orcid.org/0000-0003-4498-813XNan Wu
Imperial College LondonMauricio Barahona
Imperial College London https://orcid.org/0000-0002-1089-5675Sophia Yaliraki ( [email protected] )
Imperial College London
Article
Keywords: COVID-19 Pandemic, Binding Site Inhibition, Allosteric Communication Pathways, AtomisticGraph Theoretical Methods, Statistical Bootstrapping
Posted Date: March 1st, 2021
DOI: https://doi.org/10.21203/rs.3.rs-153249/v1
License: This work is licensed under a Creative Commons Attribution 4.0 International License. Read Full License

ALLOSTERIC HOTSPOTS IN THE MAIN PROTEASE OF
SARS-COV-2
A PREPRINT
Léonie StrömichDepartment of ChemistryImperial College London
Nan WuDepartment of ChemistryImperial College London
Mauricio BarahonaDepartment of Mathematics
Imperial College London
Sophia N. Yaliraki*Department of ChemistryImperial College London
January 22, 2021
ABSTRACT
Inhibiting the main protease of SARS-CoV-2 is of great interest in tackling the COVID-19 pandemic1
caused by the virus. Most efforts have been centred on inhibiting the binding site of the enzyme.2
However, considering allosteric sites, distant from the active or orthosteric site, broadens the search3
space for drug candidates and confers the advantages of allosteric drug targeting. Here, we report the4
allosteric communication pathways in the main protease dimer by using two novel fully atomistic5
graph theoretical methods: bond-to-bond propensity analysis, which has been previously successful in6
identifying allosteric sites without a priori knowledge in benchmark data sets, and, Markov transient7
analysis, which has previously aided in finding novel drug targets in catalytic protein families. We8
further score the highest-ranking sites against random sites in similar distances through statistical9
bootstrapping and identify four statistically significant putative allosteric sites as good candidates for10
alternative drug targeting.11
1 Introduction12
The global pandemic of COVID-19 (coronavirus disease 2019) is caused by the newly identified virus SARS-CoV-13
2 [1, 2, 3, 4], a member of the coronavirus family of enveloped, single-stranded ribonucleic acid (RNA) viruses that14
also includes SARS-CoV, the virus responsible for the severe acute respiratory syndrome (SARS) epidemic of 2003 [5].15
Since coronaviruses have been known to infect various animal species and share phylogenetic similarity to pathogenic16
human coronaviruses, the potential of health emergency events had already been noted [6]. However, their high17
mutation rate, similarly to other RNA viruses [7], makes the development of long-lasting drugs challenging. Developing18
therapeutics against coronaviruses is of high interest due to the ongoing global health emergency.19
One of the main approaches for targeting coronaviruses is to inhibit the enzymatic activity of their replication machinery.20
The main protease (Mpro), also known as 3C-like protease (3CLpro), is the best-characterised drug target owing to its21
crucial role in viral replication [8, 9, 10]. Mpro is only functional as a homodimer and the central part of the active or22
orthosteric site is composed of a cysteine-histidine catalytic dyad [11] (see Fig. 1B) which is responsible for processing23
the polyproteins translated from the viral RNA [12].24
The Mpro of the new SARS-CoV-2 is very similar to that of SARS-CoV: they share 96% sequence similarity, and exhibit25
high structural similarity (r.m.s. deviation between Cα positions equal to 0.53 Å ) [11]. Indeed, many of the residues26
that are important for catalytic activity, substrate binding and dimerisation are conserved between both proteases [13].27
However, several of the mutations in SARS-CoV-2 are located at the dimer interface (for a full list see Table S1).28
Notably, two of those mutations (Thr285Ala and Ile286Leu, see Fig.1) have been the object of particular interest: on29

one hand, it has been suggested that they could be responsible for closer dimer packing in SARS-CoV-2 [11], whereas30
on the other hand, previous mutational studies on those positions have revealed an impact on catalytic activity in31
SARS-CoV Mpro [14].32
Currently, the development of inhibitors for the Mpro of SARS-CoV-2 [11, 15, 16, 17] focuses on blocking the active33
sites to disrupt viral replication [18], similarly to the strategy followed for the design of other inhibitors for coronavirus34
proteases [19, 20, 21], Targeting the active site enables high affinity of the drug molecules, but can also result in35
off-target-based toxicity when binding to proteins with similar active sites [22, 23]. Drug resistance is another major36
concern, especially when the active site may potentially change owing to mutations. Targeting an allosteric site distal37
from the main binding site provides an attractive alternative strategy by increasing both the range and selectivity of38
drugs to fine-tune protein activity circumventing some of the aforementioned disadvantages. (For reviews and recent39
successes of allosteric drug design, see Wenthur et al. and Cimermancic et al. [24, 25]). Indeed, there have been40
indications of allosteric processes mediated by the extra domain in the protease of the old SARS-CoV [26, 27, 28, 14].41
However, to the best of our knowledge, there is to date no indication in the literature of such putative allosteric sites in42
SARS-CoV-2 Mpro, other than a recent implication of potential allosteric regulation of SARS-CoV-2 Mpro [29] and43
simulated binding events to distant areas of the protein [30].44
Our focus here is the allostericity of the SARS-CoV-2 main protease, and specifically whether there are potential45
allosteric sites strongly connected to the active site that may offer alternative ways to inhibit virus reproduction. The46
identification of allosteric sites in enzymes remains challenging and is still often done serendipitously. Computational47
prediction of allosteric sites has become an active field of research for drug design (for reviews see [31, 32]) as it does48
not require the laborious and time-consuming compound screening process. For example, molecular dynamics (MD)49
simulations that model proteins at the atomic level are used to detect communication pathways in the protein structure50
which can be exploited for allosteric residue and site identification [33, 34]. To alleviate the substantial computational51
resources required by MD simulations, as well as their inability to explore all the required time and length scales,52
variations of normal mode analysis (NMA) of elastic network models (ENM) are widely employed and have achieved53
moderate accuracy in allosteric site detection when tested on known allosteric proteins [35, 36, 37, 38]. The toolbox for54
allosteric site prediction is continuously growing, and new methods range from statistical mechanical models [39, 40]55
to methods based on graph theory [41]. However, most of them overcome the computational requirements of MD at the56
cost of resolution by looking at coarse-grained representations of protein structures [42].57
To overcome some of these limitations, we have recently introduced a suite of methods for the analysis of high-resolution58
atomistic protein graphs derived from structural data, which are computationally efficient and can span across scales59
in an unsupervised manner. The graphs have atoms as nodes and retain key physico-chemical detail through energy-60
weighted edges obtained from structural information and interatomic potentials of covalent and weak interactions61
(hydrogen bonds, electrostatics and hydrophobics) which are known to be important in allosteric signalling [43, 44, 45].62
Here we apply two techniques that take full advantage of this detailed atomistic graph: bond-to-bond propensities [46]63
and Markov transient analysis [44]. Firstly, bond-to-bond propensities quantify how an energy fluctuation in a given set64
of bonds significantly affects any other bond in the protein graph and provides a measure of instantaneous connectivity as65
mediated by the graph structure. Unlike most network approaches, bond-to-bond propensity is formulated on the edges66
of the graph and thus makes a direct link between energy and flow through bonds (i.e., physico-chemical interactions)67
of the system [46]. It has been shown that bond-to-bond propensities are capable of successfully predicting allosteric68
sites in a wide range of proteins without any a priori knowledge other than the active site [46]. Of particular relevance69
to the homodimeric protease studied here, it has been subsequently used to show how allostery and cooperativity are70
intertwined in multimeric enzymes such as the well-studied aspartate carbamoyltransferase (ATCase) [47]. Secondly,71
Markov transient analysis provides additional information by shedding light on the catalytic aspects of allostery. Markov72
transients extracts pathways implicated in allosteric regulation by analyzing the dynamical transients of the propagation73
of a random walker starting from the active site as it diffuses on the node space of the atomistic graph [44]. Crucially,74
Markov transients takes into account all possible pathways, not just the shortest or optimal paths—an important75
feature since allosteric communication is known to involve multiple paths across the protein [48]. In doing so, Markov76
transient analysis has been successful in identifying allosteric paths in caspase-1 [44], as well as previously unknown77
allosteric inhibitor binding sites in p90 ribosomal s6 kinase 4 (RSK4) which complemented drug repurposing in lung78
cancer [49]. These two methods are complementary and reveal different aspects of the underlying allosteric mechanisms:79
bond-to-bond propensity analysis gives insights into the structural connectivity, whereas Markov transient analysis is80
better suited to capture the time scales and catalytic effects of a protein.81
In this paper, we apply these two methodologies in the setting of COVID-19. We analysed the SARS-CoV-2 main82
protease and obtained bond-to-bond propensities for all bonds as well as Markov transient half-times t1/2 for all atoms83
in the protein. Our results shed light on the allosteric communication patterns in the Mpro dimer, highlighting the84
role of the dimer interface. We use our methods to show how the subtle structural changes between SARS-CoV and85
SARS-CoV-2 affect the dimer properties. By applying a rigorous scoring procedure, we identify four statistically86
2

significant hotspots on the protein that are strongly connected to the active site and propose that they hold potential for87
allosteric regulation of the main protease. Aligning the hits from a recent Diamond Light Source XChem fragment88
screen [50], we find molecules that could be a first starting point for allosteric drug design. The inhibitory effect of89
some of these molecules has been proven by mass spectrometry based assays [29]. By providing guidance for allosteric90
drug design we hope to open a new chapter for drug targeting efforts to combat COVID-19.91
2 Results92
2.1 Bond-to-bond propensities provide insights into the Mpro dimer at atomistic resolution.93
Here we analyse the recently resolved apo structure of the main protease Mpro of SARS-CoV-2 (PDB ID: 6Y2E) [11].94
In its active form, the protease forms a homodimer, and each monomer has three domains (Fig. 1A). The active site in95
each monomer forms a catalytic dyad which is expanded to a triad by the presence of a water molecule [11] (Fig. 1B).96
Our analysis starts with the PDB file, from which we construct an atomistic graph that includes both strong (covalent)97
bonds and weak interactions (hydrogen bonds, electrostatic and hydrophobic interactions), as well as structural water98
molecules that are known to be catalytically important (see Methods and Fig. 5).99
Figure 1: Overview of the SARS-CoV-2 main protease dimer. Atomic coordinates are obtained from the PDB file (PDB ID:6Y2E). A) shows the full dimer with the active site residues on both monomers shown as spheres. The second monomer is shownwith increased transparency to visualise where the monomers interact. Colours are according to domain: Domain I residues 10 to 99 -dark green, domain II residues 100 to 182 - dark blue, domain III residues 198 to 303 - orange, loops in light green. B) Zoom-in ofthe active site with histidine 41 and cysteine 145 forming a catalytic dyad which is extended to a triad by a water molecule in closeproximity.
We then employ bond-to-bond propensity (B2B-prop) and Markov transient analysis (MTA) to characterise the100
propagation of perturbations emanating from given residues across the atomistic protein graph. To quantify these101
effects, we use quantile regression to score all bonds and atoms, and consequently all residues. This allows us to102
identify statistically significant hotspots, i.e., regions of the protein that are affected more strongly (using B2B-prop) or103
reached more quickly (using MTA) by perturbations emanating from a given set of residues (see Methods). We use104
these techniques in two ways: firstly, in a forward step, we source perturbations at the active sites of the dimer and105
identify hotspots in the rest of the protein, which we mark as putative allosteric sites; secondly, in a reverse step, we106
source perturbations at the obtained hotspots and analyse the pattern of propagation back to the active sites and other107
regions of interest in the dimer (e.g., the dimer interface). Bond-to-bond propensity has been shown to successfully108
detect allosteric sites on an extended set of known allosteric proteins [46], and Markov transient analysis has been used109
to reveal allosteric communication pathways within the protein structure in both caspase [44] and RSK4 [49].110
Figure 2 shows the forward step of the bond-to-bond propensity analysis of the Mpro of SARS-CoV-2, obtained when111
we source perturbations from the active sites in the homodimer (specifically, from the catalytically active residues112
histidine 41 and cysteine 145 in both monomers). The computed propensities of the residues are then regressed against113
their distance to the active site using quantile regression (Figure 2C). The resulting quantile scores of all residues are114
also shown as a colour map on the protein structure in Figure 2A-B, and the list of residues with quantile scores above115
95% (a total of 40 residues) are shown in Table S2. By sourcing the perturbations at the active site residues histidine 41116
3
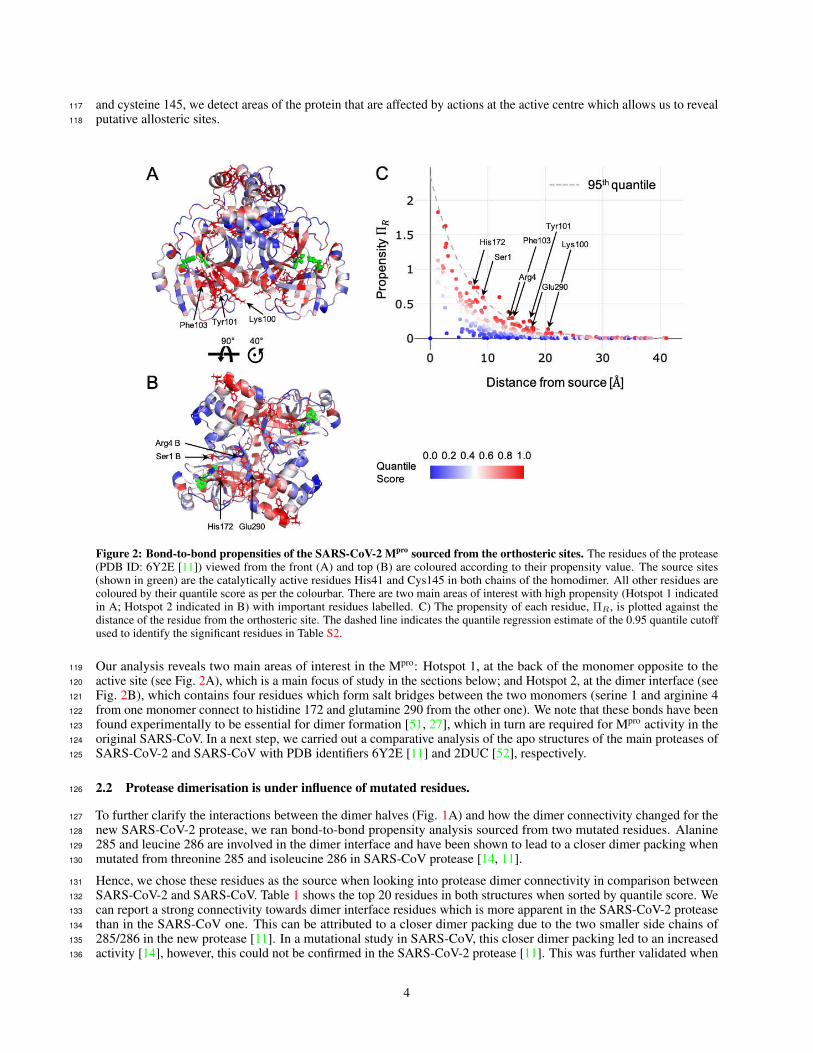
and cysteine 145, we detect areas of the protein that are affected by actions at the active centre which allows us to reveal117
putative allosteric sites.118
Figure 2: Bond-to-bond propensities of the SARS-CoV-2 Mpro sourced from the orthosteric sites. The residues of the protease(PDB ID: 6Y2E [11]) viewed from the front (A) and top (B) are coloured according to their propensity value. The source sites(shown in green) are the catalytically active residues His41 and Cys145 in both chains of the homodimer. All other residues arecoloured by their quantile score as per the colourbar. There are two main areas of interest with high propensity (Hotspot 1 indicatedin A; Hotspot 2 indicated in B) with important residues labelled. C) The propensity of each residue, ΠR, is plotted against thedistance of the residue from the orthosteric site. The dashed line indicates the quantile regression estimate of the 0.95 quantile cutoffused to identify the significant residues in Table S2.
Our analysis reveals two main areas of interest in the Mpro: Hotspot 1, at the back of the monomer opposite to the119
active site (see Fig. 2A), which is a main focus of study in the sections below; and Hotspot 2, at the dimer interface (see120
Fig. 2B), which contains four residues which form salt bridges between the two monomers (serine 1 and arginine 4121
from one monomer connect to histidine 172 and glutamine 290 from the other one). We note that these bonds have been122
found experimentally to be essential for dimer formation [51, 27], which in turn are required for Mpro activity in the123
original SARS-CoV. In a next step, we carried out a comparative analysis of the apo structures of the main proteases of124
SARS-CoV-2 and SARS-CoV with PDB identifiers 6Y2E [11] and 2DUC [52], respectively.125
2.2 Protease dimerisation is under influence of mutated residues.126
To further clarify the interactions between the dimer halves (Fig. 1A) and how the dimer connectivity changed for the127
new SARS-CoV-2 protease, we ran bond-to-bond propensity analysis sourced from two mutated residues. Alanine128
285 and leucine 286 are involved in the dimer interface and have been shown to lead to a closer dimer packing when129
mutated from threonine 285 and isoleucine 286 in SARS-CoV protease [14, 11].130
Hence, we chose these residues as the source when looking into protease dimer connectivity in comparison between131
SARS-CoV-2 and SARS-CoV. Table 1 shows the top 20 residues in both structures when sorted by quantile score. We132
can report a strong connectivity towards dimer interface residues which is more apparent in the SARS-CoV-2 protease133
than in the SARS-CoV one. This can be attributed to a closer dimer packing due to the two smaller side chains of134
285/286 in the new protease [11]. In a mutational study in SARS-CoV, this closer dimer packing led to an increased135
activity [14], however, this could not be confirmed in the SARS-CoV-2 protease [11]. This was further validated when136
4

we calculated the average residue quantile score of the active site in these runs. For the active site in SARS-CoV-2 Mpro137
the score is 0.26 which is below a randomly sampled site score of 0.48 (95% CI: 0.47-0.49) and makes the active site a138
coldspot in this analysis. In SARS-CoV Mpro we detect a higher connectivity with a score of 0.50 for the active site139
which is nevertheless slightly above a random site score of 0.48 (95% CI: 0.47- 0.48).140
Table 1: Comparison of Top 20 residues between Covid-19and SARS main protease. Highlighted in blue are residueswhich are in the dimer interface.
SARS-CoV-2 SARS-CoVSER1 A ARG40 AARG4 A SER123 AARG40 A GLU166 A
PRO122 A ASP187 ASER1 B PHE305 AARG4 B ARG40 BARG40 B ASN95 B
PRO122 B PRO122 BGLN306 B ARG131 B
PHE3 A ASP187 BSER10 A ILE281 BGLU14 A TYR54 AASN95 A ILE281 A
GLU166 A SER1 BPHE305 A PHE3 BGLN306 A ARG4 B
PHE3 B SER10 BSER10 B ASP56 BASN95 B ARG60 B
GLU166 B TRP207 B
Although we could not identify the direct link between the141
extra domain and the active site on an atomistic level here,142
we assume that studying the dimer interface residues in a143
systematic manner would help elucidate the link between144
domain III and the catalytic activity of the Mpro.145
2.3 Identification146
and scoring of putative allosteric sites.147
We could detect two hotspots on the protease which might148
be targetable for allosteric regulation of the protease (Fig.149
3). Most of the residues present in the two putative sites150
are amongst the highest scoring residues which are listed in151
Table S2. Site 1 (Fig. 3A shown in yellow) which is located152
on the back of the monomer in respect to the active site and153
is formed by nine residues from domain I and II (full list in154
Table S4). The second hotspot identified with bond-to-bond155
propensities is located in the dimer interface and contains156
6 residues (Tab. S5) which are located on both monomers157
(Fig. 3B shown in pink). Two of these residues, glutamine158
290 and arginine 4 of the respective second monomer, are159
forming a salt bridge which is essential for dimerisation160
[27]. Quantile regression allows us to rank all residues in161
the protein and thus we can score both sites with an average162
residue quantile score as listed in Table 2. Site 1 and 2 have163
a high score of 0.97 and 0.96, respectively and score much164
higher than a randomly sampled site would score with 0.53165
(95% CI: 0.53-0.54) for a site of the size of site 1 or 0.52166
(95% CI: 0.51-0.53) for a site of the size of site 2.167
Our methodologies further allow investigating the reverse analysis to assess the connectivity of the predicted allosteric168
sites. For this purpose, we defined the source as all residues within the respective identified sites (Tables S4 and S5).169
After a full bond-to-bond propensity analysis and quantile regression to rank all residues, we are able to score the active170
site to obtain a measure for the connectivity towards the catalytic centre (Tab. S8). For site 1 the active site score is 0.64171
which is above a randomly sampled site score of 0.47 (95% CI:0.47-0.48). However, for site 2 the active site score is172
0.49 which is only marginally above a randomly sampled site score of 0.48 (95% CI:0.47-0.48). As site 2 is located in173
the dimer interface, this is in line with the above-described suggestion that the allosteric effect is not directly conferred174
from the dimer interface towards the catalytic centre. Nonetheless, this site might provide scope for inhibiting the Mpro175
by disrupting the dimer formation at these sites.176
Overall, this missing bi-directional connectivity hints to a more complex communication pattern in the protein and gave177
us reason to utilise another tool which has been shown to be effective in catalytic frameworks [44] like the protease.178
Markov transients reveal fast signal propagation which happens often along allosteric communication pathways within179
the protein structure. The top-scoring residues with a QS > 0.95 in a Markov transient analysis sourced from the active180
site residues are shown in Figure 4A and a full list can be found in Table S3. In the SARS-CoV-2 Mpro, this analysis181
subsequently led to the discovery of two more putative sites as shown in Figure 4C. Both hotspots are located on the182
back of the monomer in relation to the active site. Site 3 (turquoise in Figure 4C) is located solely in domain II and183
consists of ten residues as listed in Table S6. One of which is a cysteine at position 156 which might provide a suitable184
anchor point for covalent drug design. Site 4 (orange in Figure 4C) is located further down the protein in domain I with185
11 residues as listed in Table S7. Both sites were scored as described above and in the Methods section. Both sites have186
high average residue quantile scores of 0.87 (Tab. 2) which are significantly higher than the random site scores of 0.50187
(95% CI: 0.49-0.50) and 0.49 (95% CI: 0.49-0.50), respectively.188
Following the same thought process as described for site 1 and 2, we can investigate the protein connectivity from the189
opposite site by sourcing our runs from the residues in site 3 and 4. We then score the active site to measure the impact190
of the putative sites on the catalytic centre (Tab. S8). For site 3, the active site has an average residue quantile score191
5

Figure 3: Putative allosteric sites identified by bond-to-bond propensities. Surface representation of the Mpro dimer coloured byquantile score (as shown in the legend). A) Rotated front view with site 1 (yellow) which is located on the opposite of the orthostericsite (coloured in green). B) Top view with site 2 (pink) located in the dimer interface. A detailed view of both sites is provided withimportant residues labelled.
of 0.66 in comparison to a random site score of 0.53 (95% CI: 0.52-0.53) which indicates a significant catalytic link192
between site 3 and the active site. For site 4 (as for site 2) the scores are similar to a randomly sampled score, which193
means that we do not detect a significant connectivity from this site to the active site. Judging from previous experience194
in multimeric proteins this might be due to another structural or dynamic factor which we did not yet uncover between195
site 4 and the active site.196
Overall, we see a similar pattern of hot and cold spots in the SARS-CoV Mpro (results not shown). We find a high197
overlap for the identified four sites which gives us confidence, that a potential drug effort would find applications in198
COVID-19 as well as SARS. To provide a first indication of the druggability of the identified sites, we chose to align the199
fragments identified in the Diamond Light Source XChem fragment screen [50] with our sites. The screen identified 25200
fragments which bind outside of the active site and 15 of these bind within 4 Å of any of the four putative allosteric sites.201
Due to the computational efficiency of our methodologies we were able to conduct a full analysis of all 15 structures202
and ran our methods from the fragments as source sites. We subsequently scored the active sites in each run (full data in203
Table S9) and found that the fragment deposited with the PDB identifier 5RE8 might be of particular interest as it has204
the highest connectivity to the active site. Moreover, one of the fragments within 4 Å of site 1 with the PDB identifier205
5RGJ, has been shown to inhibit the proteolytic activity of the Mpro [29] and possesses a relatively high connectivity to206
the active site.207
6

Figure 4: Markov transient analysis of Mpro sourced from the orthosteric sites. The orthosteric sites are shown in green andinclude His41 and Cys145 in both chains of the homodimer (front A) view). B) The t1/2 values of each residue are plotted againsttheir distance from the orthosteric site. The dashed line indicates the quantile regression estimate of the 0.95 quantile cutoff used foridentifying significant residues. The quantile scores of all residues are mapped onto the structure of the Mpro dimer (front A) view),coloured as shown in the legend. C) Surface representation of a rotated front view of the Mpro dimer coloured by quantile score. Site3 (turquoise) and 4 (orange) are located on the opposite side of the active site (coloured in green). A detailed view of both sites isprovided with important residues labelled.
Table 2: Scoring of the 4 identified putative allosteric sites. Included is a structural bootstrap score of 1,000 randomly sampledsites with 95% confidence interval (CI).
Site Average Residue Quantile Score Random Site Score [95% CI]Site 1 0.97 0.53 [0.53, 0.54]Site 2 0.96 0.52 [0.51, 0.53]Site 3 0.87 0.50 [0.49, 0.51]Site 4 0.87 0.49 [0.49, 0.51]
3 Discussion208
During the global pandemic of COVID-19 that has started in January 2020, we have seen an increase of research209
activities to develop new drugs against the disease-causing virus SARS-CoV-2. A wide range of approaches from210
chemistry, structural biology and computational modelling have been used to identify potential protease inhibitors.211
However, most of these initiatives focus on investigating the active site as a drug target [11, 16], high-throughput212
docking approaches to the active site [15] or re-purposing approved drugs [53] and protease inhibitors [54] which bind213
at the active site.214
To increase the targetable space of the SARS-CoV-2 main protease and allow a broader approach to inhibitor discovery,215
we provide a full computational analysis of the protease structure which gives insights into allosteric signalling and216
identifies potential putative sites. Our methodologies are based on concepts from graph theory and the propagation of217
perturbations and fluctuations on a protein graph. We have previously demonstrated the applications of bond-to-bond218
propensities and Markov transients in identifying allosteric sites and communication pathways in a range of biological219
7

settings [44, 46, 47, 49]. Applying bond-to-bond propensities on the SARS-CoV-2 Mpro gave us important insights into220
connectivity of the protein and highlighted residues at the dimer interface. We further explored the interface residues in221
comparison with the SARS-CoV protease as dimerisation is known to be essential for the proteolytic activity [14] and222
might provide scope for inhibitor development [55]. Important for the dimer packing and mutated in SARS-CoV-2223
are residues 285 and 286 [11]. When sourced from these residues, we find a higher proportion of dimer interface224
residues within the top 20 scoring residues for SARS-CoV-2 which confirms a stronger dimer connectivity as described225
in literature [11]. Although we could not identify the direct link between the mutated residues and the active site on an226
atomistic level here, we assume that further systematic studies of the residues at the dimer interface would provide227
clarity.228
This gave us the confidence to further explore the SARS-CoV-2 protease with our methodologies. Using the above-229
described approaches we have identified four allosteric binding sites on the protease. We describe the locations of230
the sites and possible implications for the proteolytic activity of the protein. Site 1 and 2 have been identified using231
bond-to-bond propensities and hence have a strong instantaneous connectivity to the active site. Sourced from both sites,232
we noticed that site 1 is directly connected to the active site, which is detected with a score above a randomly sampled233
site score (0.64 > 0.47) while site 2 is indirectly connected to the active site with a active site score only slightly above234
that of a random site (0.49 > 0.48). This suggests that site 1 might be a functional site and any perturbation at site 1235
would induce a structural change of the protease thereby impacting the active site directly. Indeed, a fragment near site 1236
has been shown to exhibit some inhibitory effect on the Mpro in a recent study [29]. Notably, site 2, although not directly237
coupled to the active site as a functional site, is located in the dimer interface (Fig. 3B) and provides a deep pocket for238
targeting the protease and maybe disrupting dimer formation. Targeting site 2 could result in a conformational change239
of the protease and inhibition of dimerisation.240
The sites identified with Markov transients are reached the fastest by a signal sourced from the active site and are both241
located at the back of each monomer in relation to the active site. Site 3 is assumed to be directly coupled to the active242
site as seen from the score of the active site (0.66 > 0.53) and perturbation at site 3 would thus affect the catalytic243
activity of Mpro. Besides, Site 3 (Fig. 4C) contains a cysteine residue (Cys156) which provides an anchor point for244
covalently binding inhibitors [56]. Similar to site 2, site 4 is not directly connected to the active site. Effects exerted at245
site 4 could affect other parts of the protein which in turn lead to an altered activity of Mpro.246
We also include the analysis of 15 structures containing small fragments from a recent Diamond Light Source XChem247
fragment screen [50] which bind in proximity to the putative sites. We scored the active site (His41 and Cys145) using248
these fragments as the source. The active site score is analysed rigorously with a structural bootstrap to compare the249
effect of each fragment on the protease. Some fragments have a direct link to the active site and have been recently250
investigated in experimental studies [29] and might provide a first starting point for rational drug design.251
Together our methods provide in-depth insights into the global connectivity of the main protease. By taking our results252
into consideration we hope to broaden the horizon for targeting the main protease of SARS-CoV-2. This will aid in the253
development of effective medications for COVID-19.254
After the submission of this manuscript we became aware of the work by Carli et al.. Analysing metastable states from255
MD trajectories, they reveal a distal binding site which might allosterically affect the active site [57]. This site overlaps256
with the residues we have identified for site 2 in the dimer interface.257
4 Methods258
Protein Structures. We analysed the X-ray crystal structures of the apo conformations of the SARS-CoV-2 (PDB ID:259
6Y2E [11]) and the SARS-CoV (PDB ID: 2DUC [52]) main proteases (Mpro). All residues of the Mpro proteins that are260
mutated between the two viruses are listed in Table S1. Both structures contained a water molecule in proximity to261
the catalytic dyad formed by histidine 41 and cysteine 145. These water molecules were kept while all other solvent262
molecules were removed. Atom and residue, secondary structural names and numberings are in accordance with the263
original PDB files. The dimer interface was investigated using the online tool PDBePISA [58] (for a full list of the264
resulting dimer interface residues see https://doi.org/10.6084/m9.figshare.12815903).265
Atomistic Graph Construction. Instead of the coarse-grained descriptions typical of most network methods for266
protein analysis, we use protein data bank (PDB) [59] structure files to derive atomistic protein graphs from the three-267
dimensional protein structure parameterised with physico-chemical energies. In our graph, the nodes are atoms and the268
weighted edges represent interactions, both covalent bonds and weak interactions, including hydrophobic, hydrogen269
bonds and salt bridges (See Fig. 5). Details of earlier versions of this approach can be found in Refs [43, 44, 46].270
We summarise briefly the main features below and we note three further improvements in the current version: (i) the271
stand-alone detection of edges without need of third-party software; (ii) the many-body detection of hydrophobic edges272
8

across scales; and (iii) the improved computational efficiency of the code. For further details of the updated atomistic273
graph construction used in this work see [60, 45].274
Figure 5 gives an overview of the workflow. We start from atomistic cartesian coordinates of a PDB file. Since275
X-ray structures do not include hydrogen atoms and NMR structures may not report all of them, we use the software276
Reduce [61] to add any missing hydrogen atoms. Hydrophobic interactions and hydrogen bonds are identified with a277
cutoff of 9 Å and 0.01 kcal/mol respectively. In addition, hydrogen bonds are also identified based on the angles related278
to the hybridisation of the donor - acceptor atoms. The edges are weighted by their energies: covalent bond energies279
from their bond-dissociation energies [62]; hydrogen bonds and salt bridges by the modified Mayo potential [63, 64];280
hydrophobic interactions by using a hydrophobic potential of mean force [65].281
Figure 5: Atomistic Graph Construction. We showcase the general procedure here on the main protease of SARS-Cov-2: Atomiccoordinates are obtained from the PDB (ID: 6Y2E [11]) and hydrogens are added by Reduce [61]. Edges are identified and theweights are assigned, as described in the methods section, by taking into account covalent bonds as well as weak interactions:hydrogen bonds, electrostatic interactions and the hydrophobic effect which are coloured as indicated.
Bond-to-bond Propensities. Bond-to-bond propensity analysis was first introduced in Ref. [46] and further discussedin Ref. [47], hence we only briefly summarise it here. This edge-space measure examines and exhibits the instantaneouscommunication of a perturbation at a source towards every bond in the protein. The edge-to-edge transfer matrix Mwas introduced to study non-local edge-coupling and flow redistribution in graphs [66] and an alternative interpretationof M as a Green function is employed to analyse the atomistic protein graph. The element Mij describes the effect thata perturbation at edge i has on edge j. M is given by
M =1
2WBTL†B (1)
where B is the n × m incidence matrix for the atomistic protein graph with n nodes and m edges; W = diag(wij) is an282
m ×m diagonal matrix which possesses all the edge interaction energies with wij as the weight of the edge connecting283
nodes i and j, i.e. the bond energy between the atoms; and L† is the pseudo-inverse of the weighted graph Laplacian284
matrix L [67] and defines the diffusion dynamics on the energy-weighted graph [68].285
To evaluate the effect of perturbations from a group of bonds b0
(i.e., the source), on bond b of other parts of the protein,we define the bond propensity as:
Πb =X
b0 ∈ source
|Mbb0 | (2)
and then calculate the residue propensity of a residue R:
ΠR =X
b ∈ R
Πb . (3)
Markov Transient Analysis (MTA). A complementary, node-based method, Markov Transient analysis (MTA)286
identifies areas of the protein that are significantly connected to a site of interest, the source, such as the active site, and287
obtains the signal propagation that connects the two sites at the atomistic level. The method has been introduced and288
discussed in detail in Ref. [44] and has successfully identified allosteric hotspots and pathways without any a priori289
knowledge [44, 49]. Importantly, it captures all paths that connect the two sites. The contribution of each atom in the290
9

communication pathway between the active site and all other sites in a protein or protein complex is measured by the291
characteristic transient time t1/2,292
t(i)1/2 = argmin
t
p(i)t ≥
π(i)
2
�
(4)
where t(i)1/2 is the number of time steps in which the probability of a random walker to be at node i reaches half the293
stationary distribution value. This provides a measure of the speed by which perturbations originating from the active294
site diffuse into the rest of the protein by a random walk on the above described atomistic protein graph. To obtain the295
transient time t1/2 for each residue, we take the average t1/2 over all atoms of the respective residue.296
Quantile Regression (QR). To determine the significant bonds with high bond-to-bond propensity and atoms with297
fast transient times t1/2 at the same geometric distance from the source, we use conditional quantile regression (QR) [69],298
a robust statistical measure widely used in different areas [70]. In contrast to standard least squares regressions, QR299
provides models for conditional quantile functions. This is significant here because it allows us to identify not the300
"average" atom or bond but those that are outliers from all those found at the same distance from the active site and301
because we are looking at the tails of highly non-normal distributions.302
As the distribution of propensities over distance follows an exponential decay, we use a linear function of the logarithm303
of propensities when performing QR while in the case of transient times which do not follow a particular parametric304
dependence on distance, we use cubic splines to retain flexibility. From the estimated quantile regression functions, we305
can then compute the quantile score for each atom or bond. To obtain residue quantile scores, we use the minimum306
distance between each atom of a residue and those of the source. Further details of this approach for bond-to-bond307
propensities can be found in Ref. [46] and for Markov Transient Analysis in Ref. [71].308
Site scoring with structural bootstrap sampling. To allow an assessment of the statistical significance of a site of309
interest, we score the site against 1000 randomly sampled sites of the same size. For this purpose, the average residue310
quantile score of the site of interest is calculated. After sampling 1000 random sites on the protein, the average residue311
quantile scores of these sites are calculated. By performing a bootstrap with 10,000 resamples with replacement on the312
random sites average residue quantile scores, we are able to provide a 95% confidence interval to assess the statistical313
significance of the site of interest score in relation to the random site score.314
Residues used when scoring the active site. For scoring the active site as a measure of the connectivity towards the315
main binding site, we use all non-covalent hits bound in the active site from the XChem fragment screen against the316
SARS-CoV-2 Mpro [50] . The 22 found structures were further investigated using PyMol v.2.3 [72] for residues which317
have atoms within 4Å of any of the bound fragments. These residues are Thr25, Thr26, His41, Cys44, Thr45, Ser46,318
Met49, Tyr54, Phe140, Leu141, Asn142, Ser144, Cys145, Met162, His163, His164, Met165, Glu166, Leu167, Pro168,319
Asp187, Arg188, Gln189, Thr190 and constitute the active site as a site of interest in all scoring calculations.320
XChem fragment screen hits selection. From the above mentioned XChem fragment screen against the SARS-321
CoV-2 Mpro [50], 25 hits were found at regions other than the active site. The 15 fragments which contain atoms that322
are within 4Å from any of the putative allosteric site residues we obtained were selected as candidates for further323
investigation as shown in Table 3.324
Table 3: XChem fragments in 4 Å proximity to the identified allosteric sites.Site Fragment PDB IDSite 1 5RGJ, 5RE8, 5RF4, 5RF9, 5RFD, 5RED, 5REI, 5RF5, 5RGRSite 2 5RF0, 5RGQSite 3 5RF9Site 4 5RGG, 5RE5, 5RE7, 5RFC, 5RE8, 5RF4, 5RFD
For each of these fragment-bound structures, we performed bond-to-bond propensity and Markov transient analyses to325
evaluate the connectivity to the active site. The active site was scored as described above.326
10

Visualisation and Solvent Accessible Surface Area. We use PyMol (v.2.3) [72] for structure visualisation and327
presentation of Markov transient and bond-to-bond propensity results directly on the structure. The tool was also used328
to calculate the residue solvent accessible surface area (SASA) reported here, with a rolling probe radius of 1.4 and a329
sampling density of 2.330
Data availability331
All data presented in this study are available at figshare with DOI: 10.6084/m9.figshare.12815903.332
Acknowledgements333
We acknowledge helpful discussions with Florian Song, Francesca Vianello, Ching Ching Lam and Jerzy Pilipczuk. This334
work was funded by a Wellcome Trust studentship to L.S. [grant number 215360/Z/19/Z]. M.B. and S.N.Y. acknowledge335
funding from the EPSRC award EP/N014529/1 supporting the EPSRC Centre for Mathematics of Precision Healthcare.336
Author contributions337
L.S., N.W., M.B and S.N.Y. conceived the study. L.S and N.W. performed the computations, L.S. created the figures338
and all authors analysed the data and wrote the manuscript.339
Competing interests340
The authors declare no competing interests.341
Materials & Correspondence342
All requests for data and code shall be directed to [email protected]
References344
[1] Zhou, P. et al. A pneumonia outbreak associated with a new coronavirus of probable bat origin. Nature 579,345
270–273 (2020). URL https://doi.org/10.1038/s41586-020-2012-7.346
[2] Wu, F. et al. A new coronavirus associated with human respiratory disease in China. Nature 579, 265–269 (2020).347
URL https://doi.org/10.1038/s41586-020-2008-3.348
[3] Zhu, N. et al. A novel coronavirus from patients with pneumonia in China, 2019. New England Journal of349
Medicine 382, 727–733 (2020). URL https://doi.org/10.1056/NEJMoa2001017.350
[4] Gorbalenya, A. E. et al. The species Severe acute respiratory syndrome-related coronavirus: classifying 2019-351
nCoV and naming it SARS-CoV-2. Nature Microbiology 5, 536–544 (2020). URL https://doi.org/10.352
1038/s41564-020-0695-z.353
[5] Peiris, J. S. M., Guan, Y. & Yuen, K. Y. The severe acute respiratory syndrome. Nature Medicine 10, S88–S97354
(2004). URL https://doi.org/10.1038/nm1143.355
[6] Graham, R. L., Donaldson, E. F. & Baric, R. S. A decade after SARS: strategies for controlling emerging coron-356
aviruses. Nature Reviews Microbiology 11, 836–848 (2013). URL https://doi.org/10.1038/nrmicro3143.357
[7] Steinhauer, D. A. & Holland, J. J. Direct method for quantitation of extreme polymerase error frequencies at358
selected single base sites in viral RNA. Journal of Virology 57, 219–228 (1986). URL https://doi.org/10.359
1128/JVI.57.1.219-228.1986.360
[8] Anand, K. et al. Structure of coronavirus main proteinase reveals combination of a chymotrypsin fold with an361
extra alpha-helical domain. The EMBO journal 21, 3213–3224 (2002). URL https://doi.org/10.1093/362
emboj/cdf327.363
[9] Anand, K., Ziebuhr, J., Wadhwani, P., Mesters, J. R. & Hilgenfeld, R. Coronavirus main proteinase (3CLpro)364
structure: basis for design of anti-SARS drugs. Science 300, 1763–1767 (2003). URL https://doi.org/10.365
1126/science.1085658.366
11

[10] Yang, H. et al. The crystal structures of severe acute respiratory syndrome virus main protease and its complex with367
an inhibitor. Proceedings of the National Academy of Sciences of the United States of America 100, 13190–13195368
(2003). URL https://doi.org/10.1073/pnas.1835675100.369
[11] Zhang, L. et al. Crystal structure of SARS-CoV-2 main protease provides a basis for design of improved370
α-ketoamide inhibitors. Science 368, 409–412 (2020). URL https://doi.org/10.1126/science.abb3405.371
[12] Hilgenfeld, R. From SARS to MERS: crystallographic studies on coronaviral proteases enable antiviral drug372
design. FEBS Journal 281, 4085–4096 (2014). URL http://doi.org/10.1111/febs.12936.373
[13] Chen, Y. W., Yiu, C. P. B. & Wong, K. Y. Prediction of the SARS-CoV-2 (2019-nCoV) 3C-like protease (3CLpro)374
structure: Virtual screening reveals velpatasvir, ledipasvir, and other drug repurposing candidates. F1000Research375
9 (2020). URL https://doi.org/10.12688/f1000research.22457.2.376
[14] Lim, L., Shi, J., Mu, Y. & Song, J. Dynamically-driven enhancement of the catalytic machinery of the SARS377
3C-like protease by the S284-T285-I286/A mutations on the extra domain. PLoS ONE 9 (2014).378
[15] Ton, A.-T., Gentile, F., Hsing, M., Ban, F. & Cherkasov, A. Rapid Identification of Potential Inhibitors of379
SARS-CoV-2 Main Protease by Deep Docking of 1.3 Billion Compounds. Molecular Informatics 39, 2000028380
(2020). URL https://doi.org/10.1002/minf.202000028.381
[16] Jin, Z. et al. Structural basis for the inhibition of SARS-CoV-2 main protease by antineoplastic drug car-382
mofur. Nature Structural & Molecular Biology 27, 529–532 (2020). URL https://doi.org/10.1038/383
s41594-020-0440-6.384
[17] Jin, Z. et al. Structure of M(pro) from SARS-CoV-2 and discovery of its inhibitors. Nature 582, 289–293 (2020).385
URL https://doi.org/10.1038/s41586-020-2223-y.386
[18] Ullrich, S. & Nitsche, C. The SARS-CoV-2 main protease as drug target. Bioorganic and Medicinal Chemistry387
Letters 30, 127377 (2020). URL https://doi.org/10.1016/j.bmcl.2020.127377.388
[19] Yang, H. et al. Design of Wide-Spectrum Inhibitors Targeting Coronavirus Main Proteases. PLoS Biology 3, e324389
(2005). URL https://doi.org/10.1371/journal.pbio.0030324.390
[20] Pillaiyar, T., Manickam, M., Namasivayam, V., Hayashi, Y. & Jung, S.-H. An Overview of Severe Acute391
Respiratory Syndrome–Coronavirus (SARS-CoV) 3CL Protease Inhibitors: Peptidomimetics and Small Molecule392
Chemotherapy. Journal of Medicinal Chemistry 59, 6595–6628 (2016). URL https://doi.org/10.1021/393
acs.jmedchem.5b01461.394
[21] Dyall, J. et al. Middle East Respiratory Syndrome and Severe Acute Respiratory Syndrome: Current Therapeutic395
Options and Potential Targets for Novel Therapies. Drugs 77, 1935–1966 (2017). URL https://doi.org/10.396
1007/s40265-017-0830-1.397
[22] Rudmann, D. G. On-target and Off-target-based Toxicologic Effects. Toxicologic Pathology 41, 310–314 (2012).398
URL https://doi.org/10.1177/0192623312464311.399
[23] Guengerich, F. P. Mechanisms of drug toxicity and relevance to pharmaceutical development. Drug metabolism400
and pharmacokinetics 26, 3–14 (2011). URL https://doi.org/10.2133/dmpk.dmpk-10-rv-062.401
[24] Wenthur, C. J., Gentry, P. R., Mathews, T. P. & Lindsley, C. W. Drugs for Allosteric Sites on Receptors.402
Annual Review of Pharmacology and Toxicology 54, 165–184 (2014). URL https://doi.org/10.1146/403
annurev-pharmtox-010611-134525.404
[25] Cimermancic, P. et al. CryptoSite: Expanding the Druggable Proteome by Characterization and Prediction of405
Cryptic Binding Sites. Journal of Molecular Biology 428, 709–719 (2016). URL http://doi.org/10.1016/j.406
jmb.2016.01.029.407
[26] Shi, J., Wei, Z. & Song, J. Dissection study on the severe acute respiratory syndrome 3C-like protease reveals408
the critical role of the extra domain in dimerization of the enzyme: defining the extra domain as a new target for409
design of highly specific protease inhibitors. The Journal of biological chemistry 279, 24765–24773 (2004). URL410
https://doi.org/10.1074/jbc.M311744200.411
[27] Shi, J. & Song, J. The catalysis of the SARS 3C-like protease is under extensive regulation by its extra domain.412
FEBS Journal 273, 1035–1045 (2006). URL https://doi.org/10.1111/j.1742-4658.2006.05130.x.413
[28] Shi, J. et al. Dynamically-Driven Inactivation of the Catalytic Machinery of the SARS 3C-Like Protease414
by the N214A Mutation on the Extra Domain. PLOS Computational Biology 7, e1001084 (2011). URL415
https://doi.org/10.1371/journal.pcbi.1001084.416
[29] El-baba, T. J. et al. Allosteric inhibition of the SARS-CoV-2 main protease - insights from mass spectrometry-417
based assays. Angewandte Chemie International Edition (2020). URL https://doi.org/10.1002/anie.418
202010316.419
12

[30] Komatsu, T. S. et al. Drug Binding Dynamics of the Dimeric SARS-CoV-2 Main Protease, Determined by420
Molecular Dynamics Simulation. Scientific Reports 10, 16986 (2020). URL https://doi.org/10.1038/421
s41598-020-74099-5.422
[31] Greener, J. G. & Sternberg, M. J. Structure-based prediction of protein allostery. Current Opinion in Structural423
Biology 50, 1–8 (2018). URL https://doi.org/10.1016/j.sbi.2017.10.002.424
[32] Lu, S., He, X., Ni, D. & Zhang, J. Allosteric Modulator Discovery: From Serendipity to Structure-Based Design.425
Journal of Medicinal Chemistry 62, acs.jmedchem.8b01749 (2019). URL http://doi.org/10.1021/acs.426
jmedchem.8b01749.427
[33] Shukla, D., Meng, Y., Roux, B. & Pande, V. S. Activation pathway of Src kinase reveals intermediate states428
as targets for drug design. Nature Communications 5, 3397 (2014). URL https://doi.org/10.1038/429
ncomms4397.430
[34] Penkler, D., Sensoy, , Atilgan, C. & Tastan Bishop, Perturbation-Response Scanning Reveals Key Residues431
for Allosteric Control in Hsp70. Journal of Chemical Information and Modeling 57, 1359–1374 (2017). URL432
https://doi.org/10.1021/acs.jcim.6b00775.433
[35] Panjkovich, A. & Daura, X. Exploiting protein flexibility to predict the location of allosteric sites. BMC434
Bioinformatics 13, 273 (2012). URL https://doi.org/10.1186/1471-2105-13-273.435
[36] Panjkovich, A. & Daura, X. PARS: a web server for the prediction of Protein Allosteric and Regulatory Sites.436
Bioinformatics 30, 1314–1315 (2014). URL https://doi.org/10.1093/bioinformatics/btu002.437
[37] Greener, J. G. & Sternberg, M. J. E. AlloPred: prediction of allosteric pockets on proteins using normal mode pertur-438
bation analysis. BMC Bioinformatics 16, 335 (2015). URL https://doi.org/10.1186/s12859-015-0771-1.439
[38] Song, K. et al. Improved Method for the Identification and Validation of Allosteric Sites. Journal of Chemical440
Information and Modeling 57, 2358–2363 (2017). URL https://doi.org/10.1021/acs.jcim.7b00014.441
[39] Guarnera, E. & Berezovsky, I. N. Structure-Based Statistical Mechanical Model Accounts for the Causality and442
Energetics of Allosteric Communication. PLoS computational biology 12, e1004678–e1004678 (2016). URL443
https://doi.org/10.1371/journal.pcbi.1004678.444
[40] Tee, W.-V., Guarnera, E. & Berezovsky, I. N. Reversing allosteric communication: From detecting allosteric sites445
to inducing and tuning targeted allosteric response. PLOS Computational Biology 14, e1006228 (2018). URL446
https://doi.org/10.1371/journal.pcbi.1006228.447
[41] Wang, J. et al. Mapping allosteric communications within individual proteins. Nature Communications 3862448
(2020). URL https://doi.org/10.1038/s41467-020-17618-2.449
[42] Collier, G. & Ortiz, V. Emerging computational approaches for the study of protein allostery. Archives of450
Biochemistry and Biophysics 538, 6–15 (2013). URL https://doi.org/10.1016/j.abb.2013.07.025.451
[43] Delmotte, A., Tate, E. W., Yaliraki, S. N. & Barahona, M. Protein multi-scale organization through graph452
partitioning and robustness analysis: application to the myosin-myosin light chain interaction. Physical Biology 8,453
055010 (2011). URL https://doi.org/10.1088/1478-3975/8/5/055010.454
[44] Amor, B., Yaliraki, S. N., Woscholski, R. & Barahona, M. Uncovering allosteric pathways in caspase-1 using455
Markov transient analysis and multiscale community detection. Molecular BioSystems 10, 2247–2258 (2014).456
URL https://doi.org/10.1039/C4MB00088A.457
[45] Song, F., Barahona, M. & Yaliraki, S. N. BagPyPe: A Python package for the construction of atomistic,458
energy-weighted graphs from biomolecular structures. Manuscript in preparation (2020).459
[46] Amor, B. R. C., Schaub, M. T., Yaliraki, S. N. & Barahona, M. Prediction of allosteric sites and mediating460
interactions through bond-to-bond propensities. Nature Communications 7, 12477 (2016). URL https://doi.461
org/10.1038/ncomms12477.462
[47] Hodges, M., Barahona, M. & Yaliraki, S. N. Allostery and cooperativity in multimeric proteins: bond-463
to-bond propensities in ATCase. Scientific Reports 8, 11079 (2018). URL https://doi.org/10.1038/464
s41598-018-27992-z.465
[48] del Sol, A., Tsai, C.-J., Ma, B. & Nussinov, R. The origin of allosteric functional modulation: multiple pre-existing466
pathways. Structure 17, 1042–1050 (2009). URL https://doi.org/10.1016/j.str.2009.06.008.467
[49] Chrysostomou, S. et al. Abstract 1775: Targeting RSK4 prevents both chemoresistance and metastasis in lung468
cancer. Cancer Research 79, 1775 (2019). URL https://doi.org/10.1158/1538-7445.AM2019-1775.469
[50] Douangamath, A. et al. Crystallographic and electrophilic fragment screening of the SARS-CoV-2 main protease.470
Nature Communications 11, 5047 (2020). URL https://doi.org/10.1038/s41467-020-18709-w.471
13

[51] Chou, C. Y. et al. Quaternary structure of the severe acute respiratory syndrome (SARS) coronavirus main472
protease. Biochemistry 43, 14958–14970 (2004). URL https://doi.org/10.1021/bi0490237.473
[52] Muramatsu, T. et al. SARS-CoV 3CL protease cleaves its C-terminal autoprocessing site by novel subsite474
cooperativity. Proceedings of the National Academy of Sciences of the United States of America 113, 12997–475
13002 (2016). URL https://doi.org/10.1073/pnas.1601327113.476
[53] Mahanta, S. et al. Potential anti-viral activity of approved repurposed drug against main protease of SARS-477
CoV-2: an in silico based approach. Journal of Biomolecular Structure and Dynamics (2020). URL https:478
//doi.org/10.1080/07391102.2020.1768902.479
[54] Eleftheriou, P., Amanatidou, D., Petrou, A. & Geronikaki, A. In Silico Evaluation of the Effectivity of Approved480
Protease Inhibitors against the Main Protease of the Novel SARS-CoV-2 Virus. Molecules 25, 2529 (2020). URL481
https://doi.org/10.3390/molecules25112529.482
[55] Goyal, B. & Goyal, D. Targeting the Dimerization of the Main Protease of Coronaviruses: A Potential Broad-483
Spectrum Therapeutic Strategy. ACS Combinatorial Science 22, 297–305 (2020). URL https://doi.org/10.484
1021/acscombsci.0c00058.485
[56] Hallenbeck, K., Turner, D., Renslo, A. & Arkin, M. Targeting Non-Catalytic Cysteine Residues Through486
Structure-Guided Drug Discovery. Current Topics in Medicinal Chemistry 17, 4–15 (2017). URL https:487
//doi.org/10.2174/1568026616666160719163839.488
[57] Carli, M., Sormani, G., Rodriguez, A. & Laio, A. Candidate Binding Sites for Allosteric Inhibition of the489
SARS-CoV - 2 Main Protease from the Analysis of Large-Scale Molecular Dynamics Simulations. The Journal of490
Physical Chemistry Letters 12, 65–72 (2021). URL https://doi.org/10.1021/acs.jpclett.0c03182.491
[58] Krissinel, E. & Henrick, K. Inference of Macromolecular Assemblies from Crystalline State. Journal of Molecular492
Biology 372, 774–797 (2007). URL https://doi.org/10.1016/j.jmb.2007.05.022.493
[59] Berman, H. M. et al. The Protein Data Bank. Nucleic Acids Research 28, 235–242 (2000). URL https:494
//doi.org/10.1093/nar/28.1.235.495
[60] Mersmann, S. et al. ProteinLens: a web-based application for the analysis of allosteric signalling on atomistic496
graphs of biomolecules (2020). URL https://doi.org/10.6084/m9.figshare.12369125.v1.497
[61] Word, J., Lovell, S. C., Richardson, J. S. & Richardson, D. C. Asparagine and glutamine: using hydrogen atom498
contacts in the choice of side-chain amide orientation. Journal of Molecular Biology 285, 1735–1747 (1999).499
URL https://doi.org/10.1006/jmbi.1998.2401.500
[62] Huheey, J. E., Keiter, E. A. & Keiter, R. L. Inorganic chemistry: principles of structure and reactivity (Harper-501
Collins College Publishers, New York, NY, 1993).502
[63] Mayo, S. L., Olafson, B. D. & Goddard, W. A. DREIDING: A generic force field for molecular simulations.503
Journal of Physical Chemistry 94, 8897–8909 (1990). URL https://doi.org/10.1021/j100389a010.504
[64] Dahiyat, B. I., Gordon, D. B. & Mayo, S. L. Automated design of the surface positions of protein helices. Protein505
Science 6, 1333–1337 (1997). URL https://doi.org/10.1002/pro.5560060622.506
[65] Lin, M. S., Fawzi, N. L. & Head-Gordon, T. Hydrophobic Potential of Mean Force as a Solvation Function for507
Protein Structure Prediction. Structure 15, 727–740 (2007). URL https://doi.org/10.1016/j.str.2007.508
05.004.509
[66] Schaub, M. T., Lehmann, J., Yaliraki, S. N. & Barahona, M. Structure of complex networks: Quantifying510
edge-to-edge relations by failure-induced flow redistribution. Network Science 2, 66–89 (2014). URL https:511
//doi.org/10.1017/nws.2014.4.512
[67] Biggs, N. Algebraic graph theory, vol. 67 (Cambridge university press, 1993).513
[68] Lambiotte, R., Delvenne, J. & Barahona, M. Random Walks, Markov Processes and the Multiscale Modular514
Organization of Complex Networks. IEEE Transactions on Network Science and Engineering 1, 76–90 (2014).515
URL https://doi.org/10.1109/TNSE.2015.2391998.516
[69] Koenker, R. & Hallock, K. F. Quantile Regression. Journal of Economic Perspectives 15, 143–156 (2001). URL517
https://doi.org/10.1257/jep.15.4.143.518
[70] Koenker, R. quantreg: Quantile Regression. R package version 5.52 (2019). URL https://cran.r-project.519
org/package=quantreg.520
[71] Amor, B. R. C. Exploring allostery in proteins with graph theory. Ph.D. thesis, Imperial College London (2016).521
URL https://doi.org/10.25560/58214.522
[72] Schrodinger/pymol-open-source. Open-source foundation of the user-sponsored PyMOL molecular visualization523
system. (2020). URL https://github.com/schrodinger/pymol-open-source.524
14

Figures
Figure 1
Overview of the SARS-CoV-2 main protease dimer. Atomic coordinates are obtained from the PDB file(PDB ID: 6Y2E). A) shows the full dimer with the active site residues on both monomers shown asspheres. The second monomer is shown with increased transparency to visualise where the monomersinteract. Colours are according to domain: Domain I residues 10 to 99 -dark green, domain II residues 100to 182 - dark blue, domain III residues 198 to 303 - orange, loops in light green. B) Zoom-in of the activesite with histidine 41 and cysteine 145 forming a catalytic dyad which is extended to a triad by a watermolecule in close proximity.

Figure 2
Bond-to-bond propensities of the SARS-CoV-2 Mpro sourced from the orthosteric sites. The residues ofthe protease (PDB ID: 6Y2E [11]) viewed from the front (A) and top (B) are coloured according to theirpropensity value. The source sites (shown in green) are the catalytically active residues His41 andCys145 in both chains of the homodimer. All other residues are coloured by their quantile score as per thecolourbar. There are two main areas of interest with high propensity (Hotspot 1 indicated in A; Hotspot 2indicated in B) with important residues labelled. C) The propensity of each residue, IIR, is plotted againstthe distance of the residue from the orthosteric site. The dashed line indicates the quantile regressionestimate of the 0.95 quantile cutoff used to identify the significant residues in Table S2.

Figure 3
Putative allosteric sites identified by bond-to-bond propensities. Surface representation of the Mpro dimercoloured by quantile score (as shown in the legend). A) Rotated front view with site 1 (yellow) which islocated on the opposite of the orthosteric site (coloured in green). B) Top view with site 2 (pink) located inthe dimer interface. A detailed view of both sites is provided with important residues labelled.

Figure 4
Markov transient analysis of Mpro sourced from the orthosteric sites. The orthosteric sites are shown ingreen and include His41 and Cys145 in both chains of the homodimer (front A) view). B) The t1/2 valuesof each residue are plotted against their distance from the orthosteric site. The dashed line indicates thequantile regression estimate of the 0.95 quantile cutoff used for identifying significant residues. Thequantile scores of all residues are mapped onto the structure of the Mpro dimer (front A) view), colouredas shown in the legend. C) Surface representation of a rotated front view of the Mpro dimer coloured byquantile score. Site 3 (turquoise) and 4 (orange) are located on the opposite side of the active site(coloured in green). A detailed view of both sites is provided with important residues labelled.

Figure 5
Atomistic Graph Construction. We showcase the general procedure here on the main protease of SARS-Cov-2: Atomic coordinates are obtained from the PDB (ID: 6Y2E [11]) and hydrogens are added by Reduce[61]. Edges are identified and the weights are assigned, as described in the methods section, by takinginto account covalent bonds as well as weak interactions: hydrogen bonds, electrostatic interactions andthe hydrophobic effect which are coloured as indicated.
Supplementary Files
This is a list of supplementary �les associated with this preprint. Click to download.
siallosterymprocommbio.pdf