Embed Size (px)
Citation preview
Allocation of CO2 Emission Allowances
Karsten NeuhoffUniversity of Cambridge
The Cambridge-MITInstitute
Carnegie Mellon UniversityOctober 2004
In collaboration with Kim Keats, ICF Consulting, London.
See also CMI working paper 49 @ econ.cam.ac.uk/electricity
2
Outline
• CO2 emission reduction strategy
– Failure of voluntary commitments– Effectiveness of price mechanism– Separate environmental externalities from
technology policy (learning externalities)• The European Emission Trading Scheme• Impact of updating (conditional allowance allocation)• Impact of free allowance allocation to new entrants• Border tax adjustment to allow auction of allowances
and higher CO2 prices
3
European strategy to reduce CO2 emissions
• European Climate Change Program 2000• Bonn/Marrakech/EU required delivery of
Kyoto targets• After criticising US, policymakers had to show
action• Failure of voluntary commitments in 1990
4
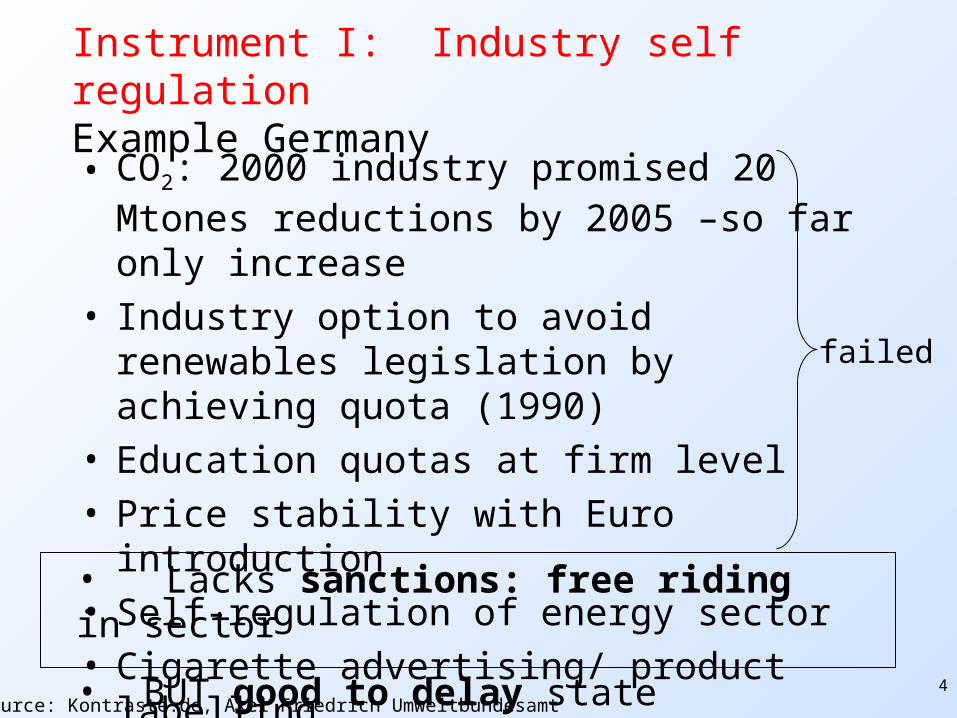
Instrument I: Industry self regulation Example Germany• CO2: 2000 industry promised 20 Mtones
reductions by 2005 –so far only increase• Industry option to avoid renewables
legislation by achieving quota (1990)• Education quotas at firm level • Price stability with Euro introduction• Self-regulation of energy sector• Cigarette advertising/ product labelling
Source: Kontraste.de, Axel Friedrich Umweltbundesamt
failed
• Lacks sanctions: free riding in sector
• BUT good to delay state intervention
5
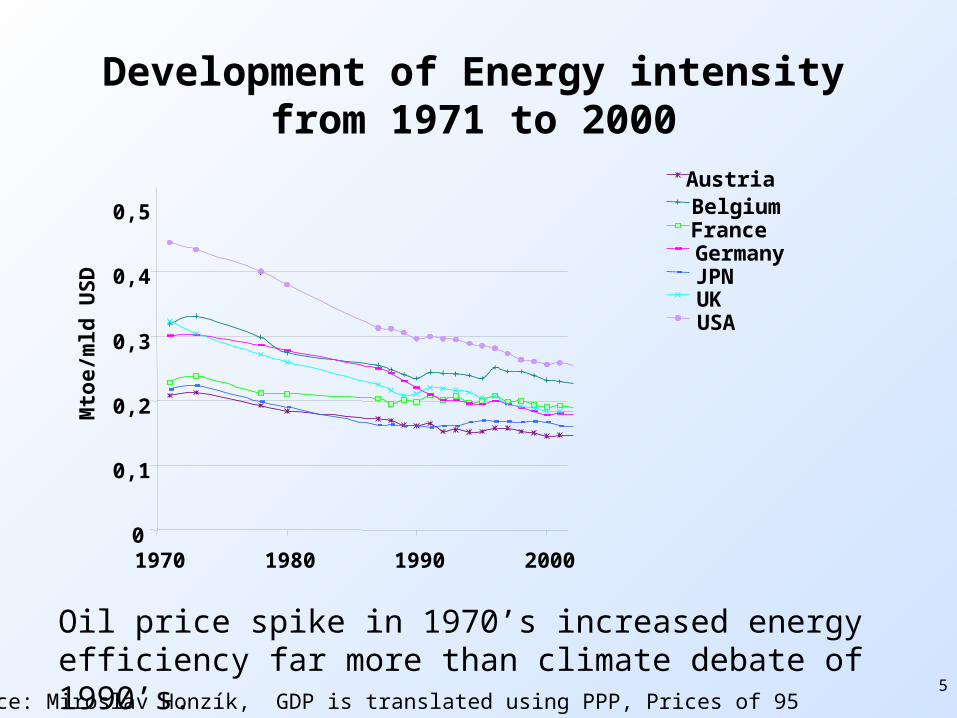
Development of Energy intensity from 1971 to 2000
0
0,1
0,2
0,3
0,4
0,5
1970 1980 1990 2000
Mto
e/m
ld U
SD
AustriaBelgiumFranceGermanyJPNUKUSA
Source: Miroslav Honzík, GDP is translated using PPP, Prices of 95
Oil price spike in 1970’s increased energy efficiency far more than climate debate of 1990’s.
6
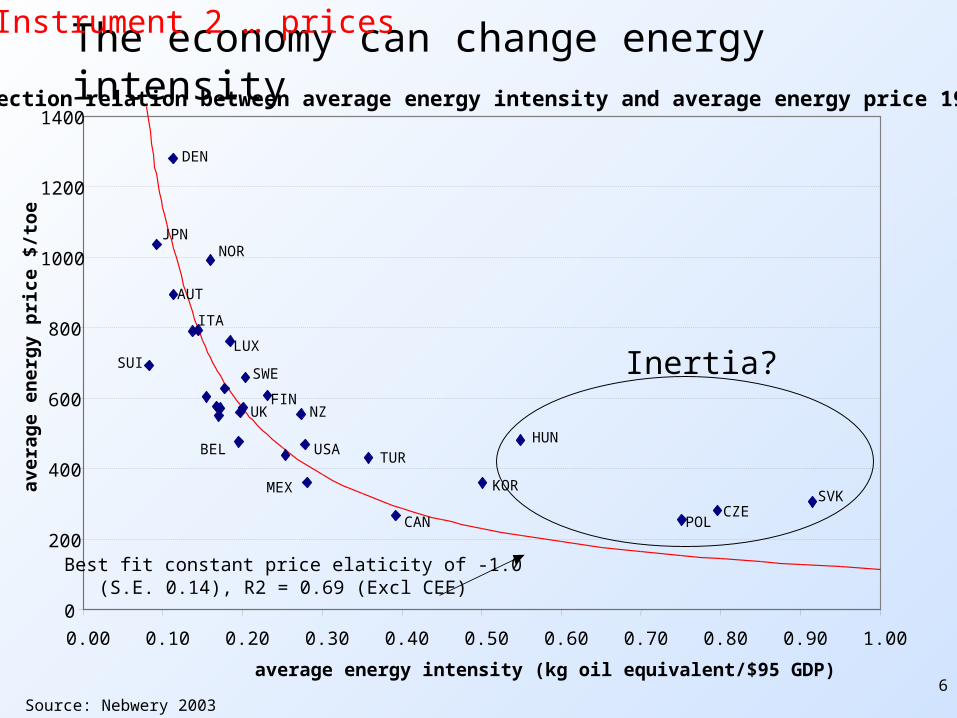
The economy can change energy intensity
0
200
400
600
800
1000
1200
1400
0.00 0.10 0.20 0.30 0.40 0.50 0.60 0.70 0.80 0.90 1.00
average energy intensity (kg oil equivalent/$95 GDP)
ave
rag
e en
erg
y p
rice
$/t
oe
Best fit constant price elaticity of -1.0 (S.E. 0.14), R2 = 0.69 (Excl CEE)
SVKCZE
POL
HUN
KOR
CAN
DEN
NORJPN
ITA
SUI
AUT
LUX
UK NZ
USATUR
FIN
SWE
BEL
MEX
Cross-section relation between average energy intensity and average energy price 1993-99
Source: Nebwery 2003
Inertia?
Instrument 2 … prices
7
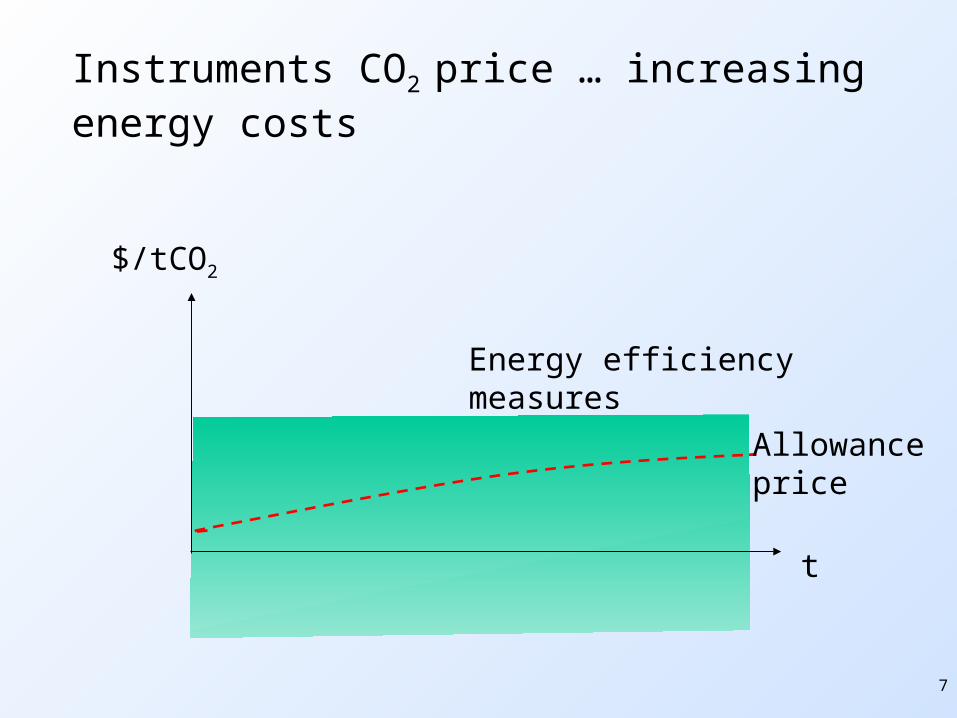
Instruments CO2 price … increasing energy costs
t
$/tCO2
Allowance price
Energy efficiencymeasures
8
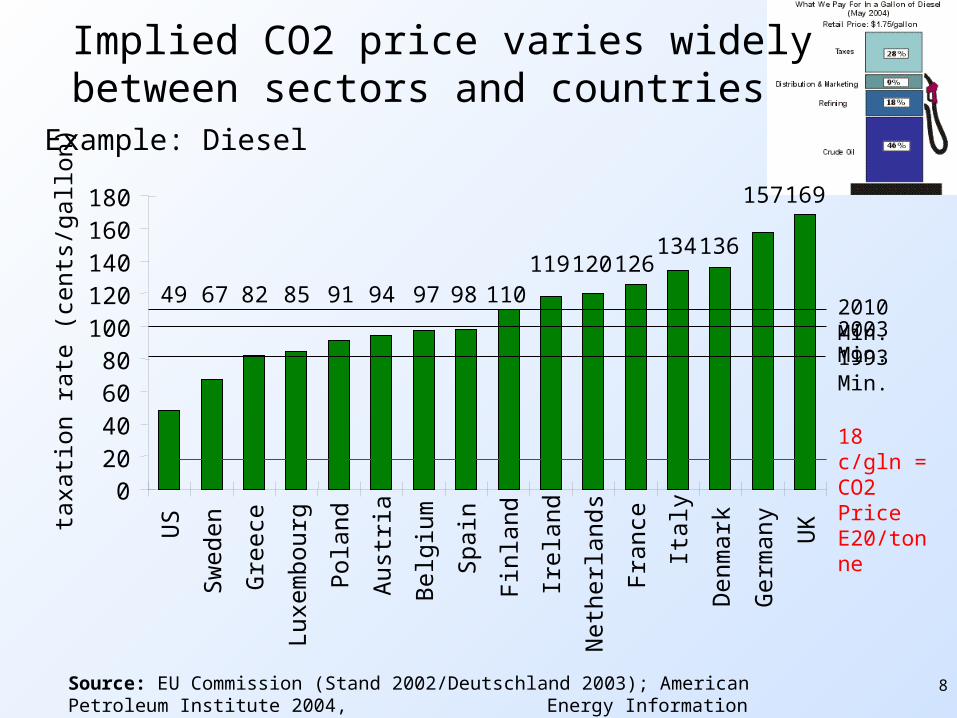
Implied CO2 price varies widely between sectors and countriesExample: Diesel
Source: EU Commission (Stand 2002/Deutschland 2003); American Petroleum Institute 2004, Energy Information Administration, 2004
UK
49 82119 120 126
134 136
157 169
94 97 9891 1108567
020406080
100120140160180
US
Sw
eden
Gre
ece
Luxe
mbo
urg
Pol
and
Aus
tria
Bel
gium
Spa
in
Fin
land
Irel
and
Net
herla
nds
Fra
nce
Ital
y
Den
mar
k
Ger
man
y
taxa
tion
rate
(ce
nts/
gallo
n)
2010 Min.2003 Min.1993 Min.
18 c/gln = CO2 Price E20/tonne
9
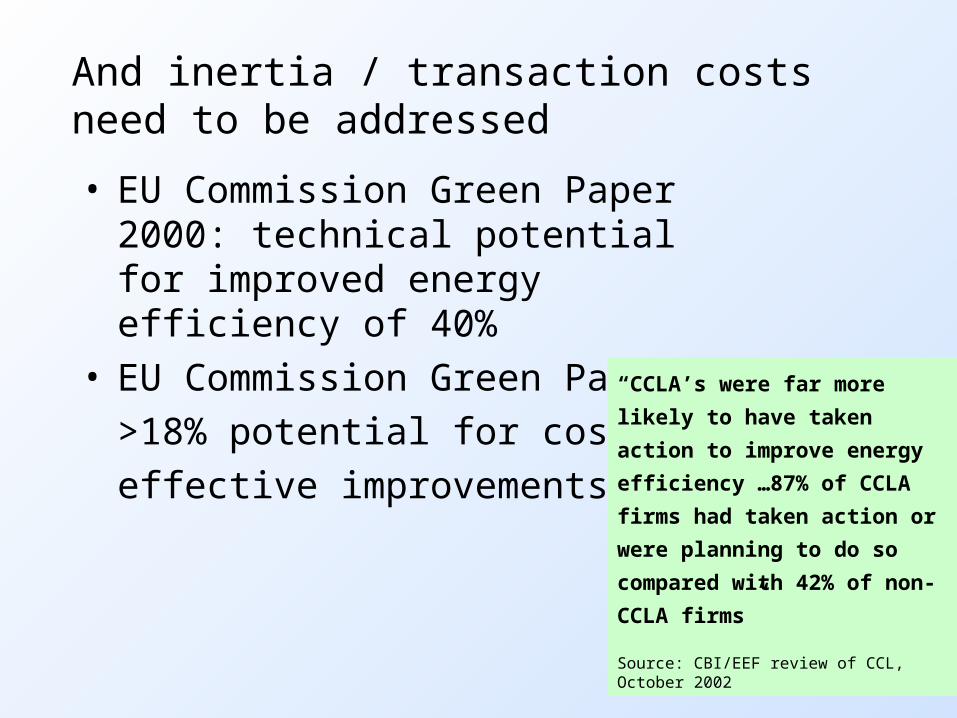
And inertia / transaction costs need to be addressed
• EU Commission Green Paper 2000: technical potential for improved energy efficiency of 40%
• EU Commission Green Paper:
>18% potential for cost
effective improvements
“CCLA’s were far more
likely to have taken action
to improve energy
efficiency …87% of CCLA
firms had taken action or
were planning to do so
compared with 42% of non-
CCLA firms”
Source: CBI/EEF review of CCL, October 2002
10
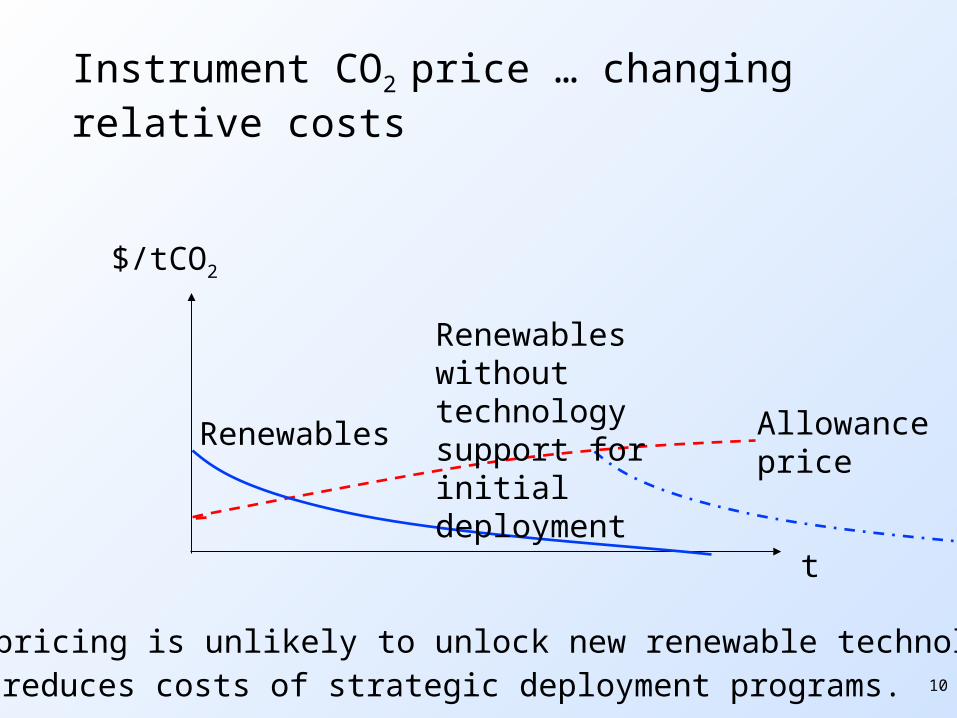
Instrument CO2 price … changing relative costs
t
$/tCO2
Allowance price
Renewables
CO2 pricing is unlikely to unlock new renewable technologies.But reduces costs of strategic deployment programs.
Renewables without technology support for initial deployment
11
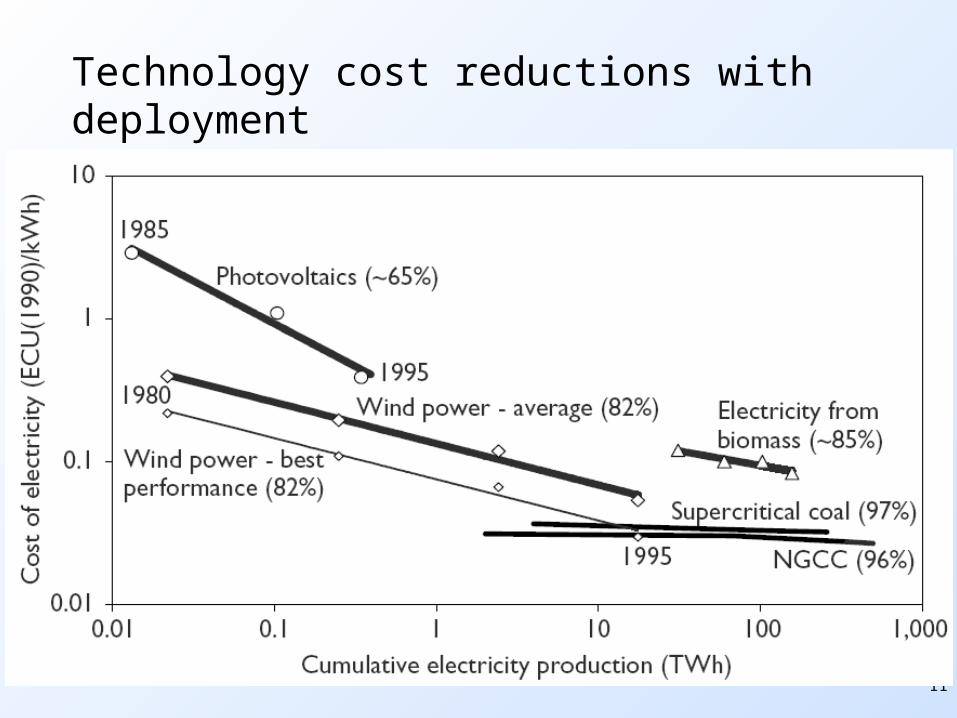
Technology cost reductions with deployment
12
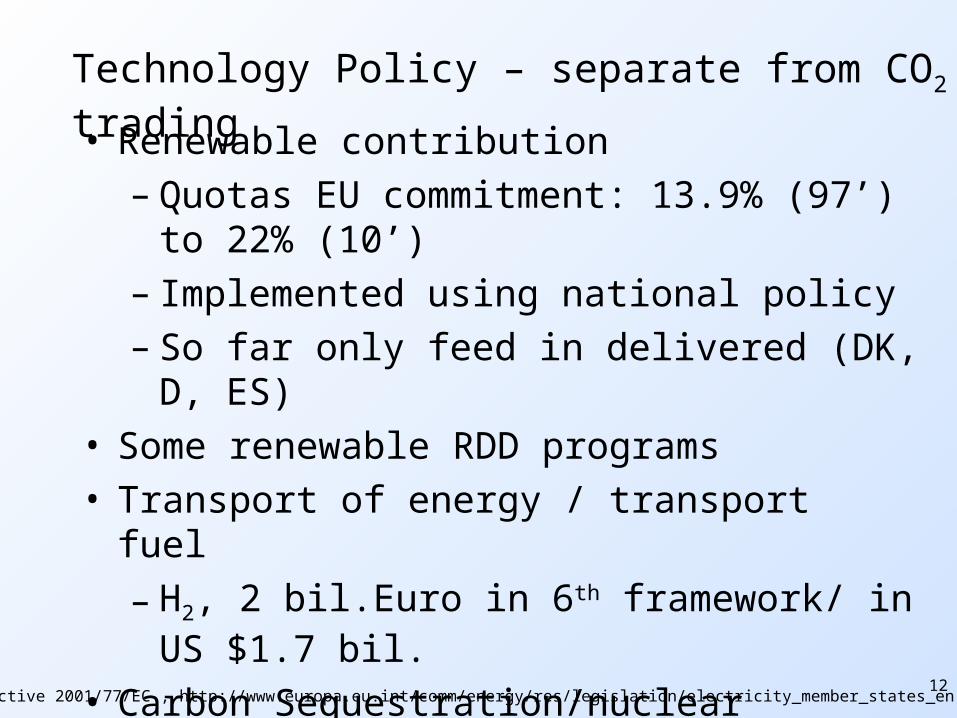
Technology Policy – separate from CO2 trading• Renewable contribution
– Quotas EU commitment: 13.9% (97’) to 22% (10’)
– Implemented using national policy – So far only feed in delivered (DK, D, ES)
• Some renewable RDD programs• Transport of energy / transport fuel
– H2, 2 bil.Euro in 6th framework/ in US $1.7 bil.
• Carbon Sequestration/nuclear perceived as marginal– Public concerns about leakage
Source: Directive 2001/77/EC , http://www.europa.eu.int/comm/energy/res/legislation/electricity_member_states_en.htm
13
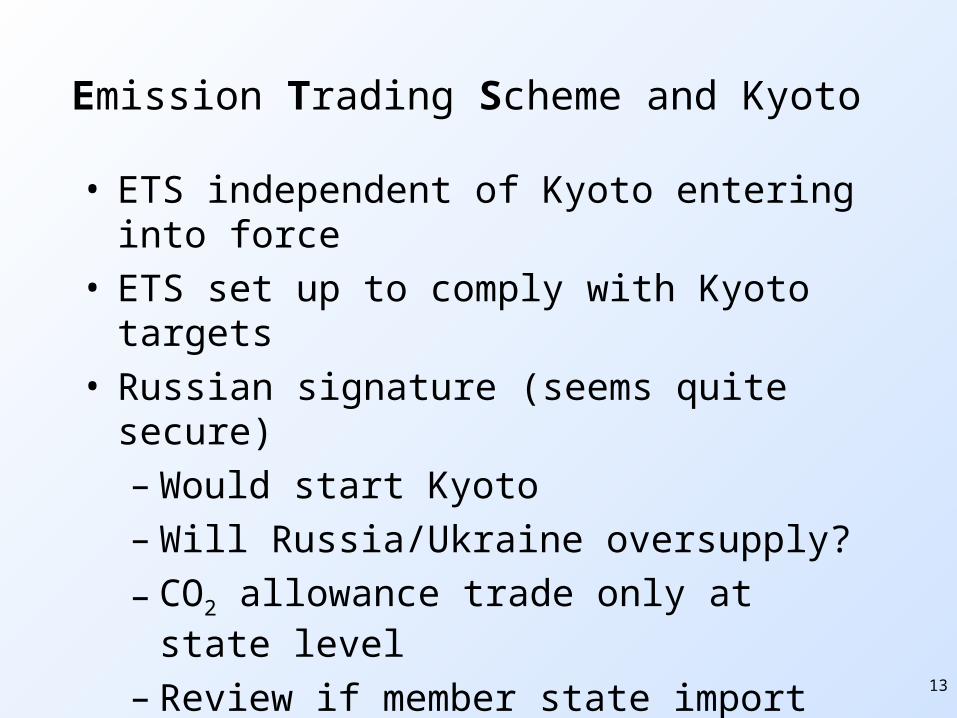
Emission Trading Scheme and Kyoto
• ETS independent of Kyoto entering into force• ETS set up to comply with Kyoto targets• Russian signature (seems quite secure)
– Would start Kyoto– Will Russia/Ukraine oversupply?
– CO2 allowance trade only at state level
– Review if member state import more than 6% of allowances.
– Limit imports to keep carbon price up• US participation would increase carbon price
14
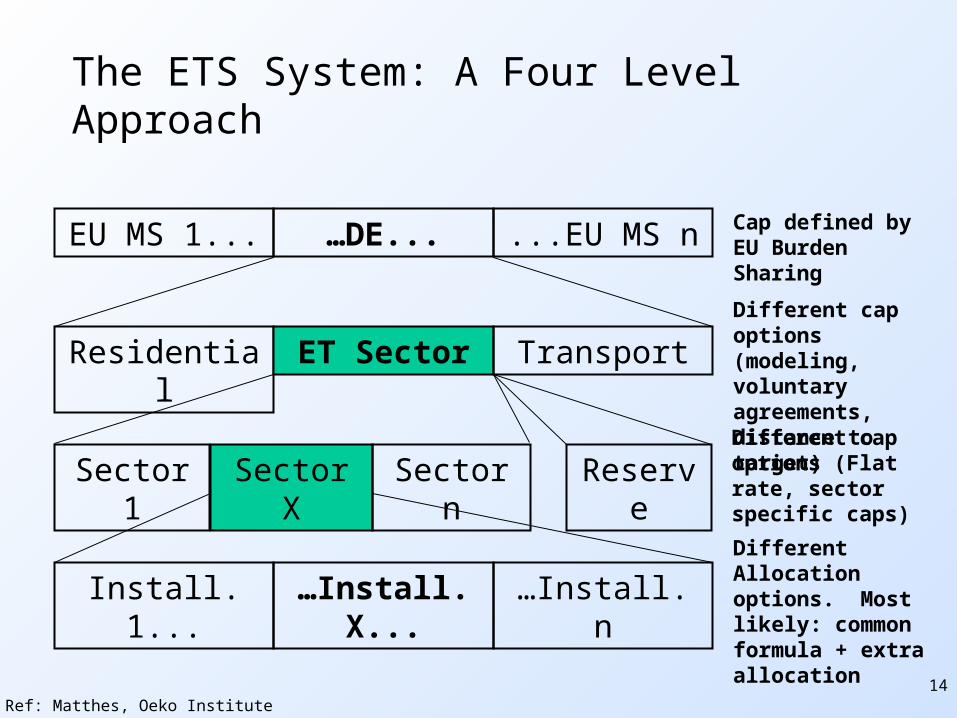
The ETS System: A Four Level Approach
EU MS 1... …DE... ...EU MS n
Install. 1... …Install. X... …Install. n
Residential ET Sector Transport
Sector 1 Sector X Sector n Reserve
Cap defined by EU Burden Sharing
Different cap options (modeling, voluntary agreements, distance to target)
Different cap options (Flat rate, sector specific caps)
Different Allocation options. Most likely: common formula + extra allocation
Ref: Matthes, Oeko Institute
15
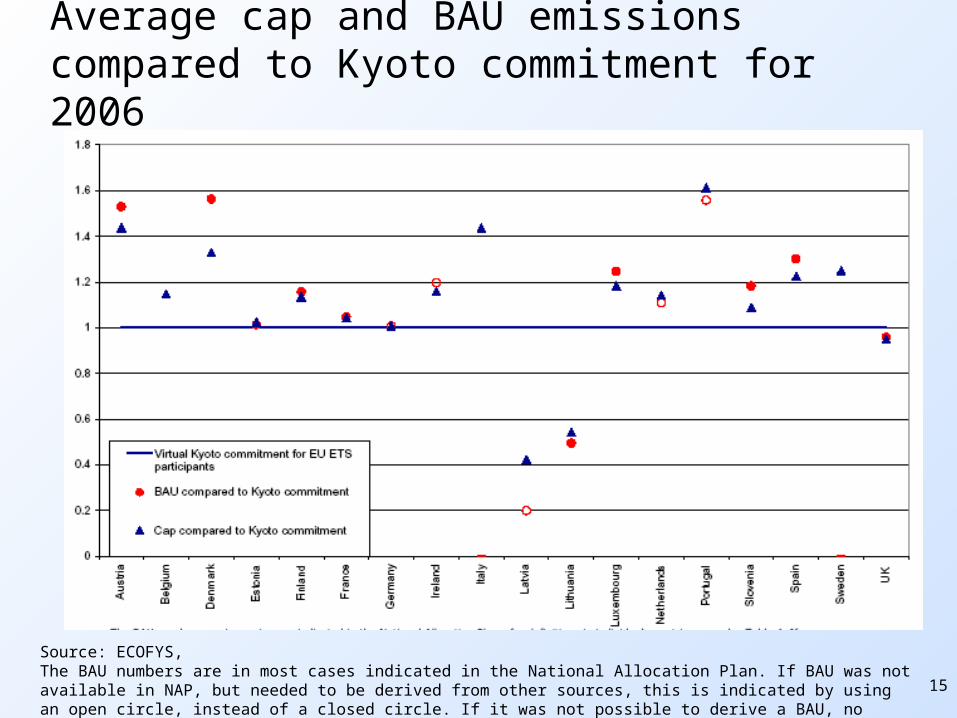
Average cap and BAU emissions compared to Kyoto commitment for 2006
Source: ECOFYS,The BAU numbers are in most cases indicated in the National Allocation Plan. If BAU was not available in NAP, but needed to be derived from other sources, this is indicated by using an open circle, instead of a closed circle. If it was not possible to derive a BAU, no circle is given for that specific country.
16
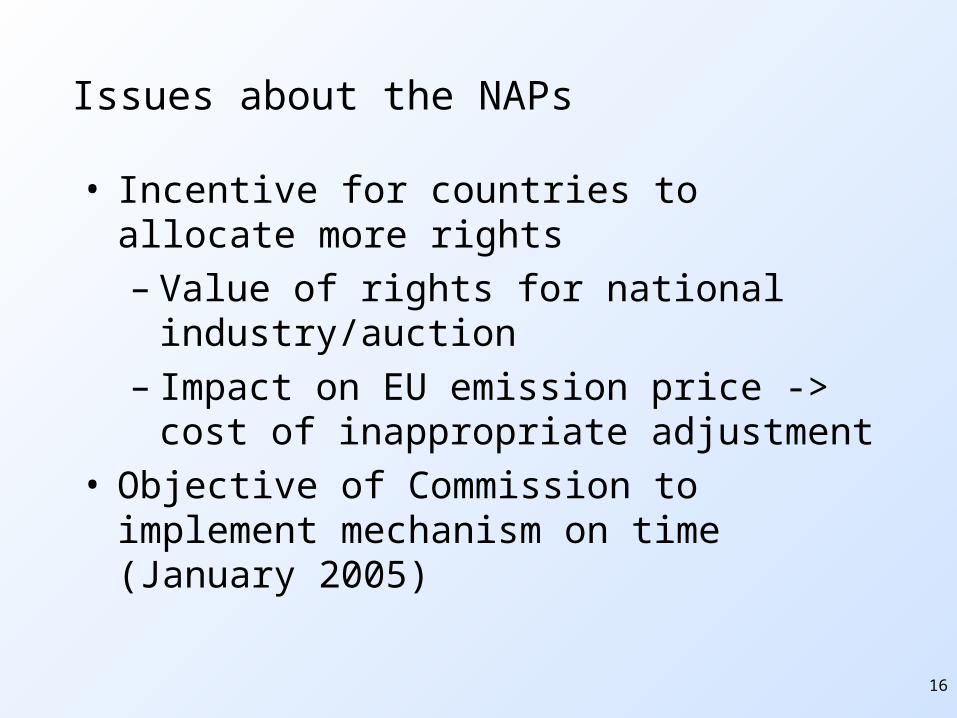
Issues about the NAPs
• Incentive for countries to allocate more rights– Value of rights for national industry/auction– Impact on EU emission price -> cost of
inappropriate adjustment• Objective of Commission to implement
mechanism on time (January 2005)
17
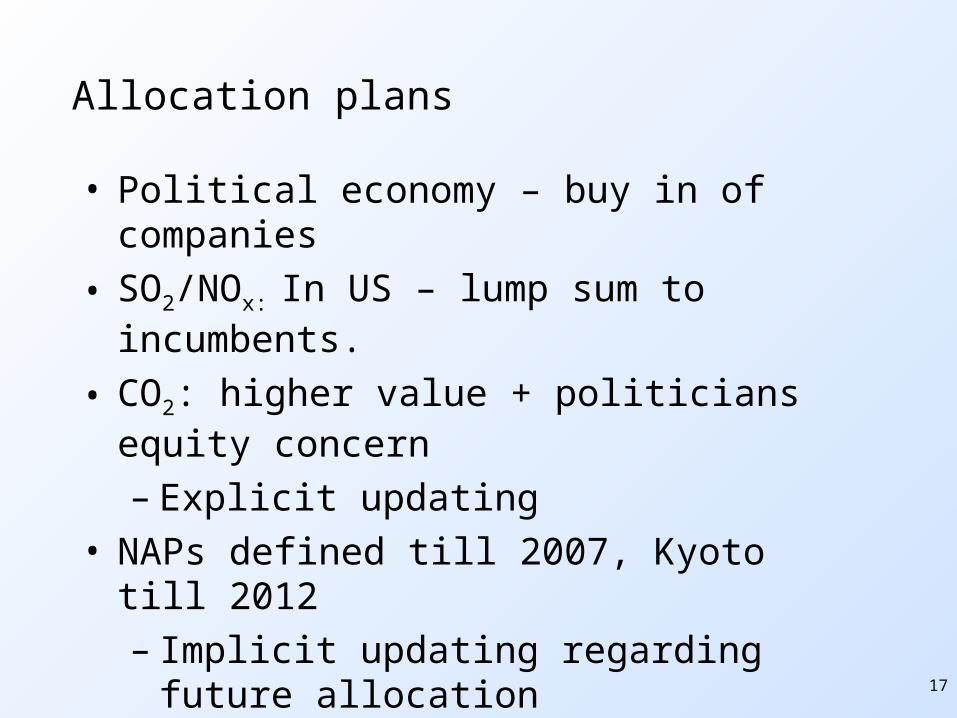
Allocation plans
• Political economy – buy in of companies
• SO2/NOx: In US – lump sum to incumbents.
• CO2: higher value + politicians equity concern
– Explicit updating• NAPs defined till 2007, Kyoto till 2012
– Implicit updating regarding future allocation• New Entrant provisions
– Regional competition or Coal support?
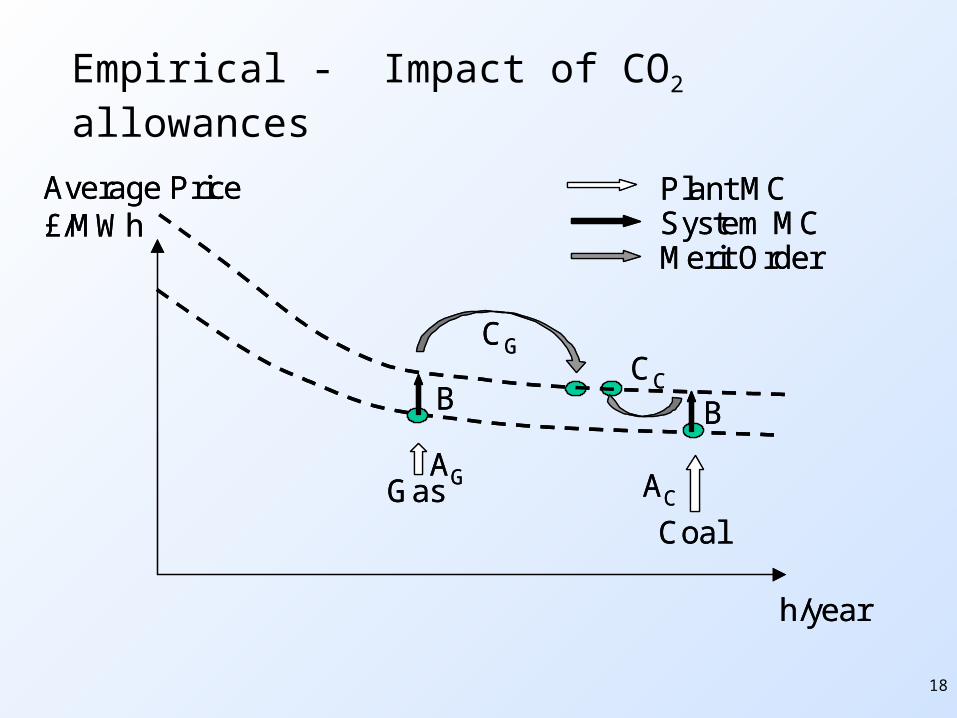
18
System MCMerit Order
Plant MC
CoalGas
Average Price£/MWh
h/year
AG AC
B
CGCC
B
System MCMerit Order
Plant MC
CoalGas
Average Price£/MWh
h/year
AG AC
B
CGCC
B
Empirical - Impact of CO2 allowances
19
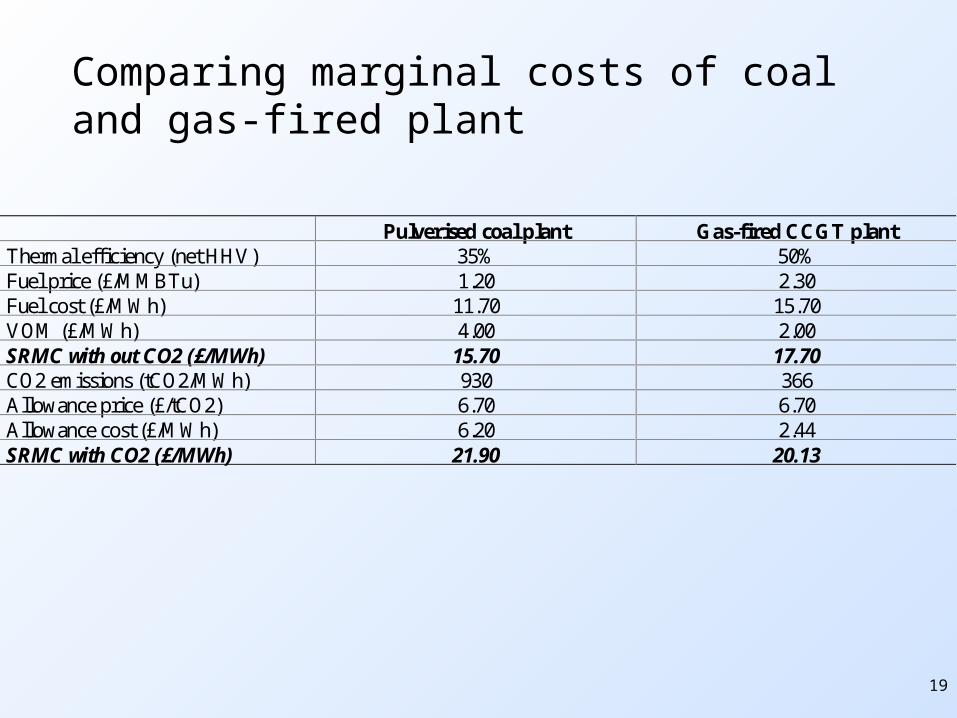
Comparing marginal costs of coal and gas-fired plant
Pulverised coal plant Gas-fired CCGT plant Thermal efficiency (net HHV) 35% 50% Fuel price (£/MMBTu) 1.20 2.30 Fuel cost (£/MWh) 11.70 15.70 VOM (£/MWh) 4.00 2.00 SRMC with out CO2 (£/MWh) 15.70 17.70 CO2 emissions (tCO2/MWh) 930 366 Allowance price (£/tCO2) 6.70 6.70 Allowance cost (£/MWh) 6.20 2.44 SRMC with CO2 (£/MWh) 21.90 20.13
20
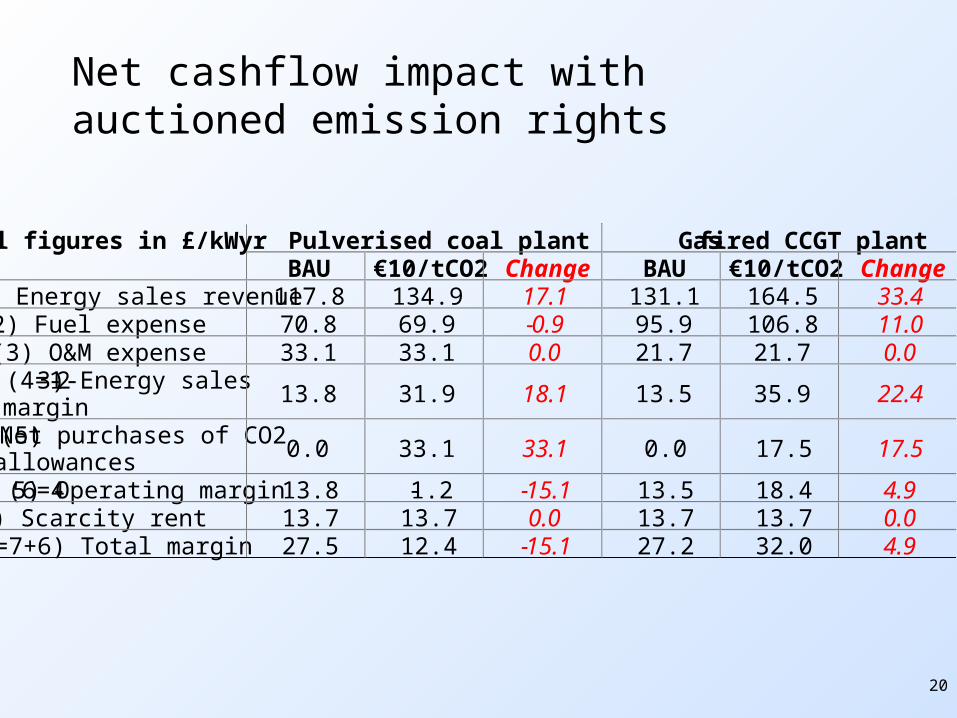
Net cashflow impact with auctioned emission rights
Pulverised coal plant Gas-fired CCGT plant All figures in £/kWyr BAU €10/tCO2 Change BAU €10/tCO2 Change
(1) Energy sales revenue 117.8 134.9 17.1 131.1 164.5 33.4 (2) Fuel expense 70.8 69.9 -0.9 95.9 106.8 11.0 (3) O&M expense 33.1 33.1 0.0 21.7 21.7 0.0 (4=1-2-3) Energy sales margin
13.8 31.9 18.1 13.5 35.9 22.4
(5) Net purchases of CO2 allowances
0.0 33.1 33.1 0.0 17.5 17.5
(6=4-5) Operating margin 13.8 -1.2 -15.1 13.5 18.4 4.9 (7) Scarcity rent 13.7 13.7 0.0 13.7 13.7 0.0 (8=7+6) Total margin 27.5 12.4 -15.1 27.2 32.0 4.9
21
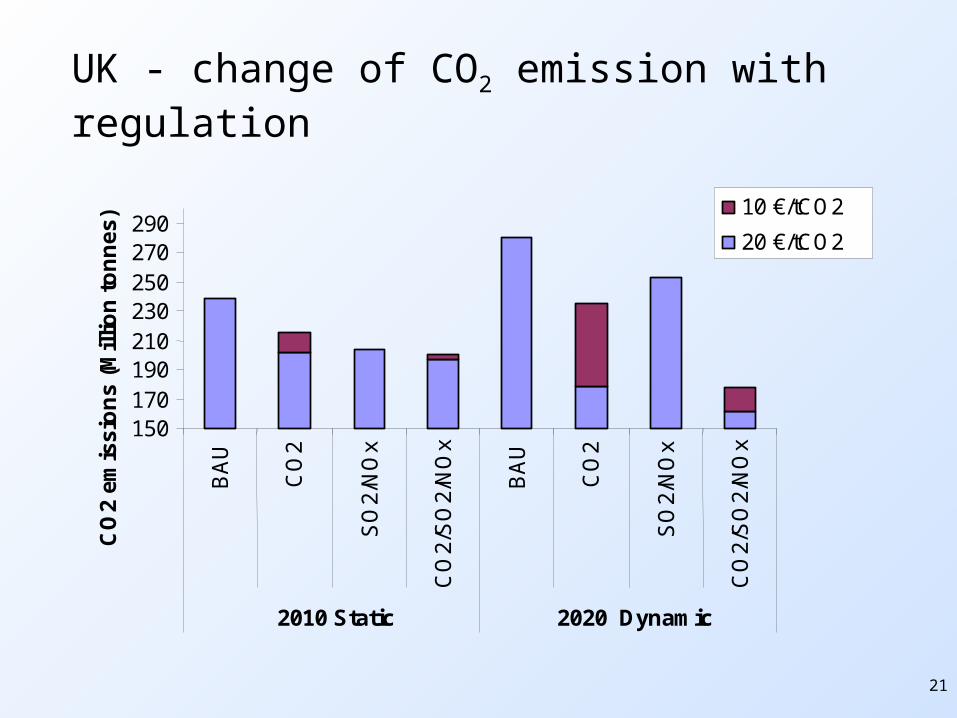
UK - change of CO2 emission with regulation
150170190210230250270290
BA
U
CO
2
SO
2/N
Ox
CO
2/S
O2/
NO
x
BA
U
CO
2
SO
2/N
Ox
CO
2/S
O2/
NO
x
2010 Static 2020 Dynamic
CO
2 e
mis
sio
ns
(Mil
lion
to
nn
es) 10 €/tCO2
20 €/tCO2
22
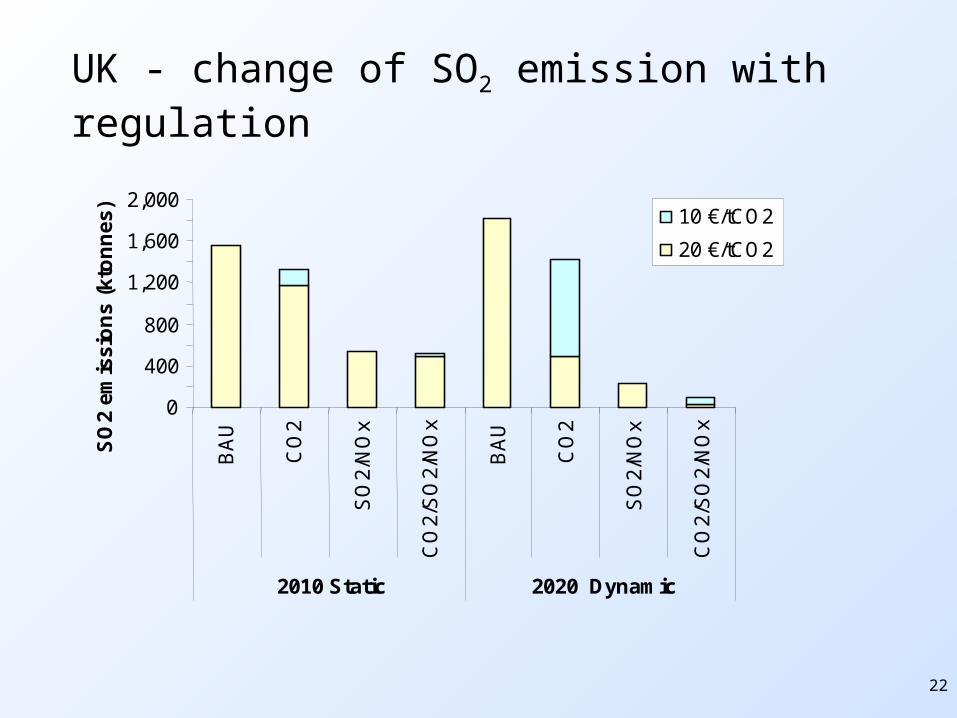
UK - change of SO2 emission with regulation
0
400
800
1,200
1,600
2,000B
AU
CO
2
SO
2/N
Ox
CO
2/S
O2/
NO
x
BA
U
CO
2
SO
2/N
Ox
CO
2/S
O2/
NO
x
2010 Static 2020 Dynamic
SO
2 em
issi
on
s (k
ton
nes
)
10 €/tCO2
20 €/tCO2
23
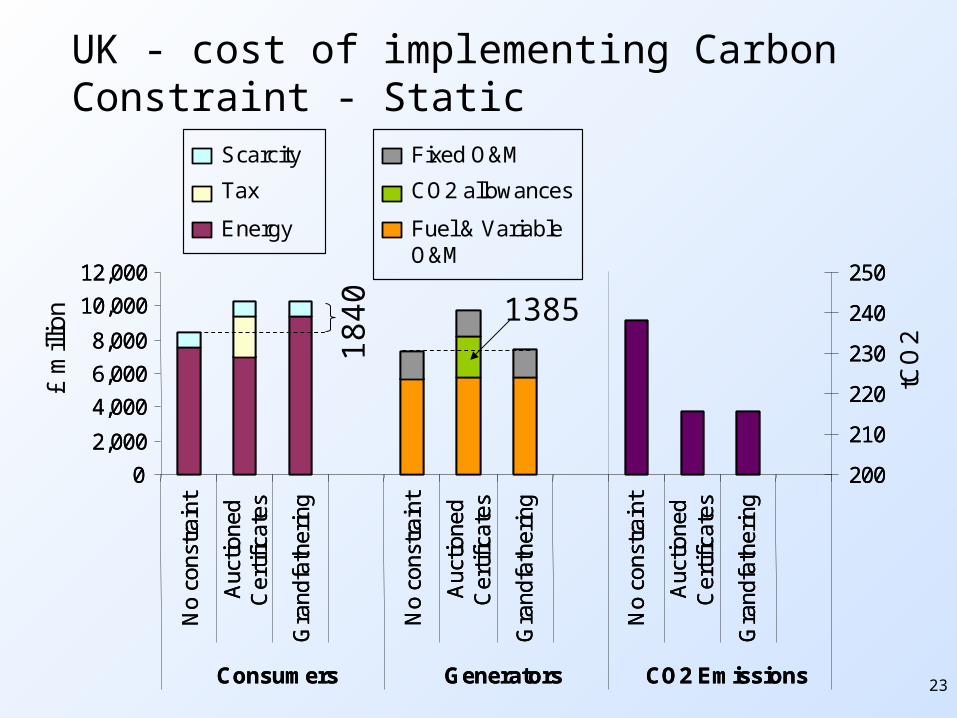
UK - cost of implementing Carbon Constraint - Static
0
2,000
4,000
6,000
8,000
10,000
12,000
No
cons
trai
nt
Auc
tione
dC
ertif
icat
es
Gra
ndfa
ther
ing
No
cons
trai
nt
Auc
tione
dC
ertif
icat
es
Gra
ndfa
ther
ing
No
cons
trai
nt
Auc
tione
dC
ertif
icat
es
Gra
ndfa
ther
ing
Consumers Generators CO2 Emissions
200
210
220
230
240
250
Scarcity
Tax
Energy
0
2,000
4,000
6,000
8,000
10,000
12,000
No
cons
trai
nt
Auc
tione
dC
ertif
icat
es
Gra
ndfa
ther
ing
No
cons
trai
nt
Auc
tione
dC
ertif
icat
es
Gra
ndfa
ther
ing
No
cons
trai
nt
Auc
tione
dC
ertif
icat
es
Gra
ndfa
ther
ing
Consumers Generators CO2 Emissions
200
210
220
230
240
250
£ m
illio
n
tCO
2
Fixed O&M
CO2 allowances
Fuel & Variable O&M
1840 1385
24
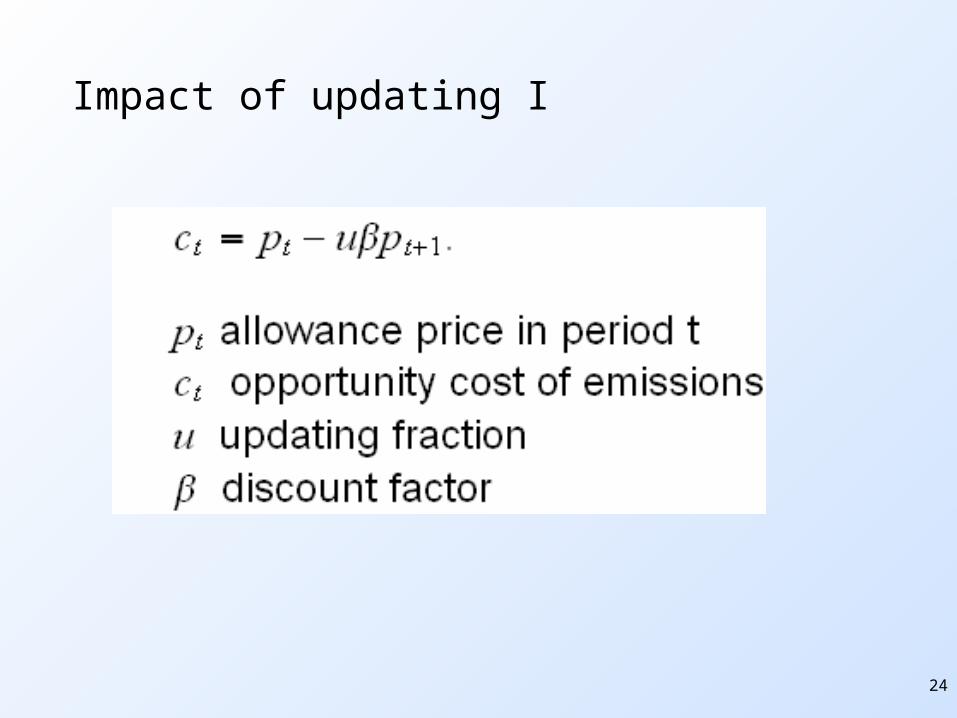
Impact of updating I
25
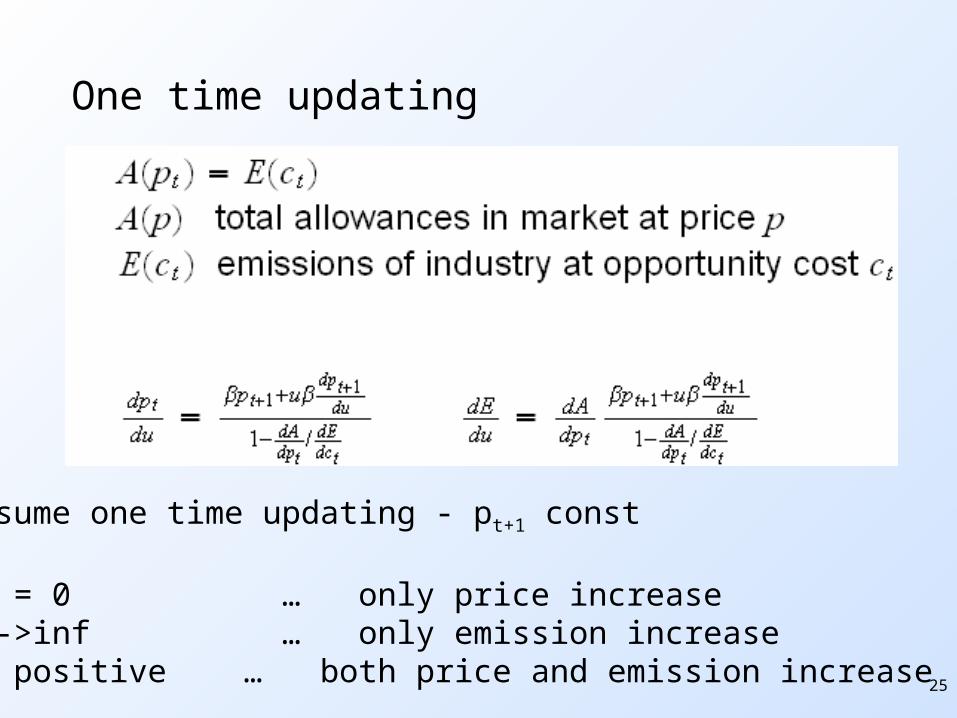
One time updating
Assume one time updating - pt+1 const
A’ = 0 … only price increaseA’->inf … only emission increaseA’ positive … both price and emission increase
26
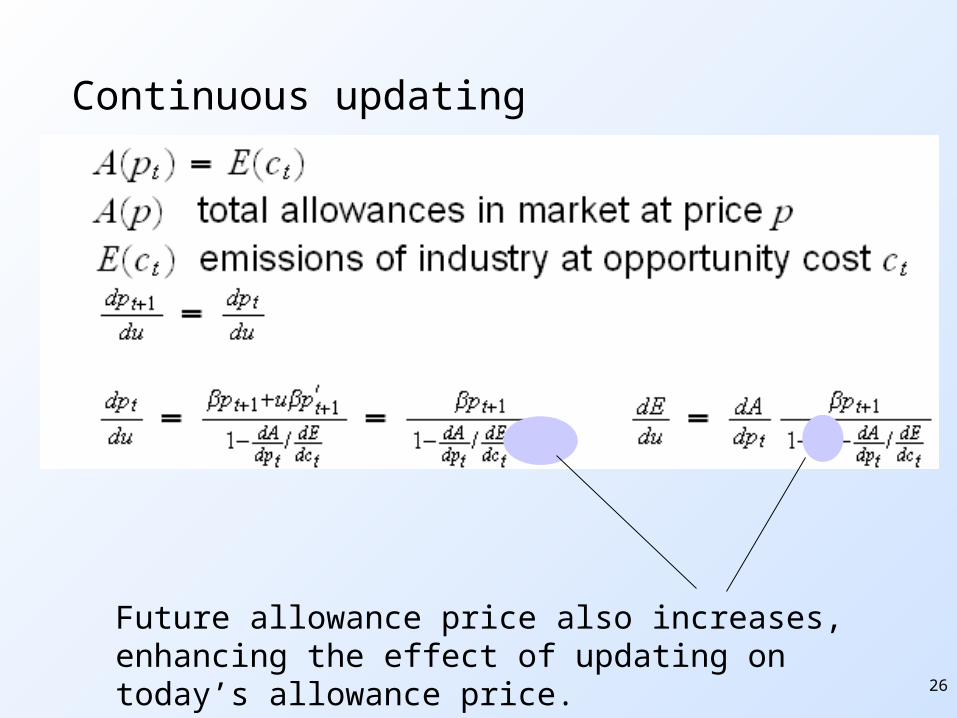
Continuous updating
Future allowance price also increases, enhancing the effect of updating on today’s allowance price.
27
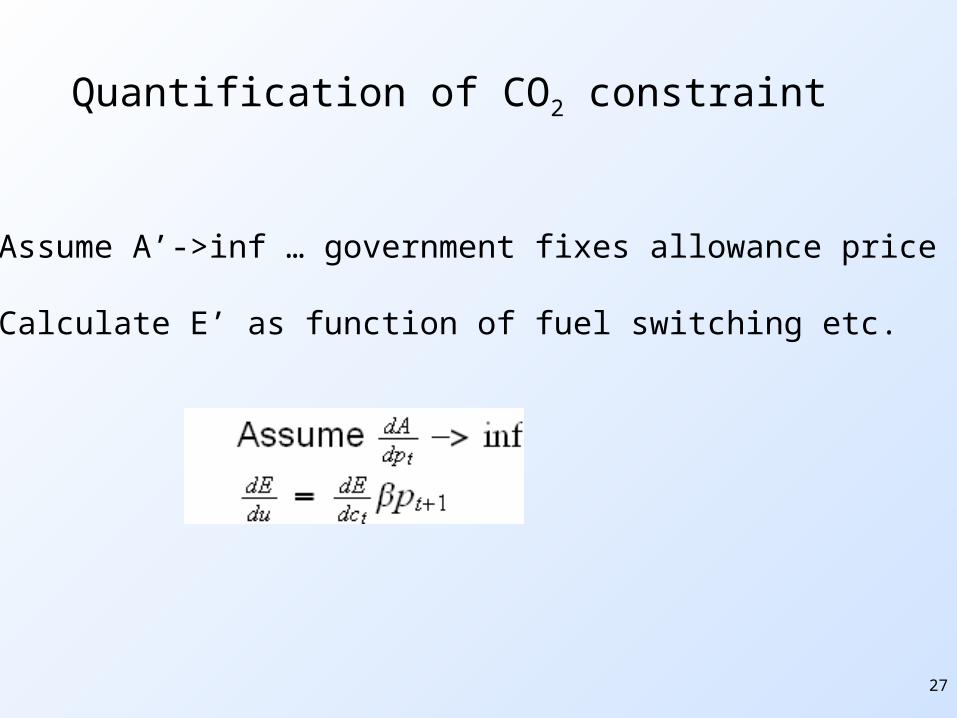
Quantification of CO2 constraint
Assume A’->inf … government fixes allowance price
Calculate E’ as function of fuel switching etc.
28
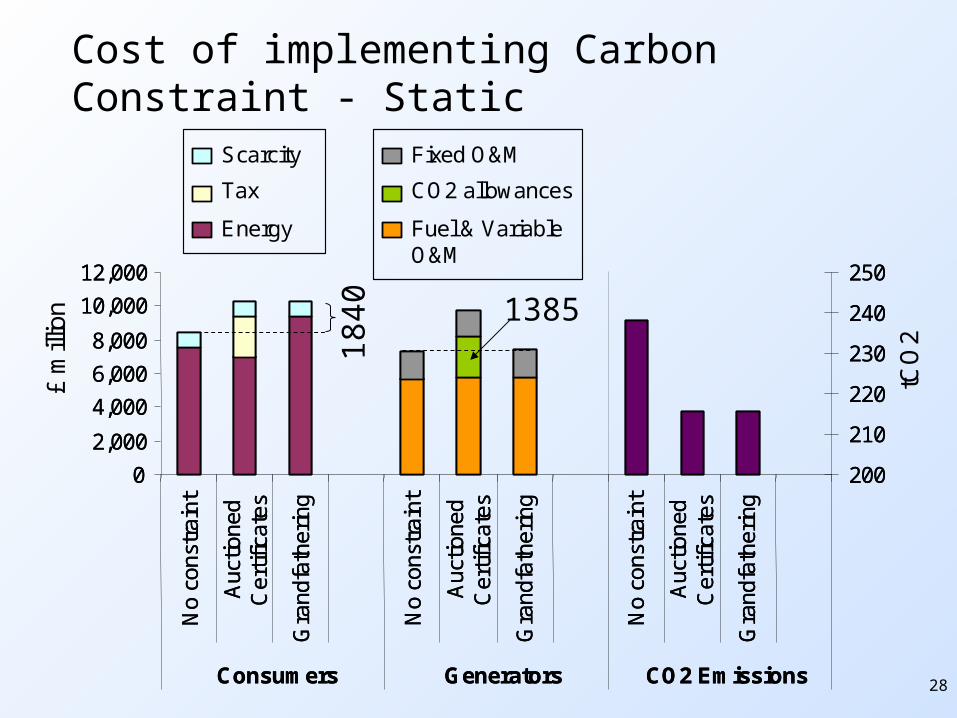
Cost of implementing Carbon Constraint - Static
0
2,000
4,000
6,000
8,000
10,000
12,000
No
cons
trai
nt
Auc
tione
dC
ertif
icat
es
Gra
ndfa
ther
ing
No
cons
trai
nt
Auc
tione
dC
ertif
icat
es
Gra
ndfa
ther
ing
No
cons
trai
nt
Auc
tione
dC
ertif
icat
es
Gra
ndfa
ther
ing
Consumers Generators CO2 Emissions
200
210
220
230
240
250
Scarcity
Tax
Energy
0
2,000
4,000
6,000
8,000
10,000
12,000
No
cons
trai
nt
Auc
tione
dC
ertif
icat
es
Gra
ndfa
ther
ing
No
cons
trai
nt
Auc
tione
dC
ertif
icat
es
Gra
ndfa
ther
ing
No
cons
trai
nt
Auc
tione
dC
ertif
icat
es
Gra
ndfa
ther
ing
Consumers Generators CO2 Emissions
200
210
220
230
240
250
£ m
illio
n
tCO
2
Fixed O&M
CO2 allowances
Fuel & Variable O&M
1840 1385
29
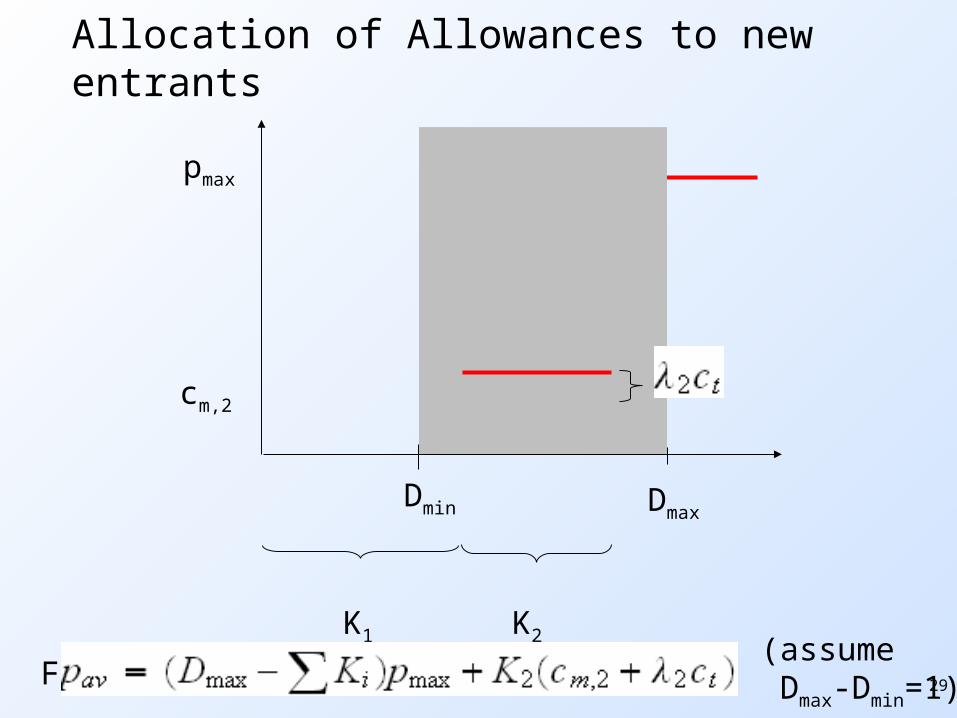
Allocation of Allowances to new entrants
K1 K2
Dmin Dmax
pmax
cm,2
Fixed costs: cf,1 cf,2
(assume Dmax-Dmin=1)
30
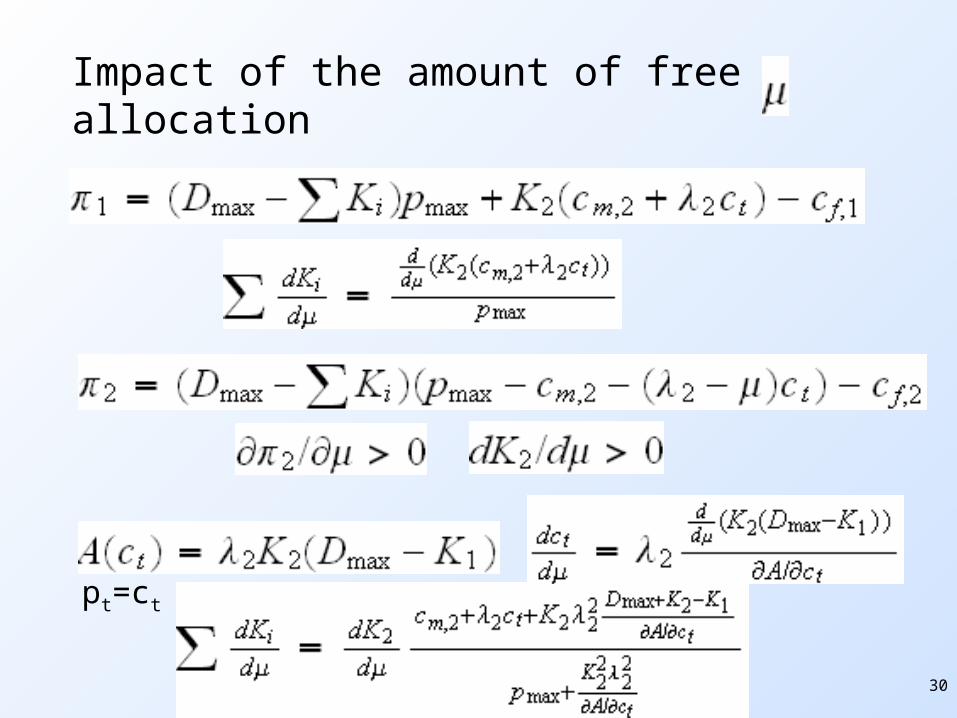
Impact of the amount of free allocation
pt=ct
31
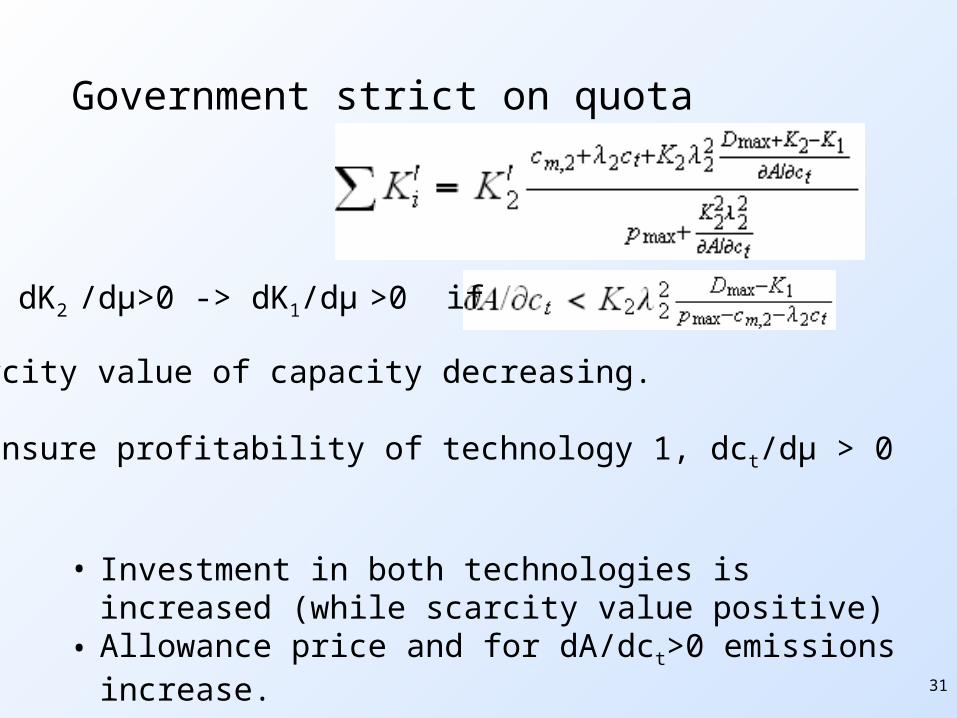
Government strict on quota
dK2 /dμ>0 -> dK1/dμ >0 if
Scarcity value of capacity decreasing.
To ensure profitability of technology 1, dct/dμ > 0
• Investment in both technologies is increased (while scarcity value positive)
• Allowance price and for dA/dct>0 emissions increase.
32
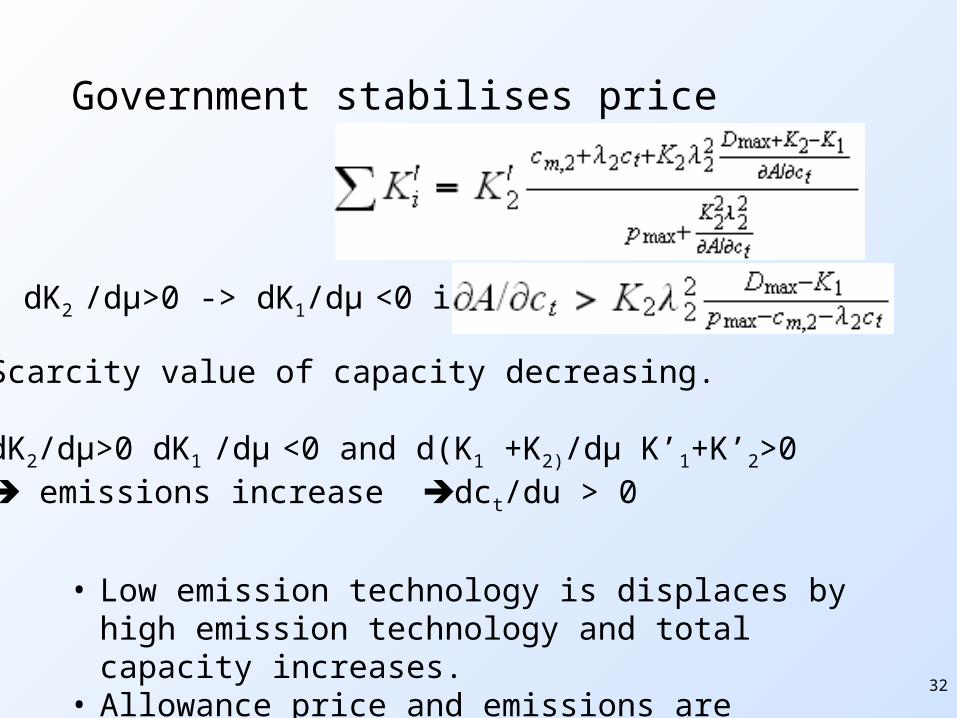
Government stabilises price
dK2 /dμ>0 -> dK1/dμ <0 if
Scarcity value of capacity decreasing.
dK2/dμ>0 dK1 /dμ <0 and d(K1 +K2)/dμ K’1+K’2>0 emissions increase dct/du > 0
• Low emission technology is displaces by high emission technology and total capacity increases.
• Allowance price and emissions are increased.
33
Impact of Allocation Rules on UK Wholesale Prices
10
15
20
25
30
35
40
2004 2005-2007 2008-2012 2013-2017
All
-in
Pri
ce
(€
/MW
h)
No closure test/No NER
Closure test/No NER
Closure test/NER
BAU
Price reflects energy-weighted average wholesale power price across UK assuming a CO2 price of 10€/tonne. Source: ICF Consulting, March 2004.
34
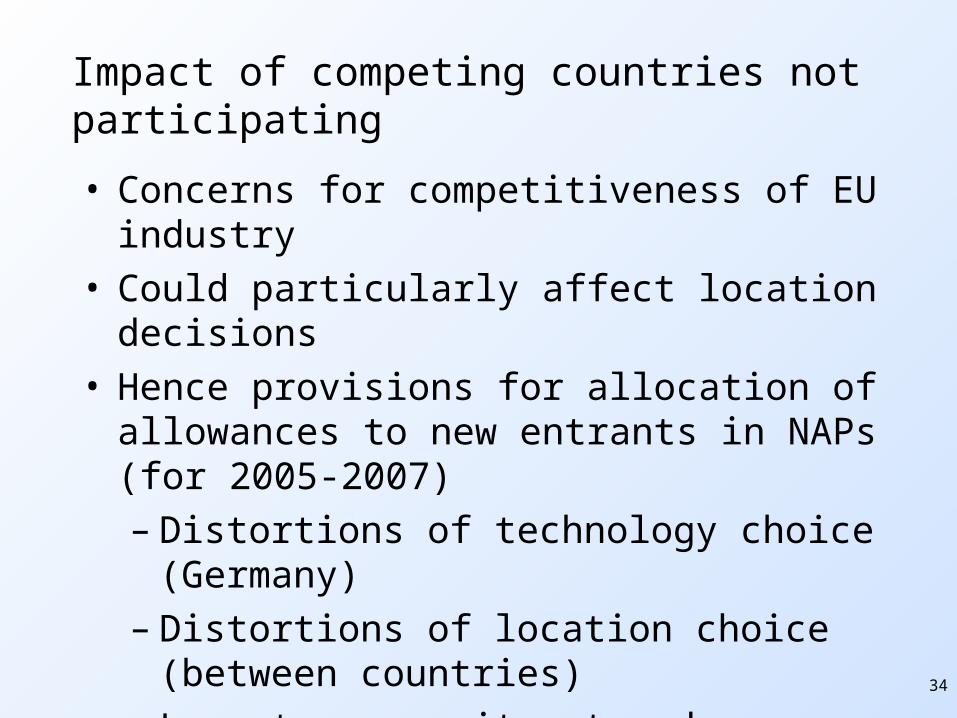
Impact of competing countries not participating
• Concerns for competitiveness of EU industry• Could particularly affect location decisions• Hence provisions for allocation of allowances to
new entrants in NAPs (for 2005-2007)– Distortions of technology choice (Germany)– Distortions of location choice (between
countries)– Long-term commitment reduces policy options– How many reserves to retain for entrants?
• Updating provisions – reduce effectiveness
35
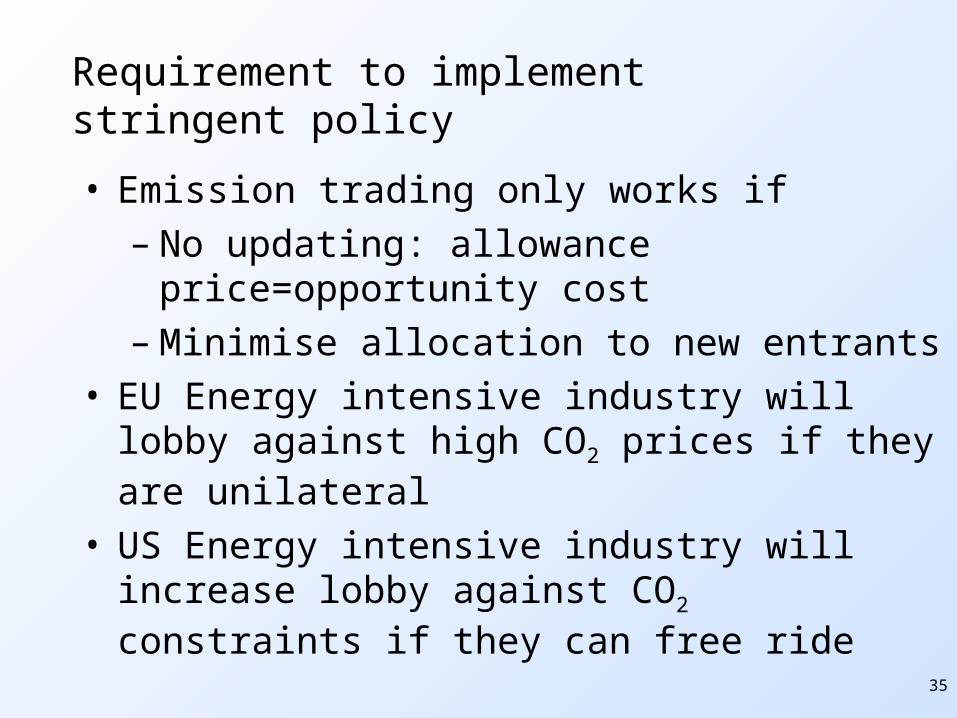
Requirement to implement stringent policy
• Emission trading only works if– No updating: allowance price=opportunity cost– Minimise allocation to new entrants
• EU Energy intensive industry will lobby against high CO2 prices if they are unilateral
• US Energy intensive industry will increase lobby against CO2 constraints if they can free ride
• We need border tax adjustment
36
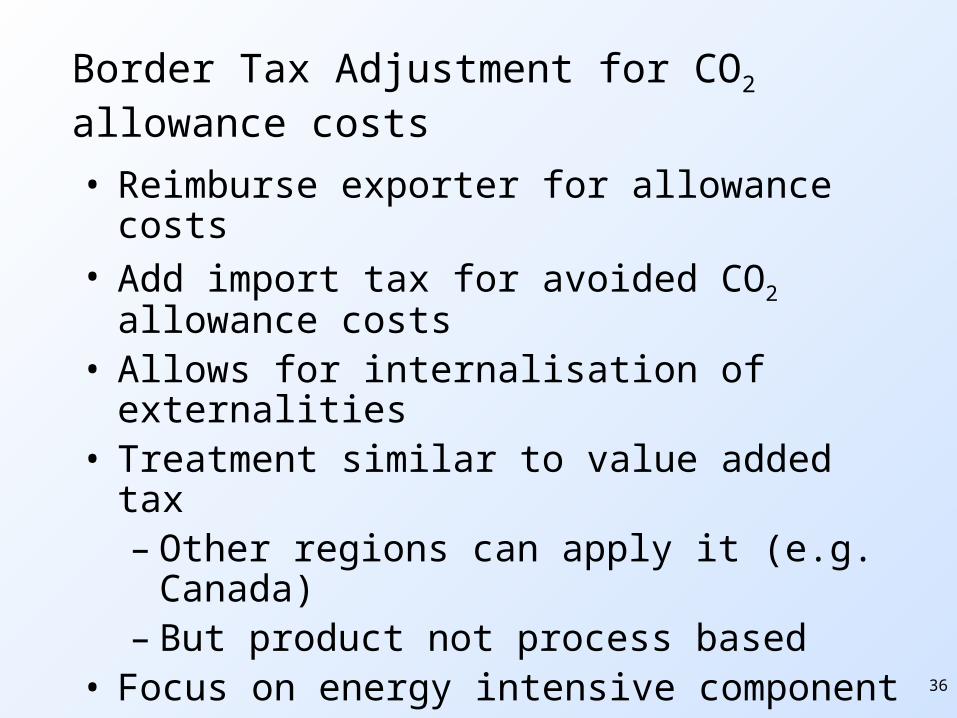
Border Tax Adjustment for CO2 allowance costs
• Reimburse exporter for allowance costs• Add import tax for avoided CO2 allowance costs• Allows for internalisation of externalities• Treatment similar to value added tax
– Other regions can apply it (e.g. Canada)– But product not process based
• Focus on energy intensive component– Small transaction costs– Based on best available technology– Simple monitoring / tariff setting
• WTO compatible
37
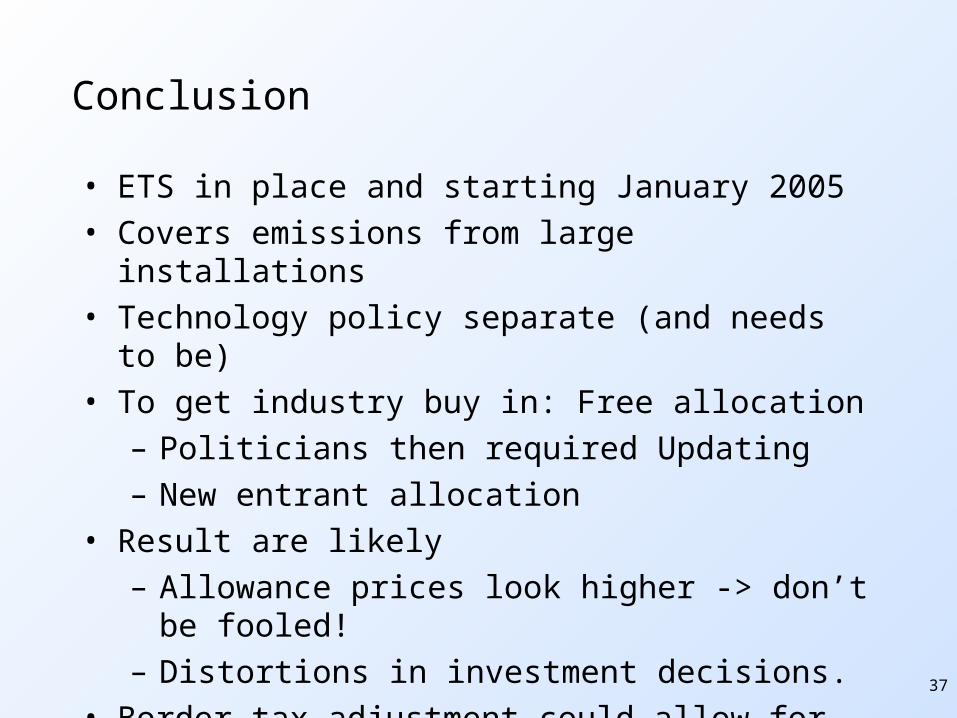
Conclusion
• ETS in place and starting January 2005• Covers emissions from large installations• Technology policy separate (and needs to be)• To get industry buy in: Free allocation
– Politicians then required Updating– New entrant allocation
• Result are likely– Allowance prices look higher -> don’t be fooled!– Distortions in investment decisions.
• Border tax adjustment could allow for higher CO2 price levels.