Embed Size (px)
Citation preview
O’Hare International Airport
O’Hare International Airport Master Plan Alternatives
V-49
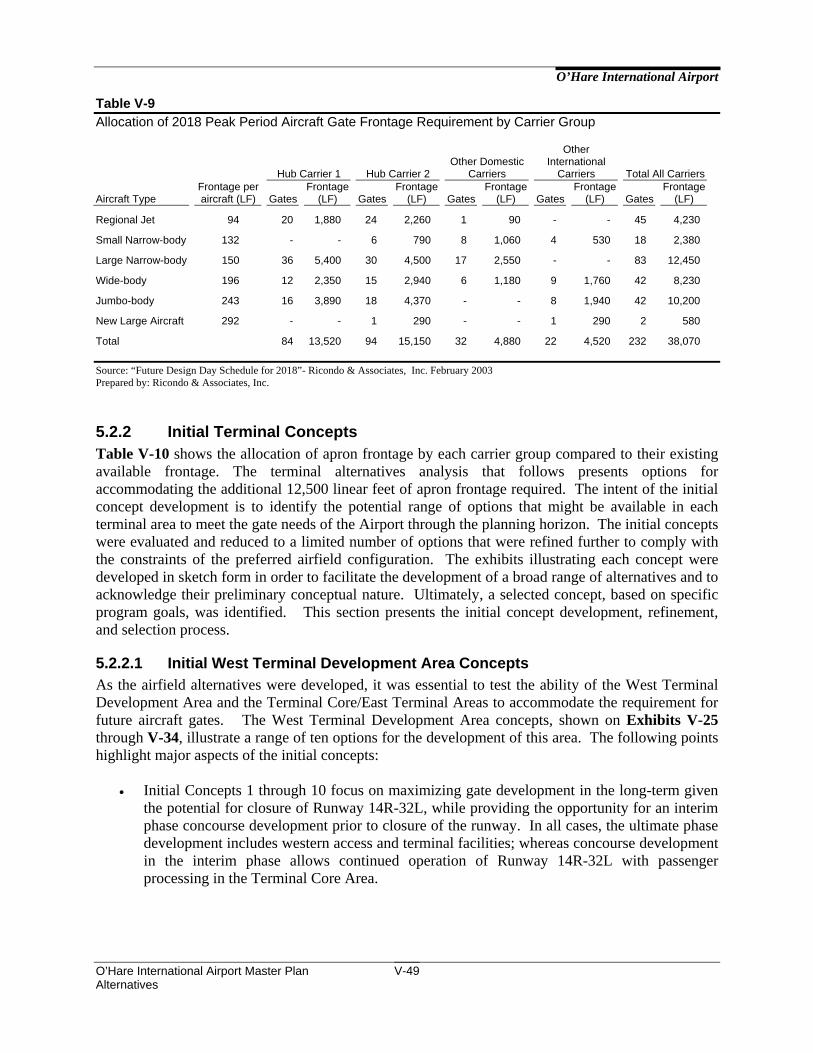
Table V-9 Allocation of 2018 Peak Period Aircraft Gate Frontage Requirement by Carrier Group
Hub Carrier 1 Hub Carrier 2 Other Domestic
Carriers
Other International
Carriers Total All Carriers
Aircraft Type Frontage per aircraft (LF) Gates
Frontage (LF) Gates
Frontage (LF) Gates
Frontage (LF) Gates
Frontage (LF) Gates
Frontage (LF)
Regional Jet 94 20 1,880 24 2,260 1 90 - - 45 4,230
Small Narrow-body 132 - - 6 790 8 1,060 4 530 18 2,380
Large Narrow-body 150 36 5,400 30 4,500 17 2,550 - - 83 12,450
Wide-body 196 12 2,350 15 2,940 6 1,180 9 1,760 42 8,230
Jumbo-body 243 16 3,890 18 4,370 - - 8 1,940 42 10,200
New Large Aircraft 292 - - 1 290 - - 1 290 2 580
Total 84 13,520 94 15,150 32 4,880 22 4,520 232 38,070 Source: “Future Design Day Schedule for 2018”- Ricondo & Associates, Inc. February 2003 Prepared by: Ricondo & Associates, Inc.
5.2.2 Initial Terminal Concepts Table V-10 shows the allocation of apron frontage by each carrier group compared to their existing available frontage. The terminal alternatives analysis that follows presents options for accommodating the additional 12,500 linear feet of apron frontage required. The intent of the initial concept development is to identify the potential range of options that might be available in each terminal area to meet the gate needs of the Airport through the planning horizon. The initial concepts were evaluated and reduced to a limited number of options that were refined further to comply with the constraints of the preferred airfield configuration. The exhibits illustrating each concept were developed in sketch form in order to facilitate the development of a broad range of alternatives and to acknowledge their preliminary conceptual nature. Ultimately, a selected concept, based on specific program goals, was identified. This section presents the initial concept development, refinement, and selection process.
5.2.2.1 Initial West Terminal Development Area Concepts As the airfield alternatives were developed, it was essential to test the ability of the West Terminal Development Area and the Terminal Core/East Terminal Areas to accommodate the requirement for future aircraft gates. The West Terminal Development Area concepts, shown on Exhibits V-25 through V-34, illustrate a range of ten options for the development of this area. The following points highlight major aspects of the initial concepts:
• Initial Concepts 1 through 10 focus on maximizing gate development in the long-term given the potential for closure of Runway 14R-32L, while providing the opportunity for an interim phase concourse development prior to closure of the runway. In all cases, the ultimate phase development includes western access and terminal facilities; whereas concourse development in the interim phase allows continued operation of Runway 14R-32L with passenger processing in the Terminal Core Area.

O’Hare International Airport
O’Hare International Airport Master Plan Alternatives
V-50
Table V-10 Comparison of Existing Aircraft Gate Frontage to the 2018 Peak Period Requirements
Existing 2018
Requirements Total Additional
Required
Hub Carrier 1 Terminal 3 Concourse G 2,237 Concourses H and K 5,636 Concourse L 842 Total Hub Carrier 1 8,715 13,520 4,805
Hub Carrier 2 Terminal 1 Concourse B 2,969 Concourse C 4,290 Subtotal 7,259 Terminal 2 Concourse E 746 Concourse F 1,865 Subtotal 2,611 Total Hub Carrier 2 9,870 15,150 5,280
Other Domestic Carriers Terminal 2 Concourse E 1,616 Concourse F 209 Subtotal 1,825 Terminal 3 Concourse L 1,149 Subtotal 1,149 Total Other Domestic Carriers 2,974 4,880 1,906
Other International Carriers1/ Terminal 5 Concourse M 3,970 Subtotal 3,970 Total Other International Carriers 3,970 4,320 550
Total All Carriers 25,529 38,070 12,541 1/ Terminal 5 existing frontage for the Other International Carriers includes gates occasionally utilized for
international arrivals by the two Hub Carriers. Source: Ricondo & Associates, Inc. Prepared by: Ricondo & Associates, Inc.