Embed Size (px)
Citation preview

Allianz –an opportunity!
Oliver Schmidt, Head of Investor Relations
UniCreditGerman Investment Conference,Munich, September 2011

1109
_UC
_con
fere
nce
© A
llian
z S
E 2
011
2
OutlookD
Sovereign debt exposureC
1H 2011B
Allianz at a glanceAAgenda

1109
_UC
_con
fere
nce
© A
llian
z S
E 2
011
3
1) 12/20102) 06/20113) Relation of positive parts of operating profit
P/C
Allianz at a glance
EUR 106bn total revenues1
EUR 1,508bn total AuM2
EUR 8.2bn operating profit1
180% solvency ratio2
EUR 43bn S/H equity2
EUR 44bn market cap2
More than 76mn customers1
Segments1,3
Operating profit in %Regions1,3
Operating profit in %
AM
L/H WesternEurope
GermanyGrowth markets
Specialty insurance
Broker markets US, UK, AUS
31%
22%
47%
5%12%
32%28%
23%

1109
_UC
_con
fere
nce
© A
llian
z S
E 2
011
4
Leading P/C insurer globally1
Top 5 in Life business globally
Top 5 asset manager globally
Largest global assistance provider
Worldwide leader in credit insurance
One of the leading industrial insurers globally
Building the leading global automotive
provider
1) All rankings mentioned on the slide based on 2009 or 2010 data
Strong market positions and brands 1Successfactor
1109
_UC
_con
fere
nce
© A
llian
z S
E 2
011
5
8.2
7.2
7.4
10.9
10.4
7.7
6.9
4.0
n.a.
4.5
4.1
3.5
5.5
3.8
2.0
1.8
1.5
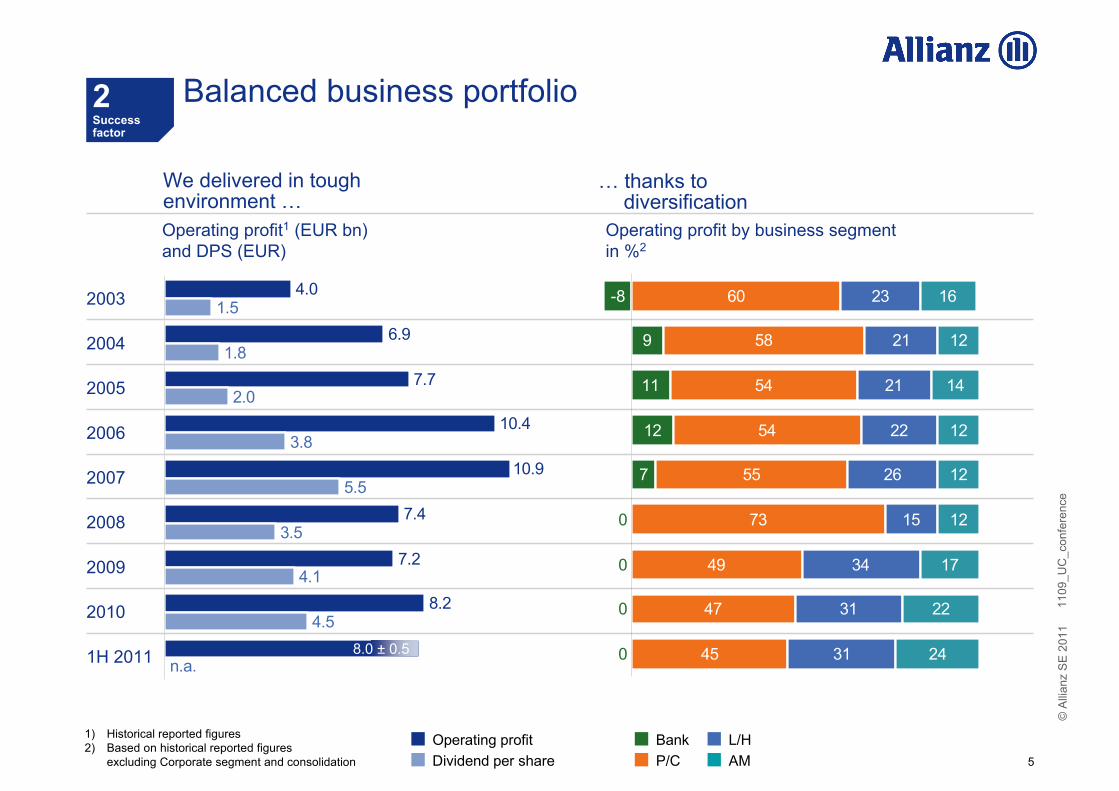
We delivered in tough environment …
… thanks todiversification
Operating profit1 (EUR bn) and DPS (EUR)
2003
2004
2005
2006
2007
2008
2009
2010
Operating profit by business segment in %2
26
-53
-8
9
11
12
7
60
58
54
54
55
73
49
47
45
23
21
21
22
26
15
34
31
31
16
12
14
12
12
12
17
22
240
0
0
0
1) Historical reported figures2) Based on historical reported figures
excluding Corporate segment and consolidation
1H 2011
Operating profitDividend per share P/C
L/HAM
Bank
8.0 ± 0.5
Balanced business portfolio2Successfactor

1109
_UC
_con
fere
nce
© A
llian
z S
E 2
011
6
EUR 448.4bn
AAA 45%
AA 14%A 25%BBB 10%
Not rated3 4%
Cash / Other 2%EUR 6.8bn
Real estate 2%EUR 8.6bn
Equities 7%EUR 33.4bn
Debt instruments 89%EUR 399.6bn
Rating profile2
1) 1H 2011, based on consolidated insurance portfolios (P/C, L/H), Corporate and other2) Excluding self-originated German private retail mortgage loans3) Mostly policyholder loans and registered debentures, all of investment grade quality
Non-investment grade 2%
High-quality investment portfolio
Conservative asset allocation1 High-quality fixed income portfolio
3Success factor

1109
_UC
_con
fere
nce
© A
llian
z S
E 2
011
7
Shareholders’ equity1
(EUR mn)
1) Excluding non-controlling interests (31.12.10: EUR 2,071mn, 31.03.11: EUR 2,055mn, 30.06.11: EUR 2,074mn)
2) Including F/X3) After non-controlling interests, policyholder participation and tax4) Including derivatives
31.12.10 31.03.11 30.06.11
43,560
28,685
4,000
10,875
-2.2%
44,491
28,685
10,749
5,057
Paid-in capital
Unrealizedgains/losses
Retainedearnings2
Equity markets -30%4
Interest rate +100bps
Interest rate -100bps
Credit loss/migration5
Credit spread6
Interest rate +100bps/equity markets -30%4
Estimation of stress impact on IFRS equity3 (EUR bn)
-4.4
+3.7
-2.1
-2.6
-3.2
-1.1
5) Credit loss/migration (Corporate and ABS portfolio): scenario based on probabilities of default as in 1932, migrations adjusted to mimic recession and assumed recovery rate of 30%
6) Credit spread: 100bps increase in the credit spreads across allrating classes (Corporate and ABS bond portfolio)
28,685
42,615
9,649
4,281
-7.6
F/X USD -10%
4Successfactor
Strong capital position (1)

1109
_UC
_con
fere
nce
© A
llian
z S
E 2
011
8
Conglomerate solvency1
(EUR bn)
Solvency ratio
+0%-p
173%
31.12.10 30.06.11
41.3
22.9
31.03.11
22.9
39.6
Available fundsRequirement
Conglomerate solvency ratio2
Target range: 150% – 170%
Ratio as of 30.06.11
Equity markets -30%3
Interest rate +100bps
Interest rate -100bps
Credit loss/migration4
NatCat6
Credit spread5
180%
181%
176%
175%
180%
175%
167%
Interest rate +100bps/equity markets -30%3 168%
100%
4) Corporate credit loss/ migration: scenario based on probabilities of default as in 1932, migrations adjusted to mimic recession and assumed recovery rate of 30%
5) Credit spread: 100bps increase in the credit spreads across allrating classes (Corporate and ABS bond portfolio)
6) NatCat: loss due to Cat events, both natural and man-made,leading to claims of EUR 1.5bn. Applies to P/C business only
1) Including off-balance sheet reserves (31.12.10: EUR 2.1bn, 31.03.11:EUR 2.1bn, 30.06.2011: 2.1bn) pro forma. The solvency ratio excludingoff-balance sheet reserves would be 164% as of 31.12.10, 171%as of 31.03.11 and 171% as of 30.06.11
2) After non-controlling interests, policyholder participation and tax3) Including derivatives
180% 180%
41.4
23.0
F/X USD -10% 179%
4Successfactor
Strong capital position (2)

1109
_UC
_con
fere
nce
© A
llian
z S
E 2
011
9
30.06.1131.03.11
177%
54.6
30.8
+7%-p
Economic solvency1
(EUR bn)
Economic solvency ratioRisk bearing fundsRisk capital
Stress impact2
Ratio as of 30.06.11
Interest rate +100bps
Interest rate -100bps
Equity markets -30%
Equity markets +30%
F/X USD -10%
1) Internal risk capital is calculated at 99.97% confidence level. At the local OE-level we are capitalizing at 99.93% confidence level. Risk bearing funds reflect yield curves and liquidity premium for valuation purposes in line with the current proposal of the European Insurance and Occupational Pensions Authority ("EIOPA") for L/H segment. Before non-controlling interests
2) Estimated solvency ratio changes in case of stress scenarios (stress applied on both risk bearing funds and risk capital)
184%
165%
195%
171%
196%
181%
184%
56.2
30.6
Interest rate -100bps/equity markets -30% 154%
4Successfactor
Strong capital position (3)

1109
_UC
_con
fere
nce
© A
llian
z S
E 2
011
10
OutlookD
Sovereign debt exposureC
1H 2011B
Allianz at a glanceAAgenda
1109
_UC
_con
fere
nce
© A
llian
z S
E 2
011
11
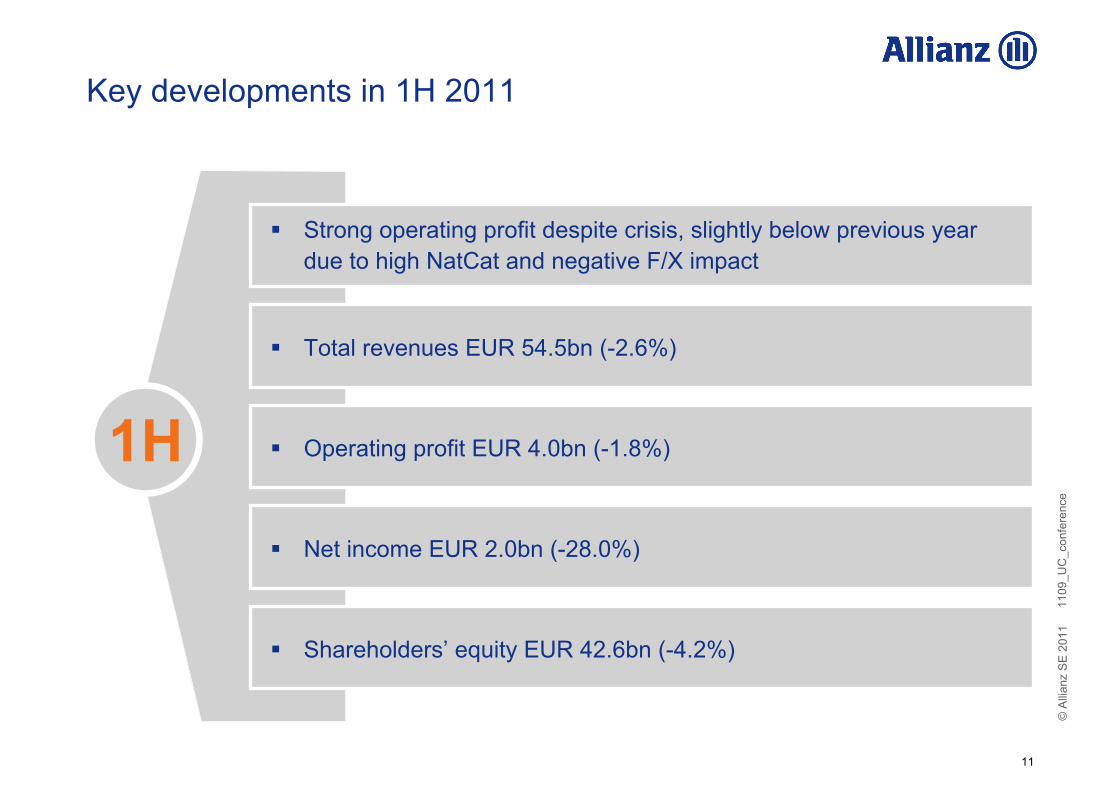
Key developments in 1H 2011
Strong operating profit despite crisis, slightly below previous year due to high NatCat and negative F/X impact
Total revenues EUR 54.5bn (-2.6%)
1H Operating profit EUR 4.0bn (-1.8%)
Shareholders’ equity EUR 42.6bn (-4.2%)
Net income EUR 2.0bn (-28.0%)

1109
_UC
_con
fere
nce
© A
llian
z S
E 2
011
12
Net income(EUR mn)
Operating profit(EUR mn)
Total revenues(EUR bn)
Quarterly results overview
22.0
-3.2%1
22.225.5
30.625.4
29.9
4Q 1Q2Q 3Q 4Q 1Q 2Q 3Q
2,0551,762 2,009 1,960 1,732
2,302
-0.1%
1,660
1,268
1,8721,390
1,0331,603
1,157
-7.4%
915
2,154
1,181
1) Internal growth -0.9%, adjusted for F/X and consolidation effects
2Q
24.6
2,300
1,071
2009 2010 2011
26.024.5

1109
_UC
_con
fere
nce
© A
llian
z S
E 2
011
13
P/C 1H 2011: operating profit up 7%
Comments Growth driven by positive volume and
price effects
Operating profit up due to improvement in France, Italy, credit insurance and AGCS
NatCat still at high level (EUR 910mn / 4.7%-p CR)
Accident year loss ratio excluding NatCat steadily improving (<70%)
Operating investment income grew, driven by higher asset base
Positive price effect of 1.0% on our renewed business (+1.5% excluding credit insurance)
Revenues(EUR bn)
Operating profit(EUR mn)
1H 10 1H 11
+2.1%
23.9 24.4
1H 10 1H 11
+7.2%
1,8591,992
98.4 98.1
Combined ratio in %

1109
_UC
_con
fere
nce
© A
llian
z S
E 2
011
14
Revenues(EUR bn)
L/H 1H 2011: operating profit suffered from impairments
Comments Revenue development impacted by
positive one-offs in 1H 10
Operating asset base up 2%, net inflows EUR 2.1bn
Stable value creation from new business (NBM 2.4%)
Operating profit suffered from impairments on Greek sovereign bonds (EUR 76mn)
Operating profit(EUR mn)
1H 10 1H 11
-7.6%
29.527.2
1H 10 1H 11
-16.8%
1,659
1,381
2.5% 2.4%
Operating asset base (EUR bn)
414 423
New business margin

1109
_UC
_con
fere
nce
© A
llian
z S
E 2
011
15
3rd party AuM(EUR bn)
1H 10 1H 11
AM 1H 2011: strong contribution to Group performance
Comments Growing AuM drive revenues and
operating profit
Total AuM internal growth of 11.1%
Strong net inflows despite difficult market environment
Share of outperforming assets further increased to outstanding 94% (fixed income) and 65% (equities)
Shift to higher margin products increases AuM driven margin to 40.3bps from 39.1bps
Operating profit(EUR mn)
+1.1%
1,139 1,151
1H 10 1H 11
+7.5%
9821,056
57.4 59.0
Cost-income ratio in %
60.0 33.6
Net inflows (EUR bn)
1109
_UC
_con
fere
nce
© A
llian
z S
E 2
011
16
OutlookD
Sovereign debt exposureC
1H 2011B
Allianz at a glanceAAgenda

1109
_UC
_con
fere
nce
© A
llian
z S
E 2
011
17
Greek sovereign bond portfolio impaired to market values 30.6.2011 (EUR mn)
Gross impairments on sovereign bonds
Net income effect from impairments(a/php1, a/tax, b/min)
644 48596
326 41285
AllianzGroup
P/C L/H AllianzGroup
P/C L/H
Operating profit effect from impairments (a/php1)
L/HP/CAllianzGroup
7676 0
Special effectsGreece EUR 92mnFrance EUR 135mn
1) After policyholder participation

1109
_UC
_con
fere
nce
© A
llian
z S
E 2
011
18
Remaining exposure to peripheral sovereign bonds marked-to-market …
1.8%
Spain1.2%
Total fixed income portfolio1
100% = EUR 399.6bnGreece
0.2%
Portugal0.2%
Ireland0.2%
35%
26%19%
10%
10%
-236
-102
-58
-4
-72
Unrealized loss (net)2
-7267,285Total
-245780Portugal
-195646Ireland
-6782Greece3
-2805,077Spain
Unrealized loss (gross)
Carrying value
Gross exposure (EUR mn)
1) As of June 30, 2011, portfolio discussion is based on consolidated insurance portfolios (P/C, L/H, Corporate and Other, does not include Banking operations)2) After policyholder participation and taxes; based on June 30, 2011 balance sheet figures reflected in accumulated other comprehensive income3) After impairments
Government
OtherBanksCorporateCovered bonds
Government bonds

1109
_UC
_con
fere
nce
© A
llian
z S
E 2
011
19
Absolute exposure
100% 100% 100%
Carrying value in %
of total investments
Unrealized loss (gross) in % of shareholders'
equity2
Unrealized loss(gross) in % ofrequired FCD solvency cap.2
-1,44436,442Total
-71829,157Italy
-7267,285Sub-total
-2805,077Spain
-6782Greece
-245780Portugal
-195646Ireland
Unrealized loss (gross)Carrying valueEUR mn
1H 2011
Relative exposure1
1.6%
8.1%
1.7%3.4% 3.2%
6.3%All ratios
before phpand tax!
1) Light grey ratios refer to total exposure (peripherals plus Italy)2) Ratios slightly overstated, because net unrealized losses are already deducted from S/H equity
… and low

1109
_UC
_con
fere
nce
© A
llian
z S
E 2
011
20
OutlookD
Sovereign debt exposureC
1H 2011B
Allianz at a glanceAAgenda

1109
_UC
_con
fere
nce
© A
llian
z S
E 2
011
21
Our strategy for the next five years:keep proven business model – just get better …
Dimension
Capital efficiency
Growth
External
Internal
External
Internal
Solvency II, rating, market volatility
Discipline, cash flow, dividends, risk management
GDP, demography, emerging markets
Distribution, Global Lines, self-retention
Main levers Mid-term trend
ComplexityExternal
Internal
Transaction opportunities
Disposals, streamlining, Global Lines
ProfitabilityExternal
Internal
Cycle, interest rates, growth, competition, NatCat
Structures, processes, products, channels
1
+One
3
2

1109
_UC
_con
fere
nce
© A
llian
z S
E 2
011
22
Revenues at EUR 27bn EUR 2.1bn net inflows
EUR 34bn net inflows CIR 59.0%
Please mind the seasonality of the business and our disclaimer1!
Exceptionally high NatCat CR 98.1%
As expected
Total
L/H
AM
Co
P/C 2.04.2 – 4.8
1.42.2 – 2.8
1.1
-0.4
4.0
EUR 7.5 – 8.5bn operating profit expected in 2011
Operating profit (EUR bn)
-0.9 – -1.1
1) Disclaimer: Impact from NatCat, financial markets and global economic development not predictable!
1H 2011 Outlook published 02/11 1H 2011
8.57.5
8.0
1.8 – 2.2

1109
_UC
_con
fere
nce
© A
llian
z S
E 2
011
23
Summary: Allianz well positioned
Resilient and well diversified business model
High-quality investment portfolio
Strong capital base
Balanced growth opportunities
EUR 7.5bn – 8.5bn operating profit expected in 2011
Well positioned for the
“New Normal”

Appendix

1109
_UC
_con
fere
nce
© A
llian
z S
E 2
011
25
Investor Relations contacts
Oliver SchmidtHead of Investor Relations
Phone +49 89 [email protected]
Peter Hardy
Phone +49 89 [email protected]
Holger Klotz
Phone +49 89 [email protected]
Reinhard Lahusen
Phone +49 89 [email protected]
Christian Lamprecht
Phone +49 89 [email protected]
Stephanie AldagIR Events
Phone +49 89 [email protected]
Investor Relations
Fax +49 89 [email protected]
Internet
(English): www.allianz.com/investor-relations(German): www.allianz.com/ir

1109
_UC
_con
fere
nce
© A
llian
z S
E 2
011
26
Financial calendar
November 11, 2011 3rd quarter results 2011
February 23, 2012 Financial press conference for the 2011 fiscal year
February 24, 2012 Analysts’ conference for the 2011 fiscal year
March 23, 2012 Annual Report 2011
May 9, 2012 Annual General Meeting
May 15, 2012 Interim Report 1st quarter 2012
August 3, 2012 Interim Report 2nd quarter 2012
November 9, 2012 Interim Report 3rd quarter 2012
The German Securities Trading Act ("Wertpapierhandelsgesetz") obliges issuers to announce immediately any information which may have a substantial price impact, irrespective of the communicated schedules. Therefore we cannot exclude that we have to announce key figures of quarterly and fiscal year results ahead of the dates mentioned above. As we can never rule out changes of dates, we recommend checking them on the Internet at www.allianz.com/financialcalendar.

1109
_UC
_con
fere
nce
© A
llian
z S
E 2
011
27
Disclaimer
These assessments are, as always, subject to the disclaimer provided below.
Cautionary Note Regarding Forward-Looking StatementsThe statements contained herein may include statements of future
expectations and other forward-looking statements that are based
on management’s current views and assumptions and involve known
and unknown risks and uncertainties that could cause actual results,
performance or events to differ materially from those expressed or
implied in such statements. In addition to statements which are forward-
looking by reason of context, the words “may”, “will”, “should”, “expects”,
“plans”, “intends”, “anticipates”, “believes”, “estimates”, “predicts”,
“potential”, or “continue” and similar expressions identify forward-looking
statements. Actual results, performance or events may differ materially
from those in such statements due to, without limitation, (i) general economic
conditions, including in particular economic conditions in the Allianz Group’s
core business and core markets, (ii) performance of financial markets,
including emerging markets, and including market volatility, liquidity and
credit events (iii) the frequency and severity of insured loss events,
including from natural catastrophes and including the development of loss
expenses, (iv) mortality and morbidity levels and trends, (v) persistency
levels, (vi) the extent of credit defaults, (vii) interest rate levels, (viii) currency
exchange rates including the Euro/U.S. Dollar exchange rate, (ix) changing
levels of competition, (x) changes in laws and regulations, including monetary
convergence and the European Monetary Union, (xi) changes in the policies
of central banks and/ or foreign governments, (xii) the impact of acquisitions,
including related integration issues, (xiii) reorganization measures, and (xiv)
general competitive factors, in each case on a local, regional, national and/ or
global basis. Many of these factors may be more likely to occur, or more
pronounced, as a result of terrorist activities and their consequences. The
company assumes no obligation to update any forward-looking statement.
No duty to updateThe company assumes no obligation to update any information
contained herein.