Embed Size (px)
Citation preview
All Politics is National: The Rise of Negative Partisanship and the Nationalization of U.S. House and Senate Elections in the 21st Century
Alan Abramowitz Emory University
Steven Webster
Emory University
Abstract
One of the most important developments affecting electoral competition in the United States in the 21st century has been the increasing partisanship of the American electorate. However, the standard party identification scale does not adequately reflect the growing intensity of voters’ partisan preferences. Using data from the American National Election Studies cumulative file, we show that since 1992 and especially since 2008, partisan identities have become increasingly associated with racial, cultural and ideological divisions in American society. As a result, growing proportions of strong, weak and leaning party identifiers have come to perceive important differences between the parties and to hold extremely negative opinions of the opposing party. This has led to sharp increases in party loyalty and straight ticket voting across all categories of party identification and to growing consistency between the results of presidential elections and the results of House and Senate elections. Increasing nationalization of congressional elections has important implications for party performance, democratic representation and governance. Prepared for presentation at the Annual Meeting of the Midwest Political Science Association, Chicago, Illinois, April 16-19, 2015
1
In the 21st century, the United States has entered a new age of partisanship. Sharp party
divisions now characterize all of our major political institutions. In Congress, the ideological
divide between Democrats and Republicans in both the House and Senate is now larger than at
any time in the past century (Ansolabehere, Snyder, and Stewart 2001; Bafumi and Herron 2010;
Mann and Ornstein 2013; Kraushaar 2014). Party unity on roll call votes has increased
dramatically in both chambers in recent years (Izadi 2014; McCarty, Poole, and Rosenthal 2008;
Theriault 2008; Sinclair 2006). Moreover, the party divide in Washington is not limited to the
elected branches of government. On the Supreme Court, the justices now divide along party
lines on major cases with greater frequency than at any time in recent history (Clark 2009;
Bartels 2015; Stone 2014). Nor are deep party divisions confined to the federal government. In
many of the states, Democrats and Republicans are even more divided along ideological lines
than Democrats and Republicans in Congress (Shor and McCarty 2011).
The rise of partisanship in American politics is by no means limited to political elites.
Indeed, the growing intensity of partisan conflict among political elites in recent years cannot be
understood without taking into account the growing partisanship of the American electorate. In
this paper we argue that one of the most important trends in American politics over the past
several decades has been the rise of negative partisanship in the electorate. The rise of negative
partisanship, a development not adequately captured by the traditional party identification scale,
has led to a sharp increase in party loyalty in voting for elected offices at all levels, a concurrent
increase in straight-ticket voting and a growing connection between the results of presidential
elections and the results of House and Senate elections. To a greater extent than at any time in
the post-World War II era, the outcomes of elections below the presidential level reflect the
outcomes of presidential elections. As a result, the famous comment by the late Tip O’Neill that
2
“all politics is local” now seems rather quaint. In the 21st century United States, it increasingly
appears that all politics is national.
The Growth of Partisan Behavior: Party Loyalty and Straight-Ticket Voting
Recent elections in the United States have been characterized by the highest levels of party
loyalty and straight-ticket voting since the American National Election Studies first began
measuring party identification in 1952. In 2012, according to the ANES survey, 91 percent of
party identifiers and leaners voted for their party’s presidential candidate.1 That tied the record
first set in 2004 and matched in 2008. The 90 percent rate of party loyalty in the 2012 House
elections tied the record set in 1956 and the 89 percent rate of party loyalty in the 2012 Senate
elections broke the previous record of 88 percent set in 1958. As one would expect, these high
rates of party loyalty were accompanied by very high rates of straight-ticket voting. The 89
percent rate of straight-ticket voting in the presidential and House elections in 2012 broke the
record of 87 percent set in 1952 and the 90 percent rate of straight-ticket voting in the
presidential and Senate elections in 2012 broke the record of 89 percent set in 1960.
The extraordinarily high rates of party loyalty in the 2012 presidential, House and Senate
elections represent a continuation of a long-term trend—one that has been evident since
partisanship reached a low-point in the elections of the 1970s and 1980s. Moreover, the rise of
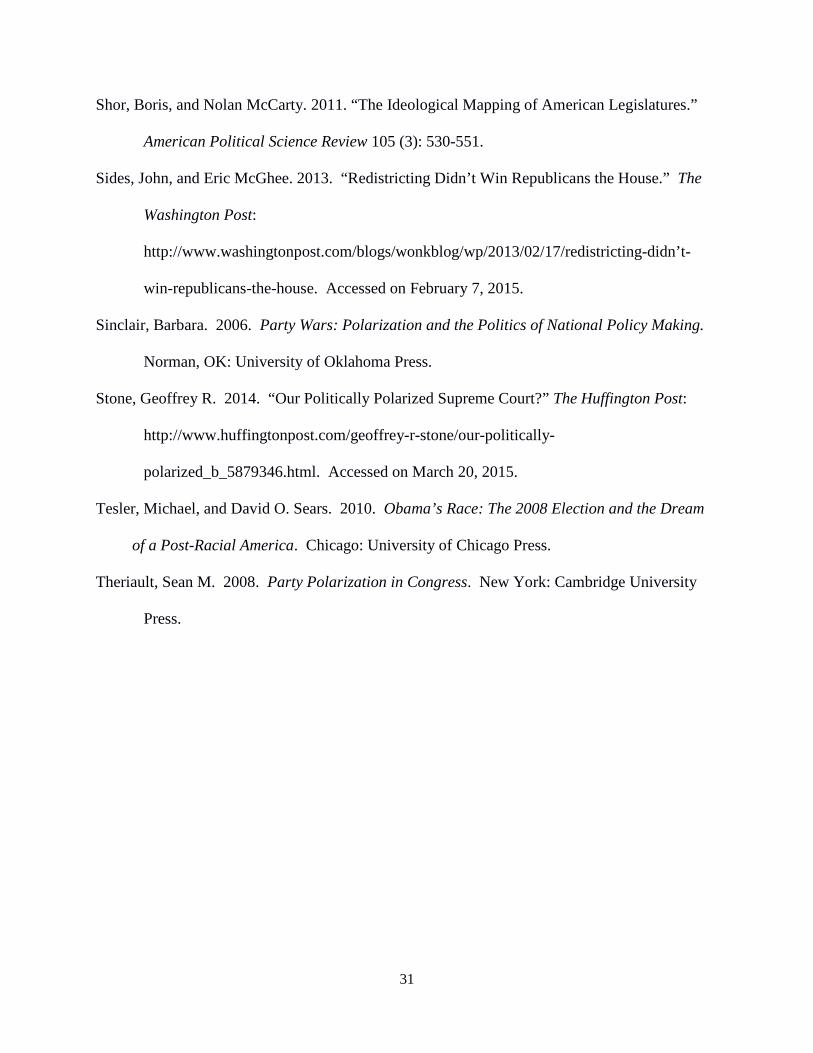
partisan behavior has involved supporters of both major parties. This can be seen in Figure 1
which displays the trends in consistent party loyalty among Democratic and Republican
identifiers, including leaning independents, between 1952 and 2012. Consistent loyalty here
means voting for the candidates of your own party for President, House of Representatives and
U.S. Senate. 1 All analyses of the 2012 ANES survey are based on the personal interviews only in order to facilitate comparisons with surveys done in earlier years. Results including the Internet-based component of the 2012 survey show slightly higher levels of party loyalty in voting for president, House and Senate.
3
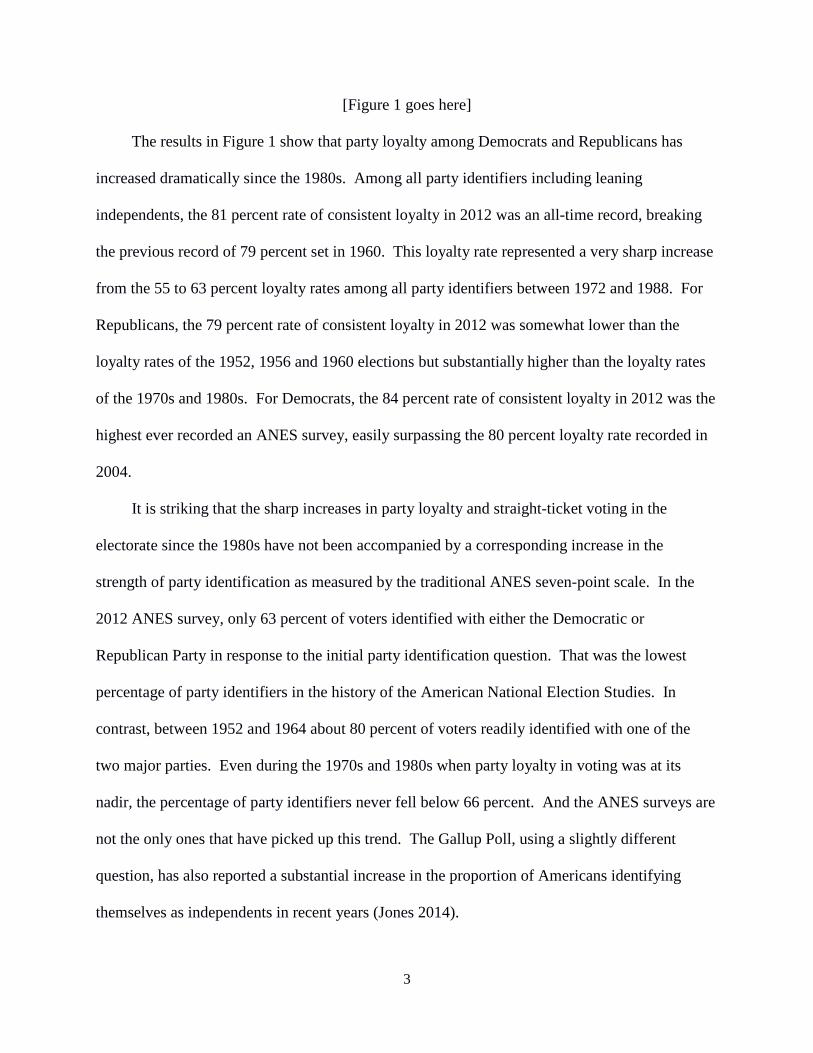
[Figure 1 goes here]
The results in Figure 1 show that party loyalty among Democrats and Republicans has
increased dramatically since the 1980s. Among all party identifiers including leaning
independents, the 81 percent rate of consistent loyalty in 2012 was an all-time record, breaking
the previous record of 79 percent set in 1960. This loyalty rate represented a very sharp increase
from the 55 to 63 percent loyalty rates among all party identifiers between 1972 and 1988. For
Republicans, the 79 percent rate of consistent loyalty in 2012 was somewhat lower than the
loyalty rates of the 1952, 1956 and 1960 elections but substantially higher than the loyalty rates
of the 1970s and 1980s. For Democrats, the 84 percent rate of consistent loyalty in 2012 was the
highest ever recorded an ANES survey, easily surpassing the 80 percent loyalty rate recorded in
2004.
It is striking that the sharp increases in party loyalty and straight-ticket voting in the
electorate since the 1980s have not been accompanied by a corresponding increase in the
strength of party identification as measured by the traditional ANES seven-point scale. In the
2012 ANES survey, only 63 percent of voters identified with either the Democratic or
Republican Party in response to the initial party identification question. That was the lowest
percentage of party identifiers in the history of the American National Election Studies. In
contrast, between 1952 and 1964 about 80 percent of voters readily identified with one of the
two major parties. Even during the 1970s and 1980s when party loyalty in voting was at its
nadir, the percentage of party identifiers never fell below 66 percent. And the ANES surveys are
not the only ones that have picked up this trend. The Gallup Poll, using a slightly different
question, has also reported a substantial increase in the proportion of Americans identifying
themselves as independents in recent years (Jones 2014).
4
It appears that a large proportion of American voters today are reluctant to openly
acknowledge any affiliation with a political party. This may reflect a kind of social desirability
effect: because partisanship has a bad reputation in the U.S., the independent label appeals to
many voters. However, a closer look at the ANES data reveals a somewhat more nuanced
picture with regard to recent trends in the strength of party attachment in the American
electorate. The proportion of strong party identifiers has rebounded since bottoming out at
around 30 percent between 1972 and 1980. Since 1996, strong party identifiers have made up
between 37 and 41 percent of the electorate, close to the proportion of strong identifiers between
1952 and 1964. At the same time, the composition of the independent category has changed
somewhat since the 1970s—the ratio of leaning independents to pure independents has grown
over the past four decades. In 2012, more than 80 percent of independent voters indicated that
they leaned toward one of the two major parties. In contrast, during the 1970s and 1980s, only
about 70 percent of independent voters expressed a party preference. As a result, while the
proportion of independents has risen in recent years, the proportion of “pure independents,”
those with no party preference whatsoever, has remained very small—well below 10 percent of
the electorate.
Taken together, these results present a mixed picture with regard to the strength of party
identification in the contemporary American electorate. When we shift our focus from partisan
identification to partisan behavior, however, the evidence is very clear—partisanship is stronger
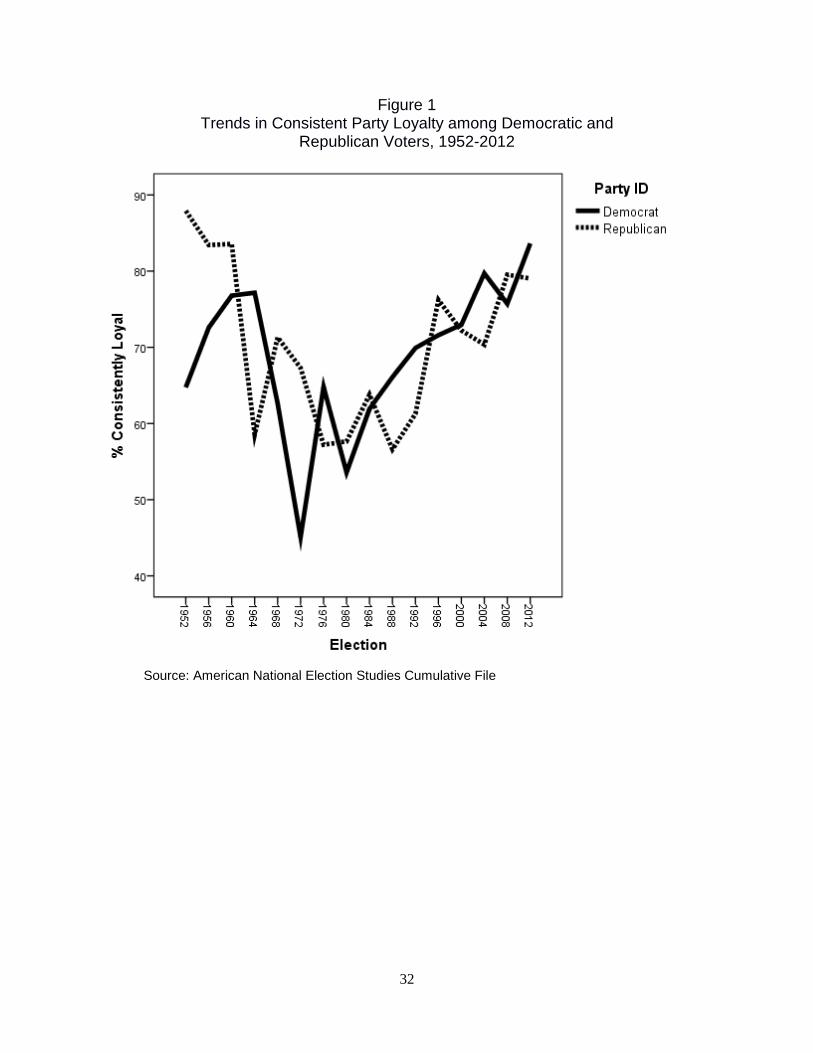
today than at any time in the past fifty years. This is readily apparent from the data displayed in
Figure 2 which shows the trends in consistent party loyalty among all three types of party
identifiers—strong, weak and leaning independent—between 1952 and 2012. Among each
5
group of party identifiers there was a marked increase in party loyalty between the elections of
the 1970s and 1980s and the present.
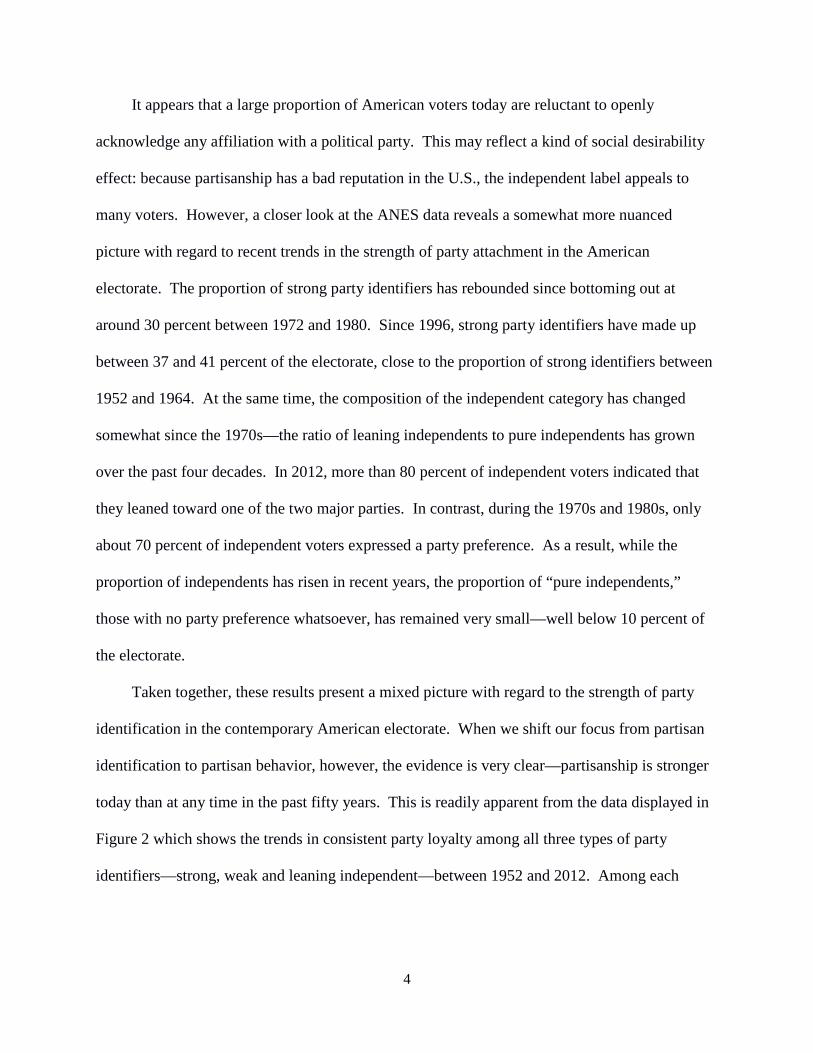
[Figure 2 goes here]
Not surprisingly, the data displayed in Figure 2 show that strong party identifiers had the
highest rate of consistent party loyalty throughout the sixty years of the American National
Election Studies. However, even among strong party identifiers, loyalty fell from an average of
close to 90 percent between 1952 and 1960 to an average of around 75 percent during the 1970s
and 1980s before rebounding back to close to 90 percent in the 2004-2012 elections. What is
perhaps more impressive in these data, however, is the surge in party loyalty among weak party
identifiers and leaning independents since the 1980s. During the 1970s and 1980s the rate of
consistent party loyalty among these two groups was slightly below 50 percent. By 2012,
however, the loyalty rate of both groups was close to 75 percent.
A Theory of Negative Partisanship
The trends shown in Figure 2 demonstrate that partisan behavior has surged in the
American electorate in recent elections and that this surge has cut across the traditional division
of voters into strong, weak and independent-leaning party identifiers. Among all types of party
identifiers, consistent party loyalty reached its highest levels in half a century in the 2008 and
2012 elections. We believe that this surge in partisan behavior reflects a fundamental change in
the nature of partisan identity in the American electorate—the rise of negative partisanship.
Negative partisanship develops when the partisan identities of voters are strongly related to
other salient social and political characteristics. When this happens, supporters of each party
perceive supporters of the opposing party as very different from themselves in terms of their
social characteristics and fundamental values. As a result, voters tend to hold very negative
6
opinions of the opposing party’s leaders and supporters, prefer not to associate with those who
support the opposing party and are less likely to consider voting for candidates from the
opposing party (Pew Research Center 2014; Bafumi and Shapiro 2009; Greenberg 2004;
Jacobson 2005; Kimball, Summary and Vorst 2015). These attitudes can be found among all
types of party identifiers including independents who lean toward a party.
One of the most important factors contributing to the rise of negative partisanship in the
United States in recent years has been a growing racial divide between the two major parties
(Frey 2008; Tesler and Sears 2010; Kinder and Dale-Riddle 2012; Olson 2008; Frey 2015,
chapter 11). Between 1992 and 2012 according to data from national exit polls, the nonwhite
share of the U.S. electorate more than doubled, growing from 13 percent to 28 percent.
However, the growing nonwhite share of the electorate has affected the two major parties very
differently. Over the past several decades, the Democratic Party has become increasingly
dependent on the votes of African-Americans, Latinos and other nonwhites while the Republican
Party has continued to rely overwhelmingly on the votes of non-Hispanic whites. In 2012,
according to the national exit poll, nonwhites made up 45 percent of Democratic congressional
and presidential voters but only 11 percent of Republican congressional and presidential voters.
At the same time as the racial divide between the party coalitions has been expanding, the
emergence of new moral and cultural issues such as abortion and gay rights has resulted in a
growing religious and cultural divide in the electorate, especially among white voters. Since
1980, when the Republican Party made opposition to legalized abortion a plank in its national
platform, religious white voters have been moving toward the GOP. According to ANES data,
between 1980 and 2012, the proportion of observant white voters—those who reported attending
religious services every week or almost every week—identifying with or leaning toward the
7
Republican Party increased sharply from 48 percent to 72 percent. Over the same time period,
the proportion of nonobservant white voters—those who reported seldom or never attending
religious services—identifying with or leaning toward the Republican Party increased only
modestly, from 38 percent to 46 percent. As a result of this dramatic rise in Republican
identification among the most observant white voters, religious conservatives have become a
major component of the Republican electoral base while religious liberals and secular voters, a
group that has been growing in size in recent years (Pew Research Center 2012; Newport 2015)
have become a major component of the of the Democratic electoral base.
The growing divide between the partisan loyalties of religious and non-religious white
voters has contributed to a growing partisan divide on cultural issues such as abortion. Thus,
according to the ANES data, between 1980 and 2012 the proportion of Democratic voters taking
a strongly pro-choice position on abortion rose from 38 percent to 61 percent while the
proportion favoring a ban or stricter limits on abortion fell from 46 percent to 21 percent. Over
the same time period, the proportion of Republican voters taking a strongly pro-choice position
on abortion fell from 35 percent to 30 percent while the proportion favoring a ban or stricter
limits on abortion rose from 42 percent to 51 percent. Moreover, this question probably
understated the depth of the partisan divide on this issue in 2012. A new question on the 2012
ANES survey asked respondents to place themselves on a nine-point scale measuring agreement
vs. disagreement with the statement that abortion should always be legal as a matter of choice.
Sixty-four percent of Democratic voters placed themselves on the pro-choice side of this scale
(1-4) and 54 percent placed themselves within one unit of the pro-choice end of the scale. In
contrast, 59 percent of Republican voters placed themselves on the pro-life side of this scale (6-
9) and 56 percent placed themselves within one unit of the pro-life end of the scale.
8
The growing cultural divide among white voters and the growing racial divide among all
voters have both contributed to a widening ideological divide between Democratic and
Republican voters. Nonwhites are not especially liberal on cultural issues but they are much
more likely than whites to favor liberal economic policies such as a more generous social safety
net and higher taxes on the wealthy (Barreto and Segura 2014, Abramowitz 2013). At the same
time, the growing dependence of Democrats on the votes of African-Americans, Latinos and
other nonwhites has helped to drive racially and economically conservative whites toward the
Republican Party (Hood, Kidd, and Morris 2004; Shafer and Johnston 2006; Hillygus and
Shields 2008; Abramowitz 2013).
According to ANES data, between 1972 and 2012 the proportion of white voters
identifying with the Republican Party rose from 43 percent to 55 percent. However, this increase
in Republican identification was concentrated almost entirely among self-identified
conservatives. Over these 40 years, the proportion of conservative white voters identifying with
the Republican Party rose from 60 percent to 92 percent while the percentage of moderate white
voters identifying with the Republican Party only rose slightly from 38 percent to 42 percent and
the percentage of liberal whites identifying with the Republican Party actually fell sharply from
24 percent to four percent. As a result, the correlation between ideology and party identification
among white voters rose from only .29 in 1972 to .73 in 2012.
The result of the ideological realignment of white voters has been a very large increase in
the ideological distance between supporters of the two parties. Republican voters are
considerably more conservative than they were during the 1970s while Democratic voters are
considerably more liberal than they were during the 1970s: the average location of Republican
voters on the 7-point liberal-conservative scale (with respondents who did not place themselves
9
on the scale assigned to the middle position) went from 4.6 in 1972 to 5.2 in 2012 while the
average location of white Democratic voters on the scale went from 3.8 in 1972 to 3.4 in 2012.
Thus, the distance between the average Democratic voter and the average Republican voter on
the liberal-conservative scale more than doubled over these 40 years.
We know that the two parties have been moving apart in their ideological orientations for
several decades and so have voters who identify with the parties with Democrats moving to the
left and Republicans moving to the right. As a result, each party’s supporters now feel much
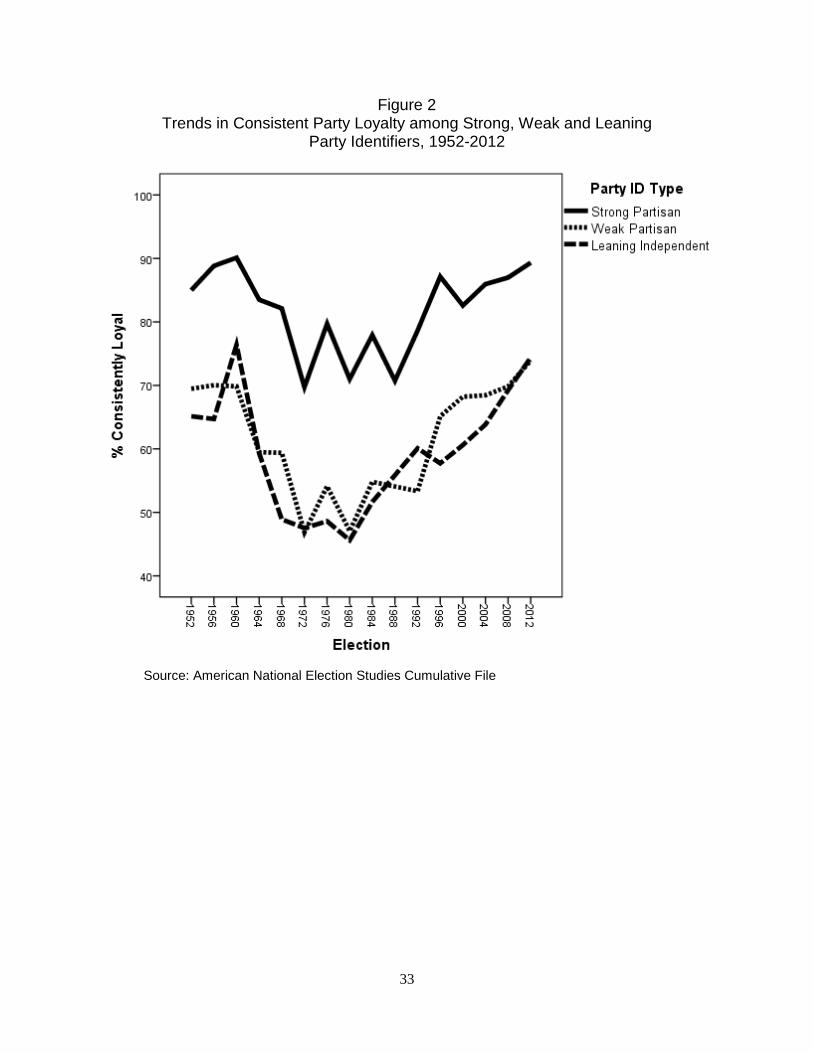
farther from the opposing party’s ideological position than in the past. We measured the relative
distance of voters from their own party and from the opposing party on the seven-point liberal-
conservative scale. Since this scale has a range from one to seven, the ideological proximity
scale ranges from zero for voters who place a party at the same location as themselves to six for
voters who place a party at the opposite end of the scale from themselves. Figure 3 displays the
trend between 1972 and 2012 in the average ideological distance of voters from their own party
and the opposing party. Leaning independents were included as party supporters in calculating
the distance scores.
[Figure 3 goes here]
The results displayed in Figure 3 show that over this 40 year time period there was almost
no change in the average perceived distance between voters and their own party. Voters
generally viewed themselves as fairly close to their own party with the average distance score
hovering around one unit. In contrast, over the same time period there was a sharp and fairly
consistent increase in the average perceived distance between voters and the opposing party.
Voters in 2012 perceived the opposing party as much more distant from their own ideological
position than in 1972. This was true for both Democrats and Republicans. Among all party
10
identifiers and leaners, the average distance from the opposing party increased from 2.1 units to
3.4 units on a scale with a range from zero to six. This trend cut across all categories of party
identification: average distance from the opposing party increased from 2.6 units to 3.8 units
among strong party identifiers, from 1.8 units to 3.0 units among weak party identifiers and from
1.9 units to 3.1 units among leaning independents.
The increase of about 1.3 units in the average perceived distance between party identifiers
and the opposing party over these 40 years was quite significant. Between 1972 and 2012, the
proportion of party identifiers placing the opposing party within one unit of their own position on
the liberal-conservative scale fell from 38 percent to 10 percent and the proportion placing the
opposing party within two units of their own position fell from 65 percent to 26 percent. At the
same time, the proportion of party identifiers placing the opposing party at least four units from
their own position increased from 18 percent to 48 percent and the proportion placing the
opposing party at least five units from their own position increased from four percent to 22
percent.
Increasing ideological distance from the opposing party has contributed to both growing
recognition of important differences between the two major parties and to increasingly negative
feelings toward the opposing party. According to the ANES survey, in 2012 there was a
correlation of .40 between perceived ideological distance from the opposing party and
recognition of important party differences and a correlation of -.47 between perceived
ideological distance from the opposing party and ratings of the opposing party on the feeling
thermometer scale. Among voters who placed the opposing party within one unit of themselves
on the liberal-conservative scale, only 51 percent believed that there were important differences
between the parties and the average rating of the opposing party on the feeling thermometer was
11
44 degrees. In contrast, among voters who placed the opposing party five or six units away from
themselves, 97 percent believed that there were important differences between the parties and the
mean rating of the opposing party on the feeling thermometer was 16 degrees.
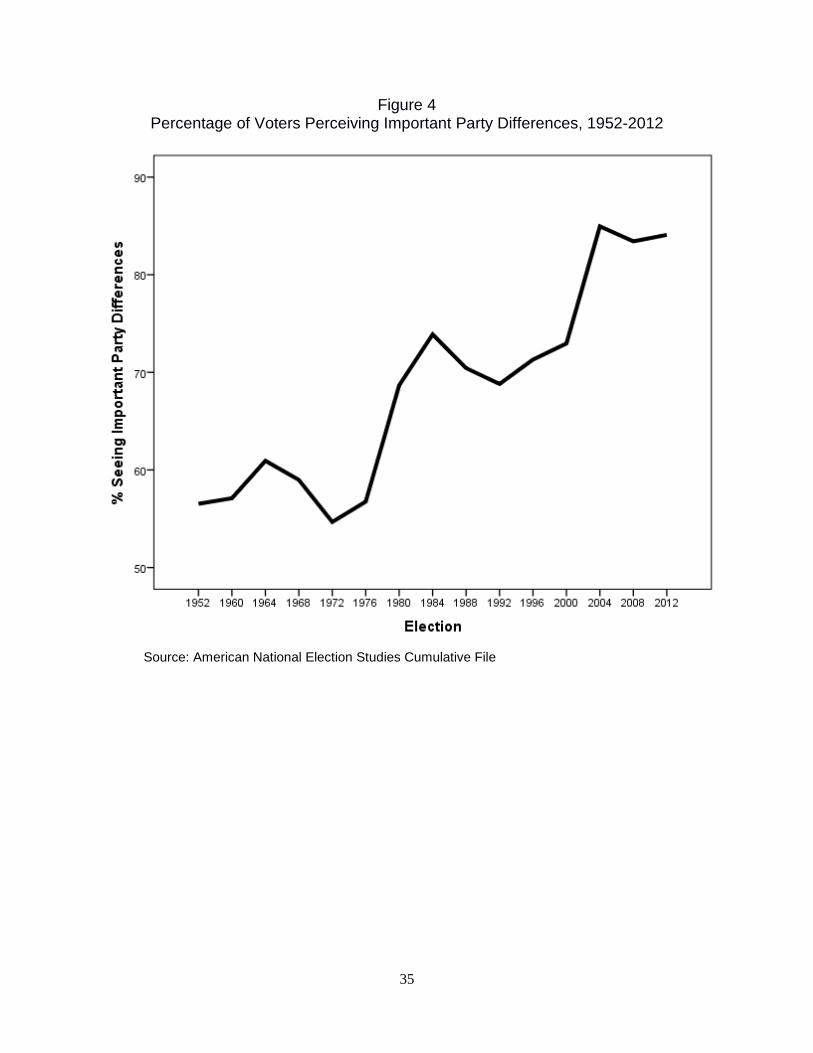
The data displayed in Figure 4 show that the proportion of voters perceiving important
differences between the two major parties has risen sharply in the past three decades. Between
the 1950s and the 1970s there was little change on this question: the proportion of voters who
saw important differences between the two major parties ranged between 55 and 60 percent
during this period. Awareness of important party differences barely budged even in 1964 when
Lyndon Johnson and Barry Goldwater offered voters sharply contrasting positions on a wide
range of policy issues. As the racial and ideological divides between the parties grew from the
1980s onward, however, voters became increasingly likely to perceive important differences
between the two major parties: the proportion rose to around 70 percent between 1980 and 2000
and to over 80 percent between 2004 and 2012. Moreover, this shift occurred among across all
categories of party identifiers. Between the 1950s and the 2000s, awareness of important
differences rose from 67 percent to 91 percent among strong identifiers, from 50 percent to 83
percent among weak party identifiers and from 55 percent to 81 percent among leaning
independents.
[Figure 4 goes here]
As predicted by the theory of negative partisanship, as the racial and ideological divides
between the parties have increased, supporters of each party have come to hold increasingly
negative views of the opposing party (Iyengar, Sood and Lelkes 2012; Bafumi and Shapiro 2009;
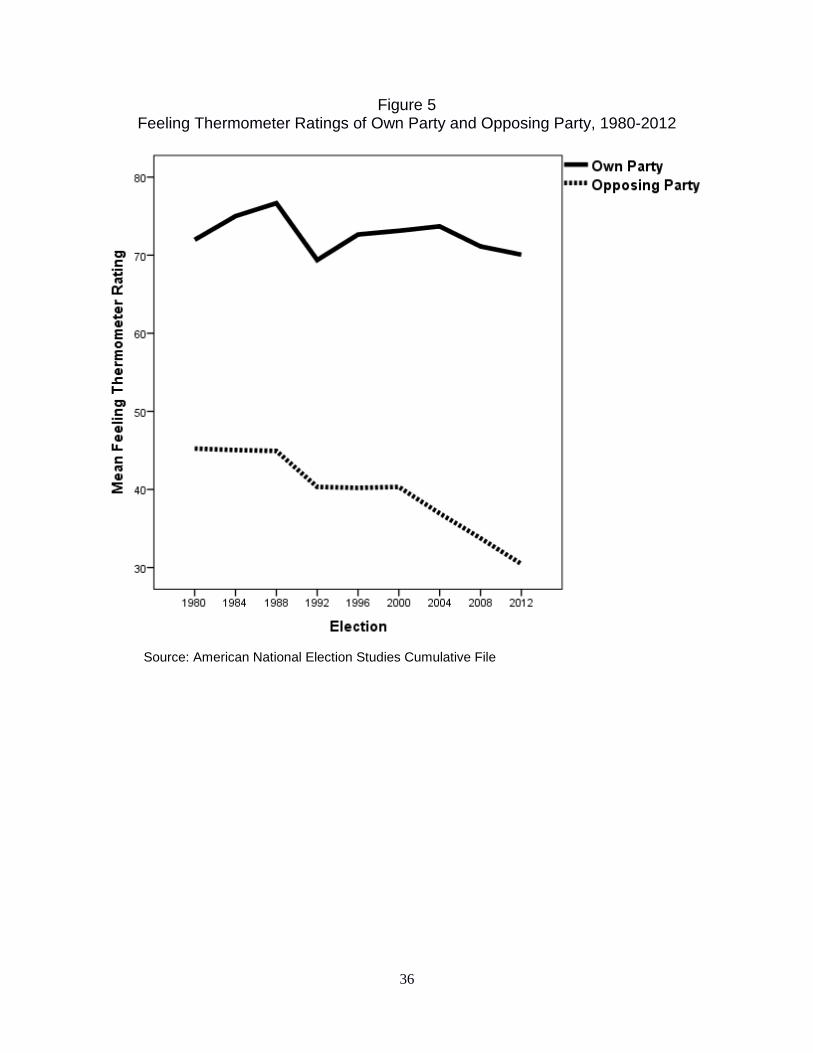
Jacobson 2007; Abramowitz 2015). This is clearly evident in Figure 5 which displays the trend
in the mean rating by party identifiers, including leaning independents, of their own party and the
12
opposing party on the ANES feeling thermometer scale. This is a scale that ranges from zero
degrees, the most negative rating, to 100 degrees, the most positive rating. A rating of 50
degrees on the scale is labelled neutral.
[Figure 5 goes here]
The data in Figure 5 show that party identifiers’ ratings of their own party have changed
very little over this time period. The average rating by voters of their own party went from 72
degrees in 1980 to 70 degrees in 2012. In contrast, ratings by voters of the opposing party have
fallen sharply over this time period. The average rating by voters to the opposing party fell from
45 degrees in 1980 to 30 degrees in 2012. Moreover, this increase in negative feelings toward
the opposing party cut across all party identification categories. Between 1980 and 2012 the
mean rating of the opposing party on the feeling thermometer scale fell from 41 degrees to 24
degrees among strong party identifiers, from 47 degrees to 36 degrees among weak party
identifiers and from 48 degrees to 35 degrees among leaning independents.
Today, far larger proportions of Democratic and Republican voters hold strongly negative
views of the opposing party than in the past. In 1980, 55 percent of voters gave the opposing
party a neutral or positive rating while only 27 percent gave the opposing party a rating of 30
degrees or lower. In contrast, in 2012, only 26 percent of voters gave the opposing party a
neutral or positive rating while 56 percent gave the opposing party a rating of 30 degrees or
lower. These increasingly negative opinions of the opposing party among all categories of party
identifiers have been a major factor in the rise of party loyalty and straight ticket voting.
Explaining Partisan Behavior
According to the theory of negative partisanship, perceptions of important party differences
and strongly negative feelings about the opposing party have contributed to the very high levels
13
of party loyalty in the American electorate in recent elections. If this is the case, then we should
find that these attitudes predict loyalty in voting even after controlling for strength of party
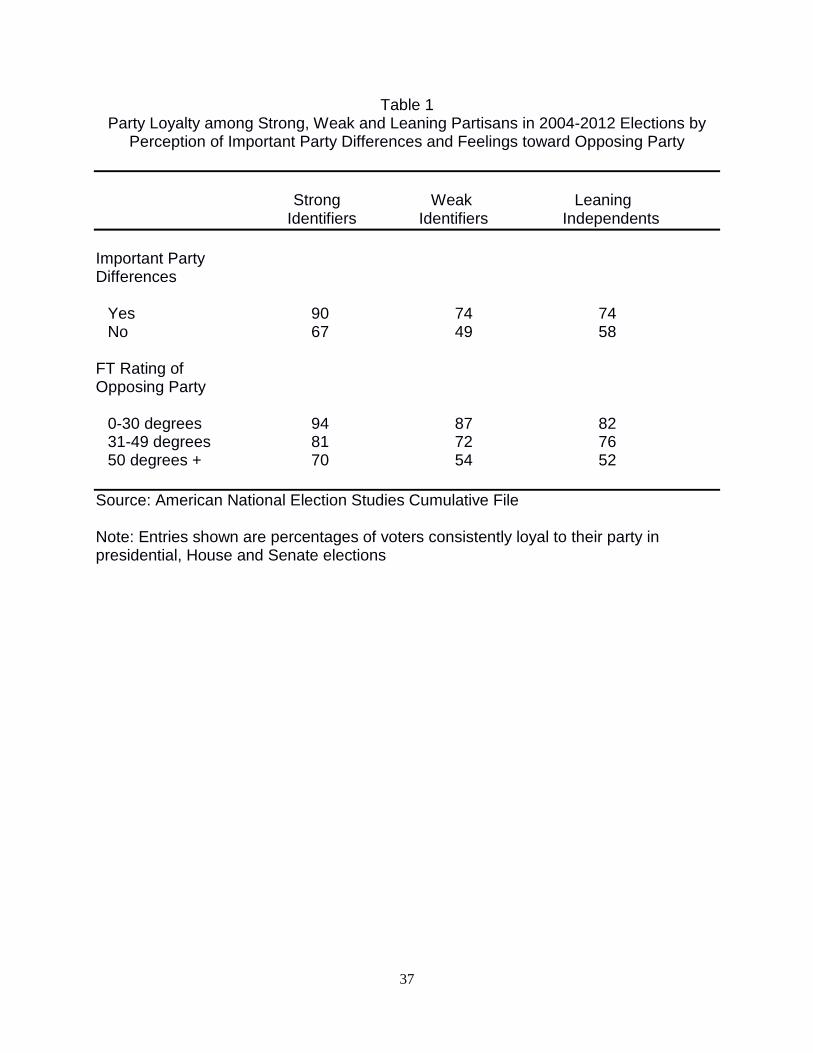
identification. In order to test this hypothesis, Table 1 displays the relationship between party
loyalty in the 2004-2012 elections and both perceptions of important party differences and
feelings toward the opposing party among three types of partisans—strong identifiers, weak
identifiers and leaning independents.
[Table 1 goes here]
The results in this table show that even after controlling for strength of party identification,
perceptions of important party differences and feelings toward the opposing party had clear
effects in the predicted direction on party loyalty.2 Among strong identifiers, weak identifiers
and leaning independents alike, those who perceived important party differences were much
more likely to vote consistently for their party’s candidates than those who did not perceive such
differences. Likewise, those who rated the opposing party at 30 degrees or lower on the feeling
thermometer scale were much more likely to vote consistently for their party’s candidates than
those who rated the opposing party at 50 degrees or higher.
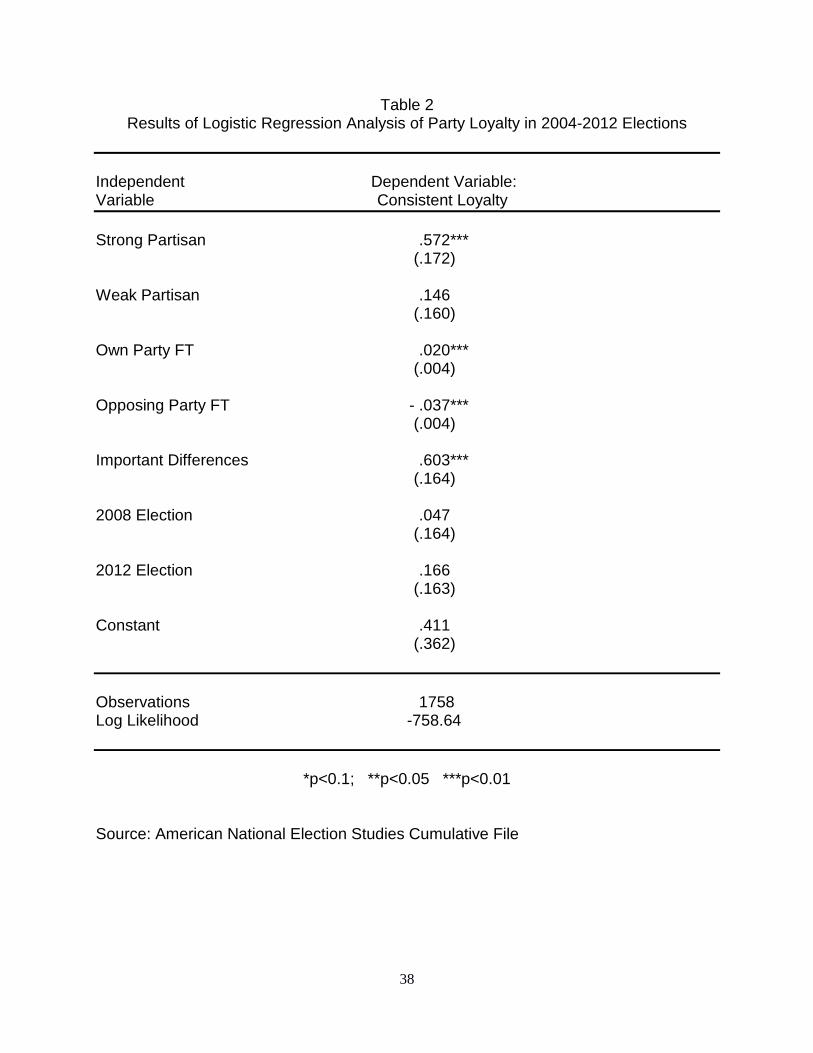
As a further test of the negative partisanship theory, we conducted a logistic regression
analysis of party loyalty among all voters identifying with a party, including leaning
independents, in the 2014-2012 elections. For this analysis, the dependent variable is our
dichotomous measure of consistent party loyalty. Our independent variables are strength of
party identification, measured by dummy variables for strong party identifiers and weak party
identifiers (with leaning independents as the contrast category); a dummy variable that measures
whether a voter perceives important party differences; and feeling thermometer ratings by voters
2 All of these relationships are statistically significant at the .01 level based on one-tailed t-tests.
14
of their own party and the opposing party. The results of this logistic regression analysis are
displayed in Table 2.
In these three elections, voters who perceived important differences between the two
parties were more likely to be consistently loyal than those who do not perceive such differences.
The coefficient estimate on this variable is .603 and is significant at the .001 level. Additionally,
voters who identify as strong partisans are more likely than others to vote consistently for their
party’s candidates. Given the effect of our strong partisan identifier variable, the coefficient for
weak partisans falls well short of statistical significance. The strongest predictors of partisan
loyalty are voters’ feeling thermometer ratings of their own party and the opposing party. Both
of these variables are highly statistically significant predictors in the model (p < .001) and, given
the scale on which they are measured, both are substantively significant as well. However, the
more important of these two variables is the assessment of the opposing party. As predicted by
our negative partisanship theory, regardless of the strength of their attachment to their own party,
the more voters dislike the opposing party, the greater the probability that they will vote
consistently for their own party’s candidates.
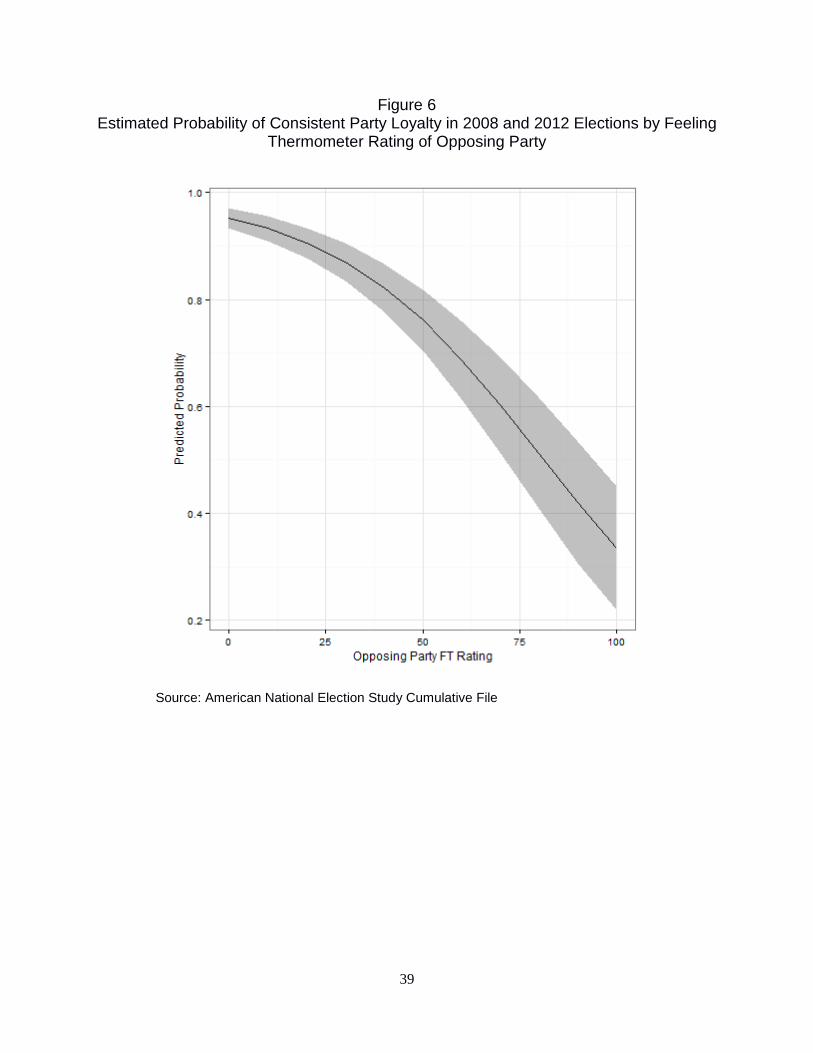
To facilitate comprehension of our model and to illustrate this phenomenon, we present a
predicted probability graph of consistent party loyalty in the 2004, 2008 and 2012 elections
depending on voters’ ratings of the opposing party on the feeling thermometer scale. The
estimates shown in Figure 6 are for strong party identifiers, with the “perceives important
differences” variable and voters’ ratings of their own party set at their mean values. Because our
dummy variables for the 2008 and 2012 elections fall well short of reaching statistical
significance, they are set to zero in the calculation of our predicted probabilities.
[Figure 6 goes here]
15
The results displayed in this figure show that the probability of consistent loyalty is much
greater among strong party identifiers who dislike the opposing party than among those who are
neutral or feel favorably toward the opposing party. For strong identifiers who rate the opposing
party at zero on the feeling thermometer scale, the model predicts a 95 percent chance of
consistent loyalty. As feeling thermometer ratings of the opposing party increase, the probability
of consistent loyalty sharply declines. For strong identifiers rating the opposing party at 50
degrees, the model predicts only a 76 percent chance of consistent loyalty. Our results indicate
that even among strong party identifiers, dislike of the opposing party is a strong predictor of
party loyalty. It therefore seems reasonable to conclude that along with increasing awareness of
party differences, increasing negativism toward the opposing party has contributed significantly
to the rise of party loyalty and straight ticket voting in recent years.
Nationalization of House Elections
One of the most important consequences of growing party loyalty and straight ticket voting
since the 1980s has been the increasing nationalization of congressional elections: a growing
connection between the outcomes of presidential elections and the outcomes of congressional
elections. This trend has been very evident in contests for the U.S. House of Representatives. In
2012, the correlation between the Democratic share of the U.S. House vote and the Democratic
share of the presidential vote in districts with contested races was an astonishing .95. This was
the strongest correlation for any election since data on the presidential vote in House districts
became available in 1952. In the 2014 midterm election, the correlation between the Democratic
share of the House vote and the Democratic share of the 2012 presidential vote across all districts
with contested races was .94. This was the strongest correlation for any midterm election in the
past sixty years.
16
There has been a very sharp increase in the connection between presidential and House
elections since the 1970s: the correlation between the Democratic share of the House vote and
the Democratic share of the presidential vote in districts with contested races averaged .54
between 1972 and 1980, .65 between 1982 and 1990, .78 between 1992 and 2000, .83 between
2002 and 2010 and .94 in 2012-2014. In terms of shared variance, the relationship between
presidential and House elections is now three times stronger than it was in the 1970s.
These results indicate that there have been important changes in the determinants of House
election outcomes over the past several decades. In particular, these results suggest the relative
importance of district presidential partisanship may be increasing at the expense of more local
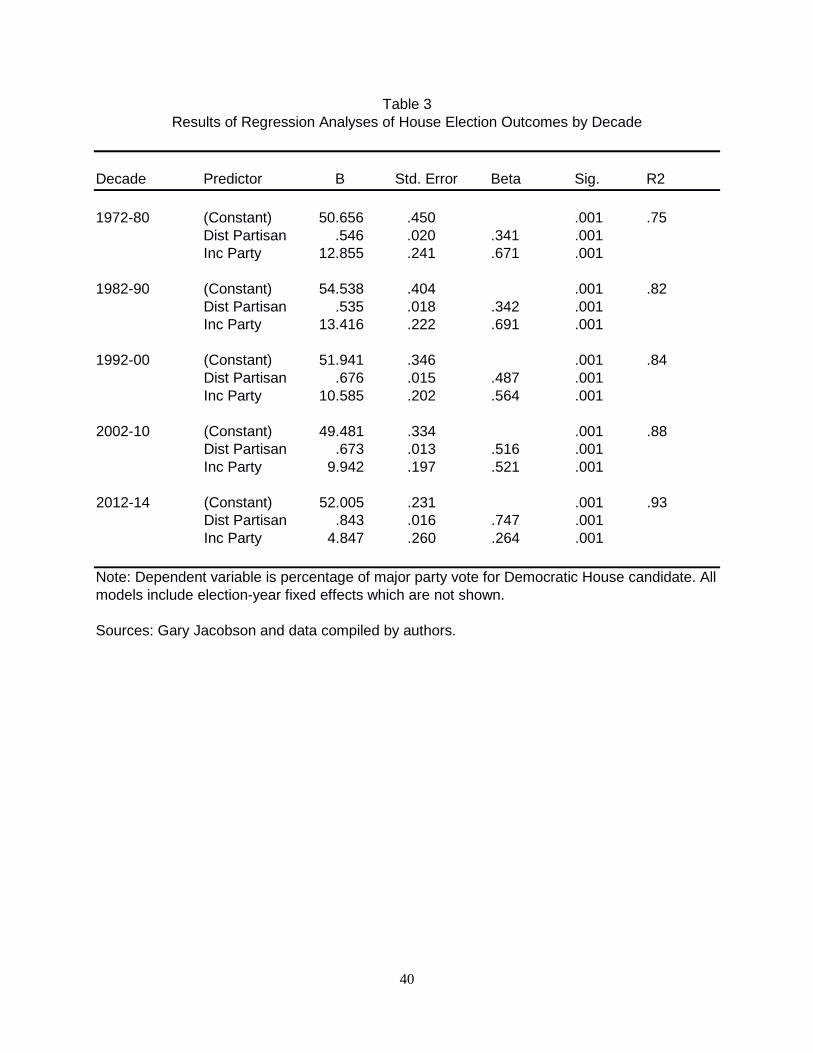
factors, especially the personal advantage of incumbency. In order to test this hypothesis and to
measure changes in the relative influence of presidential partisanship and incumbency on the
outcomes of individual House races over time, we conducted regression analyses of these
outcomes for each decade since the 1970s. Our dependent variable in these analyses is the
Democratic percentage of the major party vote.
The independent variables in our regression equations are the Democratic share of the
major party presidential vote in each district in relation to the nation, the party of the House
incumbent, coded as +1 for contests with Democratic incumbents, 0 for open seat contests and -1
for contests with Republican incumbents. In addition, because our data is measured at the
district-level and the errors in explaining election outcomes in district i at time t are likely to be
correlated with outcomes in that same district at time t-2, we included election-year fixed effects
in each model. For the sake of clarity in presentation, we did not include the estimates for the
election-year fixed effects in Table 3.
[Table 3 goes here]
17
The results in Table 3 show that there were drastic changes in the effects of our two key
independent variables during the five decades included in this analysis. The overall explanatory
power of our model increased substantially over time. However, this increase was due entirely
to the increased influence of district partisanship. An examination of the unstandardized
regression coefficients shows that the effect of district presidential partisanship increased
considerably over time with the largest increase occurring during the most recent time period.
By contrast, the effect of incumbency decreased slightly during the 1990s and 2000s and then
dropped dramatically in the most recent time period. Along the same lines, a comparison of the
standardized regression coefficients for district partisanship and incumbency in each time period
shows that the influence of district partisanship relative to incumbency increased somewhat
during the 1990s and 2000s and then rose dramatically in the most recent time period. These
results show that as the importance of district partisanship has grown in House elections, the
personal advantage of incumbency has declined. As a result, compared with the 1970s and
1980s, the electoral fortunes of House incumbents now depend much less on how effectively
they cultivate their constituencies and much more on the partisan makeup of those
constituencies.
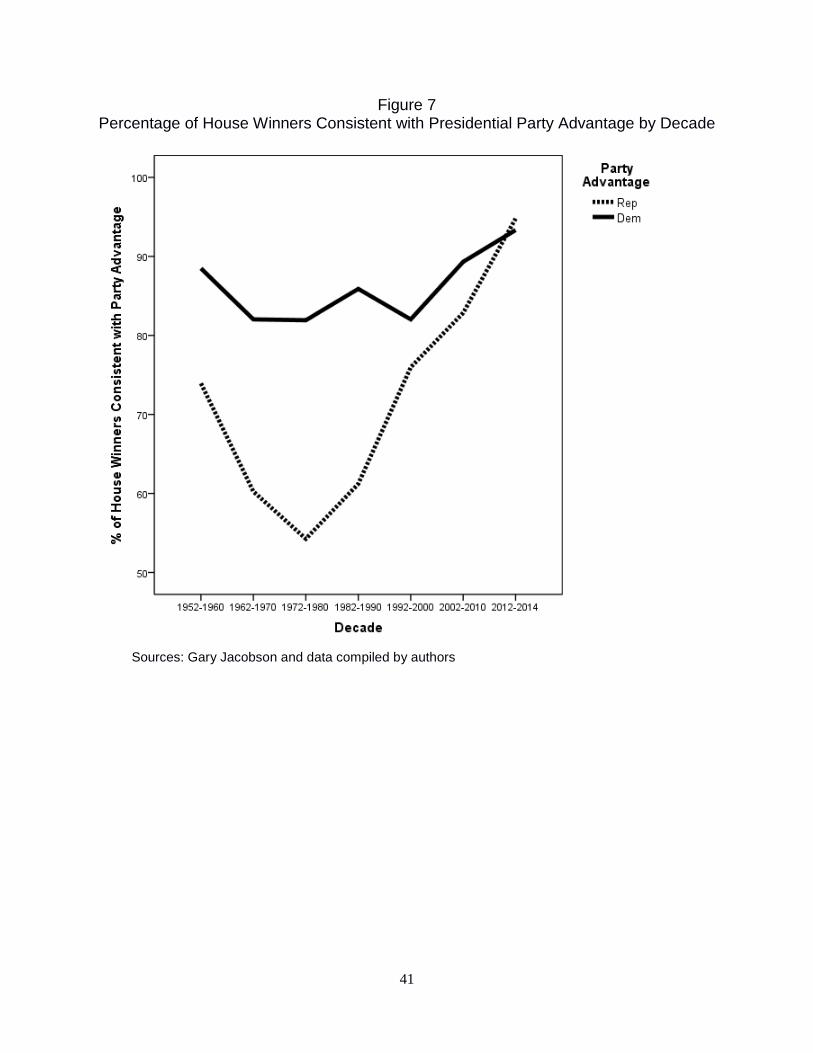
These results demonstrate that House elections have experienced a strong trend toward
nationalization over the past several decades. The outcomes of House elections are now
determined to a much greater degree than in the recent past by the relative strength of the
Democratic and Republican presidential candidates in House districts. This shift is readily
apparent in Figure 7 which displays the trends in the percentage of House contests won by
Democrats and Republicans in House districts that favor each party based on the results of
presidential elections. The favored presidential party is determined here by the Democratic share
18
of the major party presidential vote in the district compared with the Democratic share of the
major party presidential vote in the nation. A district in which the Democratic share of the major
party presidential vote is greater than the Democratic share of the major party presidential vote in
the nation is considered a Democratic-leaning district while a district in which the Democratic
share of the major party presidential vote is less than the Democratic share of the major party
presidential vote in the nation is considered a Republican-leaning district.3
[Figure 7 goes here]
The results displayed in Figure 7 show that since 1990 there has been a very sharp increase
in the proportion of House contests won by the candidate of the favored presidential party.
However this increase has been much greater in Republican-leaning districts than in Democratic-
leaning districts. Between the 1960s and the 1980s, Republicans won less than 60 percent of
House races in districts that were more Republican than the nation in presidential elections. In
contrast, during this time period, Democrats won about 80 percent of House races that were more
Democratic than the nation in presidential elections. Since 1994, however, and especially since
2010, GOP candidates have enjoyed much more success in Republican-leaning districts. This
improvement in Republican fortunes is directly related to the increasing connection between
presidential and House voting.
The Republican takeover of the House in the 2010 midterm election was due largely to the
party’s gains in Republican-leaning districts. Prior to the 2010 election, Republicans held only
165 out of 232 House seats in Republican-leaning districts. Republicans captured 52 of the 67
Democratic seats in these Republican-leaning districts. As a result, the Republican share of seats
in these districts went from 71 percent to 94 percent. In contrast, the Republican share of seats in 3 By controlling for short-term factors favoring one party or the other in a specific presidential election, this measure provides a more accurate gauge of the underlying partisan orientation of House districts than simply using the winner of the presidential election.
19
Democratic-leaning House districts rose only slightly, from seven percent in 2010 to 13 percent
in 2012.
In the most recent time period, 2012-2014, there has been an extremely strong relationship
between presidential and House voting. As a result, in these elections Republicans have won a
remarkable 95 percent of contests in Republican-leaning districts while Democrats have won 93
percent of contests in Democratic-leaning districts. However, this pattern of strong partisan
consistency has worked to the advantage of Republicans because there are many more
Republican-leaning districts than Democratic-leaning districts.
Based on the 2012 presidential election results, there are currently 240 Republican-leaning
districts compared with only 195 Democratic-leaning districts. This is partly a result of partisan
gerrymandering by Republican state legislatures in the aftermath of the GOP’s big gains in the
2010 midterm elections. However, this Republican advantage is not new. Republicans have long
enjoyed an advantage in House elections as a result of the fact that, from the standpoint of
winning individual seats, Democratic voters are inefficiently distributed across House districts
(Erikson 1972, 2002; Chen and Rodden 2009; Rodden 2010; Sides and McGhee 2013; Cohn
2014). What has changed in recent years is not the proportion of Republican-leaning districts. It
is the ability of Republicans to convert their advantage in district presidential partisanship into
actual majorities of House seats and this change is directly attributable to the nationalization of
House elections.
Nationalization of Senate Elections
Senate elections have also become increasingly nationalized in recent years. The trend
there has been very similar to the trend in House elections but even more dramatic because the
connection between presidential and Senate elections was considerably weaker than the
20
connection between presidential and House elections as recently as the early 1990s. Thus, the
correlation between the Democratic share of the Senate vote and the Democratic share of the
presidential vote in states with contested Senate races was only .22 in 1992 and only .21 in 1994.
In sharp contrast, the correlation was .84 in 2010, .80 in 2012 and .89 in 2014. The average
correlation between the Democratic share of the presidential vote and the Democratic share of
the Senate vote in states with contested races has risen from .42 between 1992 and 2000 to .66
between 2002 and 2010 and to .84 in 2012-2014. This means that, in terms of shared variance,
the relationship is now more than four times stronger than it was during the 1990s.
As was true for House elections, these results indicate that there have been important
changes in the determinants of Senate election outcomes over the past three decades. And just as
with House elections, these results suggest the relative importance of presidential partisanship
has been increasing at the expense of more local factors, especially the personal advantage of
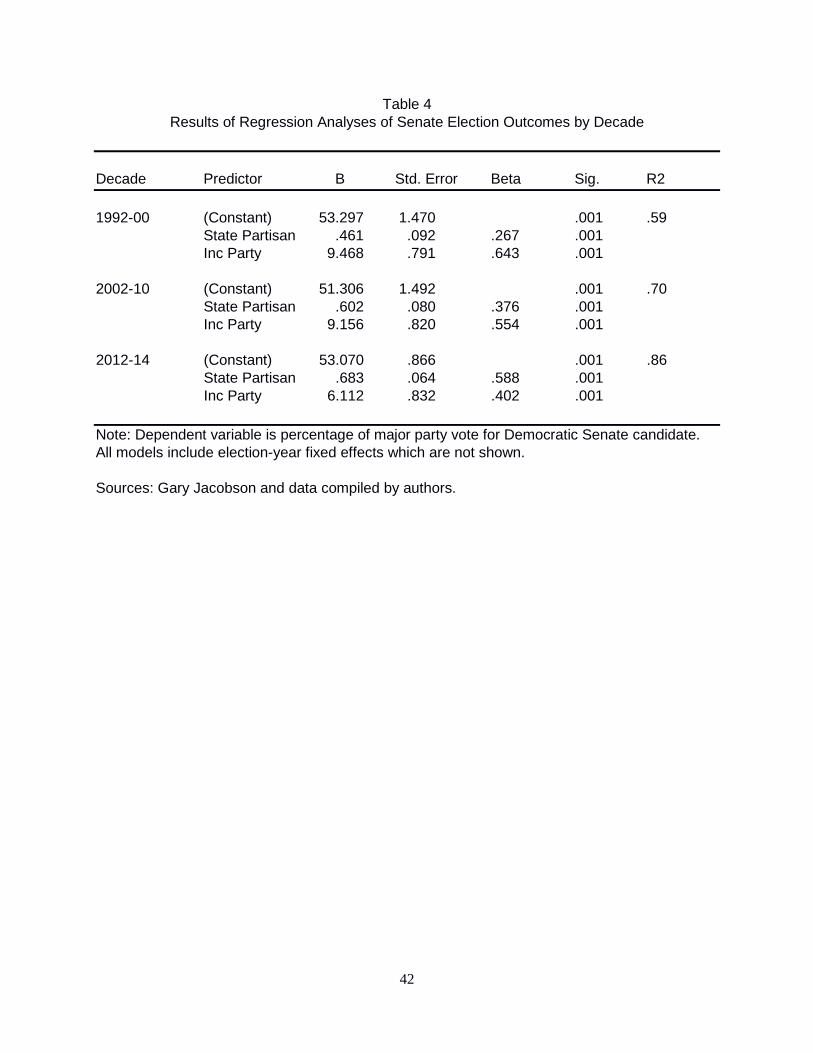
incumbency. In order to test this hypothesis and to measure changes in the relative influence of
presidential partisanship and incumbency on the outcomes of individual Senate races over time,
we conducted regression analyses of these outcomes for each decade since the 1990s. Our
dependent variable in these analyses is the Democratic percentage of the major party vote.
The independent variables in our Senate regression equations are the Democratic share of
the major party presidential vote in each state in relation to the nation, the party of the
incumbent, coded as +1 for contests with Democratic incumbents, 0 for open seat contests and -1
for contests with Republican incumbents. In addition, because our data is measured at the state-
level and the errors in explaining election outcomes in state i at time t are likely to be correlated
with outcomes in that same state at time t-6, we included election-year fixed effects in each
21
model. For the sake of clarity in presentation, we did not include the estimates for the election-
year fixed effects in Table 4.
[Table 4 goes here]
The results in Table 4 show the trends in Senate elections were very similar to those that
we found in House elections. There were drastic changes in the effects of our two key
independent variables during the three decades included in this analysis. The overall explanatory
power of our model increased substantially over time and, as with House elections, this increase
was due entirely to the increased influence of presidential partisanship. An examination of the
unstandardized regression coefficients shows that the effect of state presidential partisanship
increased considerably over time with the largest increase occurring during the most recent time
period. As was true for House elections, the effect of incumbency declined dramatically in the
most recent time period. A comparison of the standardized regression coefficients for state
partisanship and incumbency in each time period shows that the influence of state partisanship
relative to incumbency increased somewhat during the 2000s and then rose dramatically in the
most recent time period. As in the case of House elections, these results show that as the
importance of partisanship has grown in Senate elections, the personal advantage of incumbency
has declined. As a result, the electoral fortunes of Senate incumbents, like the electoral fortunes
of House incumbents, now depend less on their personal popularity and more on the partisan
makeup of their states than in the past.
Just as was the case for House elections, the nationalization of Senate elections has resulted
in a sharp increase in consistency between the outcomes of these two types of elections. We
classified states as Democratic-leaning or Republican-leaning in the same way that we classified
House districts. States in which the Democratic presidential candidate’s share of the major party
22
vote was greater than his share of the national major party vote were classified as Democratic-
leaning while those in which the Democratic presidential candidate’s share of the major party
vote was less than his share of the national major party vote were classified as Republican-
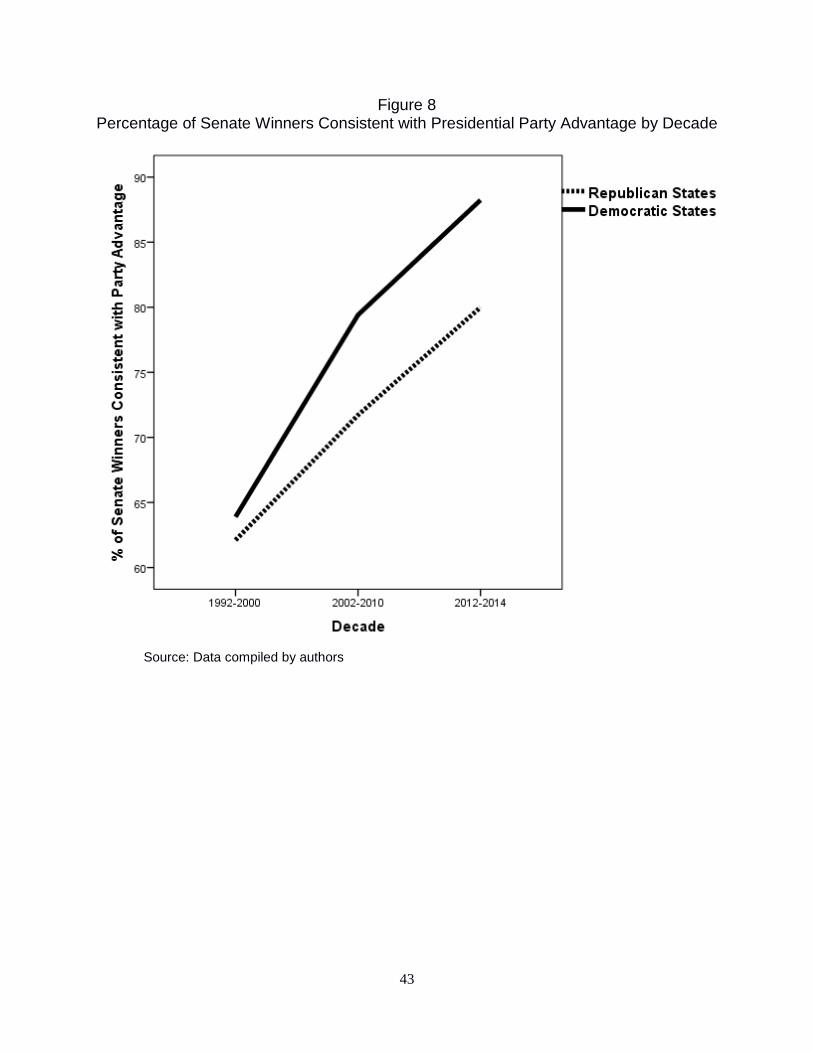
leaning. Figure 8 displays the trends in the proportions of Senate contests won by the
Democratic candidate in Democratic-leaning states and by the Republican candidate in
Republican-leaning states over the past three decades.
[Figure 8 goes here]
The results in this figure show that since the 1990s there has been a dramatic increase in the
proportion of Senate races won by the advantaged party. This trend has been somewhat stronger
in Democratic-leaning states but it is very evident in Republican-leaning states as well.
Democratic-leaning states are now much more likely to elect Democratic senators than they were
during the 1990s and Republican-leaning states are now much more likely to elect Republican
senators than they were during the 1990s. Thus, in 2014, 33 of 36 Senate contests were won by
the candidate of the advantaged party—Democrats won 12 of 15 contests in states that were
more Democratic than the nation in the 2012 presidential election and Republicans won all 21
contests in states that were more Republican than the nation in the 2012 presidential election.
The results of presidential elections in the states since 1992 show that just as in House
elections, Republicans enjoyed a significant advantage in Senate elections as a result of the way
supporters of the two parties are distributed across Senate districts—the 50 states. In the case of
Senate elections, this advantage reflects the fact that Democratic voters are heavily concentrated
in the large urban areas of the nation’s most populous states. However, these states have the
same number of senators as sparsely populated, predominantly rural states which tend to elect
Republicans. As a result, in the 12 elections between 1992 and 2012 there were substantially
23
more Republican-leaning states than Democratic-leaning states. Altogether, 57 percent of Senate
races during these years took place in states in which the Republican share of the presidential
vote was above the national average.
There was considerable variation in the proportion of Republican-leaning states across the
three Senate classes. Only 48 percent of states with class one Senate seats—those elected in
1994, 2000, 2006 and 2012—leaned Republican. In contrast, 64 percent of states with class two
Senate seats—those elected in 1996, 2002, 2008 and 2014—leaned Republican and 59 percent of
states with class three Senate seats—those elected in 1992, 1998, 2004 and 2010—leaned
Republican. The results of Senate elections between 1992 and 2014 generally reflected the
relative partisan tilt of each class: during these years Republican candidates won only 38 percent
of Senate contests in class one states compared with 59 percent of Senate contests in class two
states and 54 percent of Senate contests in class three states.
The results displayed in Figure 8 show that between the 1992-2000 elections and the 2012-
2014 elections, both parties substantially improved their performance in states in which they
were advantaged based on presidential election results. In each decade, however, Democratic
candidates won a somewhat larger share of seats in Democratic-leaning states than Republican
candidates won in Republican-leaning states. In the 2012-2014 elections, for example,
Democratic candidates won 88 percent (30 of 34) of contests in Democratic-leaning states while
Republican candidates won 80 percent (28 of 35) of contests in Republican-leaning states.
The success of Democratic candidates in winning Senate races in Republican-leaning states
was a crucial factor in the party’s ability to hold and slightly expand its majority in the upper
chamber in the 2012 election. In that year, Democrats won seven of 14 races in Republican-
leaning states as well as 18 of 19 contests in Democratic-leaning states. In 2014, however,
24
Republicans won all 21 contests in Republican-leaning states including seven races for seats
previously held by Democrats. Republicans also won three of the 15 contests in Democratic-
leaning states including two races for seats previously held by Democrats. The result was a gain
of nine seats for Republicans giving them a total of 54 seats and control of the Senate for the first
time in eight years.
By 2016, Republicans will have held a majority of the seats in the House of
Representatives for 18 out of 24 years. But they will have held a majority of the seats in the
Senate for only 12 of those 24 years. Democrats have fared better in recent Senate elections than
in recent House elections because of their success in winning Senate contests in states that lean
Republican in presidential elections. The question now is whether, given the increasing
nationalization of Senate elections, Democrats will be able to continue winning such contests in
the future. If they cannot, we may see a Republican advantage in Senate elections similar the
party’s recent advantage in House elections.
Discussion and Conclusions
Regardless of the strength of their attachment to the Democratic Party or the Republican
Party, American voters in the 21st century are much more likely to hold strongly negative views
of the opposing party than in the past. The rise of this sort of negative partisanship in the
American electorate has led to the highest rates of party loyalty and straight ticket voting in the
past sixty years. As a result, to a much greater degree than at any time in the previous 50 years,
the outcomes of House and Senate elections reflect the relative strength of the presidential parties
in the 435 House districts and the 50 states.
As the influence of presidential partisanship has risen, the personal advantage of
incumbency has decreased. This has made it much more difficult for incumbents in difficult
25
districts or states to survive by cultivating their constituencies. The overwhelming majority of
House and Senate races now are won by the party that is favored based on the presidential vote
in the district or state. This growing nationalization of congressional elections has important
consequences for party performance, representative democracy, and governance.
First, our results suggest that the recent Republican advantage in House elections is likely
to persist for some time. The most important factor explaining the current Republican advantage
in House elections is the inefficient distribution of Democratic voters in the electorate combined
with the increasingly partisan behavior of the American electorate. As a result, Republican
House candidates are now winning over 90 percent of districts that are more Republican than the
national average in presidential elections. While Republican candidates are doing worse in
Democratic-leaning districts than they did in the past, there are fewer such districts and their
performance in them has declined only slightly over time. Republicans enjoy a similar
advantage in Senate elections due to the extreme overrepresentation of sparsely populated rural
states and the fact that Democratic voters are heavily concentrated in more populous states with
large urban areas. Until 2014, Democrats were able to overcome this disadvantage by winning a
somewhat larger share of Senate contests in Republican-leaning states than Republicans were
able to win in Democratic-leaning states. Given the growing nationalization of Senate elections,
however, it is unclear whether Democrats will be able to continue winning enough seats in
Republican-leaning states to offset the GOP’s natural advantage in Senate elections.
In addition to making election outcomes more predictable, the rise of negative partisanship
and the growing nationalization of American politics have had important consequences for
representation in the House and the Senate. The growing proportions of districts and states that
strongly favor one party combined with the increasingly partisan behavior of the electorate mean
26
that representation of constituents’ policy preferences is almost entirely limited to partisan
representation. There is no incentive for most members of Congress to consider the views of
supporters of the opposing party. They are unlikely to win many of their votes and they
generally do not need their votes. As a result, most Republicans are only concerned about the
preferences of Republican voters in their district or state and most Democrats are only concerned
about the preferences of Democratic voters in their district or state.
Today, only a relatively small number of members who represent districts or states that tilt
toward the opposing party are likely to be concerned about winning over voters outside of their
own party. However, these members are finding this task increasingly difficult as the personal
advantage of incumbency diminishes. Thus, Republican gains in the 2014 Senate elections were
aided by the inability of Democratic incumbents to use their personal popularity to overcome
their party’s growing unpopularity in states such as Arkansas, Alaska and Louisiana.
The rise of partisan representation has had a substantial impact on the legislative process
itself. While Mayhew (2002) found that divided party control of government did not lead to a
decline in legislative productivity during an earlier time period, our results suggest that this
conclusion may not be valid in the current era of intensified partisan polarization. Most
members of Congress have little reason to be concerned with “reaching across the aisle” to work
with leaders and members of the opposing party. In fact, doing so can actually be risky to one’s
political career. With divided government likely to be a frequent occurrence and little or no
incentive for bipartisan compromise, our findings suggest that confrontation and gridlock are
almost certain to characterize the policy-making process in Washington for the foreseeable
future.
27
References Abramowitz, Alan I. 2013. The Polarized Public: Why American Government is So
Dysfunctional. New York: Pearson Longman.
Abramowitz, Alan I. 2015. “Partisan Nation: The Rise of Affective Partisanship in the
American Electorate,” in John C. Green, Daniel J. Coffey, and David B. Cohen, eds., The
State of the Parties: The Changing Role of Contemporary American Parties, 7th edition.
New York: Rowman and Littlefield.
Ansolabehere, Stephen, Snyder, James M., and Charles Stewart. 2001. “Candidate Positioning
in U.S. House Elections.” American Journal of Political Science 45 (1): 136-159.
Bafumi, Joseph, and Robert Y. Shapiro. 2009. “A New Partisan Voter.’’ The Journal of
Politics 71 (1): 1-24.
Bafumi, Joseph, and Michael C. Herron. 2010. “Leapfrog Representation and Extremism: A
Study of American Voters and Their Members in Congress.” American Political Science
Review 104 (3): 519-542.
Barreto, Matt, and Gary M. Segura. 2014. Latino America: How America’s Most Dynamic
Population is Poised to Transform the Politics of the Nation. Philadelphia: Public Affairs.
Bartels, Brandon L. In Press. “The Sources and Consequences of Polarization in the U.S.
Supreme Court.” In James Thurber and Antoine Yoshinaka, eds., American Gridlock.
New York: Cambridge University Press.
Clark, Tom S. 2009. “Measuring Ideological Polarization on the United States Supreme Court.”
Political Research Quarterly 62 (1): 146-157.
28
Chen, Joewi, and Jonathan Rodden. 2009. “Tobler’s Law, Urbanization, and Electoral Bias:
Why Compact, Contiguous Districts are bad for the Democrats.” Unpublished paper,
Department of Political Science, Stanford University.
Cohn, Nate. 2014. “Why Democrats Can’t Win the House.” The New York Times:
http://www.nytimes.com/2014/09/07/upshot/why-democrats-cant-
win.html?abt=0002&abg=1. Accessed on February 9, 2015.
Erikson, Robert S. 1972. “Malapportionment, Gerrymandering, and Party Fortunes in
Congressional Elections.” American Political Science Review 66 (4): 1234-1245.
Erikson, Robert S. 2002. “Sources of Partisan Bias in U.S. Congressional Elections: An Update
Stimulated by Ron Johnston’s Essay.” Political Geography 21 (1): 49-54.
Frey, William. 2008. “Race, Immigration, and America’s Changing Electorate,” in Ruy A.
Teixeira, ed., Red, Blue, and Purple America: The Future of Election Demographics.
Washington, D.C.: Brookings Institution Press.
Frey, William H. 2015. Diversity Explosion: How New Racial Demographics are Remaking
America. Washington, D.C.: Brookings Institution Press.
Greenberg, Stanley B. 2004. The Two Americas: Our Current Political Deadlock and How to
Break It. New York: St. Martin’s Press.
Hillygus, D. Sunshine, and Todd G. Shields. 2008. The Persuadable Voter: Wedge Issues in
Presidential Campaigns. Princeton, NJ: Princeton University Press.
Hood III, M.V., Kidd, Quentin, and Irwin L. Morris. 2004. “A Report on the Reintroduction of
the Elephas Maximus in the Southern United States: Explaining the Rise of Republican
State Parties, 1960-2000.” American Politics Research (32): 68-101.
29
Iyengar, Shanto, Gaurov Sood, and Yphtach Lelkes. 2012. “Affect, Not Ideology: A Social
Identity Perspective on Polarization.” Public Opinion Quarterly 76 (3): 405-431.
Izadi, Elahe. 2014. “Congress Sets Record for Voting along Party Lines,” National Journal:
http://www.nationaljournal.com/congress/congress-sets-record-for-voting-along-party-
lines-20140203. Accessed on March 27, 2015.
Jacobson, Gary C. 2005. “Polarized Politics and the 2004 Congressional and Presidential
Elections.” Political Science Quarterly 120 (2): 199-218.
Jacobson, Gary C. 2007. A Divided, Not a Uniter: George W. Bush and the American People.
New York: Pearson Longman.
Jones, Jeffrey M. 2014. “Record-High 42% of Americans Identify as Independents.” Gallup
Poll: http://www.gallup.com/poll/166763/record-high-americans-identify-
independents.aspx. Accessed March 19, 2015.
Kimball, David C., Summary, Bryce, and Eric C. Vorst. 2015. “Political Identity and Party
Polarization in the American Electorate,” in John C. Green, Daniel J. Coffey and David B.
Cohen, eds., The State of the Parties: The Changing Role of Contemporary American
Parties, 7th edition. New York: Rowman and Littlefield.
Kinder, Donald R., and Allison Dale-Riddle. 2012. The End of Race? Obama, 2008, and Racial
Politics in America. New Haven, CT: Yale University Press.
Kraushaar, Josh. 2014. “The Most Divided Congress Ever, at Least until Next Year,” National
Journal: http://www.nationaljournal.com/2013-vote-ratings/the-most-divided-congress-
ever-at-least-until-next-year-20140206. Accessed on March 27, 2015.
30
Mann, Thomas E., and Norman J. Ornstein. 2013. It’s Even Worse Than It Looks: How the
American Constitutional System Collided With the New Politics of Extremism. New York:
Basic Books.
Mayhew, David R. 2002. Divided We Govern: Party Control, Lawmaking, and Investigations,
1946-2002, 2nd edition. New Haven, CT: Yale University Press.
McCarty, Nolan, Poole, Keith T., and Howard Rosenthal. 2008. Polarized America: The Dance
of Ideology and Unequal Riches. Cambridge, MA: MIT University Press.
Newport, Frank. 2015. “U.S. Satisfaction with Religion Settling at Lower Levels.” Gallup
Poll: http://www.gallup.com/poll/181532/satisfaction-religion-settling-lower-
levels.aspx?utm_source=religion&utm_medium=search&utm_campaign=tiles.
Accessed on March 19, 2015.
Olson, Joel. 2008. “Whiteness and the Polarization of American Politics.” Political Research
Quarterly 61 (4): 704-718.
Pew Research Center. 2012. “ ‘Nones’ on the Rise.” Pew Research Center:
http://www.pewforum.org/2012/10/09/nones-on-the-rise/. Accessed on March 19, 2015.
Pew Research Center. 2014. “Political Polarization in the American Public: How Increasing
Ideological Uniformity and Partisan Antipathy Affect Politics, Compromise and Everyday
Life.” Pew Research Center: http://www.people-press.org/files/2014/06/6-12-2014-
Political-Polarization-Release.pdf. Accessed on April 3, 2015.
Rodden, Jonathan. 2010. “The Geographic Distribution of Political Preferences.” Annual
Review of Political Science 13: 321-340.
Shafer, Byron E., and Richard Johnston. 2006. The End of Southern Exceptionalism.
Cambridge, MA: Harvard University Press.
31
Shor, Boris, and Nolan McCarty. 2011. “The Ideological Mapping of American Legislatures.”
American Political Science Review 105 (3): 530-551.
Sides, John, and Eric McGhee. 2013. “Redistricting Didn’t Win Republicans the House.” The
Washington Post:
http://www.washingtonpost.com/blogs/wonkblog/wp/2013/02/17/redistricting-didn’t-
win-republicans-the-house. Accessed on February 7, 2015.
Sinclair, Barbara. 2006. Party Wars: Polarization and the Politics of National Policy Making.
Norman, OK: University of Oklahoma Press.
Stone, Geoffrey R. 2014. “Our Politically Polarized Supreme Court?” The Huffington Post:
http://www.huffingtonpost.com/geoffrey-r-stone/our-politically-
polarized_b_5879346.html. Accessed on March 20, 2015.
Tesler, Michael, and David O. Sears. 2010. Obama’s Race: The 2008 Election and the Dream
of a Post-Racial America. Chicago: University of Chicago Press.
Theriault, Sean M. 2008. Party Polarization in Congress. New York: Cambridge University
Press.
32
Figure 1 Trends in Consistent Party Loyalty among Democratic and
Republican Voters, 1952-2012
Source: American National Election Studies Cumulative File
33
Figure 2 Trends in Consistent Party Loyalty among Strong, Weak and Leaning
Party Identifiers, 1952-2012
Source: American National Election Studies Cumulative File
34
Figure 3 Mean Distance from Own Party and Opposing Party on Liberal-Conservative
Scale, 1972-2012
Source: American National Election Studies Cumulative File
35
Figure 4 Percentage of Voters Perceiving Important Party Differences, 1952-2012
Source: American National Election Studies Cumulative File
36
Figure 5 Feeling Thermometer Ratings of Own Party and Opposing Party, 1980-2012
Source: American National Election Studies Cumulative File
37
Table 1 Party Loyalty among Strong, Weak and Leaning Partisans in 2004-2012 Elections by
Perception of Important Party Differences and Feelings toward Opposing Party
Strong Weak Leaning Identifiers Identifiers Independents Important Party Differences Yes 90 74 74 No 67 49 58 FT Rating of Opposing Party 0-30 degrees 94 87 82 31-49 degrees 81 72 76 50 degrees + 70 54 52 Source: American National Election Studies Cumulative File Note: Entries shown are percentages of voters consistently loyal to their party in presidential, House and Senate elections
38
Table 2 Results of Logistic Regression Analysis of Party Loyalty in 2004-2012 Elections
Independent Dependent Variable: Variable Consistent Loyalty Strong Partisan .572*** (.172) Weak Partisan .146 (.160) Own Party FT .020*** (.004) Opposing Party FT - .037*** (.004) Important Differences .603*** (.164) 2008 Election .047 (.164) 2012 Election .166 (.163) Constant .411 (.362) Observations 1758 Log Likelihood -758.64
*p<0.1; **p<0.05 ***p<0.01
Source: American National Election Studies Cumulative File
39
Figure 6 Estimated Probability of Consistent Party Loyalty in 2008 and 2012 Elections by Feeling
Thermometer Rating of Opposing Party
Source: American National Election Study Cumulative File
40
Table 3 Results of Regression Analyses of House Election Outcomes by Decade
Decade Predictor B Std. Error Beta Sig. R2 1972-80 (Constant) 50.656 .450 .001 .75 Dist Partisan .546 .020 .341 .001 Inc Party 12.855 .241 .671 .001 1982-90 (Constant) 54.538 .404 .001 .82 Dist Partisan .535 .018 .342 .001 Inc Party 13.416 .222 .691 .001 1992-00 (Constant) 51.941 .346 .001 .84 Dist Partisan .676 .015 .487 .001 Inc Party 10.585 .202 .564 .001 2002-10 (Constant) 49.481 .334 .001 .88 Dist Partisan .673 .013 .516 .001 Inc Party 9.942 .197 .521 .001 2012-14 (Constant) 52.005 .231 .001 .93 Dist Partisan .843 .016 .747 .001 Inc Party 4.847 .260 .264 .001 Note: Dependent variable is percentage of major party vote for Democratic House candidate. All models include election-year fixed effects which are not shown. Sources: Gary Jacobson and data compiled by authors.
41
Figure 7 Percentage of House Winners Consistent with Presidential Party Advantage by Decade
Sources: Gary Jacobson and data compiled by authors
42
Table 4 Results of Regression Analyses of Senate Election Outcomes by Decade
Decade Predictor B Std. Error Beta Sig. R2 1992-00 (Constant) 53.297 1.470 .001 .59 State Partisan .461 .092 .267 .001 Inc Party 9.468 .791 .643 .001 2002-10 (Constant) 51.306 1.492 .001 .70 State Partisan .602 .080 .376 .001 Inc Party 9.156 .820 .554 .001 2012-14 (Constant) 53.070 .866 .001 .86 State Partisan .683 .064 .588 .001 Inc Party 6.112 .832 .402 .001 Note: Dependent variable is percentage of major party vote for Democratic Senate candidate. All models include election-year fixed effects which are not shown. Sources: Gary Jacobson and data compiled by authors.
43
Figure 8 Percentage of Senate Winners Consistent with Presidential Party Advantage by Decade
Source: Data compiled by authors

![POSITIVE AND NEGATIVE FEEDBACK IN POLITICS[ Positive and Negative Feedback in Politics ] 5 5 equilibrium. Positive and negative feedback processes lead alternately to the creation,](https://img.pdfslide.us/doc/110x75/5e6fc60d27274a5c975cef86/positive-and-negative-feedback-in-politics-positive-and-negative-feedback-in-politics.jpg)


![The Politics of Protest [week 17] The Rise of the Radical Right](https://img.pdfslide.us/doc/110x75/56649eda5503460f94be9982/the-politics-of-protest-week-17-the-rise-of-the-radical-right.jpg)