Embed Size (px)
Citation preview
1Scientific Data | (2020) 7:64 | https://doi.org/10.1038/s41597-020-0403-0
www.nature.com/scientificdata
all-hazards dataset mined from the US National Incident Management System 1999–2014Lise a. St. Denis1,2 ✉, Nathan P. Mietkiewicz1,2, Karen C. Short4, Mollie Buckland1,3 & Jennifer K. Balch1,2,3
This paper describes a new dataset mined from the public archive (1999–2014) of the U.S. National Incident Management System/Incident Command System Incident Status Summary Form (a total of 124,411 reports for 25,083 incidents, including 24,608 wildfires). This system captures detailed information on incident management costs, personnel, hazard characteristics, values at risk, fatalities, and structural damage. Most (98.5%) of the reports are fire-related, followed in decreasing order by other, hurricane, hazardous materials, flood, tornado, search and rescue, civil unrest, and winter storms. The archive, although publicly available, has been difficult to use due to multiple record formats, inconsistent free-form fields, and no bridge between individual reports and high-level incident analysis. Here, we describe this improved dataset and the open, reproducible methods used, including merging records across three versions of the system, cleaning and aligning with the current system, smoothing values across reports, and supporting incident-level analysis. This integrated record offers the opportunity to explore the daily progression of the most costly, damaging, and deadly events in the U.S., particularly for wildfires.
Background & SummaryThere has been a steady rise in the occurrence of billion-dollar disasters in the United States (U.S.) since the 1980s, with the past three years (2016–2018) each setting historic highs. The average number of billion-dollar disasters across this period has more than doubled (from 6 to 15 events per year1). Further, cumulative costs in 2017 set a new annual record of $306.2 billion2. There is evidence that the frequency and magnitude of natural disasters is changing, with some extreme weather events linked to anthropogenic climate change3, such as the intensity of tropical storms4. Further, within just the past few decades, the area burned by wildfi es in the western U.S. has increased at least threefold5–8, with a strong climate change influence for forest systems9. Th s is a critical moment to develop new methods and data sources to help understand the interrelationships between the physical and environmental characteristics of a hazard, the effectiveness of incident management strategies, and the societal impacts of these large-scale events.
Wildfi es and hurricanes are two natural hazards that cause signifi ant societal impacts, and require costly and complex incident response. In the last two years, damages from wildfi es alone have exceeded $40 billion1 and current suppression costs average $2-3 billion each year10. For example, in the last two years, California has seen the largest, costliest, and deadliest fires in state history. More than 33,000 homes burned and 130 people died in wildfi es in the past two years (www.iii.org/fact-statistic/facts-statistics-wildfi es#top). Another striking impact is that of hurricanes between 2016 and 2018, when six separate billion-dollar hurricanes made landfall in the U.S. with an inflation-adjusted total loss of $329.9 billion and 3,318 fatalities1. When these events turn into disasters with large societal impacts, they necessitate a government-coordinated response with critical documentation about how the event is unfolding and threats to life and property.
The Incident Command System Incident Status Summary Form 209 (ICS-209) captures a unique perspective across an important population of hazard events. It is intended specifi ally for signifi ant incidents that operate
1Earth Lab, 4001 Discovery Drive Suite S348–UCB 611, University of Colorado-Boulder, Boulder, Colorado, 80309, USA. 2Cooperative Institute for Research in Environmental Sciences, 216 UCB, University of Colorado-Boulder, Boulder, Colorado, 80309, USA. 3Department of Geography, GUGG 110, 260 UCB, University of Colorado-Boulder, Boulder, Colorado, 80309, USA. 4USDA Forest Service, Rocky Mountain Research Station, 800 Beckwith Ave., Missoula, MT, 59801, USA. ✉e-mail: [email protected]
DaTa DeSCrIPTor
oPeN
2Scientific Data | (2020) 7:64 | https://doi.org/10.1038/s41597-020-0403-0
www.nature.com/scientificdatawww.nature.com/scientificdata/
for an extended duration, compete with other incidents for scarce resources, or require signifi ant mutual aid/additional support and attention11. Further, the ICS-209 is intended for use when an incident becomes signifi ant enough to merit special attention, such as those that attract media attention, or when there is increased threat to public safety. Over 98% of the incidents in the dataset are wildfires. Although only 1–2% of wildfires become large incidents, they account for approximately 85% of total suppression costs and upwards of 95% of total acres burned each year12. The ICS-209 captures the best in-the-moment observations about the current and forecasted status of the hazard, current resources assigned, estimated costs, current and forecasted critical needs, and the societal and natural values currently at threat. These status summaries are required for each operational period of an incident response or when signifi ant events warrant a status update. As a result, these reports offer a unique opportunity to study the relationship between hazard characteristics, incident response, and the societal impacts/threats incrementally across all phases of active response.
Th s paper describes the methods used to create and refi e this dataset into a science-grade database. We provide a brief overview of the all-hazards dataset and then examine high-level spatial and temporal trends for wildfi es across several key variables captured by these reports. We compare these values with a larger population of wildfi es in the U.S. We then look in detail at relationships between these variables for the 2013 Rim Fire, a large catastrophic event, for insight into how these values might be combined with other sources of data such as satellite-derived datasets. We conclude by identifying the key opportunities for use of this dataset and how this open-source solution could be extended in the future.
MethodsData source. Historical data from the ICS-209s are archived by the National Wildfi e Coordinating Group (NWCG) on the Fire and Aviation Management Website (FAMWEB) in two formats: an HTML version of the forms (2001 to 2013), published at (https://fam.nwcg.gov/fam-web/hist_209/report_list_209), and the raw data, published annually on the FAMWEB homepage (https://fam.nwcg.gov/fam-web). We downloaded and compared the data from both sources and determined that the overlapping records were identical, yet the raw data covered a wider timespan, was more complete and included all records up to the most recent completed year. All data in the ICS-209-PLUS dataset are sourced from the raw data files, and the dataset is designed so that it can be extended as new data is released. We manually downloaded the raw data from FAMWEB, saving each table in Excel format. The data span three separate versions that we will refer to as Historical System 1 (HIST1) from 1999 to 2002, Historical System 2 (HIST2) from 2001 to 2013, and the current version (CURRENT) from 2014 to the present. The input tables for each of these versions are summarized in Table 1 below. The ICS-209-PLUS dataset is cur-rently truncated in 2014 due to missing tables and data duplication issues in 2015 through 2017. If these issues can be resolved, we will extend the dataset to include records from the most recent years. We describe the handling of data from overlapping years in the Purging Duplicate and Erroneous Records section below.
History of ICS. The ICS-209 form, commonly referred to as a sitrep, is part of the U.S. National Incident Management System/Incident Command System (NIMS/ICS). The earliest implementation of ICS was devel-oped by the U.S. Forest Service (USFS) following a devastating fi e in California in 1970 that claimed 16 lives, destroyed over 700 structures and burned over 500k acres. Numerous communication and coordination issues hampered the effectiveness of the agencies involved, resulting in a congressional mandate requiring the USFS to design a new system to facilitate interagency coordination and to support the allocation of suppression resources in dynamic, multi-fire situations13–15. The USFS worked in collaboration with California state agencies to produce
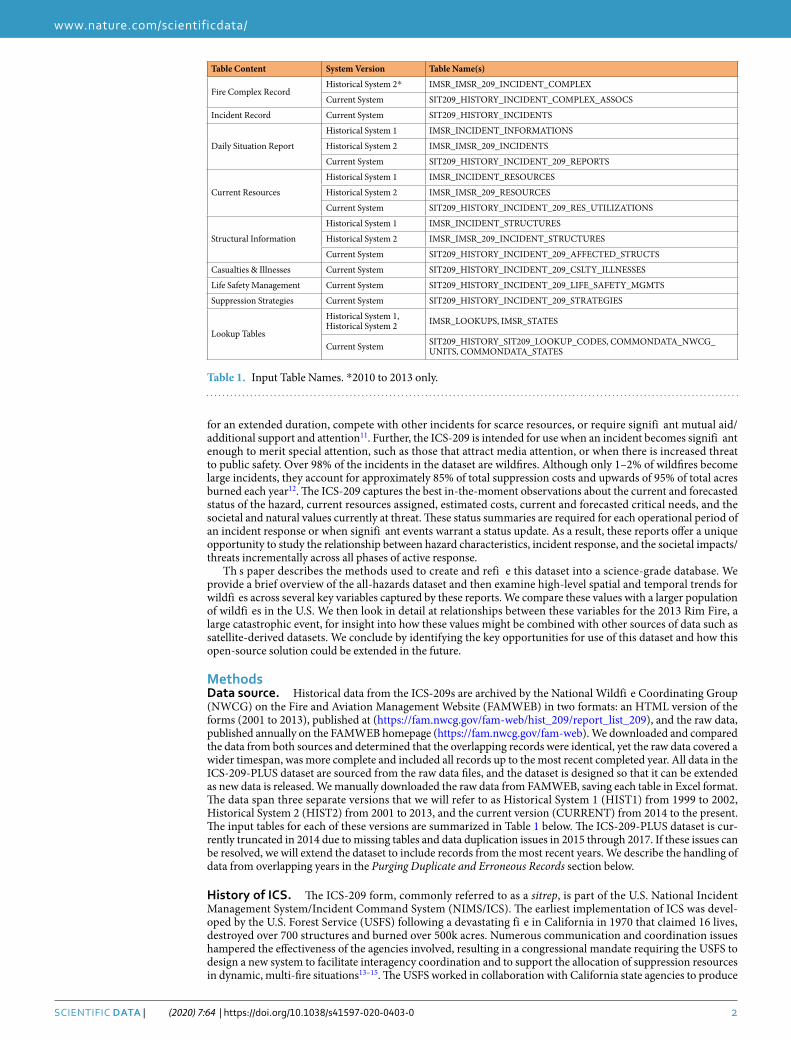
Table Content System Version Table Name(s)
Fire Complex RecordHistorical System 2* IMSR_IMSR_209_INCIDENT_COMPLEX
Current System SIT209_HISTORY_INCIDENT_COMPLEX_ASSOCS
Incident Record Current System SIT209_HISTORY_INCIDENTS
Daily Situation Report
Historical System 1 IMSR_INCIDENT_INFORMATIONS
Historical System 2 IMSR_IMSR_209_INCIDENTS
Current System SIT209_HISTORY_INCIDENT_209_REPORTS
Current Resources
Historical System 1 IMSR_INCIDENT_RESOURCES
Historical System 2 IMSR_IMSR_209_RESOURCES
Current System SIT209_HISTORY_INCIDENT_209_RES_UTILIZATIONS
Structural Information
Historical System 1 IMSR_INCIDENT_STRUCTURES
Historical System 2 IMSR_IMSR_209_INCIDENT_STRUCTURES
Current System SIT209_HISTORY_INCIDENT_209_AFFECTED_STRUCTS
Casualties & Illnesses Current System SIT209_HISTORY_INCIDENT_209_CSLTY_ILLNESSES
Life Safety Management Current System SIT209_HISTORY_INCIDENT_209_LIFE_SAFETY_MGMTS
Suppression Strategies Current System SIT209_HISTORY_INCIDENT_209_STRATEGIES
Lookup Tables
Historical System 1, Historical System 2 IMSR_LOOKUPS, IMSR_STATES
Current System SIT209_HISTORY_SIT209_LOOKUP_CODES, COMMONDATA_NWCG_UNITS, COMMONDATA_STATES
Table 1. Input Table Names. *2010 to 2013 only.
3Scientific Data | (2020) 7:64 | https://doi.org/10.1038/s41597-020-0403-0
www.nature.com/scientificdatawww.nature.com/scientificdata/
FIRESCOPE (FIrefi hting RESources of California Organized for Potential Emergencies) with two key compo-nents: the Incident Command System (ICS) and the Multi-Agency Coordination System (MACS13). By 1981, FIRESCOPE was used by agencies throughout Southern California and was adapted for non-fi e use. In parallel with this effort, the NWCG adopted and revised the FIRESCOPE ICS documentation to create the National Interagency Incident Management System (NIIMS) Incident Command System Operational System Description (ICS 120-1) - a document that was collectively maintained by CalFire and NWCG. Th s document later served as the basis for NIMS ICS15. Following the 2001 September 11th terrorist attacks in the U.S., the Department of Homeland Security (DHS) was formed, and on February 28, 2003, President George W. Bush issued Presidential Directive-516 calling for the establishment of a single, comprehensive national incident management system, which became NIMS.
NIMS ICS. The NIMS was issued in March 2004 to enable responders at all jurisdictional levels and disciplines to work together more effectively by establishing a single, comprehensive national incident management struc-ture14,15. In 2005, there was a push to institutionalize the use of ICS across the entire response system and by 2006, federal funding for state, local and tribal grants was tied directly to compliance with the NIMS15. The NIMS/ICS built upon existing incident management best practices including ICS and MACS. It fully delineates standardized command and control structures and procedures designed to support interoperability among jurisdictions and across disciplines as the complexity of a response effort increases. The planning function is centralized within ICS with information captured during each operational period fl wing up to the tactical and strategic planning level14.
The ICS 209 incident status summary. The Federal Emergency Management Association (FEMA) describes the purpose of the ICS-209 as follows: “The ICS 209 is used for reporting information on significant incidents … The ICS 209 contains basic information elements to support decision making at all levels above the incident to support the incident. Decision makers may include the agency having jurisdiction, but also all multi-agency coordination system (MACS) elements and parties, such as cooperating and assisting agencies/organizations, dispatch centers, emergency operation centers, administrators, elected offi als, and local, tribal, county, State, and Federal agencies.”11. The ICS-209 is described as providing a “snapshot in time”, capturing the most accurate and up-to-date information available at the time of preparation. The form is typically completed by the Situation Unit Leader or Section Planning Chief within the Incident Management Team, but may also be completed by a local dispatcher or another staff member when necessary. Reports are logged for each operational period or when information becomes outdated in a quickly evolving incident. Each report describes current characteristics of the hazard, current environmental conditions, current and projected incident management costs, details about spe-cific resources assigned to the incident, critical resource needs, a description of structural and life safety threats, an ongoing accounting of injuries, fatalities, damages, and the projected incident management outlook.
The format and content of the ICS-209 has evolved over time in parallel with efforts to adapt the form for all-hazards use. Our inspection of records identifi d new fi lds added in 2004, when the system was incorporated into NIMS, and again in 2007 to support all-hazards reporting. It is important to note that the use of NIMS/ICS was not mandatory on large incidents until fiscal year 200615, and so there may be significant gaps in report-ing prior to this date. Any time-series analysis exploring trends in the data must acknowledge this limitation. Additionally, the ICS-209-PLUS dataset is based on the published data and may exclude records containing sen-sitive information.
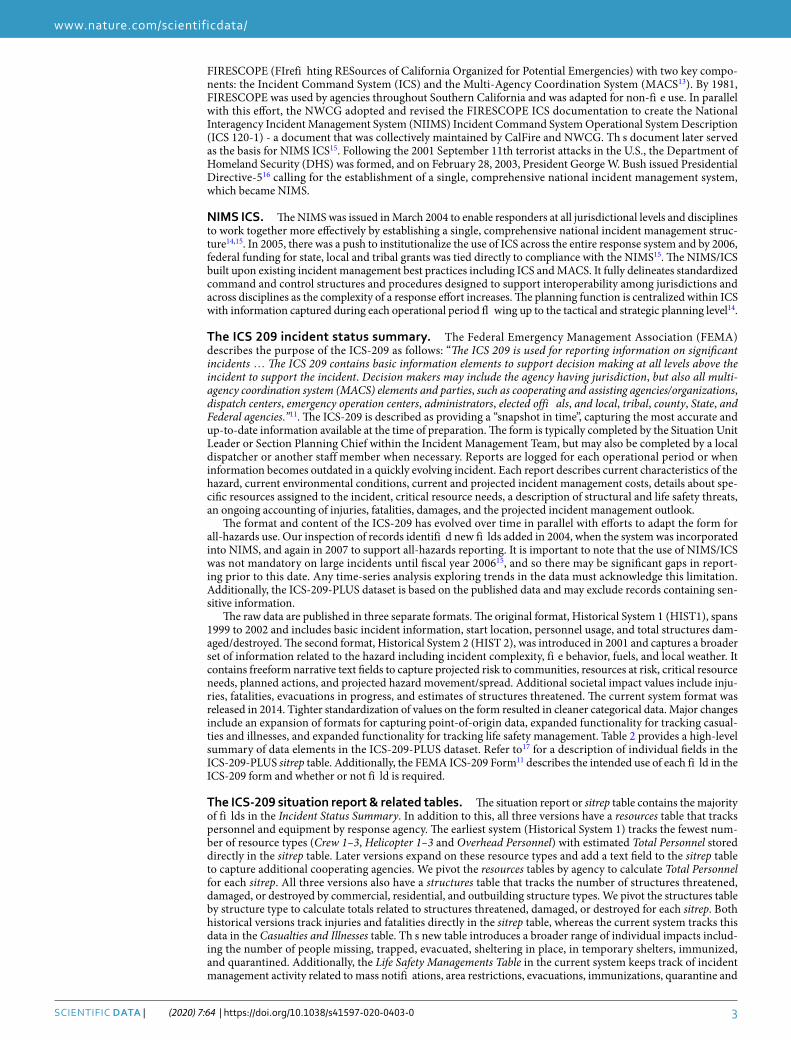
The raw data are published in three separate formats. The original format, Historical System 1 (HIST1), spans 1999 to 2002 and includes basic incident information, start location, personnel usage, and total structures dam-aged/destroyed. The second format, Historical System 2 (HIST 2), was introduced in 2001 and captures a broader set of information related to the hazard including incident complexity, fi e behavior, fuels, and local weather. It contains freeform narrative text fields to capture projected risk to communities, resources at risk, critical resource needs, planned actions, and projected hazard movement/spread. Additional societal impact values include inju-ries, fatalities, evacuations in progress, and estimates of structures threatened. The current system format was released in 2014. Tighter standardization of values on the form resulted in cleaner categorical data. Major changes include an expansion of formats for capturing point-of-origin data, expanded functionality for tracking casual-ties and illnesses, and expanded functionality for tracking life safety management. Table 2 provides a high-level summary of data elements in the ICS-209-PLUS dataset. Refer to17 for a description of individual fields in the ICS-209-PLUS sitrep table. Additionally, the FEMA ICS-209 Form11 describes the intended use of each fi ld in the ICS-209 form and whether or not fi ld is required.
The ICS-209 situation report & related tables. The situation report or sitrep table contains the majority of fi lds in the Incident Status Summary. In addition to this, all three versions have a resources table that tracks personnel and equipment by response agency. The earliest system (Historical System 1) tracks the fewest num-ber of resource types (Crew 1–3, Helicopter 1–3 and Overhead Personnel) with estimated Total Personnel stored directly in the sitrep table. Later versions expand on these resource types and add a text field to the sitrep table to capture additional cooperating agencies. We pivot the resources tables by agency to calculate Total Personnel for each sitrep. All three versions also have a structures table that tracks the number of structures threatened, damaged, or destroyed by commercial, residential, and outbuilding structure types. We pivot the structures table by structure type to calculate totals related to structures threatened, damaged, or destroyed for each sitrep. Both historical versions track injuries and fatalities directly in the sitrep table, whereas the current system tracks this data in the Casualties and Illnesses table. Th s new table introduces a broader range of individual impacts includ-ing the number of people missing, trapped, evacuated, sheltering in place, in temporary shelters, immunized, and quarantined. Additionally, the Life Safety Managements Table in the current system keeps track of incident management activity related to mass notifi ations, area restrictions, evacuations, immunizations, quarantine and
4Scientific Data | (2020) 7:64 | https://doi.org/10.1038/s41597-020-0403-0
www.nature.com/scientificdatawww.nature.com/scientificdata/
sheltering-in-place. We use the Casualties and Illnesses table to calculate the number of injuries and fatalities and evacuation status for each sitrep. Th s could be expanded in future releases to track a broader range of life safety threat and current response status. Finally, there is an annual Lookup Codes table containing standardized fi ld values. These values have remained fairly consistent with new values added over time. Current code val-ues are summarized in the standard codes reference14. Any modifi ations to existing values are discussed in the Transforming Standardized Fields section below.
There are two parent tables related to the sitrep table: an incidents table and a complexes table. The complexes table was added in 2010. A complex incident is defi ed as two or more individual incidents located in the same general area which are assigned to a single incident commander or unified command15. The complex record clus-ters all fires and sitreps associated with a fire complex under the same incident number, capturing individual fire names, suppression strategy, current containment percentage and estimated costs to date. The current version also includes the current area for individual fi es within the complex. Th s information is missing in both histori-cal versions of the system. We used data that was manually compiled and verifi d to derive a complex associations table for wildfi es between 1999 and 2013 and we produce a similar table for 2014 to describe the relationship between fi e complexes and individual fi es. These supplementary tables are described in section 7 below. Finally, the current version has an incidents table that contains basic incident level information including discovery date, cause, area, location, and estimated cost to date. Concatenated versions of the original complex and incident tables are included in the dataset (Table 1), but we did not clean or modify these tables. We created a new Wildfire Incident Summary Table17 derived from the cleaned and smoothed values in the Wildfi e sitreps table. Th s new incident level table contains additional incident level statistics that enhance the research value of the dataset. Th s new table is described at the end of the methods section.
open/reproducible framework. We produced the ICS-209-PLUS dataset using principles of open and reproducible science18–20. All data source files and the fi al ICS-209-PLUS dataset are archived online17. The python source code for the ICS-209-PLUS creation21 and R code used for spatial database creation and the crea-tion of all figu es and tables22 are publicly available. Our aims are twofold: to provide transparency to the methods and assumptions used to produce the fi al dataset and to provide a framework for others to adapt or expand upon the dataset. The code is written in Python using the Numpy and Pandas data science libraries. We were unable to automate the downloading of the raw data from FAMWEB and so our code assumes all relevant tables (Table 1) are downloaded to the corresponding annual directories beforehand.
We accomplished several key objectives in this first release. First, we aligned data elements and standardized values across both historical versions with the current data model. Th s allows for seamless comparison of records across the entire time-period. Secondly, due to the free-form nature of the fi lds and limited mechanisms enforc-ing data entry standards, the original data is notoriously messy and difficult to use. The scripts are designed to automate as much of the cleaning and formatting as possible, improving the overall consistency of the dataset. It is also designed to support the manual updates identifi d in the process of producing the dataset. Th s is important for several reasons. It allowed us to easily incorporate updates for fi lds such as Latitude and Longitude that were deemed critical for dataset use. It also provided a framework for incorporating the cleaning efforts and refi e-ments from the 209 dataset curated by Karen Short. Finally, we connect the ICS-209-PLUS dataset with the Fire Program Analysis fi e-occurrence database (FPA FOD23) enabling linkage with fi e perimeter data and fi al fi e statistics. The following sections detail how the dataset is produced from the merging of the original source files to the creation of the Wildfire Incident Summary table and external linkages.
Producing the ICS-209-PLUS dataset. The ICS-209-PLUS dataset is produced by a series of Python scripts that fi st consolidates the annual files for each of the tables across the three versions of the system (Table 1). Each version of the sitrep table is then cleaned and prepared for the merge. This includes general cleaning and for-matting for each fi ld, fi ld-level updates to correct known errors, and deletion of duplicates/erroneous records. Each of the related tables are pivoted and totals are calculated for personnel, aerial equipment, structures threat-ened, structures damaged, structures destroyed, injuries, fatalities, and evacuation status (2014+) for each sit-uation report. These totals are joined into the situation report and then columns across the three versions are aligned and concatenated. Once the data has been consolidated into a single dataset, individual fi lds are cleaned and smoothed, filling missing values and adjusting values where appropriate. Th s fi alized version is then used
Information Type Data Elements
Incident Reporting Detail Incident Name, Incident Number, Reporting Time Period, Report Status (Initial, Update, Final), Approval and Routing Information
Current Incident StatusIncident Commander(s), Incident Management Organization, Level of Complexity, Percent Contained/Completed, Estimated Costs to Date, Current Resources (Personnel and Equipment currently in use), Agencies Involved, Additional Cooperating and Assisting Agencies, Fire Complex Details
Hazard Description & Conditions
Incident Type, Cause, Start Date/Time, Location, Current Area Involved, Materials/Hazards Involved, Fuels, Fuel Conditions, Fire Behavior, Current & Forecast Weather
Projected Outlook & NeedsCritical Resource Needs, Current and Projected Weather/Conditions, Projected activity/movement/escalation or spread, Strategic Objectives, Planned Actions, Projected Final Size, Projected Final Costs, Projected Containment Date, Projected Demobilization Date
Societal Impacts Structures threatened/damaged/destroyed, Values at Risk, Injuries, Fatalities
Table 2. Description of Data Elements by Type on ICS-209 Incident Status Form.

5Scientific Data | (2020) 7:64 | https://doi.org/10.1038/s41597-020-0403-0
www.nature.com/scientificdatawww.nature.com/scientificdata/
to produce an all-hazards dataset (ICS-209-PLUS All-Hazards), and a wildfi e dataset (ICS-209-PLUS WF). The wildfi e dataset is composed of two tables: all the wildfi e daily status summaries and an incident level summary record. The Wildfire Incident Summary contains high-level statistics that are useful from a research standpoint.
Cleaning and formatting the individual datasets. The script cleans each version of the sitrep table prior to the merge. Th s is necessary to deal with subtle differences between each version. Unique identifie s are constructed within the historical datasets to separate out individual fi e events and to group related inci-dents together. We clean and standardize values for each historical version so that they merge smoothly into the fi al dataset. Once this preliminary cleaning is complete, members of the historical dataset are compared with a refi ed version of the record and sitreps that are not members of this refi ed set are archived to a deleted sitreps table (described later).
Creating unique incident and fire identifiers. Th Incident Number fi ld is meant to uniquely identify an incident, but there are multiple issues with this fi ld, particularly in the historical datasets. In some instances, incident numbers are incomplete or they are re-used from year to year, resulting in sitreps for multiple incidents being grouped together as a single incident. Splitting them based on year is problematic because some fi es, particularly in the southeastern United States span the annual boundary or have a fi al report filed in the next year. There are also instances where Incident Name and point of origin are distinctly different but share the same incident number. Conversely, there are incidents in the current version that have the same incident number, but are split across multiple unique system identifie s. Finally, there are instances where fi es are incorporated into a fi e complex and the Incident Number changes to that of the fi e complex. We solved these issues by creating two concatenated ID fi lds: the Fire Event ID and the Incident ID. The Fire Event ID is used to identify individual wild-fi es regardless of whether they are managed as part of a larger fi e complex. The Incident Id is used to group all sitreps related to an incident response, clustering related situation reports that are related but may differ in terms of the Incident Number and or the Incident Name.
The fire event ID. The Fire Event ID is a concatenation of the Start Year and the Incident Number fields followed by a sequence number (default = 1). The Start Year separates instances where the Incident Number is re-used from year-to-year. We manually scanned sitreps in both historical versions sorted by Incident Number, Incident Name, Discovery Date, and the report date to identify records that needed to be split. For example, Incident Number “AR-ARS-D2” was assigned to three separate incidents starting in different locations at different times (Table 3). We split them by adjusting the sequential variable for Dierks to 2 and Red Barn to 3.
the incident ID. Th Incident ID is a concatenation of the Start Year, the fi al Incident Number, and the final Incident Name, such that multiple fires can be grouped together if they are later incorporated into a larger response. Th s information is missing in the historical datasets, but was manually compiled and verifi d by co-author Karen Short over time during the compilation of the Fire Program Analysis fi e-occurrence database (FPA-FOD23). As a United States Forest Service employee, she was able to compare incident information with other internal sources to piece together relationships between individual fi es and fi e complexes and to purge duplicate and erroneous situation reports across the two historical records. We use this cleaned version of the sit-209 records, referred to as the Short master list17, as a defin tive reference such that this table is used to create the Incident ID for all historical sitreps and determines which records should be deleted.
The example below is taken from the 2006 Boundary Complex Wildfi e. It illustrates how Incident ID is used to group related fi es together (Table 4) while preserving the original values. The complex includes the following individual fi es: Elkhorn 2, Lost Lake, Deer, Thi ket, Chuck, East Elk, North Elk, and Knapp 2, all under Incident ID 2006_ID-SCF-006336_BOUNDARY COMPLEX. The Fire Event IDs are included at the fi e right to illustrate how the Incident ID allows for multiple physical fi es to be grouped together as a single response, whereas the Fire Event ID provides a unique identifier for the physical fi e event.
General field level cleaning. We used the Python data science tools to inspect values contained in each column across the three versions to determine what actions were needed to clean and prepare for the merge. Many columns had standardized values, but contained extraneous characters or inconsistencies. The script uses regular expressions to standardize values for fi lds like GACC Priority, Dispatch Priority, Percent Containment, Containment Date, and Incident Management Team Type fi lds. Once these values are standardized, they are linked to corresponding values in the lookup code tables. The script also removes all linefeeds and hidden charac-ters from text fi lds to make viewing and processing the fi lds easier. Values such as “N/A”, “same”, or “none” and redundant values are deleted from the consolidated text fi lds. The script fi es any obvious date errors (e.g., year values of 1901 instead of 2001) and applies consistent formatting across all date fi lds. All Latitude and Longitude values have been converted to decimal degrees. We cleaned and formatted most of the fi lds with the exception of
Incident Name Location Coordinates Discovery Date Fire Event ID
Vandervoort 3 miles NE of Vandervoort AR 33.134167, −93.858333 2011-04-03 21:41:00 2011|AR-ARS-D2|1
Dierks 7 miles NE of Dierks 34.145833, −93.895 2011-04-03 15:12:00 2011|AR-ARS-D2|2
Red Barn East of Cowlingsville 33.869167, −94.087778 2011-09-10 15:30:00 2011|AR-ARS-D2|3
Table 3. Example of Fire Event ID splitting three separate Wildfi es sharing same Incident Number.

6Scientific Data | (2020) 7:64 | https://doi.org/10.1038/s41597-020-0403-0
www.nature.com/scientificdatawww.nature.com/scientificdata/
weather variables and fuels. We determined that both of these fi lds would require extensive effort and fell outside the scope of this initial release.
Th oughout the process, we identifi d individual values that were clearly an error and made some individual fi ld level updates. These updates are limited and are incorporated into the general fi ld cleaning function for each script. In the future, there is potential to maintain these updates as part of fi ld level update table that could be loaded at runtime to automate individual fi ld-level modifi ations. Th s would be an ideal solution to support ongoing update and maintenance of the dataset in the future but is beyond the scope of this initial release.
Finally, we use static information from the Incidents Table (SIT209_HISTORY_INCIDENTS) in the current version to fill missing values in the sitrep table. Values copied from the Incidents Table include: Incident Name, Incident Number, Cause, Discovery Date, Incident Type, Short Location Description, Point of Origin City, Point of Origin State, County, the Legal Description for the point of origin (Township, Section variables, Range, Prime Meridian), and Single/Complex Flag. This patch was developed to repair a significant number of missing values in the pre-released 2016 sitrep table, including values used to build the Incident Identifi rs and Fire Identifi rs (Incident Name, Incident Number, Discovery Date). Few values were changed in the 2014 dataset, particularly for columns with already high fill rates (~0–8 rows updated). There were modest improvements for Point of Origin City (152 rows filled) and Legal Description for point of origin (154 rows filled), but the overall fill rates remain the same. We applied the patch to the 2014 dataset so that when we publish later years, the data in the 2014 records will remain consistent over time.
Transforming standardized fields. Standard values remained relatively consistent across the three ver-sions, with new values added as the form was adapted for all-hazards use. The Cause and Suppression Method Abbreviation fi lds changed slightly from the historical to the new version and so we translated old values to equivalent new values (Table 5). A handful of Incident Types were eliminated in the current system. After careful consideration, we decided to keep the historical values for consistency and to prevent information loss. Prescribed burns (RX) and Wildfi e for Resource Benefit have been included in the Wildfi e datasets. We reclassifi d all val-ues that were binary (yes/no) to boolean values (true/false) to make them consistent and to put them in a more standard database format.
Cleaning and consolidating narrative text. Each version of the Incident Status Summary provides space for recording important observations from incident command. The earliest version of the report (Historical System 1) has only one Narrative fi ld whereas later versions have multiple narrative text fi lds organized around the following topics: critical resource needs, current threats, projected incident movement and spread, weather, fuels, relevant conditions, and general remarks. Critical resource needs, current threats, and projected fi e activ-ity capture projected values at 12, 24, 48, 72, and greater than 72 hours from the current report. We consolidated these observations into one narrative field for each topic to manage the complexity of the dataset, eliminate redundancy, and to organize the observations for potential text mining and topic modeling efforts. Before consol-idating, we clean each individual field to strip hidden characters, eliminate placeholder values (e.g. “n/a”, “same”, “none”) and eliminate duplicate values. A pipe ‘|’ character is used to separate observations. For example, the following values for the projected activity fi lds:
Projected Movement 12: “Minimal fire movement due to lower temps higher RH and precipitation.”Projected Movement 24: “Minimal fire movement due to lower temps higher RH and precipitation.”Projected Movement 48: “Moderate fire activity is anticipated on Friday due to warming temps, falling RH, and
wind.”Projected Movement 72: “same”
Is consolidated into a single projected activity narrative. “Minimal fire movement due to lower temps higher RH and precipitation|Moderate fire activity is anticipated on Friday due to warming temps, falling RH, and wind.”
Incident Number Incident Name # sitreps Start Fire Event ID
ID-SCF-006336 Boundary 8 8/21 2006|ID-SCF-006336|1
ID-SCF-006336 Boundary Complex 39 8/8 2006|ID-SCF-006336|1
ID-SCF-6245 Elkhorn2 1 8/9 2006|ID-SCF-6245|1
ID-SCF-6349 Lost Lake 2 8/8 2006|ID-SCF-6349|1
ID-SCF-6369 Deer 2 8/31 2006|ID-SCF-6369|1
ID-SCF-6373 Thi ket 1 8/7 2006|ID-SCF-6373|1
ID-SCF-6415 Chuck 3 8/9 2006|ID-SCF-6215|1
ID-SCF-6494 East Elk 1 8/21 2006|ID-SCF-6494|1
ID-SCF-6496 North Elk 2 8/21 2006|ID-SCF-6496|1
ID-SCF-6554 Knapp #2 1 9/7 2006|ID-SCF-6554|1
ID-SCF-6554 Knapp 2 4 9/7 2006|ID-SCF-6554|1
Table 4. Multiple Fires Grouped Within 2006_ID-SCF-006336_BOUNDARY COMPLEX Wildfi e.

7Scientific Data | (2020) 7:64 | https://doi.org/10.1038/s41597-020-0403-0
www.nature.com/scientificdatawww.nature.com/scientificdata/
Table 6 summarizes the narrative text fields in the final dataset. The bold-faced fields are the newly consoli-dated fi lds that condense projected values into a single narrative summary. The version column identifies which versions populate this fi ld.
Linking to additional fire datasets. The co-authorship of this paper made linking with the Fire Program Analysis fi e-occurrence database (FPA FOD23) a logical extension of the ICS-209-PLUS dataset. The FPA FOD database provides fi al determination for cause, containment and discovery dates, fi al acres, and connectivity to the Monitoring Trends in Burn Severity database (MTBS24). The MTBS database, in turn provides fi e perimeter and burn severity data.
Th Incident ID is used to join Wildfire Incident Summary records with records in the FPA FOD Extract file. The extract is an excel spreadsheet published as part of the dataset using the naming convention FOD_JOIN_{mmddyyyy}.xlsx. Matching records between the two datasets was an iterative process. At time of publication, all wildfi e incidents occurring in United States and US Territories with a clearly defi ed point of origin larger than 1000 acres with corresponding record(s) in the FPA FOD database has been linked with 86% of incidents linking to at least one FPA FOD record. As we continue to clean and refi e the dataset we will publish incremental updates to this file17.
As matches were identified between the two datasets, the Short Master List17, needed to be updated to main-tain the relationships between fi es and complexes in the FPA FOD dataset. Th s process for managing rela-tionships between fi es and complexes at the sitrep level for the historic dataset was unwieldy but difficult to modify given the signifi ance of the Short master list in the merge and cleaning process for the historical data. We replaced this with a merge configur tion file FOD_CPLX_REF_2014.xlsx for the current dataset (Table 7). Th s file is derived from the Complex Associations Table with additional rows added for complexes that are in the FPA FOD but not in the ICS-209-PLUS table. The table maintains relationship between fi es and complexes and is used to map individual sitreps to the incident summary record for the fire complex and to the fire complex in the FPA FOD dataset.
FPa FoD and MTBS fields. The majority of incidents in the ICS-209-PLUS dataset matched with a single record in the FPA FOD database (83%) but a small percentage (3%) were fi e complexes associated with multiple records in the FPA FOD database. To balance the potential for multiple FPA FOD identifie s per incident with the more general case, we developed the following solution. We added the following fi lds to the Wildfi e Incident Summary (Table 8). The values for the largest fi e are used if there are multiple fi es. The Cause fi ld takes all unique values for cause. It is typically one, but will contain a list of values if there are multiple causes across a multi-fire incident. The discovery date is the earliest value in related FPA FOD records and the containment day is the latest. The FOD_FINAL_ACRES is the sum of all reported acres. The FOD_NUM_FIRES fi ld is the number of fi es linked to this incident and FOD_LIST stores information about all fi es related to the incident.
All FPA FOD records associated with an incident are stored in the FOD Fire List as a JSON object. Th s pro-vides both a human-readable and machine parsable summary at the incident level. For example, the 1999 Arizona Jump Complex has three records in the fi e-occurrence database and so the FOD Fire List contains three entries:
[{“ID”: 215365, “MTBS_ID”: “AZ3662411371319990528(JUMPSPRING)”,”COORDS”: (36.5928, −113.7352), “CAUSE”: “Lightning”, “SIZE”: 16816.0, “DISC”: 148, “CONT”: 154.0}, {“ID”: 215366, “COORDS”: (36.6216, −113.7172),”CAUSE”: “Lightning”, “SIZE”: 7.0, “DISC”: 148, “CONT”: 154.0}, {“ID”: 215369, “COORDS”: (36.96, −113.8158), “CAUSE “: “Lightning”, “SIZE”: 69.0,”DISC”: 149, “CONT”: 150.0}]
Latitude/Longitude. Given the critical role point of origin data plays in geospatial analysis, we manually cleaned and inspected the point of origin coordinates, fixi g obvious errors and providing estimates for missing or obviously erroneous values. The values in the earliest system (Historical System 1) were fi st converted from
Field Version Original Value New Value
Cause Hist1, Hist2 N (No Description) O (Other)
Complex Hist2Current
Y/NS/C True/False
Evacuation In Progress Hist2, Current Y/N True/False
Incident Type Abbreviation Hist1, Hist2
SAR (Search & Rescue)USR (Urban Search & Rescue)WFU (Wildfi e for Res Benefit)RX (Prescribed Burn)OS (Oil Spill)LE (Law Enforcement)MC (Mass Casualty)STR (Structure Fire)BAR (Burned Area Emergency Rehabilitation)
SR/R (for Search & Rescue types)All other values preserved to prevent data loss.
Suppression Method AbbreviationMM (Monitor)CC (Confi e)PZ (Point Zone Protection)
M (Monitor)C (Confi e)PZP (Point Zone Protection)
Table 5. Standard Field Updates.

8Scientific Data | (2020) 7:64 | https://doi.org/10.1038/s41597-020-0403-0
www.nature.com/scientificdatawww.nature.com/scientificdata/
degrees and minutes to decimal format. We then mapped all the points, identifying those that fell outside of the United States and its territories. The most common issue was an incorrect numeric sign for latitude or longitude. The longitude was incorrect for 98.5% of the longitudes in the second historical system (Historical System 2) and 4% of the coordinates for 2014. Wherever possible, we used latitude/longitude values from the FPA-FOD Fire-occurrence database for missing and erroneous values. We then manually examined the remaining values that fell outside of the clipped boundaries individually. We used the information contained in other point of ori-gin fi lds (e.g., the location description) to estimate latitude and longitude. For each of these estimated values, we set the Lat/Long Update flag to true and set the Lat/Long Confidence fi ld to capture our level of confide ce in this estimate (low, medium, high). We rated our estimate as high to medium if we were able to get close to the actual point of origin (ex: intersection of roads) and low if the location description was vague (ex: 6 miles southwest of Sisters Oregon). Our goal was to maximize available geospatial information while allowing users of the data to filter out low-confide ce or updated values when a high level of accuracy is needed. The accuracy and complete-ness of the data improves over time across the three versions, as well as the location description fields available for estimation. In the earliest version (Historical System 1), 29% of coordinates were missing or erroneous but we were able to populate nearly half (49%) of the missing values with estimates taken from the corresponding record in the FPA-FOD database. With limited information, we were only able to manually estimate point of origin for 103 additional values (12%) with the majority of those (89 of the incidents) estimated as low confide ce due to limited location information.
In contrast, only 2% of the coordinates were missing or erroneous in the second historical version (Historical System 2) and we were able to populate 45% of the missing values with estimates taken from the corresponding record in the FPA-FOD database. We were able to estimate an additional 26% of missing values with a mix of con-fide ce levels (42 incidents with high confide ce, 26 with medium confide ce, and 50 with low confide ce levels). Finally, only 1.6% of the coordinates were missing or erroneous in the 2014 data with over half of the missing values populated with values taken from the corresponding record in the FPA-FOD database and we were able to estimate all but 2 of the remaining values with a high level of confide ce with roughly half requiring a simple swap of latitude and longitude values to correct. Table 9 below summarizes latitude and longitude updates by system and corresponding levels of confide ce.
Some of these records are deleted as part of the merging and cleaning process described in section 5 resulting in 98% of incidents with a valid latitude longitude in the fi al dataset.
Preparing to merge. The individual fi lds and values in the incident status reports remained relatively consistent across the three versions, but the underlying data model continued to evolve to adapt to all-hazards management and to capture more detailed information about resources, life safety threat, and management. Our
Field Name Description Version
ADDTNL_COOP_ASSIST_ORG_NARR List of additional agencies not tracked in resources table cooperating on Fire. HIST2, Current
CRIT_RES_NEEDS_NARR Projected resource needs 12, 24, 48, 72 hours HIST2, Current
CURRENT_THREAT_NARR Current resources and values at risk. HIST2, Current
HAZARDS_MATLS_INVOLVEMENT_NARR Description of fuels and materials involved in fi e. HIST2, Current
LIFE_SAFETY_HEALTH_STATUS_NARR Summary of current risk to life and health safety. Current Only
MAJOR_PROBLEMS Summary of any major problems HIST2 Only
OBS_FIRE_BEHAVE Description of current fi e behavior HIST2 Only
PLANNED_ACTIONS Summary of planned actions HIST2, Current
PROJECTED_ACTIVITY_NARR Projected hazard activity 12, 24, 48, 72 hours HIST2, Current
REMARKS General Remarks Field HIST1, HIST2, Current
SIGNIF_EVENTS_SUMMARY Summary of signifi ant events for the current operational period HIST2, Current
STRATEGIC_NARR Strategic Objectives and Strategic Discussion (current system only) Current Only
WEATHER_CONCERNS_NARR Current and projected weather outlook, consolidates weather observations from HIST2 into one parsable fi ld. HIST2, Current
Table 6. Narrative Fields in Final Dataset.
Column Name Description
CPLX_INCIDENT_ID Concatenated Incident ID for Fire Complex
CPLX_INC_IDENTIFIER Internal Incident Identifier for table joins
MEMBER_INCIDENT_ID Concatenated Incident ID for Member Fire in Complex
MEMBER INC_IDENTIFIER Internal Incident Identifier for table joins
ICS_209_CPLX Boolean – true if in complex associations table
Table 7. FOD Complex Cross Reference Table Description for Current System.

9Scientific Data | (2020) 7:64 | https://doi.org/10.1038/s41597-020-0403-0
www.nature.com/scientificdatawww.nature.com/scientificdata/
goal when mapping values across the three versions was to maximize continuity while making the historical data forward compatible with the current system. Most of the columns aligned with minimal or no modification. There were several columns that had no equivalent column in the current system. We preserved the ones that had a high fill rate: Major Problems, Observed Fire Behavior, and Terrain. Refer to the column defin tions in the ICS-209-PLUS sitrep table17.
In addition to the consolidated text fi lds described in the section above, we added fi lds to the situation report to align the historical data with the current version or where they added value. For example, the Acres fi ld provides a convenient way to compare incident area without having to convert units of measurement. The day of year (DOY) fi lds (Discovery DOY and Report DOY), Start Year, and Current Year (CY) support simple querying and analysis without having to manipulate the related timestamps. The script also integrates totals calculated from the related tables into the incident status record. Table 10 summarizes the new values that have been added to the Incident Status Summary table.
Purging duplicate and erroneous records. As mentioned above, the historical datasets overlap between 2001 and 2003, and sometimes incident status reports were logged in both systems resulting in duplicate records across the two systems, along with other erroneous records. Many of these records were deleted from the dataset maintained by Karen Short. Rather than deleting each of these records explicitly, we use the records in the Short dataset as a master list (Short1999to2013v2.xlsx).
Any wildfi e that does not exist in the master list is removed from the production dataset. Once the cleaning and formatting of the sitrep table is complete, the wildfi es in the master list are moved to production dataset and the deleted records are archived to a separate deletions file for reference (Table 9). The comparison resulted in the deletion of 527 sitreps from the fi st historical dataset (3.4%, 57% of these overlapping with Historical System 2) and 3,597 sitreps from the second historical dataset (3.4%).
Merging and final cleaning. Once each of the individual datasets are refined, historical columns are renamed to align with the corresponding columns in the current version (Table 11) and the individual Incident Status Summary tables are concatenated into a single dataset. Unused columns are dropped.
The script then makes a fi al cleaning and smoothing pass across the records, filling missing values where appropriate and smoothing columns to make them more consistent. The specifics are described below and the columns in the fi al dataset are described in17.
Filling missing values. Several fi lds in the dataset are either cumulative or the value, once known, is unlikely to change. We forward filled these fi lds with the previous known value to minimize gaps and to make sure that these values were propagated to the fi al report. Th s was important not just for consistency, but also because these records are used to produce the Wildfire Incident Summary table described below. Forward filled fi lds include: Acres, Estimated Incident Management Costs to Date, Fatalities, Injuries to Date, Latitude, Longitude, Projected Final Incident Management Costs, Total Structures Damaged, Total Commercial Structures Damaged,
Column Name Description
FOD_ID Fire-occurrence database ID - largest fi e if multiple fi es
FOD_CAUSE_CODE Cause code - numeric
FOD_CAUSE_DESCR Cause description (e.g. Arson, Lightning, Debris, Campfi e)
FOD_COMPLEX_NAME Fire Complex Name
FOD_CONTAINMENT_DOY Day of year for fi e containment - minimum value if multiple fi es
FOD_DISCOVERY_DOY Day of year for discovery date - maximum value if multiple fi es
FOD_FINAL_ACRES Final size of fi e (sum of acres if multiple fi es)
FOD_LIST List of FOD Fires related to this incident as key/value pairs
FOD_LATITUDE FOD Latitude for point of origin (decimal)
FOD_LONGITUDE FOD Longitude for point of origin (decimal)
FOD_NUM_FIRES Number of FPA FOD records associated with incident
MTBS_ID MTBS Identifier associated with incident – largest fi e if multiples
MTBS_FIRE_NAME MTBS Fire Name – largest fi e if multiple fi es
Table 8. New fi lds from FPA FOD database added to Wildfi e Incident Summary Table.
Version/File High Medium Low No Value
Historical 1 447 (438 FOD) 5 89 346
Historical 2 238 (201 FOD) 26 50 130
Current 22 (14 FOD) 2
Total 707 31 139 478
Table 9. Latitude/Longitude Updates by System.

1 0Scientific Data | (2020) 7:64 | https://doi.org/10.1038/s41597-020-0403-0
www.nature.com/scientificdatawww.nature.com/scientificdata/
Total Residential Structures Damaged, Total Structures Destroyed, Total Commercial Structures Destroyed, and Total Residential Structures Destroyed.
Smoothing acres and calculating new acres. Once the forward-filling of acres is complete, we perform a backwards smoothing pass. If the number of Acres is downgraded on a subsequent report, we reduce the num-ber of acres on previous reports given that a fi e never truly gets smaller, this is likely over-estimation at the time the report was filed. Reducing this was important because we use this value to calculate the New Acres fi ld, which is then used to calculate the daily fi e spread rate (Wildfire FSR) (see Wildfi e Incident Summary section below).
Smoothing cost estimates. The consistency of the cost fi lds is critical for analysis, even if these fi lds are subject to bias and real-time information is limited, all records are subject to this bias and it provides a metric for comparing cost across incidents in the research dataset. Both the Estimated Incident Management Costs to Date and the Projected Final Incident Management Cost fi lds were sparsely populated with the Estimated Incident Management Costs to Date populated only 35% of the time and the Projected Final Incident Management Cost only 2% of the time. Th s fi ld was also particularly prone to data entry error and variations in notation, particularly for estimates in the millions or billions of dollars. When the records were sorted by incident and report date, it was easy to identify instances where someone either left off a digit or added too many for that particular day. Also, as cost increased, sometimes notation changed to simplify data entry (e.g., 1,200,000 becomes 1.2 for $1.2 million dollars). After forward filling the values, we started the cleaning process by manually inspecting all instances where the fi al reported values were an order of magnitude smaller than the maximum value entered across the reports. We designated the final value based on comparison of trends across the existing reports. We were conservative, only correcting obvious errors. These updates are individually updated in the cost adjustments func-tion of the merge script. Once corrections were made to the fi al reported values, we performed two smoothing passes. We fi st worked backward from the fi al cost, adjusting any estimates that were more than 10x larger than the current value by reducing it until it was within the 10x limit. We then worked forward, adjusting any values that were at least 9x smaller the previous estimate until they fell within the 9x limit. When both these passes were complete, if there was no value for the Projected Final Incident Management Cost, we defaulted it to the Estimated Incident Management Costs to Date on the fi al report.
Creating the wildfire incident summary record. The cleaned and merged Incident Status Summary table is used to create the Wildfire Incident Summary table. This table extracts key elements from the individual sitreps to describe the fi e and support high-level analysis across wildfi e events. Th s information includes the cause, discovery date information, fi al acres, final estimated costs, injuries, fatalities, if evacuations recorded at any point during the fi e, and the point of origin (latitude/longitude) for the fi e. The summary also includes relevant statistics for structural threat, structures damaged/destroyed and estimates of total personnel and aerial support summed across the fi e. We identify peak volumes and corresponding days across the fi e including peak personnel, peak aerial, and peak fi e spread. Finally, we calculate what we call the Cessation Date when the fi e grew to within 95% of its fi al size. Th s metric is valuable, because the containment date may actually be quite conservative, with incident management teams hesitant to declare a fi e contained until there is very limited risk of growth.
the historical complex associations tables. We use the Short reference data described above to con-struct a Complex Associations Table for the historical datasets. Th s information is limited. It clusters incident names and numbers under associated fire complex and tallies the number of sitreps related to each. This table is described in Table 12 below.
Data recordsThe initial release of the ICS-209-PLUS dataset spans sixteen years from 1999 to 2014 and contains 124,411 Incident Status Summary reports for 25,083 thousand all-hazard incidents. The dominant hazard in the dataset is wildland fire (98.3%) with the remaining 1.7% spread across other hazards. The number of incidents is lower overall prior to 2005 mandate, but contains roughly the same distribution of fire and non-fire incidents as in subsequent years. Given the dominance of wildfi e in the dataset, we created three tables specifi ally for wildland fi e analysis: a Wildfi e-specific Incident Status Summary table with just the wildfi e sitreps, a Wildfire Incident Summary table with key values related for each fi e, and a Complex Associations table (Historical only 1999 to 2013). Table 13 below summarizes each of the tables in the ICS-209-PLUS dataset and the number of records contained in each.
All files used to produce the dataset are packaged with yearly database table files as part of the ics209-plus-source.zip file. These input files and directory locations are summarized in Table 14 below. Table defin tion and fi ld fill rates are also available online in the ics209-pluse-reference.zip file (Table 15 below). The dataset, input, source, and reference files can be found online at fig hare17.
technical ValidationIt is important to note that the ICS-209-PLUS represents a small but important subset of wildfi es (1–2%). The trends presented in this technical validation are for large incidents only and not meant to be interpreted as hold-ing for wildfi es in general.
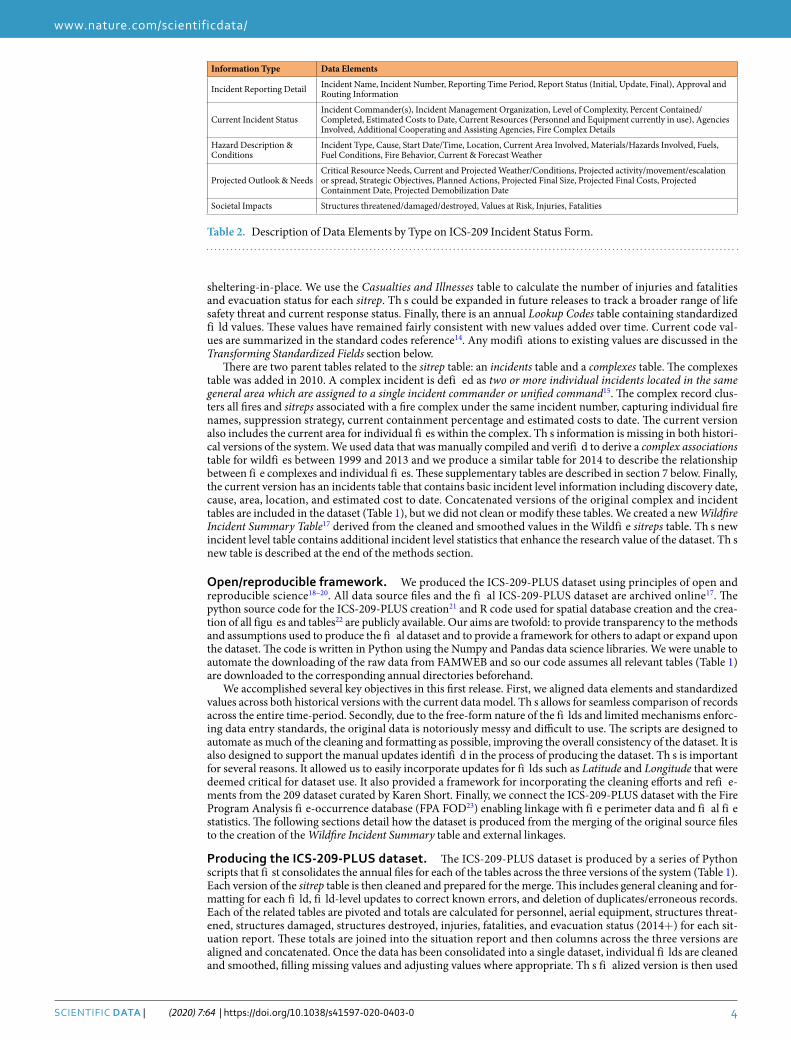
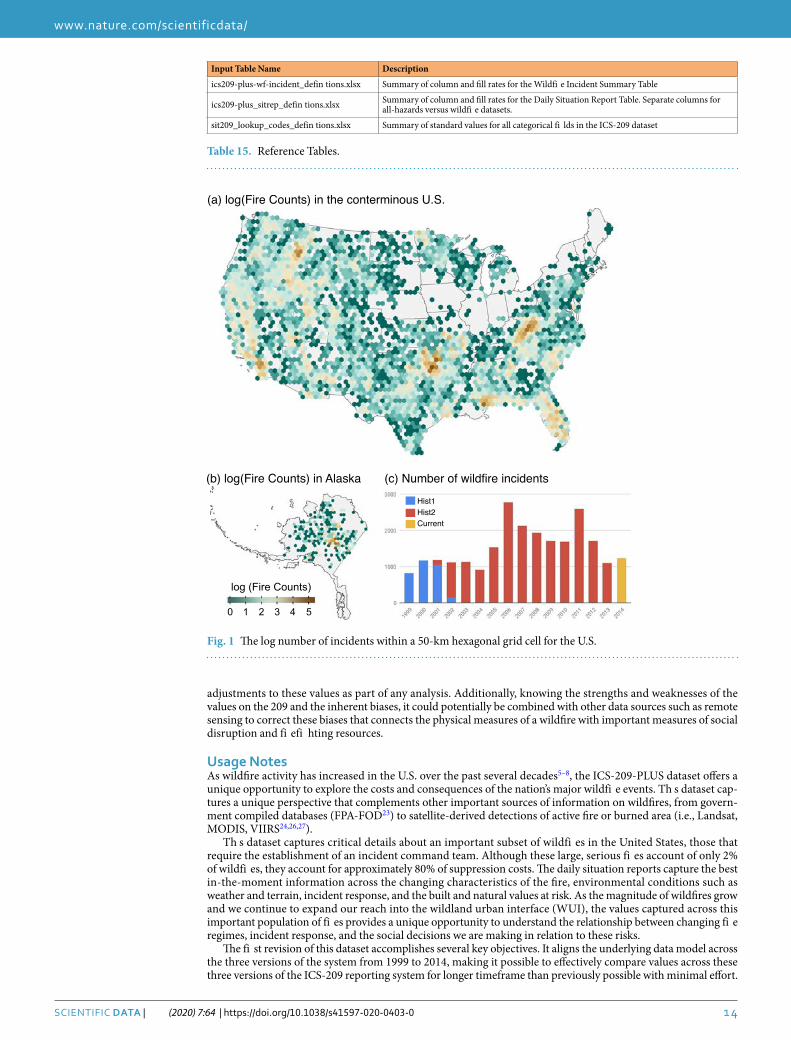
Wildfire distribution. Wildfires requiring the use of ICS are spread across the interior of Alaska and con-tinental U.S. with higher concentrations in parts of California, the Northern Rockies, Northern Forests, and parts of the Southeastern U.S. There were a small number of fi es in Hawaii and Puerto Rico (not shown). Fire is

1 1Scientific Data | (2020) 7:64 | https://doi.org/10.1038/s41597-020-0403-0
www.nature.com/scientificdatawww.nature.com/scientificdata/
notably limited in areas of the Central Midwest and Northeastern US. The spatial distribution of incidents for the continental U.S. and Alaska with the total number of incidents by year is shown in Fig. 1 below.
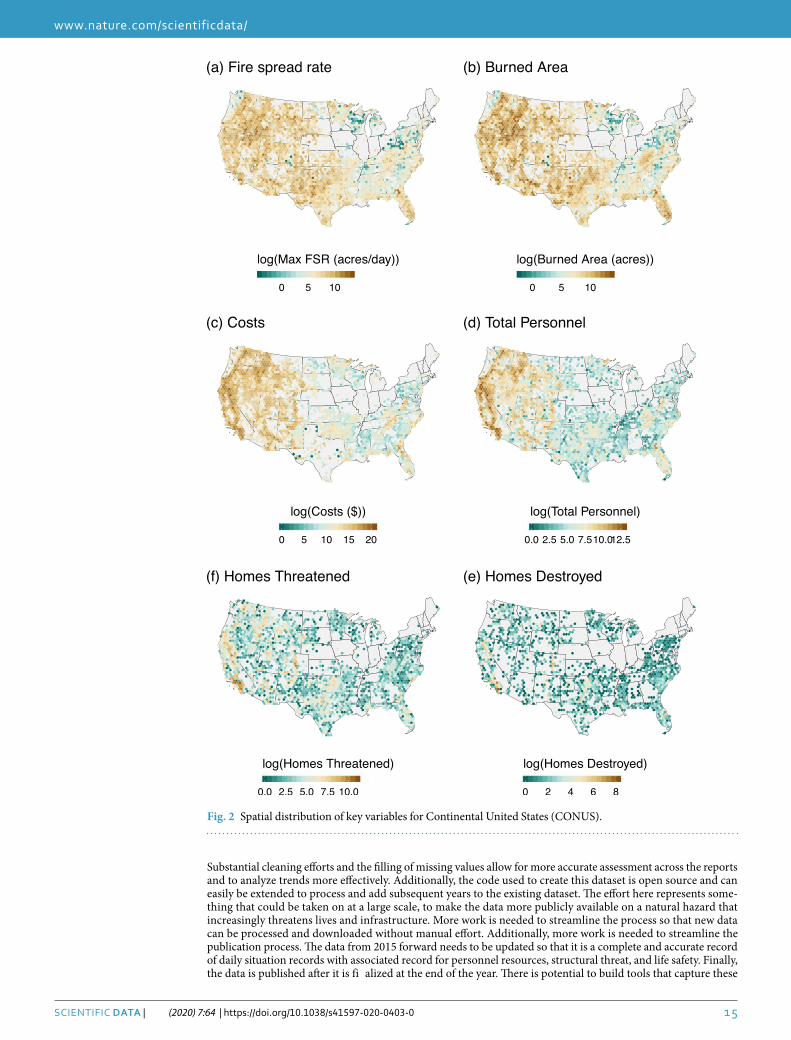
trends across key variables. We examined the national patterns in six variables within the dataset: maxi-mum fi e spread rate, burned area, projected fi al costs, total personnel (total personnel summed across sitreps), maximum number of homes threatened, and the number of homes destroyed (Fig. 2). Not surprisingly, the fastest fi es were located in the northern Great Basin area, along the border of Nevada and Idaho, landscapes that are dominated by cheatgrass fuels. Additionally, the west experienced larger, faster fi es requiring more resources and resulting in higher suppression costs. Suppression costs are an order of magnitude lower on average in the east versus the west, but that societally impactful fi es are not limited to the West (Fig. 2ef). Smaller fi es in the east threaten and destroy large numbers of homes. The allocation of fi efi hting personnel is heaviest in California and the Pacific Northwest, with California committing the heaviest resources regionally, which may help mitigate the number of homes damaged or destroyed given the population density and large number of homes threatened across these fi e-prone landscapes, except in the hottest and driest areas portion of Southern California. Large wildfires have a presence in all but key areas of the midwest and northeast. In the Appalachian mountain range, the influence of human ignitions has led, in recent years, to large of areas burned, requiring management of an incident command team that is apparent in this dataset. More research is needed to understand the factors at play in these fi es outside of the scope of this work.
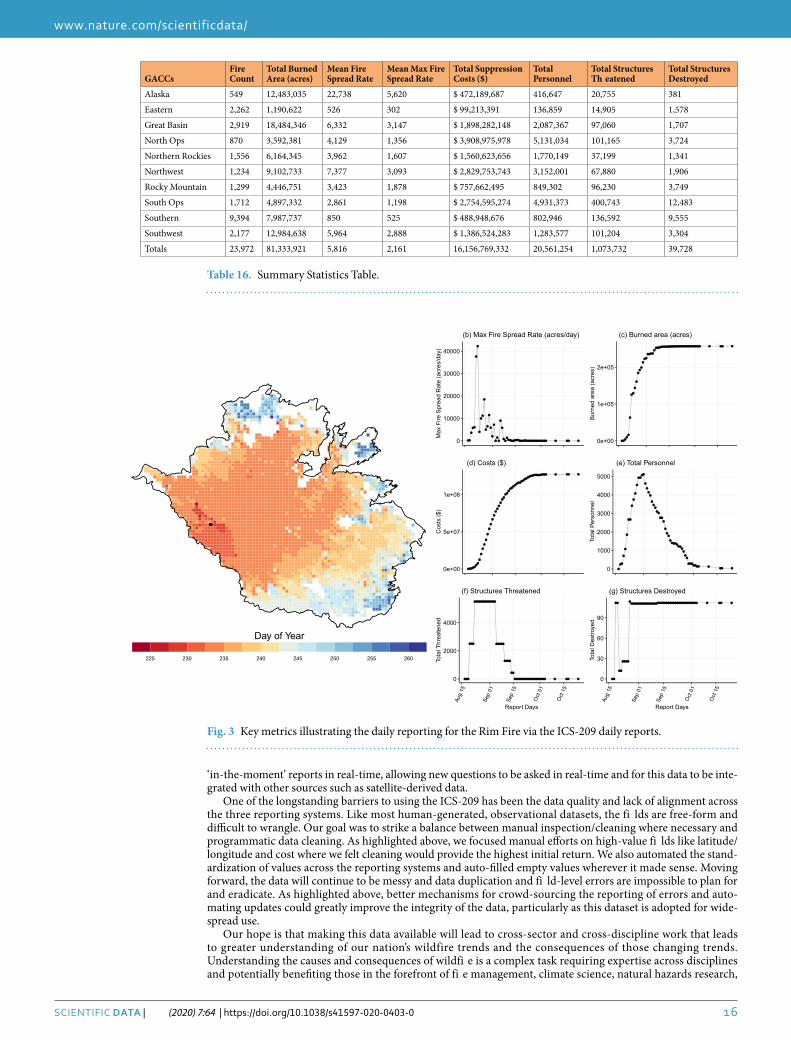
Summary statistics were generated across the national Geographic Area Coordination Centers (GACCs) for the six key metrics (Table 16). Most notably in the conterminous U.S., the Great Basin experienced the fastest fi es, with an average maximum fi e spread rate of 3,147 acres/day, yet, Alaska reported the fastest average maxi-mum fi e spread rate across all GACCs (5,620 acres/day) and largest average wildfire (22,738 acres). The average fi e size in the southern GACC (southeastern U.S.) was 850 acres, or roughly 85% smaller than average fi e size compared to all other GACCs. Though wildfires were substantially smaller in the southern GACC, it experienced the second highest structures threatened (136,592) and destroyed (9,555). The state of California consists of the South Ops and North Ops GACCs, and, when combined, represent 41% of the total suppression costs, 48% of total personnel employed, 45% of all structures threatened, 40% of all structures destroyed, yet only 11% of the total burned area across all GACCs.
(refer to Supplementary Tables 1 and 2 for summary statistics across level 1 Ecoregions25 and state adminis-trative boundaries)
Field Name Description
ACRES Current size in acres
COMPLEX True/False indicating incident is part of a fi e complex
COMPLEX_NAME Fire complex name (may or may not be same as Incident Name)
CRITICAL_RES_NEEDS_NARR Critical resources identifi d for upcoming 12/24/48/72/72 + hours
CURRENT_THREAT_NARR Current values at risk for upcoming 12/24/48/72/72 + hours
DISCOVERY_DOY Julian day of the current year for the Discovery Date fi ld
EVACUATION_IN_PROGRESS True/False evacuations in progress
FATALITIES Current number of reported fatalities
FIRE_EVENT_ID Unique Identifier for individual fi e events
INCIDENT_ID Unique Identifier for all sitreps grouped under the same incident response
INJURIES Number of injuries for this reporting period
INJURIES_TO_DATE Number of injuries to date
NEW_ACRES Number of acres since the last report
REPORT_DOY Julian day of the current report
STARTYEAR Start year of the incident
STR_DAMAGED_RESSTR_DESTROYED_RESSTR_THREATENED_RES
Total residential structures damaged, destroyed, threatened for the current operational period.
STR_DAMAGEDSTR_DESTROYEDSTR_THREATENED
Total structures damaged, destroyed, threatened for the current operational period.
STR_DAMAGED_COMMSTR_DESTROYED_COMMSTR_THREATENED_COMM
Total commercial structures damaged, destroyed, threatened for the current operational period.
STR_DAMAGED_RESSTR_DESTROYED_RESSTR_THREATENED_RES
Total residential structures damaged, destroyed, threatened for the current operational period.
TOTAL_AERIAL Total number of aerial support resources currently assigned to the fi e.
TOTAL_PERSONNEL Total number of personnel resources summed across all agencies
Table 10. New Fields.

1 2Scientific Data | (2020) 7:64 | https://doi.org/10.1038/s41597-020-0403-0
www.nature.com/scientificdatawww.nature.com/scientificdata/
National interagency fire center (NIFC) comparison. We compared the ICS-209-PLUS dataset with annual fi e statistics provided by the National Interagency Fire Center (www.nifc.gov) across the same time period. The ICS-209-PLUS dataset captured approximately 2% (range 0.6% to 3.5% annually) of the population of wildfi es, accounting for approximately 80% of the acres burned (range 53% to 98% of acres burned annually) and 79% of the suppression costs (range 51% to 140% of costs annually). These numbers are roughly in line with what you would expect, but the annual variability indicates that there are still signifi ant outliers in the values that are skewing the results.
Case study. The 2013 california rim fire. The California Rim fi e started on August 17th, 2013 in a remote canyon of the Stanislaus National Forest as the result of an illegal campfi e. The fi e was discovered when it was approximately 40 acres in size but due to drought, extreme weather conditions, inaccessible terrain, and erratic winds, the fi e grew to over 10,000 acres in just 36 hours and grew to over 100,000 acres in the fi st four days. It was not declared fully contained until October 24th, 2013, reaching a fi al size of 257,314 acres, making it the third largest fi e in California history at the time. At its peak, more than 5000 fi efi hting resources were assigned to the fi e, and it cost $127.35 million dollars to suppress (https://inciweb.nwcg.gov/incident/5595/). It resulted in 10 injuries and no fatalities. At its peak, the fi e threatened over 5,000 structures and resulted in the evacuation of over 15,000 people, destroying over a hundred structures including eleven residences.
Column Name Description
COMPLEX_INCIDENT_ID Incident Id value for fi e complex
COMPLEX_NAME Final name for fi e complex
INC_MGMT_NUM_SITREPS Number of sitreps related to Incident Number/Incident Name combination
INCIDENT_NUMBER Incident number for each incident incorporated into complex
Table 12. Historical Complex Associations Table.
Current Column Name Historical System 2 Name Historical System 1 Name
ADDTNL_COOP_ASSIST_ORG_NARR COOP_AGENCIES
CURR_INC_AREA_UOM AREA
CURR_INCIDENT_AREA AREA_MEASUREMENT
DISCOVERY_DATE START_DATE STARTDATE
DISPATCH_PRIORITY DISPATCH_PRIORITY DPRIORITY
EST_IM_COST_TO_DATE COSTS_TO_DATE ECOSTS
EXPECTED_CONTAINMENT_DATE EXP_CONTAIN CDATE
GACC_PRIORITY GACC_PRIORITY GPRIORITY
HAZARDS_MATLS_INVOLVMENT_NARR FUELS
INC_MGMT_ORG_ABBREV IMT_TYPE
INC_MGMT_ORG_DESC IMT_TYPE_DESC TEAMTYPE
INCIDENT_COMMANDERS_NARR IC_NAME TEAMNAME
INCIDENT_NAME INCIDENT_NAME ENAME
INCIDENT_NUMBER INCIDENT_NUMBER EVENT_ID
INCTYP_ABBREVIATION INCTYP_DESC ITYPE
INCTYP_DESC INCTYP_DESC INCTYP_DESC
PCT_CONTAINED_COMPLETED P_CONTAIN F_CONTAIN
POO_LATITUDE LATITUDE LATDEG + LATMIN
POO_LONGITUDE LONGITUDE LONGDEG + LONGMIN
POO_SHORT_LOCATION_DESC LOCATION LOCATE
POO_STATE UN_USTATE UN_USTATE
PROJ_INC_AREA_UOM EST_FINAL_AREA
PROJ_INCIDENT_AREA AREA_MEASUREMENT
PROJ_SIG_RES_DEMOB_START_DATE DEMOBE_START
PROJECTED_FINAL_IM_COST EST_FINAL_COSTS
REMARKS REMARKS NARRATIVE
REPORT_TO_DATE REPORT_DATE + HOUR REPDATE
SIGNIF_EVENTS_SUMMARY SIG_EVENT
TOTAL_PERSONNEL TOTAL_PERSONNEL PERSONNEL
UNIT_OR_OTHER_NARR UN_UNITID UN_UNITID
Table 11. Columns renamed from Historical Systems 1 & 2.

13Scientific Data | (2020) 7:64 | https://doi.org/10.1038/s41597-020-0403-0
www.nature.com/scientificdatawww.nature.com/scientificdata/
There are 100 situation reports for the Rim Fire spanning fi e discovery on August 17th at 3:25 pm through the declared containment on October 24th. Looking across key metrics on the 209 reports, one can see the fi e narra-tive play out across the situation reports (Fig. 3). There is a close relationship across the peaks of these variables. There is a clear lag in the reporting of burned area, which may refl ct delays in fi alizing estimates, particularly in the most volatile phase of large and fast fi es. The fi e is not estimated at 10,000 acres until the third day and does not reach 100,000 acres until the morning of the seventh day. The acreage stabilizes as the growth slows on September 6th. The estimated fi al incident management costs rise steeply during the active growth phase of the fi e and level out at $46 million dollars, less than half the fi al estimated incident management cost. Th s example illustrates that estimates are likely to be conservative, particularly on large, fast-moving events with estimates based on what is known in the moment rather than a clear accounting of fi al cost. It may take months for the fi al numbers to be tallied on large-scale responses. The allocation of fi efi hting personnel ramps quickly to just over 5,000 on September 1st, fourteen days into the fi e and then begins to taper down equally quickly. The number of homes threatened rises quickly, with the fi st threat reported as 25 structures at 6 pm on August 19th. Th s value jumps to 2,505 at 7am the following morning with a total of seven structures destroyed including two residences, and again on August 23rd to 4,503 structures at 6am and 5,503 structures at 7:30 pm, coinciding with issuing of new evacuation advisories.
The values logged for both total personnel and structures threatened may represent the most knowable infor-mation in-the-moment. The tracking of personnel happens in real-time during a shift and concrete estimates of homes and areas threatened by a wildfi e are integral to incident management decisions. It is also likely that there is a lag between resource needs and the deployment of new fi efi hting personnel. We hypothesize that the fi st report of structures threatened may serve as an accurate indicator of the onset of social disruption and that the growth and levelling out of personnel indicates that the fi e is in its most acute and socially disruptive phase with the onset of demobilization of resources indicating the easing of the threat posed by a fi e. In this case, the fi st structural threat is recorded at 6 pm on August 19th and jumps to over 2,500 the following evening. Th s figu e reaches it peak at over 5,000 structures approximately 48 hours later on August 22nd, where it remains for thirteen days. The number of personnel steadily increases until September 1st when resources begin to drop.
The perimeter map (Fig. 3a) visually depicts the rapid growth of the fi e. The black dot at the bottom left is the Point of Origin Latitude/Longitude from the ICS 209 report. The perimeter outline is taken from the MTBS dataset24 and the fi e progression is constructed using the MODIS burned area data26. Because the MODIS data records the last burn detection for each pixel, the maximum growth is recorded on day five of the fi e, which is earlier than the formal reporting of this same acreage on the sitrep. Th s highlights two important points. Knowing that there is a likely delay in the reporting of acres burned on the sitreps, we may be able to make
Dataset Table Name Description # Records
ics209-plus_sitreps_1999to2014(ics209-plus-allhazards.zip) All-hazards dataset 124,411
ics209-plus-wf_sitreps_1999to2014(ics209-plus-wildfi e.zip) All wildfi e and prescribed burn sitreps 120,825
ics209-plus-wf_incidents_1999to2014(ics209-plus-wildfi e.zip) Incident level summary for all wildfi e incidents and prescribed burns 24,608
ics209-plus-wf_complex_assocs_1999to2013(ics209-plus-wildfi e.zip)
Summary of wildfi e complexes for historical dataset 1,905
ics209-plus-wf_complex_assocs_2014(ics209-plus-wildfi e.zip) Summary of wildfi e complexes for current ics209 system 70
ics209_sitreps_deleted_hist1_1999to2002(ics209-plus-wildfi e.zip) Deleted records from hist1 527
Ics209_sitreps_deleted_hist2_2001to2013(ics209-plus-wildfi e.zip) Deleted records from hist2 3,597
Table 13. Tables in Production Dataset.
Input Table Name Description & Location
FOD_CPLX_REF_2014.xlsxReference for all Fire Complexes in the FPA/FOD Database and ICS-209-PLUS Dataset and the individual Fire Events related to those Fire Complexes(data/raw/excel/fod)
FOD_JOIN_{timestamp}.xlsxLatest version of Dataset linking FPA/FOD Dataset with ICS-209-PLUS. *Linked based on ICS_209_PLUS_INCIDENT_ID(data/raw/excel/fod)
Latitude/Longitude Update Files• legacy_cleaned_ll-fod.csv• historical_cleaned_ll-fod.csv• 2014_cleaned_ll-fod.csv
Estimate or replacement values for all latitude and longitude values in the ICS-209 dataset that did not fall within bound of US or US territories, along with confide ce estimates.(data/raw/latlong_clean)
Short1999to2013v2.xlsx Short Master List for Historical Wildfi es. Only Historical Wildfi es in this list are in production dataset. (data/raw/excel)
Table 14. Input Tables Used to Produce Dataset.
1 4Scientific Data | (2020) 7:64 | https://doi.org/10.1038/s41597-020-0403-0
www.nature.com/scientificdatawww.nature.com/scientificdata/
adjustments to these values as part of any analysis. Additionally, knowing the strengths and weaknesses of the values on the 209 and the inherent biases, it could potentially be combined with other data sources such as remote sensing to correct these biases that connects the physical measures of a wildfire with important measures of social disruption and fi efi hting resources.
Usage NotesAs wildfire activity has increased in the U.S. over the past several decades5–8, the ICS-209-PLUS dataset offers a unique opportunity to explore the costs and consequences of the nation’s major wildfi e events. Th s dataset cap-tures a unique perspective that complements other important sources of information on wildfires, from govern-ment compiled databases (FPA-FOD23) to satellite-derived detections of active fire or burned area (i.e., Landsat, MODIS, VIIRS24,26,27).
Th s dataset captures critical details about an important subset of wildfi es in the United States, those that require the establishment of an incident command team. Although these large, serious fi es account of only 2% of wildfi es, they account for approximately 80% of suppression costs. The daily situation reports capture the best in-the-moment information across the changing characteristics of the fire, environmental conditions such as weather and terrain, incident response, and the built and natural values at risk. As the magnitude of wildfires grow and we continue to expand our reach into the wildland urban interface (WUI), the values captured across this important population of fi es provides a unique opportunity to understand the relationship between changing fi e regimes, incident response, and the social decisions we are making in relation to these risks.
The fi st revision of this dataset accomplishes several key objectives. It aligns the underlying data model across the three versions of the system from 1999 to 2014, making it possible to effectively compare values across these three versions of the ICS-209 reporting system for longer timeframe than previously possible with minimal effort.
Fig. 1 The log number of incidents within a 50-km hexagonal grid cell for the U.S.
Input Table Name Description
ics209-plus-wf-incident_defin tions.xlsx Summary of column and fill rates for the Wildfi e Incident Summary Table
ics209-plus_sitrep_defin tions.xlsx Summary of column and fill rates for the Daily Situation Report Table. Separate columns for all-hazards versus wildfi e datasets.
sit209_lookup_codes_defin tions.xlsx Summary of standard values for all categorical fi lds in the ICS-209 dataset
Table 15. Reference Tables.
1 5Scientific Data | (2020) 7:64 | https://doi.org/10.1038/s41597-020-0403-0
www.nature.com/scientificdatawww.nature.com/scientificdata/
Substantial cleaning efforts and the filling of missing values allow for more accurate assessment across the reports and to analyze trends more effectively. Additionally, the code used to create this dataset is open source and can easily be extended to process and add subsequent years to the existing dataset. The effort here represents some-thing that could be taken on at a large scale, to make the data more publicly available on a natural hazard that increasingly threatens lives and infrastructure. More work is needed to streamline the process so that new data can be processed and downloaded without manual effort. Additionally, more work is needed to streamline the publication process. The data from 2015 forward needs to be updated so that it is a complete and accurate record of daily situation records with associated record for personnel resources, structural threat, and life safety. Finally, the data is published after it is fi alized at the end of the year. There is potential to build tools that capture these
Fig. 2 Spatial distribution of key variables for Continental United States (CONUS).
1 6Scientific Data | (2020) 7:64 | https://doi.org/10.1038/s41597-020-0403-0
www.nature.com/scientificdatawww.nature.com/scientificdata/
‘in-the-moment’ reports in real-time, allowing new questions to be asked in real-time and for this data to be inte-grated with other sources such as satellite-derived data.
One of the longstanding barriers to using the ICS-209 has been the data quality and lack of alignment across the three reporting systems. Like most human-generated, observational datasets, the fi lds are free-form and difficult to wrangle. Our goal was to strike a balance between manual inspection/cleaning where necessary and programmatic data cleaning. As highlighted above, we focused manual efforts on high-value fi lds like latitude/longitude and cost where we felt cleaning would provide the highest initial return. We also automated the stand-ardization of values across the reporting systems and auto-filled empty values wherever it made sense. Moving forward, the data will continue to be messy and data duplication and fi ld-level errors are impossible to plan for and eradicate. As highlighted above, better mechanisms for crowd-sourcing the reporting of errors and auto-mating updates could greatly improve the integrity of the data, particularly as this dataset is adopted for wide-spread use.
Our hope is that making this data available will lead to cross-sector and cross-discipline work that leads to greater understanding of our nation’s wildfire trends and the consequences of those changing trends. Understanding the causes and consequences of wildfi e is a complex task requiring expertise across disciplines and potentially benefiting those in the forefront of fi e management, climate science, natural hazards research,
GACCsFire Count
Total Burned Area (acres)
Mean Fire Spread Rate
Mean Max Fire Spread Rate
Total Suppression Costs ($)
Total Personnel
Total Structures Th eatened
Total Structures Destroyed
Alaska 549 12,483,035 22,738 5,620 $ 472,189,687 416,647 20,755 381
Eastern 2,262 1,190,622 526 302 $ 99,213,391 136,859 14,905 1,578
Great Basin 2,919 18,484,346 6,332 3,147 $ 1,898,282,148 2,087,367 97,060 1,707
North Ops 870 3,592,381 4,129 1,356 $ 3,908,975,978 5,131,034 101,165 3,724
Northern Rockies 1,556 6,164,345 3,962 1,607 $ 1,560,623,656 1,770,149 37,199 1,341
Northwest 1,234 9,102,733 7,377 3,093 $ 2,829,753,743 3,152,001 67,880 1,906
Rocky Mountain 1,299 4,446,751 3,423 1,878 $ 757,662,495 849,302 96,230 3,749
South Ops 1,712 4,897,332 2,861 1,198 $ 2,754,595,274 4,931,373 400,743 12,483
Southern 9,394 7,987,737 850 525 $ 488,948,676 802,946 136,592 9,555
Southwest 2,177 12,984,638 5,964 2,888 $ 1,386,524,283 1,283,577 101,204 3,304
Totals 23,972 81,333,921 5,816 2,161 16,156,769,332 20,561,254 1,073,732 39,728
Table 16. Summary Statistics Table.
Fig. 3 Key metrics illustrating the daily reporting for the Rim Fire via the ICS-209 daily reports.

17Scientific Data | (2020) 7:64 | https://doi.org/10.1038/s41597-020-0403-0
www.nature.com/scientificdatawww.nature.com/scientificdata/
policy making, planning and development. The ICS-209-PLUS data provides an important level of detail that can be used in parallel with other sources of information, filling in gaps and providing a more complete and nuanced picture of the relationship between characteristics of wildfi e, incident response, and the causes and consequences of threatening wildfires in the national landscape. There is potential to address a critical informational need as we work to understand trends and address the impacts and consequences of fi e in an evolving physical and social landscape. Th s dataset has a great future research benefit, particularly if current limitations are addressed effectively through community-wide efforts to keep improving on this rich dataset in an open science framework.
Received: 8 May 2019; Accepted: 15 January 2020;Published: xx xx xxxx
references 1. Smith, A. B. 2018’s billion dollar disasters in context. NOAA Climate, https://www.climate.gov/news-features/blogs/beyond-
data/2018s-billion-dollar-disasters-context (2019). 2. Smith, A. B. 2017 U.S. billion-dollar weather and climate disasters: a historic year in context. NOAA Climate, https://www.climate.
gov/news-features/blogs/beyond-data/2017-us-billion-dollar-weather-and-climate-disasters-historic-year (2018). 3. Walsh, J. et al. Chapter 2: our changing climate. In Climate change impacts in the United States: the third national climate assessment
(eds. Melillo, J. M., Richmond, T. & Yohe, G.W.) 19–67 (U.S. Global Research Program, 2014). 4. Webster, P. J., Holland, G. J., Curry, J. A. & Chang, H.-R. Changes in tropical cyclone number, duration, and intensity in a warming
environment. Science 309, 1844–1846 (2005). 5. Westerling, A. L. Increasing western U.S. forest wildfi e activity: sensitivity to changes in the timing of Spring. Philos. Trans. R. Soc.
Lond. B. Biol. Sci. 371, 222–231 (2016). 6. Westerling, A. L. Warming and earlier spring increase western U.S. forest wildfi e activity. Science 1161, 940–943 (2006). 7. Balch, J. et al. Switching on the big burn of 2017. Fire 1, 17 (2018). 8. Dennison, P. E., Brewer, S. C., Arnold, J. D. & Moritz, M. A. Large wildfi e trends in the western United States, 1984–2011. Geophys.
Res. Lett. 41, 2928–2933 (2014). 9. Abatzoglou, J. T. & Williams, A. P. Impact of anthropogenic climate change on wildfi e across western U.S. forests. PNAS 113,
11770–11775 (2016). 10. Bracmort, K. Wildfire management: federal funding and related statistics (Congressional Research Service, 2013) 11. FEMA. Incident Status Summary (ICS 209), https://www.fema.gov/media-library-data/20130726-1922-25045-0241/ics_209.txt
(FEMA, 2013) 12. Williams, J. T. & Hyde, A. C. The mega-fi e phenomenon: observations from a coarse-scale assessment with implications for
foresters, land managers, and policy-makers. In Society of American Foresters 89th National Convention (2009). 13. Chase, R. A. FIRESCOPE: a new concept in multiagency fire suppression coordination. Report No. USDA GTR PSW-40. (U.S.
Department of Agriculture, 1980). 14. Buck, D. A., Trainor, J. & Aguirre, B. A critical evaluation of the Incident Command System and NIMS. J. Homel. Secur. Emerg.
Manag. 3, 1557–7355 (2006). 15. Jamieson, G. NIMS and the Incident Command System. In International Oil Spill Conference 291–294 (2005). 16. Bush, G. W. Presidential directive 5. (Homeland Security, 2003). 17. St. Denis, L., Mietkiewicz, N., Short, K., Buckland, M. & Balch, J. ICS-209-PLUS - An all-hazards dataset mined from the US
National Incident Management System 1999–2014. figshare. https://doi.org/10.6084/m9.fig hare.8048252 (2019). 18. Hampton, S. E. et al. The Tao of open science for ecology. Ecosphere 6, 120 (2015). 19. Nosek, B. A. et al. Promoting an open research culture. Science 348, 1422–1425 (2015). 20. Stodden, V. Trust your science? Open your data and code. Comput. Sci. Eng. 12, 8–13 (2010). 21. St. Denis, L. A. Source code for: All-hazards dataset mined from the U.S. National Incident Management System 1999–2014. Zenodo.
https://doi.org/10.5281/ZENODO.3491126 (2019). 22. Mietkiewicz, N. & Joseph, M. Source code for: All-hazards dataset mined from the U.S. National Incident Management System
1999–2014. Zenodo. https://doi.org/10.5281/ZENODO.2652423 (2019). 23. Short, K. Spatial wildfire occurrence data for the United States, 1992–2015. Report No. FPA_FOD_20170508., https://doi.org/10.2737/
RDS-2013-0009.4. (U.S. Forest Service, 2017) 24. Eidenshink, J. et al. A project for monitoring trends in burn severity. Fire Ecol. 3, 3–21 (2009). 25. Omernik, J. M. & Griffith, G. E. Ecoregions of the conterminous United States: evolution of a hierarchical spatial framework.
Environ. Manage. 54, 1249–1266 (2014). 26. Giglio, L., Loboda, T., Roy, D. P., Quayle, B. & Justice, C. O. An active-fi e based burned area mapping algorithm for the MODIS
sensor. Remote Sens. Environ. 113, 408–420 (2009). 27. Hawbaker, T. J. et al. Mapping burned areas using dense time-series of Landsat data. Remote Sens. Environ. 198, 504–522 (2017).
acknowledgementsWe would like to thank emergency response and research participants from the Usable Science Workshop organized by Western Water Assessment, funded by the University of Colorado Boulder’s Grand Challenge grant program that guided our early development.
author contributionsLise A. St. Denis was lead author of the manuscript, authored all code to produce the ICS-209-PLUS dataset, and oversaw the cleaning and verification of the results. She worked with co-author Short to link ICS-209 records with records in the FPA/FOD Database and MTBS. Nathan P. Mietkiewics contributed to the writing of the manuscript and was responsible for the technical validation, data visualization, the case study, the generation of summary statistics and R-code to generate the wildfi e spatial package. Karen C. Short contributed to writing of the manuscript, the cleaning and verifi ation of records against sources within United States Forest Service. Worked with co-author St. Denis to link ICS-209 records with records in the FPA/FOD Database and MTBS. Mollie Buckland helped curate the initial version of the historical dataset and provided feedback on manuscript. Jennifer Balch provided overall project guidance and contributed to editing and authorship of the manuscript.
Competing interestsThe authors declare no competing interests.
1 8Scientific Data | (2020) 7:64 | https://doi.org/10.1038/s41597-020-0403-0
www.nature.com/scientificdatawww.nature.com/scientificdata/
additional informationCorrespondence and requests for materials should be addressed to L.A.S.D.Reprints and permissions information is available at www.nature.com/reprints.Publisher’s note Springer Nature remains neutral with regard to jurisdictional claims in published maps and institutional affiliations.
Open Access This article is licensed under a Creative Commons Attribution 4.0 International License, which permits use, sharing, adaptation, distribution and reproduction in any medium or
format, as long as you give appropriate credit to the original author(s) and the source, provide a link to the Cre-ative Commons license, and indicate if changes were made. The images or other third party material in this article are included in the article’s Creative Commons license, unless indicated otherwise in a credit line to the material. If material is not included in the article’s Creative Commons license and your intended use is not per-mitted by statutory regulation or exceeds the permitted use, you will need to obtain permission directly from the copyright holder. To view a copy of this license, visit http://creativecommons.org/licenses/by/4.0/.
TheCreative Commons Public Domain Dedication waiver http://creativecommons.org/publicdomain/zero/1.0/ applies to the metadata files associated with this article. © The Author(s) 2020


![Stanford University · 3.1 Dataset SQuAD dataset is a machine comprehension dataset on Wikipedia articles with more than 100,000 questions [1]. The dataset is randomly partitioned](https://img.pdfslide.us/doc/110x75/602d75745c2a607275039f53/stanford-university-31-dataset-squad-dataset-is-a-machine-comprehension-dataset.jpg)